Article

Erosion Performance of Atmospheric Plasma Sprayed Thermal Barrier Coatings with Diverse Porosity Levels

1
Department of Engineering Science, University West, 461 32 Trollhättan, Sweden
2
Department of Mechanical Engineering, SASTRA University, Thanjavur, Tamil Nadu 613401, India
3
Thermal Spray Innovations, Bruck an der Grossglocknerstrasse, 5662 Salzburg, Austria
4
Treibacher Industrie AG, 9330 Althofen, Austria
*
Authors to whom correspondence should be addressed.
Submission received: 13 December 2020 / Revised: 8 January 2021 / Accepted: 12 January 2021 / Published: 14 January 2021
(This article belongs to the Special Issue Recent Developments of Thermal Barrier Coatings)

Abstract

:
Thermal barrier coatings (TBCs) prolong the durability of gas turbine engine components and enable them to operate at high temperature. Several degradation mechanisms limit the durability of TBCs during their service. Since the atmospheric plasma spray (APS) processed 7–8 wt.% yttria stabilized zirconia (YSZ) TBCs widely utilized for gas turbine applications are susceptible to erosion damage, this work aims to evaluate the influence of their porosity levels on erosion behavior. Eight different APS TBCs were produced from 3 different spray powders with porosity ranging from 14% to 24%. The as-deposited TBCs were examined by SEM analysis. A licensed software was used to quantify the different microstructural features. Mechanical properties of the as-deposited TBCs were evaluated using micro-indentation technique. The as-deposited TBCs were subjected to erosion tests at different angles of erodent impact and their erosion performance was evaluated. Based on the results, microstructure-mechanical property-erosion performance was correlated. Findings from this work provide new insights into the microstructural features desired for improved erosion performance of APS deposited YSZ TBCs.

1. Introduction

Thermal barrier coatings (TBCs) are vital in improving the efficiency and durability of gas turbine engine components used in the hot sections [1]. During the TBC service lifetime, degradation mechanisms such as molten salt infiltration (hot corrosion) [2], CMAS infiltration [3], thermal cyclic fatigue [4], sintering induced stiffening [5], erosion [6,7], phase instability [8], etc., limit their longevity [9]. Apart from the above damage mechanisms, erosion can also lead to significant loss of TBC material and result in premature failure in both land-based and certain aero-engine gas turbines. In general, the erosion damage is seen as a particularly severe threat to the rotating components of a gas turbine engine such as the blades. 7–8 wt.% yttria stabilized zirconia (YSZ) is the most widely used top coat TBC composition due to its exceptional thermomechanical properties, low thermal conductivity, high coefficient of thermal expansion, and phase stability up to a service temperature of 1200 °C [10,11]. Conventionally, two technologies i.e., atmospheric plasma spray (APS) and electron beam physical vapor deposition (EB-PVD) are used to process TBCs [12,13].
The erosion performance of EB-PVD coatings has been reported to be superior to lamellar structured APS TBCs due to their columnar microstructure and column gaps, which localize the erosion damage within the column [14,15]. However, Cernuschi et al. reported comparable erosion resistance for plasma sprayed segmented TBCs and EB-PVD TBCs [16]. For commercial applications such as industrial gas turbine (IGT) blades, APS is preferred over EB-PVD for processing TBCs due to its faster deposition rates, absence of size restriction on the substrates, and low operational costs [17]. In the past, TBC microstructure alterations were attempted to improve their erosion performance. It has been suggested that the desirable microstructural features for obtaining erosion resistant TBCs include; lower porosity [18], fewer cracks [19,20], etc. as these features influence the TBC fracture toughness and act as the crack initiation sites upon erodent impact. On the other hand, defects in a TBC such as pores, splat boundaries, and cracks are essential in lowering the TBC thermal conductivity and stiffness, and thus enhancing the efficiency and durability of a gas turbine engine [21]. Thus, there seems to be a tradeoff between the TBC erosion resistance and lower thermal conductivity. Consequently, based on the intended TBC application, appropriate microstructural features need to be considered for designing the TBCs. Li et al. demonstrated both experimentally and theoretically that adequate lamellar bonding, i.e., higher mean lamellar bonding ratio, is essential for enhancing the TBC erosion resistance [20]. Furthermore, post processing techniques such as laser re-melting [22], laser glazing [23,24,25] etc. were employed to achieve dense top coats with minimal defects for improving the fracture toughness and TBC erosion resistance.
The different APS TBCs used industrially can be segregated according to their microstructure. APS-deposited TBC microstructures can vary greatly in terms of level of internal porosity and, further, if they are intentionally designed to have vertical segmentation cracks. Segmented or dense vertically cracked (DVC) coatings, by virtue of their inherently dense microstructure barring the cracks, display high erosion resistance while sacrificing thermal insulation properties [26,27]. The microstructures of porous TBCs (without segmentation cracks) can vary significantly depending on their intended application, but can be broadly classified according to their porosity level. Firstly, TBCs with ‘conventional porosity’ characterized by nominal target porosity in the vicinity of 15%, which are extensively used in both the aero and industrial turbines [28,29]. Conventional TBCs are utilized at thicknesses ranging from 250 µm up to 450 µm, with thicker coatings being more common on industrial turbine components or on aero turbine combustor liners [30]. A conventional TBC could be described as requiring a balance of coating performance features such as moderate thermal conductivity, strain tolerance and erosion resistance. The second type of coating corresponds to the high porosity TBCs where the porosity target is 20–30% [31,32]. High porosity TBCs are more commonly used on industrial gas turbines, particularly on large combustor liner components. These high porosity coatings are typically utilized at higher thicknesses than their conventional counterparts at a range of 500 µm to several millimeters. The primary design goal of a high porosity TBC is to maximize thermal insulation of the coating with the often-expected sacrifice in other coating properties.
The objective of this study is to compare the erosion behavior of a number of above porous type TBCs. The influence of APS parameters and initial spray powder on the microstructural features such as total porosity, pores and cracks/delaminations were first quantified using a commercial image analysis software. Mechanical properties such as hardness and fracture toughness of the as-deposited coatings were also evaluated. The as-deposited TBCs were then subjected to erosion test at different impact angles and their erosion rate was calculated. Furthermore, post-erosion analysis was performed to understand their erosion mechanisms.

2. Materials and Methods

2.1. Coating Feedstock

Three different zirconia powders stabilized with 7–8 wt.% Y2O3 have been utilized in this study to produce the various TBCs to be evaluated: two commercial powders and an experimental powder. For conventional porous TBCs, a commercial plasma spherodised or homogenized oven spherodised powder (HOSP) was used as a reference material. This type of powder is most widely used for the manufacture of conventional porosity TBCs [29]. For the high porosity TBCs, a commercial agglomerated and sintered (A&S) powder was used as the reference material, being more typical of that application [31,32,33]. As a comparison feedstock, an experimental YSZ powder was used that was designed for high spray efficiency and high porosity transfer potential [32,34]. The experimental Low-Density (LD) powder was also based on the agglomeration and sintering morphology, though with a reduced specific density (~1.6 g/cm3) relative to both the commercial HOSP and A&S powders (2.2–2.4 g/cm3). The powders used in this study had approximately similar particle size distributions with a D10 in the range 15–25 µm, D50 in the range 50–60 µm and D90 in the range 90–105 µm. Powder chemistries were in all cases comparable with 7–8 wt.% yttria used as stabilizer, 1.6–2.2 wt.% HfO2 and the total impurity oxides (alumina, silica, titania, iron oxide, etc.) below 2 wt.%.

2.2. Coating Deposition

TBC specimens in this study were deposited on 25.4 mm diameter low carbon steel (AISI 1020 series) buttons with a thickness of 6 mm. Before coating deposition, samples were first cleaned with acetone and then grit blasted to prepare the surface. Bond coats for all samples were deposited using an Axial III plasma system (Northwest Mettech, BC, Canada) and a NiCoCrAlY + HfSi bond coat powder (NI 192-5. Praxair Surface Tech, Indianapolis, IN, USA). All bond coats were deposited during a single spray run in order to minimize any differences between produced samples.
The ceramic topcoats were deposited using a 100HE plasma spray torch (Progressive Surface, Grand Rapids, MI, USA) utilizing a G4 gravimetric powder feeder (Uniquecoat, Richmond, VA, USA). Parameters for coating deposition were deliberately selected in order to manufacture coatings with different porosity levels for different TBC applications, based on recommendations of the plasma torch manufacturer. Plasma forming gasses were a combination of argon, nitrogen, and hydrogen. Further details of the process may be found in a previous publication [32]. Based on the processing conditions employed, the deposited TBCs were classified into four groups;
(a)
Conventional porosity, low powder feed rate
(b)
Conventional porosity, medium powder feed rate
(c)
High porosity, high powder feed rate
(d)
High porosity with high feed rate and shorter standoff distance
A summary of the TBC spray parameters and the nomenclature used hereafter is detailed in Table 1, with the suffixes L, M, and H referring to low, medium, and high powder feed rates, respectively, while the additional suffix alphabet S is intended to signify use of a shorter standoff distance during spraying.
For deposition of the conventional porosity (~15%) TBCs, a low and medium powder feed rate was selected at 90 g/min and 150 g/min, respectively. The choice of high and low deposition rate conditions was motivated by the desire to produce representative conditions for coating deposition on smaller components such as vanes as well as larger components such as combustor liners. Coating parameters (plasma power and robot speed) were adjusted in order to achieve coatings in the targeted porosity range while maintaining a deposition per pass thickness below 25 µm in order to reduce coating stress. High porosity TBCs were produced at high powder feed rate conditions of 280 g per minute. As described previously, such deposition conditions are typically relevant for coatings deposited on very large industrial gas turbine combustor liners that require high deposition rates in order to be economically viable [32]. Such high throughput coatings were sprayed at a standard long spray distance and at the same standoff distance as the conventional porosity coatings for comparison. Table 1 also summarizes the deposition rates measured employing each of the indicated spray parameter sets as well as the corresponding porosity content in the resulting coatings. These are discussed in further detail in the subsequent section.
Prior to coating deposition, an Accuraspray G3C in-flight particle measurement system (Tecnar, Saint-Bruno-de-Montarville, QC, Canada) was utilized to check the spray plume for correct powder injection and to measure powder particle apparent temperature and velocity in the plasma jet at the stand-off distance used for coating deposition. For each measurement, the system was allowed several minutes to stabilize before data was recorded.

2.3. Coating Characterization

The metallographic preparation for cross sectional analysis was performed by cold mounting the as-deposited TBCs and later sectioning them using a slow speed cutting machine. The cold mounted specimens were polished to mirror finish using standard polishing procedures discussed elsewhere [35]. The specimens were gold sputtered and analyzed by SEM in back scattered electron (BSE) mode. A licensed software, ‘APHELION’ (ADCIS, Paris, France), was used to quantify the microstructural features such as pores, cracks in contact with pores, free cracks, alignment of cracks etc. using cross-sectional SEM micrographs. A typical specimen SEM micrograph and the corresponding above-mentioned microstructural features visualized using APHELION are shown in Figure 1.
Twenty different SEM micrographs were considered to obtain the mean values and standard deviation of the different microstructural features. Micro-indentation tests (Vickers) in the cross section of the as-deposited TBCs were performed using a HMV-2 series, micro-hardness tester (SHIMADZU Corp, Japan). A normal load of 0.1 N was applied for a dwell time of 15 s. Fifteen independent indents were made and their mean hardness values and standard deviations are reported. For the fracture toughness measurements, a higher normal load (0.2 N) was applied to generate cracks at the indent vertices. Based on the hardness measurements and crack dimensions, the fracture toughness of the as-deposited coatings was calculated according to equation 1 [36].
KIC = 0.16*(c/a)−1.5 × (H*a0.5)
where ‘c’ is the crack length in μm, ‘a’ is the half diagonal length in μm, ‘H’ is the hardness of the sample in MPa, and ‘KIC’ is the fracture toughness. Fifteen independent measurements were performed and the mean fracture toughness values and standard deviations are reported in MPa.m1/2.
The as-deposited TBC specimens were ultrasonically cleaned using acetone and were dried and weighed for their initial weight prior to erosion testing. An Air-jet erosion tester (TR-470, DUCOM, Groningen, Netherlands) was used to perform the erosion tests on the TBC specimens at room temperature, according to ASTM G76–13 standard [37]. A schematic of the erosion test rig and the specimen holder is presented in our previous work [7]. Alumina sand (50 ± 10 μm) was used as the erodent. Two different angles of erodent impact (90 and 30 degrees) were used. An erodent feed rate of 1 g/min and an erodent velocity of 70 m/s were used for this study. The diameter of the tungsten carbide coated erodent discharge nozzle was 1.5mm. In the past, milder erosion test conditions were used for erosion study of TBCs [7]. The relatively more aggressive erosion test parameters were chosen in the present study to achieve test conditions closer to those experienced in a gas turbine engine, i.e., high erodent velocity. The eroded specimens were also ultrasonically cleaned and the weight loss was measured using a sensitive weighing machine (PCE Instruments AB100, Southampton, UK). Three repetitions under identical test conditions were performed to obtain statistically reliable erosion results. The erosion rate of the TBCs was calculated using Equation (2) [15]. The post-erosion examination was performed by SEM analysis on the surface and cross section of the eroded specimens.
Erosion rate = (weight loss of coating in g)/(weight of erodent used in Kg)

3. Results and Discussion

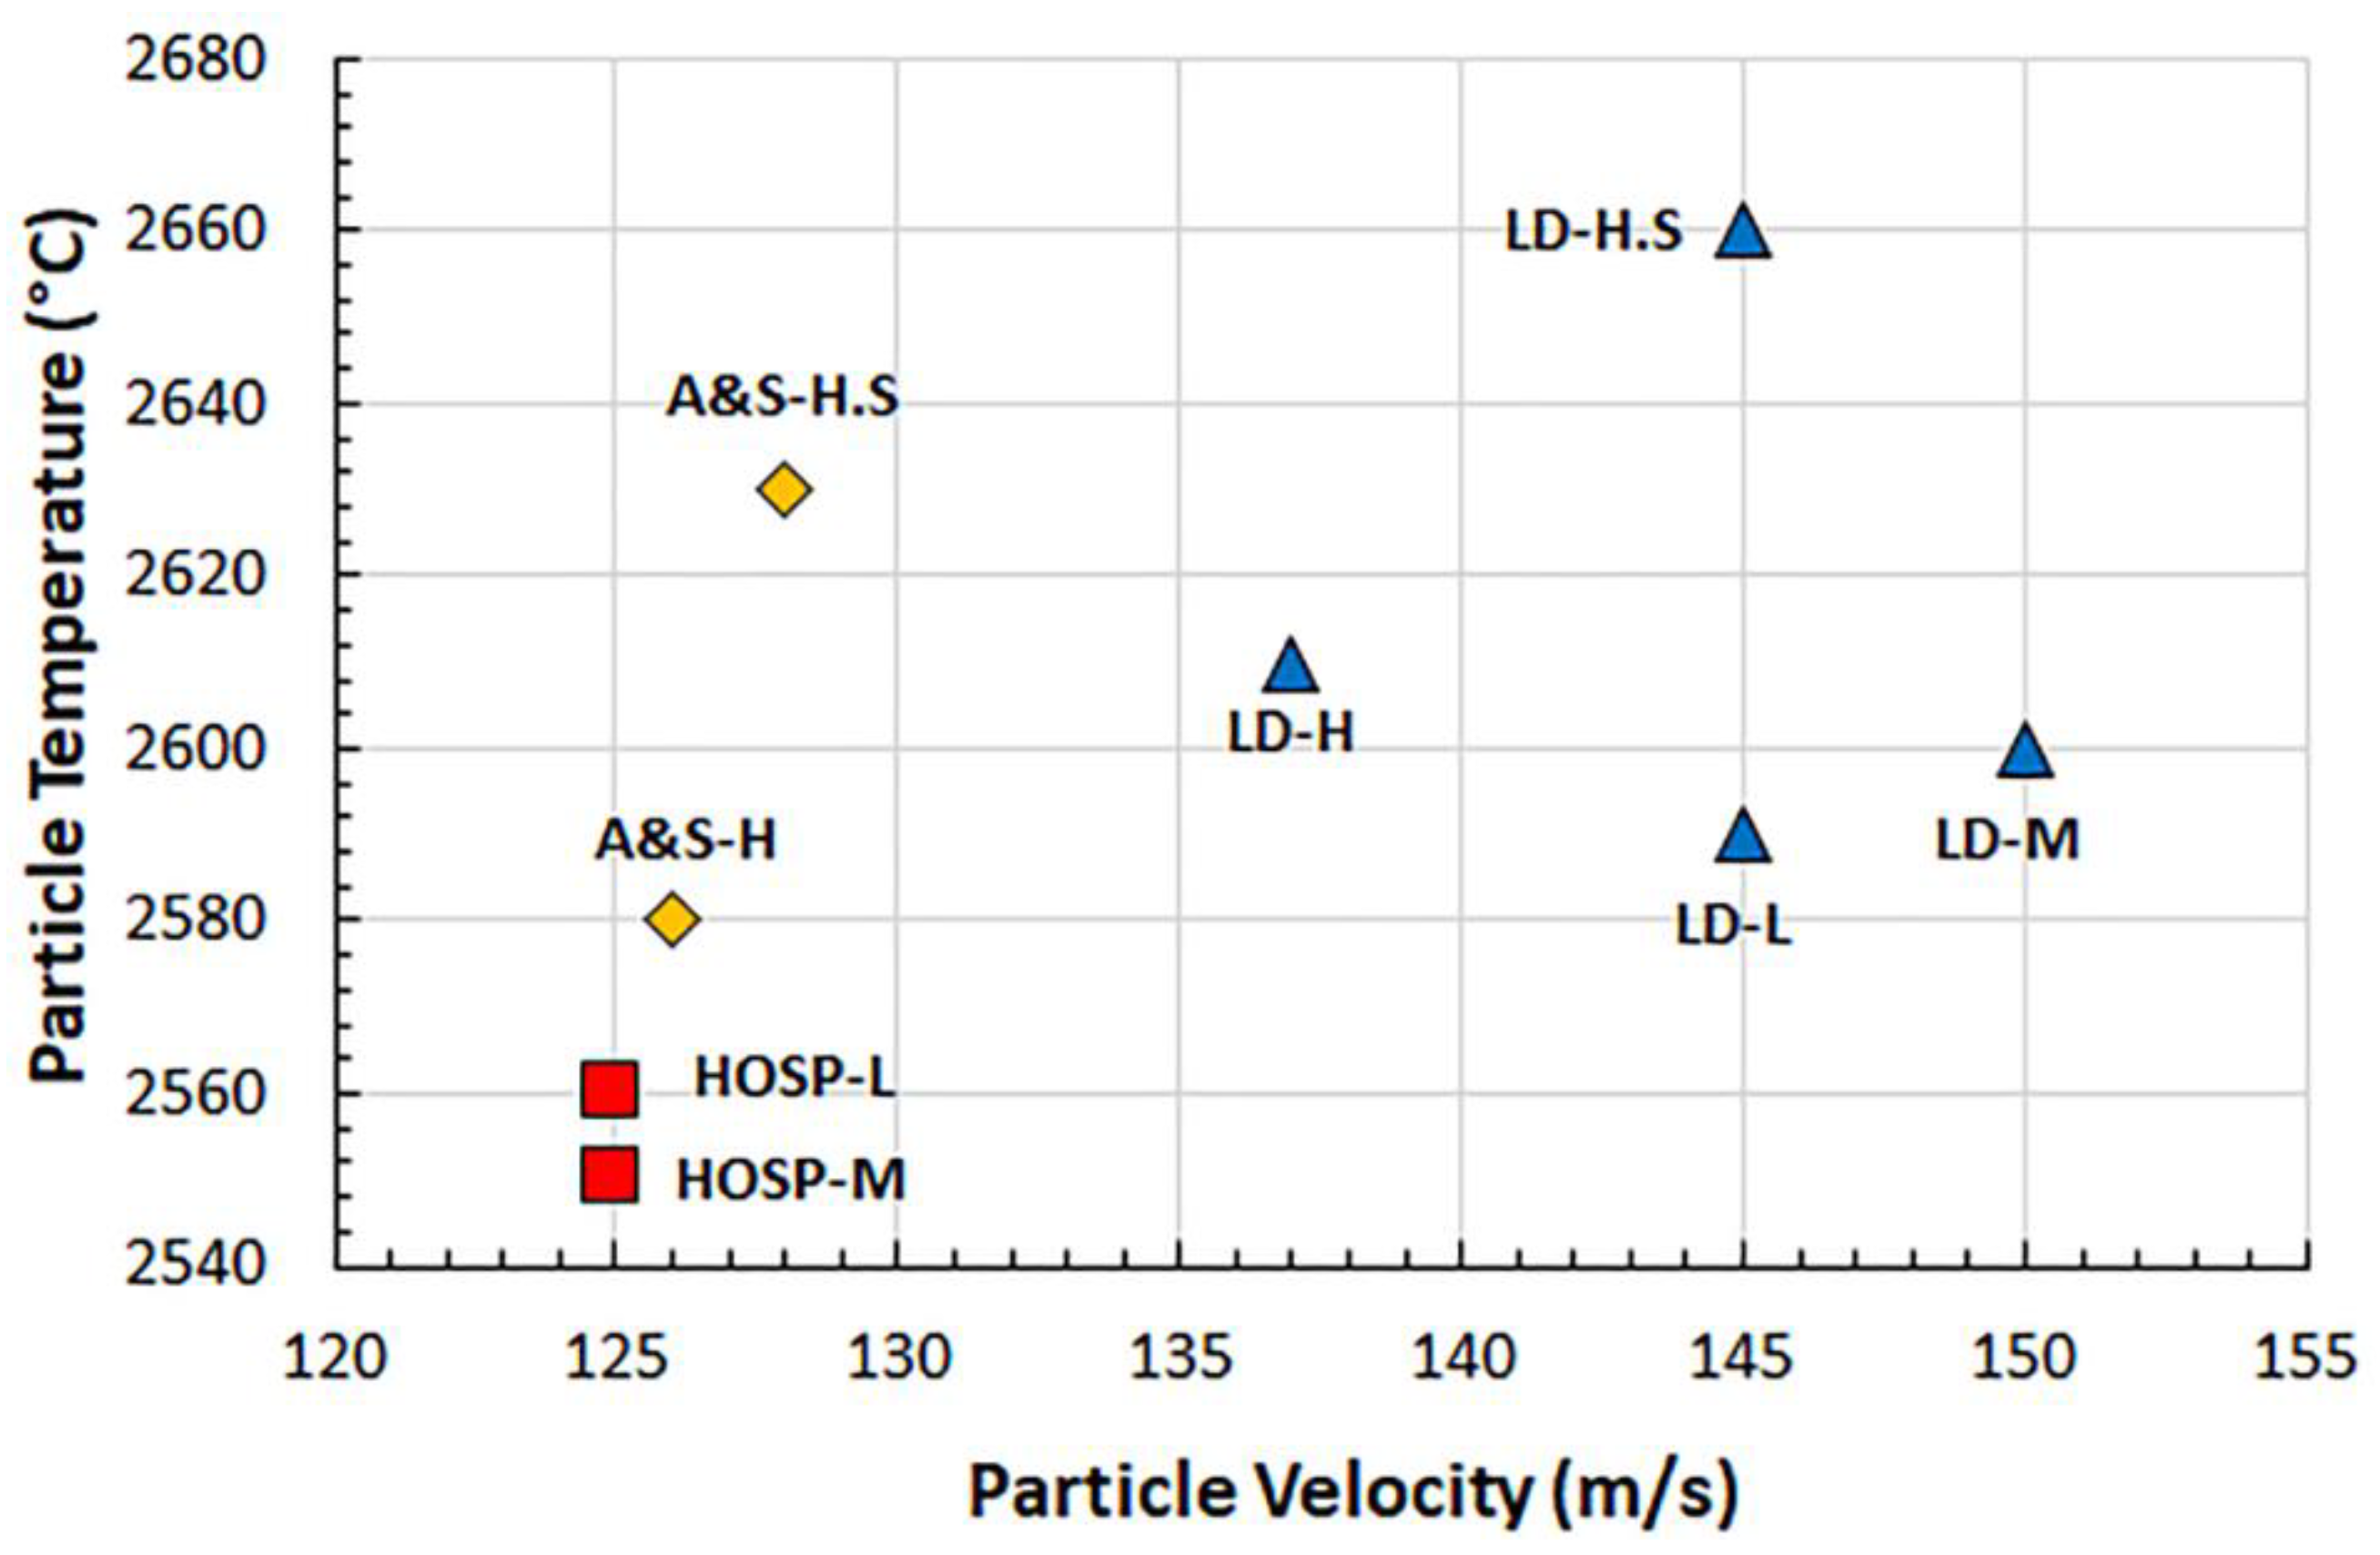
3.1. Accuraspray Results

The apparent particle velocities and particle temperatures for the deposited coatings are illustrated in Figure 2.
It can be observed that the HOSP coatings were deposited at the lowest apparent particle speed and temperature. By comparison, the LD-L and LD-M coatings were deposited at significantly higher particle velocities and temperatures, 30 to 40 degrees hotter. The high feed rate conditions also demonstrate slightly higher and faster conditions for the LD-H coating in comparison to the A&S-H coating sprayed with commercial powder. For the high feed rate, shortened standoff conditions, the measured particle temperatures are significantly higher at 150 mm versus 175 mm. The particle velocity however, increased significantly for the LD-H.S coating. Furthermore, from Table 1, it can be observed that there is a difference in the deposition efficiencies of the powders used in this study. Typically, the low-density experimental powder shows an advantage in deposition efficiency relative to the two commercial powders at all sprayed conditions. While high deposition efficiency is desirable from an economics and environmental impact standpoint; the spray process must be adjusted to account for higher deposition rates.

3.2. Microstructural Analysis

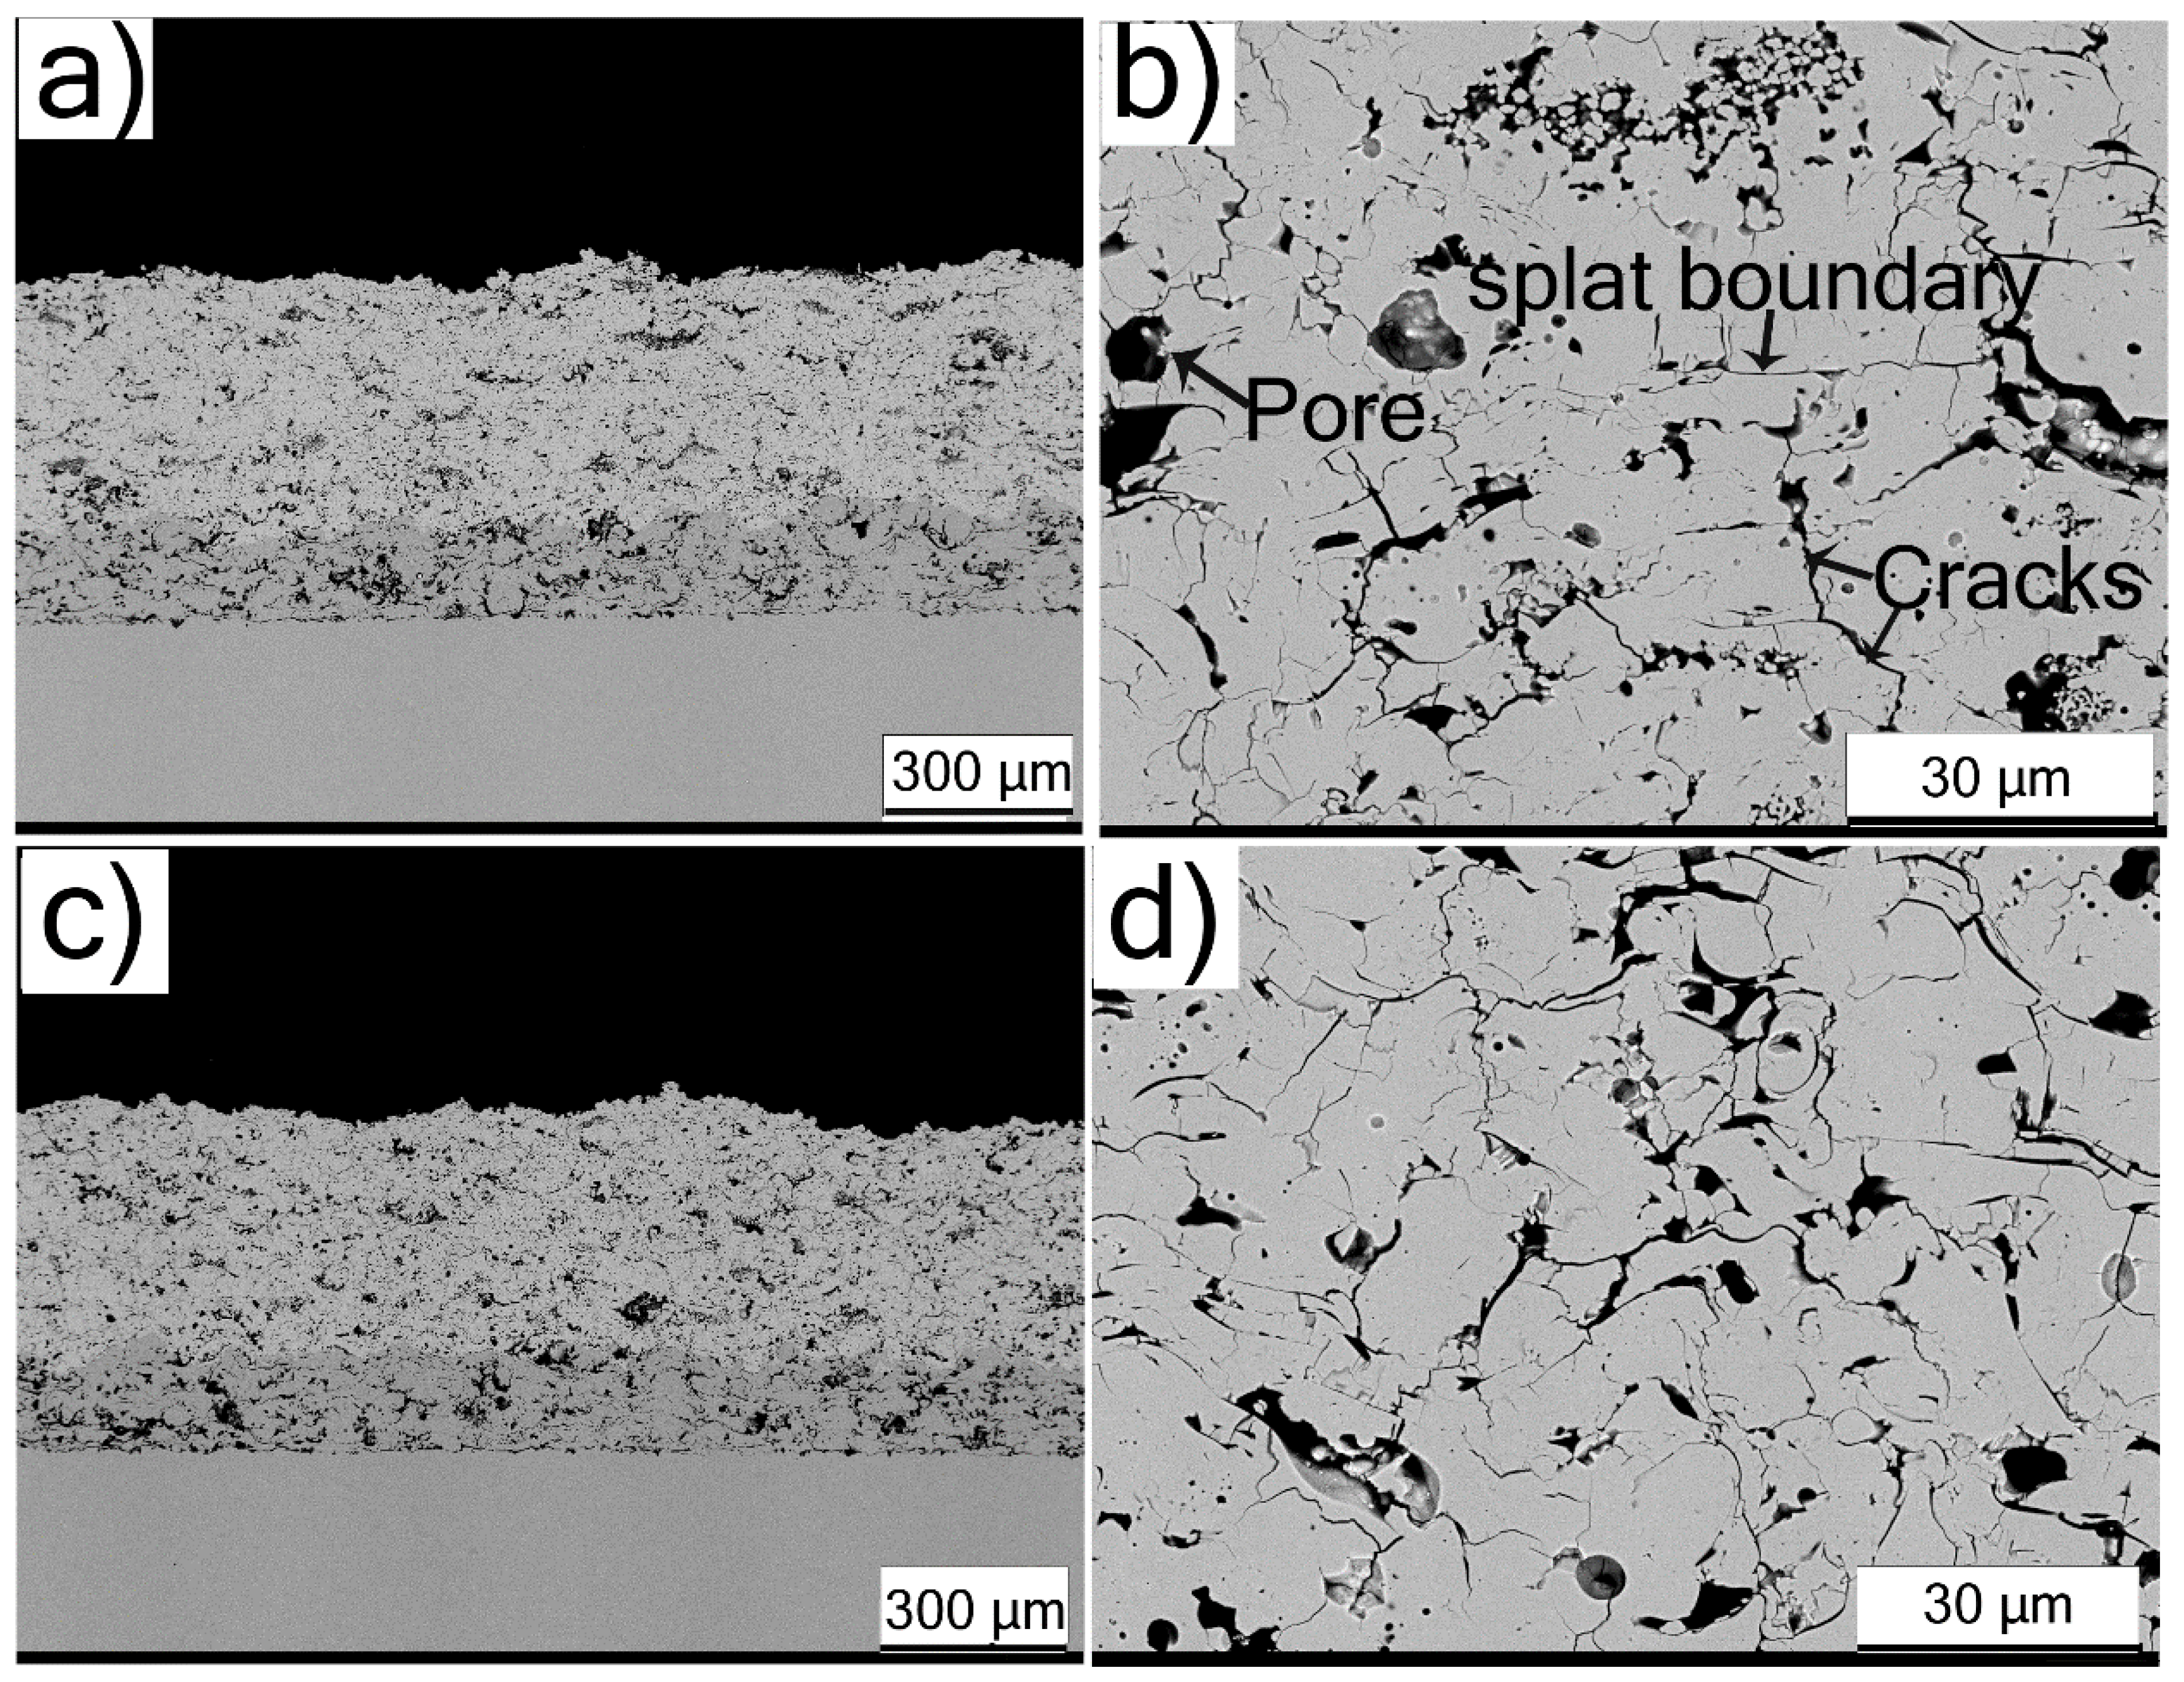
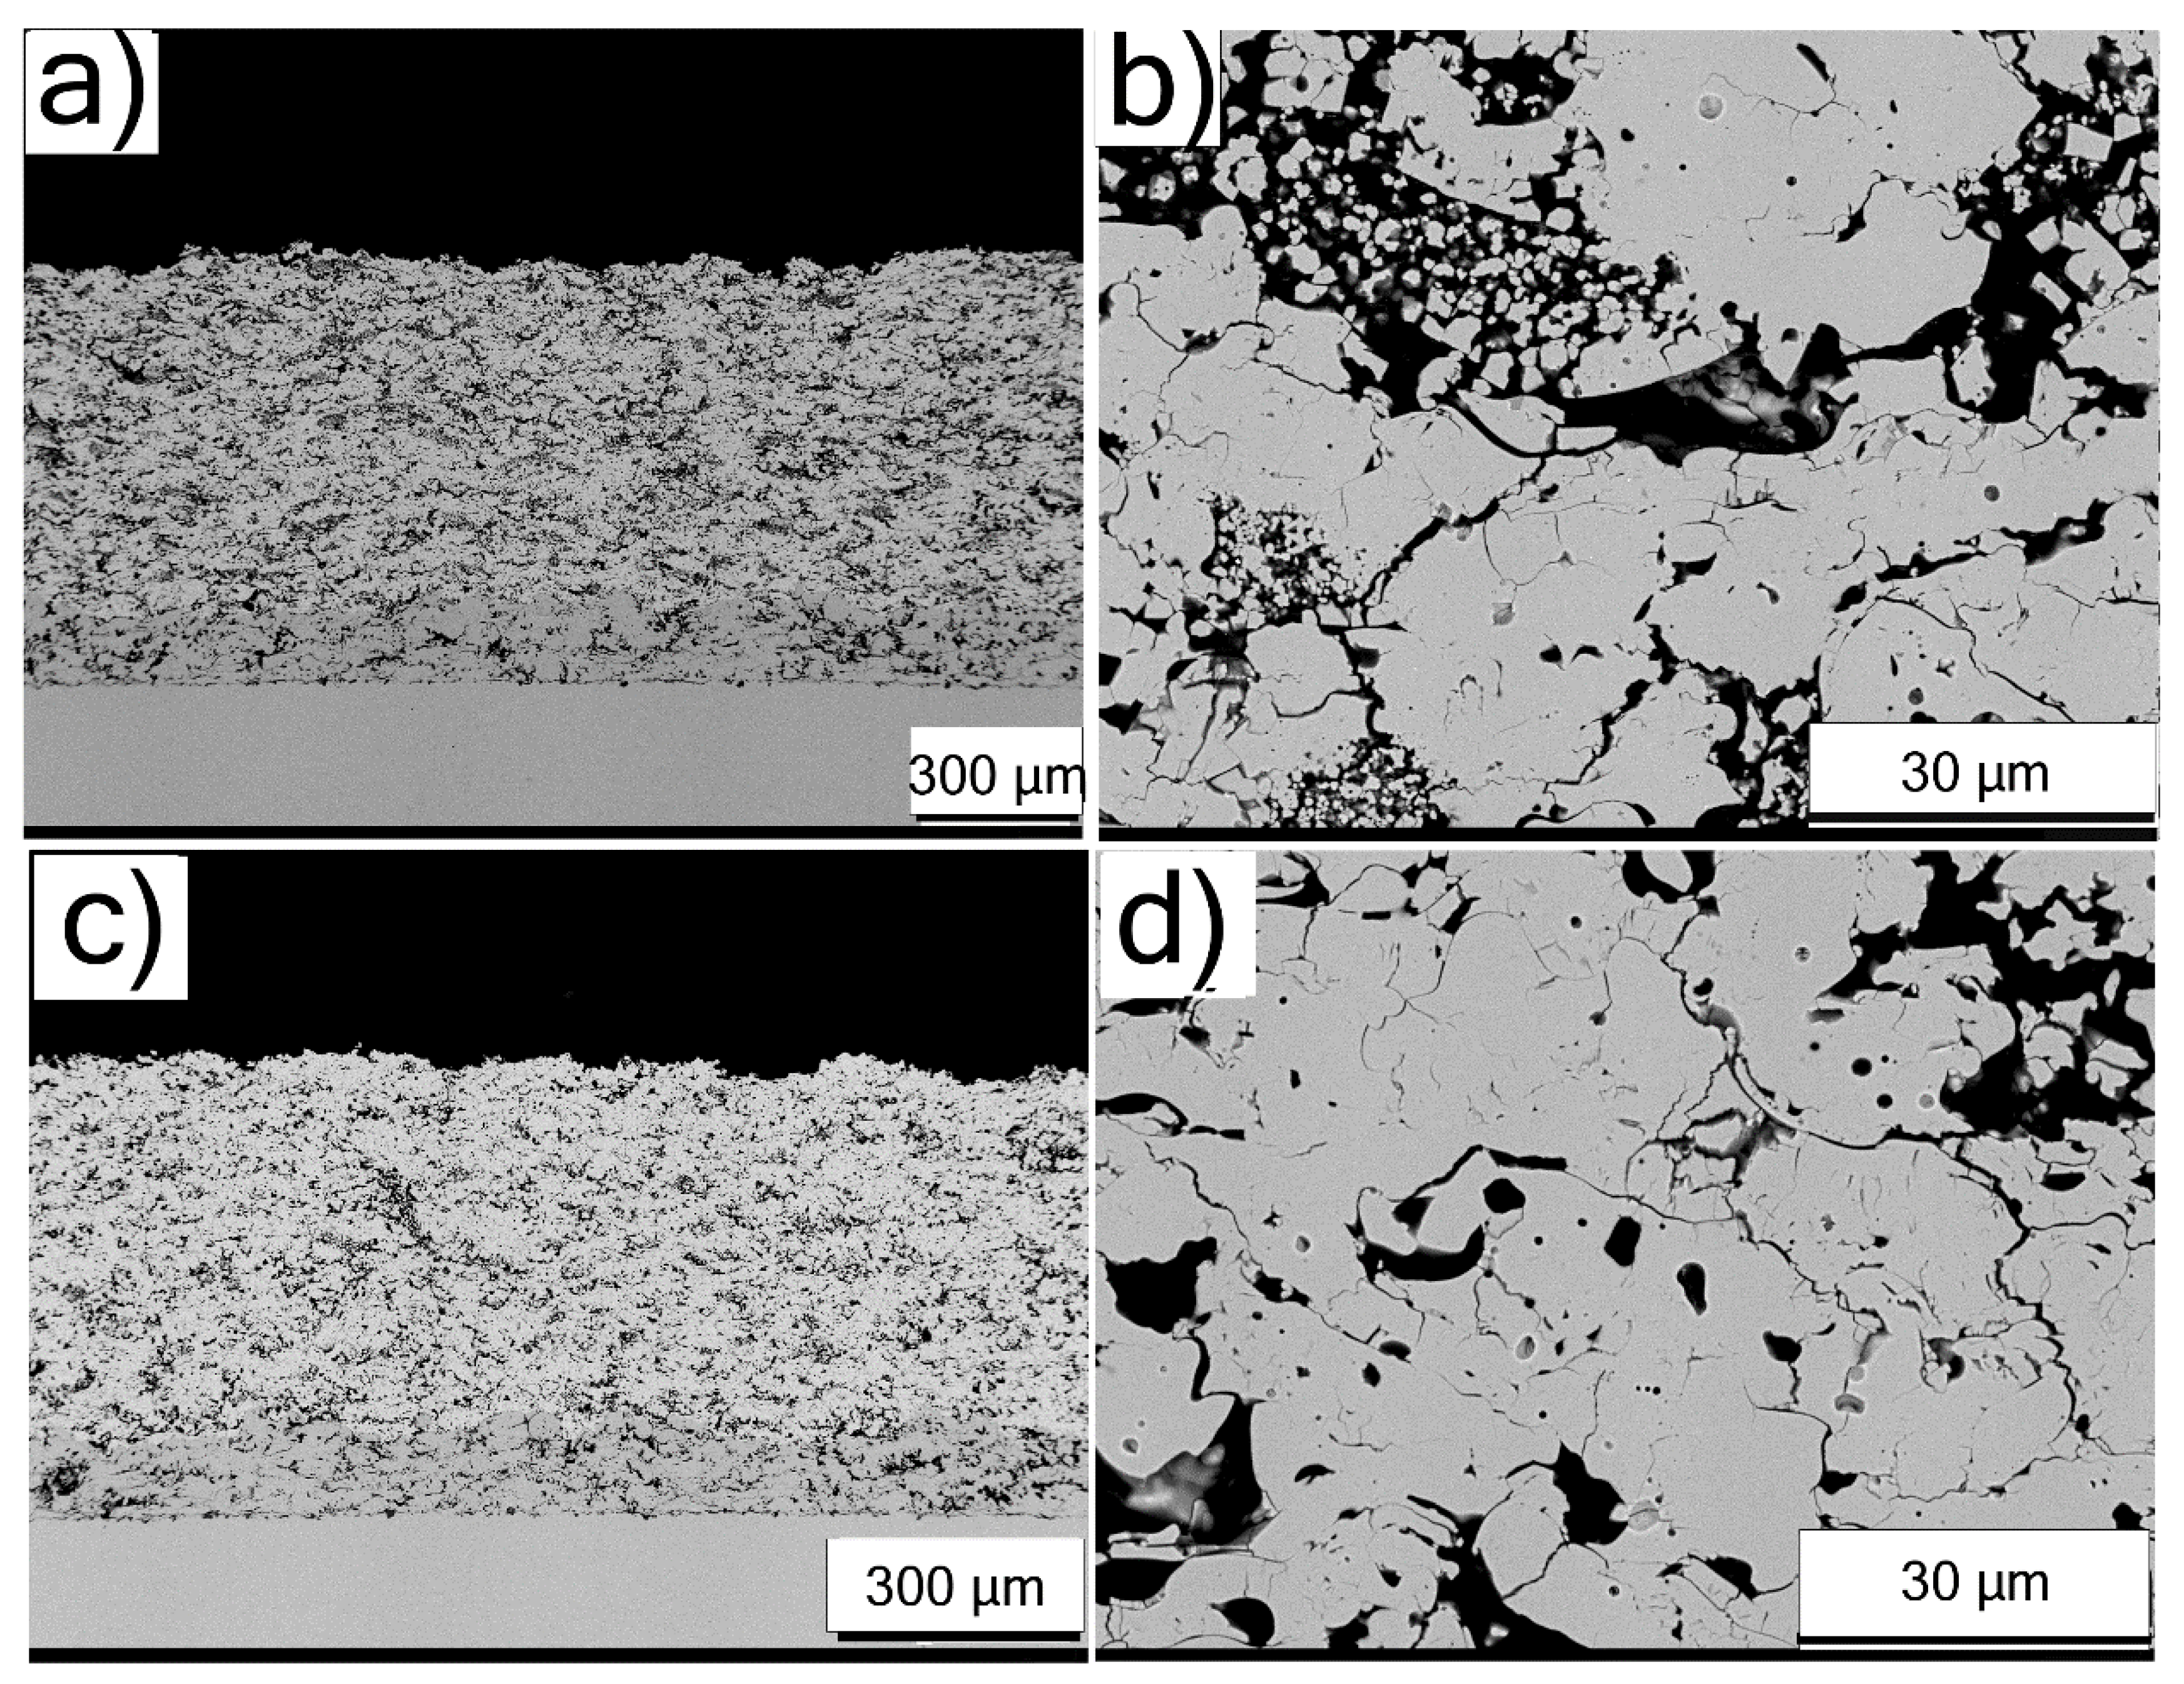
3.2.1. Conventional Porosity—Low Powder Feed Rate (LD-L and HOSP-L)

The low magnification cross-sectional SEM analysis of LD and HOSP feedstocks deposited at low powder feed rate TBCs showed a lamellar microstructure, according to Figure 3a,c, respectively. High magnification cross sectional SEM micrographs of the LD and HOSP-low feed rate TBCs showed clearly distinct splat boundaries and other microstructural features such as cracks and pores, according to Figure 3b,d, respectively. The HOSP coating contains typical lamellar porosity features present in conventional TBCs manufactured from plasma spherodized spray powder. The LD coating contains localized areas with higher porosity; these are apparently formed from larger partially melted powder particles embedded in the coating microstructure [28].

3.2.2. Conventional Porosity—Medium Powder Feed Rate (LD-M and HOSP-M)

The LD (LD-M) and HOSP (HOSP-M) feedstock TBCs processed at medium (M) powder feed rate also showed a lamellar microstructure, according to low magnification SEM micrographs in Figure 4a,c, respectively. At higher magnification, the LD and HOSP-medium feed rate TBCs showed splat boundaries cracks and pores, according to SEM micrographs in Figure 4 b,d, respectively. The microstructure of the HOSP coating resembles that of the low feed rate coating (HOSP-L) with a similar lamellar structure and distributed pores. The LD-M coating contains a greater number of near vertical cracks within the coating microstructure in comparison to the low feed rate coating.
For each of the feedstocks used (LD and HOSP), the deposition efficiency was shown to have a percentage decrease of 4% and 17%, respectively, with an increase in feed rate from 90 g/min to 150 g/min (see Table 1). Furthermore, the ~66.7% increase in the powder feed rate did not result in any dramatic changes in the TBC microstructure. This correlates to the particle in flight conditions reported in Figure 1 that show only slight differences between low and medium feed rate conditions.

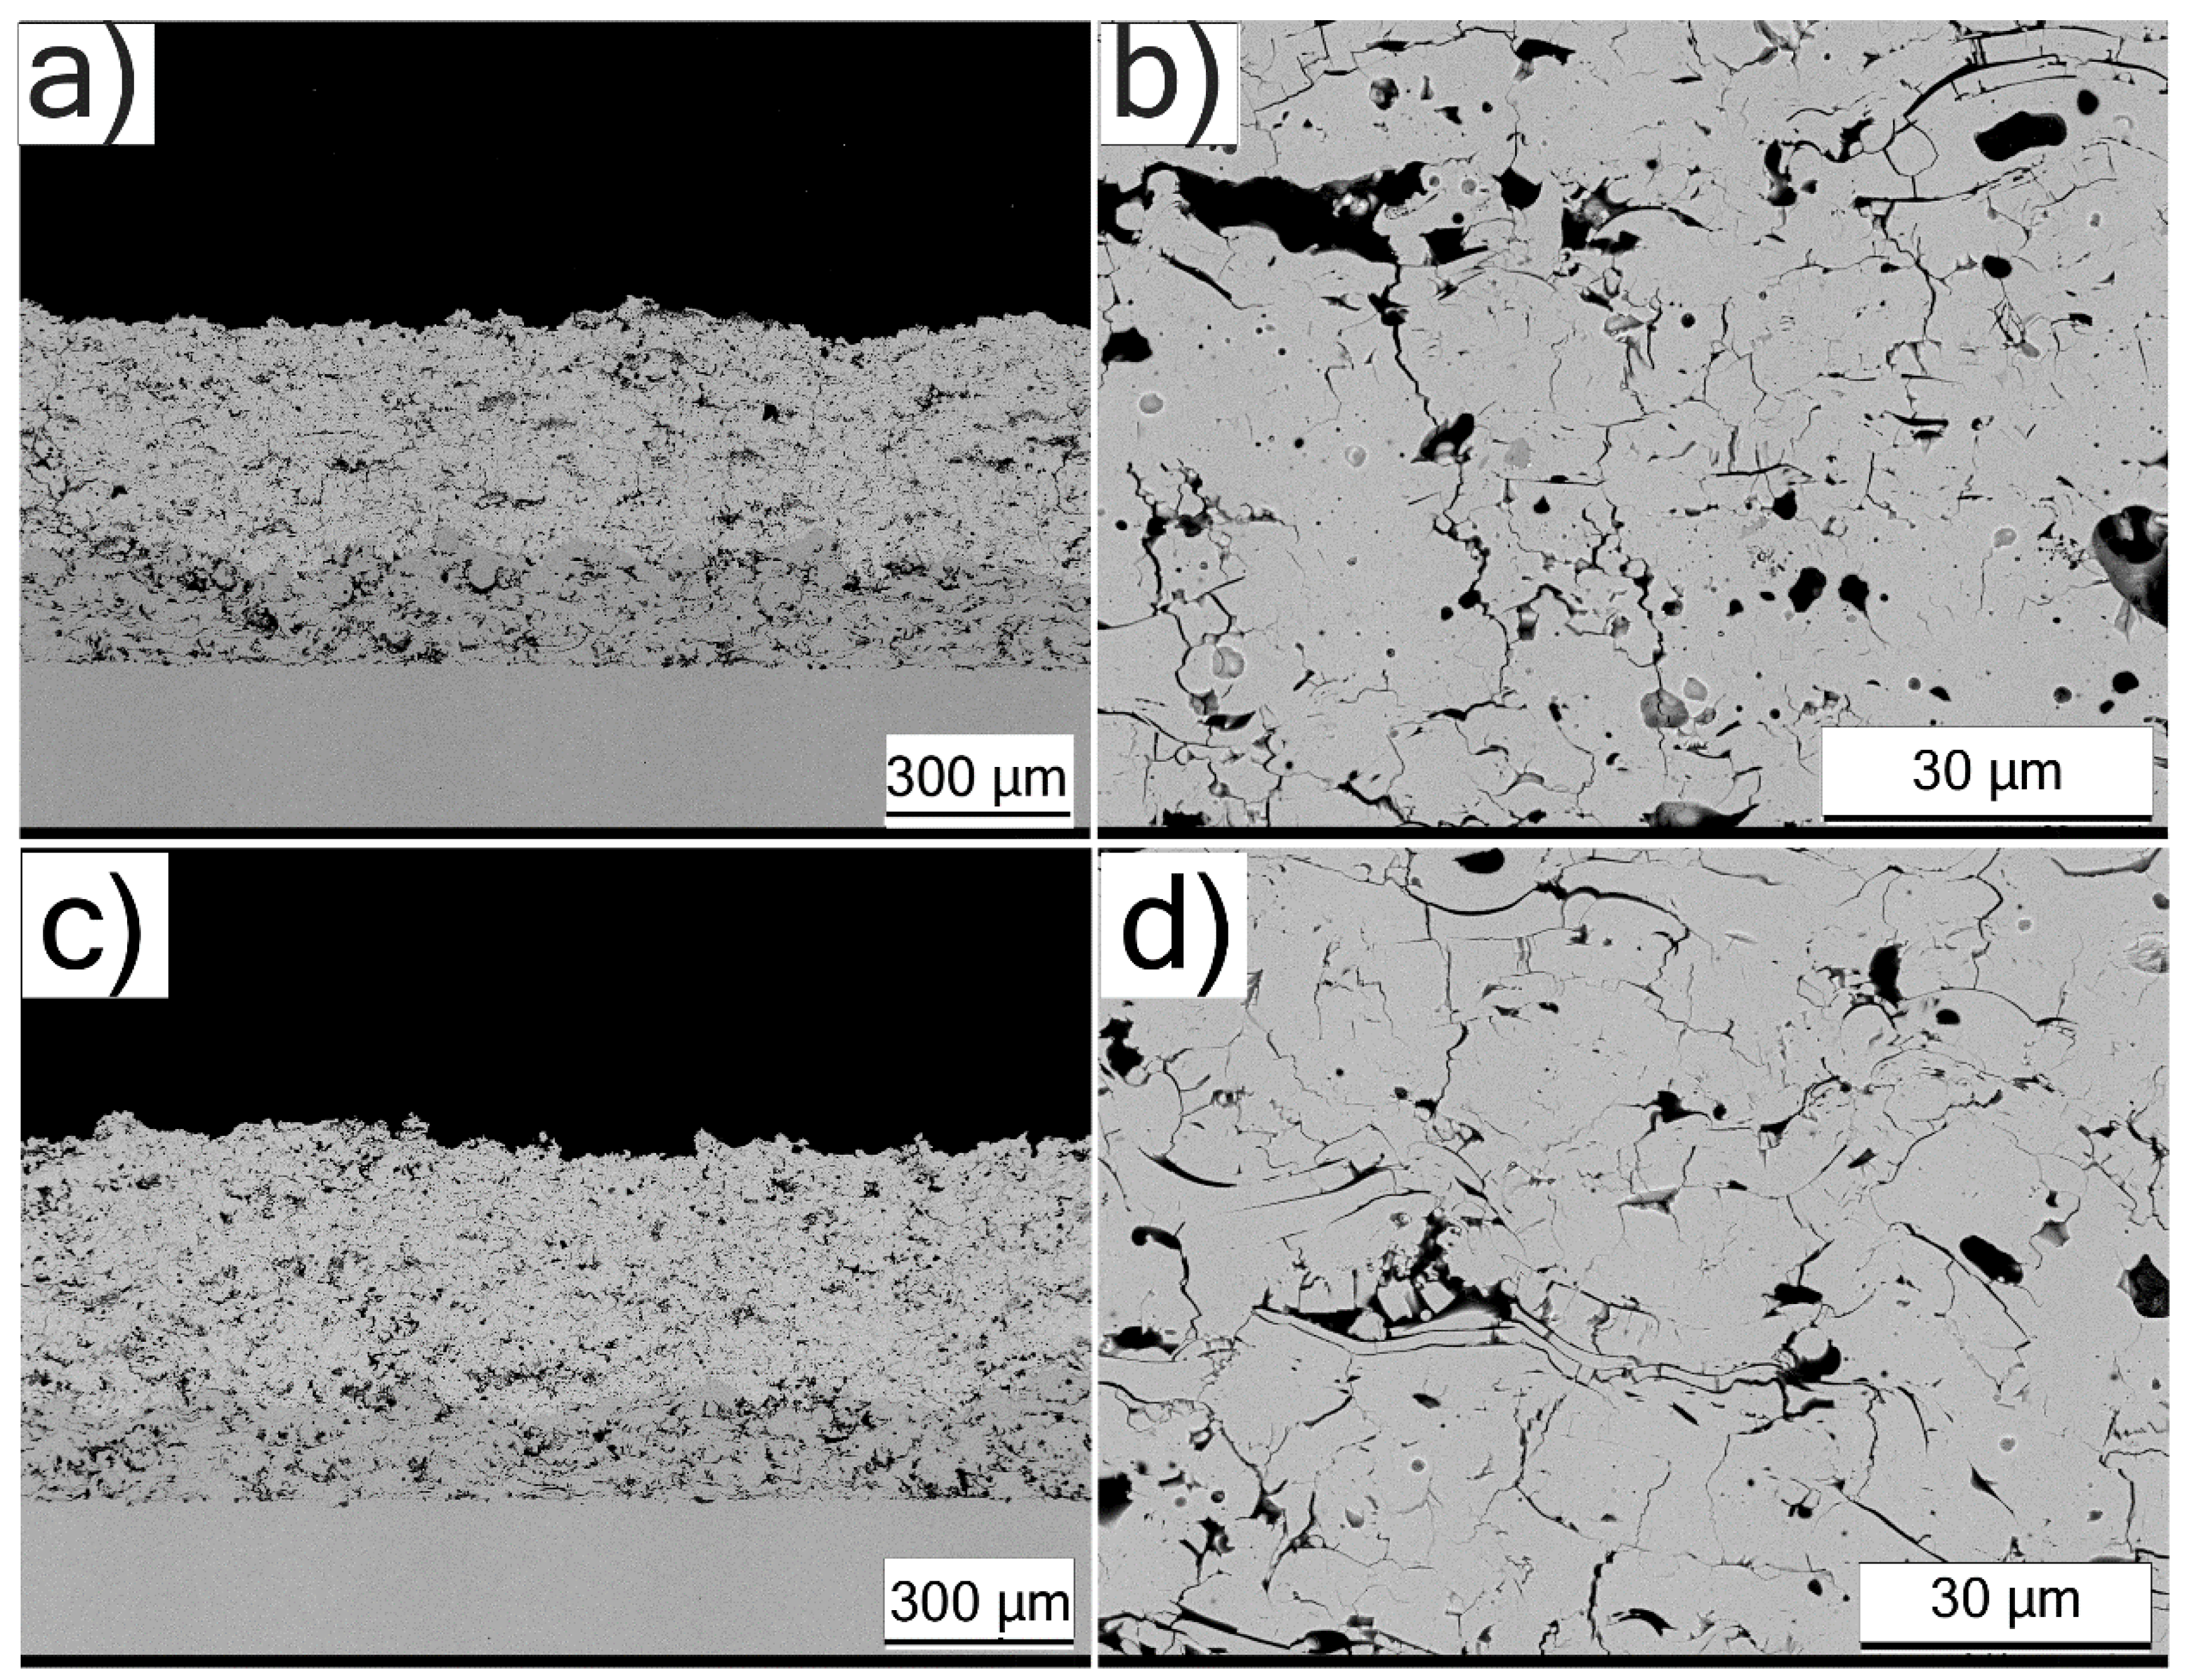
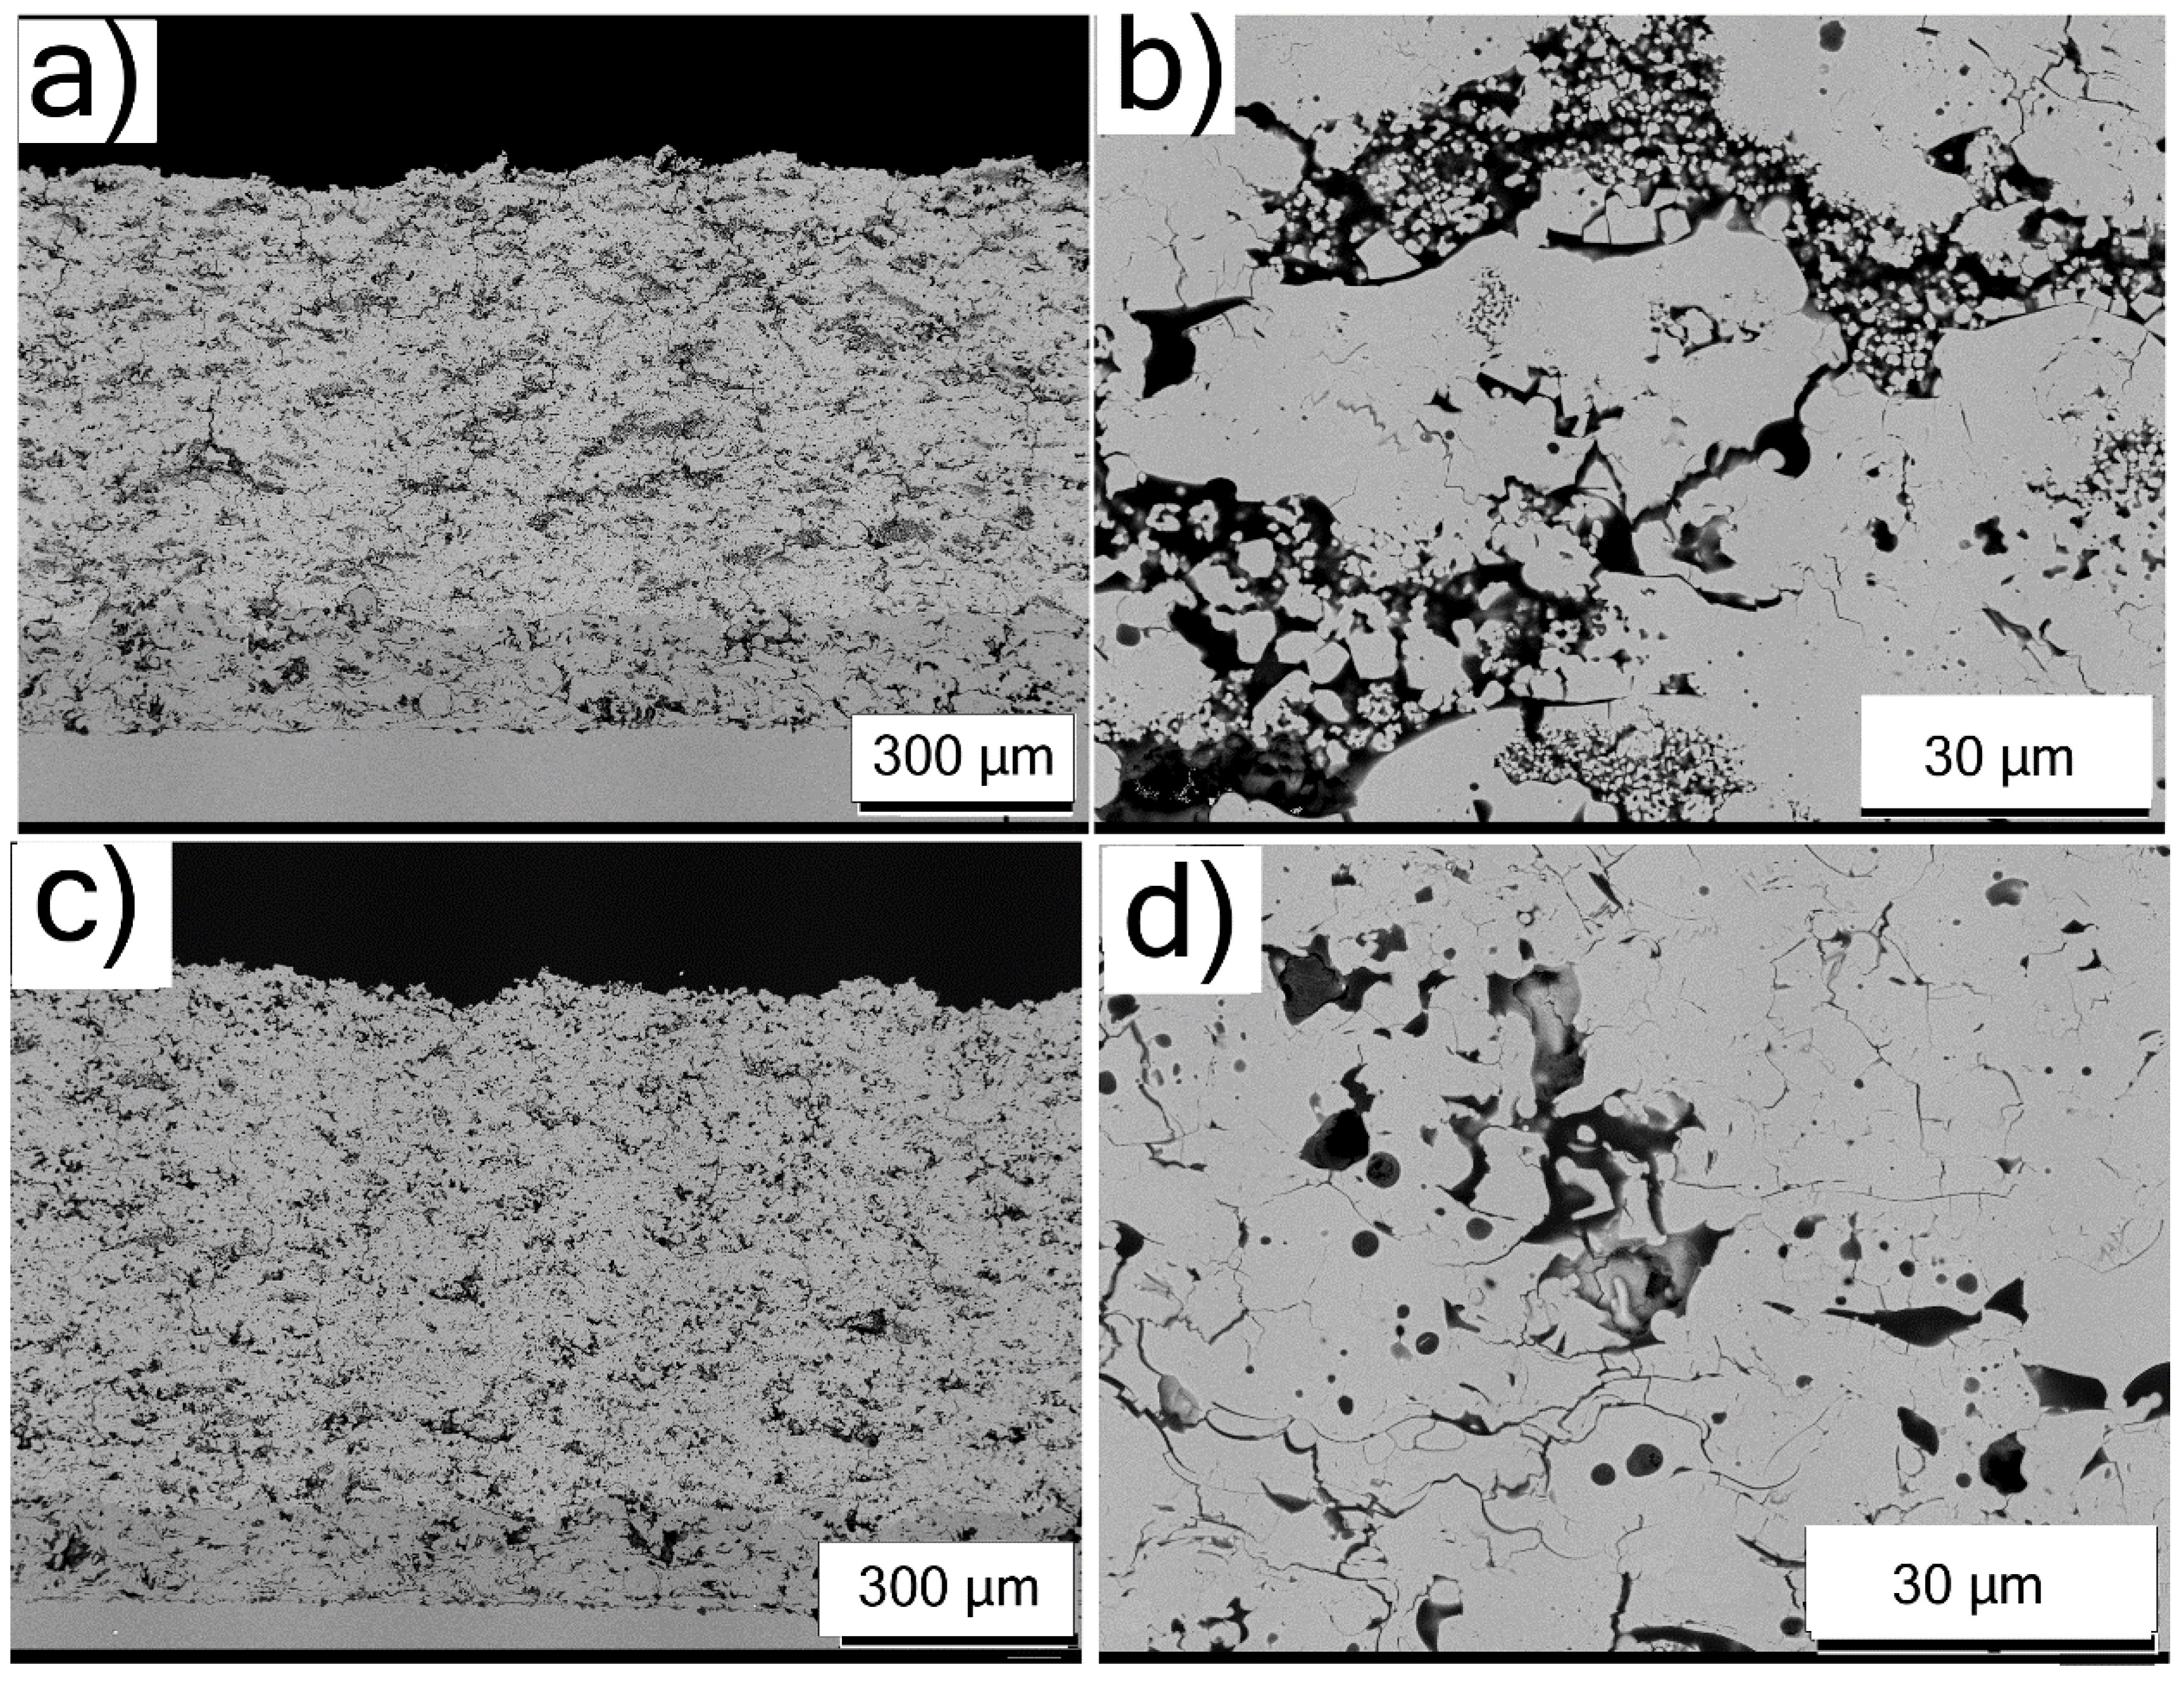
3.2.3. High Porosity—Higher Feed Rates and Longer Standoff Distance (LD-H, A&S-H)

In the case of agglomerated and sintered, experimental (LD-H) and commercial (A&S-H) feedstocks processed using higher (H) powder feed rates, the cross-sectional SEM micrographs at lower magnification showed lamellar microstructure with visible porosity, see Figure 5a,c, respectively. Additionally, it can be seen at the lower magnification, that there is a notable difference in porosity between the two coatings, with the LD-H coating visibly more porous than the A&S-H coating. The high magnification cross sectional SEM micrographs in Figure 5b showed extensive presence of partially molten powder particles as well as irregular porosity and lamellar defects in the case of LD-H. The commercial powder derived TBC in Figure 5d showed fewer partially melted powder particles, with the porosity consisting of primarily irregular pores and some lamellar porosity.
Comparing the low and medium feed rate LD TBCs with those deposited using high feed rates, an increase in powder feed rate from 150 g/min to 280 g/min uses the same amount of available plasma energy for heating ~86.7% greater mass of feedstock particles. This causes lower overall particle heating in the plasma plume and results in a higher quantity of partially melted powder particles embedded in the coating structure. Additionally, longer (25 mm longer) standoff distance results in the arrival of particles in a relatively slower condition prior to their deposition, further contributing to irregular porosity content as well as partially melted powder particles. These unmolten particles can compromise the TBC erosion performance [20].

3.2.4. High Porosity—Higher Feed Rates and Shorter Standoff Distance (LD-H.S, A&S-H.S)

Experimental (LD-H.S) and commercial feedstock (A&S-H.S) derived TBCs deposited using higher (H) powder feed rates and shorter (S) standoff distance, the cross sectional SEM micrographs showed lamellar microstructure, see Figure 6a,c. In comparison to the standard high porosity TBC conditions, those at a shorter standoff distance display a reduced level of porosity. It is also apparent in the LD-H.S coating that there are many vertical cracks present within the coating structure.
Partially melted powder particles were clearly visible in the case of experimental feedstock (LD) derived TBC in Figure 6b. In the case of the commercial feedstock derived TBC, fewer partially molten powder particles were observed the microstructure Figure 6d. Irregular pores, splat boundaries, and cracks, which are typical for a plasma sprayed TBC, were observed in both the cases. The relatively shorter standoff distance compared to standard conditions for high porosity TBCs resulted in TBC microstructures with reduced levels of unmelts. This could be attributed to the fact that the lower standoff distance allows the particles to arrive in a relatively hotter and faster condition prior to deposition, as observed in Figure 1.

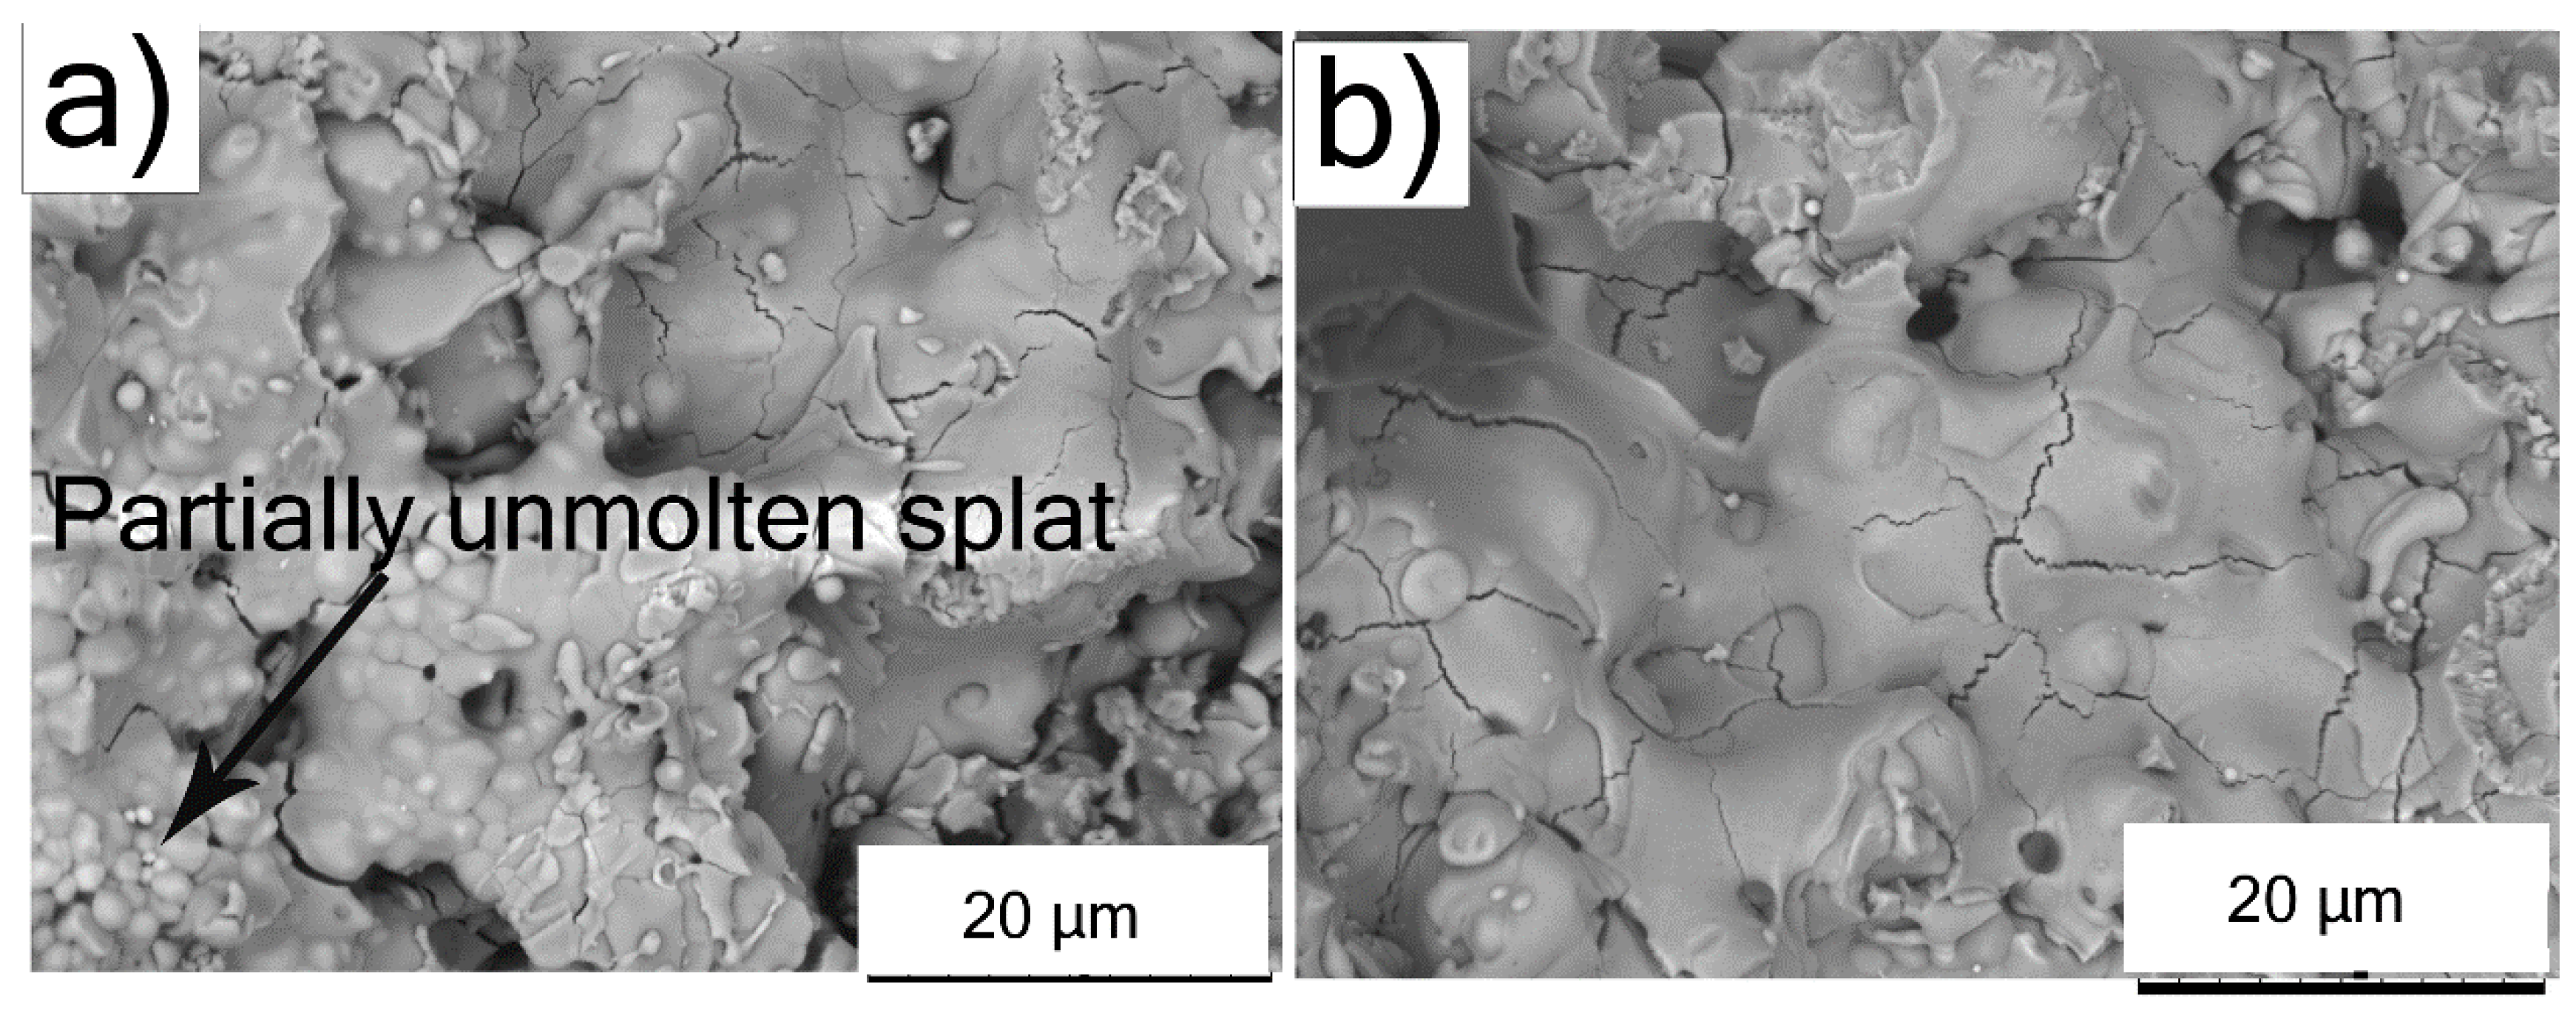
3.2.5. Top Surface SEM Analysis

In the top surface SEM analysis, most of the investigated TBCs showed similar microstructural features. Therefore, TBCs with visibly distinct top surface microstructural features were considered for comparison. The top surface SEM micrograph of L.D-H TBC in Figure 7a showed partially unmolten splats. On the other hand, the A&S-H.S showed minimal unmolten splats, see Figure 7b. The top surface SEM analysis results of L.D-H and A&S-H.S concur with their cross sectional SEM analysis results in relation to the presence of partially unmolten splats. These differences in microstructural features could potentially influence their fracture toughness and erosion performance [20]. Furthermore, L.D-H and A&S-HS TBCs showed quenching cracks within the solidified splats.

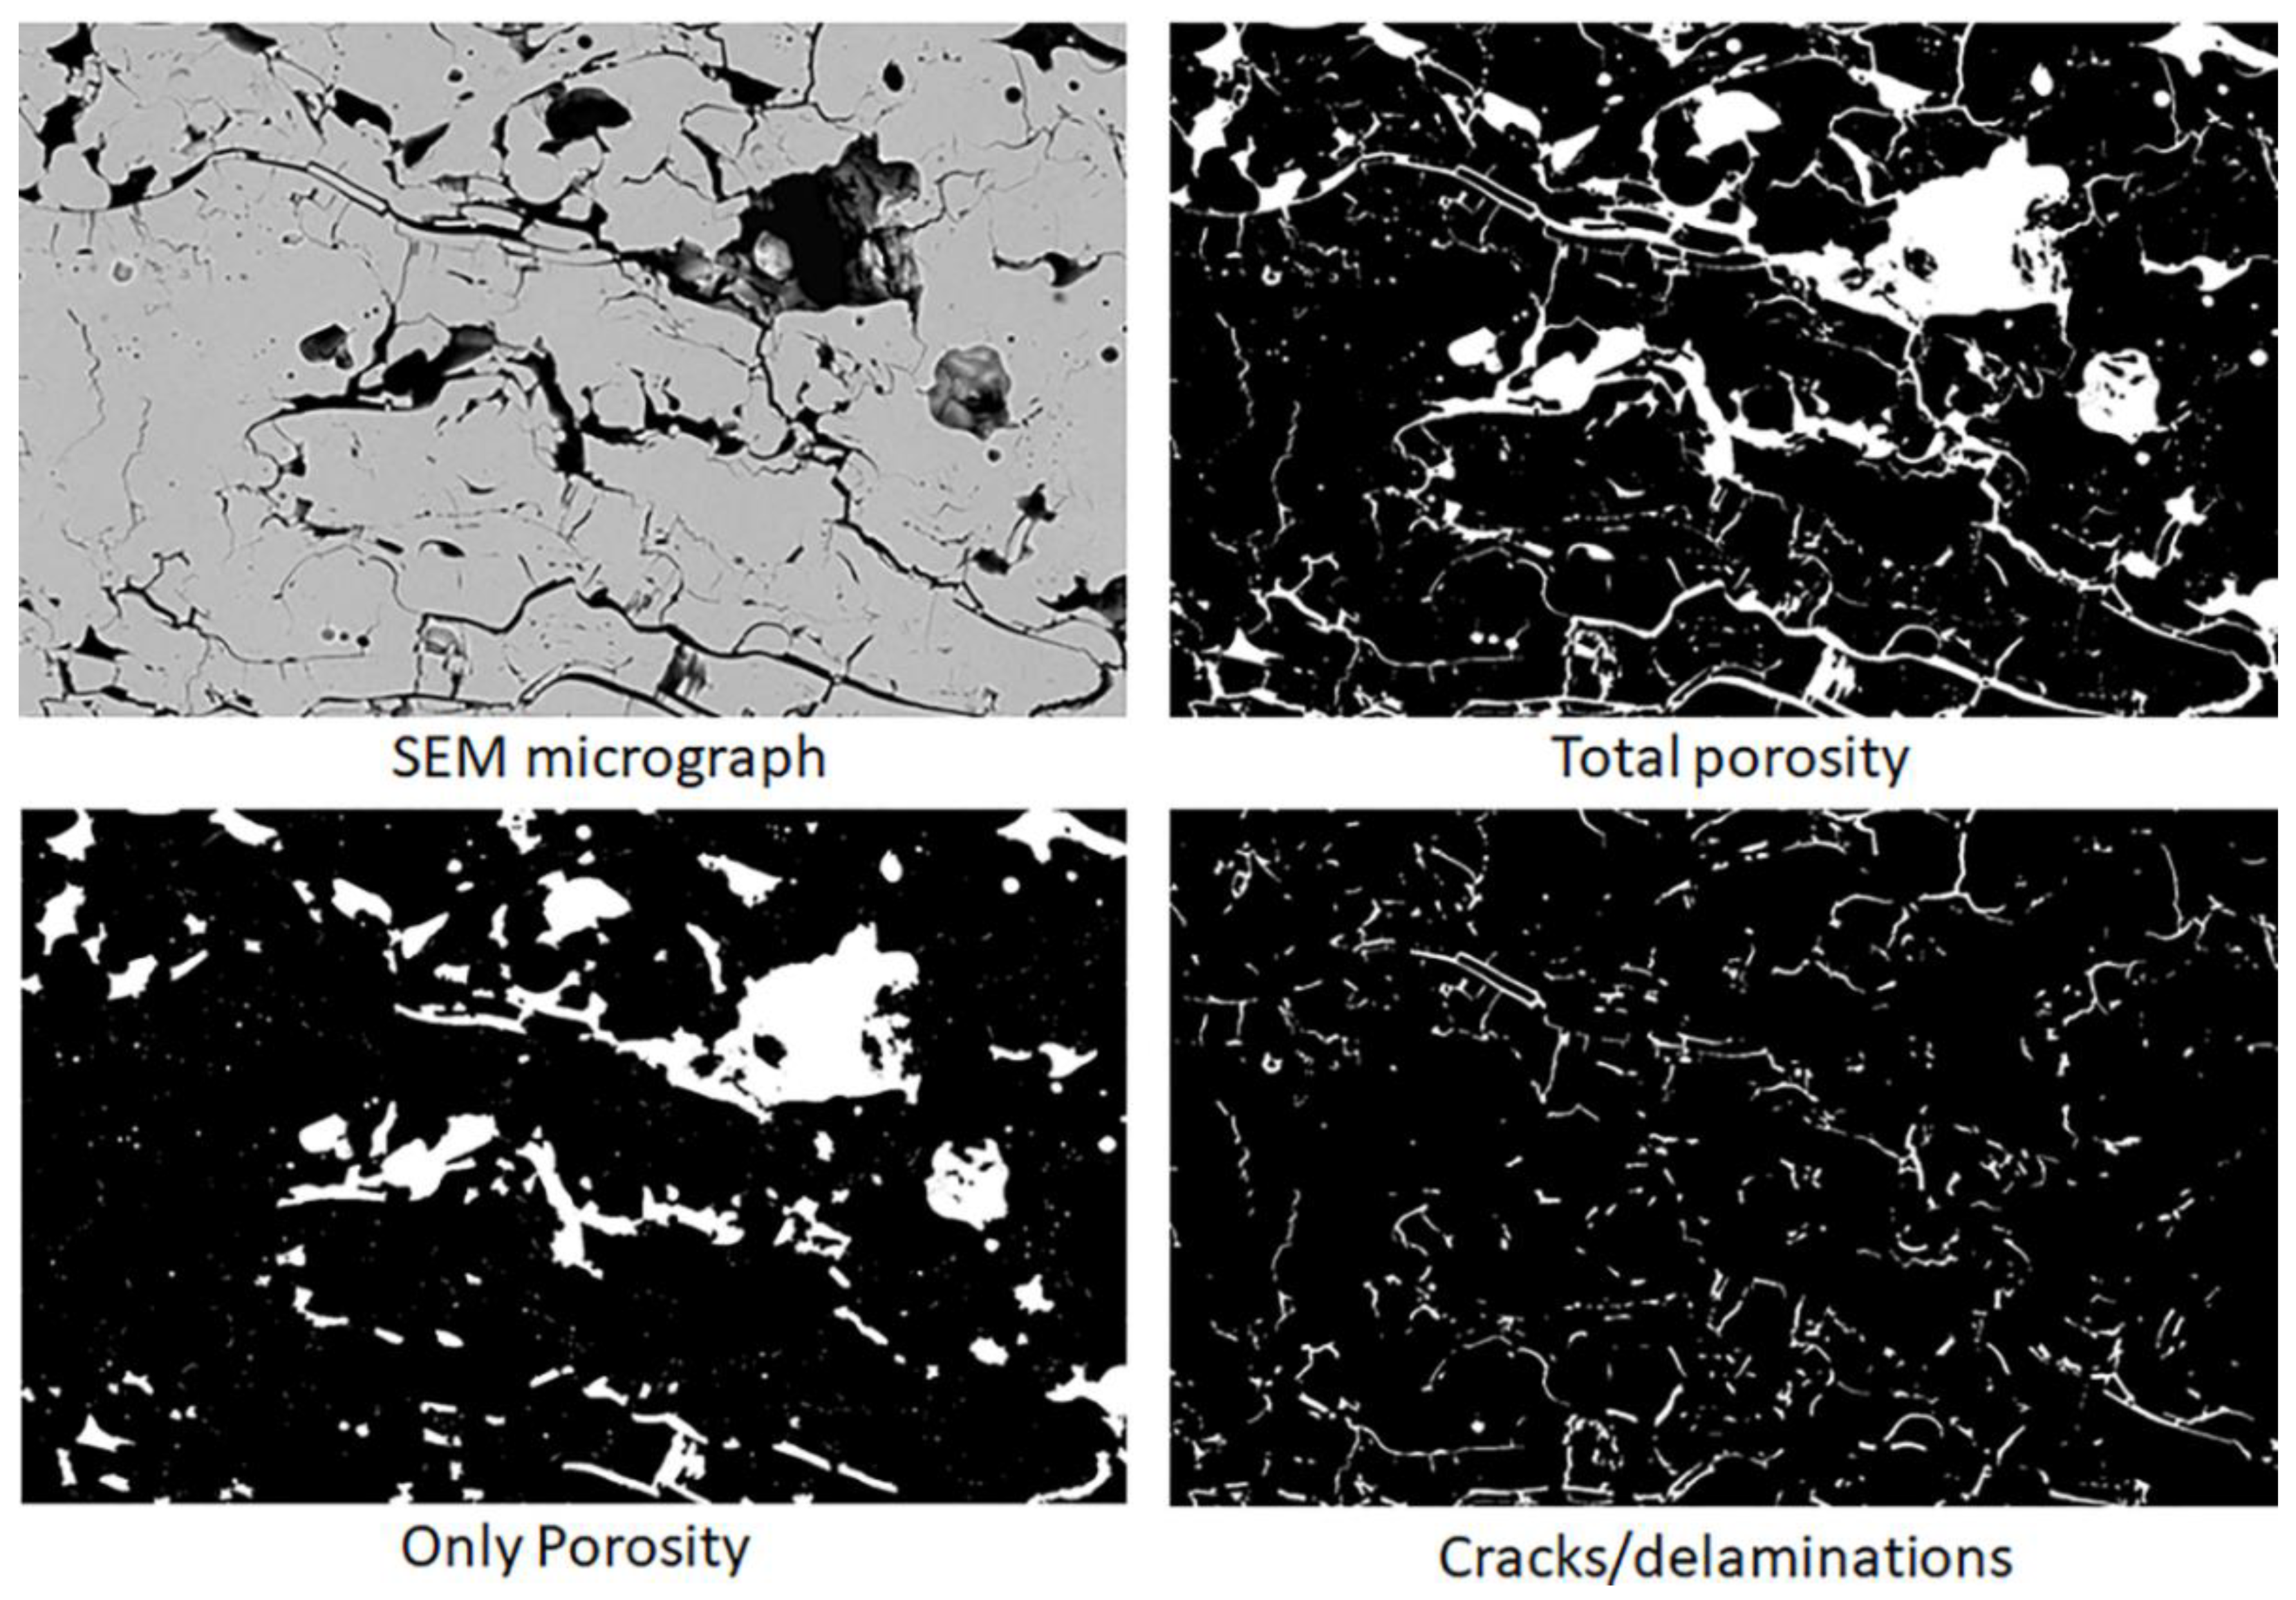
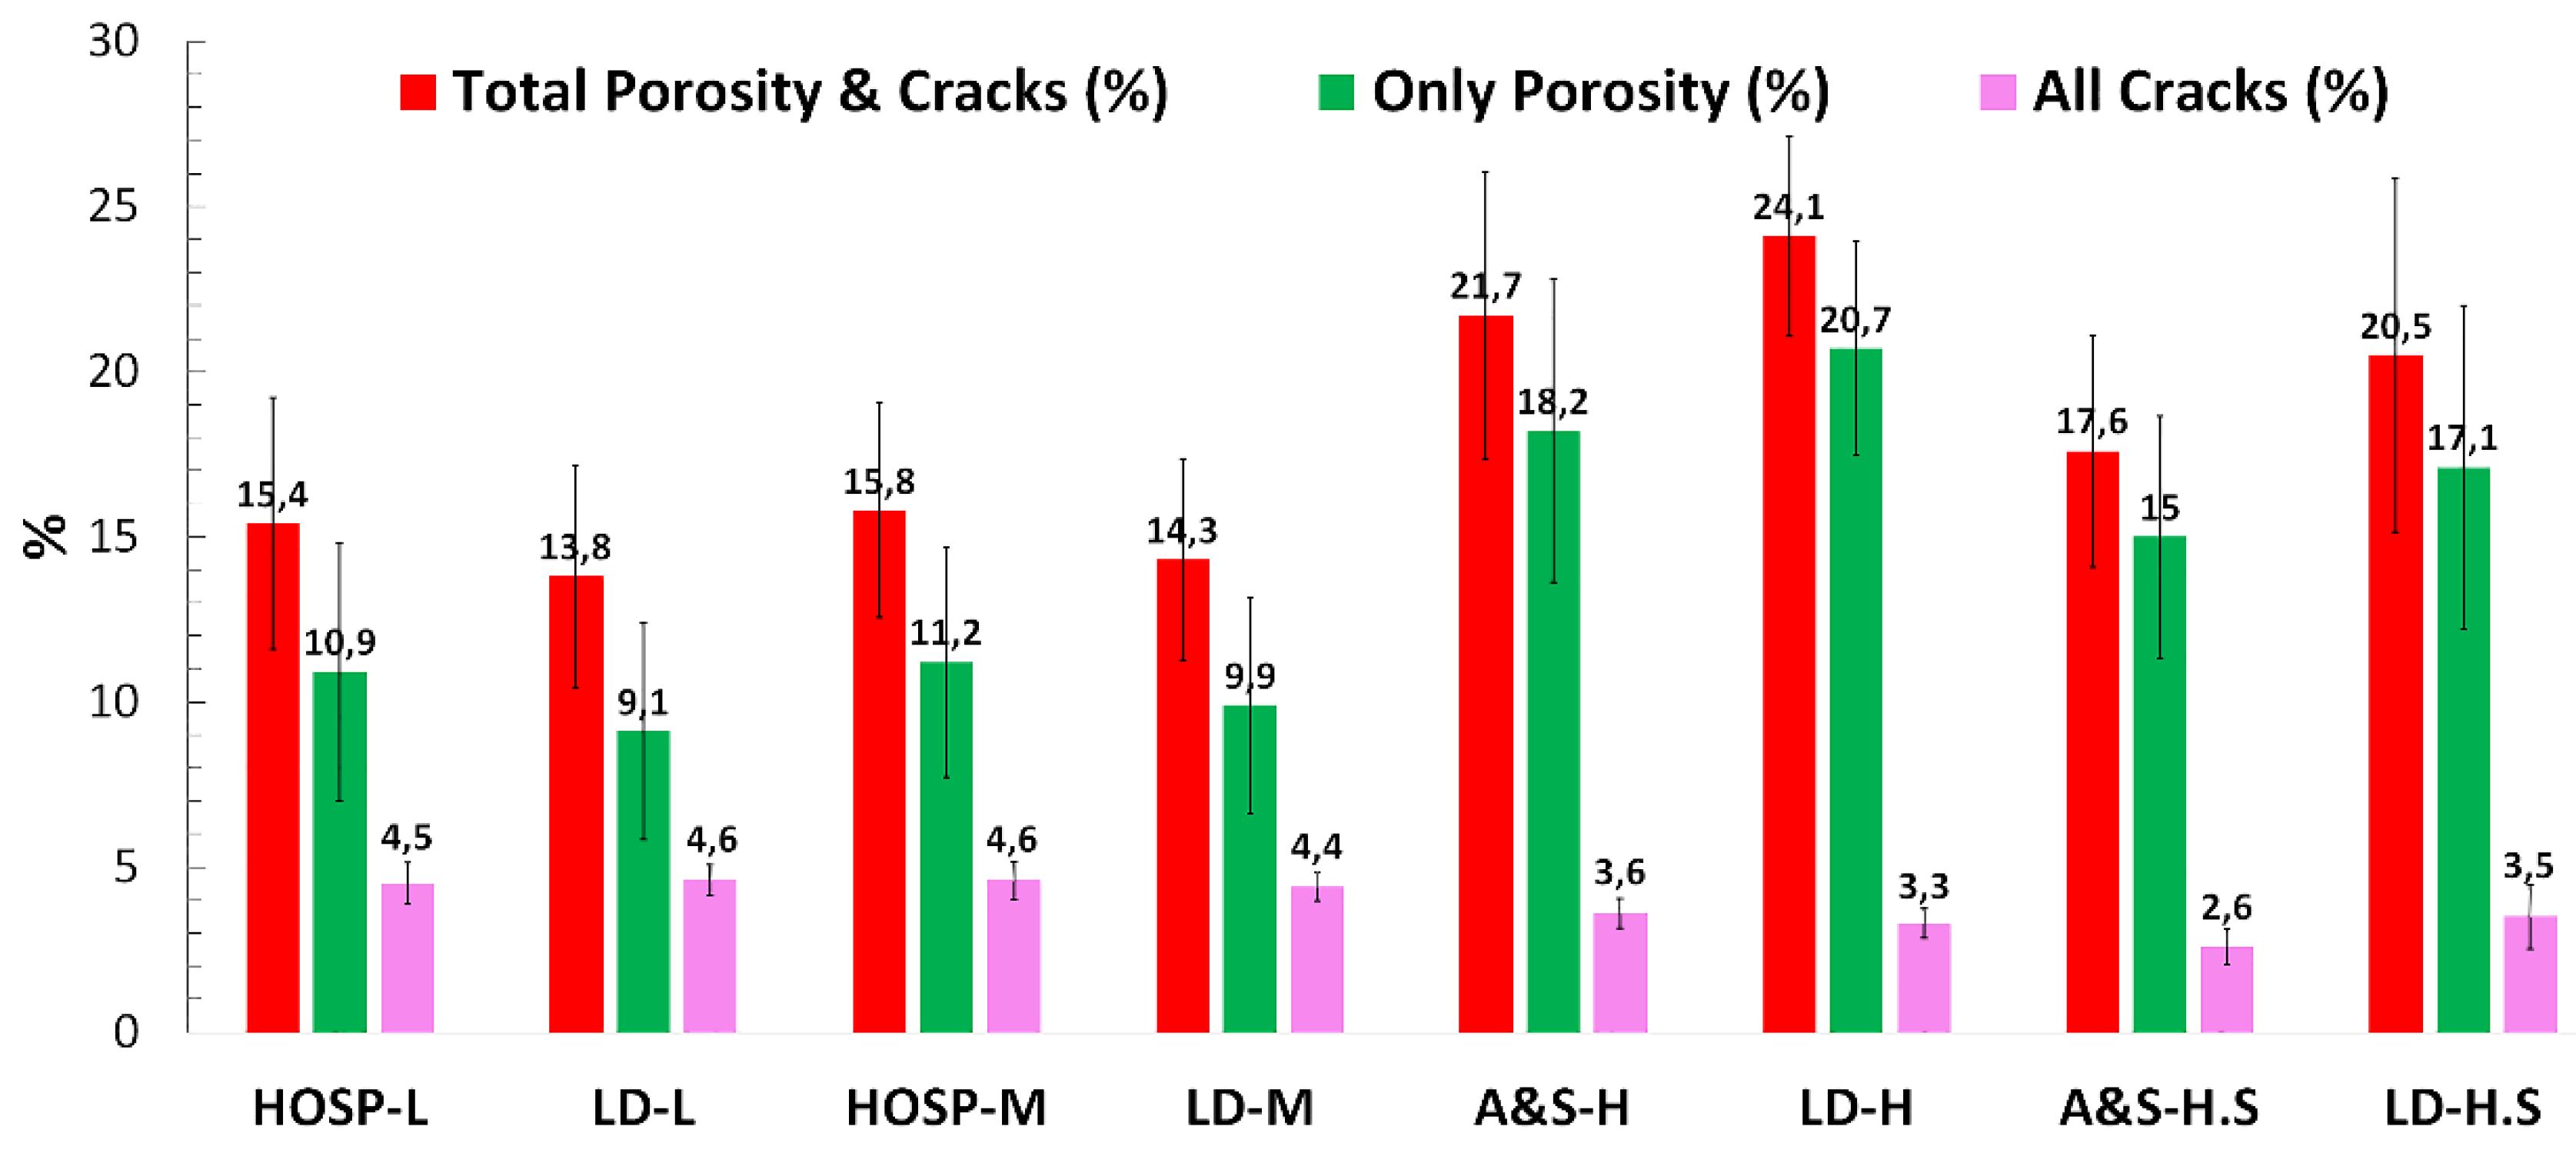
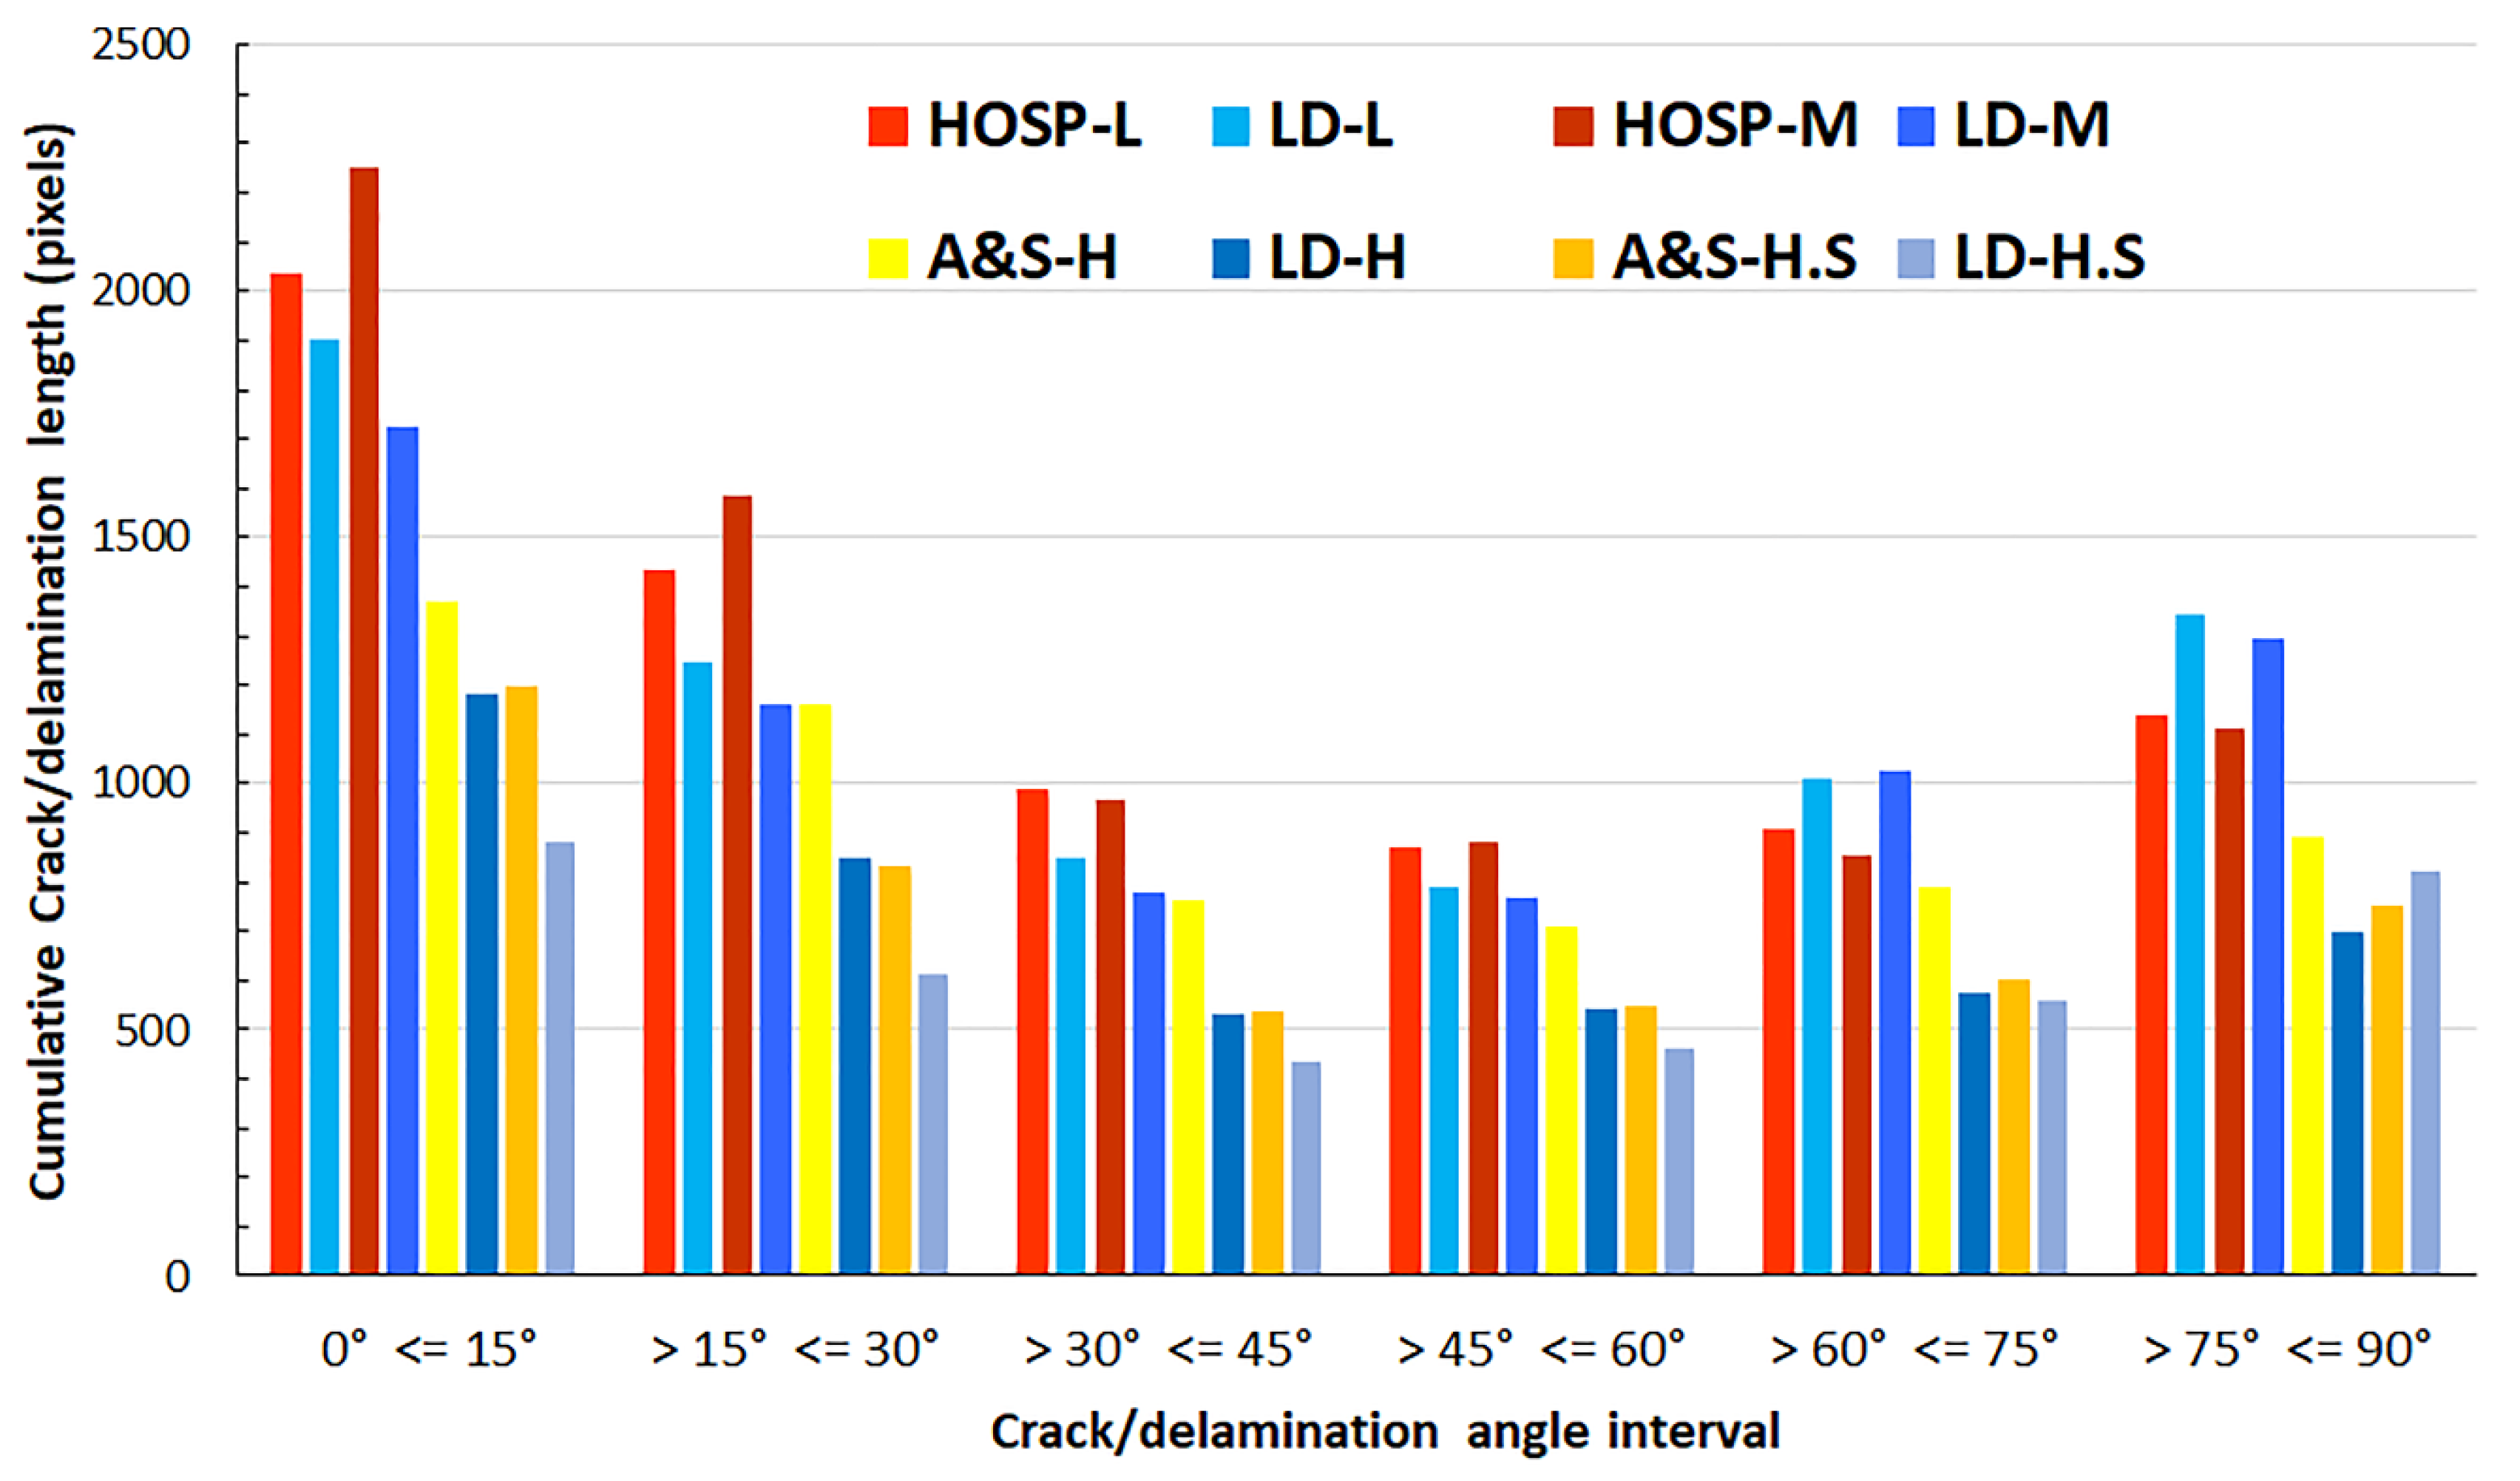
3.3. Quantification of Microstructural Features

The total porosity content in the as-deposited TBCs, considering the contribution from pores, splat boundaries, and cracks, is shown in Figure 8. As expected, total porosity was greatest for the high porosity TBCs (LD-H and A&S-H) at 24.1% and 21.8%, respectively. As a consequence of such high porosity content, it is expected that the properties such as hardness, fracture toughness and erosion resistance for these TBCs could be inferior to other investigated TBCs. The high feed rate, short standoff coatings (LD-H.S and A&S-H.S) were slightly lower in porosity at 20.5% and 17.6%, respectively. Furthermore, for an identical powder feedstock, decrease in standoff distance led to a decrease in total porosity. This could be attributed to the fact that the molten feedstock arrives in a relatively hotter condition and undergoes flattening to a greater extent when the standoff distance is kept lower.
Conventional porous TBCs with low (LD-L, HOSP-L) and medium (LD-M and HOSP-M) powder feed rates showed comparable total porosity in the range 13.8% to 15.8%, with the LD based coatings being at the lower end of the range. This may be understood when considering the high deposition efficiency (68–71%) for both the LD-L and LD-M coatings (see Table 1). High DE suggests very efficient melting of the YSZ powders despite the lower plasma power levels utilized. Well melted spray powder would tend to favor a lower porosity level in the final coating. Looking at the breakdown of porosity type, the contribution from pores only (irregular porosity) follows closely the trend of total porosity.
Furthermore, the contribution from only cracks/delaminations (in %) among the investigated TBCs was shown to be lowest for A&S-H.S whereas the rest of the TBCs showed slightly higher contribution from cracks. For the conventional porosity TBCs, crack/delamination content accounts for approximately 1/3rd of the total porosity content. When moving to high feed rate conditions, the detected crack/delamination content reduces slightly; meaning the majority of the additional porosity generated by these conditions is in the form of irregular porosity.

Inclination Angle of Cracks to the Substrate

When analyzing porosity, pores within the microstructure with a high aspect ratio are classified as cracks or delaminations. Crack or delamination angles are determined by drawing a line through the long axis of a crack and calculating the angle that is made to the horizontal plane (bond coat interface). Those delaminations in the range of 0° to 15° are deemed parallel to the substrate and bond coat interface. Those between 75° and 90° are deemed perpendicular to the bond coat interface and would be considered vertical cracks.
It can be seen in Figure 9 that the HOSP coatings have a larger cumulative crack length in the near to parallel direction in comparison to the other coatings evaluated. This may be related to the typical structure of coatings manufactured from plasma spherodized powders that contain many lamellar pores. It has been reported previously that plasma spherodized powders create coatings with a far greater number of horizontal delaminations in comparison to conventional A&S powder [38]. The low-density coatings produced at low and medium feed rate have more cracks/delaminations oriented in the 60°–90° direction in comparison to the HOSP coatings. This may be related to the differences between the powder morphologies or the differences in deposition conditions.
The coatings sprayed at high feed rates showed a lower cumulative measured crack length across all angles in comparison to the conventional porosity level coatings. This could be understood as they have a lower percentage of cracks making up their total porosity; the coatings being designed to contain a large quantity of irregular pores.
SEM analysis and porosity results indicate that the microstructural features such as pores, partially molten splats etc., increased with an increase in the standoff distance and powder feed-rate. This could be attributed to the fact that the splats arrive in a relatively colder condition prior to deposition onto the substrate. Similar findings on the influence of standoff distance and feed rate on the coating density were reported elsewhere for suspension plasma sprayed TBCs [2,35,39].

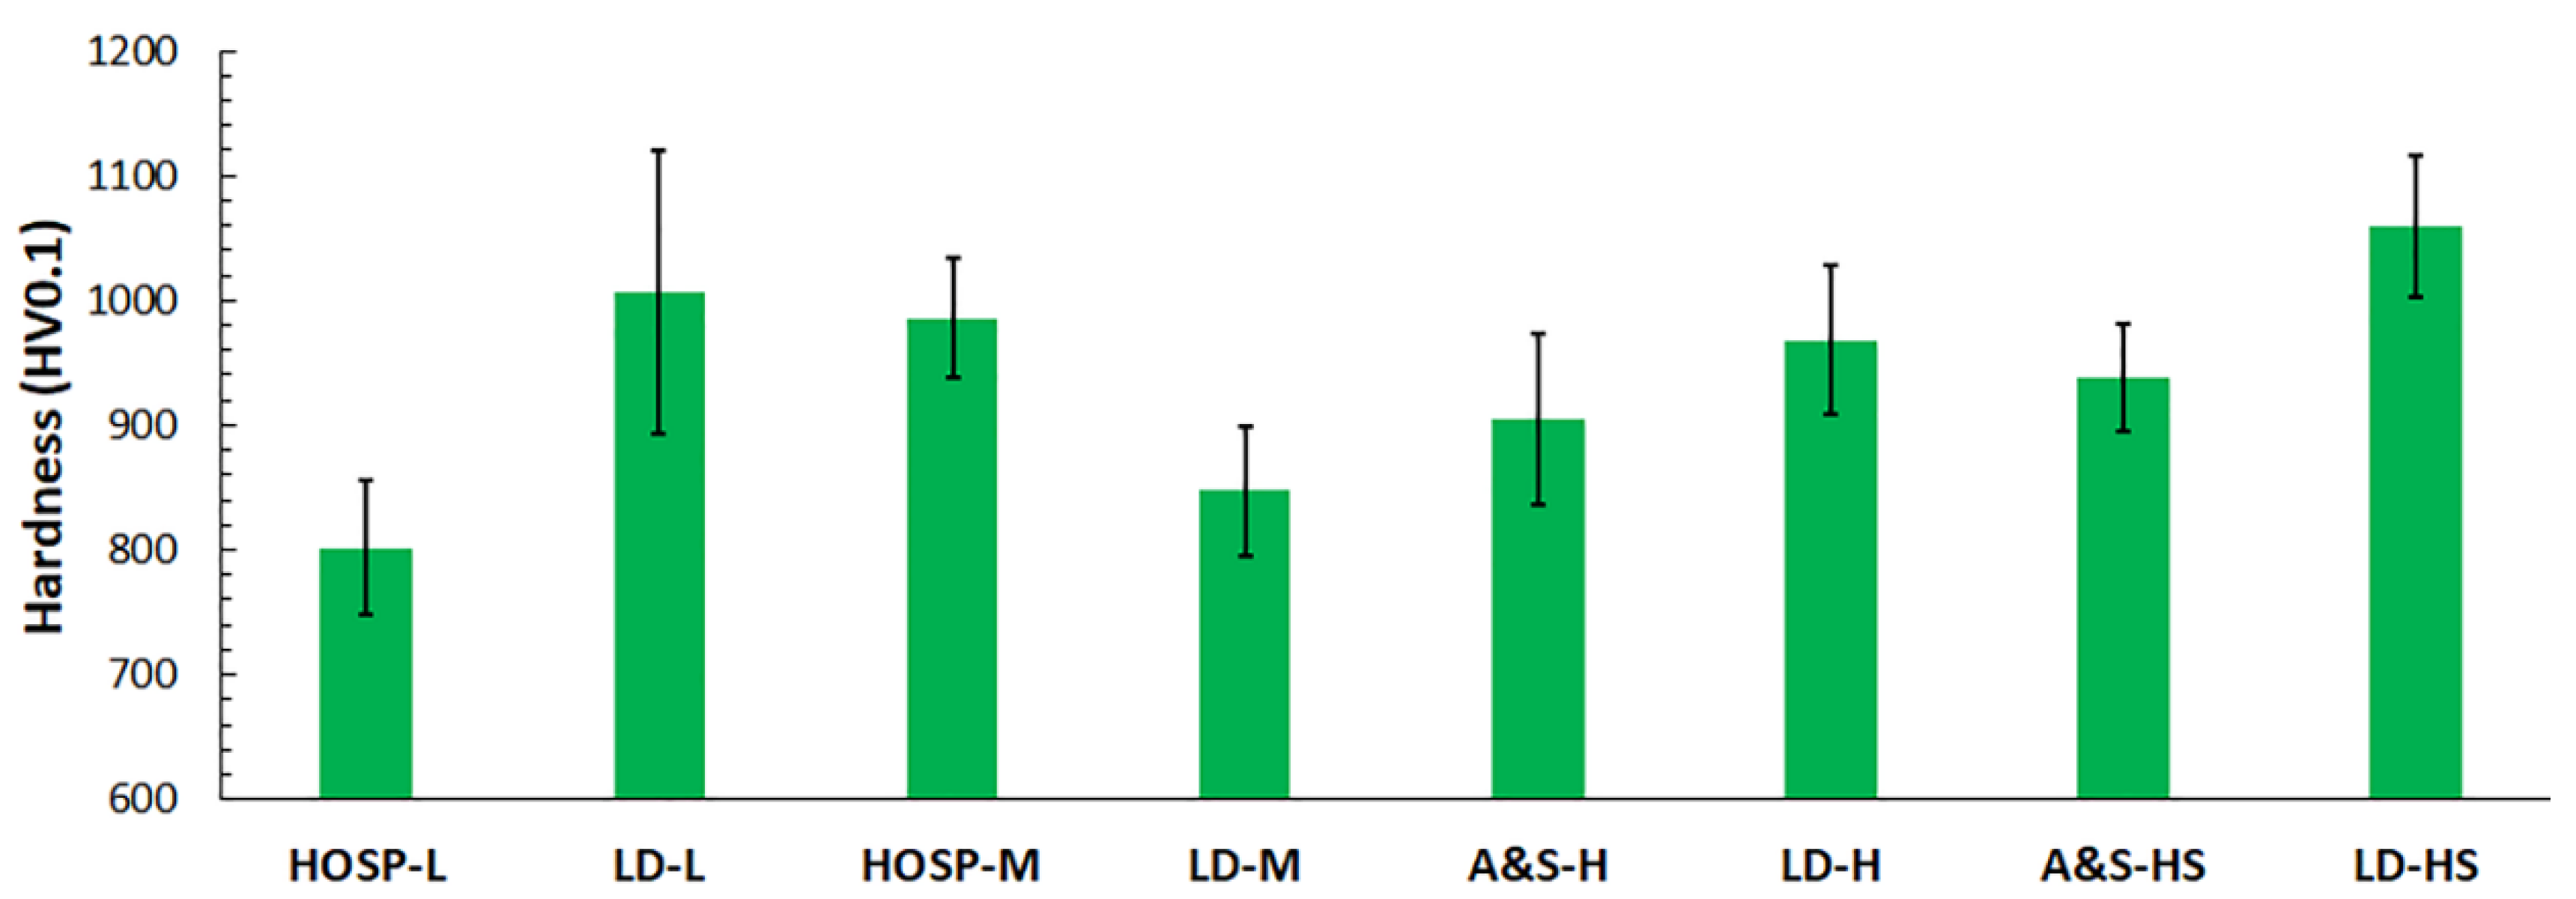
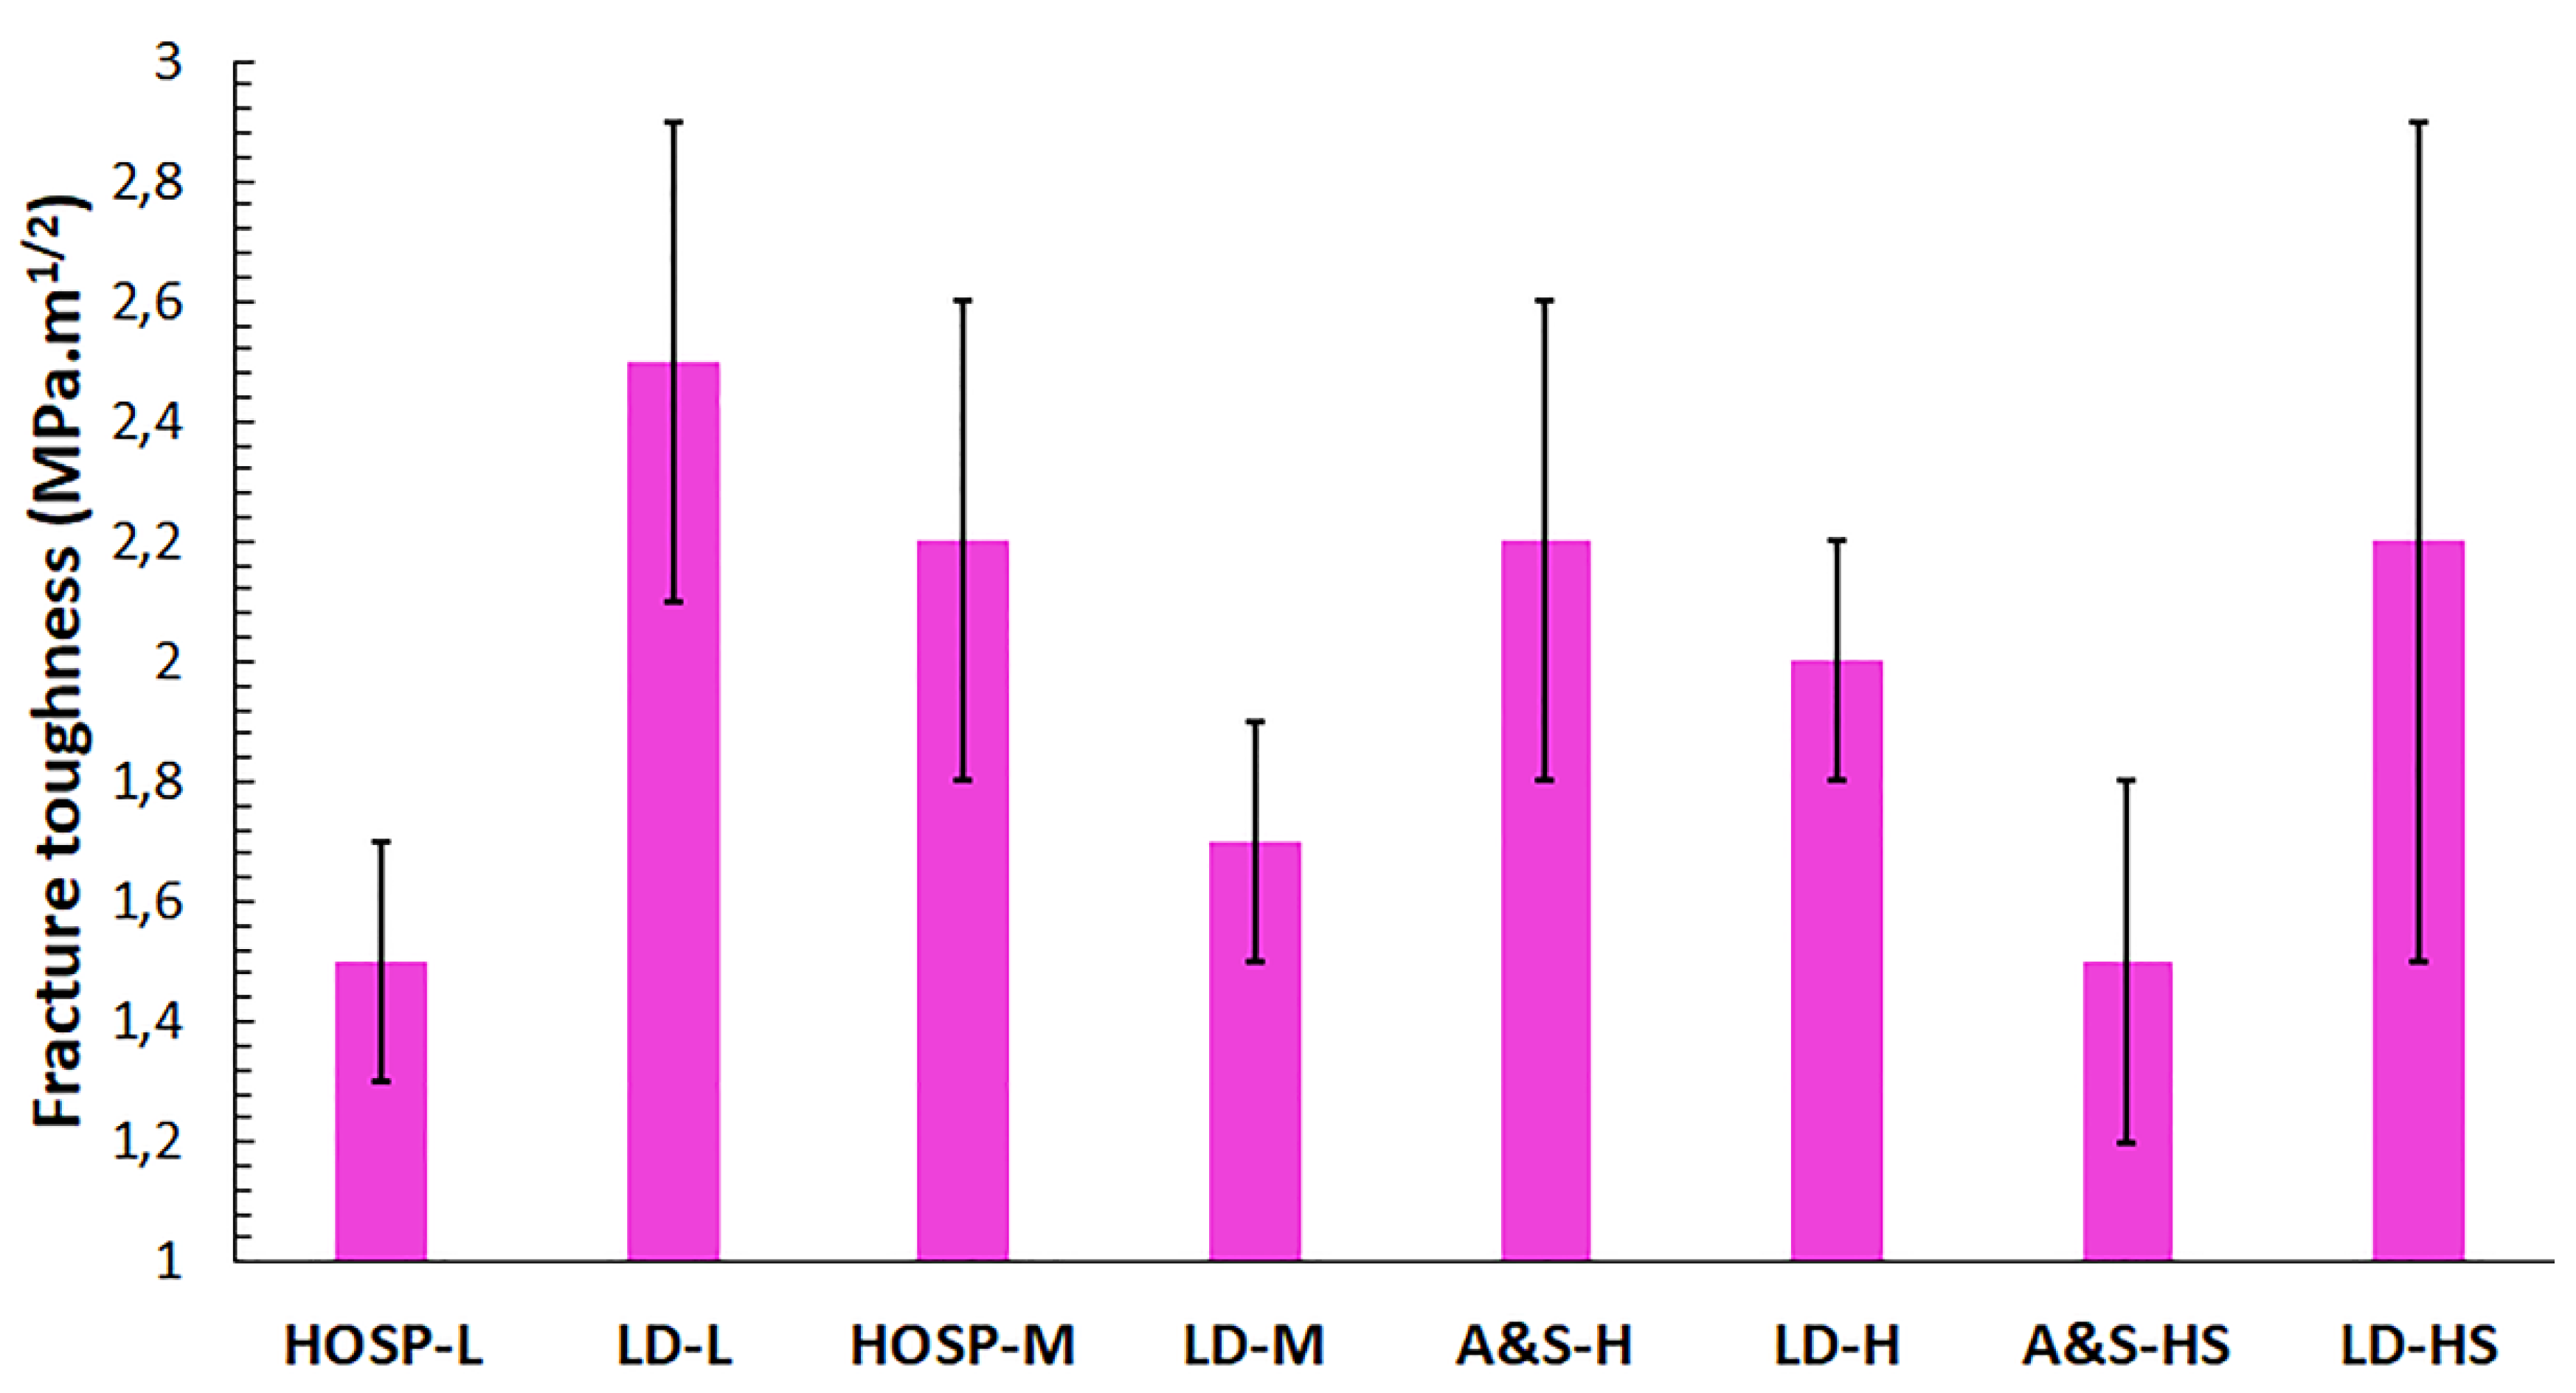
3.4. Hardness and Fracture Toughness

The TBCs exhibited a micro-hardness in the range from 801 (HV0.1) to 1058 (HV0.1) and could be said to be roughly comparable hardness considering the uncertainty in measurement, according to Figure 10. The inhomogeneous distribution of porosity, cracks and other microstructural features, as discussed in the previous section, could have led to higher uncertainty in hardness measurement. It should be mentioned that lower hardness does not necessarily imply inferior erosion resistance [18,39]. On the other hand, fracture toughness was reported to dictate the erosion performance of TBCs [40]. Therefore, fracture toughness measurements were also performed.
The fracture toughness of all the TBCs in Figure 11 also showed high uncertainty in measurement, resulting from the high degree of inhomogeneity in the TBC microstructures. Additionally, the higher porosity A&S-H and LD-H TBCs showed higher fracture toughness than the A&S-H.S TBC, which contradicts the fact that higher porosity in a TBC results in inferior fracture toughness [18]. The fracture toughness results measured using micro-indentation technique in this work did not correlate well with the porosity results, and to most extent showed conflicting results. It could be said that micro-indentation technique is an unreliable technique to evaluate the fracture toughness of porous TBCs. Similar findings related to unreliability of Vickers indentation technique to accurately evaluate fracture toughness of ceramics was reported by Quinn and Bradt [41]. The reason was attributed to its limitation in reporting the overall fracture toughness of the coating, as it rather provides the localized fracture toughness. However, despite its unreliability, several research groups often employ the indentation technique to report fracture toughness of plasma sprayed ceramics [42,43]. Nonetheless, it should be mentioned that the fracture toughness of bulk YSZ was reported to be in excess of 5 MPa.m1/2 when measured using different methods [44]. The fracture toughness values reported in this work are comparable to those reported by Dwivedi et al. using a double torsion test method for YSZ-based TBCs [19].

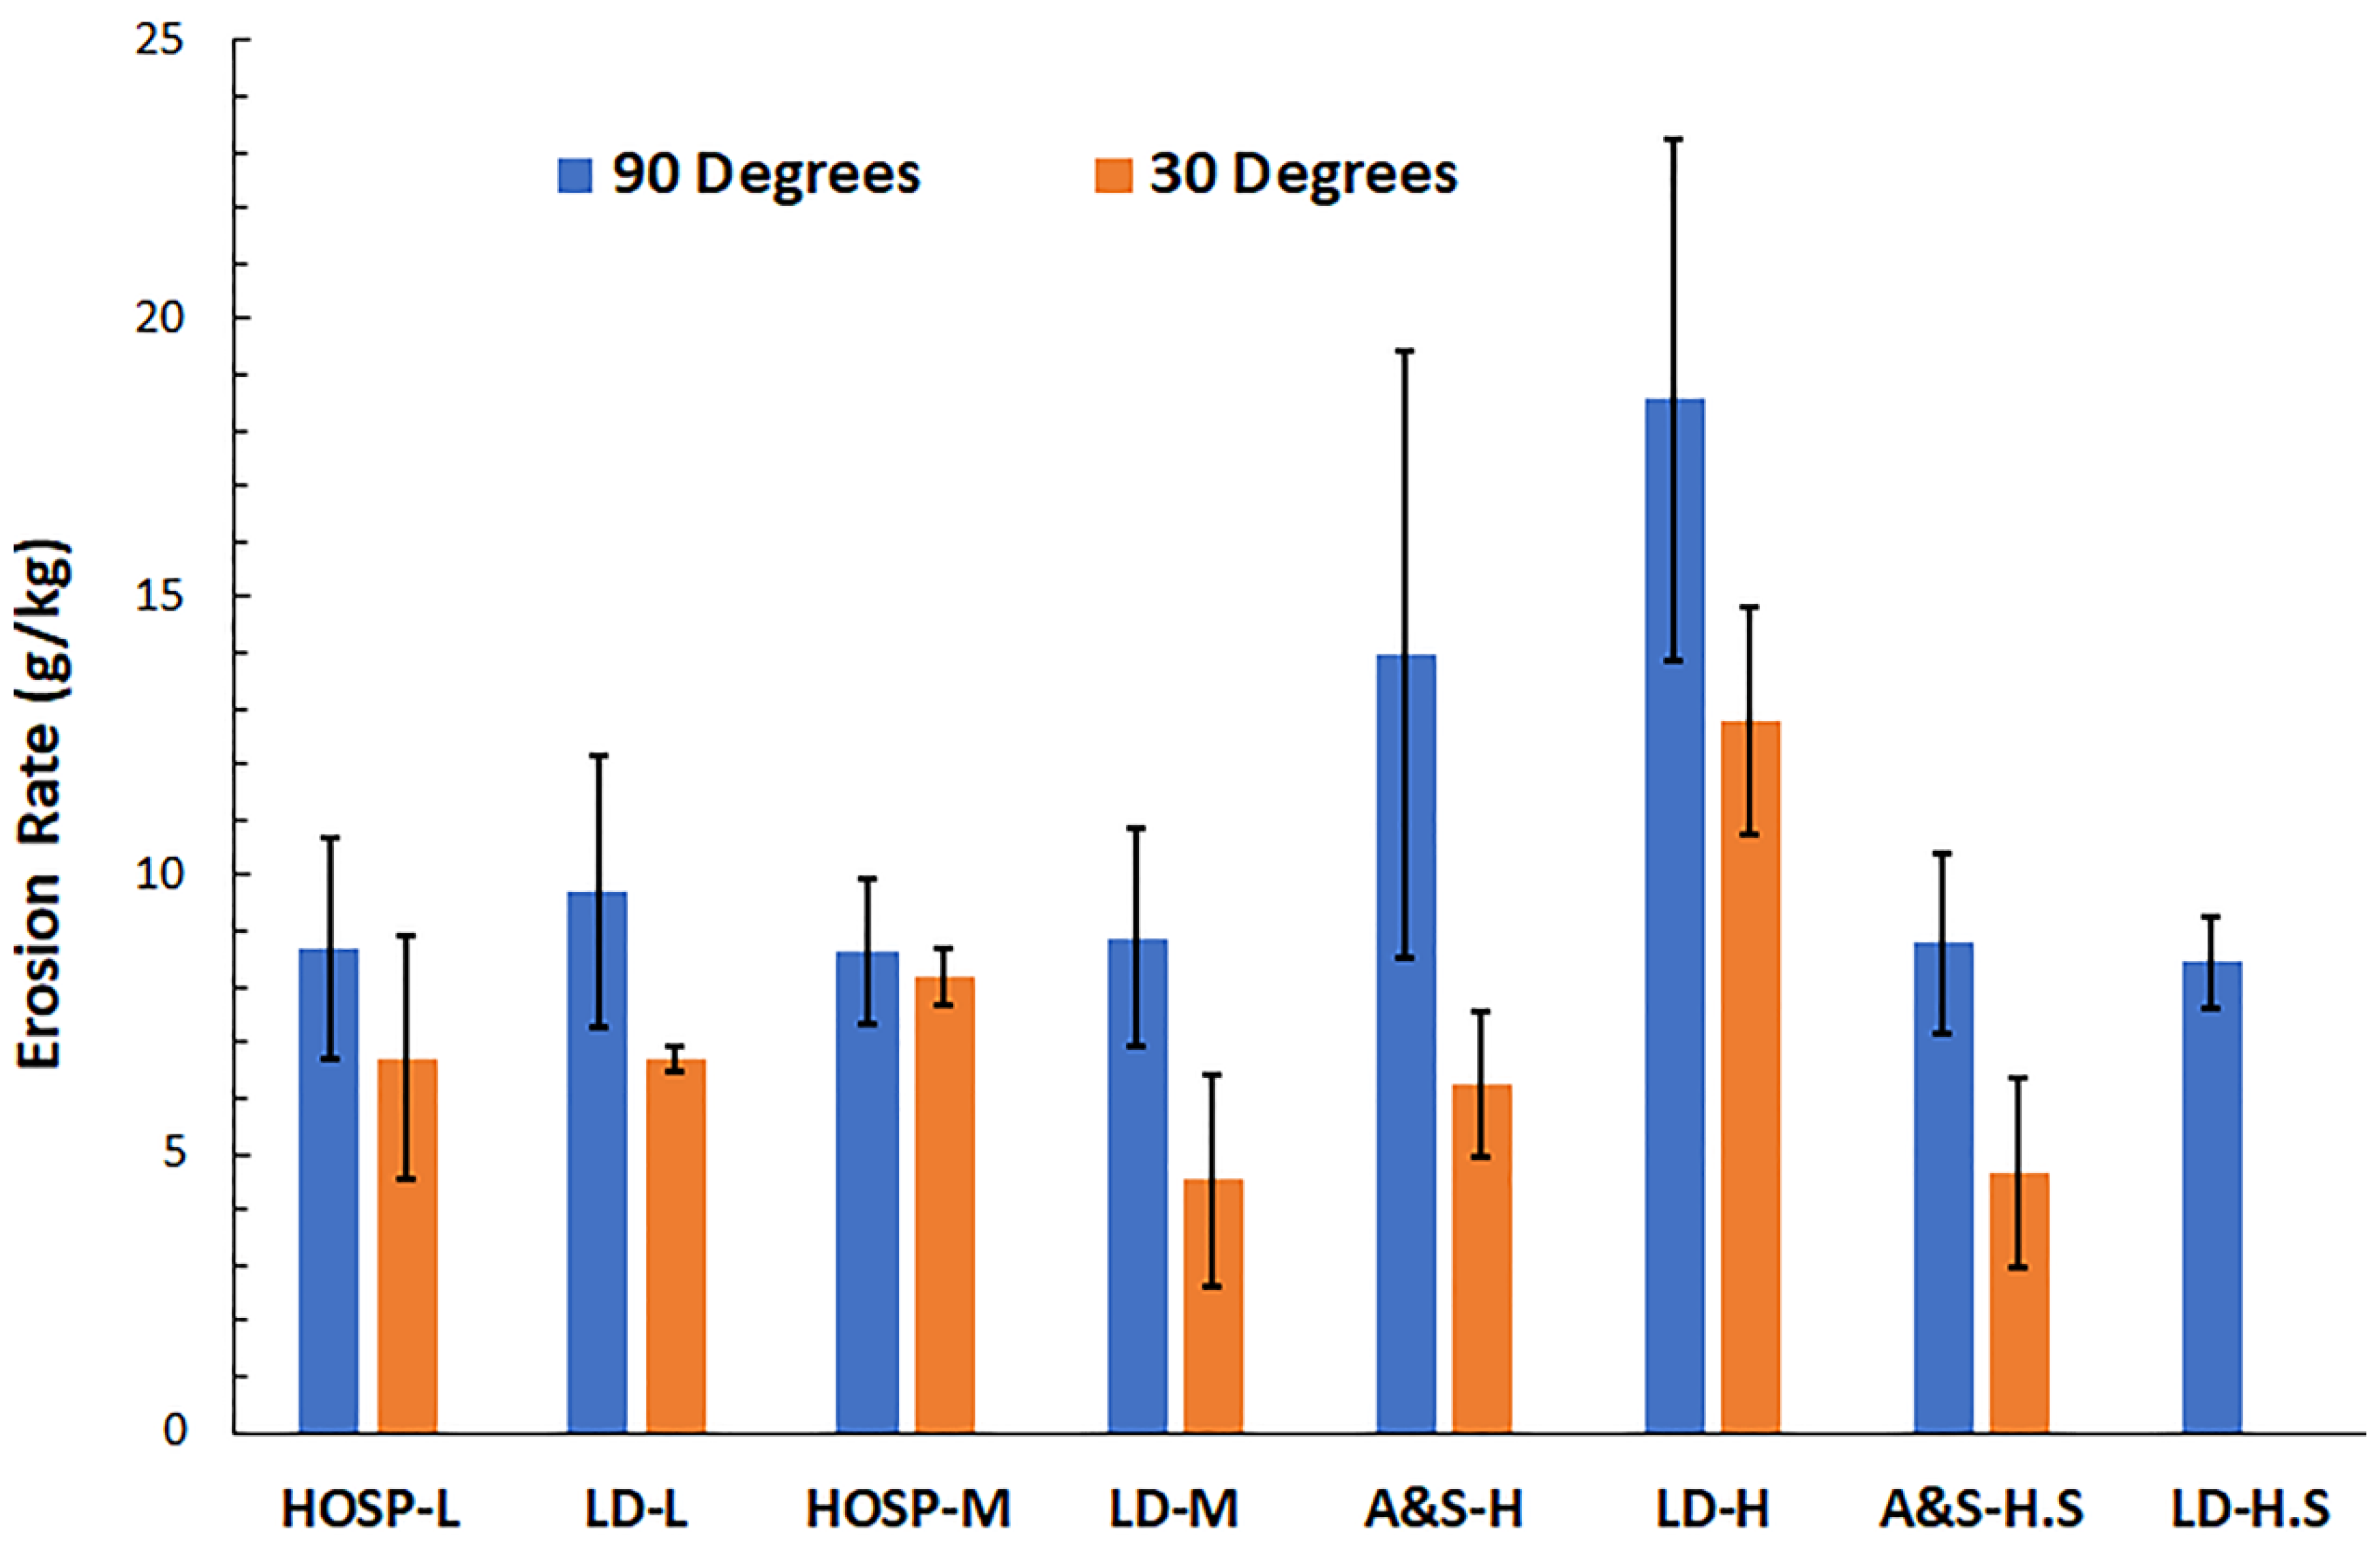
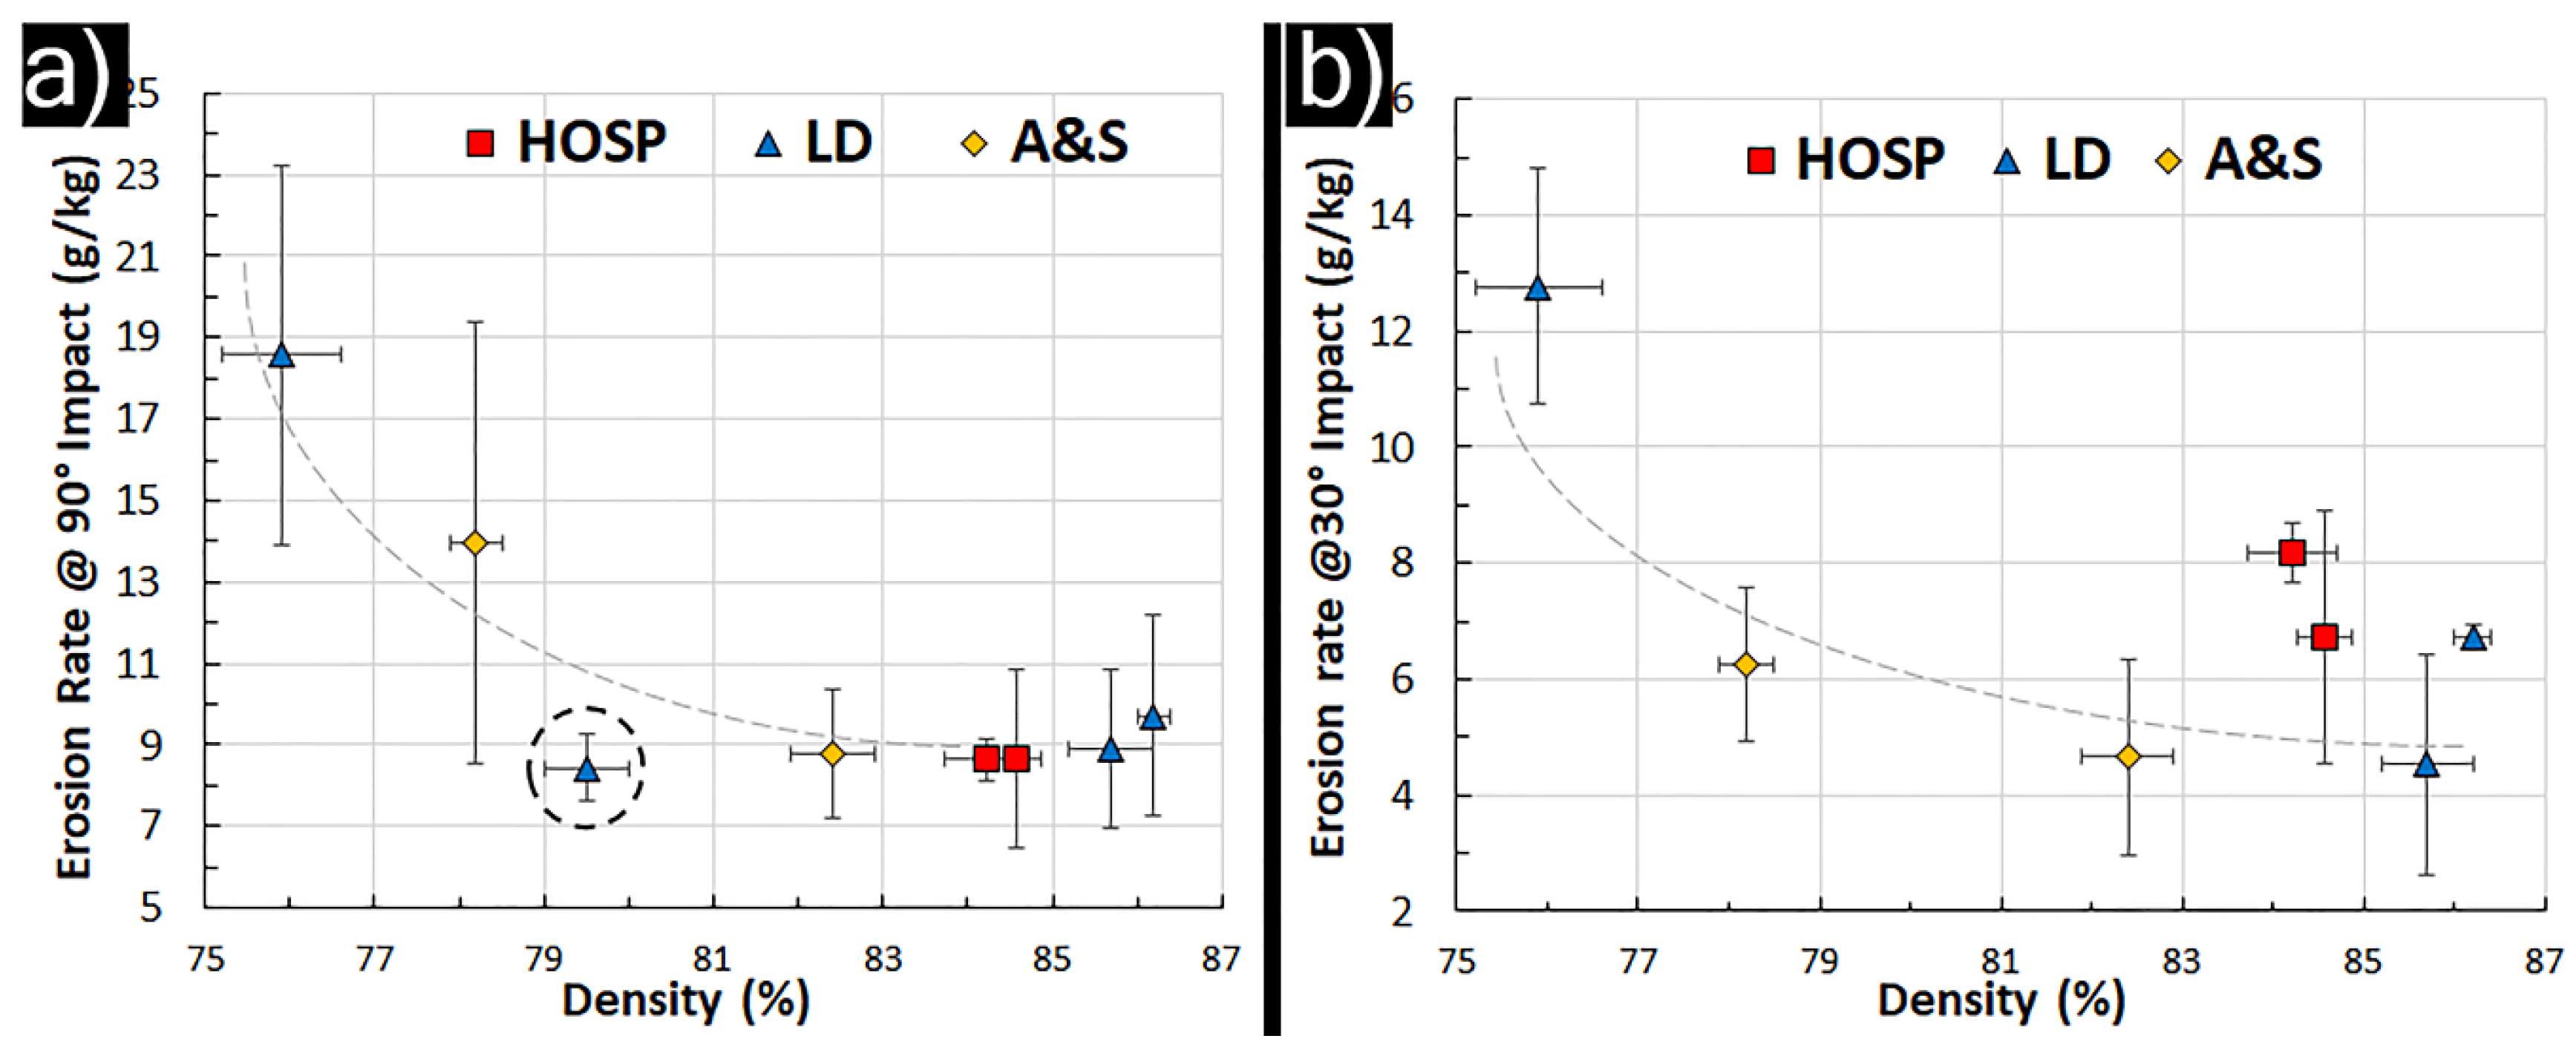
3.5. Erosion Rate at Different Impact Angles

Erosion performance results for 90-degree and 30-degree erodent impact angles are summarized in Figure 12. The erosion rates of all the investigated TBCs at 30 degrees erodent impact angle were lower than 90 degrees erodent impact, indicating the normal erodent impact resulted in the highest kinetic energy transfer and maximum TBC damage. Similar findings were reported by Wellman et al. and Lima et al. where an erodent angle of 90 degrees led to higher erosion rates in EB-PVD and APS processed YSZ TBCs [6,15].
The conventional porosity TBCs display comparatively similar erosion rates at 90-degrees impact angle in the range of 7–12 g/kg. At 30-degrees impact angle, the results are more varied despite the coatings comparable porosity levels. The low feed rate, conventional TBCs HOSP-L and LD-L show the same erosion rate, with a larger scatter in the results for the HOSP coating. When moving to intermediate feeding rate of 150 g/min, there is a divergence in performance where the HOSP-M coating shows increased susceptibility to erosion, whereas the LD-M coating is more resistant to it. This observation may be related to a proposed mechanism by Eaton and Novak [45]. They proposed that higher pore surface area for a given porosity level results in lower coating strength and therefore inferior erosion performance. A similar mechanism was suggested by Li et al. for plasma sprayed alumina where a lower bonding degree between splats reduced coating erosion resistance [20]. In this study, the HOSP derived TBC specimens showed comparable porosity levels and were manufactured with identical plasma conditions. However, the higher feed rate utilized for the HOSP-M coating results in a 18% lower deposition efficiency and powder particles arriving in a relatively cooler state (see Figure 1). It can be considered therefore that this coating could show poorer bonding between deposited splats. The LD-M coating by contrast was manufactured with 5 kW higher input power than the LD-L and only a slight drop in deposition efficiency. According to Figure 1, this results in higher particle temperature and velocity. It is feasible then that such conditions would allow for higher deposition temperatures and better splat bonding. Differences in coating structure may also be seen from the crack/delamination results in Figure 9. In the HOSP coatings the degree of detected near parallel delaminations increases with increased feed rate whereas it decreases for the LD coatings. While a high degree of delaminations near parallel to the bond coat interface would be beneficial for thermal properties, they may act as easy pathways for splat removal in shallow angle erosion exposure.
For the high powder feed rate conditions, the highest erosion rate was observed for high porosity TBCs, LD-H, and A&S-H at 90-degree impact angle. The high feed rate, short stand-off conditions A&S-H.S and L.D-H.S TBCs showed comparable erosion rate to the conventional porosity TBCs. At a 30-degree impact angle, the high porosity A&S (A&S-H) coating demonstrates an erosion resistance comparable to the conventional porosity coatings whereas the high porosity LD coating (LD-H) shows an erosion rate approximately twice as high. When moving to a shorter stand-off, high feeding rate conditions the A&S-H.S TBCs showed the lowest erosion rate, comparable with that of the LD-M. Unfortunately the LD-H.S coating could not be evaluated at 30 degrees impact angle due to the lack of adequate TBC specimens.
For these high porosity (18–24%) coatings, the influence of coating microstructure on the erosion results is more pronounced. The erosion rate results correlate in a greater part to the quantity of irregular porosity within the coatings. The high erosion rate seen in the LD-H coating can be related directly to the coatings high amount of irregular porosity (~21%) that consists of a majority of large zones of fine structured material with low strength and toughness. With such a porous structure as can be observed in Figure 5b, erosion damage propagates quickly regardless of the impact angle. The A&S-H coating, with its slightly lower pore content, performs similarly in the 90-degree exposure but better in the 30-degree test. That the A&S-H performs comparably with the 15% porosity coatings in 30 degree erosion testing despite its higher porosity level may be understood to be related to the lower detected content of cracks or delaminations (see Figure 8 and Figure 9). A reduction in such defects may therefore provide better resistance to the propagation of erosion damage.
The short spray distance coatings (A&S-H.S and LD-H.S) are deposited at significantly hotter particle temperatures and higher velocities, as observed in Figure 1. This promotes a denser structure, as can be seen in Figure 6, with strong bonding between deposited splats. This results in reduced erosion rate when compared to the long standoff coatings.
Findings from this work are in general agreement with literature where APS processed YSZ TBCs with higher porosity content were reported to possess inferior erosion resistance than their denser counterparts [18,45,46]. The erosion test conditions employed in this work such as erodent velocity and erodent feed rate were identical to the erosion results reported by Lima et al. [6]. However, the erodent exit nozzles were not comparable as the previously published literature does not specify the nozzle dimension. Furthermore, the erosion results reported in the past were performed using different in-house standards [47,48] or customized test settings [49,50,51,52], thereby precluding a meaningful comparison of erosion rates across studies.
It is also observed that the erosion performance of all the investigated TBCs at different impingement angles does not correlate well with the fracture toughness and hardness results. This may be explained by the fact that the techniques used here give very local information for the high-density regions within the coating and not a global coating measurement. Erosion performance in the case of the TBCs evaluated here, was shown to be dominated by quantity and type of porosity present. Furthermore, the error in measurement of erosion performance was high, especially for the TBCs with highest porosity content i.e., A&S-H and LD-H. It should be mentioned that the erosion test rig was calibrated prior to testing each specimen. Therefore, the sources of error could be attributed to non-homogeneous microstructural features such as partially unmolten splats.

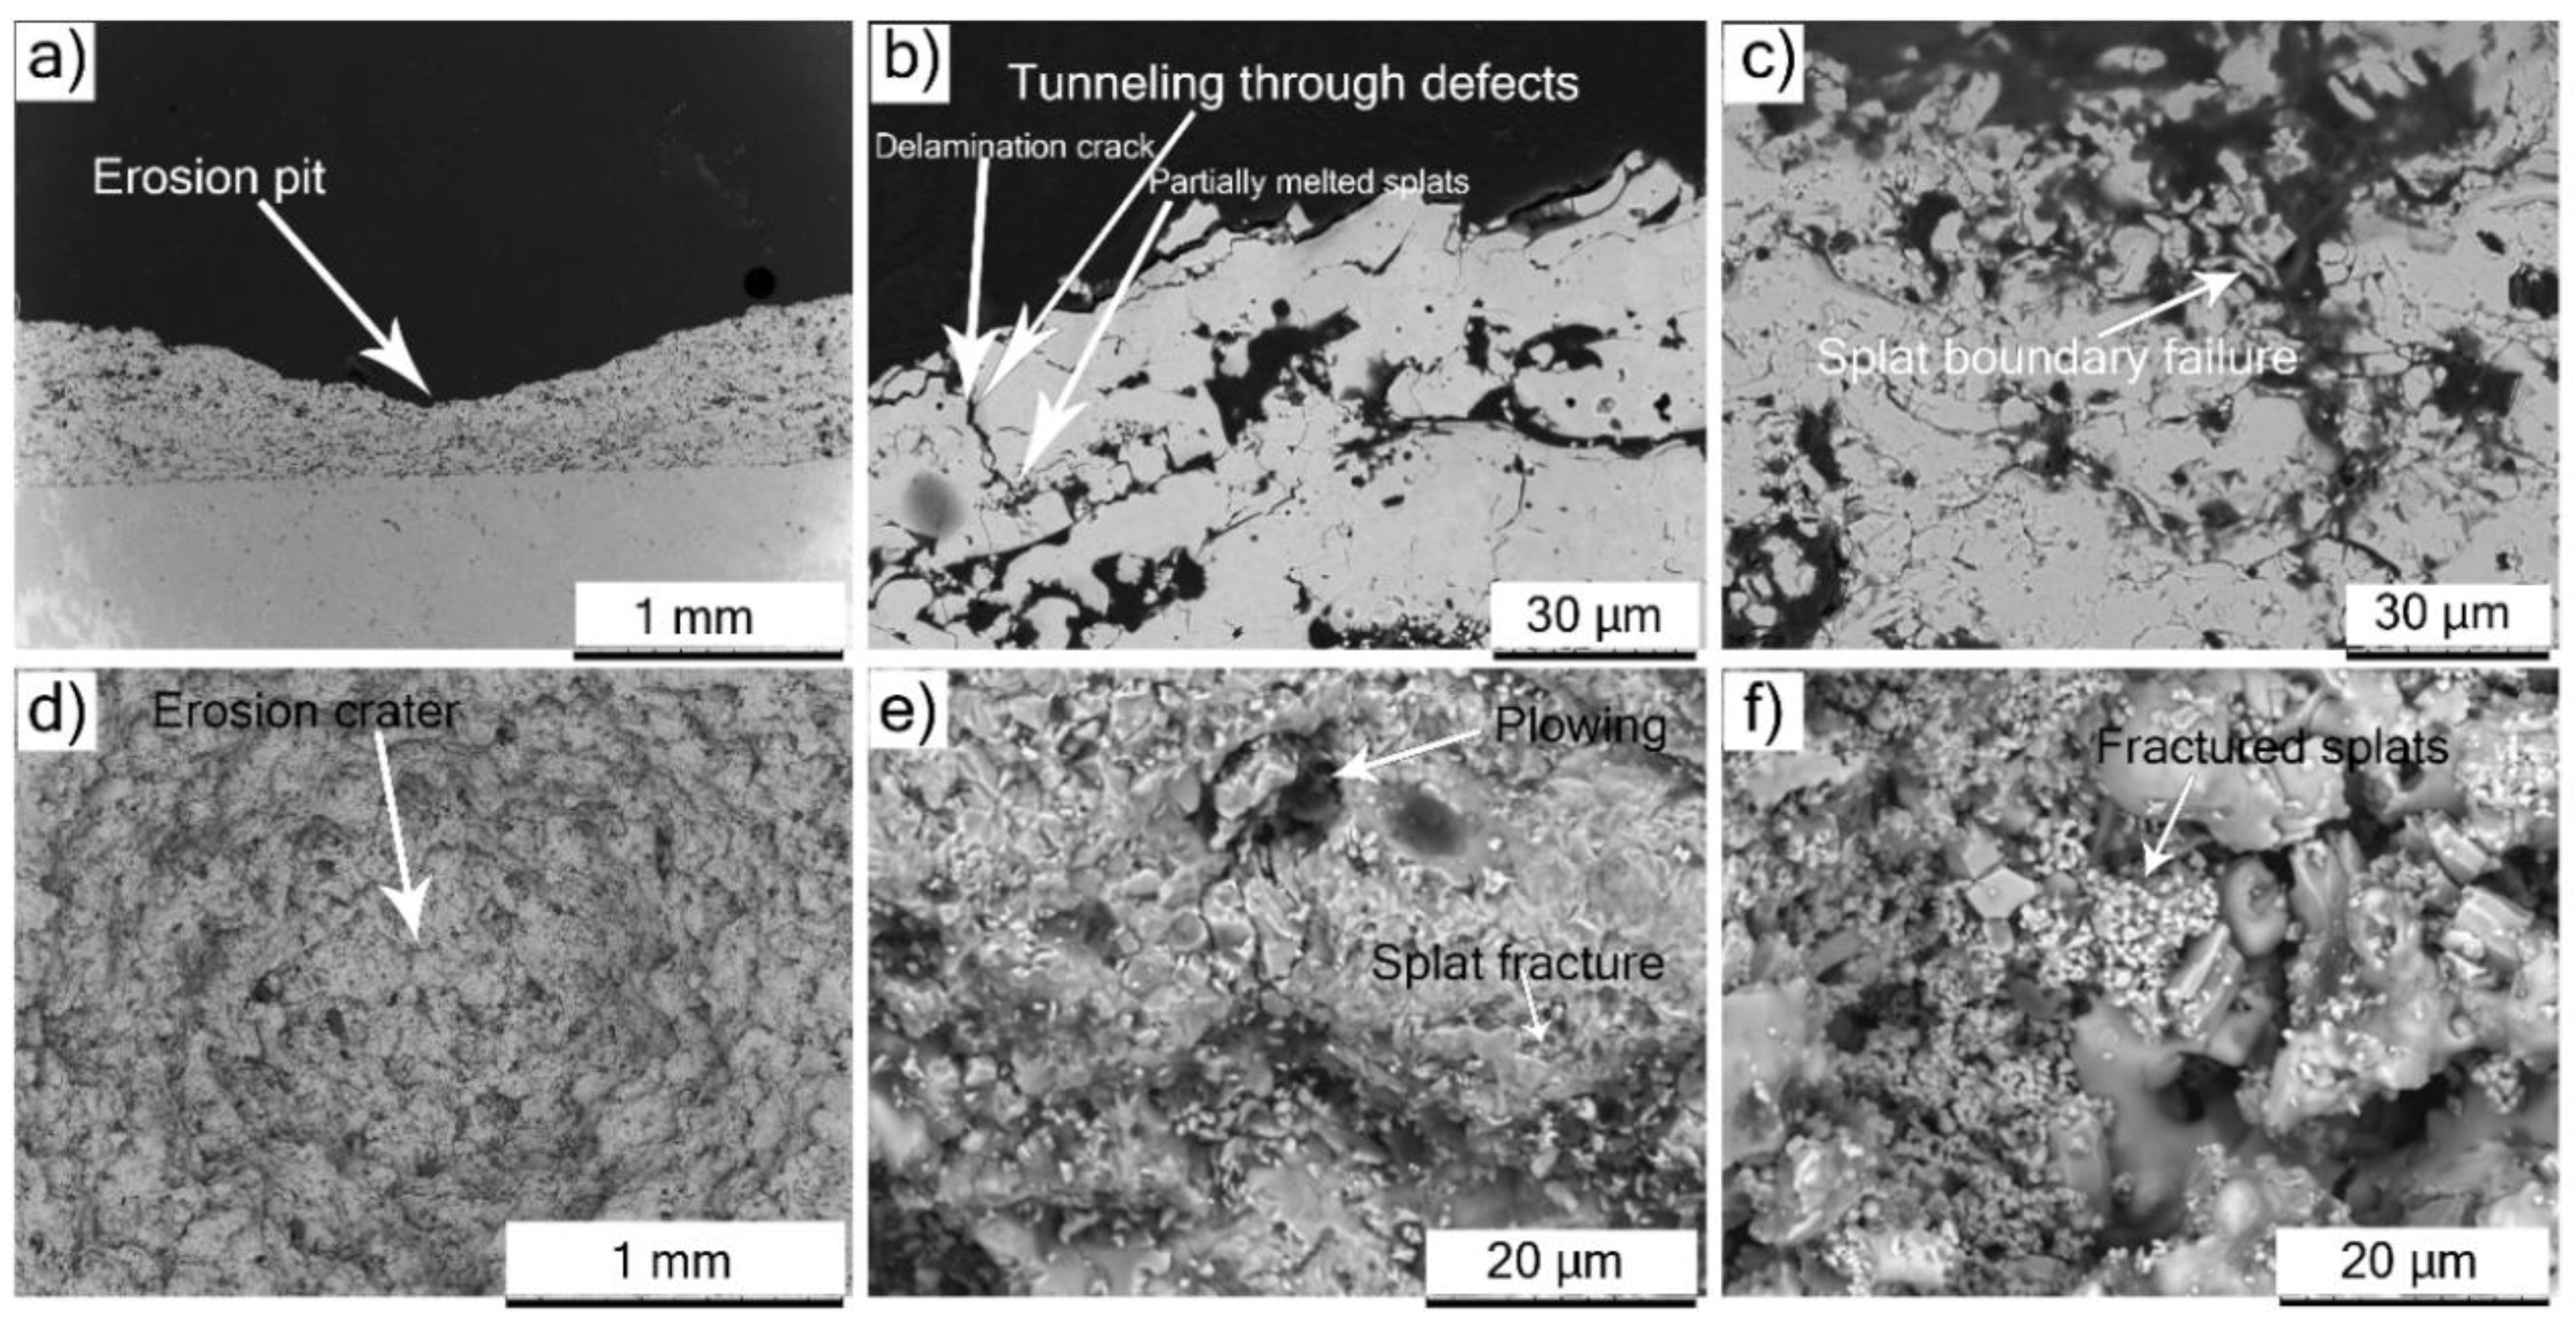
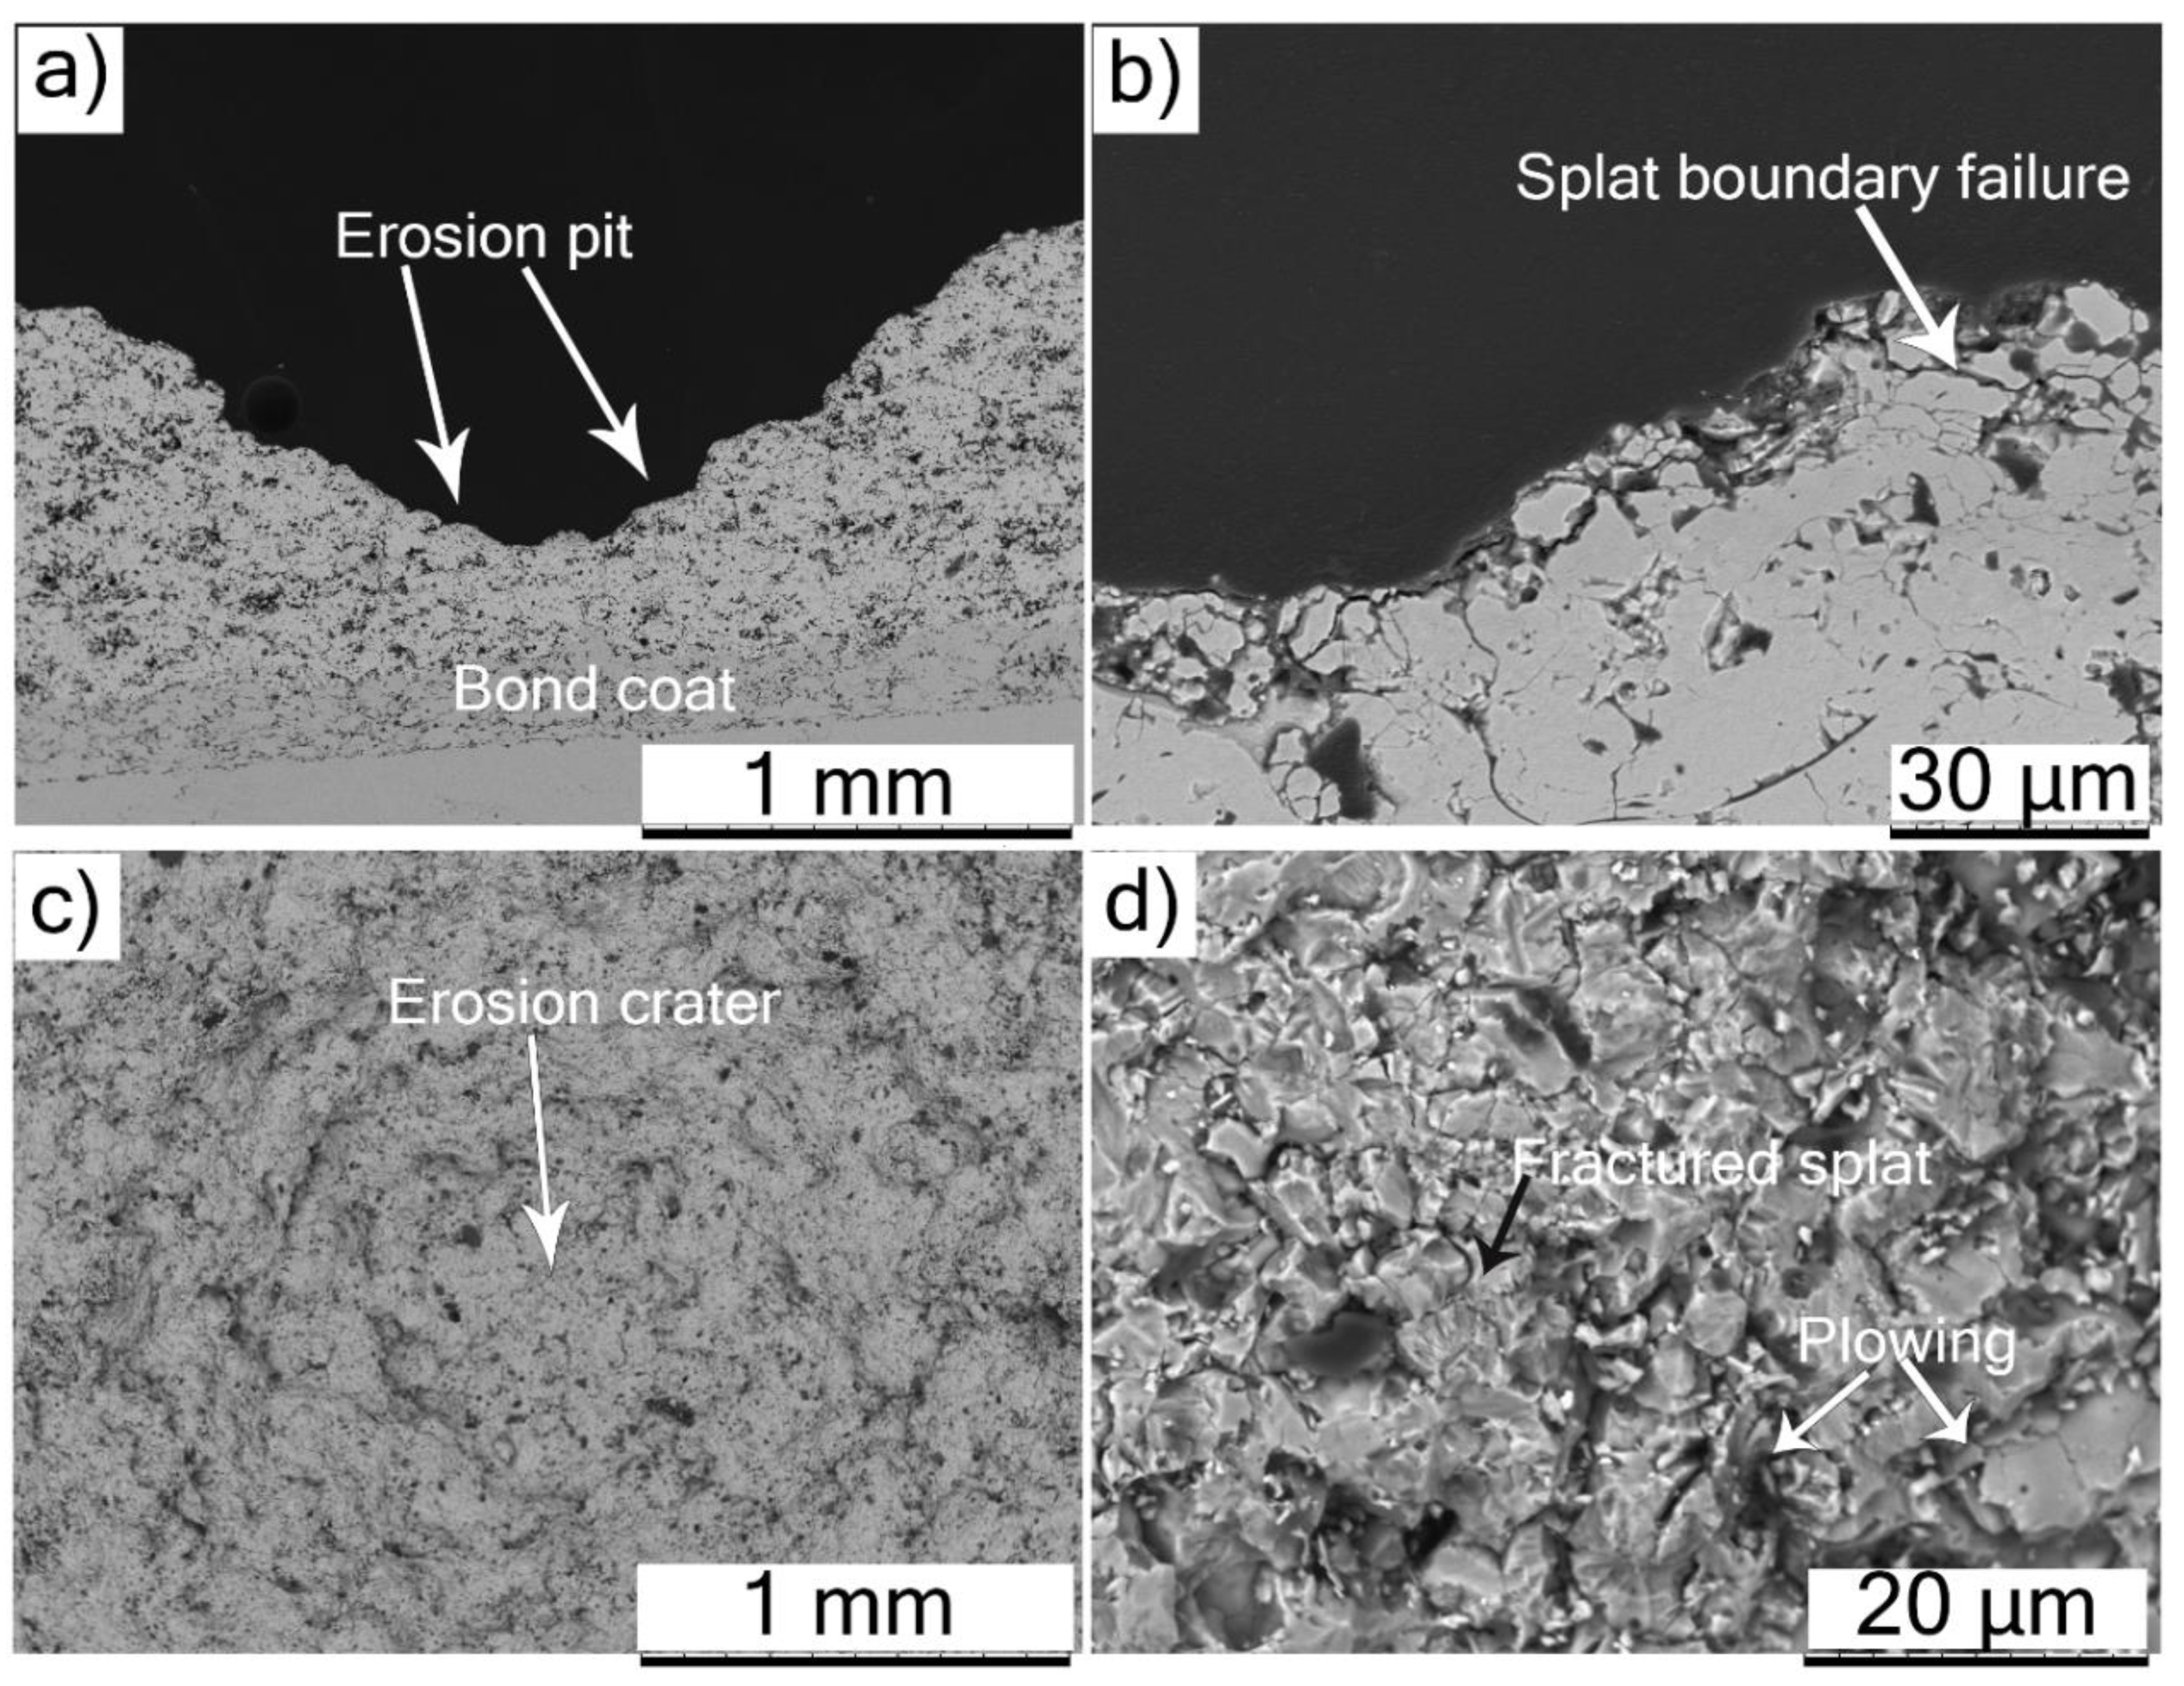
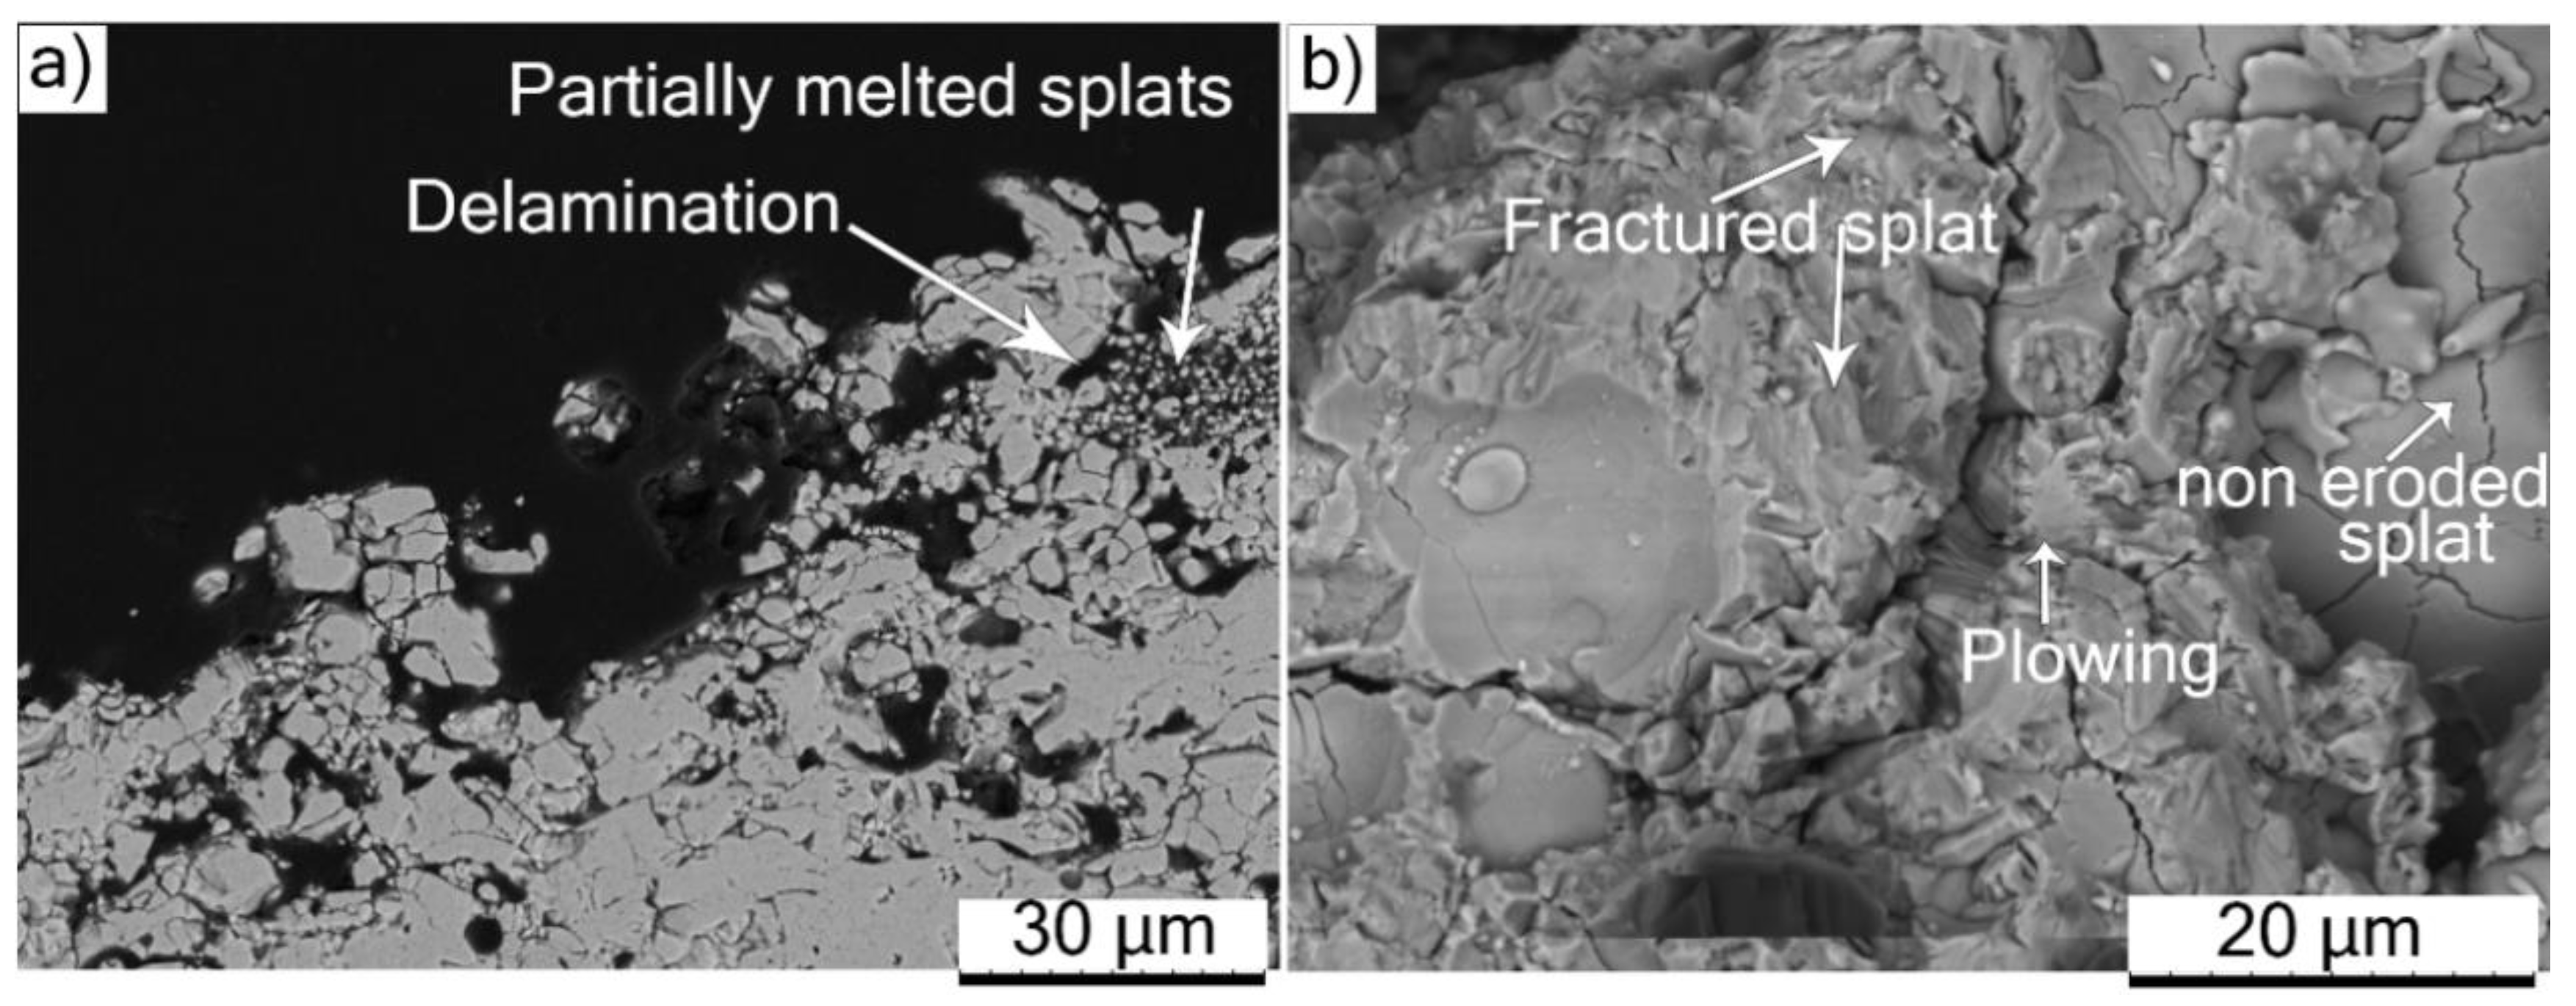
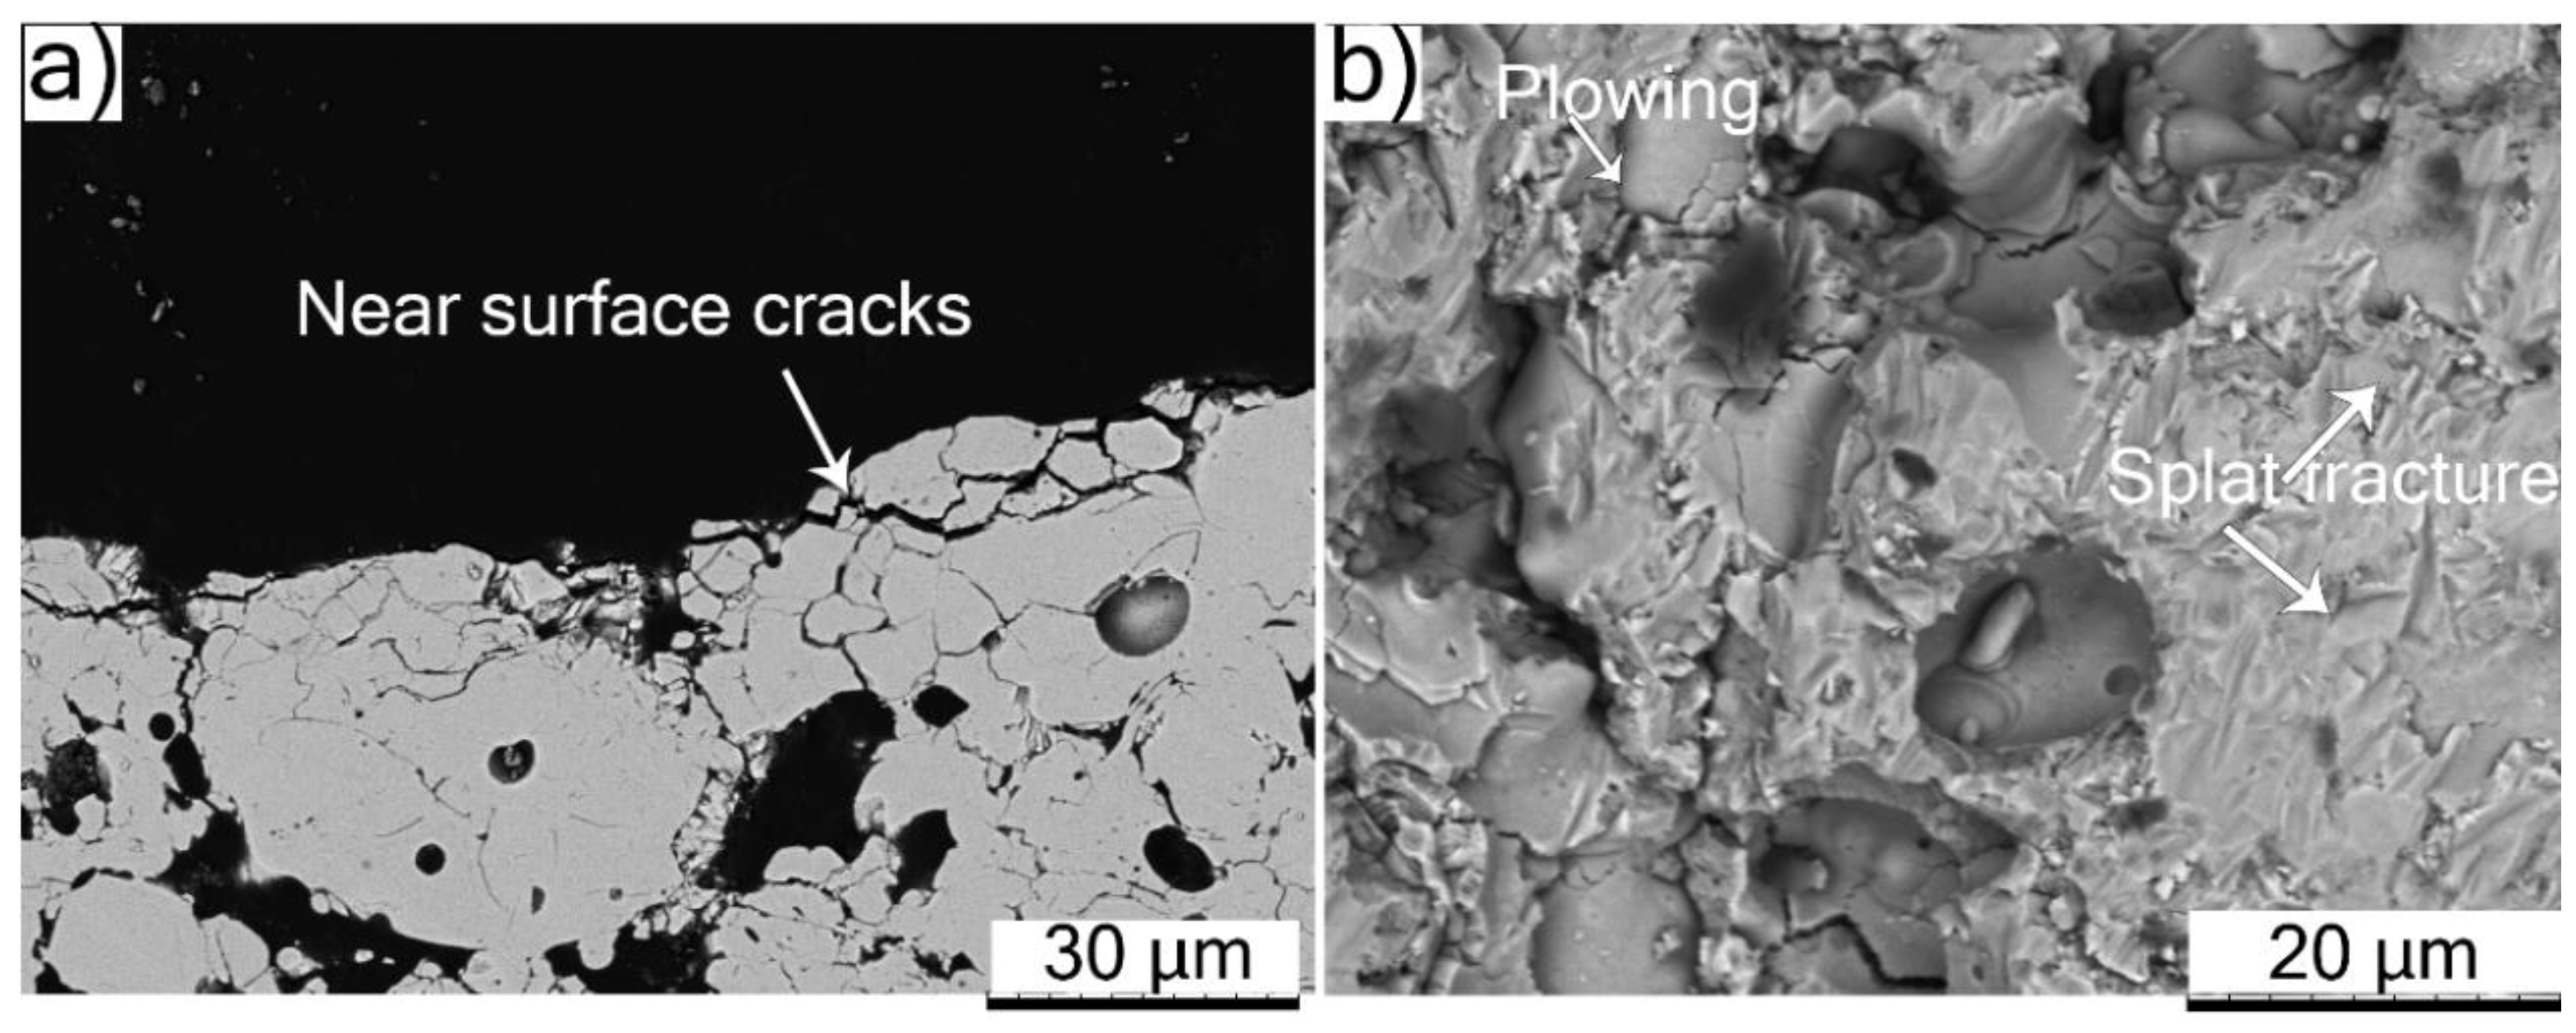
3.6. Post-Erosion Analysis

3.6.1. Erodent Impact at 90 Degrees

Post erosion analysis of LD-H and A&S-H.S was performed to understand the influence of microstructural features on the erosion mechanisms at different erodent impact angles. The low magnification cross-sectional SEM micrograph of LD-H subjected to 90 degrees impact confirmed that the erosion test was restricted to the ceramic top coat and the erosion results were reliable, see Figure 13a. Higher magnification SEM micrographs of the cross section in Figure 13b showed partially melted powder particles, which acted as nucleation sites for delamination cracks during the erodent impact. It seems that the kinetic energy transferred from the erodent to the TBC exceeded the strength within these fine structured zones leading to crack propagation and splat boundary failure in denser areas, maximizing the erosion loss. This type of erosion damage is classified as tunneling via defects, which typically results in maximum material removal [45]. Cross-sectional SEM micrograph from other region in Figure 13c also showed material removal due to splat fracture and splat boundary failure. In the top view SEM micrograph, crater formation due to normal erodent impact could be seen in Figure 13d. The higher magnification top surface SEM micrograph from the eroded region in Figure 13d shows plowing action of the erodent particles, which did not result in material removal. Furthermore, the kinetic energy transferred from the erodent to the TBC surface resulted in splat fracture, according to Figure 13e. The top view SEM micrograph of non-eroded region adjacent to the erosion crater in Figure 13f showed fine erosion debris generated due to splat fracture. Similar erosion mechanisms (plowing, fracture, and tunneling) for APS deposited YSZ TBCs were reported by Eaton et al. [45].
In the case of A&S-H.S, low magnification cross-sectional SEM micrograph in Figure 14a showed erosion damage being restricted within the TBC as the ceramic top coat was still intact at deepest point of the crater. The high magnification SEM micrograph in Figure 14b showed fractured splats and splat boundary failure. However, the splat boundary failure in A&S-H.S was restricted to the near surface region, as tunneling via defects could not be seen. On the other hand, tunneling via defects in LD-H was shown to occur from the partially melted/fully melted region interface, which were approximately 40–50 µm from the TBC surface. The top surface SEM micrograph in Figure 14c showed crater formation. High magnification top surface SEM micrographs in Figure 14d showed plowing action of the erodent particles along with splat fracture. There was no evident tunneling mechanism seen in the case of A&S-H.S TBC due to the lower porosity level and far lower content of partially molten powder particles in the microstructure, which explains its lower erosion rate compared to LD-H.

3.6.2. Erodent Impact at 30 Degrees

The cross section of LD-H in Figure 15a showed near surface splat boundary failure, along with extensively fractured splats. The partially melted powder particles were also clearly visible, although they did not show delamination cracks, as seen in the case of 90 degrees impact. The erodent’s kinetic energy transferred to the TBC surface at low impact angles (30 degrees) does not seem to be adequate to generate such delamination cracks, which could have otherwise resulted in tunneling defects. The top surface SEM micrograph in Figure 15b showed plowing action of the eroding media, along with fractured splats.
The cross-section of A&S-H.S in Figure 16a also showed near surface damage at 30-degree impact angle where the splat boundary failure and splat fracture could be clearly seen. In comparison with Figure 15a, the fracturing within the denser zones is less extensive. The top surface in Figure 16b also showed plowing action of the erodent particles along with splat fracture.
At lower erodent impact angle (30 degrees), the kinetic energy transferred to the TBC surface is lower compared to normal impact. Therefore, in this case, plowing and fracture erosion mechanisms were observed in LD-H and A&S-H.S TBCs and no tunneling defects could be seen. As discussed previously, the denser structure of the A&S-H.S coating allows greater tolerance of particle impact before generating splat fracture.

3.7. Correlating the Erosion Performance to Microstructure

Correlation between erosion rate and coating density is shown in Figure 17a for 90-degree impact and Figure 17b for 30-degree impact. At 90-degrees, the results show a non-linear trend of greatly increasing erosion rate once the coating density drops below 80% (>20% porosity), with the higher density coatings clustered around a similar erosion rate. A similar trend was first reported by Eaton and Novak [45] and later by Janos et al. [46] where the erosion rate jumped dramatically for high porosity coatings. The unusual data point in the set (circled) is for the LD-H.S coating. In this case, the erosion resistance of high porosity TBCs is comparable with the lower porosity coatings. This behavior is potentially due to microstructural features that are more specific to this coating—namely, vertical cracks between porous zones and highly dense surrounding matrix.
At 30-degrees impact angle, the trend is less clear with a greater variance amongst the lower porosity, higher density coatings. As discussed previously, this is due to more specific differences in coating structure (delamination content and splat bonding) influencing the erosion rate and not just density (porosity content).

4. Conclusions

In this work, several standard type TBCs using commercial and experimental spray powders were deposited with varying porosity levels. The processing conditions and their influence on the TBC microstructure was examined qualitatively. Furthermore, the microstructural features such irregular porosity, cracks/delaminations, inclination of cracks to the substrate etc. and the mechanical properties were quantified. The as-deposited TBCs were subjected to erosion tests at 90° and 30° erodent impact angles and their performance and damage mechanisms were investigated.
There was no correlation between localized micro-hardness or fracture toughness with erosion resistance in this study. This is more due to the results not representing the global coating behavior. While high local hardness and toughness may resist crack propagation from erosive impact damage; the low fracture toughness zones, delaminations, and cracks within the microstructure dominate its erosion performance.
There was an overall observed decrease in erosion resistance with increasing porosity content of the TBC coatings. This becomes particularly acute once the porosity exceeds 20%. This correlates with published work from other researchers. This can be understood from the increased level of irregular porosity and in some cases, partially melted powder particles that compromise the strength of the coating, allowing for easy crack propagation due to erosive impact damage.
At shallow impact angles, a divergence in erosion performance suggests that coatings with similar porosity levels, may demonstrate greater low angle erosion resistance if there is a higher degree of splat bonding caused by hot and fast particle deposition conditions. This presents an area that has not been explored in research to date and could offer another area for optimizing coating performance in erosion rather than changing porosity level.
Moving from a conventional ~15% porous TBC to a high porosity (>20%) TBC to increase the thermal insulation properties of the coating leads to a trade-off in erosion resistance. While these high porosity coatings are commonly utilized on components where erosion is not a major concern; it demonstrates why they could not replace a conventional TBC in all application areas.
Optimization of a thermal barrier coating to best resist erosion damage appears to first require lower porosity levels and secondly a ceramic matrix with fewer cracks and delaminations, especially parallel to the coating surface. There is a question if a hybrid structure, incorporating fine porosity zones, dense ceramic and some degree of segmentation cracking (as in the LD-H.S coating) would allow a good performance in erosion to be achieved while still being able to have low thermal conductivity. Thermal conductivity and thermal cycling behavior evaluation of these TBCs is ongoing. These results would further strengthen the understanding on the influence of diverse porosity content TBCs on functional performance (erosion, thermal conductivity, thermal cycling).

Author Contributions

Conceptualization, N.C. and M.L.; methodology, N.C., S.M. and S.J.; validation, N.C., S.M., S.J. and A.V.; formal analysis, A.V., S.M. and N.C.; investigation, S.M., A.V., N.C. and S.J.; resources, N.C. and S.J.; data curation, S.M., N.C. and A.V.; writing—original draft preparation, S.M. and N.C.; writing—review and editing, S.M., N.C. and S.J.; visualization, N.C. and S.J., supervision, N.C. and S.J., project administration, N.C. and S.J.; funding acquisition, S.J. All authors have read and agreed to the published version of the manuscript.

Funding

This research received funding from Energimyndigheten, Sweden, for Project NUCOP (Dnr. 2018-003191, Project nr. P46393-1).

Institutional Review Board Statement

Not applicable.

Informed Consent Statement

Not applicable.

Data Availability Statement

The data is not publicly available as it is part of an ongoing investigation.

Acknowledgments

The authors would like to thank Adwait Jahagirdar, University West, Sweden, for his help with the metallographic preparation of the specimens. Thanks to Karl Körner for his assistance when manufacturing the coating samples.

Conflicts of Interest

The authors declare no conflict of interest.

References

  1. Miller, R. Thermal barrier coatings for aircraft engines: History and directions. J. Spray Technol. 1997, 6, 35–42. [Google Scholar] [CrossRef] [Green Version]
  2. Mahade, S.; Jonnalagadda, K.; Curry, N.; Li, X.; Björklund, S.; Markocsan, N.; Nylén, P.; Peng, R. Engineered architectures of gadolinium zirconate based thermal barrier coatings subjected to hot corrosion test. Surf. Coat. Technol. 2017, 328, 361–370. [Google Scholar] [CrossRef]
  3. Drexler, J.; Shinoda, K.; Ortiz, A.; Li, D.; Vasiliev, A.; Gledhill, A.; Sampath, S.; Padture, N. Air-plasma-sprayed thermal barrier coatings that are resistant to high-temperature attack by glassy deposits. Acta Mater. 2010, 58, 6835–6844. [Google Scholar] [CrossRef]
  4. Bakan, E.; Mack, D.; Mauer, G.; Vaßen, R. Gadolinium Zirconate/YSZ Thermal Barrier Coatings: Plasma Spraying, Microstructure, and Thermal Cycling Behavior. J. Am. Ceram. Soc. 2014, 97, 4045–4051. [Google Scholar] [CrossRef]
  5. Cheng, B.; Zhang, Y.; Yang, N.; Zhang, M.; Chen, L.; Yang, G.; Li, C.; Li, C. Sintering-induced delamination of thermal barrier coatings by gradient thermal cyclic test. J. Am. Ceram. Soc. 2017, 100, 1820–1830. [Google Scholar] [CrossRef]
  6. Lima, R.; Guerreiro, B.; Aghasibeig, M. Microstructural Characterization and Room-Temperature Erosion Behavior of As-Deposited SPS, EB-PVD and APS YSZ-Based TBCs. J. Therm. Spray Technol. 2018, 28, 223–232. [Google Scholar] [CrossRef]
  7. Mahade, S.; Ruelle, C.; Curry, N.; Holmberg, J.; Björklund, S.; Markocsan, N.; Nylén, P. Understanding the effect of material composition and microstructural design on the erosion behavior of plasma sprayed thermal barrier coatings. Appl. Surf. Sci. 2019, 488, 170–184. [Google Scholar] [CrossRef]
  8. Brandon, J.; Taylor, R. Phase stability of zirconia-based thermal barrier coatings part I. Zirconia-yttria alloys. Surf. Coat. Technol. 1991, 46, 75–90. [Google Scholar] [CrossRef]
  9. Vaßen, R.; Jarligo, M.; Steinke, T.; Mack, D.; Stöver, D. Overview on advanced thermal barrier coatings. Surf. Coat. Technol. 2010, 205, 938–942. [Google Scholar] [CrossRef]
  10. Mauer, G.; Jarligo, M.; Mack, D.; Vaßen, R. Plasma-sprayed thermal barrier coatings: New materials, processing issues, and solutions. J. Therm. Spray Technol. 2013, 22, 646–658. [Google Scholar] [CrossRef]
  11. Vaßen, R.; Traeger, F.; Stöver, D. New thermal barrier coatings based on Pyrochlore/YSZ double-layer systems. Int. J. Appl. Ceram. Technol. 2005, 1, 351–361. [Google Scholar] [CrossRef]
  12. Fauchais, P.; Montavon, G.; Bertrand, G. From powders to thermally sprayed coatings. J. Therm. Spray Technol. 2009, 19, 56–80. [Google Scholar] [CrossRef] [Green Version]
  13. Tejero-Martin, D.; Rezvani Rad, M.; McDonald, A.; Hussain, T. Beyond traditional coatings: A review on thermal-sprayed functional and smart coatings. J. Therm. Spray Technol. 2019, 28, 598–644. [Google Scholar] [CrossRef] [Green Version]
  14. Nicholls, J.; Deakin, M.; Rickerby, D. A comparison between the erosion behaviour of thermal spray and electron beam physical vapour deposition thermal barrier coatings. Wear 1999, 233–235, 352–361. [Google Scholar] [CrossRef]
  15. Wellman, R.; Nicholls, J. A review of the erosion of thermal barrier coatings. J. Phys. D Appl. Phys. 2007, 40, R293–R305. [Google Scholar] [CrossRef]
  16. Cernuschi, F.; Lorenzoni, L.; Capelli, S.; Guardamagna, C.; Karger, M.; Vaßen, R.; von Niessen, K.; Markocsan, N.; Menuey, J.; Giolli, C. Solid particle erosion of thermal spray and physical vapour deposition thermal barrier coatings. Wear 2011, 271, 2909–2918. [Google Scholar] [CrossRef]
  17. Pawlowski, L. Finely grained nanometric and submicrometric coatings by thermal spraying: A review. Surf. Coat. Technol. 2008, 202, 4318–4328. [Google Scholar] [CrossRef]
  18. Ramachandran, C.; Balasubramanian, V.; Ananthapadmanabhan, P. Erosion of atmospheric plasma sprayed rare earth oxide coatings under air suspended corundum particles. Ceram. Int. 2013, 39, 649–672. [Google Scholar] [CrossRef]
  19. Dwivedi, G.; Viswanathan, V.; Sampath, S.; Shyam, A.; Lara-Curzio, E. Fracture Toughness of Plasma-Sprayed Thermal Barrier Ceramics: Influence of Processing, Microstructure, and Thermal Aging. J. Am. Ceram. Soc. 2014, 97, 2736–2744. [Google Scholar] [CrossRef]
  20. Li, C.; Yang, G.; Ohmori, A. Relationship between particle erosion and lamellar microstructure for plasma-sprayed alumina coatings. Wear 2006, 260, 1166–1172. [Google Scholar] [CrossRef]
  21. Nicholls, J.; Lawson, K.; Johnstone, A.; Rickerby, D. Methods to reduce the thermal conductivity of EB-PVD TBCs. Surf. Coat. Technol. 2002, 151–152, 383–391. [Google Scholar] [CrossRef] [Green Version]
  22. Wang, D.S.; Tian, Z.J.; Yang, B.; Shen, L.D. Preparation and solid particle erosion behaviors of plasma-sprayed and laser-remelted ZrO2-7wt.% Y2O3 thermal barrier coatings. In Applied Mechanics and Materials; Wu, J., Xie, H., Eds.; Trans Tech Publications Ltd.: Stafa-Zurich, Switzerland, 2012; Volume 159, pp. 191–197. [Google Scholar]
  23. Ghasemi, R.; Shoja-Razavi, R.; Mozafarinia, R.; Jamali, H. Laser glazing of plasma-sprayed nanostructured yttria stabilized zirconia thermal barrier coatings. Ceram. Int. 2013, 39, 9483–9490. [Google Scholar] [CrossRef]
  24. Ahmaniemi, S.; Vuoristo, P.; Mäntylä, T. Mechanical and elastic properties of modified thick thermal barrier coatings. Mater. Sci. Eng. A 2004, 366, 175–182. [Google Scholar] [CrossRef]
  25. Tsai, P.; Lee, J.; Chang, C. Improving the erosion resistance of plasma-sprayed zirconia thermal barrier coatings by laser glazing. Surf. Coat. Technol. 2007, 202, 719–724. [Google Scholar] [CrossRef]
  26. Planques, P.; Vidal, V.; Lours, P.; Proton, V.; Crabos, F.; Huez, J.; Viguier, B. Mechanical and thermo-physical properties of plasma-sprayed thermal barrier coatings: A literature survey. Oxid. Met. 2017, 88, 133–143. [Google Scholar] [CrossRef] [Green Version]
  27. Guo, H.; Kuroda, S.; Murakami, H. Microstructures and properties of plasma-sprayed segmented thermal barrier coatings. J. Am. Ceram. Soc. 2006, 89, 1432–1439. [Google Scholar] [CrossRef]
  28. Lima, R. Perspectives on thermal gradients in porous ZrO2-7–8 wt.% Y2O3 (YSZ) thermal barrier coatings (TBCs) manufactured by air plasma spray (APS). Coatings 2020, 10, 812. [Google Scholar] [CrossRef]
  29. Boissonnet, G.; Bonnet, G.; Pasquet, A.; Bourhila, N.; Pedraza, F. Evolution of thermal insulation of plasma-sprayed thermal barrier coating systems with exposure to high temperature. J. Eur. Ceram. Soc. 2019, 39, 2111–2121. [Google Scholar] [CrossRef]
  30. Smith, J.; Scheibel, J.; Classen, D.; Paschke, S.; Elbel, S.; Fick, K.; Carlson, D. Thermal barrier coating validation testing for industrial gas turbine combustion hardware. J. Eng. Gas Turbines Power 2015, 138. [Google Scholar] [CrossRef]
  31. Scrivani, A.; Rizzi, G.; Bardi, U.; Giolli, C.; Miranda, M.; Ciattini, S.; Fossati, A.; Borgioli, F. Thermal fatigue behavior of thick and porous thermal barrier coatings systems. J. Therm. Spray Technol. 2007, 16, 816–821. [Google Scholar] [CrossRef]
  32. Curry, N.; Leitner, M.; Körner, K. High-porosity thermal barrier coatings from high-power plasma spray equipment—processing, performance and economics. Coatings 2020, 10, 957. [Google Scholar] [CrossRef]
  33. Giolli, C.; Scrivani, A.; Rizzi, G.; Borgioli, F.; Bolelli, G.; Lusvarghi, L. Failure mechanism for thermal fatigue of thermal barrier coating systems. J. Therm. Spray Technol. 2009, 18, 223–230. [Google Scholar] [CrossRef]
  34. Lima, R.; Guerreiro, B.; Curry, N.; Leitner, M.; Körner, K. Environmental, economical, and performance impacts of Ar-H2 and N2-H2 plasma-sprayed YSZ TBCs. J. Therm. Spray Technol. 2019, 29, 74–89. [Google Scholar] [CrossRef]
  35. Mahade, S.; Curry, N.; Björklund, S.; Markocsan, N.; Nylén, P. Thermal conductivity and thermal cyclic fatigue of multilayered Gd2Zr2O7/YSZ thermal barrier coatings processed by suspension plasma spray. Surf. Coat. Technol. 2015, 283, 329–336. [Google Scholar] [CrossRef] [Green Version]
  36. Evans, A.; Charles, E. fracture toughness determinations by indentation. J. Am. Ceram. Soc. 1976, 59, 371–372. [Google Scholar] [CrossRef]
  37. ASTM G76—13 Standard Test Method for Conducting Erosion Tests by Solid Particle Impingement Using Gas Jets; ASTM International: West Conshohocken, PA, USA, 2013. [CrossRef]
  38. Markocsan, N.; Nylén, P.; Wigren, J.; Li, X. Low thermal conductivity coatings for gas turbine applications. J. Therm. Spray Technol. 2007, 16, 498–505. [Google Scholar] [CrossRef]
  39. Mahade, S.; Curry, N.; Björklund, S.; Markocsan, N.; Nylén, P.; Vaßen, R. erosion performance of gadolinium zirconate-based thermal barrier coatings processed by suspension plasma spray. J. Therm. Spray Technol. 2016, 26, 108–115. [Google Scholar] [CrossRef]
  40. Viswanathan, V.; Dwivedi, G.; Sampath, S. Multilayer, multimaterial thermal barrier coating systems: Design, synthesis, and performance assessment. J. Am. Ceram. Soc. 2015, 98, 1769–1777. [Google Scholar] [CrossRef]
  41. Quinn, G.; Bradt, R. On the vickers indentation fracture toughness test. J. Am. Ceram. Soc. 2007, 90, 673–680. [Google Scholar] [CrossRef]
  42. Zhou, D.; Guillon, O.; Vaßen, R. Development of YSZ thermal barrier coatings using axial suspension plasma spraying. Coatings 2017, 7, 120. [Google Scholar] [CrossRef] [Green Version]
  43. Murray, J.; Rance, G.; Xu, F.; Hussain, T. Alumina-graphene nanocomposite coatings fabricated by suspension high velocity oxy-fuel thermal spraying for ultra-low-wear. J. Eur. Ceram. Soc. 2018, 38, 1819–1828. [Google Scholar] [CrossRef]
  44. Marinis, A.; Aquilino, S.; Lund, P.; Gratton, D.; Stanford, C.; Diaz-Arnold, A.; Qian, F. Fracture toughness of yttria-stabilized zirconia sintered in conventional and microwave ovens. J. Prosthet. Dent. 2013, 109, 165–171. [Google Scholar] [CrossRef]
  45. Eaton, H.; Novak, R. Particulate erosion of plasma-sprayed porous ceramic. Surf. Coat. Technol. 1987, 30, 41–50. [Google Scholar] [CrossRef]
  46. Janos, B.; Lugscheider, E.; Remer, P. Effect of thermal aging on the erosion resistance of air plasma sprayed zirconia thermal barrier coating. Surf. Coat. Technol. 1999, 113, 278–285. [Google Scholar] [CrossRef]
  47. Mahade, S.; Zhou, D.; Curry, N.; Markocsan, N.; Nylén, P.; Vaßen, R. Tailored microstructures of gadolinium zirconate/YSZ multi-layered thermal barrier coatings produced by suspension plasma spray: Durability and erosion testing. J. Mater. Process. Technol. 2019, 264, 283–294. [Google Scholar] [CrossRef]
  48. Schmitt, M.; Stokes, J.; Gorin, B.; Rai, A.; Zhu, D.; Eden, T.; Wolfe, D. Effect of Gd content on mechanical properties and erosion durability of sub-stoichiometric Gd2Zr2O7. Surf. Coat. Technol. 2017, 313, 177–183. [Google Scholar] [CrossRef] [Green Version]
  49. Algenaid, W.; Ganvir, A.; Calinas, R.; Varghese, J.; Rajulapati, K.; Joshi, S. Influence of microstructure on the erosion behaviour of suspension plasma sprayed thermal barrier coatings. Surf. Coat. Technol. 2019, 375, 86–99. [Google Scholar] [CrossRef]
  50. Yu, Q.; He, Q.; Ning, F. Influence of interface morphology on erosion failure of thermal barrier coatings. Ceram. Int. 2018, 44, 21349–21357. [Google Scholar] [CrossRef]
  51. Steinberg, L.; Mikulla, C.; Naraparaju, R.; Toma, F.; Großmann, H.; Schulz, U.; Leyens, C. Erosion resistance of CMAS infiltrated sacrificial suspension sprayed alumina top layer on EB-PVD 7YSZ coatings. Wear 2019, 438–439, 203064. [Google Scholar] [CrossRef]
  52. Zhang, P.; Li, F.; Zhang, X.; Zhang, Z.; Tan, C.; Ren, L.; Wang, Y.; Ma, W.; Liu, M. Effect of bionic unit shapes on solid particle erosion resistance of ZrO2–7wt%Y2O3 thermal barrier coatings processed by laser. J. Bionic Eng. 2018, 15, 545–557. [Google Scholar] [CrossRef]
Figure 1. Example of original SEM micrograph (BSE) and processed images for different types of porosity.
Coatings 11 00086 g001
Figure 2. Measured particle temperature versus particle velocity for the evaluated coatings.
Coatings 11 00086 g002
Figure 3. Cross-sectional SEM analysis (BSE) of conventional porosity-low powder feed rate sprayed TBCs (a,b) LD-L (c,d) HOSP-L.
Coatings 11 00086 g003
Figure 4. Cross-sectional SEM analysis (BSE) of conventional porosity-medium powder feed rate sprayed TBCs (a,b) LD-M (c,d) HOSP-M.
Coatings 11 00086 g004
Figure 5. Cross-sectional SEM analysis (BSE) of high porosity—higher feed rates and longer standoff distance sprayed TBCs (a,b) LD-H (c,d) A&S-H.
Coatings 11 00086 g005
Figure 6. Cross-sectional SEM analysis (BSE) of high porosity—higher feed rates and shorter standoff distance sprayed TBCs (a,b) LD-H.S (c,d) A&S-H.S.
Coatings 11 00086 g006
Figure 7. Top surface SEM analysis (BSE) of (a) L.D-H (b) A&S-H.S TBCs.
Coatings 11 00086 g007
Figure 8. Different microstructural features of the investigated TBCs measured using APHELION.
Coatings 11 00086 g008
Figure 9. Cumulative crack/delamination length versus angle to substrate/coating surface.
Coatings 11 00086 g009
Figure 10. Hardness of the investigated TBCs.
Coatings 11 00086 g010
Figure 11. Fracture toughness of the investigated TBC measured using micro-indentation method.
Coatings 11 00086 g011
Figure 12. Erosion performance of the TBCs evaluated at different erodent impact angles.
Coatings 11 00086 g012
Figure 13. SEM analysis (BSE) of eroded LD-H coating at 90 degrees impact angle (ac) cross-section (df) top surface revealing different erosion mechanisms.
Coatings 11 00086 g013
Figure 14. SEM analysis (BSE) of eroded A&S-H.S coating at 90 degrees impact angle (a,b) cross-section (c,d) top surface revealing different erosion mechanisms.
Coatings 11 00086 g014
Figure 15. SEM analysis (BSE) of eroded LD-H coating at 30 degrees impact angle (a) cross-section (b) top surface.
Coatings 11 00086 g015
Figure 16. SEM analysis (BSE) of eroded A&S-H.S coating at 30 degrees impact angle (a) cross-section (b) top surface.
Coatings 11 00086 g016
Figure 17. Coating density vs. erosion rate at (a) 90-degrees and (b) 30-degrees impact angle.
Coatings 11 00086 g017
Table 1. Spray parameters and powder feedstocks used to deposit the thermal barrier coatings (TBCs).
Sample IDPowderGun Power (kW)Spray Distance (mm)Feed Rate (g/min)Thickness (µm)µm Per PassPorosity %Deposition
Efficiency
Conventional Porosity, Low (L) powder feed rate
HOSP-LHOSP Commercial100kW1509045212.215.443.6%
LD-LLow-Density90kW1509046912.713.868.9%
Conventional Porosity, Medium (M) powder feed rate
HOSP-MHOSP Commercial100kW15015047013.415.835.8%
LD-MLow-Density95kW15015043817.514.366.3%
High Porosity, High (H) powder feed rate
A&S-HA&S Commercial95kW17528080420.121.839.4%
LD-HLow-Density95kW17528084016.224.151.6%
High Porosity, High (H) powder feed rate, short (S) standoff distance
A&S-H.SA&S Commercial95kW15028098120.417.656.4%
LD-H.SLow-Density95kW15028083422.520.560.7%
Publisher’s Note: MDPI stays neutral with regard to jurisdictional claims in published maps and institutional affiliations.

