
The Interface Characterization of 2-Mercapto-1-methylimidazole Corrosion Inhibitor on Brass


Faculty of Chemistry and Chemical Engineering, University of Maribor, Smetanova ulica 17, 2000 Maribor, Slovenia
Coatings 2021, 11(3), 295; https://0-doi-org.brum.beds.ac.uk/10.3390/coatings11030295
Submission received: 10 February 2021
/
Revised: 22 February 2021
/
Accepted: 26 February 2021
/
Published: 4 March 2021
(This article belongs to the Collection Coatings: 10th Anniversary)
Abstract
:This work presents a detailed surface analytical study and surface characterization, with an emphasis on the X-ray photoelectron spectroscopy (XPS) and time-of-flight secondary ion mass spectrometry (ToF-SIMS) analyses of 2‑mercapto‑1‑methylimidazole (MMI) as a corrosion inhibitor for brass. First, the electrochemical measurements demonstrated a corrosion inhibition effect of MMI in a 3 wt.% NaCl solution. Next, the formation of the MMI surface layer and its properties after 1 month of immersion was analyzed with attenuated total reflectance–Fourier-transform infrared spectroscopy, atomic force microscopy, field-emission scanning electron microscopy, and contact angle analysis. Moreover, to gradually remove the organic surface layer, a gas cluster ion beam (GCIB) sputtering source at different accelerated voltages and cluster sizes was employed. After each sputtering cycle, a high-resolution XPS analysis was performed. Moreover, an angle‑resolved XPS analysis was carried out for the MMI-treated brass sample to analyze the heterogeneous layered structure (the interface of the MMI organic/inorganic brass substrate). The interface properties were also investigated in detail using ToF-SIMS for spectra measurements and 2D imaging. Special attention was devoted to the possible spectral interferences for MMI‑related species. The thermal stability of different MMI-related species using molecular-specific signals without possible spectral interferences was determined by performing a cooling/heating experiment associated with ToF-SIMS measurements. It was shown that these species desorbed from the brass surface in the temperature range of 310–370 °C.
1. Introduction
Problems related to corrosion represent a huge expense for most countries worldwide [1]. Therefore, the mitigation of corrosion is of utmost importance. One of the ways to mitigate corrosion is by using corrosion inhibitors. A corrosion inhibitor is a chemical compound that can be added to the corrosive solution, and thus it mitigates corrosion as it adsorbs on the surface. Corrosion inhibitors can be organic or inorganic. Organic corrosion inhibitors usually contain S, N, and/or O atoms in their chemical structure. They adsorb on the surface from the corrosive solution in a certain manner, forming a surface layer that begins to mitigate corrosion. Corrosion inhibitors can mitigate corrosion immediately after the immersion of the metallic material, or they may require some time to exert their corrosion-inhibiting effect.
The manner in which corrosion inhibitors adsorb on the surface and form a surface layer can be determined using advanced analytical techniques such as time-of-flight secondary ion mass spectrometry (ToF-SIMS) and X-ray photoelectron spectroscopy (XPS). These techniques became even more useful for the analysis of organic materials on top of the inorganic materials (metallic materials) with the development of the gas cluster ion beam (GCIB) sputtering source. This sputter beam can be used at different accelerated voltages and cluster sizes. By changing these parameters, we can control the accelerated voltage per atom in a cluster and thus the damage that the cluster causes in the surface layer. Based on that, we can control the sputtering rate to a certain degree. After each sputtering cycle, a surface analysis is performed. Thus, the in-depth composition of the elements and their environments can be determined, and if ToF-SIMS is also used, molecular-specific information can be obtained [2,3,4,5,6,7,8,9,10,11,12,13,14,15,16,17,18,19].
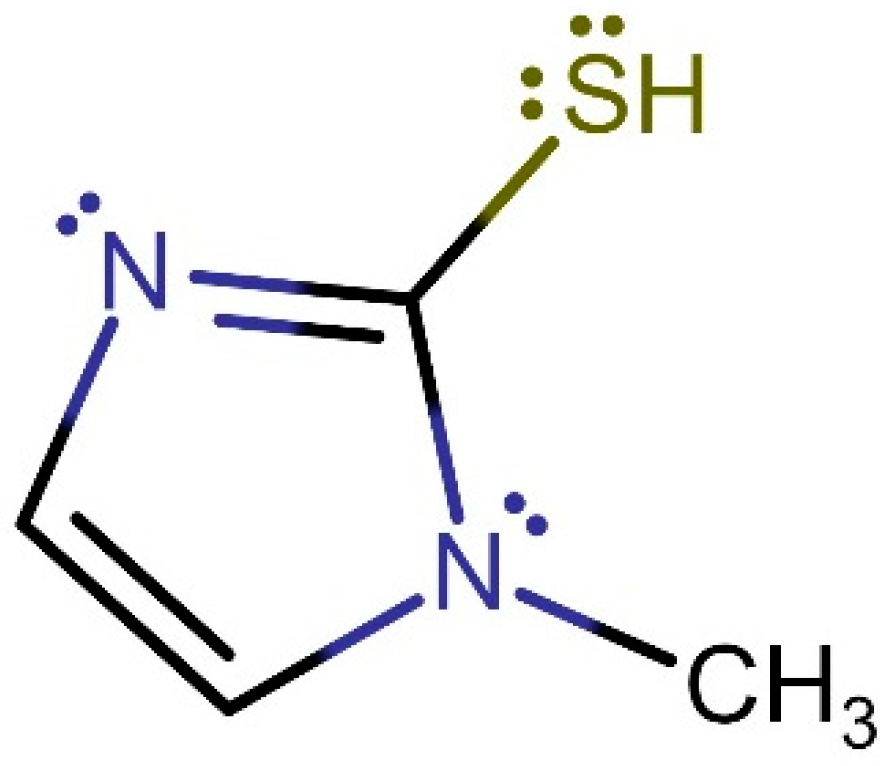
This study describes the surface analysis and interfacial properties of a corrosion inhibitor adsorbed on a brass surface. In general, brass is a vital material technologically. It is used in various fields of industry for many applications, e.g., as a material for the construction of valves, for cooling systems, for the construction of heat exchangers, and in condenser constructions [20,21,22,23,24,25,26,27,28,29,30]. However, when brass is exposed to a corrosive solution, it starts to corrode [31,32,33,34]. One of the effective ways to mitigate the corrosion of brass is to use imidazole corrosion inhibitors. In this study, 2-mercapto-1-methylimidazole (MMI with the chemical structure given in Figure 1) is presented as a corrosion inhibitor for brass in a 3 wt.% NaCl solution.
MMI can be a corrosion inhibitor for copper- and steel-based materials, as shown in [35,36,37,38,39,40]. Those studies were mainly related to corrosion phenomena, and none of them included GCIB and ToF‑SIMS surface analyses, which, as demonstrated herein, have now led to significant progress in explaining interfacial properties. Furthermore, to the best of the author’s knowledge, MMI corrosion inhibition for brass in 3 wt.% NaCl solution has not been investigated previously.
A solution containing 3 wt.% NaCl, as used in this work, is highly corrosive to brass and is, therefore, a suitable model medium for studying the properties of the MMI corrosion inhibitor. In this work, the tests were performed in a solution containing 1 mM MMI. This is the concentration commonly used in corrosion inhibitor studies and therefore allows for a direct comparison with previous studies. To clearly demonstrate the effectiveness of MMI corrosion inhibition, electrochemical impedance spectroscopy (EIS), in association with a fitting procedure and potentiodynamic curve measurements, was performed. Next, the surface properties under longer-term immersion times, i.e., 1 month of immersion, were investigated using attenuated total reflectance–Fourier-transform infrared (ATR‑FTIR) spectroscopy, atomic force microscopy (AFM), field-emission scanning electron microscopy (FE-SEM), and contact angle analysis. Finally, the MMI molecules’ exact interfacial property on the brass surface was investigated for the surface layer formed after 1 h of immersion. For the latter, XPS, angle-resolved XPS (ARXPS), GCIB‑XPS, ToF-SIMS spectra, ToF-SIMS imaging, and ToF-SIMS cooling/heating experiments were performed.
2. Materials and Methods
2.1. Sample and Solution Preparation
Brass samples were cut out of 1-mm-thick sheets in the shape of discs 15 mm in diameter. The brass sheets were supplied by Rocholl GmbH (Aglasterhausen, Germany). The brass consisted of 63.0 wt.% Cu and 37.0 wt.% Zn, and it was composed of alpha and beta phases. The brass samples were ground under a water jet using SiC papers (supplied by Struers, Ballerup, Denmark) starting with 500-grit SiC paper, followed by 800-, 1000-, 1200-, 2400-, and 4000-grit SiC papers. During grinding, the sample was turned at least 4 times by 90° to obtain a mirror-finish surface. After grinding, the samples were thoroughly rinsed with ultrapure water (with a resistivity of 18.2 MΩ cm) and cleaned in an ultrasound bath (comprising V(ultrapure water)/V(pure ethanol) 50%/50%; V stands for volume) for 3 min. Then, the samples were rinsed with ultrapure water and dried under a stream of Ar gas.
NaCl (for analysis EMSURE® ACS, ISO, Reag. Ph Eur) and MMI (with a purity of ≥99%) were supplied by Merck (Kenilworth, NJ, USA). All immersions of brass samples were performed in a 3 wt.% NaCl solution with or without 1 mM MMI. All immersion tests were performed under laboratory conditions (25 ± 1 °C).
The samples analyzed by ATR-FTIR and for contact angle analysis were prepared by the immersion of the brass in 3 wt.% NaCl solution with and without 1 mM MMI for 31 days, rinsed with ultrapure water, and dried under a stream of Ar. These experiments were performed to form a thicker MMI surface layer, which enables ATR-FTIR detection. Moreover, a hydrophobicity change is more significant and representative for the studied system under a longer immersion time (31 days). All tests were performed in triplicate (curves and spectra in the following figures are representative of the respective system, while the EIS fitted values are shown as average values).
On the other hand, the brass samples analyzed by XPS and ToF-SIMS were immersed for 1 h in 3 wt.% NaCl solution containing 1 mM MMI (hereinafter referred to as the MMI‑treated brass sample). After 1 h of immersion, the samples were rinsed with ultrapure water and dried under a stream of Ar gas. An immersion time of 1 h was sufficient for the MMI surface layer formation, which was not too thick, i.e., the analyses using XPS and ToF-SIMS enabled the investigation of the interface properties as well as the simultaneous detection of the organic MMI surface layer and the oxidized brass surface underneath the organic layer. If the brass sample was immersed for more extended periods, the MMI surface layer would become too thick, thus making the XPS and ToF-SIMS analyses less meaningful for investigating the interface properties, as the signal from the substrate would not be excited.
2.2. Electrochemical Measurements
All electrochemical measurements were performed using an Autolab PGSTAT204 (Metrohm, Herisau, Switzerland) galvanostat/potentiostat controlled by Nova 2.1.4 software (Autolab). The working electrode was a brass sample, while a graphite rod was used as a counter electrode, and a saturated calomel electrode (SCE) was employed as the reference electrode (all potentials in this work refer to the SCE). Measurements were performed in 1 L of solution under laboratory conditions (25 ± 1 °C). The EIS fitting procedure was performed with the ZView (version 2) software package (Scribner Associates Inc., Southern Pines, NC, USA).
EIS measurements were performed in the frequency range from 100 kHz to 5 mHz with a 10 mV amplitude (peak-to-peak) at the open circuit potential (Eoc). Potentiodynamic curve measurements were performed in the potential range starting from –0.250 V vs. Eoc with a positive-going potential using 0.1 mV/s, to the final potential, where the current density reached 1 mA/cm2.
2.3. ATR-FTIR, Contact Angle, AFM, and FE-SEM Measurements
For the ATR-FTIR measurements, a Shimadzu IRAffinity-1 spectrometer (Colombia, MD, USA) was employed, whereas the contact angle analyses were performed with a Krüss DSA 20 tensiometer (Krüss GmbH, Hamburg, Germany). The AFM measurements were performed using an Edge device (Bruker, Karlsruhe, Germany), which was controlled by NanoDrive software (Bruker, Karlsruhe, Germany), while the final image was constructed using NanoScope Analysis 2.0 software (Bruker, Karlsruhe, Germany). AFM measurements were performed with the RTESPA‑CP cantilevers (antimony (n) doped Si, Bruker). FE-SEM measurements were performed with the JSM 7600F device (Jeol, Tokyo, Japan).
2.4. XPS Measurements
An Al Kα X-ray source and a Supra spectrometer (Kratos, Manchester, UK) were employed for the XPS analyses. Measurement and data processing were carried out with ESCApe software (Kratos, Manchester, UK). In order to correct the binding energy (EB) in the survey and high-resolution (HR) spectra, the peak at 284.8 eV was used for the C–C/C–H in the C 1s XPS spectrum. ARXPS measurements were performed at 6 different take‑off angles (θ), i.e., 10°, 20°, 27°, 35°, 50°, and 90°. The θ is the angle of the emitted photoelectrons with respect to the sample surface.
In order to slowly sputter the corrosion inhibitor surface layer, GCIB sputter beams were employed at different accelerated voltages and cluster sizes. First, a larger cluster size and lower accelerated voltage were employed, i.e., 5 keV Ar2000+, followed by 5 keV Ar1000+, and 10 keV Ar1000+ (the number of Ar atoms in the cluster is given in the subscripts). Higher clusters at a lower accelerated voltage have a lower energy per atom and thus a lower penetration power, which is essential for sputtering organic material and thus minimizing chemical modification of the sample while removing it from the surface. After GCIB sputtering, a monoatomic Ar+ sputter beam at a 5 keV accelerated voltage was used. HR XPS spectra were measured after every sputtering cycle and were acquired at θ = 45°.
2.5. ToF-SIMS Measurements
ToF-SIMS analyses were performed with an IONTOF M6 spectrometer (IONTOF, Münster, Germany) using a 30 keV Bi3+ primary ion beam and 0.3 pA current for analysis. The acquisition of the spectra lasted 80 s. The mass resolution of the device is higher than 30,000. ToF-SIMS imaging and ToF‑SIMS cooling/heating experiments were performed on a 500 by 500 µm2 spot size using a 0.20 pA current for analysis. Calibration of the spectra was performed using the signals for CH3+ at a mass‑to‑charge ratio (m/z) of 15.02, for C2H5+ at m/z 29.04, for C3H3+ at m/z 39.02, for C3H7+ at m/z 43.05, for C4H9+ at m/z 57.07, and for C5H11+ at m/z 71.06. All measurements and data analyses were performed with SurfaceLab 7.1 software (from ION‑TOF, Münster, Germany).
3. Results and Discussion
3.1. Electrochemical Measurements
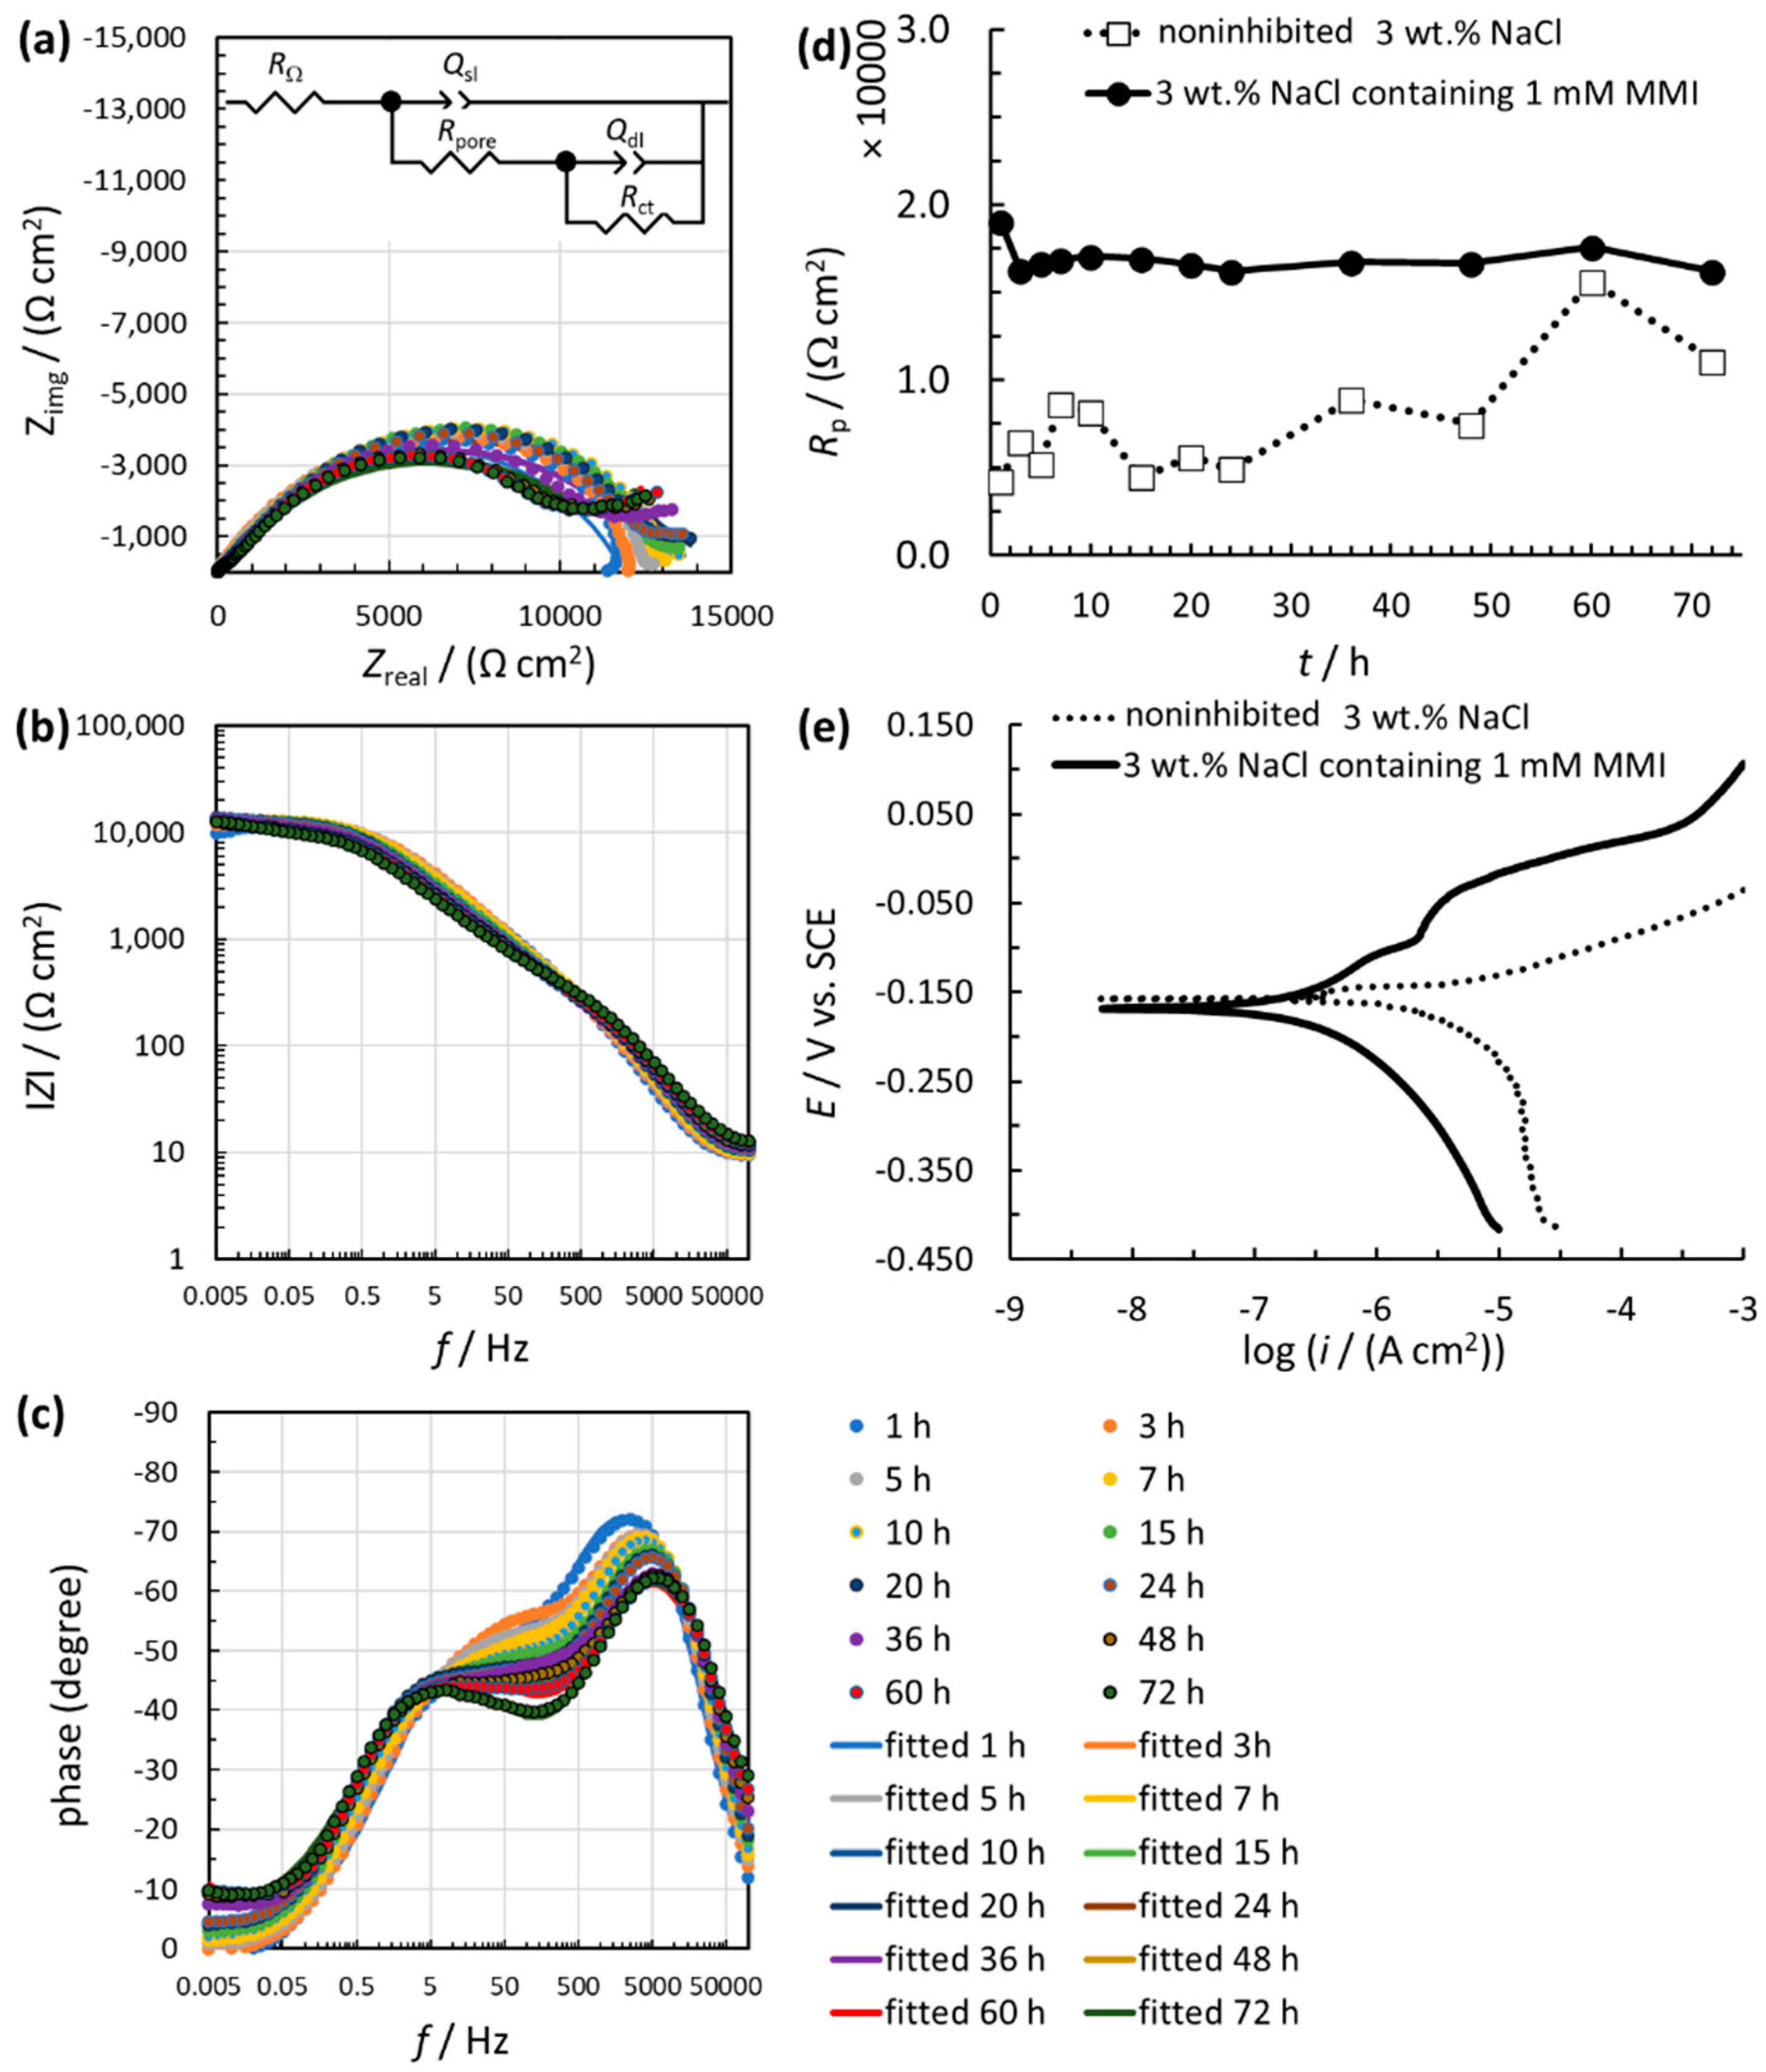
EIS measurements were performed after 1, 5, 10, 15, 20, 24, 36, 48, 60, and 72 h of immersion in the 3 wt.% NaCl solution containing 1 mM MMI (Figure 2a–c) in order to check the time dependence of the corrosion inhibition effectiveness of MMI. The obtained EIS data were fitted using different equivalent electrical circuits (EECs), including the EECs models possible for the present system of the corrosion inhibitor molecules adsorbed on the metallic material. The goodness of the fitting procedure was checked with χ2 (the lower the χ2 value, the better the fit). The best EEC model was determined to be RΩ(Rpore(Qsl(RctQdl))), which demonstrates the oxidized metallic surface covered with a corrosion inhibitor surface layer, with some pores filled with solution. RΩ stands for the uncompensated resistance, Rct for the charge transfer resistance, and Rpore for the resistance inside the pore of the corrosion inhibitor surface layer, where the electrolyte composition is different compared to the bulk solution. Qsl stands for the constant phase element (CPE) related to the surface layer and Qdl for the CPE of the double layer. The sum of Rpore and Rct represents the polarization resistance Rp. The Rp value is a measure of how the metallic material resists transferring the electron to the electroactive species in solution. The higher this value is, the more resistance to general corrosion occurs.
Figure 2d shows that the obtained Rp values for brass immersed in 3 wt.% NaCl solution containing 1 mM MMI are higher than those for the brass sample immersed in noninhibited 3 wt.% NaCl solution (EIS measurements for the noninhibited 3 wt.% solution has been presented previously in Ref. [41]). Based on this, MMI can be considered to be a corrosion inhibitor for brass in 3 wt.% NaCl solution. The highest difference in Rp values is present for the initial immersion (1 h of immersion).
Potentiodynamic curve measurements for the brass sample immersed in MMI-inhibited and noninhibited 3 wt.% NaCl solution are shown in Figure 2e. The cathodic and anodic branches of the potentiodynamic curves are at lower current densities for the inhibited compared to the noninhibited solution. On that basis, MMI can be considered to be a mixed-type inhibitor for brass in 3 wt.% NaCl solution. Moreover, the Eoc is at similar potentials for both potentiodynamic curves, implying that neither of the corrosion reactions (cathodic or anodic) is preferentially inhibited.
3.2. Tests after 1 Month of Immersion
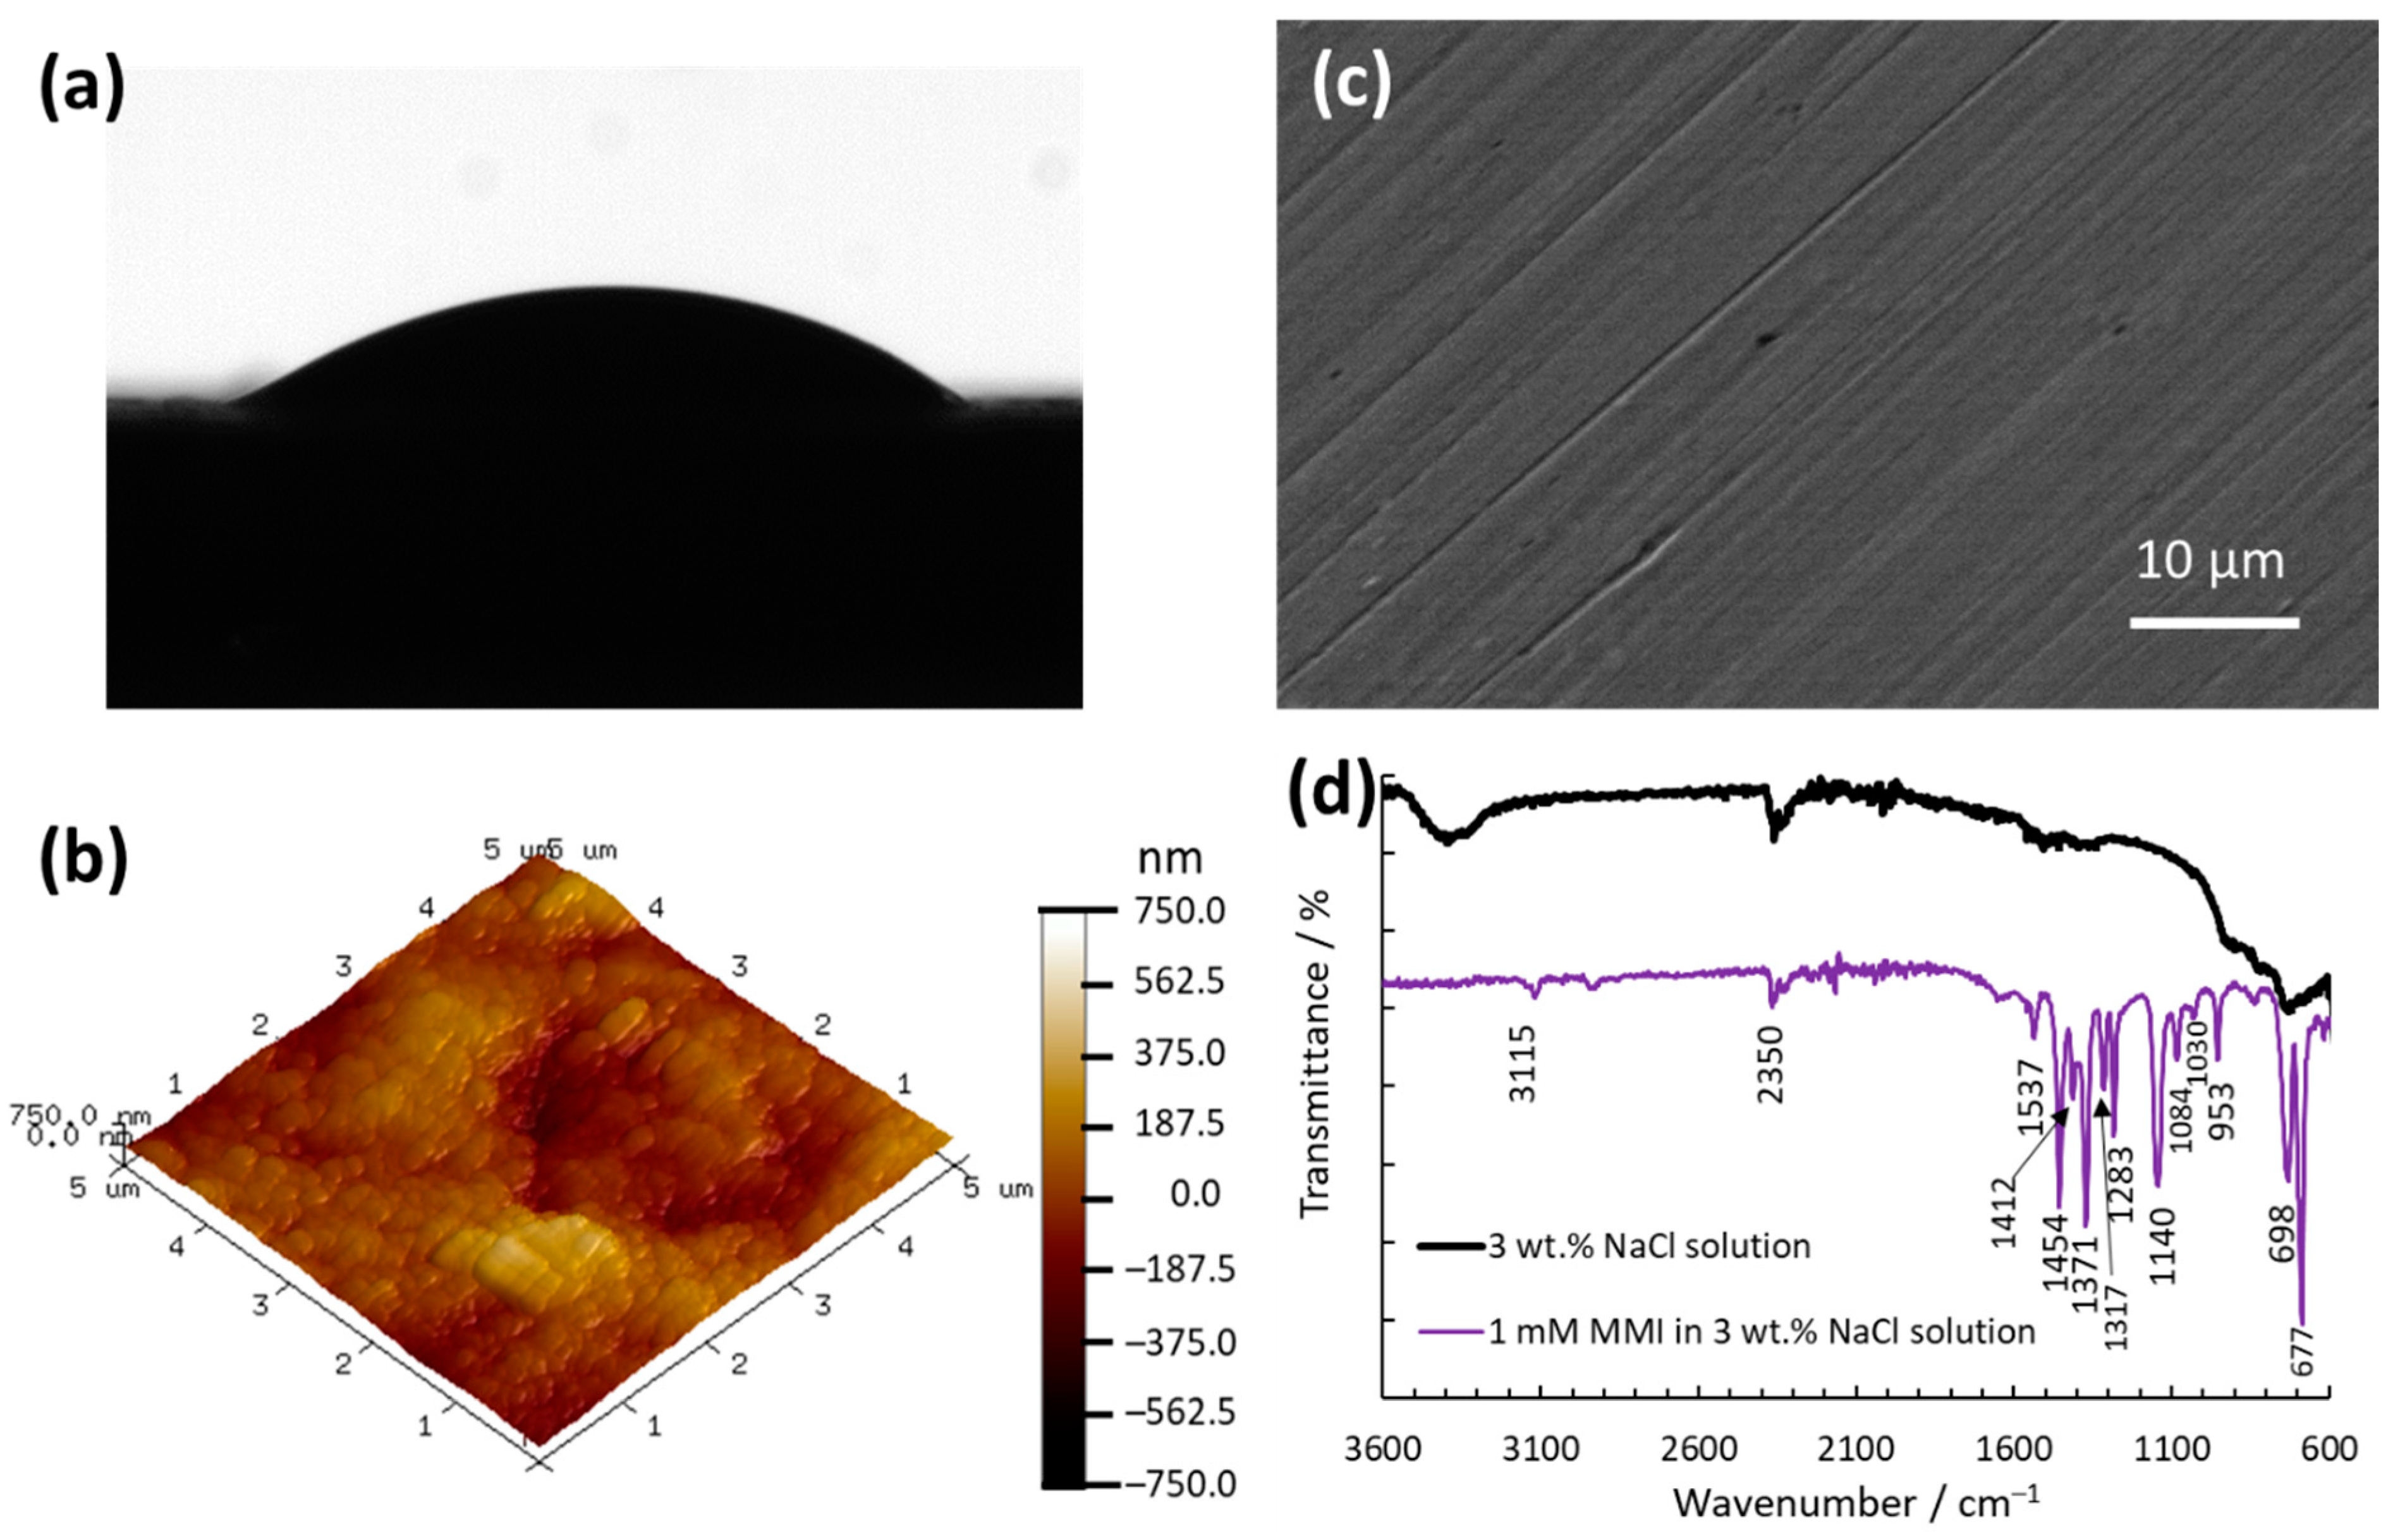
Figure 3 shows the results obtained using a tensiometer for contact angle measurements, an AFM device for topography measurement, a FE-SEM microscope for morphology measurement, and an ATR-FTIR spectrometer for FTIR spectra measurements for the brass sample after 1 month (31 days) of immersion in the 3 wt.% NaCl solution containing 1 mM MMI. The ATR‑FTIR spectrum of the noninhibited solution in Figure 3d is given for comparison.
The contact angle for the brass sample immersed in MMI-inhibited solution was determined to be 33° (Figure 3a). For comparison, the same test for the noninhibited solution reported a contact angle of 82° [41]. Therefore, the brass surface became more hydrophilic when MMI was present in the solution.
Moreover, a clear indication that the MMI surface layer was formed is shown by the AFM measurement. After the grinding procedure, the brass surface contained a uniform pattern of scratches that were oriented in one direction and can be detected using AFM. These scratches were entirely covered by MMI molecules forming the surface layer, with the topography shown in Figure 3b. Furthermore, the FE-SEM image in Figure 3d shows that the surface of the brass sample immersed in 3 wt.% NaCl solution containing 1 mM MMI for one month was not severely corroded, demonstrating the corrosion inhibition effectiveness of MMI. When brass is immersed in noninhibited 3 wt.% NaCl, it corrodes severely, as shown in Ref. [41].
Furthermore, the successful adsorption of MMI on the brass surface and the formation of the surface layer is seen from the ATR-FTIR spectra, where clear peaks were developed for the brass sample that was immersed in the MMI-inhibited solution; the peak at 3115 cm−1 corresponds to S-H vibration [42], the peak at 1537 cm−1 is assigned to C=C vibration [43], at 1454 cm−1 [44] and 1283 cm−1 [45] to C–N stretching, at 1317 cm−1 and 1371 cm−1 to CH2 symmetric bending [44], at 1412 cm−1 to C=N vibration [46], and the peaks in the range of 1090–600 cm−1 to the aromatic C–H out-of-plane bending modes [47,48,49,50,51]. However, the assignment of peaks to exact vibrations in imidazole compounds is challenging [48]. In order to clearly prove that MMI molecules were adsorbed on the brass surface, more sophisticated surface analytical techniques that provide molecular-specific signals are needed (e.g., ToF-SIMS, which will be explained below).
3.3. Chemical Structure of the MMI Surface Layer
XPS and ToF-SIMS analyses were first performed for the brass sample immersed in noninhibited 3 wt.% NaCl solution (without MMI) and for the brass sample before immersion (ground sample). These analyses show that both samples contained typical hydrocarbon signals for adventitious carbonaceous species and signals for oxidized brass. Moreover, no chloride remained on the surface for the brass that was immersed in the 3 wt.% NaCl solution. Next, a detailed surface analysis was performed for the MMI-treated brass sample.
3.3.1. XPS Analyses
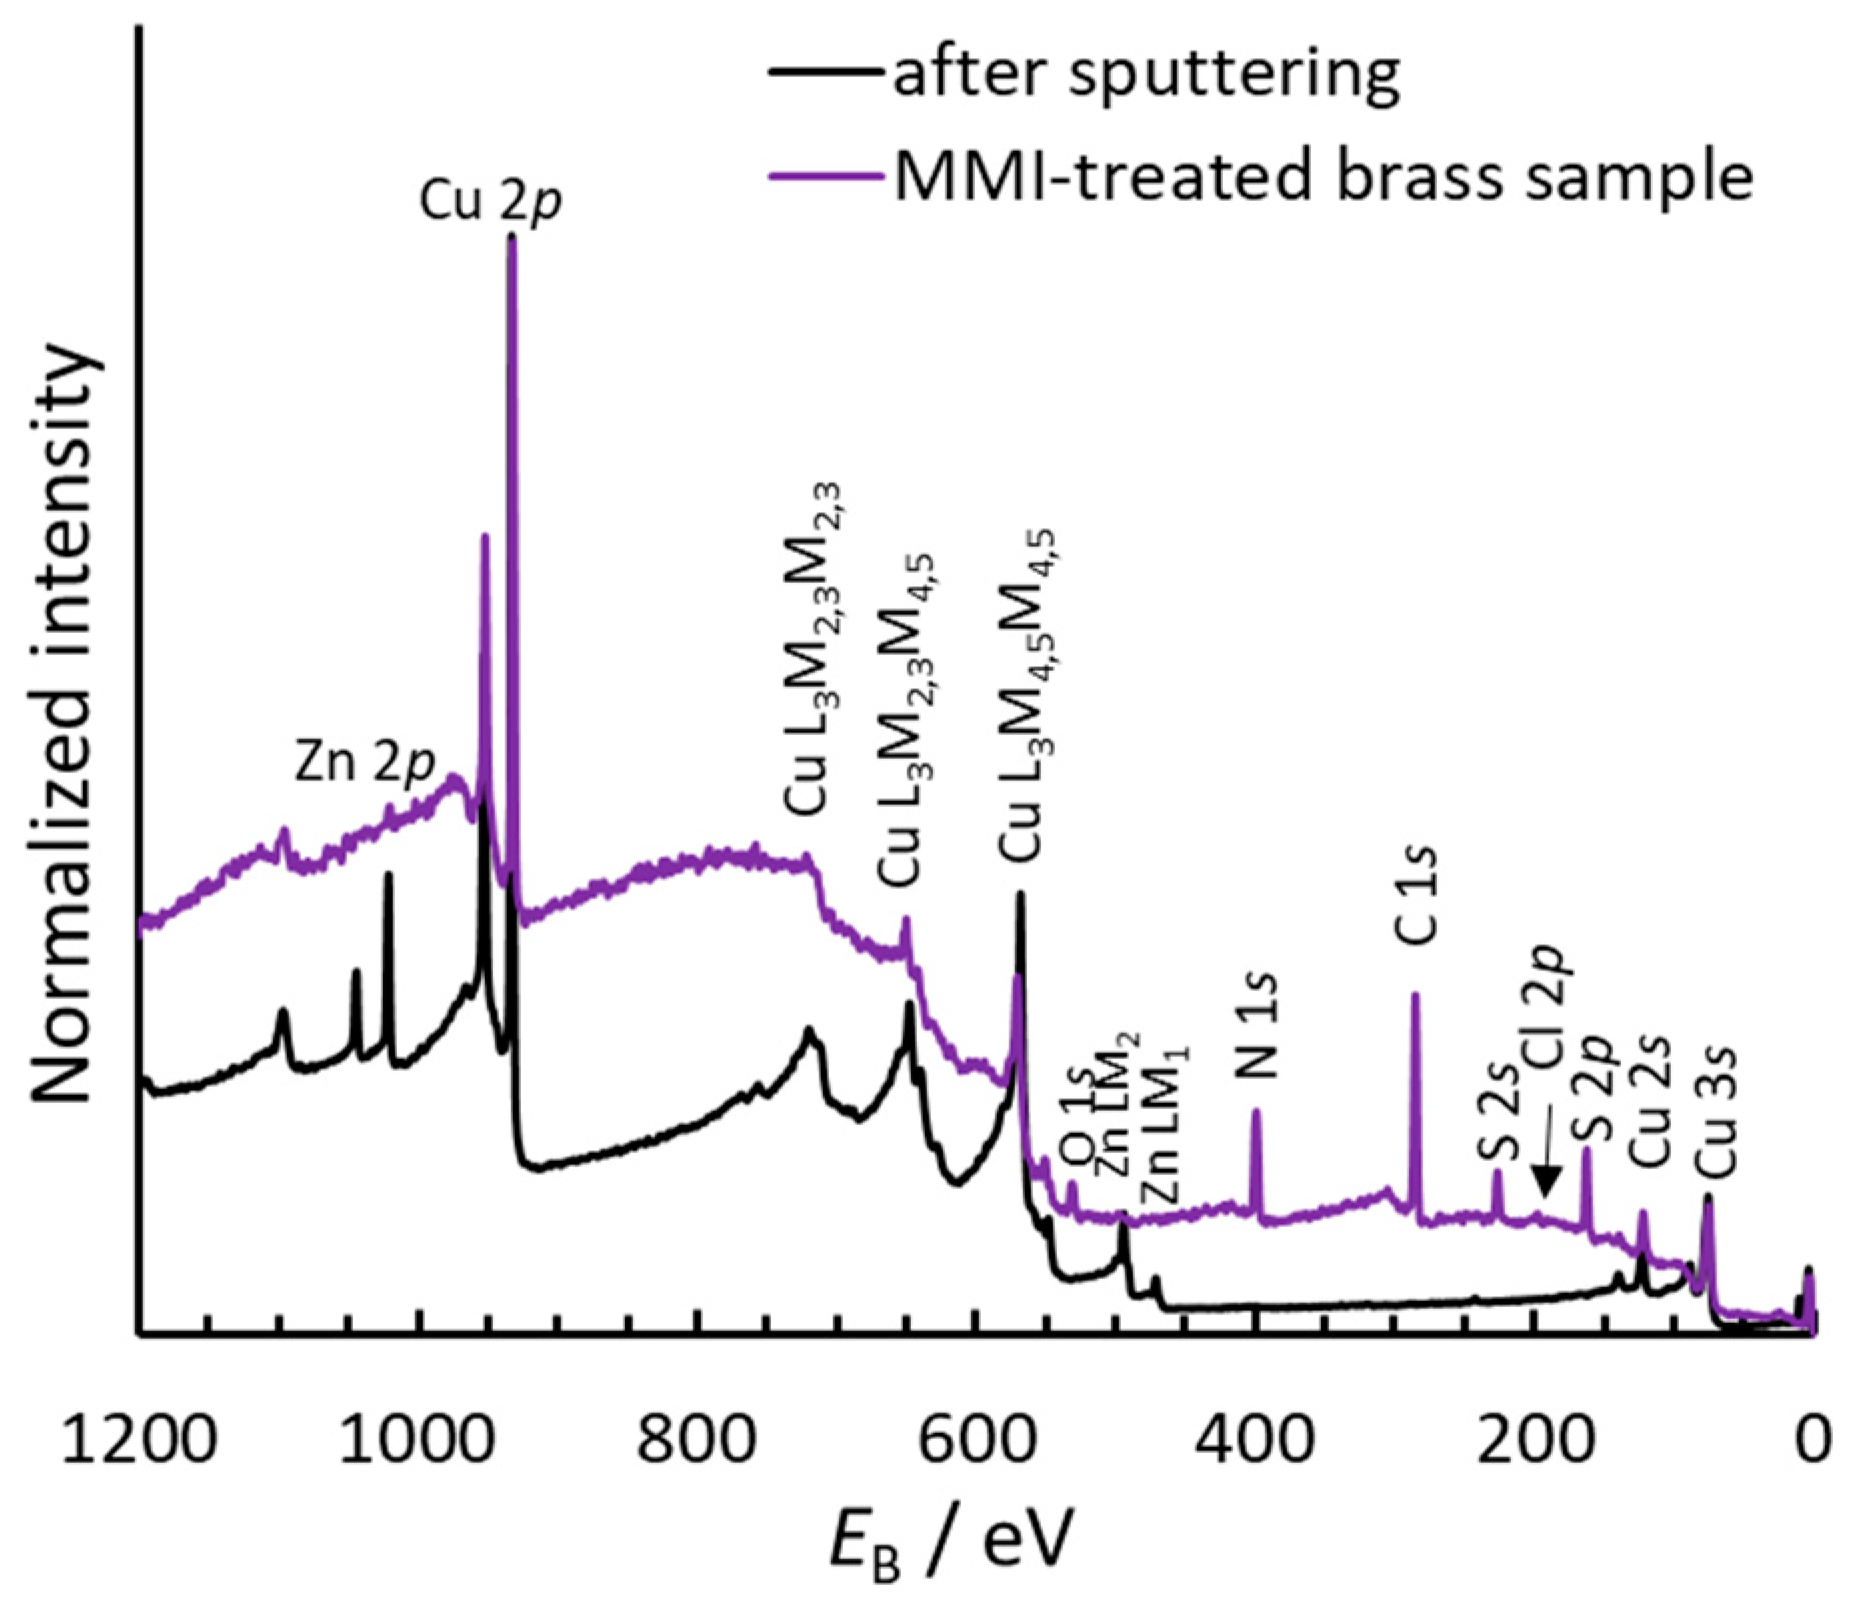
Figure 4 shows the survey spectrum of the MMI-treated brass sample. The survey spectrum of the brass sample cleaned by sputtering is also given for comparison and shows typical peaks for the Cu and Zn elements. For the sputter-cleaned brass sample, the Cu 2p, Cu 2s, and Cu 3s peaks as well as the XPS‑excited Auger Cu L3M2,3M2,3, Cu L3M2,3M4,5, and Cu L3M4,5M4,5 peaks represent Cu-related species on the brass surface. The Zn 2p and XPS-excited Auger Zn LM1 and Zn LM1 peaks represent Zn-related species on the brass surface. Sputtering was carried out with monoatomic Ar+ until the surface was free of N-, O-, and S-containing species to obtain a pure non‑oxidized brass surface.
The survey spectrum of the MMI-treated brass sample shows only Cu-related peaks, while Zn‑related peaks were not clearly developed as the surface concentration of Zn‑related species was below the detection limit of the XPS technique. The latter is most likely a consequence of the MMI surface layer being too thick and the XPS excitation signal not exciting the Zn‑related species located deeper in the subsurface. The C 1s signal originates in the carbonaceous species adsorbed from the atmosphere during sample preparation and transfer to the spectrometer. This signal can also be assigned to the MMI molecules. A clear indication that MMI molecules were adsorbed on the surface is the presence of the N 1s peak as well as the S 2p and S 2s peaks for the MMI-treated brass sample (the MMI molecule contains S and N atoms, as seen in Figure 1). In addition, the survey spectrum of the MMI-treated brass sample also contains an O 1s peak, representing an O-containing species. The O 1s signal may originate in the oxidized brass surface (Cu and Zn oxides/hydroxides), oxidized adventitious carbonaceous species, and possibly water molecules that are hydrogen-bonded to MMI molecules in the surface layer. It is also possible that a combination of these species contributed to the O 1s signal. The MMI‑treated sample also contains some chloride on the surface, which is evident from the presence of the Cl 2p peak in the survey spectrum of this sample.
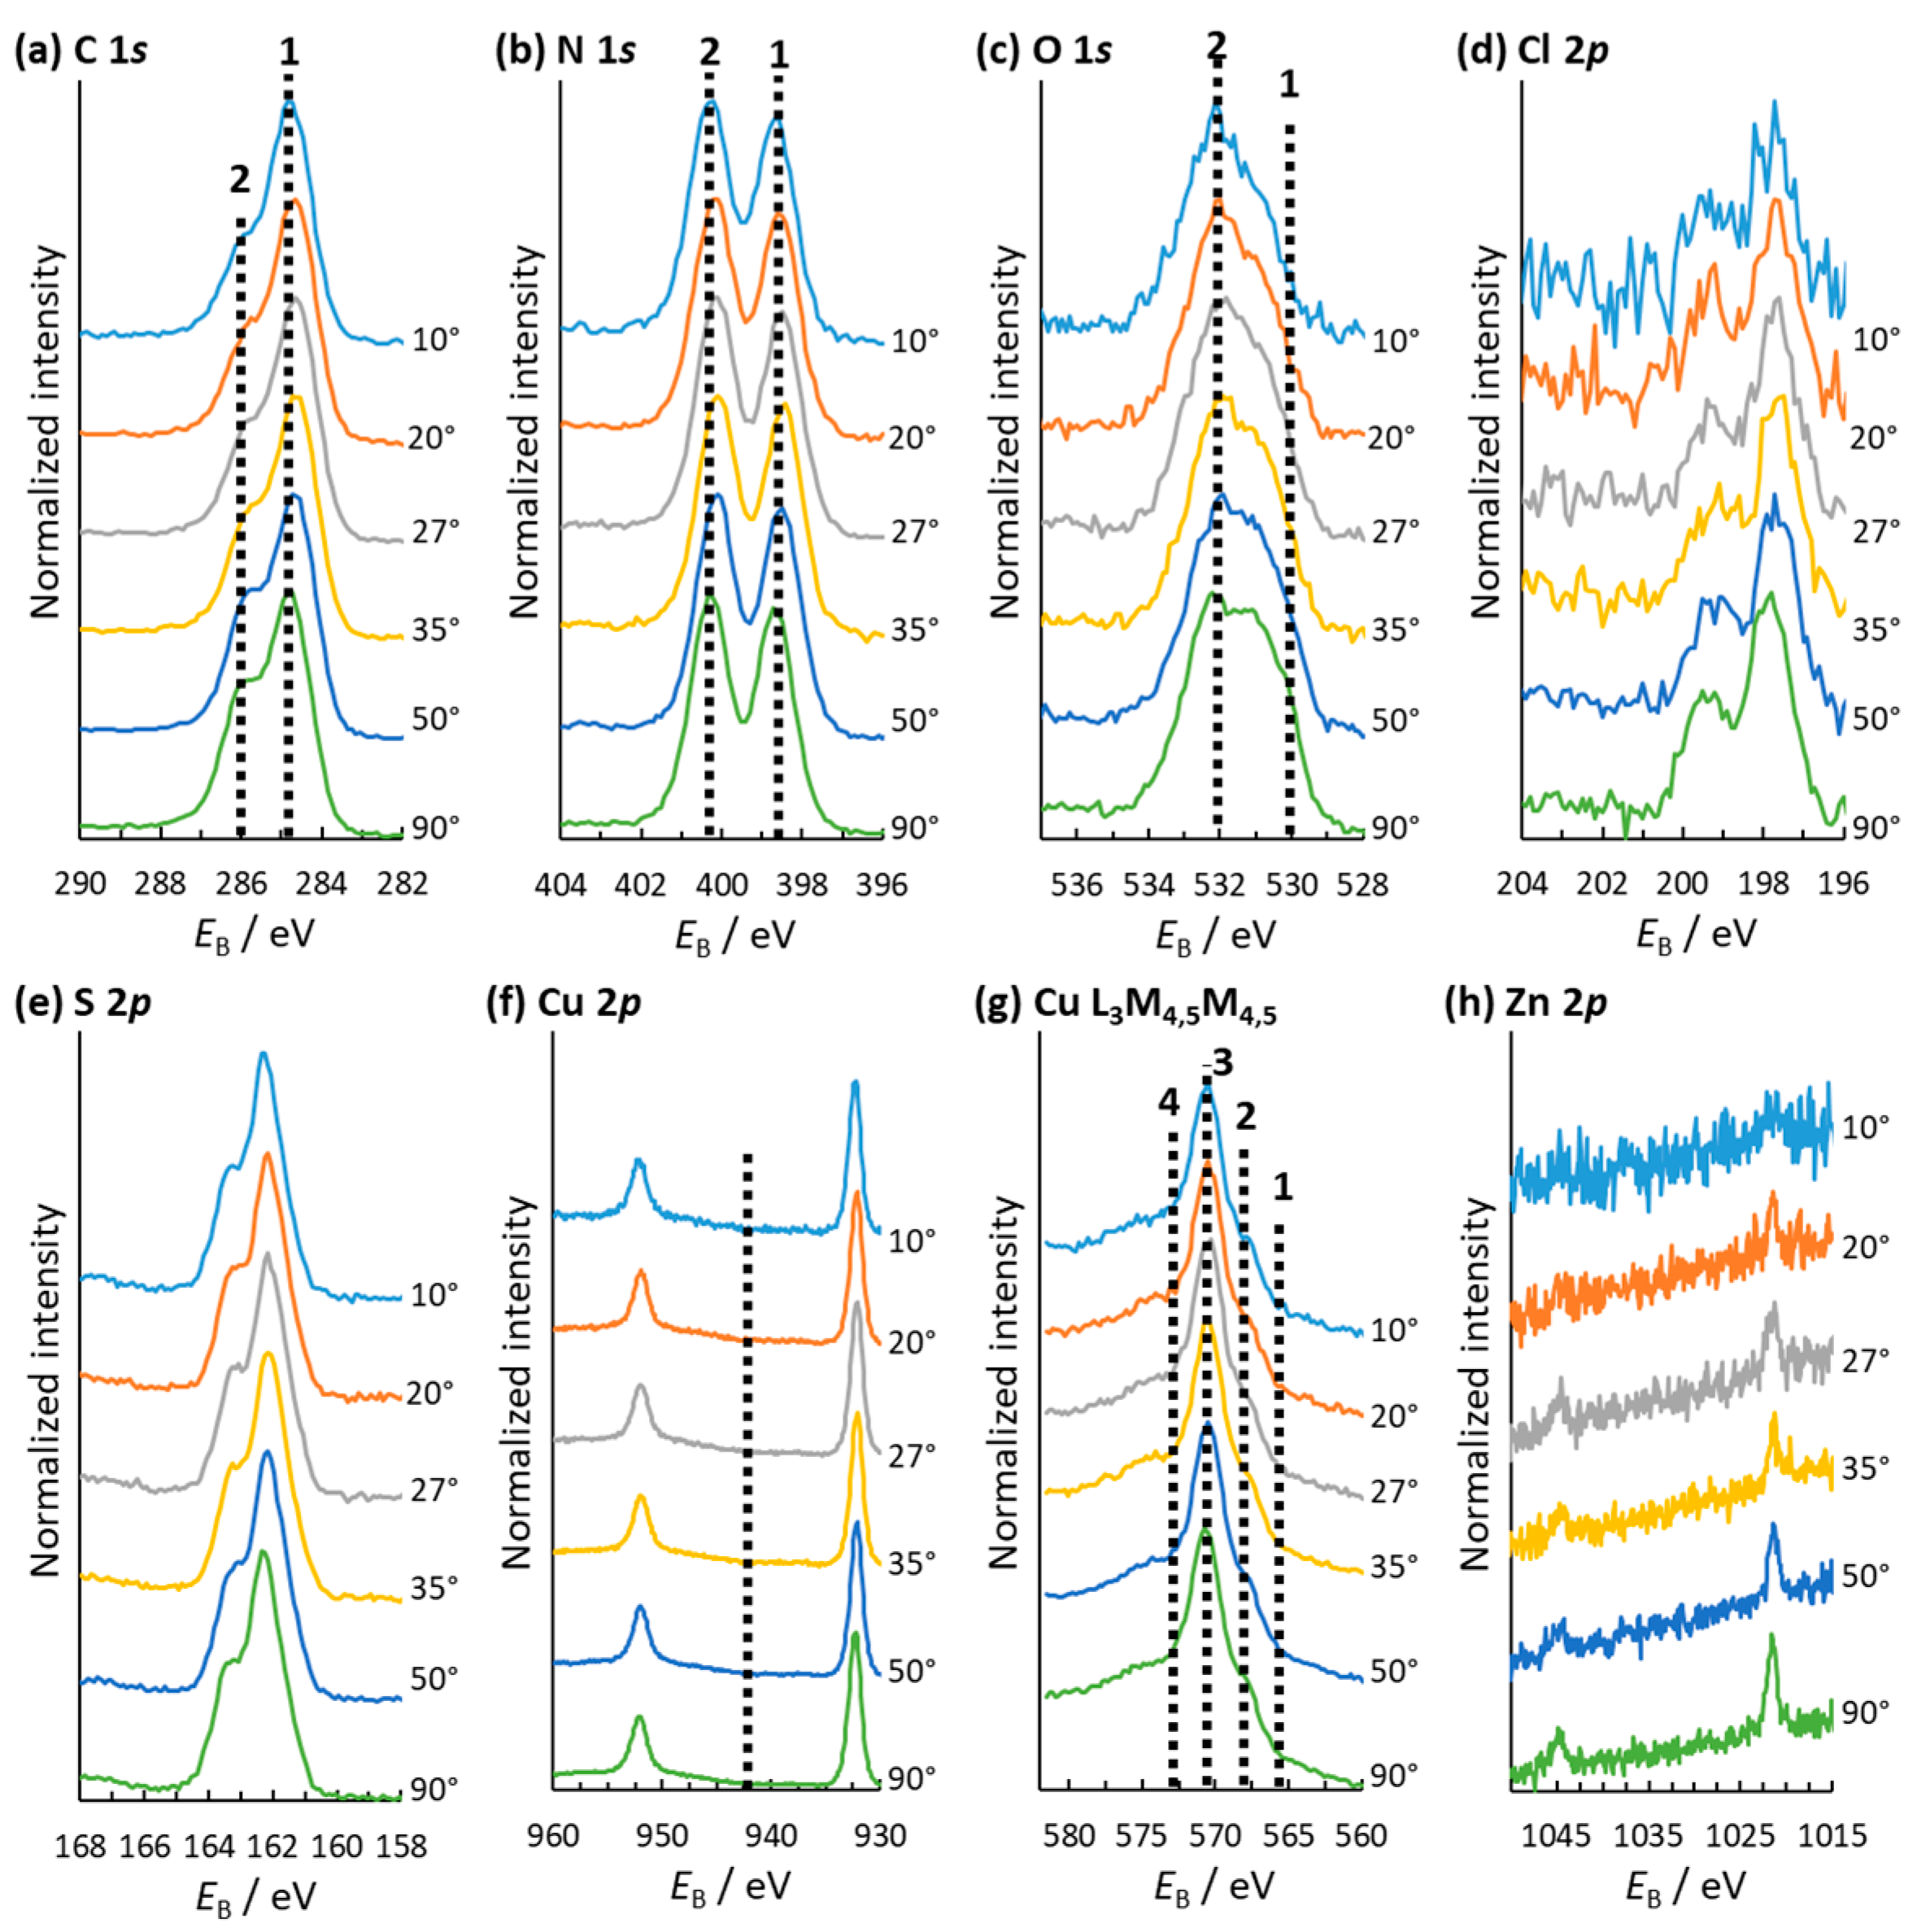
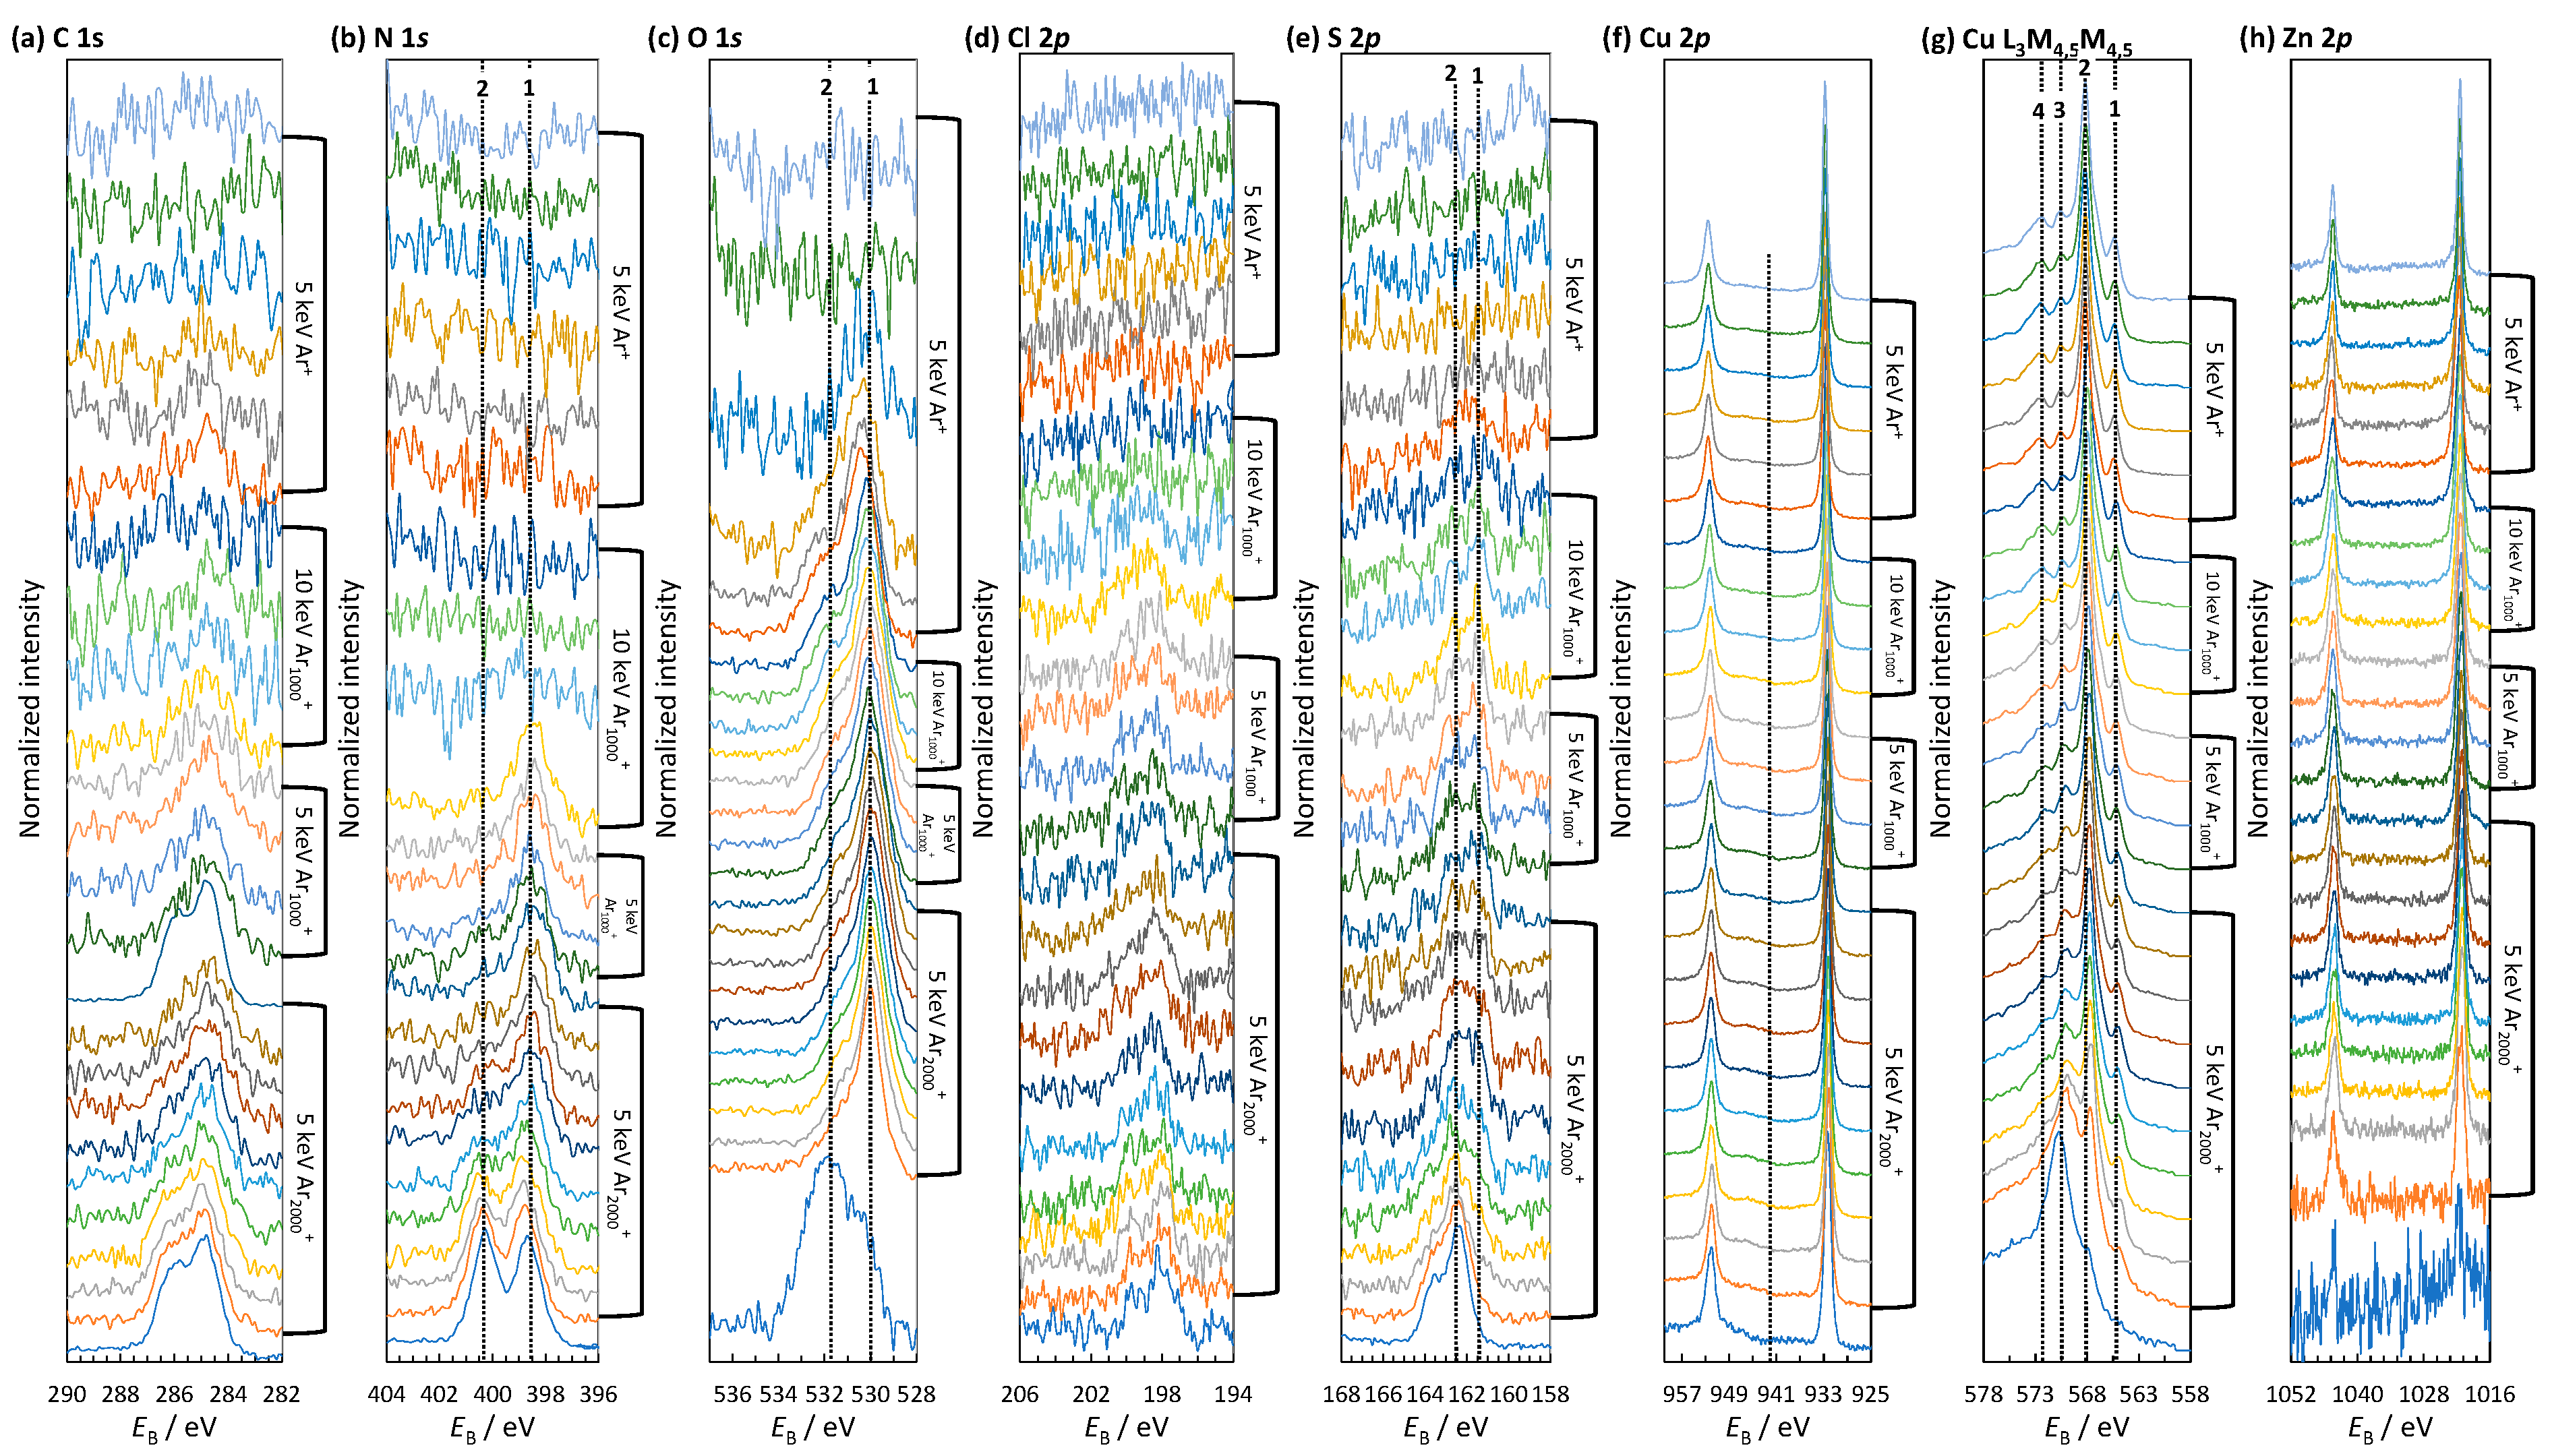
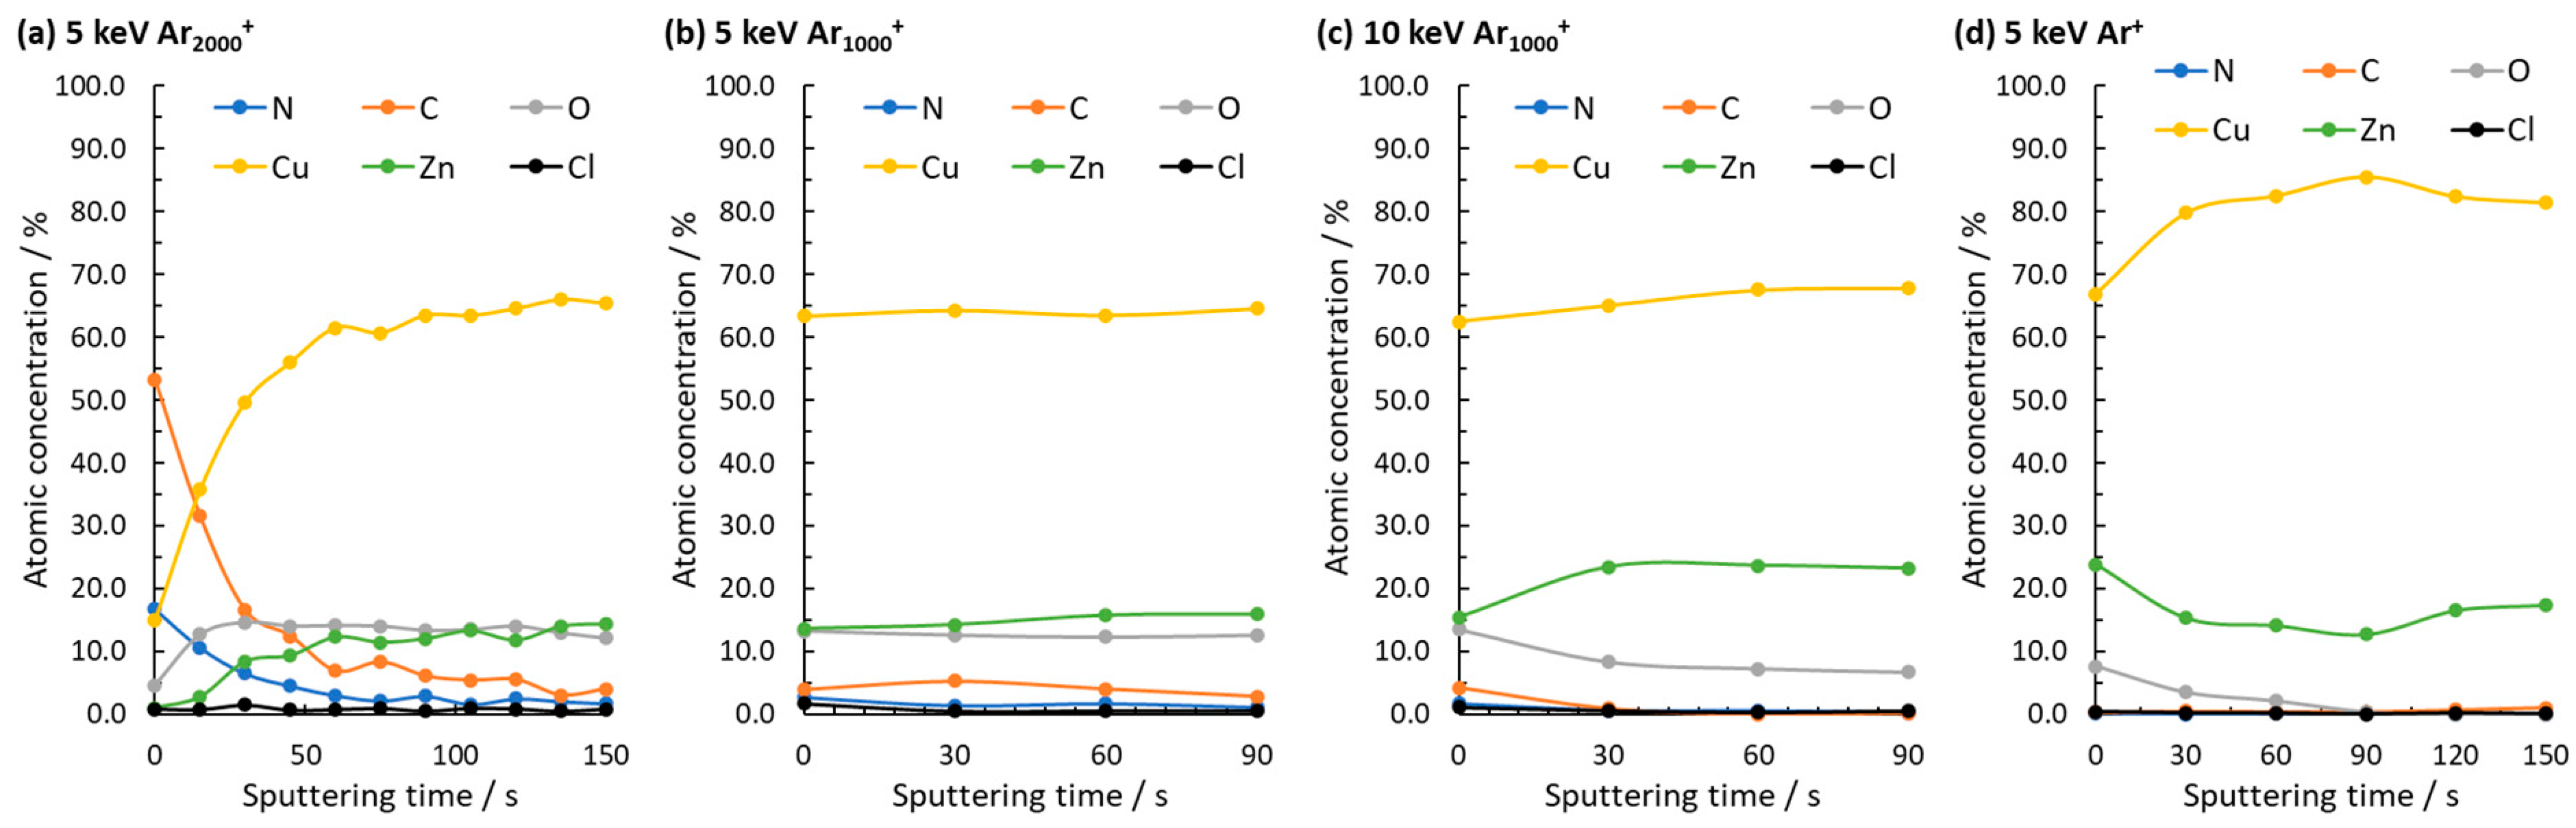
Next, ARXPS measurements were performed at different θ (Figure 5). These measurements provide information about the structure of the heterogeneous material (the organic surface layer on the inorganic material, i.e., brass). With a decrease in θ, the surface sensitivity of the XPS technique increases, which means that most of the signal comes from the topmost position. With an increase in θ, the signal comes simultaneously from the topmost position and from the deeper subsurface regions. Furthermore, GCIB sputtering using 3 different combinations of cluster sizes and accelerated voltages and a monoatomic Ar+ sputter beam were employed to gradually remove the organic surface layer until oxidized brass and subsequently the bare brass substrate were reached. Sputtering cycles using 5 keV Ar2000+ lasted 15 s, while sputtering with 5 keV Ar1000+, 10 keV Ar2000+, and monoatomic 5 keV Ar+ was performed for 30 s. The sputtering cycle for 5 keV Ar2000+ was shorter than the other cycles as the topmost position consisted of adventitious carbonaceous species on top of the MMI surface layer, which were slowly removed because the sputtering cycle was shorter and the accelerated voltage per atom was the lowest. After each sputtering cycle, HR spectra measurements were performed, as shown in Figure 6. The corresponding depth profile showing the change in atomic concentrations (normalized to 100.0%) is given in Figure 7.
The peak of the C 1s spectrum at the position of dashed line 1 corresponds to the C–C/C–H, while the position of dashed line 2 corresponds to the C–N in the imidazole ring (Figure 5a). The high EB side shoulder (corresponding to the C–N) of the C 1s peak became more intense with increasing θ. The latter indicates that MMI molecules are closer to the substrate, and the topmost position is rich in adventitious carbonaceous species containing C–C/C–H. After the first two 5 keV Ar2000+ sputtering cycles, a large amount of adventitious carbonaceous species was removed, and the atomic concentration of C dropped significantly (Figure 7).
The HR N 1s spectra in Figure 5b show two peaks at dashed lines 1 and 2 at every θ measured, indicating the two environments of N atoms in the MMI molecule. The latter could indicate that position 1 corresponds to N attached to a methyl group and position 2 corresponds to the other N atom in the imidazole ring (not bonded to the methyl group). However, the gradual removal of the MMI surface layer by different GCIB sputter beams shows the transfer of the intensive peak at dashed line 2 to the intensive peak at dashed line 1 (Figure 6b). If it were possible to distinguish the two N environments with the XPS method, both peaks would also need to be present during sputtering. As this was not the case (clearly seen before and after the last 5 keV Ar2000+ sputtering cycles), it is more likely that these two peaks correspond to two different MMI molecules bonding, i.e., the topmost position involves MMI-organometallic complex contributing to peak 2, whereas MMI molecules bonded to the brass substrate (not involved in the organometallic complex and underneath the organometallic complex) contributed to peak 1. These two ways of MMI bonding can already be detected simultaneously before sputtering, as seen in Figure 5b and in the lowest spectrum in Figure 6b.
A similar shift of the intensive feature from position 2 to more negative EB (position 1) is present for the S 2p spectra during GCIB sputtering (Figure 6e). These shifts of the N 1s and S 2p features also correlate with the shape of the XPS‑excited Auger Cu L3M4,5M4,5 spectra explained below, and they support the claim as to there being two different types of MMI bonding on the brass surface. Moreover, the shape of the S 2p spectra in Figure 5e matches the S 2p3/2 and S 2p1/2 peaks separated by 1.2 eV with an intensity ratio of 1:2 [52,53,54,55,56,57]. The position of the S 2p peak accords with the position for the thiol group, and therefore no oxidation to sulfonates in the presence of oxygen occurred. For sulphonates, a peak at EB more positive than 166 eV is expected [58,59,60,61].
The HR O 1s spectra in Figure 5c show two features. The first is at the position of dashed line 1, corresponding to O in the organic molecules (oxidized carbonaceous adventitious species) and the second at dashed line 2, corresponding to metal oxides/hydroxides [62]. With increasing θ, the feature at dashed line 1 increases as more signal is obtained from the oxidized brass substrate. The latter is also supported by the XPS depth profiling in Figure 6c, where the main peak is located at position 2 for the spectrum before sputtering (the lowest spectrum in Figure 6c), whereas the removal of the topmost species by GCIB shifted the most intensive feature to more negative EB (to the position of dashed line 1).
As mentioned above, a Cl 2p peak was detected, signifying chlorides on the surface. The HR spectra in Figure 5d at different θ confirm the presence of chlorides in the surface layer [63]. As the Cl 2p peak signal became less noisy with an increase in θ, it can be stated that chlorides were not in the topmost position of the surface layer but were involved in the MMI surface layer. The latter is supported by the XPS depth profile spectra, where the signal for Cl 2p was present until the first sputtering cycle using 10 keV Ar1000+ (Figure 6d). However, the surface concentration of chlorides was low, as shown in Figure 7.
The XPS‑excited Auger Cu L3M4,5M4,5 spectrum of pure Cu is composed of 4 peaks, i.e., peak 1 at 565.6 eV, peak 2 at 568.3 eV, peak 3 at 570.6 eV, and peak 4 at 572.8 eV [64], as indicated in Figure 6g (the upper spectra). The shape of the XPS‑excited Auger Cu L3M4,5M4,5 spectrum is highly susceptible to a Cu environment, i.e., Cu-organometallic complexes usually simultaneously increase peaks 4 and 3, and for Cu2O peak 3 is most intensive, whereas if peak 2 is the most intensive, it is an indication of metallic Cu [65]. Figure 5g does not show a significant change in the XPS‑excited Auger Cu L3M4,5M4,5 spectra measured at different θ. The shape of the spectra, with the most intensive feature between dashed lines 3 and 4, indicates the formation of MMI-Cu organometallic complexes on the surface. On the other hand, when sputtering with GCIB, the change was significant after the first sputtering cycle (Figure 6g). A feature between dashed lines 3 and 4 became less intensive, and the feature at dashed line 2 became more intensive. The latter might indicate the partial removal of the MMI-Cu complex from the surface, which produces more signal for the Cu2O and Cu underneath the organic surface layer. Further sputtering increased a feature at dashed line 2 as more Cu signal was obtained from the brass surface. After monoatomic Ar+ sputtering, the shape of the spectrum became characteristic of pure Cu (Figure 6g). Therefore, this sputter beam removed all the oxide/hydroxide layer from the surface (also seen in Figure 7d after 90 s of monoatomic Ar+ sputtering, where the atomic concentration of O dropped to zero).
The MMI-treated brass sample surface did not contain Cu(II) as no shake-up satellites developed in the Cu 2p spectra at the position of the dashed lines in Figure 5f and Figure 6f. Therefore, only Cu(I) species and metallic Cu were present on the surface. Moreover, as indicated above for the survey spectra, the concentration of Zn-related species in the topmost position was below the XPS detection limit (no peaks developed at θ = 10°), while the increase in θ resulted in the development of the Zn 2p peaks (Figure 5h). A similar case is seen in Figure 6h, with no clear Zn 2p peak developed before sputtering (the lowest spectrum), whereas peaks developed already after the first sputtering cycle.
3.3.2. ToF-SIMS Analyses
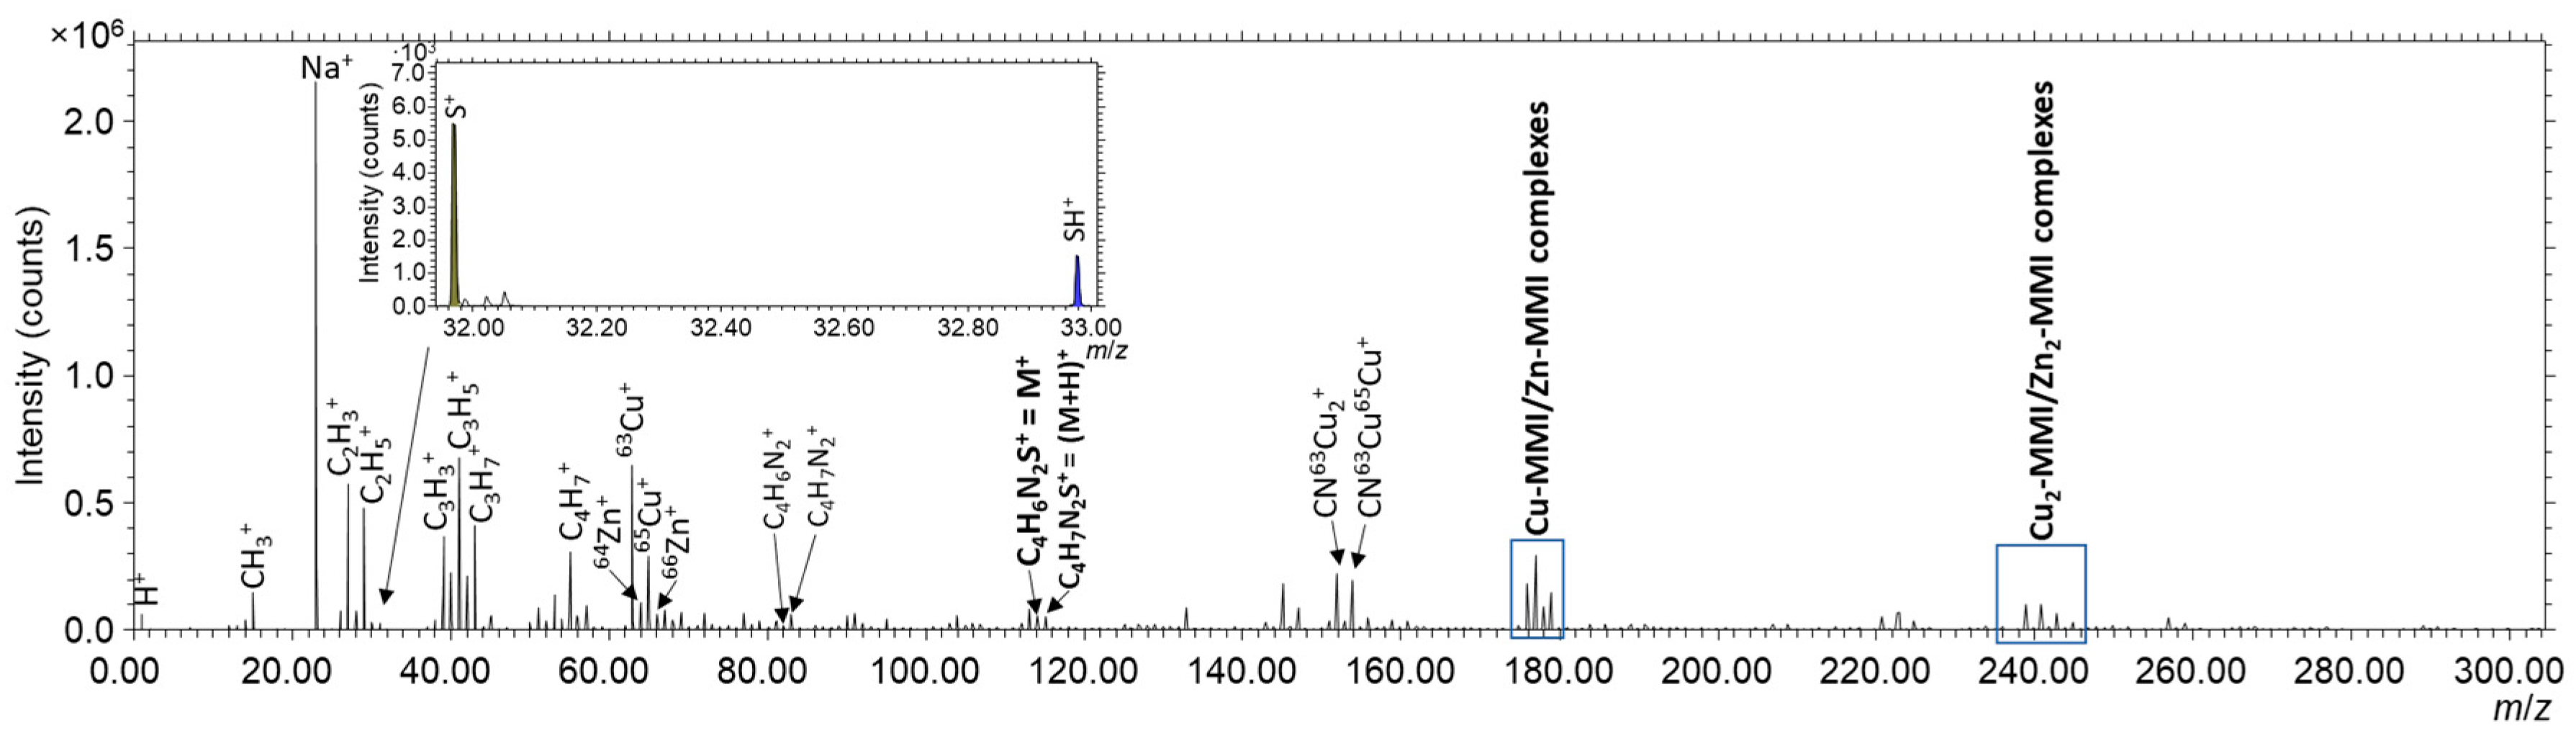
Figure 8 shows a wide m/z range positive-ion ToF-SIMS spectrum of the MMI-treated brass sample. The spectrum contains typical hydrocarbon-related signals, i.e., peaks for CH3+, C2H3+, C2H5+, C3H3+, C3H5+, C3H7+, and C4H7+ (designated in the spectrum). These signals originate in the fragmentation products of the adventitious carbonaceous species (as also detected and discussed above using XPS measurements). The signal for CH3+ could also originate in the fragmentation of the MMI molecule. The most intensive peak in Figure 8 is located at m/z 22.99 and represents Na+, which was most likely trapped within the surface layer during the MMI surface layer build-up and was not removed when rinsing the sample with ultrapure water (the presence of Na+ on the brass sample was due to immersion in NaCl solution). The intensive peak for Na+ occurs due to the low ionization energy of Na.
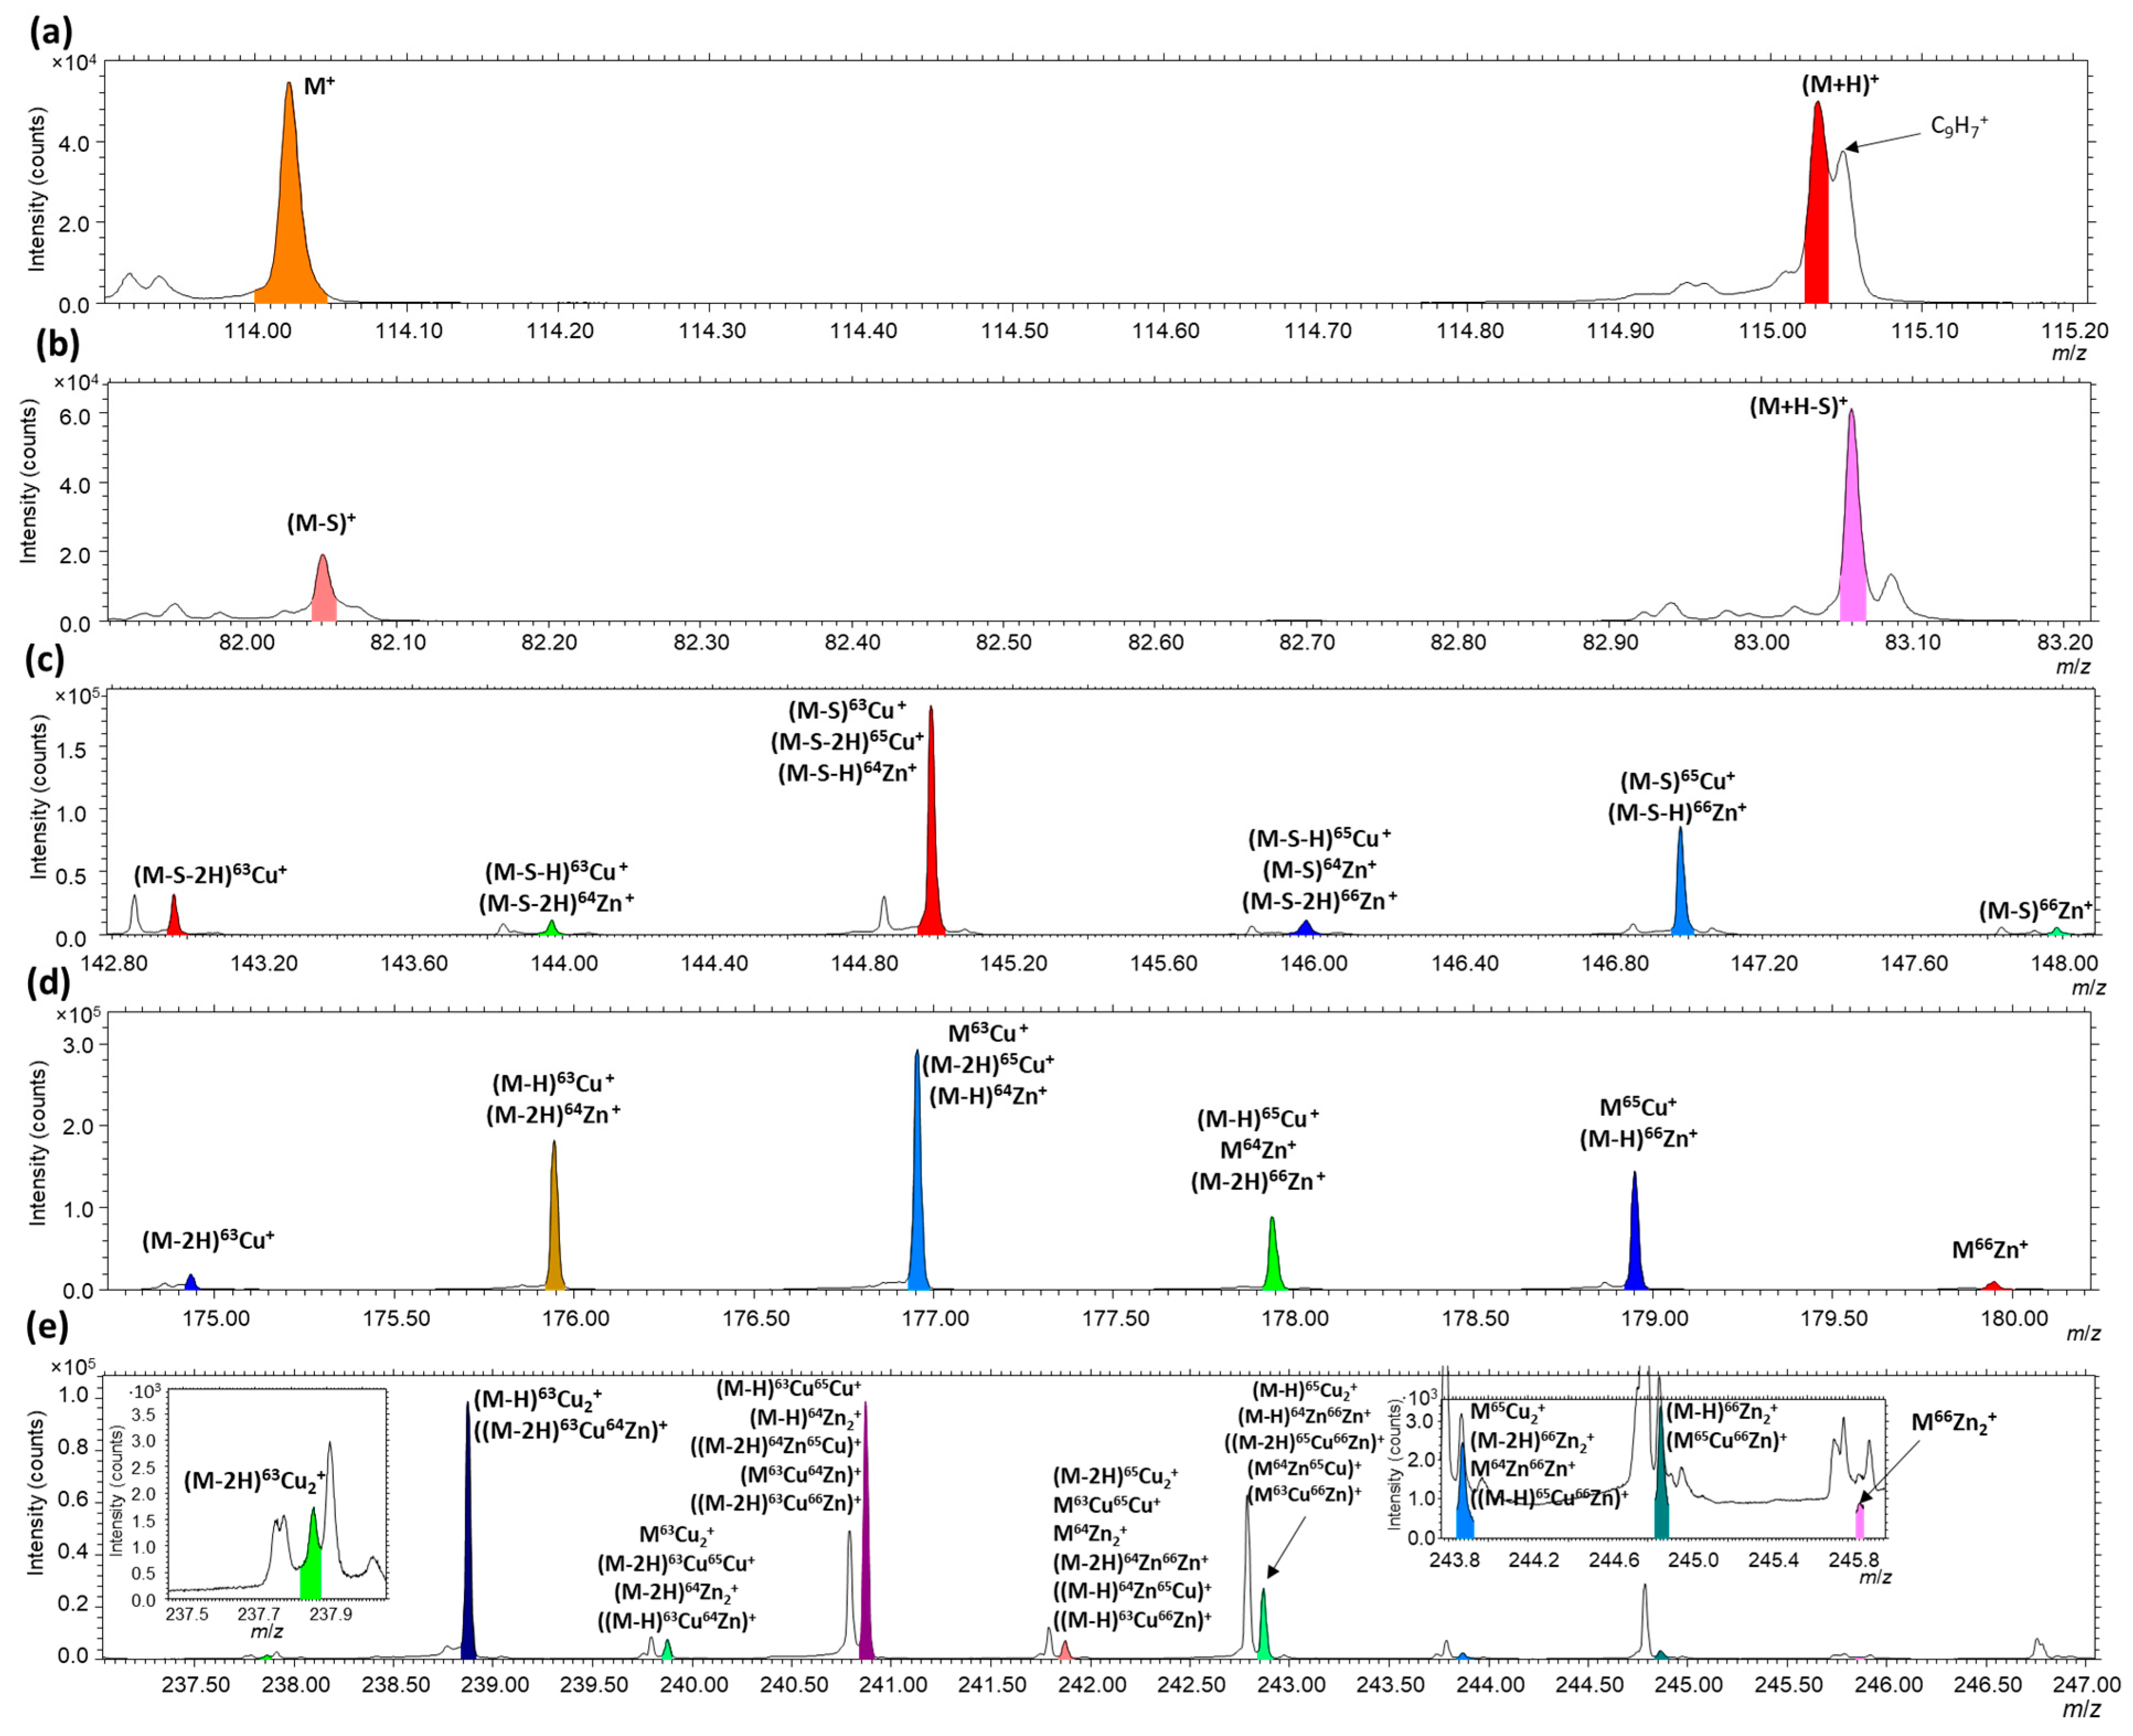
The appearance of the parent ion (M+) peak for C4H6N2S+ and the peak of the parent ion with the addition of one proton ((M+H)+) for C4H7N2S+ (Figure 9a) again clearly demonstrates the adsorption of MMI on the surface. The signal for (M+H)+ partly overlaps with the signal for C9H7+. The presence of the M+ signal characterizes a molecular-specific signal and confirms the presence of the MMI molecule more confidently than the N 1s, S 2p, and S 2s XPS peaks (as explained above). The fragmentation of MMI, with the removal of S, leads to the formation of C4H6N2+ and C4H7N2+ (Figure 9b). S+ and SH+ signals were also clearly developed (see the insert in Figure 8).
The organometallic complexes were suggested with the XPS technique. Brass is composed of Cu and Zn, and the corresponding ions were released during the initial stage of the corrosion process in chloride solution. These ions can connect with the organic compounds, forming organometallic complexes. On that basis, characteristic connections between Cu and Zn ions with the MMI molecule were investigated by ToF-SIMS. The signals for these complexes were clearly expressed (designated in the m/z range in the rectangles in Figure 8) and are analyzed in detail below. Moreover, the CN63Cu2+ and CN63Cu65Cu+ designated in Figure 8 are fragmentation products of these organometallic complexes.
Cu and Zn each have two main isotopes, i.e., 63Cu, 65Cu, 64Zn, and 66Zn. Therefore, the formation of various organometallic complexes can occur. Such combinations are designated in Figure 9c–e. The signals for the organometallic complexes appear at m/z for (M-2H)X+, (M-H)X+, and M-X+, where X is 63Cu or 65Cu, or 64Zn or 66Zn. Moreover, the organometallic complexes are usually also comprised of two metal atoms to form ToF-SIMS signals at m/z for (M-2H)X2+, (M-H)X2+, and M-X2+. Furthermore, mixed organometallic complexes with one Cu and one Zn ion can also occur. The abovementioned possible species formation makes ToF-SIMS analysis difficult due to the possible spectral interferences (which would occur if these species were present simultaneously on the surface, as designated in Figure 9c–e, where for the same signal multiple components are possible, as seen in Table 1).
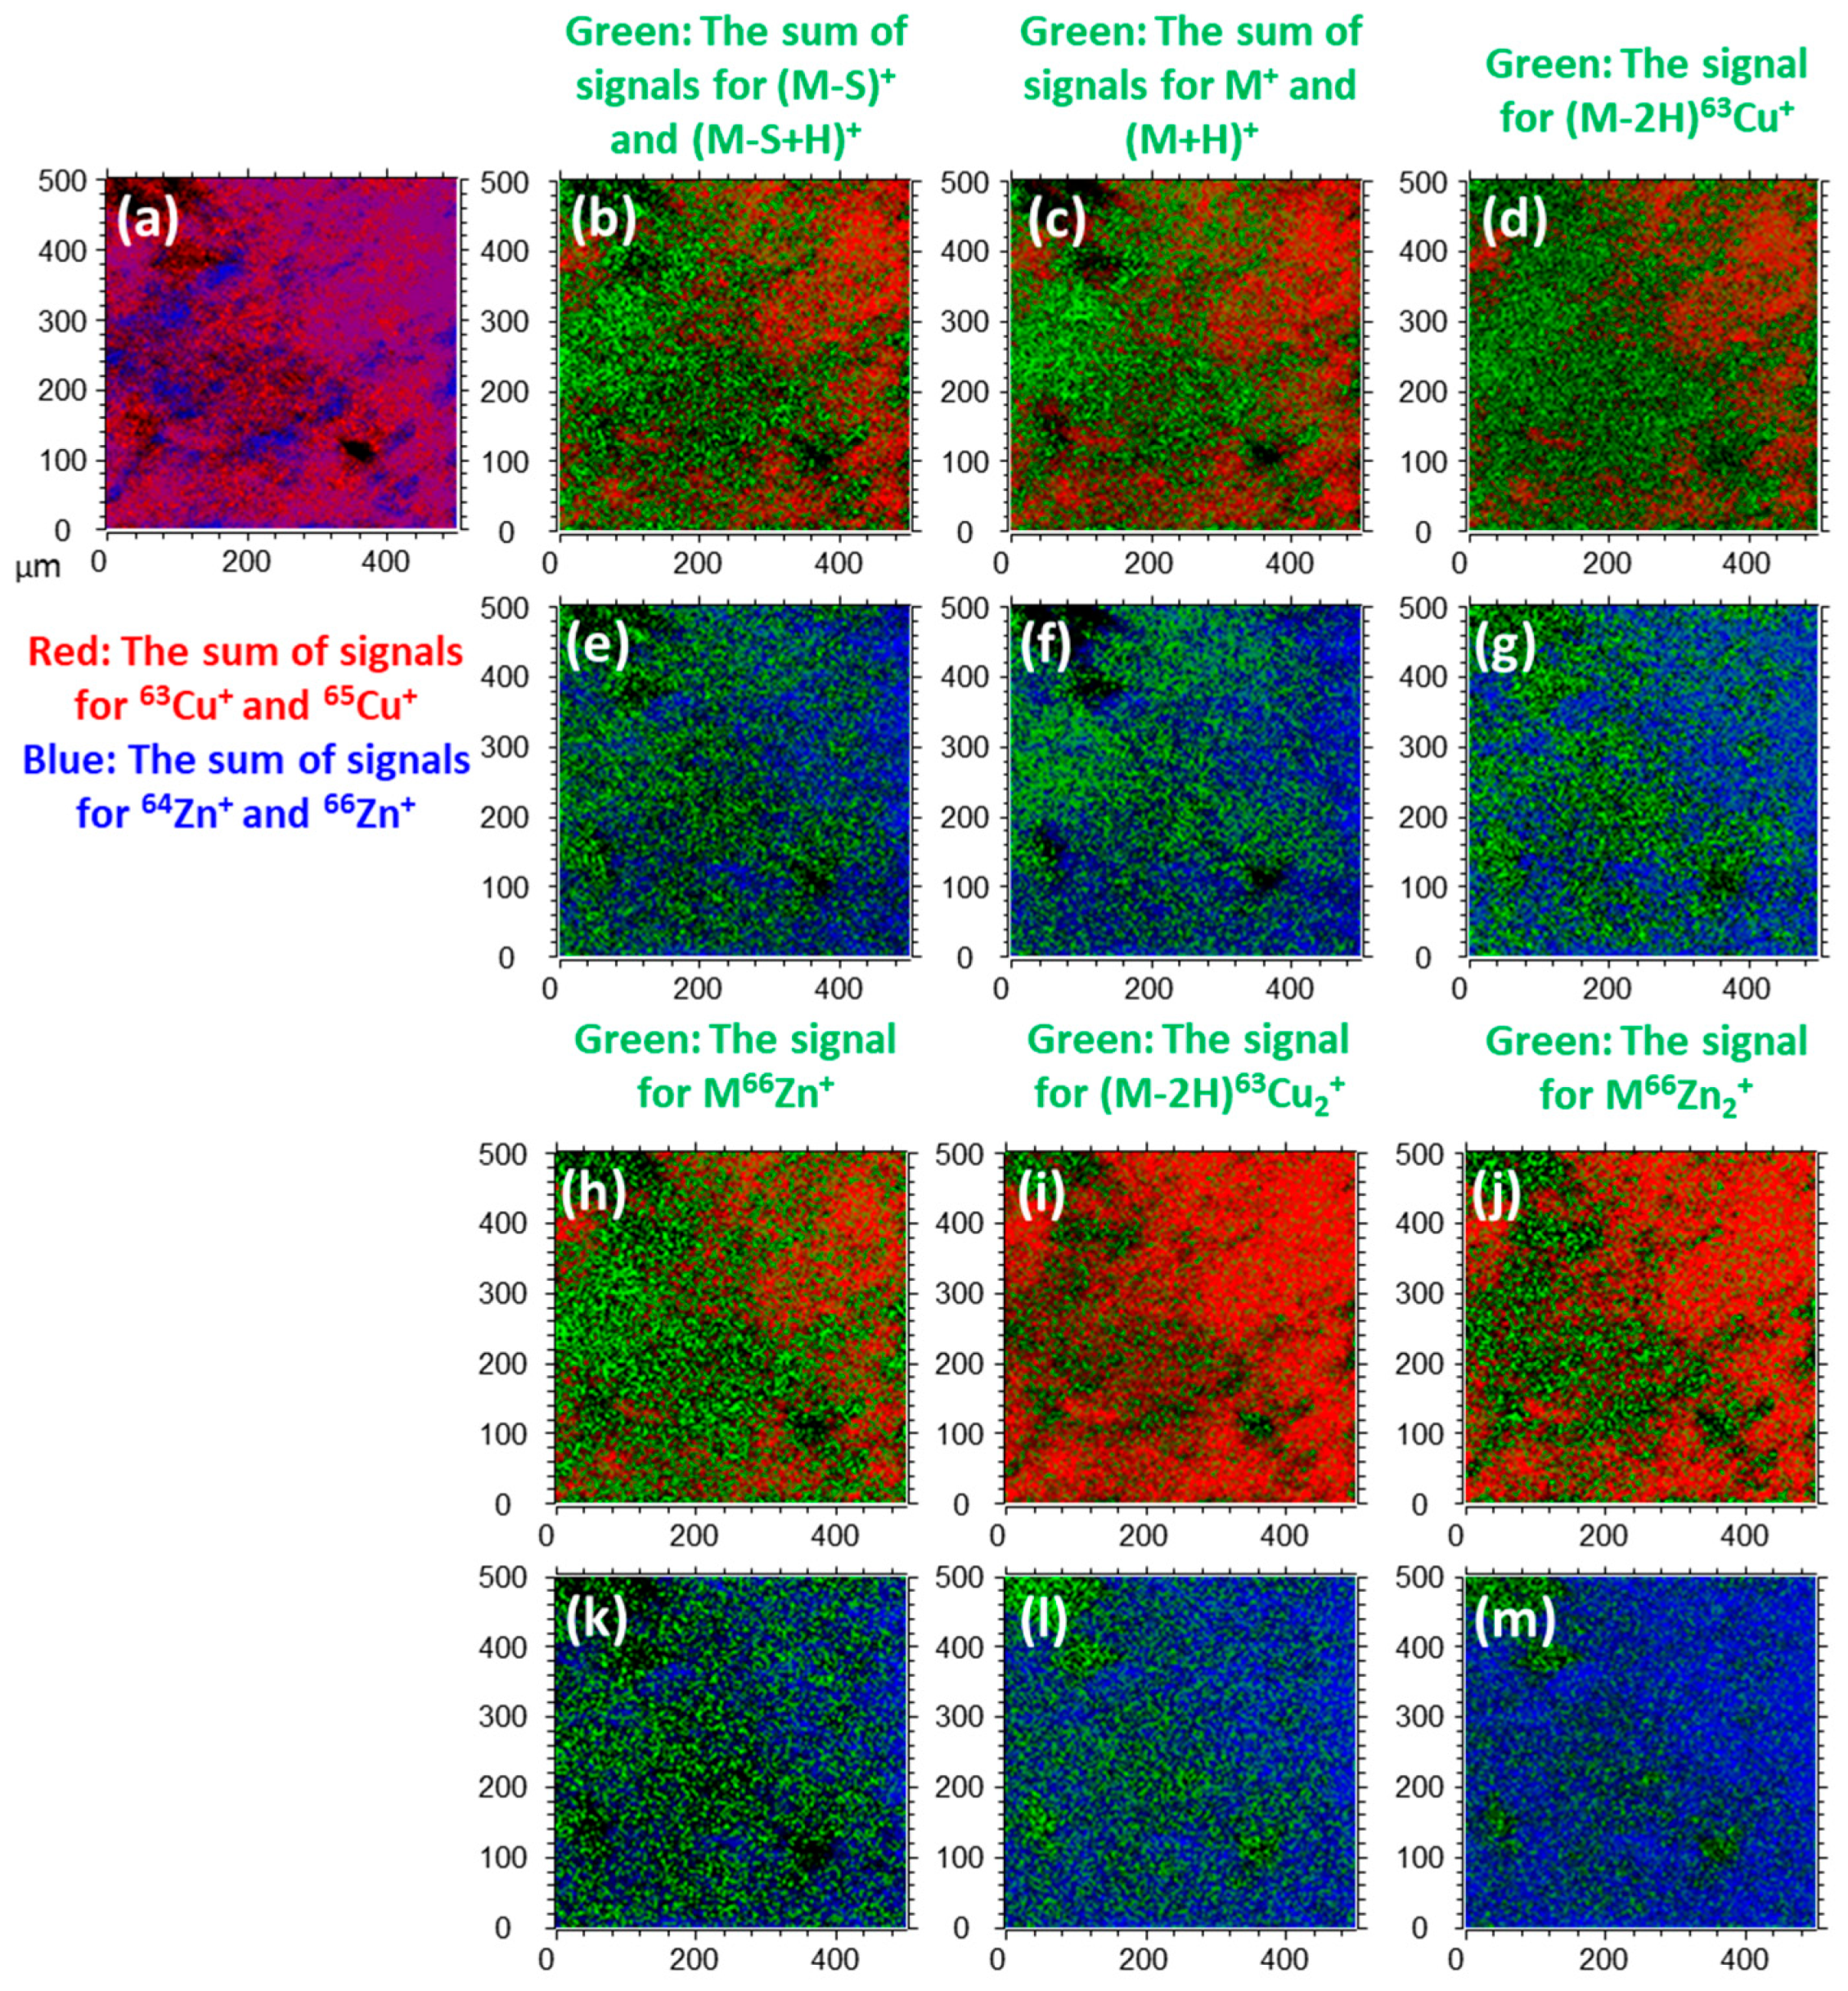
On the other hand, the signals for organometallic complexes without such spectral interferences are (M-2H)63Cu+ in Figure 9d (also (M-S-2H)63Cu+ in Figure 9c) characterizing the MMI-Cu complex, M66Zn+ in Figure 9d (also (M-S)66Zn+ in Figure 9c) characterizing the MMI-Zn complex, (M-2H)63Cu2+ in Figure 9e characterizing the MMI-Cu2 complex, and M66Zn2+ in Figure 9e characterizing the MMI-Zn2 complex. On that basis, these signals were employed for the determination of surface coverage with molecular MMI, and MMI-Cu, MMI-Zn, MMI-Cu2, and MMI-Zn (Figure 10) organometallic complexes and for the thermal stability experiment (Figure 11).
The distribution of Cu and Zn elements in the brass substrate is shown in Figure 10a. Before the overlay figure was constructed, the signals were normalized to the total ion image. The surface is mainly covered with MMI molecules (Figure 10b,c,e,f) and MMI-Cu/Zn complexes (Figure 10d,g,h,k). Moreover, the brass sample surface contains lower amounts of the MMI-Cu2/Zn2 complexes (Figure 10i,j,l,m). On the other hand, a combination of all the species (MMI molecules, MMI-Cu/Zn, and MMI‑Cu2/Zn2 complexes) cover most of the brass surface.
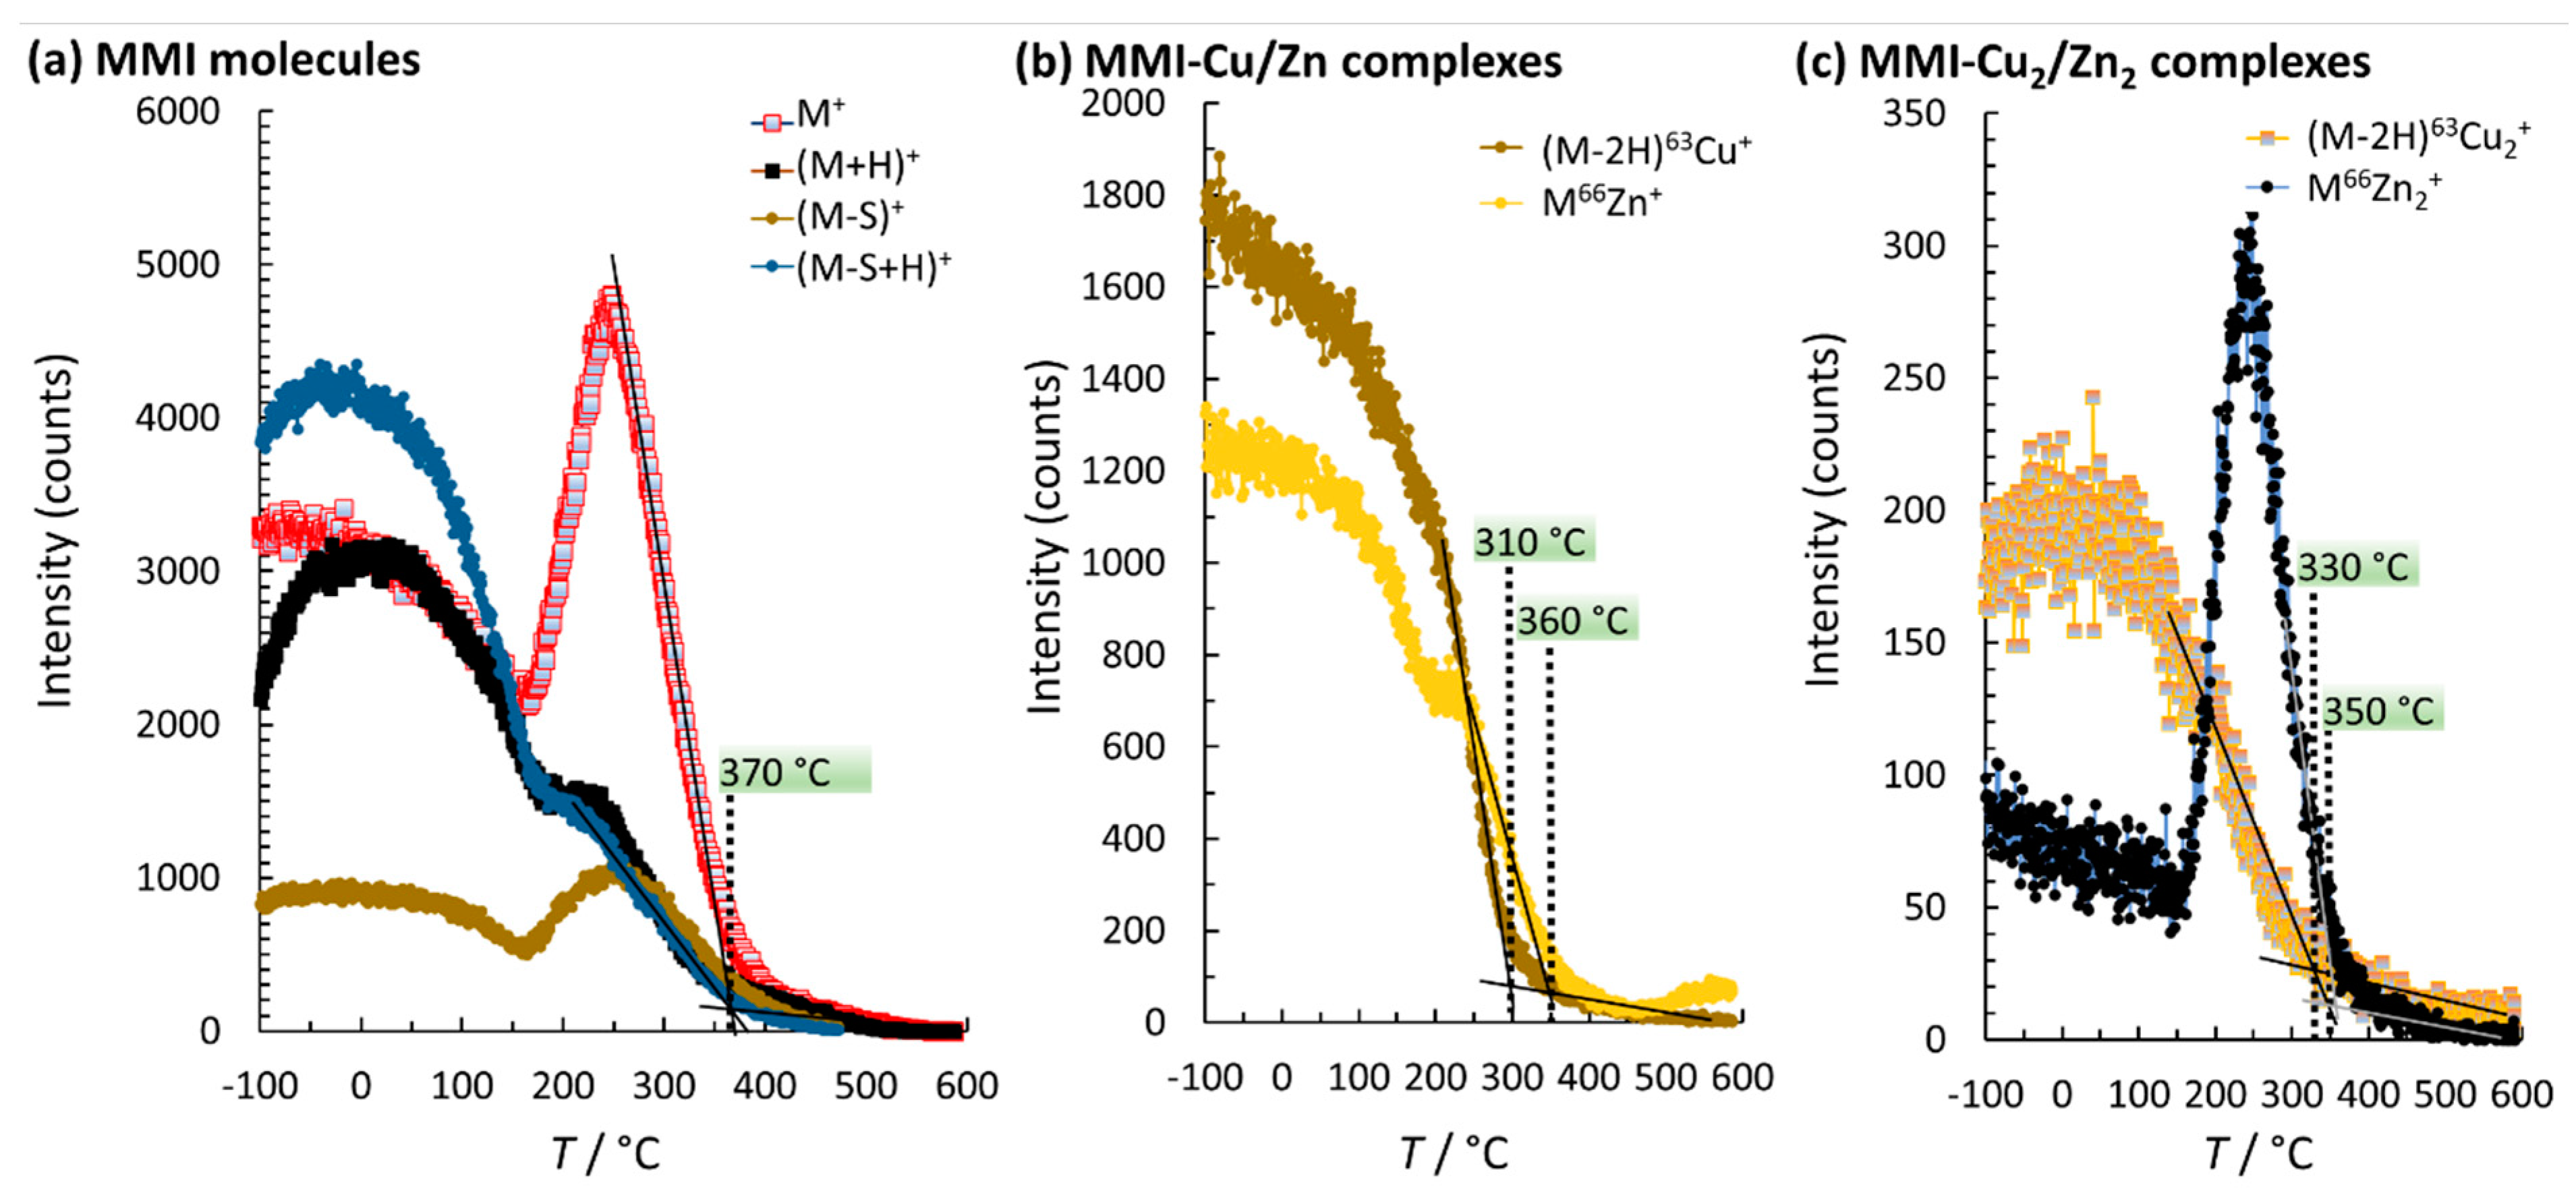
A thermal stability experiment (a cooling/heating ToF-SIMS experiment) for determining the desorption temperature (T) of MMI, MMI‑Cu/Zn, and MMI-Cu2/Zn2 complexes was performed by means of a gradual temperature increase (0.5 °C/s), starting from –100 up to 600 °C (Figure 11). During the temperature increase, the characteristic signals were measured (the same as for ToF-SIMS imaging, which does not suffer from spectral interferences). The desorption T was determined by extrapolation, as presented in Figure 11.
Figure 11a shows the characteristic signals for the MMI molecule, i.e., nonprotonated M+ and (M-S)+ and protonated (M+H)+ and (M-S+H)+. An initial increase in T (up to about 0 °C) resulted in the (M-S)+, (M+H)+, and (M-S+H)+ signals increasing and the signal for M+ becoming relatively noisy. The increase in the surface density of MMI-related species can occur due to the desorption of water molecules from the topmost position of the MMI-treated brass sample in that temperature range. A further increase in T in the range of 150–370 °C increased the signals for M+ and (M-S)+ (in Figure 11a) and also for M66Zn+ (in Figure 11c). The latter is explained by the desorption of the adventitious carbonaceous species that were adsorbed on top of the MMI surface layer, which increased the surface density of the species producing the M+, (M-S)+, and M66Zn+ signals. On the other hand, with the determined desorption T, as presented in Figure 11, the MMI-Cu complex desorbed first (at 310 °C, Figure 11b), followed by the MMI-Cu2 complex (at 330 °C, Figure 11c), the MMI-Zn2 complex (at 350 °C, Figure 11c), and the MMI-Zn complex (at 360 °C, Figure 11b). MMI molecules desorbed at 370 °C (Figure 11a). Therefore, it can be concluded that MMI-related species remain on the brass surface up to 310 °C, and with a further increase in T they start to desorb.
4. Conclusions
This work presents the detailed interface properties of a brass sample immersed in a 3 wt.% NaCl solution containing 1 mM 2-mercapto-1-methylimidazole (MMI). Surface analyses were performed using X-ray photoelectron spectroscopy (XPS) and time-of-flight secondary ion mass spectrometry (ToF-SIMS) techniques.
First, using electrochemical impedance spectroscopy and potentiodynamic curve measurements, the corrosion inhibition ability of MMI was demonstrated. It was shown that MMI can inhibit brass in a 3 wt.% NaCl solution and that it acts as a mixed-type corrosion inhibitor. Moreover, the surface becomes more hydrophilic when the brass sample was covered with an MMI surface layer.
Angle-resolved XPS measurements and gas cluster ion beam sputtering associated with XPS measurements indicated two different MMI molecules bonding in the surface layer, i.e., the topmost position contains MMI molecules in an MMI-organometallic complex, while MMI molecules in the deeper subsurface region (closer to the substrate) have a different environment—most likely not involved in the organometallic complex—and were adsorbed as MMI molecules on the brass sample. Moreover, chlorides were involved in the MMI surface layer.
For the MMI-treated brass sample, a parent ion (C4H6N2S+ = M+) signal and a signal for parent ion with the addition of one proton (C4H7N2S+ = (M+H)+) were clearly developed in the positive-ion ToF‑SIMS spectra. ToF‑SIMS analyses also showed molecular-specific signals for the MMI-Zn/Cu and MMI‑Zn2/Cu2 organometallic complexes for both main isotopes of Cu and Zn, i.e., 63Cu or 65Cu and 64Zn or 66Zn. Special attention was devoted to possible spectral interferences for all possible combinations of organometallic complexes. Using these ToF-SIMS signals without possible spectral interferences, 2D imaging was performed to investigate the spatial distribution of these species on the surface. It was found that most of the surface was covered with a combination of these species, which explains the corrosion inhibition effect of MMI. Moreover, using the molecular-specific signals, the thermal stability of MMI molecules and MMI-Zn/MMI-Cu and MMI-Zn2/MMI-Cu2 organometallic complex were investigated, with the results showing that most of these species desorbed in the 310–370 °C temperature interval.
Funding
This research was funded by Slovenian Research Agency (Grant Nos. P2-0032, J1-9169, and J1-2470)
Institutional Review Board Statement
Not applicable.
Informed Consent Statement
Not applicable.
Data Availability Statement
Data is contained within the article.
Conflicts of Interest
The author declares no conflict of interests.
References
- Koch, G.H.; Brongers, M.P.H.; Thompson, N.G. Corrosion Cost and Preventive Strategies in the Unites States; NACE International: Houston, TX, USA, 2002. [Google Scholar]
- Winograd, N. Gas cluster ion beams for secondary ion mass spectrometry. Annu. Rev. Anal. Chem. 2018, 11, 29–48. [Google Scholar] [CrossRef]
- Popczun, N.J.; Breuer, L.; Wucher, A.; Winograd, N. Ionization probability in molecular secondary ion mass spectrometry: Protonation efficiency of sputtered guanine molecules studied by laser postionization. J. Phys. Chem. C 2017, 121, 8931–8937. [Google Scholar] [CrossRef]
- Legge, E.J.; Paton, K.R.; Wywijas, M.; McMahon, G.; Pemberton, R.; Kumar, N.; Raju, A.P.A.; Dawson, C.P.; Strudwick, A.J.; Bradley, J.W.; et al. Determining the level and location of functional groups on few-layer graphene and their effect on the mechanical properties of nanocomposites. ACS Appl. Mater. Interfaces 2020, 12, 13481–13493. [Google Scholar] [CrossRef] [PubMed]
- De Samber, B.; de Rycke, R.; de Bruyne, M.; Kienhuis, M.; Sandblad, L.; Bohic, S.; Cloetens, P.; Urban, C.; Polerecky, L.; Vincze, L. Effect of sample preparation techniques upon single cell chemical imaging: A practical comparison between synchrotron radiation based X-ray fluorescence (SR-XRF) and nanoscopic secondary ion mass spectrometry (nano-SIMS). Anal. Chim. Acta 2020, 1106, 22–32. [Google Scholar] [CrossRef]
- Gorman, B.L.; Kraft, M.L. High-resolution secondary ion mass spectrometry analysis of cell membranes. Anal. Chem. 2020, 92, 1645–1652. [Google Scholar] [CrossRef] [PubMed] [Green Version]
- Wang, W.X.; Whitehead, S.N. Imaging mass spectrometry allows for neuroanatomic-specific detection of gangliosides in the healthy and diseased brain. Analyst 2020, 145, 2473–2481. [Google Scholar] [CrossRef]
- Matsuda, T.; Suzuki, Y.; Fujisawa, T.; Suga, Y.; Saito, N.; Suda, T.; Yao, I. Imaging mass spectrometry to visualise increased acetylcholine in lungs of asthma model mice. Anal. Bioanal. Chem. 2020, 412, 4327–4341. [Google Scholar] [CrossRef]
- Sämfors, S.; Fletcher, J.S. Lipid diversity in cells and tissue using imaging SIMS. Annu. Rev. Anal. Chem. 2020, 13, 249–271. [Google Scholar] [CrossRef] [Green Version]
- Mas, S.; Torro, A.; Fernández, L.; Bec, N.; Gongora, C.; Larroque, C.; Martineau, P.; de Juan, A.; Marco, S. MALDI imaging mass spectrometry and chemometric tools to discriminate highly similar colorectal cancer tissues. Talanta 2020, 208, 120455. [Google Scholar] [CrossRef] [PubMed]
- Hammann, S.; Scurr, D.J.; Alexander, M.R.; Cramp, L.J.E. Mechanisms of lipid preservation in archaeological clay ceramics revealed by mass spectrometry imaging. Proc. Natl. Acad. Sci. USA 2020, 117, 14688–14693. [Google Scholar] [CrossRef]
- Nakabayashi, R.; Mori, T.; Takeda, N.; Toyooka, K.; Sudo, H.; Tsugawa, H.; Saito, K. Metabolomics with 15N labeling for characterizing missing monoterpene indole alkaloids in plants. Anal. Chem. 2020, 92, 5670–5675. [Google Scholar]
- Castellanos, A.; Hernandez, M.G.; Tomic-Canic, M.; Jozic, I.; Fernandez-Lima, F. Multimodal, in situ imaging of ex vivo human skin reveals decrease of cholesterol sulfate in the Neoepithelium during acute wound healing. Anal. Chem. 2020, 92, 1386–1394. [Google Scholar] [CrossRef] [PubMed]
- Fernández-Vega, A.; Chicano-Gálvez, E.; Prentice, B.M.; Anderson, D.; Priego-Capote, F.; López-Bascón, M.A.; Calderón-Santiago, M.; Avendaño, M.S.; Guzmán-Ruiz, R.; Tena-Sempere, M.; et al. Optimization of a MALDI-Imaging protocol for studying adipose tissue-associated disorders. Talanta 2020, 219, 121184. [Google Scholar]
- He, C.; Song, W.; Weston, T.A.; Tran, C.; Kurtz, I.; Zuckerman, J.E.; Guagliardo, P.; Miner, J.H.; Ivanov, S.V.; Bougoure, J.; et al. Peroxidasin-mediated bromine enrichment of basement membranes. Proc. Natl. Acad. Sci. USA 2020, 117, 15827–15836. [Google Scholar] [CrossRef]
- Barrientos, R.C.; Zhang, Q. Recent advances in the mass spectrometric analysis of glycosphingolipidome—A review. Anal. Chim. Acta 2020, 1132, 134–155. [Google Scholar] [CrossRef]
- Lai, H.; Liu, Q.; Deng, J.; Wen, S.; Liu, Z. Surface chemistry study of Cu-Pb sulfide ore using ToF-SIMS and multivariate analysis. Appl. Surf. Sci. 2020, 518, 146270. [Google Scholar] [CrossRef]
- Gardner, W.; Hook, A.L.; Alexander, M.R.; Ballabio, D.; Cutts, S.M.; Muir, B.W.; Pigram, P.J. ToF-SIMS and machine learning for single-pixel molecular discrimination of an acrylate polymer microarray. Anal. Chem. 2020, 92, 6587–6597. [Google Scholar] [CrossRef] [PubMed]
- Verbeeck, N.; Caprioli, R.M.; van de Plas, R. Unsupervised machine learning for exploratory data analysis in imaging mass spectrometry. Mass Spectrom. Rev. 2020, 39, 245–291. [Google Scholar] [CrossRef] [PubMed]
- Fouda, A.S.; El-Dossoki, F.I.; Shady, I.A. Adsorption and corrosion inhibition behavior of polyethylene glycol on α-brass alloy in nitric acid solution. Green Chem. Lett. Rev. 2018, 11, 67–77. [Google Scholar] [CrossRef] [Green Version]
- Arkhipushkin, I.A.; Shikhaliev, K.S.; Potapov, A.Y.; Sapronova, L.V.; Kazansky, L.P. Inhibition of brass (80/20) by 5-Mercaptopentyl-3-Amino-1,2,4-Triazole in neutral solutions. Metals 2017, 7, 488. [Google Scholar] [CrossRef] [Green Version]
- Radovanović, M.B.; Tasić, Ž.Z.; Mihajlović, M.B.P.; Simonović, A.T.; Antonijević, M.M. Electrochemical and DFT studies of brass corrosion inhibition in 3% NaCl in the presence of environmentally friendly compounds. Sci Rep. 2019, 9, 1–16. [Google Scholar] [CrossRef] [PubMed] [Green Version]
- Altaf, F.; Qureshi, R.; Yaqub, A.; Ahmed, S. Electrochemistry of corrosion mitigation of brasses by azoles in basic medium. Chem. Pap. 2019, 73, 1221–1235. [Google Scholar] [CrossRef]
- Sha, J.-Y.; Ge, H.-H.; Wan, C.; Wang, L.-T.; Xie, S.-Y.; Meng, X.-J.; Zhao, Y.-Z. Corrosion inhibition behaviour of sodium dodecyl benzene sulphonate for brass in an Al2O3 nanofluid and simulated cooling water. Corros. Sci. 2019, 148, 123–133. [Google Scholar] [CrossRef]
- Li, Y.; He, J.B.; Zhang, M.; He, X.L. Corrosion inhibition effect of sodium phytate on brass in NaOH media. Potential-resolved formation of soluble corrosion products. Corros. Sci. 2013, 74, 116–122. [Google Scholar] [CrossRef]
- Rochdi, A.; Kassou, O.; Dkhireche, N.; Touir, R.; el Bakri, M.; Touhami, M.E.; Sfaira, M.; Mernari, B.; Hammouti, B. Inhibitive properties of 2,5-bis(n-methylphenyl)-1,3,4-oxadiazole and biocide on corrosion, biocorrosion and scaling controls of brass in simulated cooling water. Corros. Sci. 2014, 80, 442–452. [Google Scholar] [CrossRef]
- Yohai, L.; Vázquez, M.; Valcarce, M.B. Brass corrosion in tap water distribution systems inhibited by phosphate ions. Corros. Sci. 2011, 53, 1130–1136. [Google Scholar] [CrossRef] [Green Version]
- Jie, H.; Xu, Q.; Wei, L.; Min, Y. Etching and heating treatment combined approach for superhydrophobic surface on brass substrates and the consequent corrosion resistance. Corros. Sci. 2016, 102, 251–258. [Google Scholar] [CrossRef]
- Fan, H.-Q.; Shi, D.-D.; Ding, M.-M.; Li, M.-C.; Cheng, Y.F.; Li, Q. Preparation of (3-mercaptopropyl)trimethoxylsilane film on brass and its corrosion resistance in natural seawater. Prog. Org. Coat. 2020, 138, 105392. [Google Scholar] [CrossRef]
- Ouassir, J.; Bennis, H.; Benqlilou, H.; Galai, M.; Hassani, Y.; Touhami, M.E.; Berrami, K.; Lemyasser, M. EIS study on erosion–corrosion behavior of BA35 and BA22 brasses in drinking water at various impingement angles. Colloids Surf. A: Phys. Eng. Asp. 2020, 586, 124151. [Google Scholar] [CrossRef]
- Fernández, S.A.; Alvarez, M.G. Passivity breakdown and stress corrosion cracking of α-brass in sodium nitrate solutions. Corros. Sci. 2011, 53, 82–88. [Google Scholar] [CrossRef]
- Du, X.S.; Su, Y.J.; Li, J.X.; Qiao, L.J.; Chu, W.Y. Inhibitive effects and mechanism of phosphates on the stress corrosion cracking of brass in ammonia solutions. Corros. Sci. 2012, 60, 69–75. [Google Scholar] [CrossRef]
- Rault, V.; Vignal, V.; Krawiec, H.; Tadjoa, O. Corrosion behaviour of heavily deformed pearlitic and brass-coated pearlitic steels in sodium chloride solutions. Corros. Sci. 2014, 86, 275–284. [Google Scholar] [CrossRef]
- Zhang, X.; Liu, X.; Wallinder, I.O.; Leygraf, C. The protective role of hydrozincite during initial corrosion of a Cu40Zn alloy in chloride-containing laboratory atmosphere. Corros. Sci. 2016, 103, 20–29. [Google Scholar] [CrossRef] [Green Version]
- Finšgar, M. Surface analysis of 2-mercapto-1-methylimidazole adsorbed on copper by X-ray photoelectron spectroscopy. Spectrochim. Acta Part. A Mol. Biomol. Spectrosc. 2018, 190, 290–297. [Google Scholar] [CrossRef] [PubMed]
- Radovanovic, M.B.; Antonijevic, M.M. Inhibition of brass corrosion by 2-Mercapto-1-methylimidazole in weakly alkaline solution. J. Mater. Eng. Perform. 2016, 25, 921–937. [Google Scholar] [CrossRef]
- Larabi, L.; Benali, O.; Mekelleche, S.M.; Harek, Y. 2-Mercapto-1-methylimidazole as corrosion inhibitor for copper in hydrochloric acid. Appl. Surf. Sci. 2006, 253, 1371–1378. [Google Scholar] [CrossRef]
- Dafali, A.; Hammouti, B.; Aouniti, A.; Mokhlisse, R.; Kertit, S.; Elkacemi, K. 2-Mercapto-1-methylimidazole as corrosion inhibitor of copper in aerated 3% NaCl solution. Ann. De Chim. Sci. Des. Mater. 2000, 25, 437–446. [Google Scholar] [CrossRef]
- Omar, B.; Mokhtar, O. Inhibition of cold rolled steel corrosion in sulphuric acid solution by 2-mercapto-1-methylimidazole: Time and temperature effects treatments. Arab. J. Chem. 2011, 4, 443–448. [Google Scholar] [CrossRef] [Green Version]
- Benali, O.; Larabi, L.; Traisnel, M.; Gengembre, L.; Harek, Y. Electrochemical, theoretical and XPS studies of 2-mercapto-1-methylimidazole adsorption on carbon steel in 1 M HClO4. Appl. Surf. Sci. 2007, 253, 6130–6139. [Google Scholar] [CrossRef]
- Finšgar, M. Electrochemical, 3D topography, XPS, and ToF-SIMS analyses of 4-methyl-2-phenylimidazole as a corrosion inhibitor for brass. Corros. Sci. 2020, 169, 108632. [Google Scholar] [CrossRef]
- Senthil, R.A.; Theerthagiri, J.; Madhavan, J.; Arof, A.K.M. High performance dye-sensitized solar cell based on 2-mercaptobenzimidazole doped poly(vinylidinefluoride-co-hexafluoropropylene) based polymer electrolyte. J. Macromol. Sci. Part. A 2016, 53, 245–251. [Google Scholar] [CrossRef]
- Andrews, P.C.; Deacon, G.B.; Junk, P.C.; Spiccia, N.F. Exploration of solvent free and/or microwave assisted syntheses of bismuth(iii) thiolates. Green Chem. 2007, 9, 1319–1327. [Google Scholar] [CrossRef]
- Jankowska, I.; Ławniczak, P.; Pogorzelec-Glaser, K.; Łapiński, A.; Pankiewicz, R.; Tritt-Goc, J. Cellulose microfibers surface treated with imidazole as new proton conductors. Mater. Chem. Phys. 2020, 239, 122056. [Google Scholar] [CrossRef]
- Iwan, A.; Malinowski, M.; Sikora, A.; Tazbir, I.; Pasciak, G. Studies of bibenzimidazole and imidazole influence on electrochemical properties of polymer fuel cells. Electrochim. Acta 2015, 164, 143–153. [Google Scholar] [CrossRef]
- Materazzi, S.; Vecchio, S.; Wo, L.W.; Curtis, S.D. TG–MS and TG–FTIR studies of imidazole-substituted coordination compounds: Co(II) and Ni(II)-complexes of bis(1-methylimidazol-2-yl)ketone. Thermochim. Acta 2012, 543, 183–187. [Google Scholar] [CrossRef]
- Sudha, S.; Karabacak, M.; Kurt, M.; Cinar, M.; Sundaraganesan, N. Molecular structure, vibrational spectroscopic, first-order hyperpolarizability and HOMO, LUMO studies of 2-aminobenzimidazole. Spectrochim. Acta Part. A Mol. Biomol. Spectrosc. 2011, 84, 184–195. [Google Scholar] [CrossRef]
- Erdogdu, Y.; Eskioǧlu, B.; Güllüoǧlu, M.T. Theoretical investigations on the molecular structure and vibrational spectral analysis of 4-methyl 2-phenylimidazole. Opt. Spectrosc. 2012, 113, 596–606. [Google Scholar] [CrossRef]
- Koglin, E.; Witte, E.G.; Meier, R.J. The vibrational spectra of metabolites of methabenzthiazuron: 2-amino-benzothiazole and 2-(methylamino)benzothiazole. Vib. Spectrosc. 2003, 33, 49–61. [Google Scholar] [CrossRef]
- Böhlig, H.; Ackermann, M.; Billes, F.; Kudra, M. Vibrational analysis of benzothiazoline-2-thione. Spectrochim. Acta Part. A: Mol. Biomol. Spectrosc. 1999, 55, 2635–2646. [Google Scholar]
- El-Azhary, A.A. A DFT study of the geometries and vibrational spectra of indene and some of its heterocyclic analogues, benzofuran, benzoxazole, bensothiophene, benzothiazole, indole and indazole. Spectrochim. Acta Part. A Mol. Biomol. Spectrosc. 1999, 55, 2437–2446. [Google Scholar] [CrossRef]
- Abdureyim, A.; Okudaira, K.K.; Harada, Y.; Masuda, S.; Aoki, M.; Seki, K.; Ito, E.; Ueno, N. Characterization of 4-mercaptohydrocynnamic acid self-assembled film on Au(111) by means of X-ray photoelectron spectroscopy. J. Electron. Spectrosc. Relat. Phenom. 2001, 114, 371–374. [Google Scholar] [CrossRef]
- Castner, D.G.; Hinds, K.; Grainger, D.W. X-ray photoelectron spectroscopy sulfur 2p study of organic thiol and disulfide binding interactions with gold surfaces. Langmuir 1996, 12, 5083–5086. [Google Scholar] [CrossRef]
- Rosink, J.J.W.M.; Blauw, M.A.; Geerligs, L.J.; van der Drift, E.; Rousseeuw, B.A.C.; Radelaar, S.; Sloof, W.G.; Fakkeldij, E.J.M. Self-assembly of π-conjugated azomethine oligomers by sequential deposition of monomers from solution. Langmuir 2000, 16, 4547–4553. [Google Scholar] [CrossRef]
- Lu, H.B.; Campbell, C.T.; Castner, D.G. Attachment of functionalized poly(ethylene glycol) films to gold surfaces. Langmuir 2000, 16, 1711–1718. [Google Scholar] [CrossRef]
- Laiho, T.; Leiro, J.A.; Heinonen, M.H.; Mattila, S.S.; Lukkari, J. Photoelectron spectroscopy study of irradiation damage and metal-sulfur bonds of thiol on silver and copper surfaces. J. Electron. Spectrosc. Relat. Phenom. 2005, 142, 105–112. [Google Scholar] [CrossRef]
- Tan, Y.S.; Srinivasan, M.P.; Pehkonen, S.O.; Chooi, S.Y.M. Self-assembled organic thin films on electroplated copper for prevention of corrosion. J. Vac. Sci. Technol. A Vac. Surf. Film. 2004, 22, 1917–1925. [Google Scholar] [CrossRef]
- Laibinis, P.E.; Whitesides, G.M.; Allara, D.L.; Tao, Y.T.; Parikh, A.N.; Nuzzo, R.G. Comparison of the structures and wetting properties of self-assembled monolayers of n-alkanethiols on the coinage metal surfaces, copper, silver, and gold. J. Am. Chem. Soc. 1991, 113, 7152–7167. [Google Scholar] [CrossRef]
- Fonder, G.; Laffineur, F.; Delhalle, J.; Mekhalif, Z. Alkanethiol-oxidized copper interface: The critical influence of concentration. J. Colloid Interface Sci. 2008, 326, 333–338. [Google Scholar] [CrossRef]
- Hosseini, M.G.; Shahrabi, T.; Nichols, R.J. Characterization of mercaptobenzimidazole adsorption on an Au(111) electrode. Iran. J. Sci. Technol. Trans. A 2005, 29, 49–63. [Google Scholar]
- Finšgar, M. 2-Mercaptobenzimidazole as a copper corrosion inhibitor: Part II. Surface analysis using X-ray photoelectron spectroscopy. Corros. Sci. 2013, 72, 90–98. [Google Scholar]
- Cornette, P.; Zanna, S.; Seyeux, A.; Costa, D.; Marcus, P. The native oxide film on a model aluminium-copper alloy studied by XPS and ToF-SIMS. Corros. Sci. 2020, 174, 108837. [Google Scholar] [CrossRef]
- Moulder, W.F.S.J.F.; Sobol, P.E.; Bomben, K.D. Handbook of X-Ray Photoelectron Spectroscopy; Physical Electronics Inc.: Eden Prairie, MN, USA, 1995. [Google Scholar]
- Finšgar, M.; Peljhan, S.; Kokalj, A.; Kovač, J.; Milošev, I. Determination of the Cu2O thickness on BTAH-inhibited copper by reconstruction of auger electron spectra. J. Electrochem. Soc. 2010, 157, C295–C301. [Google Scholar] [CrossRef]
- Finšgar, M. X-ray excited Auger Cu L3L4,5M4,5 spectra measured at low take-off angles as a fingerprint for a Cu-organics connection. J. Electron. Spectrosc. Relat. Phenom. 2018, 222, 10–14. [Google Scholar] [CrossRef]
Figure 1.
Structure of the MMI compound showing lone electron pairs.

Figure 2.
(a–c) Electrochemical impedance spectroscopy (EIS) measurements (symbols) and fitted data (solid lines) for (a) Nyquist, (b) modulus impedance, and (c) phase impedance spectra, at different immersion times, and (d) the corresponding Rp values obtained from the EIS fitting procedures. The insert in (a) shows the equivalent electrical circuit (EEC) used to fit the measured data. (e) Potentiodynamic curve measurements for brass after 72 h of immersion.

Figure 3.
(a) The shape of the water droplet, (b) atomic force microscopy (AFM) 3D profile, and (c) FE-SEM image for the brass sample immersed for 1 month in 3 wt.% NaCl solution containing 1 mM MMI; (d) attenuated total reflectance–Fourier-transform infrared spectroscopy (ATR-FTIR) spectra of the brass sample immersed for 1 month in noninhibited and inhibited 3 wt.% NaCl solution.

Figure 4.
XPS survey spectra with designated peaks for the MMI-treated brass sample and for the sputter‑cleaned brass.
Figure 4.
XPS survey spectra with designated peaks for the MMI-treated brass sample and for the sputter‑cleaned brass.

Figure 5.
High-resolution (HR) angled-resolved (AR) XPS spectra of (a) C 1s, (b) N 1s, (c) O 1s, (d) Cl 2p, (e) S 2p, (f) Cu 2p, (g) XPS‑excited Auger Cu L3M4,5M4,5, and (h) Zn 2p.
Figure 5.
High-resolution (HR) angled-resolved (AR) XPS spectra of (a) C 1s, (b) N 1s, (c) O 1s, (d) Cl 2p, (e) S 2p, (f) Cu 2p, (g) XPS‑excited Auger Cu L3M4,5M4,5, and (h) Zn 2p.

Figure 6.
Spectra measured during depth profiling using gas cluster ion beam (GCIB) and monoatomic Ar+ sputter beams for (a) C 1s, (b) N 1s, (c) O 1s, (d) Cl 2p, (e) S 2p, (f) Cu 2p, (g) XPS‑excited Auger Cu L3M4,5M4,5, and (h) Zn 2p. The lowest spectra represent HR XPS measurements before sputtering.

Figure 7.
The change in atomic concentration during depth profiling using different sputter beams: (a) 5 keV Ar2000+, (b) 5 keV Ar1000+, (c) 10 keV Ar2000+, and (d) monoatomic 5 keV Ar+.
Figure 7.
The change in atomic concentration during depth profiling using different sputter beams: (a) 5 keV Ar2000+, (b) 5 keV Ar1000+, (c) 10 keV Ar2000+, and (d) monoatomic 5 keV Ar+.

Figure 8.
The positive-ion time-of-flight secondary ion mass spectrometry (ToF-SIMS) spectrum in the m/z 0–300 range measured on the surface of the MMI‑treated brass sample.
Figure 8.
The positive-ion time-of-flight secondary ion mass spectrometry (ToF-SIMS) spectrum in the m/z 0–300 range measured on the surface of the MMI‑treated brass sample.

Figure 9.
Positive-ion ToF-SIMS spectra of the signals characterizing (a) parent ions, (b) parent ions with the loss of S, (c) organometallic complexes with one metal atom and with the loss of S, (d) organometallic complexes with one metal atom, and (e) organometallic complexes with two metal atoms.

Figure 10.
ToF-SIMS imaging to characterize the distribution of different species (green) on the brass sample using different signals: (b,e) the sum of (M-S)+ and (M-S-H)+ and (c,f) the sum of M+ and (M+H)+ signals for the MMI molecules; (d,g) (M-2H)63Cu+ for MMI-Cu, h,k) M66Zn+ for MMI-Zn, (i,l) (M-2H)63Cu2+ for MMI‑Cu2; and (j,m) M66Zn+ for MMI-Zn2 complex. Figures (b–d,h–j) represent copper (red) and Figures (e–g,k–m) represent Zn (blue) as the underlying substrate. The figure in (a) shows the distribution of Cu and Zn in the brass sample.

Figure 11.
The thermal stability of (a) MMI molecules, (b) MMI-Cu/Zn complexes, and (c) MMI-Cu2/Zn2 complexes.
Figure 11.
The thermal stability of (a) MMI molecules, (b) MMI-Cu/Zn complexes, and (c) MMI-Cu2/Zn2 complexes.


Table 1.
The m/z values for the parent ion and possible combinations of MMI-complexes with two metal ions with isotopes 63Cu and 65Cu, and 64Zn and 66Zn, showing possible spectral interferences.
Table 1.
The m/z values for the parent ion and possible combinations of MMI-complexes with two metal ions with isotopes 63Cu and 65Cu, and 64Zn and 66Zn, showing possible spectral interferences.
| Parent Ion | m/z | (MMI63Cu2)+ Complexes | m/z | (MMI64Zn65Cu)+ Complexes | m/z |
|---|---|---|---|---|---|
| (M)+ = C4H6N2S+ | 114.03 | ((M-2H)63Cu2)+ = (C4H4N2S63Cu2)+ | 237.87 | ((M-2H)64Zn65Cu)+ = (C4H4N2S64Zn65Cu)+ | 240.87 |
| (M+H)+ = C4H7N2S+ | 115.03 | ((M-H)63Cu2)+ = (C4H5N2S63Cu2)+ | 238.88 | ((M-H)64Zn65Cu)+ = (C4H5N2S64Zn65Cu)+ | 241.87 |
| - | - | (M63Cu2)+ = (C4H6N2S63Cu2)+ | 239.88 | (M64Zn65Cu)+ = (C4H6N2S64Zn65Cu)+ | 242.88 |
| - | |||||
| (MMI63Cu)+ Complexes | - | (MMI63Cu64Zn)+ Complexes | - | (MMI65Cu2)+ complexes | - |
| ((M-2H)63Cu)+ = (C4H4N2S63Cu)+ | 174.94 | ((M-2H)63Cu64Zn)+ = (C4H4N2S63Cu64Zn)+ | 238.87 | ((M-2H)65Cu2)+ = (C4H4N2S65Cu2)+ | 241.87 |
| ((M-H)63Cu)+ = (C4H5N2S63Cu)+ | 175.95 | ((M-H)63Cu64Zn)+ = (C4H5N2S63Cu64Zn)+ | 239.88 | ((M-H)65Cu2)+ = (C4H5N2S65Cu2)+ | 242.87 |
| (M63Cu)+ = (C4H6N2S63Cu)+ | 176.95 | (M63Cu64Zn)+ = (C4H6N2S63Cu64Zn)+ | 240.88 | (M65Cu2)+ = (C4H6N2S65Cu2)+ | 243.88 |
| - | |||||
| (MMI65Cu)+ Complexes | - | (MMI63Cu65Cu)+ Complexes | - | (MMI64Zn66Zn)+ Complexes | - |
| ((M-2H)65Cu)+ = (C4H4N2S65Cu)+ | 176.94 | ((M-2H)63Cu65Cu)+ = (C4H4N2S63Cu65Cu)+ | 239.87 | ((M-2H)64Zn66Zn)+ = (C4H4N2S64Zn66Zn)+ | 241.86 |
| ((M-H)65Cu)+ = (C4H5N2S65Cu)+ | 177.95 | ((M-H)63Cu65Cu)+ = (C4H5N2S63Cu65Cu)+ | 240.87 | ((M-H)64Zn66Zn)+ = (C4H5N2S64Zn66Zn)+ | 242.87 |
| (M65Cu)+ = (C4H6N2S65Cu)+ | 178.95 | (M63Cu65Cu)+ = (C4H6N2S63Cu65Cu)+ | 241.88 | (M64Zn66Zn)+ = (C4H6N2S64Zn66Zn)+ | 243.88 |
| - | |||||
| (MMI64Zn)+ Complexes | - | (MMI63Cu66Zn)+ Complexes | - | (MMI65Cu66Zn)+ Complexes | - |
| ((M-2H)64Zn)+ = (C4H4N2S64Zn)+ | 175.94 | ((M-2H)63Cu66Zn)+ = (C4H4N2S63Cu66Zn)+ | 240.87 | ((M-2H)65Cu66Zn)+ = (C4H4N2S64Zn66Zn)+ | 242.86 |
| ((M-H)64Zn)+ = (C4H5N2S64Zn)+ | 176.95 | ((M-H)63Cu66Zn)+ = (C4H5N2S63Cu66Zn)+ | 241.87 | ((M-H)65Cu66Zn)+ = (C4H5N2S64Zn66Zn)+ | 243.87 |
| (M64Zn)+ = (C4H6N2S64Zn)+ | 177.95 | (M63Cu66Zn)+ = (C4H6N2S63Cu66Zn)+ | 242.88 | (M65Cu66Zn)+ = (C4H6N2S64Zn66Zn)+ | 244.88 |
| - | |||||
| (MMI66Zn)+ Complexes | - | (MMI64Zn2)+ Complexes | - | (MMI66Zn2)+ Complexes | - |
| ((M-2H)66Zn)+ = (C4H4N2S66Zn)+ | 177.94 | ((M-2H)64Zn2)+ = (C4H4N2S64Zn2)+ | 239.87 | ((M-2H)66Zn2)+ = (C4H4N2S66Zn2)+ | 243.86 |
| ((M-H)66Zn)+ = (C4H5N2S66Zn)+ | 178.94 | ((M-H)64Zn2)+ = (C4H5N2S64Zn2)+ | 240.88 | ((M-H)66Zn2)+ = (C4H5N2S66Zn2)+ | 244.87 |
| (M66Zn)+ = (C4H6N2S66Zn)+ | 179.95 | (M64Zn2)+ = (C4H6N2S64Zn2)+ | 241.88 | (M66Zn2)+ = (C4H6N2S66Zn2)+ | 245.88 |
Publisher’s Note: MDPI stays neutral with regard to jurisdictional claims in published maps and institutional affiliations. |
© 2021 by the author. Licensee MDPI, Basel, Switzerland. This article is an open access article distributed under the terms and conditions of the Creative Commons Attribution (CC BY) license (http://creativecommons.org/licenses/by/4.0/).
Share and Cite
MDPI and ACS Style
Finšgar, M. The Interface Characterization of 2-Mercapto-1-methylimidazole Corrosion Inhibitor on Brass. Coatings 2021, 11, 295. https://0-doi-org.brum.beds.ac.uk/10.3390/coatings11030295
AMA Style
Finšgar M. The Interface Characterization of 2-Mercapto-1-methylimidazole Corrosion Inhibitor on Brass. Coatings. 2021; 11(3):295. https://0-doi-org.brum.beds.ac.uk/10.3390/coatings11030295
Chicago/Turabian StyleFinšgar, Matjaž. 2021. "The Interface Characterization of 2-Mercapto-1-methylimidazole Corrosion Inhibitor on Brass" Coatings 11, no. 3: 295. https://0-doi-org.brum.beds.ac.uk/10.3390/coatings11030295
Note that from the first issue of 2016, this journal uses article numbers instead of page numbers. See further details here.