
In-Process Monitoring of Laser Surface Modification


1
The Manufacturing Technology Centre, Coventry CV7 9JU, UK
2
Hilase Centre, Institute of Physics, Academy of Sciences of the Czech Republic, Za Radnici 828, 25241 Dolni Brezany, Czech Republic
3
Department of Mechanical and Maintenance Engineering, Fourah Bay College, University of Sierra Leone, Freetown, Sierra Leone
*
Author to whom correspondence should be addressed.
Coatings 2021, 11(8), 886; https://0-doi-org.brum.beds.ac.uk/10.3390/coatings11080886
Submission received: 12 April 2021
/
Revised: 19 July 2021
/
Accepted: 20 July 2021
/
Published: 24 July 2021
(This article belongs to the Special Issue Innovations in Laser Surface Microprocessing, Coatings and Characterization)
Abstract
:The laser cleaning process has the potential to become an alternative to the existing chemical-based cleaning process if integrated with an effective in-process monitoring system that could serve as a control mechanism over surface damages or contaminants through which the desired surface cleanliness could be achieved. This paper presents results of an investigation into the characteristics and viability of utilizing probe beam reflection (PBR) and laser plume-emission spectroscopy (PES) as respective integrated monitoring systems during and after cleaning of titanium alloy sheets using a frequency-tripled Nd:YAG laser. The results present the probe beam reflection as a better system with the ability to differentiate between cleaned and un-cleaned surfaces for both small and large surface areas.
1. Introduction
Laser processing has become popular within the engineering industry for a variety of applications such as cutting, machining, surface structuring, and surface cleaning [1,2,3,4,5]. For surface cleaning, which is the application of interest in this paper, it can be carried out using several methods that include the conventional chemical-based cleaning method, for which laser cleaning has been identified as a feasible alternative [6,7] owing to observations so far made in a number applications such as cultural heritage restoration [8], tooling [9,10], and other applications in the semiconductor industry [6] where laser cleaning has been practically implemented.
Depending on the application at hand, various mechanisms are proposed in laser cleaning. For instance, lasers with long pulse widths (micro to millisecond) and low irradiations (103–105 W/cm2) are used [11] when the boiling temperatures of the contaminants and substrates are found to be substantially different. Additionally, most industrial laser cleaning is performed using short pulse lasers (nanosecond) with an intensity range of 107–1010 W/cm2. The use of low-intensity short-pulse lasers operating at ultraviolet wavelengths has been considered as the most suitable for laser cleaning applications [12,13], especially in high-value manufacturing where it has proved to provide the most reliable and acceptable results. For short-width lasers (~10 ns), the viscoelastic forces generated due to the rapid heating and cooling cycles result in the formation of shock waves, which allow contaminants to be removed without causing damage to the underlying surface. Furthermore, the absorption of ultraviolet laser photons by the contaminants can result in direct photochemical effects that could lead to the photodecomposition of organic contaminants. However, considering their flexibility in relation to their operational consistency and cost, frequency-tripled Nd:YAG lasers, operating at a wavelength of 355 nm, have the potential for applications in industrial environments, though laser cleaning systems to be used in industrial applications are required to operate without substrate damages such as ablation, melting, and oxide layer formation, which are undesirable.
In that respect, to enhance the efficiency and wider acceptability of the laser cleaning process, integrating it with an in-process monitoring system has been considered as a potential solution since such a system can provide an indication of surface condition relevant to the cleaning quality of the surface as well as ensuring precision control over the laser irradiation process to avoid surface damages while ensuring sufficient removal of contaminants. As a buttress to the advantage of such systems, Whitehead et al. [12], through the use of a stationary laser beam, reported an online monitoring system for detecting oxide formation in the laser cleaning process without any added contaminants.
This paper therefore summarizes the results of an investigation on the characteristics of using a probe beam reflection (PBR) system and laser plume emission spectroscopy (PES) to respectively monitor the cleaning quality of surfaces during a frequency-tripled Nd:YAG laser cleaning of titanium alloy.
2. Experimental Layout and Procedure
Shown in Figure 1 is a schematic layout of the apparatus used in the conduct of the laser cleaning experiment. The substrate material used as samples for the in-process monitoring investigation was titanium alloy (Ti6Al4V) with dimensions of 50 × 50 × 1 mm3. Some of the samples were contaminated with industrial machining coolant to study the effect of the contaminant on laser cleaning performance. The application procedure of the contaminant and its thickness were carefully controlled in all the samples in accordance with laid-down industrial procedures. The laser source used for the experiment was a frequency-tripled Litron Nd:YAG lamp-pumped laser with a wavelength of 355 nm, pulse duration of 8 ns, and maximum pulse frequency of 10 Hz. The laser beam was incident on an opening of 10 mm2, situated on a 1-mm thick object mask of a stainless-steel sheet, and then passed through a focusing lens of 200 mm focal length. The mask enabled the selection of a laser beam of uniform intensity from the frequency-tripled Nd:YAG laser. Careful control of the mask-to-lens and lens-to-target distance ensured the required laser spot size over the target surface. Four fluence levels of 0.4 J/cm2, 0.55 J/cm2, 0.7 J/cm2, and 0.85 J/cm2 were respectively considered in this study in order to understand the influence of laser fluence on the cleaning and monitoring characteristics.
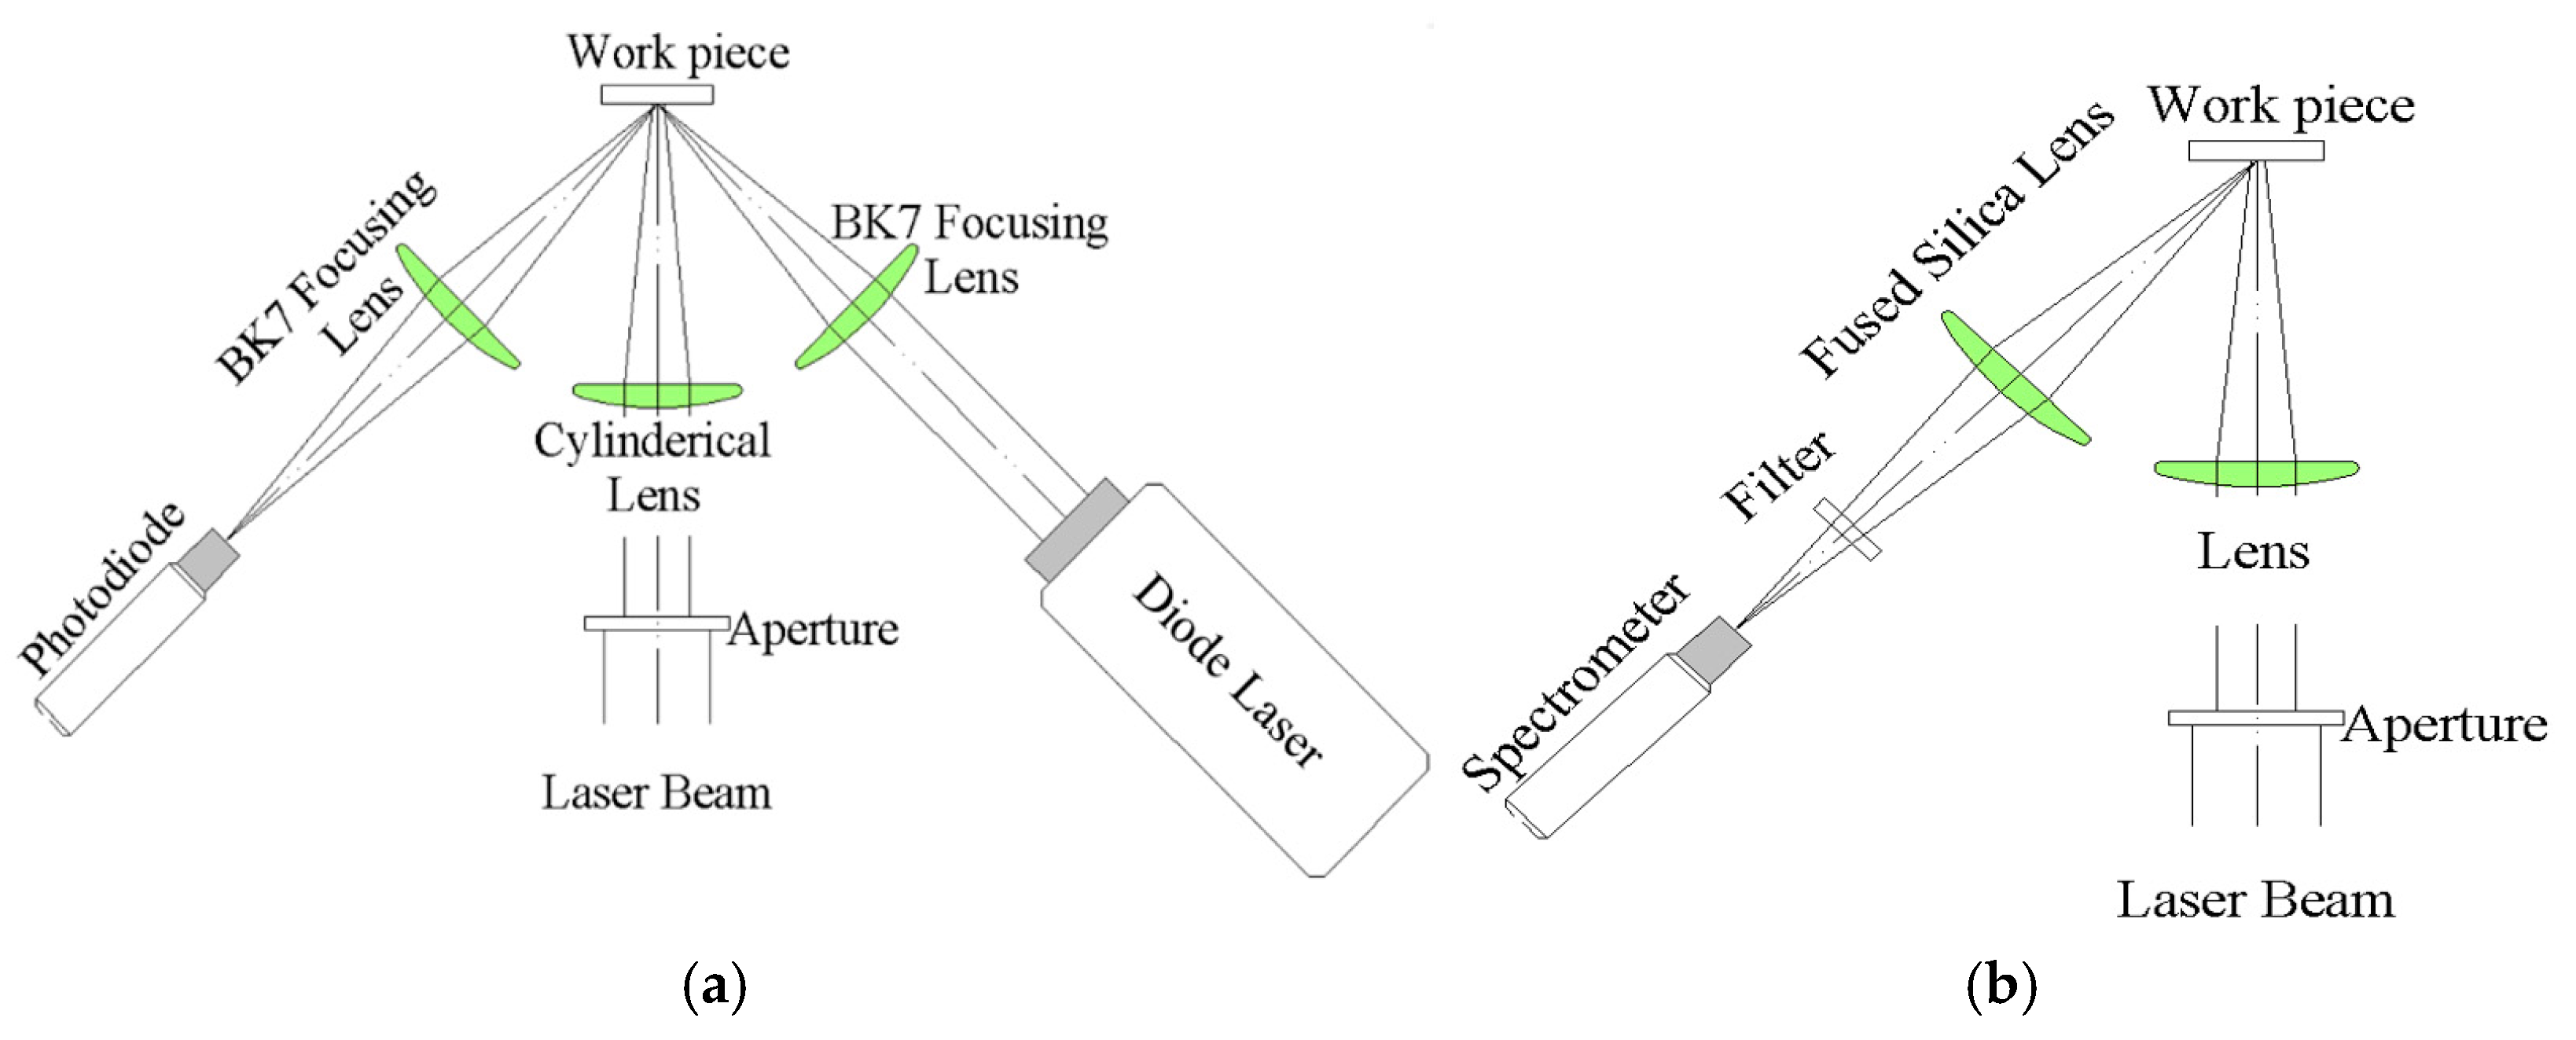
With respect to the integration of an in-process monitoring system to the laser cleaning system, schematic layouts of the experimental arrangement for the PBR and PES as integrated into the laser cleaning system are shown in Figure 2a,b, respectively.
In Figure 2a the experiment for the PBR is shown to have involved the use of a diode laser (Thorlabs CPS635R) with a 635 nm wavelength and 2.9 mm unfocused beam diameter as a light source. The diode laser beam was focused with a spherical lens at approximately 45° to the surface of the workpiece within the imaged frequency-tripled Nd:YAG laser spot. The beam diameter of the diode laser over the surface was controlled at 0.25 mm. Since the laser beam was wide enough (minimum 1 mm2), the diode laser beam was imaged at the laser spot’s centre. The light reflected from the surface of the workpiece was focused using another lens into a Thorlabs PDA10A2 photodiode to increase the light intensity on the sensor surface. The output response of the photodiode was then measured using a digital oscilloscope (Picoscope 5244D) as a means of monitoring the laser cleaning process.
The experimental arrangement in Figure 2b for the PES system is shown to have an Ocean Optics Maya2000 spectrometer as a replacement of the probe beam and photodiode in the PBR system. The elemental spectra were obtained using a fused silica lens of 100 mm focal length, which imaged the scattered emission at 45° onto an optical fiber that was coupled to the spectrometer. An optical filter of < 400 nm cut-off was placed in front of the fibre to eliminate the frequency-tripled Nd:YAG radiation from the sensor.
3. Results and Discussion
The scanning electron microscopic images of the titanium sample before and after laser cleaning are shown in Figure 3, where no change in substrate surface morphology was observed after the laser cleaning process. This implies the frequency-tripled Nd:YAG laser can successfully remove hydrocarbon-based surface contaminants, without inducing any changes or damage to the substrate. The laser cleaning mechanism observed in Figure 3 is based on selective vaporization that is attributed to the low ablation threshold of the contaminants for a wavelength of 355 nm [7]. An observation worth mentioning at this point is that the contaminants over the substrate cannot be fully removed for laser fluence less than 0.4 J/cm2, while at the same time the substrate starts to get damaged by melting and ablation for laser fluence beyond 0.85 J/cm2.
3.1. Probe Beam Reflection
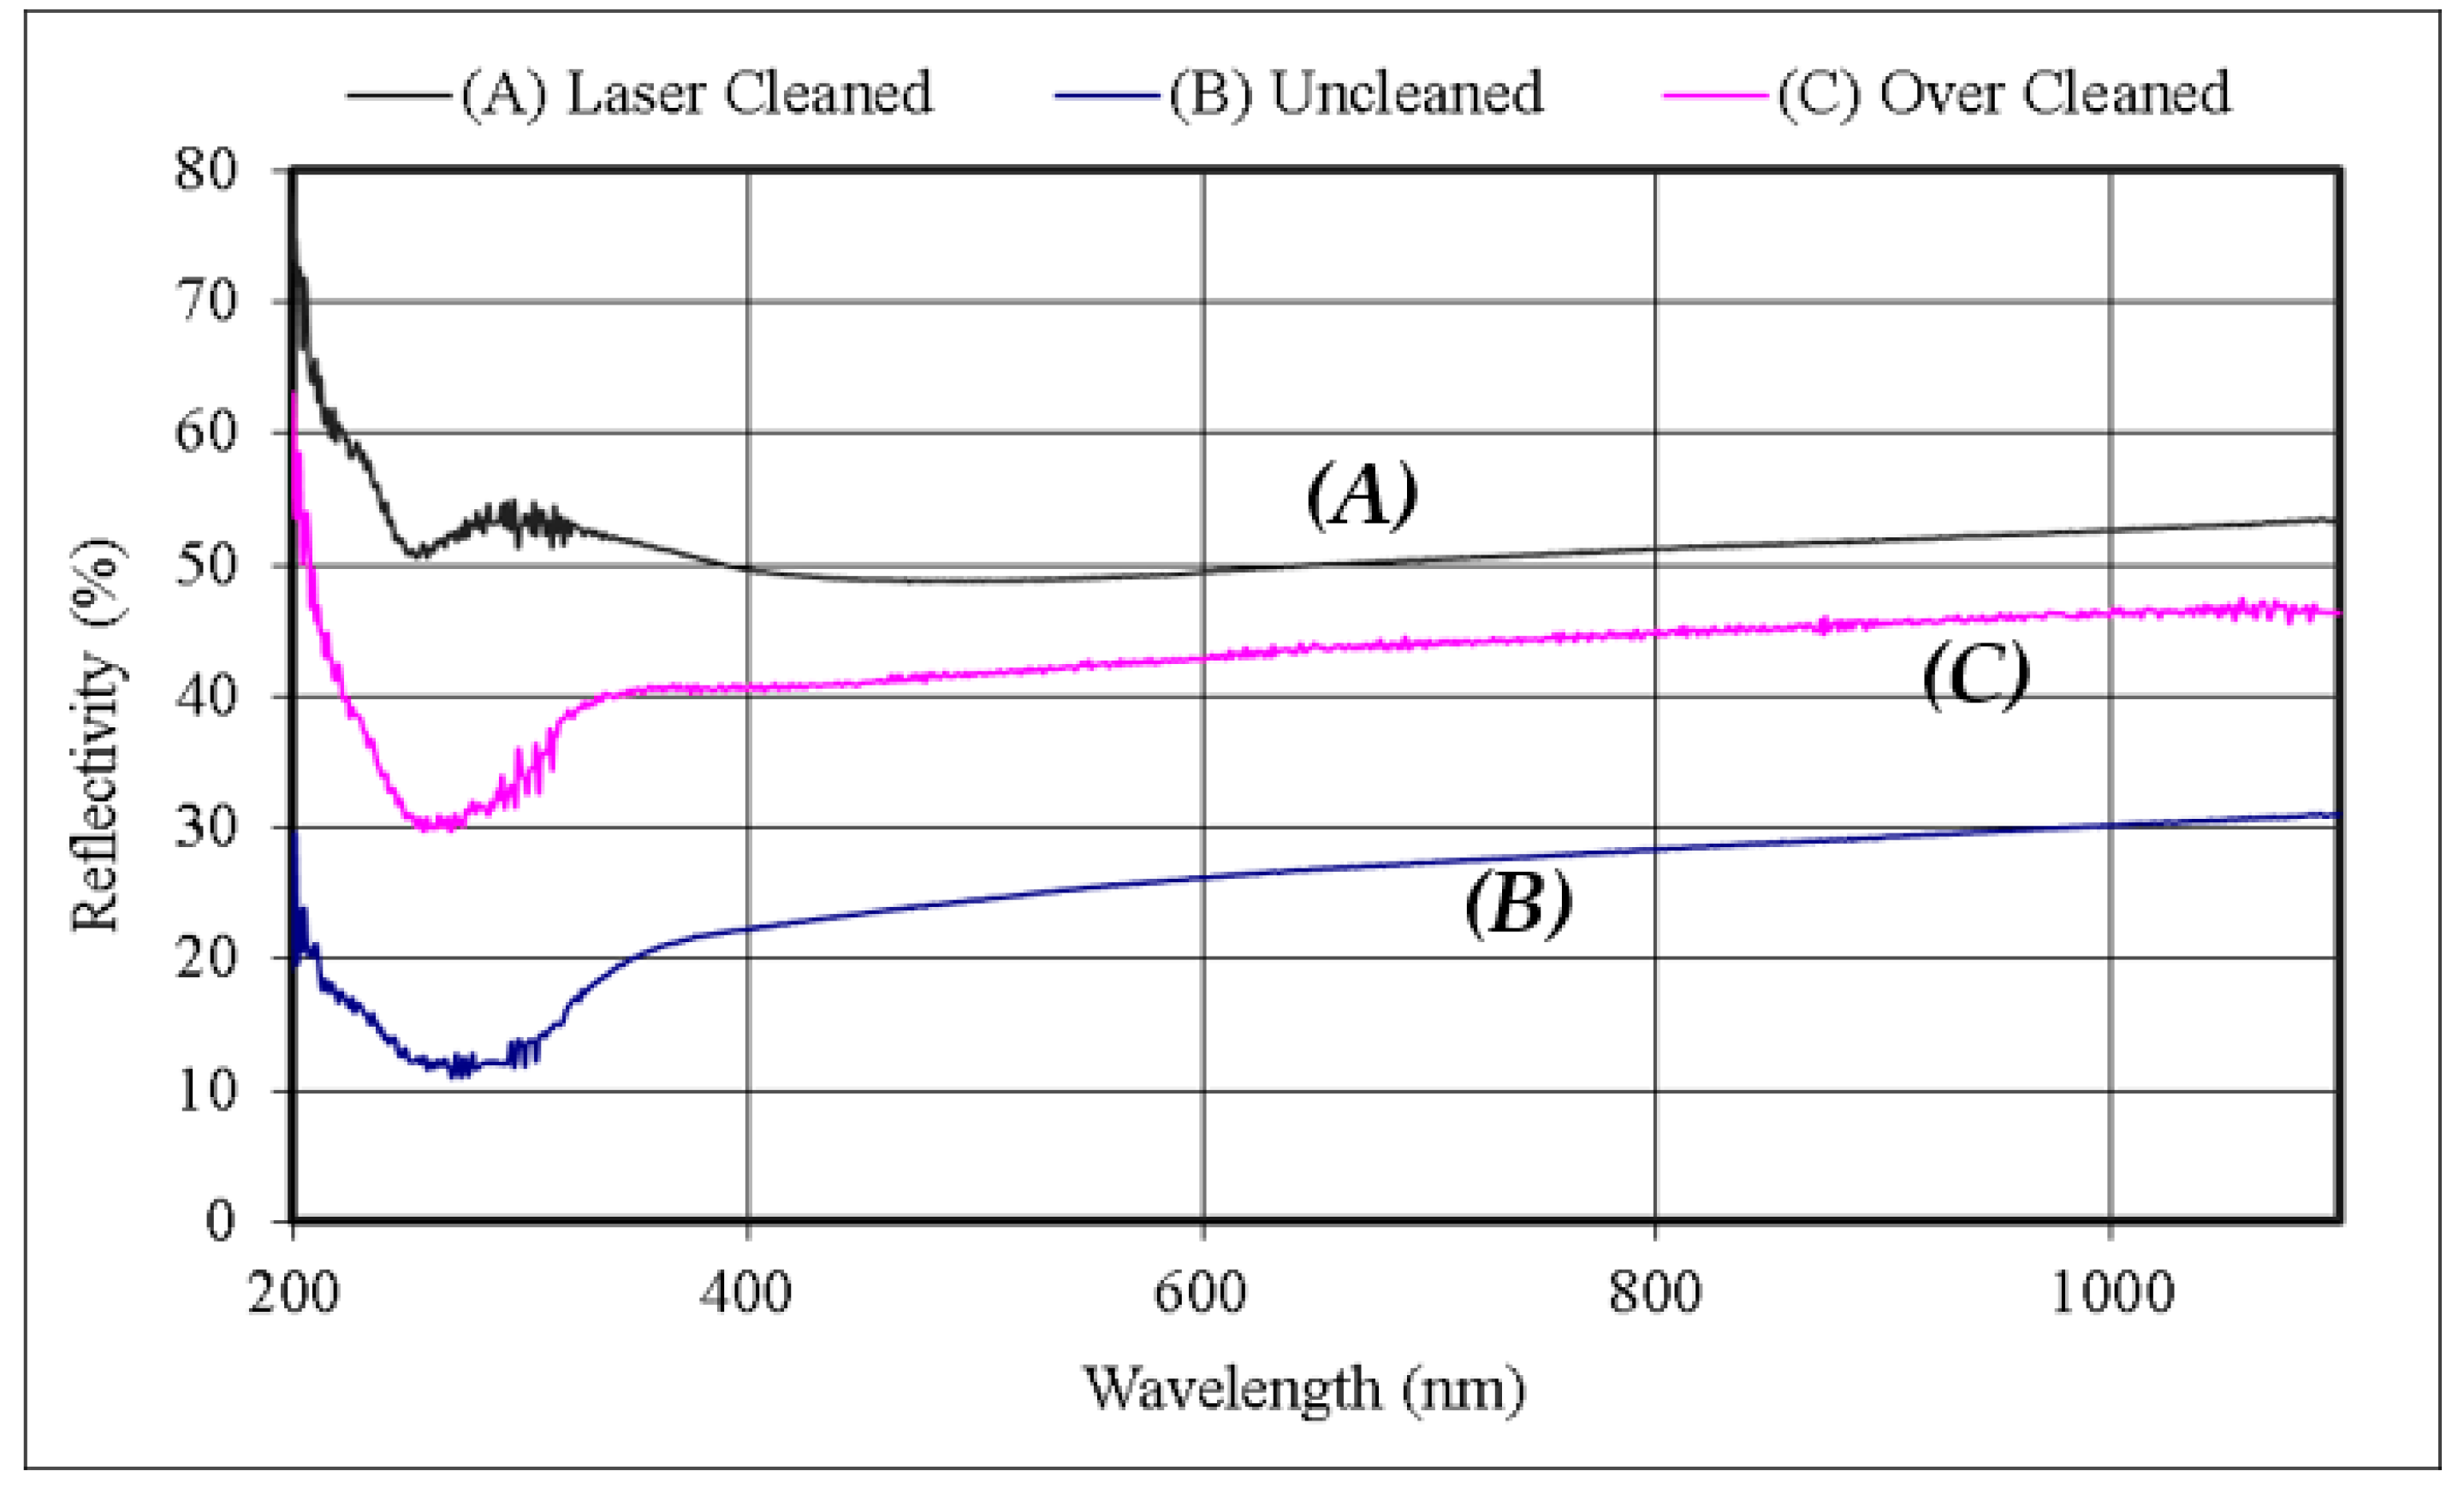
The PBR method monitors the intensity of the light source reflected from the substrate surface as an evaluation of the laser cleaning process. The variation in the intensity of the reflected light source during laser cleaning is calibrated and through which the process is monitored and controlled. Being based on measuring the reflectivity of the sample at a particular wavelength, the PBR method was carried out such that before the experiment the reflectivity of the laser-cleaned, uncleaned, and overcleaned samples were experimentally evaluated using a UV spectrophotometer and the results are shown in Figure 4.
At a wavelength of 635 nm, which corresponds to the wavelength of the diode laser to be used for monitoring, the figure shows the reflectivity of the laser-cleaned, uncleaned, and overcleaned samples to be 49%, 28%, and 44%, respectively. The least value of reflected intensity observed for the overcleaned sample is possibly due to surface oxidation [12] of titanium alloy samples processed with a large number of pulses. Since there was a discerning difference in reflectivity of cleaned, uncleaned, and overcleaned samples, the monitoring process was expected to be feasible using a 635 nm diode laser for the PBR method.
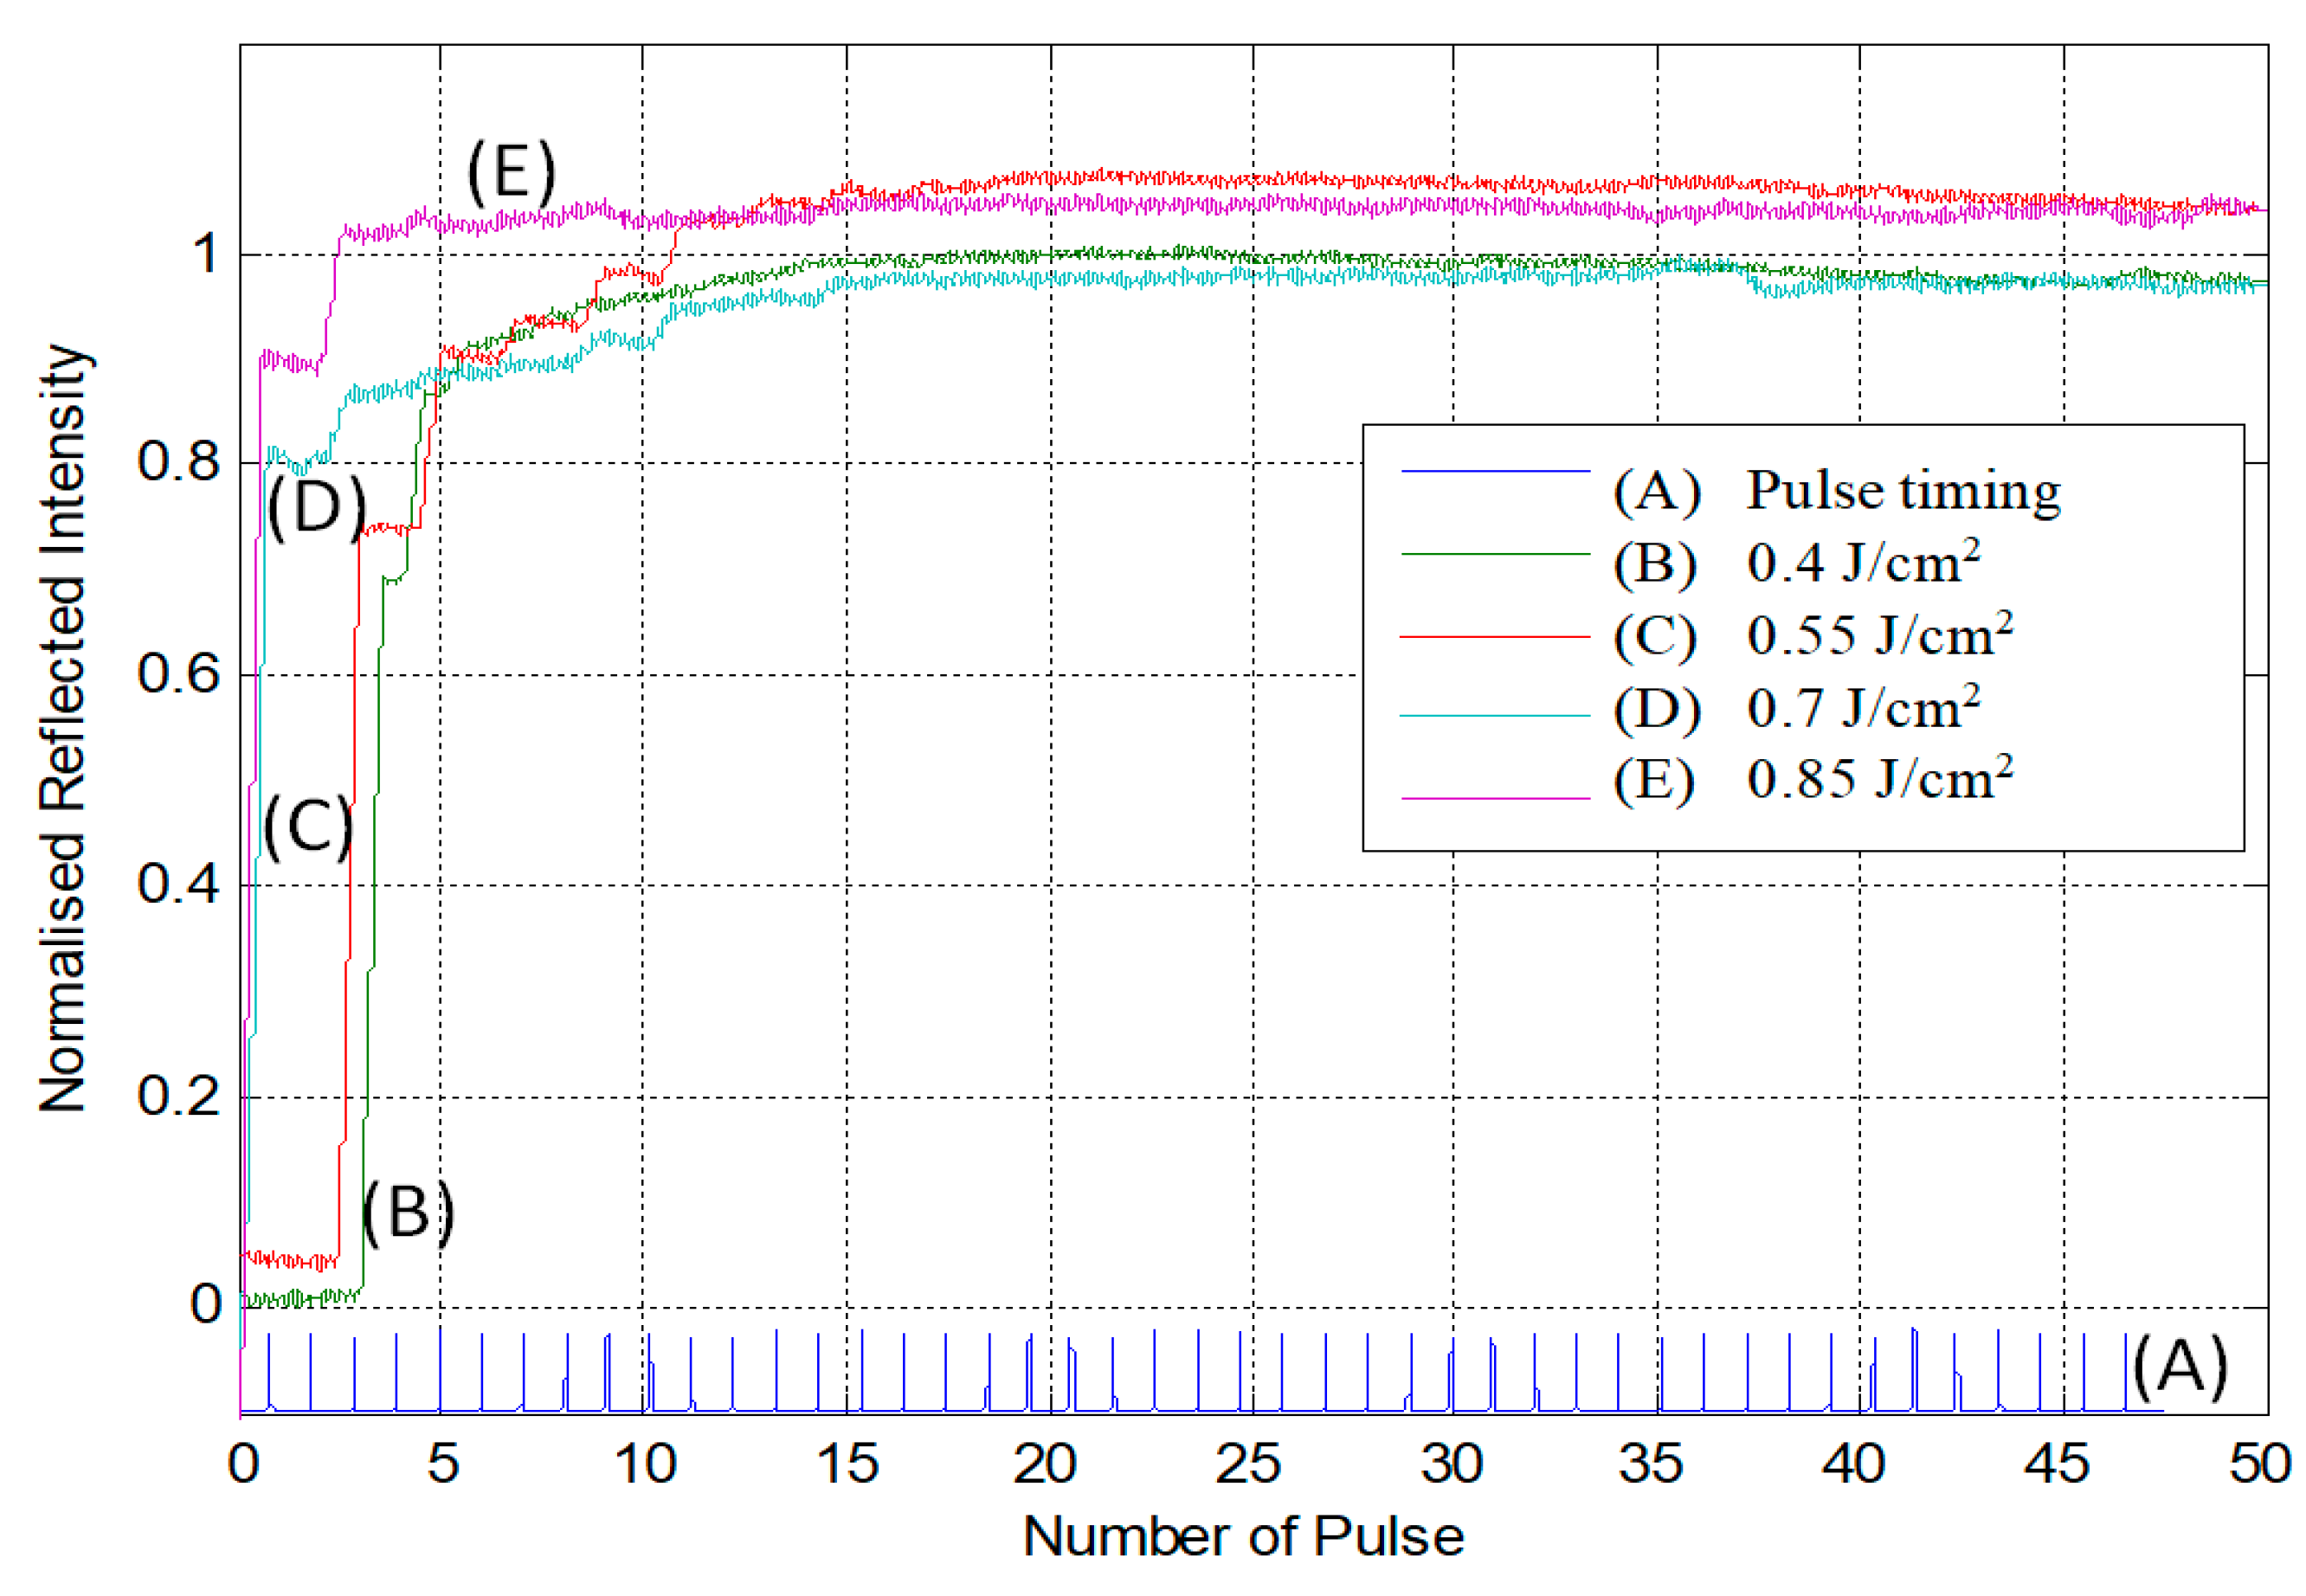
As already shown in Figure 3, the cleaned surface was free of any hydrocarbon-based contaminants, indicating an exhibit of higher reflectivity compared to the uncleaned surface. Additionally, having shown in Figure 3 the similar surface morphologies from both the laser cleaned and uncleaned surfaces, with surface roughness (Ra) vales being approximately 450 nm, any change in the reflected signal before and after laser cleaning will be predominately associated with the cleaning process. This ensured the monitoring of the variation in intensity of the reflected beam from the surface as recorded by PBR and its corresponding signal for each pulse within the laser cleaning process using an oscilloscope for various laser fluence levels and number of pulses. The results for the change in reflectivity intensity with an increase in the number of pulses for various laser fluences are presented in Figure 5, where in each case a sharp increase in the reflected intensity was observed for the first few numbers of pulses. This observation is considered as an effect related to the removal of contaminants from the surface of the titanium alloy [14]. Further shown in Figure 5 is that for all laser fluence levels, after an initial increment in intensity, the reflected intensity remained constant with an increase in number of pulses for the next 70 to 100 pulses before it started to decrease again. This subsequent decrease in reflected intensity could be attributed to oxide formation at a higher number of laser pulses. A deduction that could therefore be made from this is that there was no oxide formation within the first 50 pulses, but rather the increase in the reflected PBR signal strength noted during those pulses could predominantly be due to the effective removal of the hydrocarbon-based contaminants that are typically found in uncleaned surfaces, as shown in Figure 4.
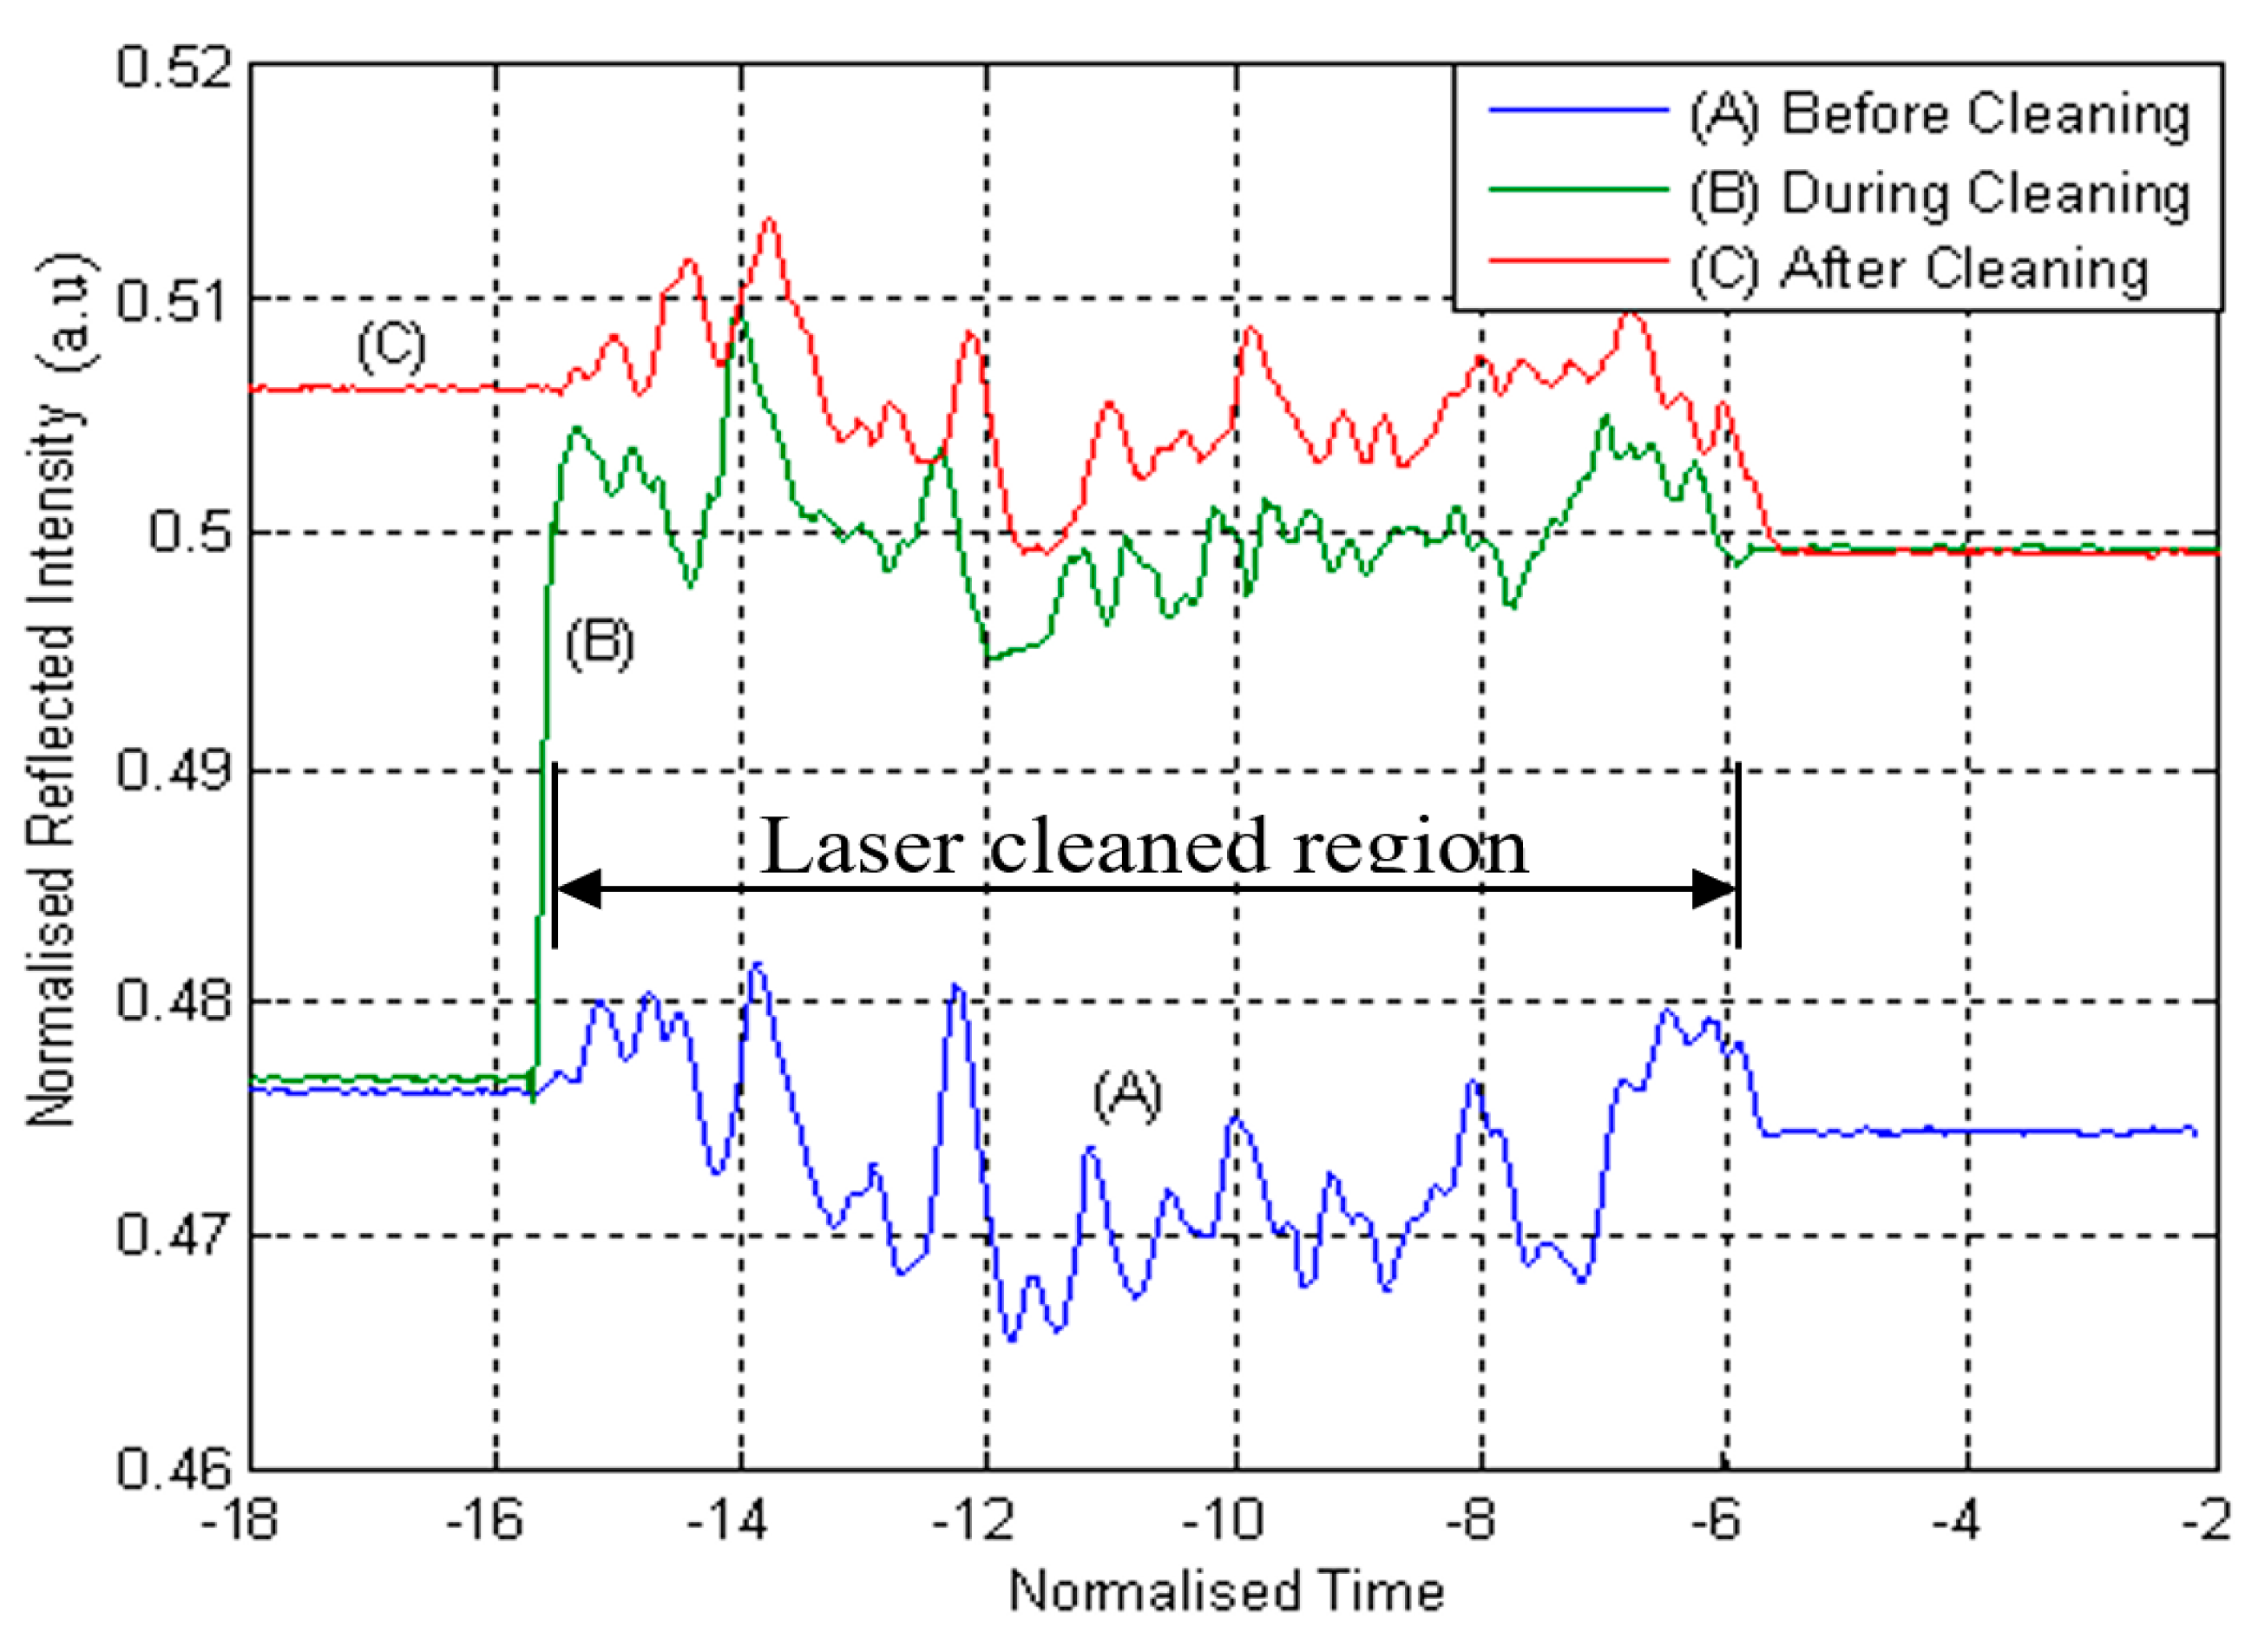
Further experimentation on PBR was carried out using a moving beam as an exploration to the implementation of the monitoring system in laser cleaning of large areas. The diode laser beam and the frequency-tripled Nd:YAG laser beam were set stationary while the workpiece was moving. To establish the effect of laser cleaning performance on the PBR intensity, recording of the intensity was carried out at three instances along the same linear laser cleaning track, i.e., before cleaning, during cleaning, and after cleaning. A comparison of the reflected intensities at the three respective instances stands to provide an indication of the effectiveness of the PBR system as an online monitoring technique in the frequency-tripled Nd:YAG laser cleaning process.
Details of the reflected intensity of the PBR system as recorded along the same line before, during, and after laser cleaning for a laser fluence of 0.55 J/cm2 and 20 pulses per position are presented in Figure 6, where a distinct difference in reflectivity of the workpiece before and after laser cleaning can be observed. This is an indication of the quality of cleaning of the substrate after the laser cleaning process. The figure also indicates that during laser cleaning the reflectivity increases sharply as the laser beam starts to clean the workpiece surface and maintain its level as the cleaning progresses.
The next stage of the experiments on the PBR technique was to establish its effectiveness in monitoring the laser cleaning of a large area. In addition to the as-received contaminated samples, samples with added contamination of industrial machining coolant were also used to evaluate the performance of Nd:YAG laser cleaning and the PBR technique. Here, the reflected intensity of the diode laser was measured twice along the middle of the laser-cleaned area, i.e., once before cleaning and once after cleaning, with the monitoring diode laser beam scanned over the surface at a speed of 1 mm/s.
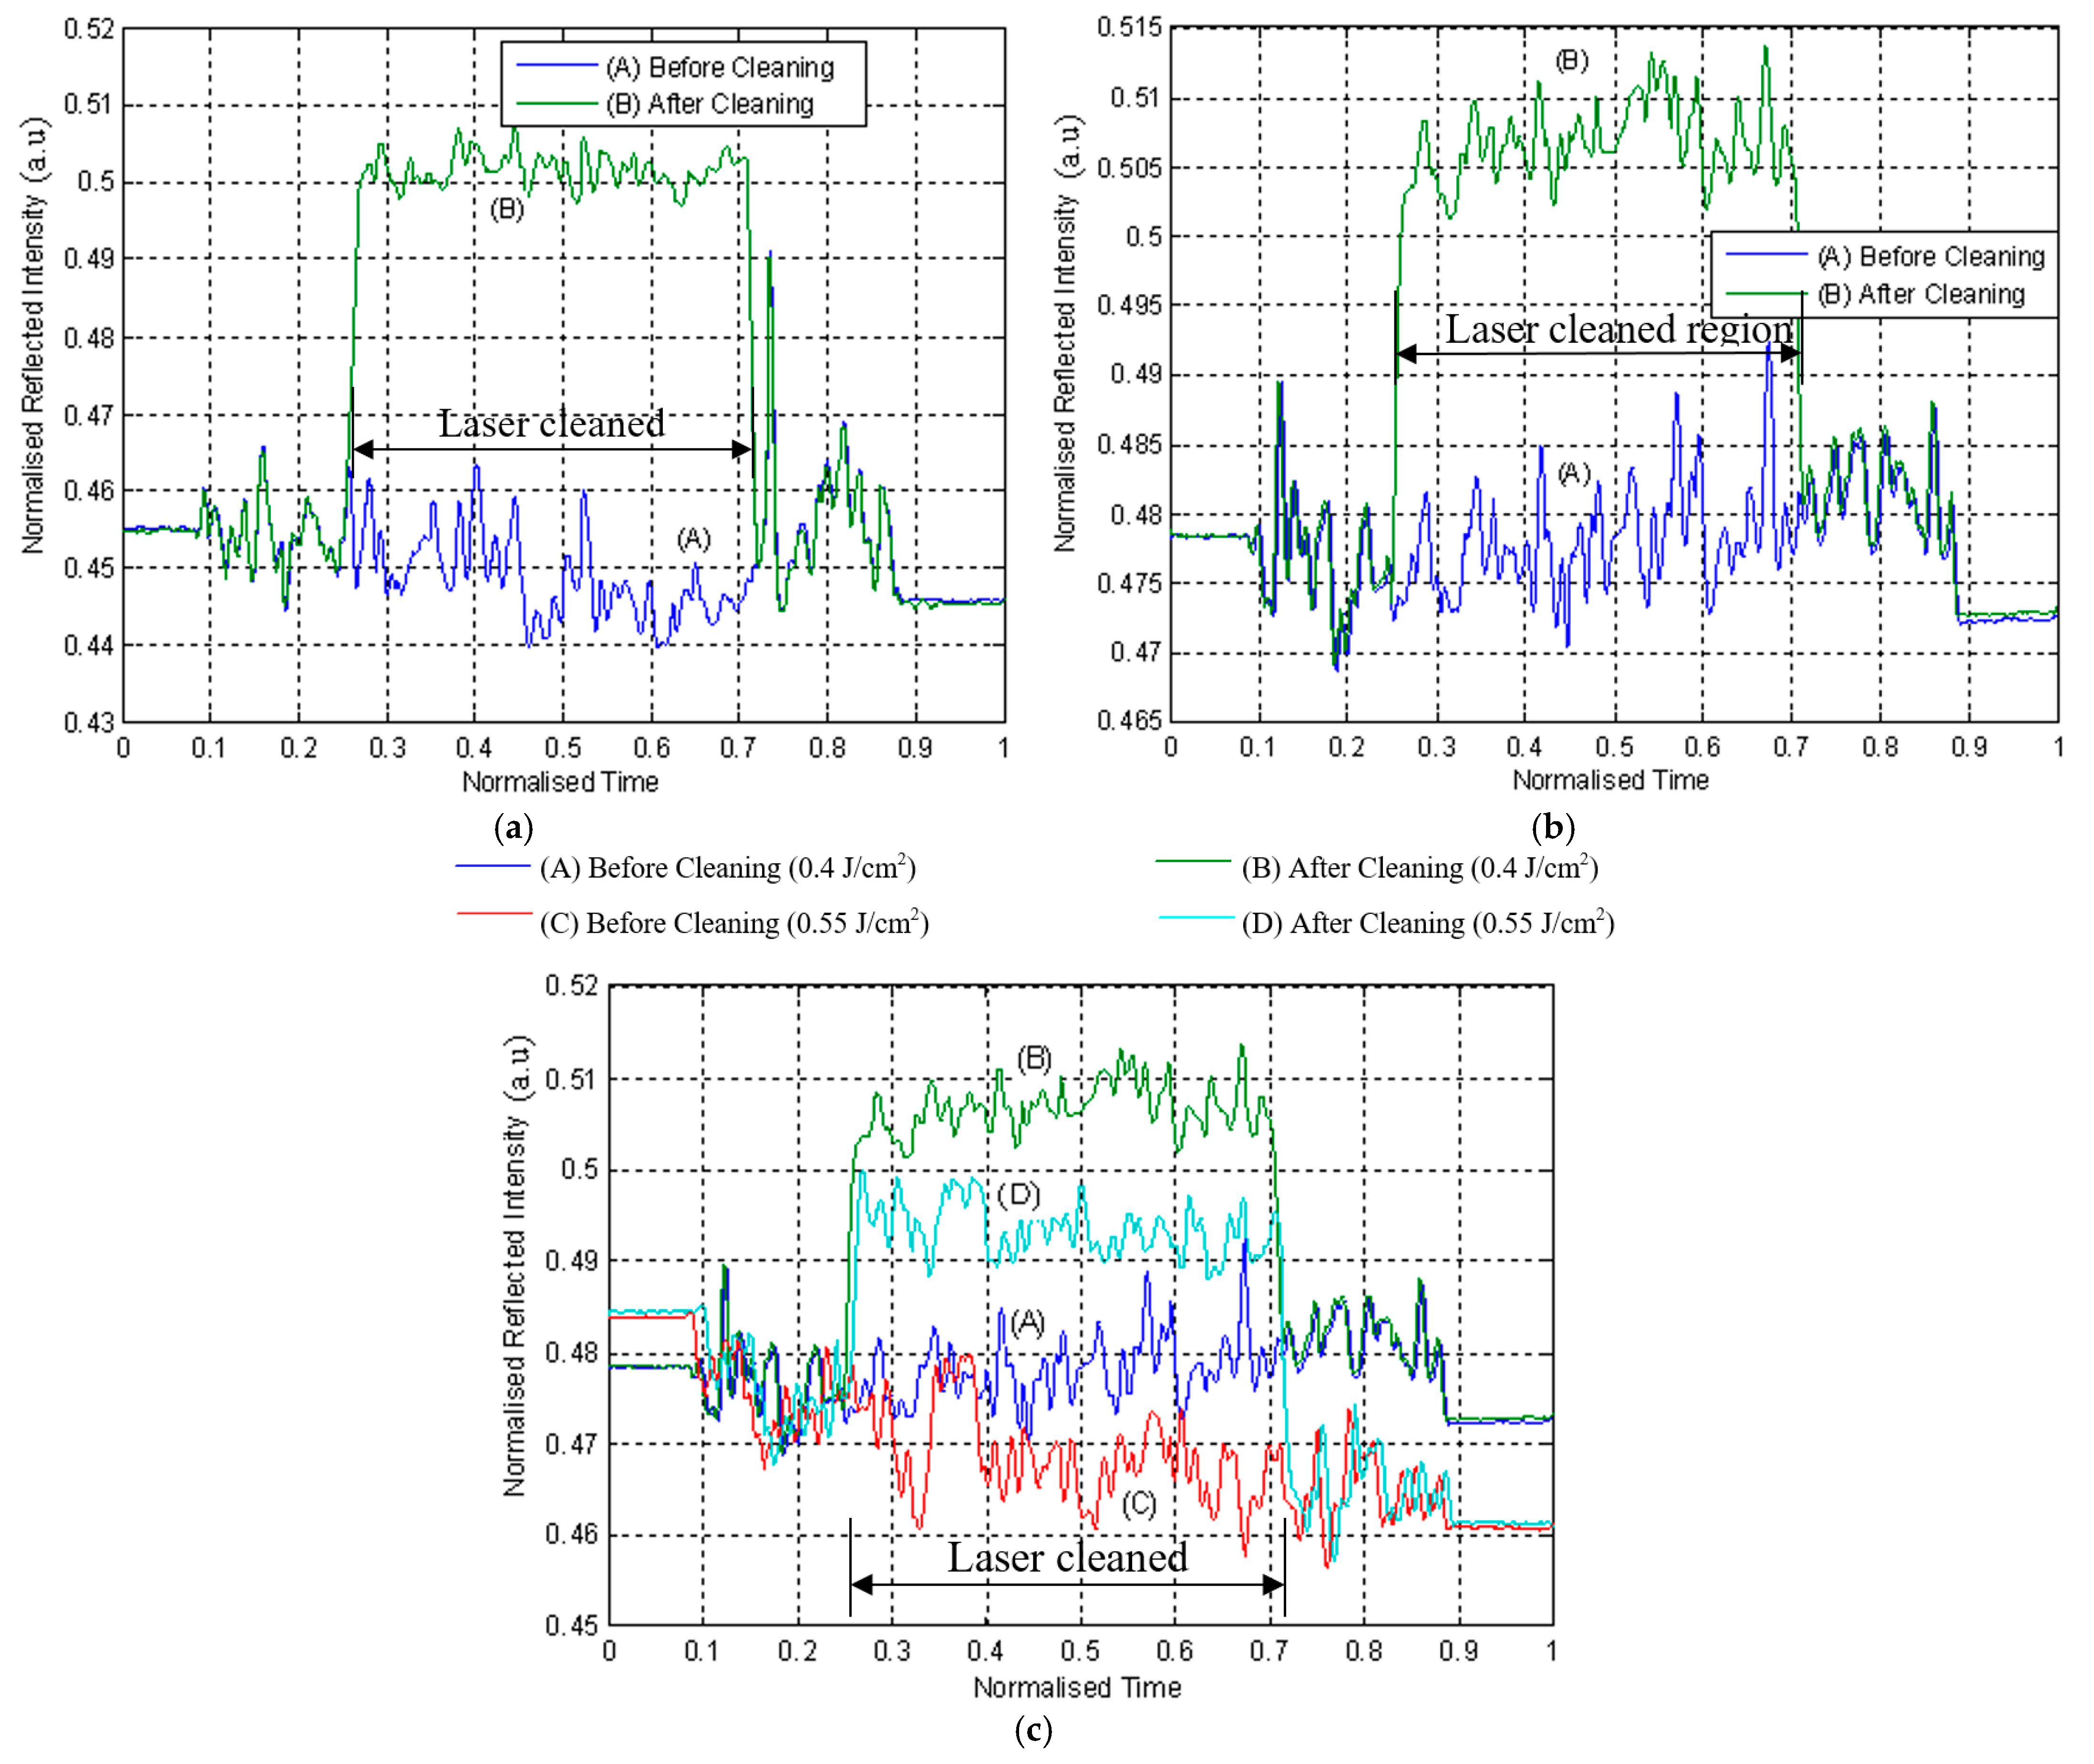
Figure 7a–c depicts the measured reflected intensity of the diode laser in monitoring the laser cleaning of a large area with a moving workpiece. While Figure 7a presents the variation of the measured intensity over an area without any added contaminants before and after laser cleaning for a laser fluence of 0.55 J/cm2, Figure 7b presents a similar variation for an area with added contaminants, before and after laser cleaning, for the same value of laser fluence. In Figure 7c, the variation of the measured intensity over an area with added contaminants before and after laser cleaning and for varying laser fluence is shown. In all cases and irrespective of the laser fluence, a distinct difference was observed in the reflected intensity measured before and after laser cleaning, with the laser-cleaned region in all cases showing higher reflected intensity than the uncleaned region. This observation is a portrayal of the effectiveness of the frequency-tripled Nd:YAG laser in cleaning the titanium alloy surface. It is also worthy to note from Figure 7c the increase in laser fluence, which has been observed to cause a marginal increase in the measured intensity of the reflected beam.
3.2. Plume Emission Spectroscopy
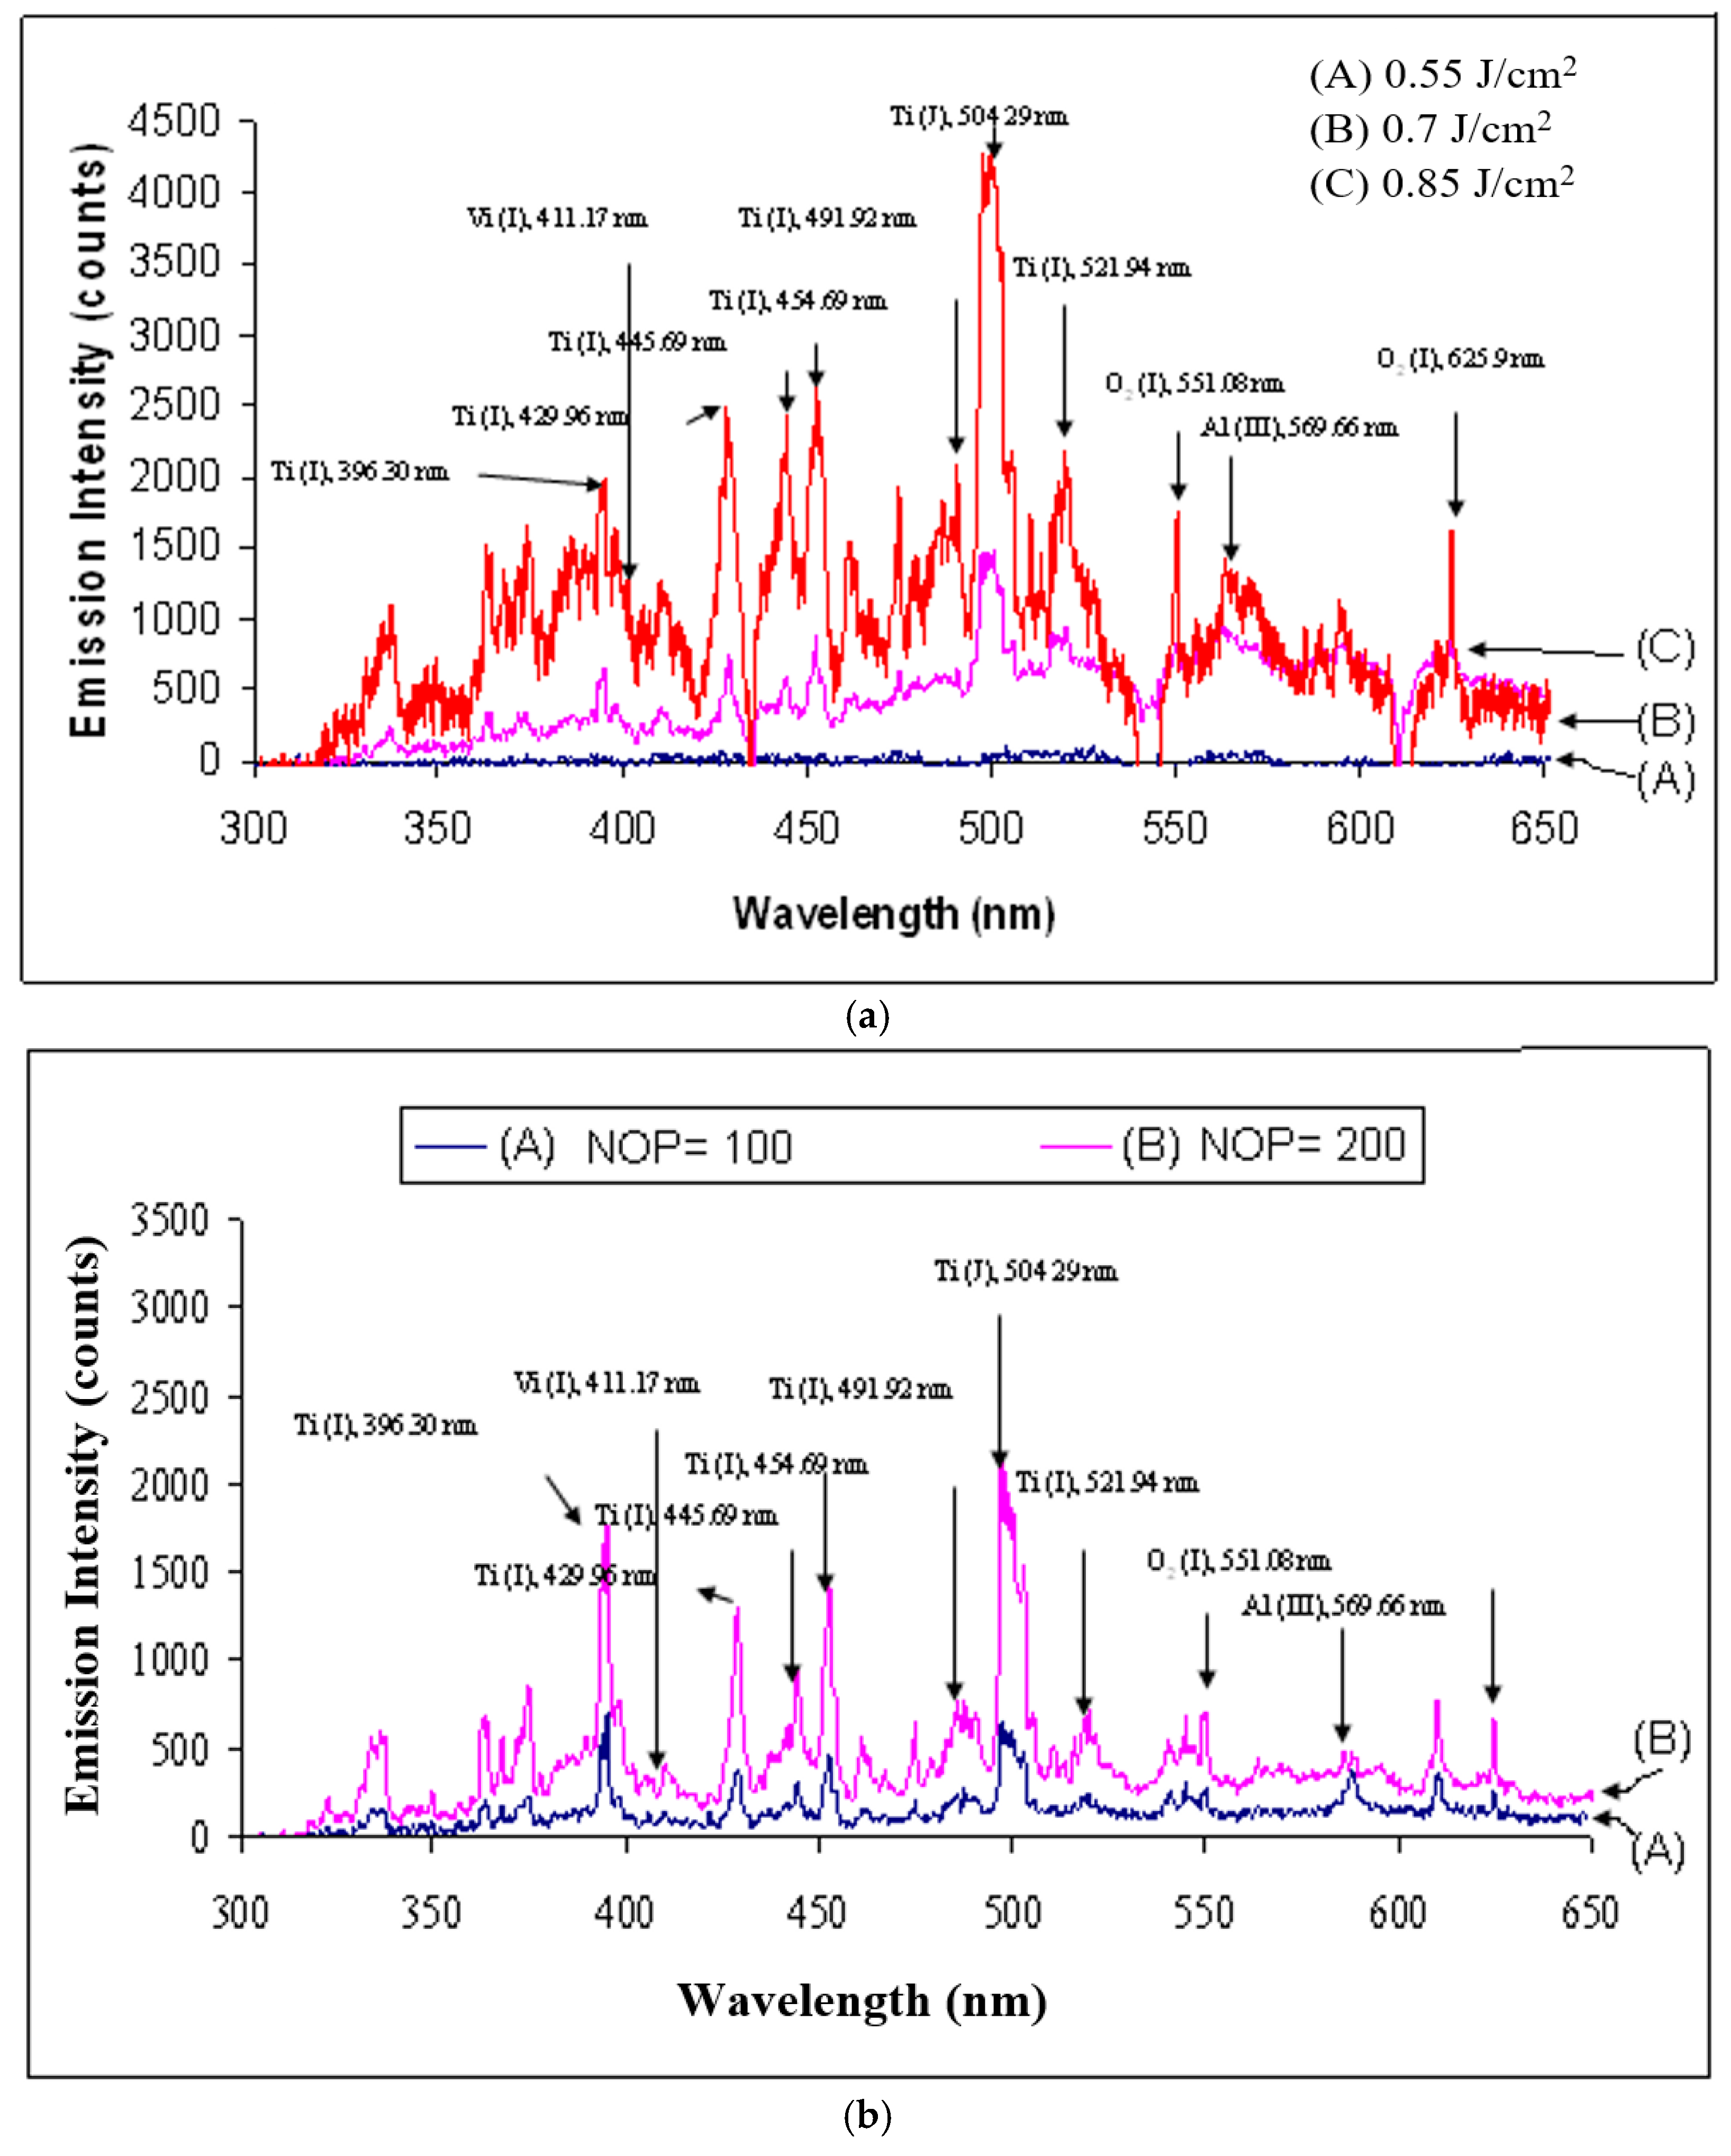
During the laser–material interaction, the contaminates over the substate are ionized, resulting in a plasma plume over the surface. The plasma plume gives rise to light emissions (at various wavelengths), which can extend up to a few millimeters from the surface of the workpiece. The multiwavelength light that is emitted from the plasma plume contains information related to the atomic species that has been ionized, and the spectra thus produced during the laser cleaning process [15,16] can be used to identify the material (corresponding to the wavelengths) removed by the laser. Shown in Figure 8a is a classical PES induced by laser irradiation of titanium alloys for a stationary laser beam operated without any added contaminants, while Figure 8b presents similar details but for a linearly moving laser beam. In both figures, the presence of titanium and oxygen emission lines is found, as discussed in the literature [17]. and with a few peaks of aluminum and vanadium also observed.
Further observed from Figure 8a for the stationary laser beam is that a significant proportion of the noticeable peaks with the most intense emissions occurred in a spectral range of 498 to 502 nm and are of a titanium-neutral signature. Emission signature lines of 529.1, 547.7, 548.7, 551.1, and 625.9 nm were also found to have been included for oxygen, but these were concealed by the titanium emissions within the spectrum because of their relatively low intensities. Furthermore, the required number of pulses for these spectra seemed to have increased as the laser fluence decreased; for any fluence less than 0.7 J/cm2 the emission during laser irradiation was found to be so weak that no useful information could be derived from the spectrometer. This is mainly due to the lack of vapor plume or plasma generation at low beam intensities below the ablation threshold for the Ti alloy studied.
In addition to the presentation in Figure 8b of the emission spectra for the linearly moving laser beam, it is also worthy to note for this beam the spectrometer failed to provide any valid spectrum for a fluence less than 0.85 J/cm2. The emission spectroscopy is able to provide spectra only for high fluence (just above the ablation threshold of the substrate) and high number of pulses per spot, hence its failure to provide valid spectra within the operating range of the laser cleaning process (less than the ablation threshold of the substrate), which could be an indication of substrate damage. However, a potential solution for direct monitoring of contamination level would be the use of photomultiplier tubes to detect the PES signals when operating at a lower fluence level. While PES has been used by previous researchers [16,17,18] for monitoring laser cleaning and coating removal processes, the technique is found in this study to have failed to give any valid spectrum within the laser cleaning operating range of titanium alloys. It must therefore be noted at this point that significant emission spectra, as shown in Figure 8a,b can be observed only when a substantial material (either substrate or contaminants) is ablated and ionized to produce light emission.
Observed in Figure 8a,b is that no specific wavelength peaks are associated with the hydrocarbon-based contaminants. This observation could be attributed to the magnitude of the contaminants observed over the substrate prior to the laser cleaning process, as presented in Figure 3, and found to be in line with observations in previous work [16,17,18] in which laser-induced breakdown spectroscopy was used for laser cleaning application with a significant volume of contaminants. Therefore, in the case of laser cleaning with minimal contaminant removal only and no substrate damage, the PES signal is not strong enough to differentiate the materials removed. This implies, the PES signal can be used as an initial technique to estimate the wavelength of the highest emission related to the substrate ablation (in this case 498 to 502 nm), which can then be used as a reference wavelength for monitoring the laser cleaning process along with other techniques like narrow-band photodiode-based monitoring.
4. Conclusions
The feasibility of using PBR and PES as online monitoring techniques for UV Nd:YAG laser cleaning of titanium alloys over a large area has been shown in principle, indicating the possibility of implementation in an industrial monitoring and process control system. The laser cleaning process monitoring with PBR showed an increased measured intensity of the reflected beam for a cleaned surface than an uncleaned or partially cleaned surface. Although PBR showed better performance in monitoring the laser cleaning process, a database of signal intensity is needed for various contaminants and fluences to improve the robustness of the sensing signal. On the contrary, the PES showed a weak signal within the operating range of the optimal laser cleaning parameters and therefore requires further study using a larger beam size and a high gain spectrometer. Monitoring of the emission spectra obtained from the PES can be used to avoid overcleaning or damage of the laser-cleaned substrate.
Author Contributions
Conceptualization, S.M. and J.R.; Investigation, S.M. and S.P.; writing—original draft preparation, S.M. and J.R.; review and editing, S.M., S.P., J.R. and A.M.K. All authors have read and agreed to the published version of the manuscript.
Funding
This research received no external funding.
Institutional Review Board Statement
Not applicable.
Informed Consent Statement
Not applicable.
Data Availability Statement
Data is contained within the article or supplementary material.
Conflicts of Interest
The authors declare no conflict of interest.
References
- Förster, D.J.; Jäggi, B.; Michalowski, A.; Neuenschwander, B. Review on Experimental and Theoretical Investigations of Ultra-Short Pulsed Laser Ablation of Metals with Burst Pulses. Materials 2021, 14, 3331. [Google Scholar] [CrossRef] [PubMed]
- Ma, M.; Wang, L.; Li, J.; Jia, X.; Wang, X.; Ren, Y.; Zhou, Y. Investigation of the surface integrity of Q345 steel after Nd: YAG laser cleaning of oxidized mining parts. Coatings 2020, 10, 716. [Google Scholar] [CrossRef]
- Jagdheesh, R.; Ocaña, J.L. Laser machined ultralow water adhesion surface by low pressure processing. Mater. Lett. 2020, 270, 127721. [Google Scholar] [CrossRef]
- Riveiro, A.; Quintero, F.; Boutinguiza, M.; Del Val, J.; Comesaña, R.; Lusquiños, F.; Pou, J. Laser cutting: A review on the influence of assist gas. Materials 2019, 12, 157. [Google Scholar] [CrossRef] [PubMed] [Green Version]
- Jagdheesh, R.; Tur, A.; Ocaña, J.L. The Effects of Pulse Period on Nanosecond Laser Microfabrication. Lasers Eng. 2017, 37, 333–343. [Google Scholar]
- LukYanchuk, B. Laser Cleaning; World Scientific Publishing Company: Singapore, 2002. [Google Scholar]
- Hu, C.; He, G.; Chen, J.; Fang, Z.; Yang, Z.; Zhang, Z. Research on Cleaning Mechanism of Anti-Erosion Coating Based on Thermal and Force Effects of Laser Shock. Coatings 2020, 10, 683. [Google Scholar] [CrossRef]
- Georgiou, S.; Zafiropulos, V.; Anglos, D.; Balas, C.; Tornari, V.; Fotakis, C. Excimer laser restoration of painted artworks: Procedures, mechanisms and effects. Appl. Surf. Sci. 1998, 127–129, 738–745. [Google Scholar] [CrossRef]
- Marimuthu, S.; Kamara, A.; Whitehead, D.; Mativenga, P.; Li, L.; Yang, S.; Cooke, K. Laser stripping of TiAlN coating to facilitate reuse of cutting tools. Proc. Inst. Mech. Eng. Part B J. Eng. Manuf. 2011, 225, 1851–1862. [Google Scholar] [CrossRef]
- Marimuthu, S.; Kamara, A.; Whitehead, D.; Mativenga, P.; Li, L. Laser removal of TiN coatings from WC micro-tools and in-process monitoring. Opt. Laser Technol. 2010, 42, 1233–1239. [Google Scholar] [CrossRef]
- Marimuthu, S.; Smith, B.; Kiely, A.; Liu, Y. Millisecond pulse laser machining of thermal barrier coatings. CIRP J. Manuf. Sci. Technol. 2020, 28, 107–117. [Google Scholar] [CrossRef]
- Whitehead, D.J.; Crouse, P.L.; Schmidt, M.J.J.; Li, L.; Turner, M.W.; Smith, A.J.E. Monitoring laser cleaning of titanium alloys by probe beam reflection and emission spectroscopy. Appl. Phys. A Mater. Sci. Process. 2008, 93, 123–127. [Google Scholar] [CrossRef]
- Lu, Y.; Ding, Y.; Wang, G.; Yang, L.; Wang, M.; Wang, Y.; Guo, B. Ultraviolet laser cleaning and surface characterization of AH36 steel for rust removal. J. Laser Appl. 2020, 32, 032023. [Google Scholar] [CrossRef]
- Turner, M.W.; Crouse, P.L.; Li, L. Comparative interaction mechanisms for different laser systems with selected materials on titanium alloys. Appl. Surf. Sci. 2007, 253, 7992–7997. [Google Scholar] [CrossRef]
- Colao, F.; Fantoni, R.; Lazic, V.; Morone, A.; Santagata, A.; Giardini, A. LIBS used as a diagnostic tool during the laser cleaning of ancient marble from Mediterranean areas. Appl. Phys. A Mater. Sci. Process. 2004, 79, 213–219. [Google Scholar] [CrossRef]
- Fortes, F.J.; Cabalín, L.M.; Laserna, J.J. The potential of laser-induced breakdown spectrometry for real time monitoring the laser cleaning of archaeometallurgical objects. Spectrochim. Acta B 2008, 63, 1191–1197. [Google Scholar] [CrossRef]
- Klein, S.; Hildenhagen, J.; Dickmann, K.; Stratoudaki, T.; Zafiropulos, V. LIBS-spectroscopy for monitoring and control of the laser cleaning process of stone and medieval glass. J. Cult. Herit. 2000, 1, S287–S292. [Google Scholar] [CrossRef]
- Mateo, M.P.; Ctvrtnickova, T.; Fernandez, E.; Ramos, J.A.; Yáñez, A.; Nicolas, G. Laser cleaning of varnishes and contaminants on brass. Appl. Surf. Sci. 2009, 255, 5579–5583. [Google Scholar] [CrossRef]
Figure 1.
Schematic of the experimental layout of the Nd:YAG laser cleaning system.

Figure 2.
Schematic illustration of the online monitoring arrangements, (a) For the probe beam reflection (PBR), (b) For the laser plume emission spectroscopy.
Figure 2.
Schematic illustration of the online monitoring arrangements, (a) For the probe beam reflection (PBR), (b) For the laser plume emission spectroscopy.

Figure 3.
Scanning electron microscopic images showing the sample surface condition (Ra of ~450 nm) (laser cleaning performed with a frequency-tripled Nd:YAG laser operating at a wavelength of 355 nm, beam size of 1 mm2, fluence of 0.55 J/cm2, number of pulse/position of 30 and frequency of 10 Hz), (a) Before cleaning, (b) After cleaning.

Figure 4.
Reflectivity spectrum of a typical workpiece used for laser cleaning.

Figure 5.
Effect of laser fluence on change in reflectivity of PBR with an increase in number of pulses for a stationary laser beam (beam size = 1 mm2, frequency = 10 Hz, monitoring laser wavelength = 635 nm).
Figure 5.
Effect of laser fluence on change in reflectivity of PBR with an increase in number of pulses for a stationary laser beam (beam size = 1 mm2, frequency = 10 Hz, monitoring laser wavelength = 635 nm).

Figure 6.
Effects of laser cleaning on PBR intensity along a linear track (beam size = 1 mm2, fluence = 0.55 J/cm2, No. of pulse/position = 20, frequency = 10 Hz, monitoring laser wavelength = 635 nm).
Figure 6.
Effects of laser cleaning on PBR intensity along a linear track (beam size = 1 mm2, fluence = 0.55 J/cm2, No. of pulse/position = 20, frequency = 10 Hz, monitoring laser wavelength = 635 nm).

Figure 7.
Effects of laser cleaning on PBR intensity over an area. (a) Without any added contaminants (beam size = 1 mm2, fluence = 0.55 J/cm2, No. of pulse per position = 30, frequency = 10 Hz, monitoring laser wavelength = 635 nm), (b) With contaminants (beam size = 1 mm2, fluence = 0.55 J/cm2, No. of pulse per position = 30, frequency = 10 Hz, monitoring laser wavelength = 635 nm), (c) With contaminants and for various laser fluences (No. of pulse per position = 30, frequency = 10 Hz, monitoring laser wavelength = 635 nm).

Figure 8.
Emission spectra of titanium alloys for various laser fluences (a) Stationary beam (after 200 pulses, beam size = 1 mm2), (b) Moving beam (fluence = 0.85 J/cm2, beam size 1 mm2, lens focal length = 200 mm).
Figure 8.
Emission spectra of titanium alloys for various laser fluences (a) Stationary beam (after 200 pulses, beam size = 1 mm2), (b) Moving beam (fluence = 0.85 J/cm2, beam size 1 mm2, lens focal length = 200 mm).

Publisher’s Note: MDPI stays neutral with regard to jurisdictional claims in published maps and institutional affiliations. |
© 2021 by the authors. Licensee MDPI, Basel, Switzerland. This article is an open access article distributed under the terms and conditions of the Creative Commons Attribution (CC BY) license (https://creativecommons.org/licenses/by/4.0/).
Share and Cite
MDPI and ACS Style
Marimuthu, S.; Pathak, S.; Radhakrishnan, J.; Kamara, A.M. In-Process Monitoring of Laser Surface Modification. Coatings 2021, 11, 886. https://0-doi-org.brum.beds.ac.uk/10.3390/coatings11080886
AMA Style
Marimuthu S, Pathak S, Radhakrishnan J, Kamara AM. In-Process Monitoring of Laser Surface Modification. Coatings. 2021; 11(8):886. https://0-doi-org.brum.beds.ac.uk/10.3390/coatings11080886
Chicago/Turabian StyleMarimuthu, Sundar, Sunil Pathak, Jagdheesh Radhakrishnan, and Alhaji M. Kamara. 2021. "In-Process Monitoring of Laser Surface Modification" Coatings 11, no. 8: 886. https://0-doi-org.brum.beds.ac.uk/10.3390/coatings11080886
Note that from the first issue of 2016, this journal uses article numbers instead of page numbers. See further details here.