
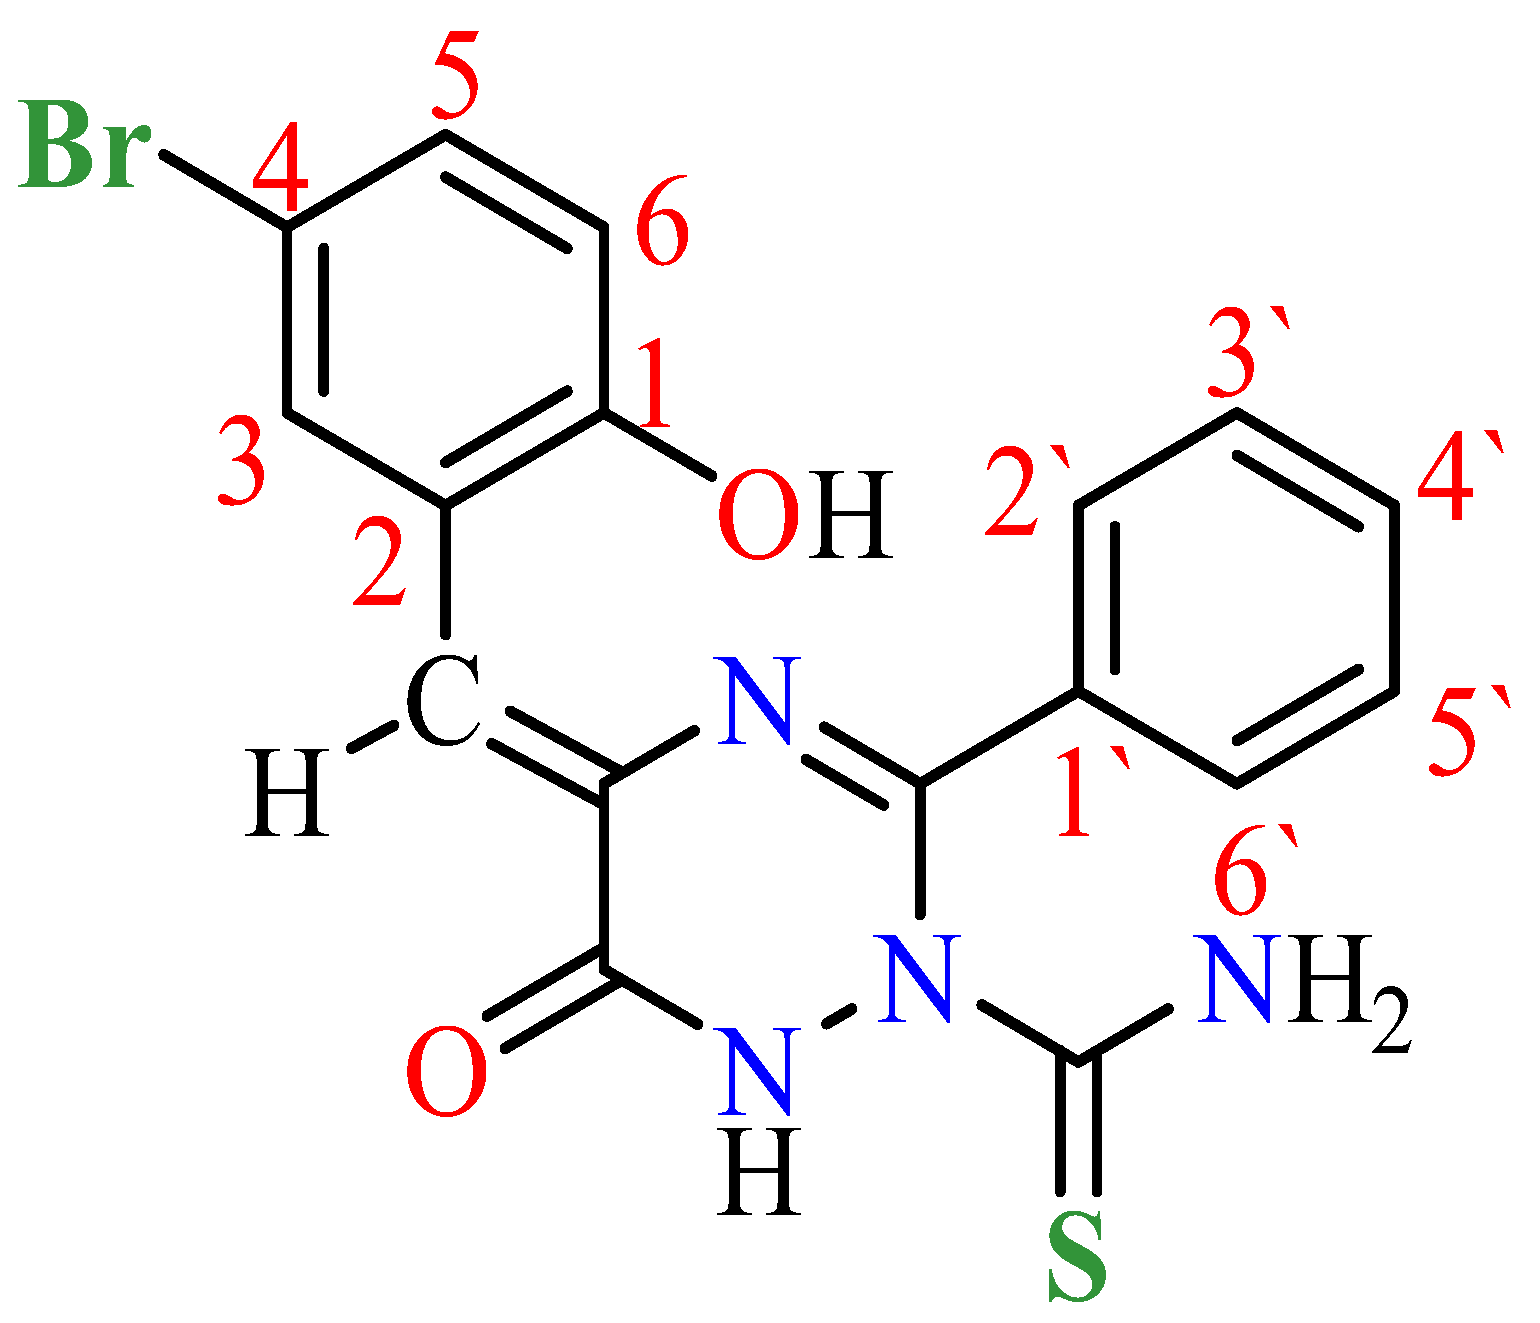
Spectroscopic and Physicochemical Studies on 1,2,4-Triazine Derivative

 , , , , and
Abstract
:1. Introduction
2. Methods and Materials
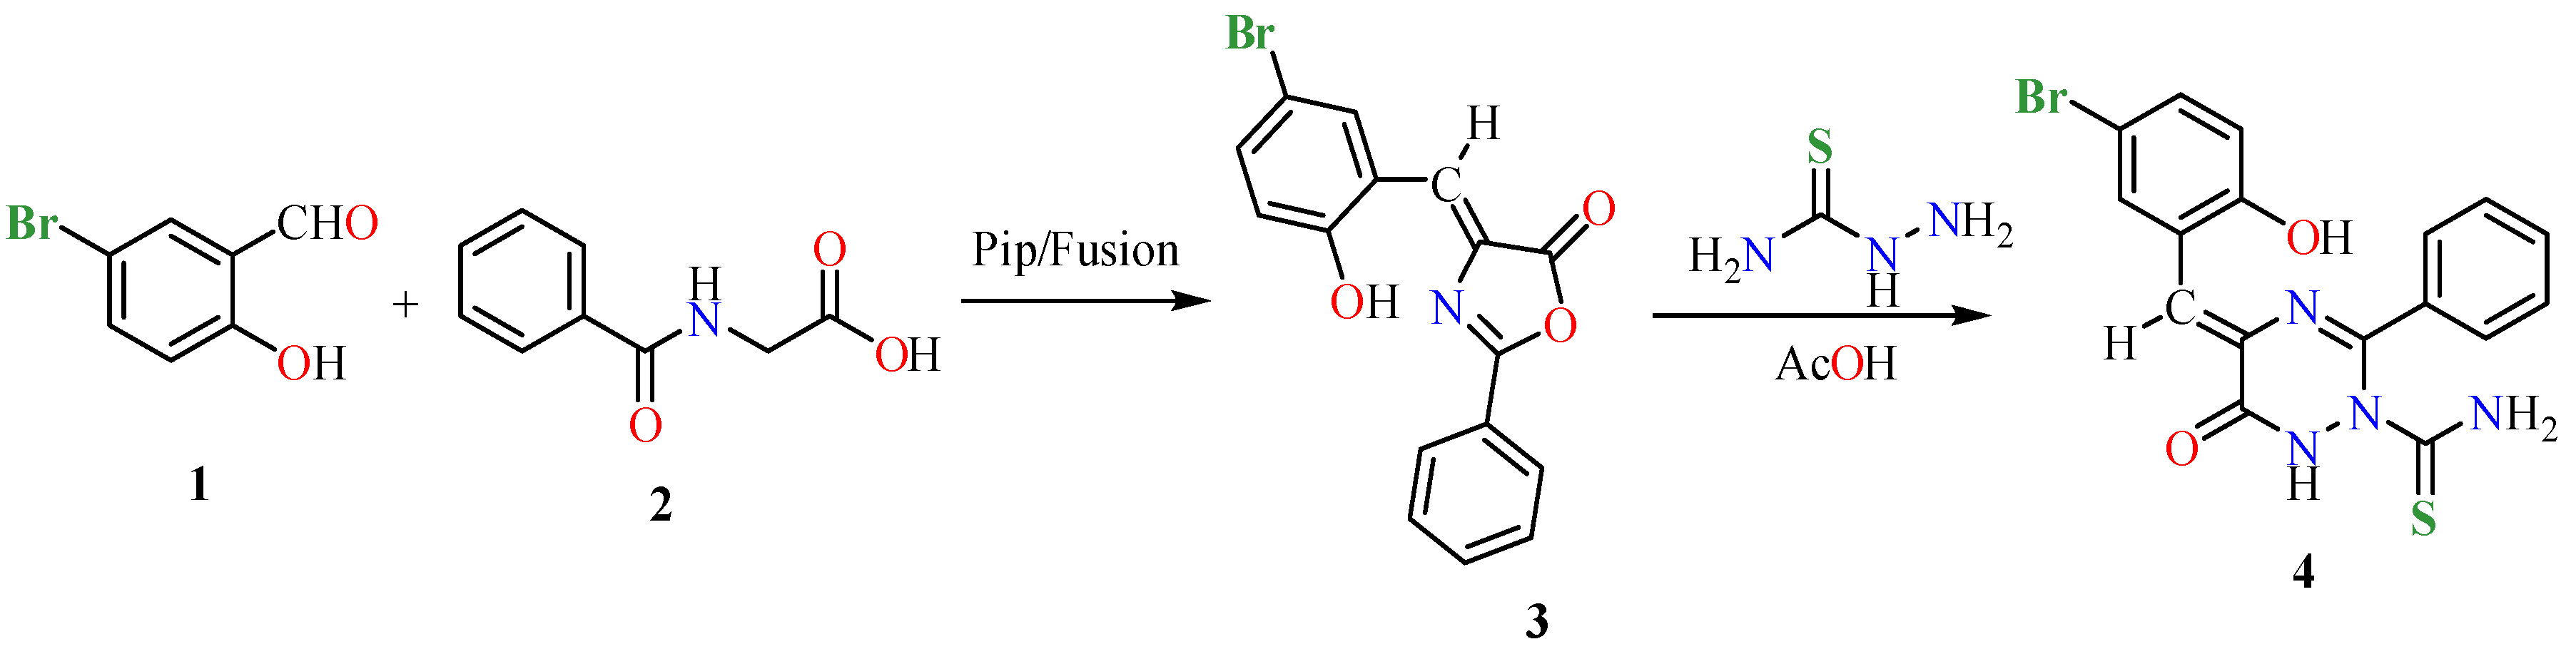
Preparation of “5-(5-Bromo-2-hydroxybenzylidene)-6-oxo-3-phenyl-5,6-dihydro-1,2,4-triazine-2(1H)-carbothioamide” (4)
3. Results and Discussion
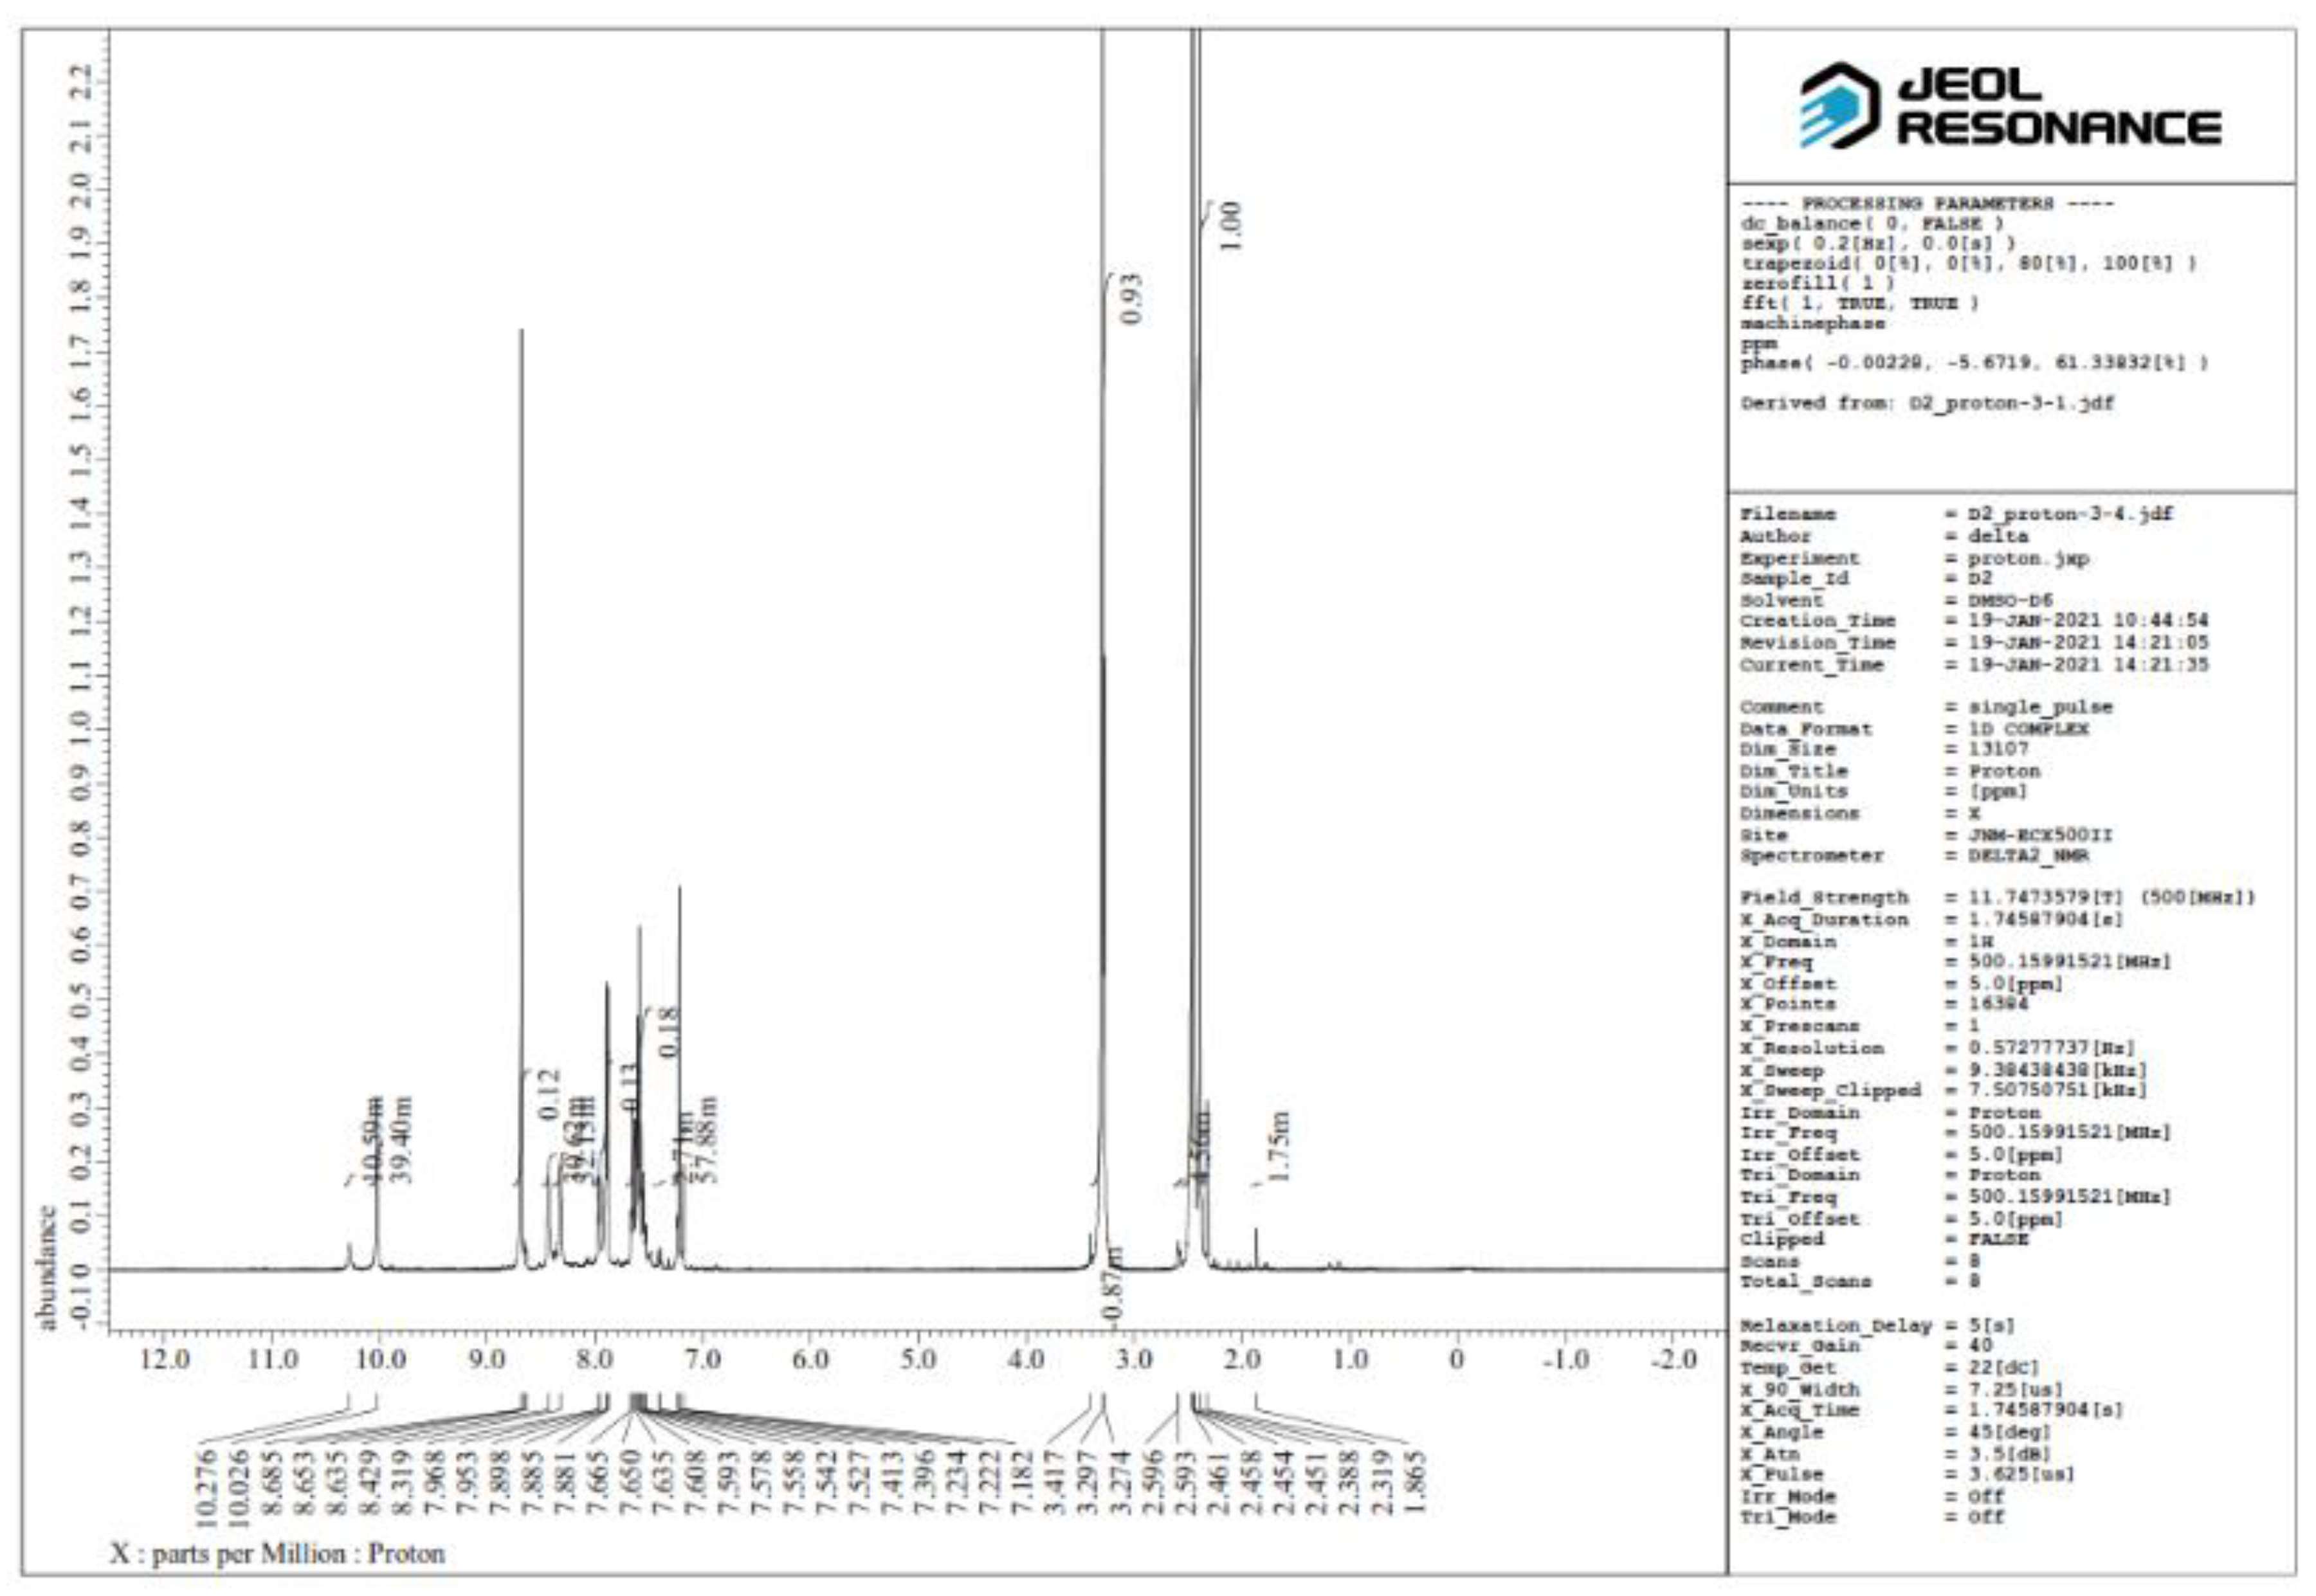
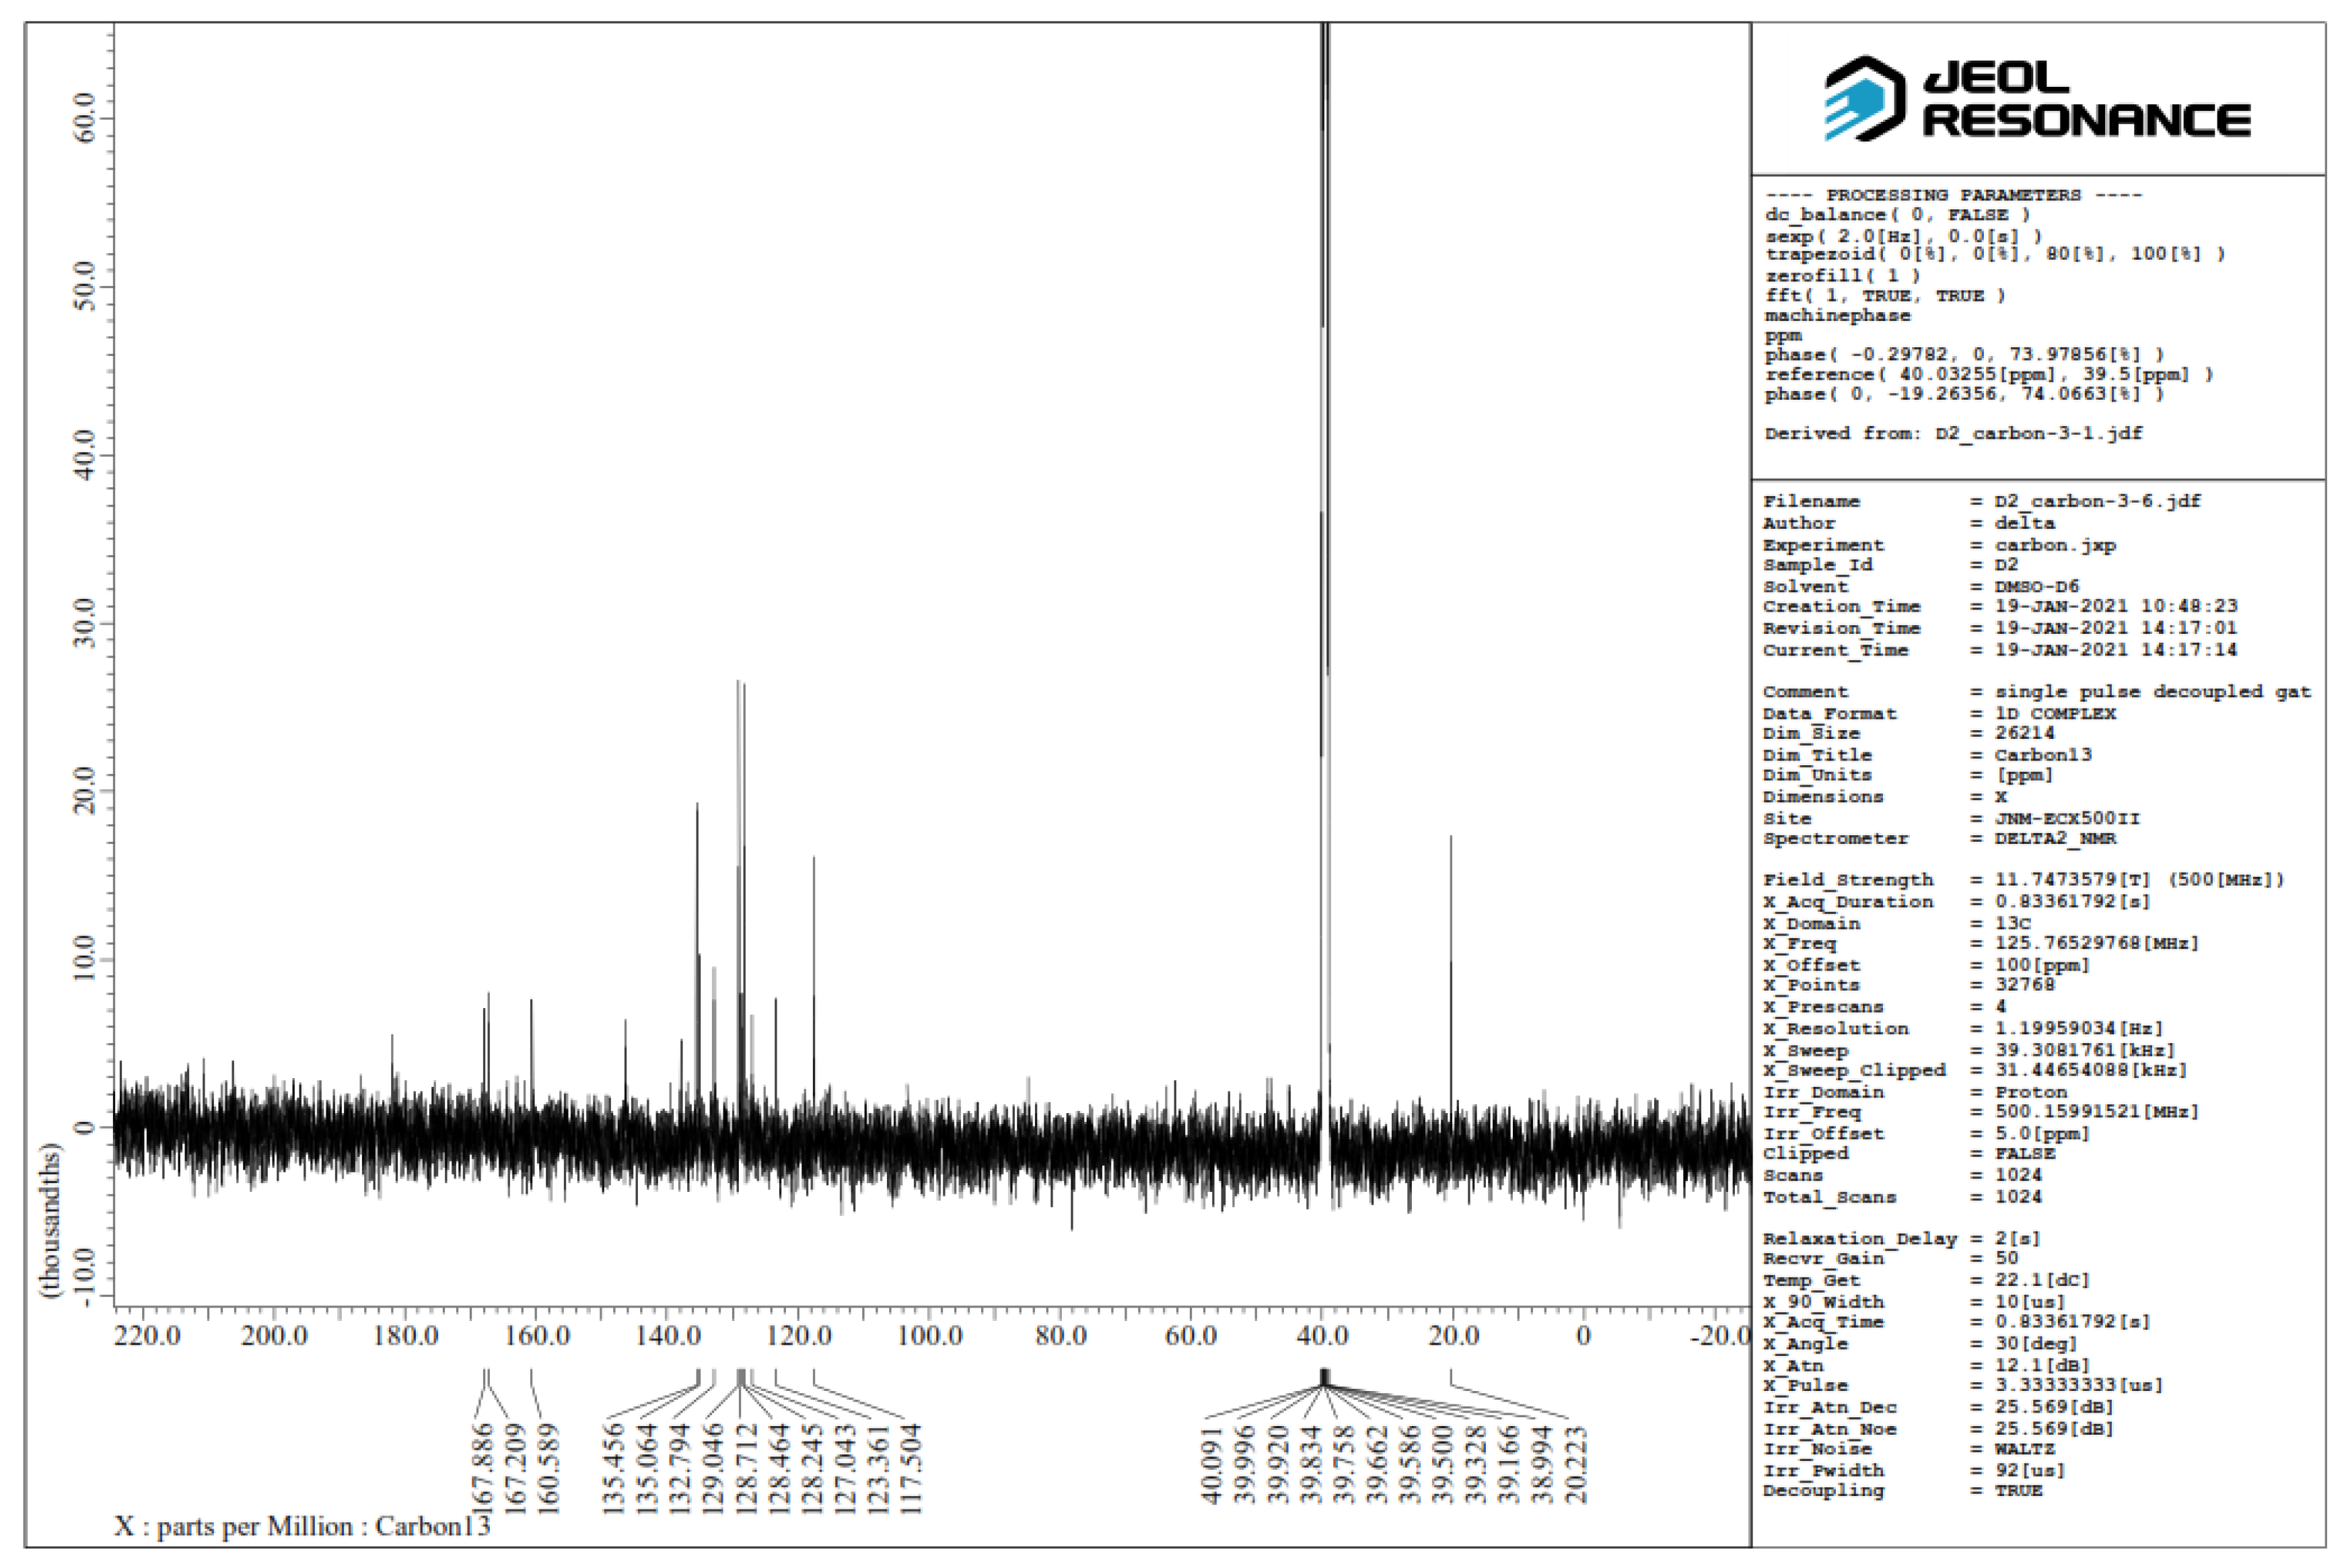
3.1. H-NMR and 13C-NMR Spectral Studies
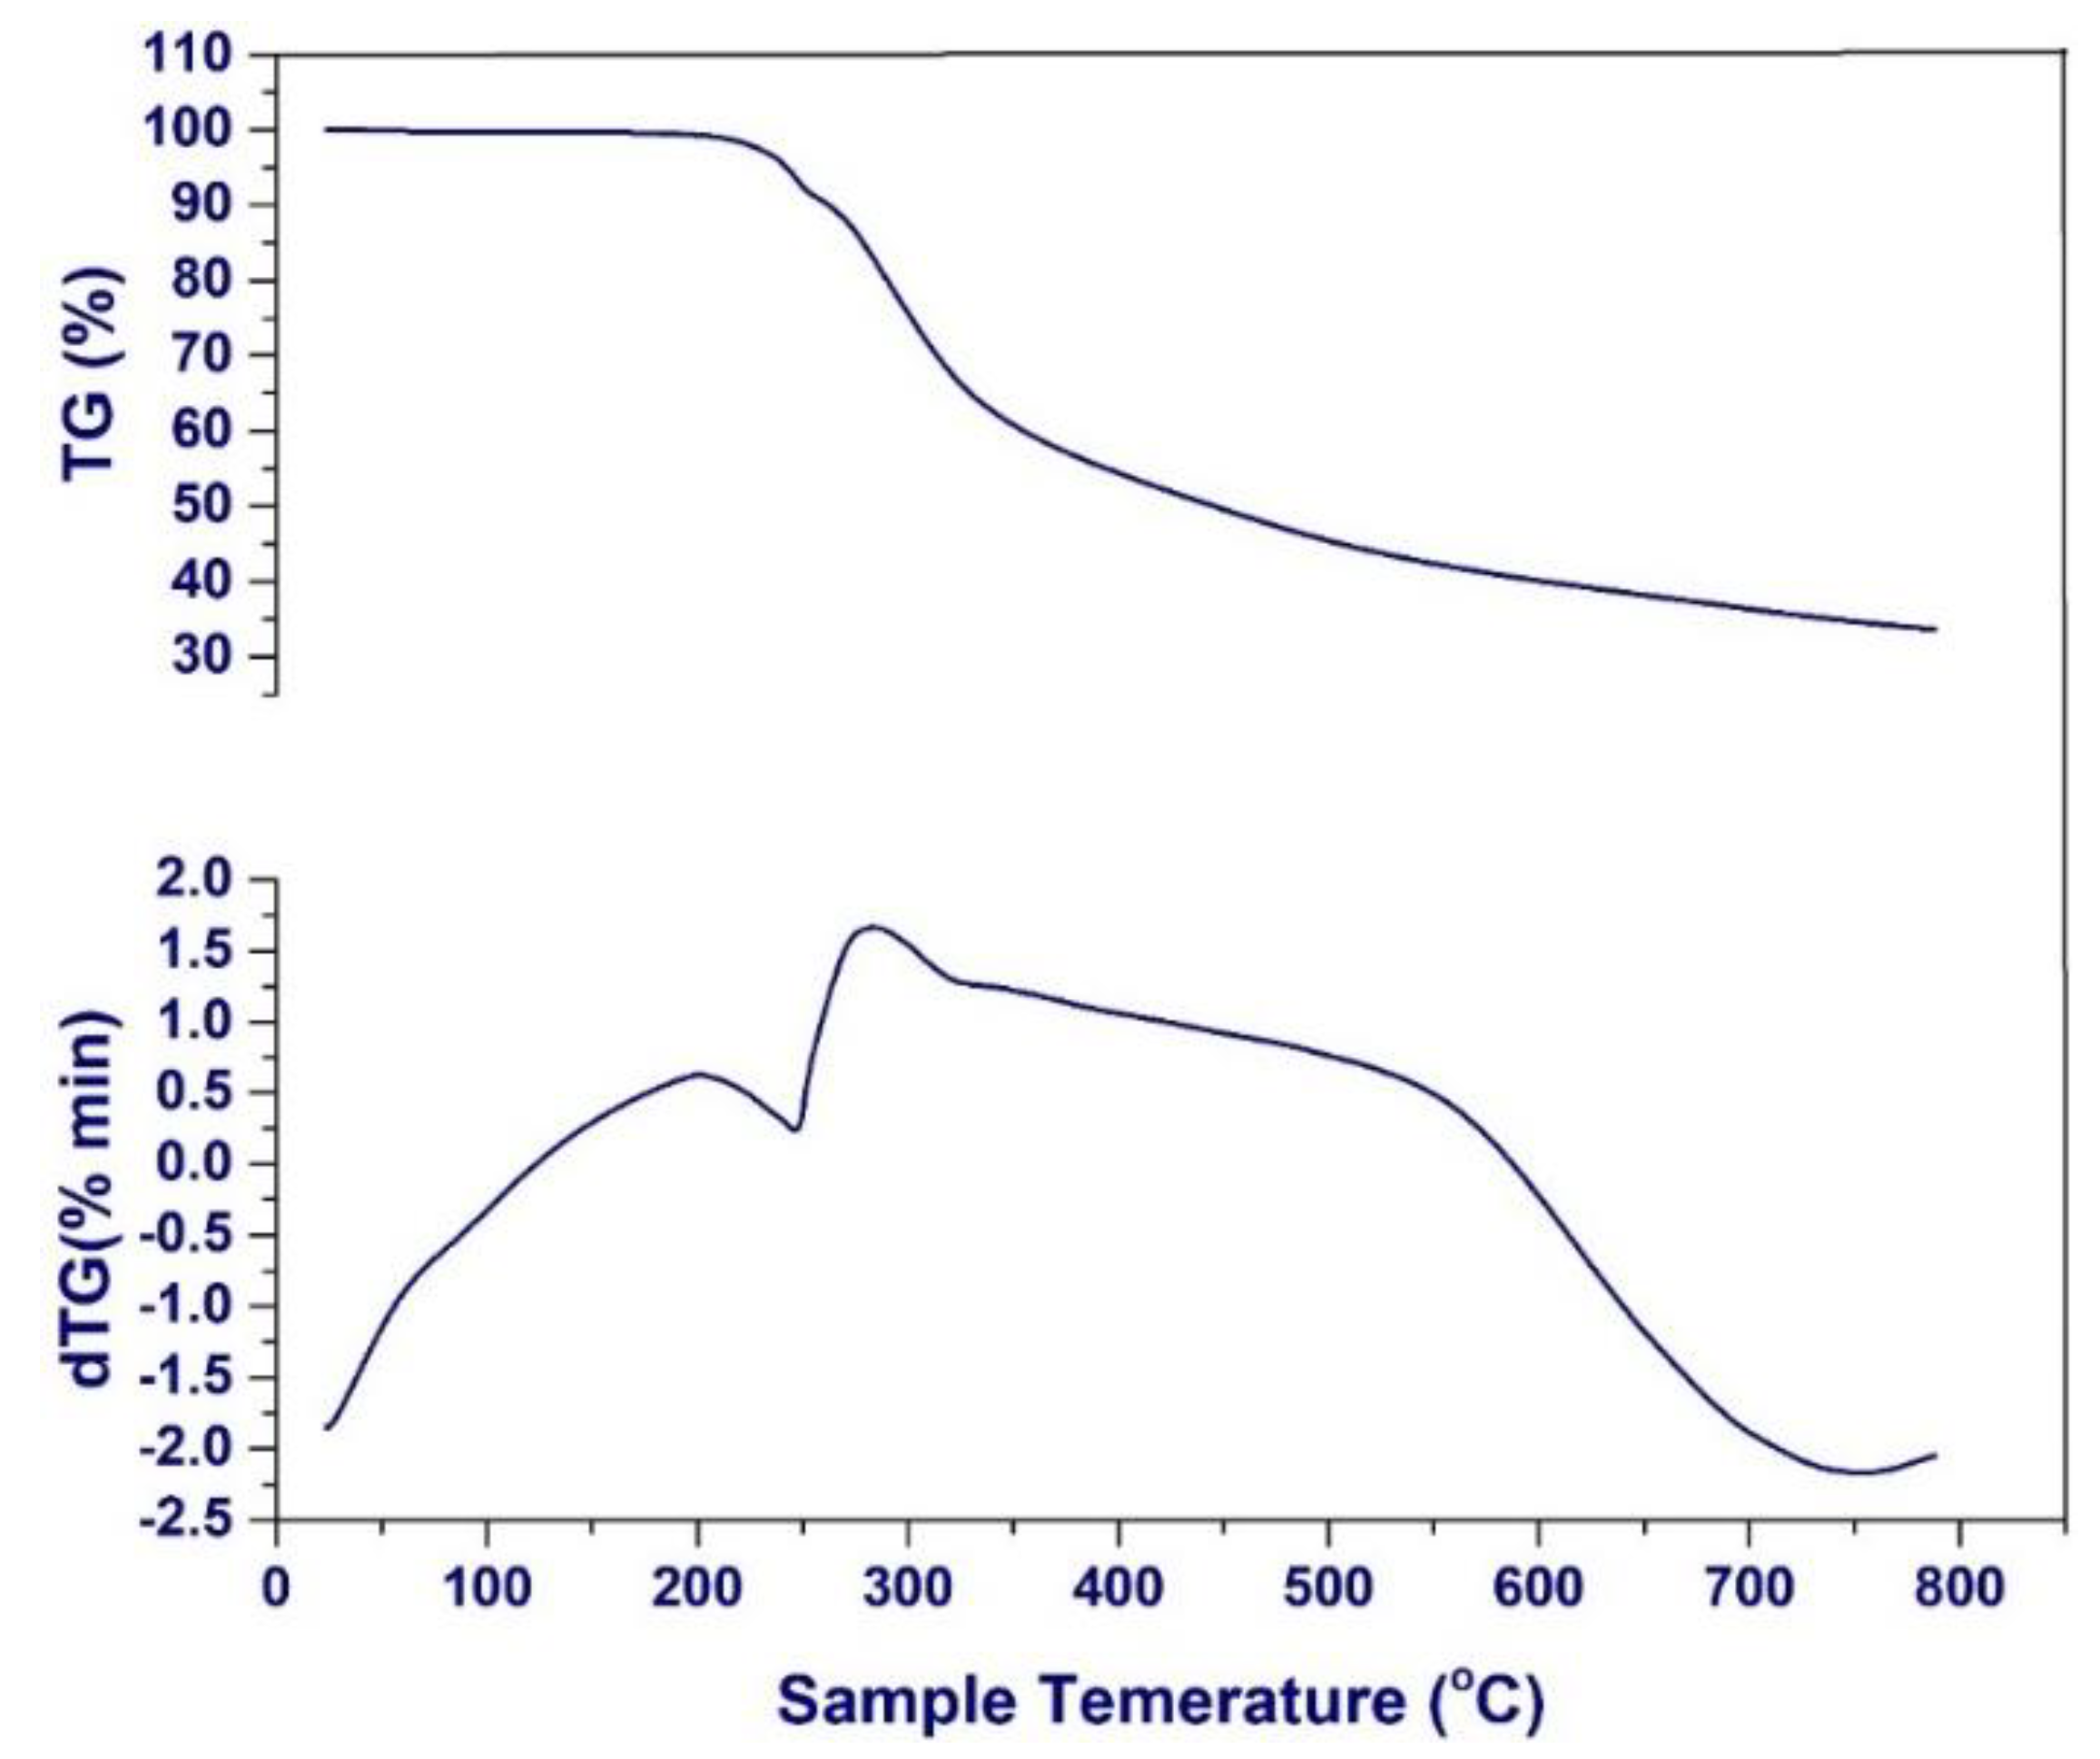
3.2. Thermal Analysis Study
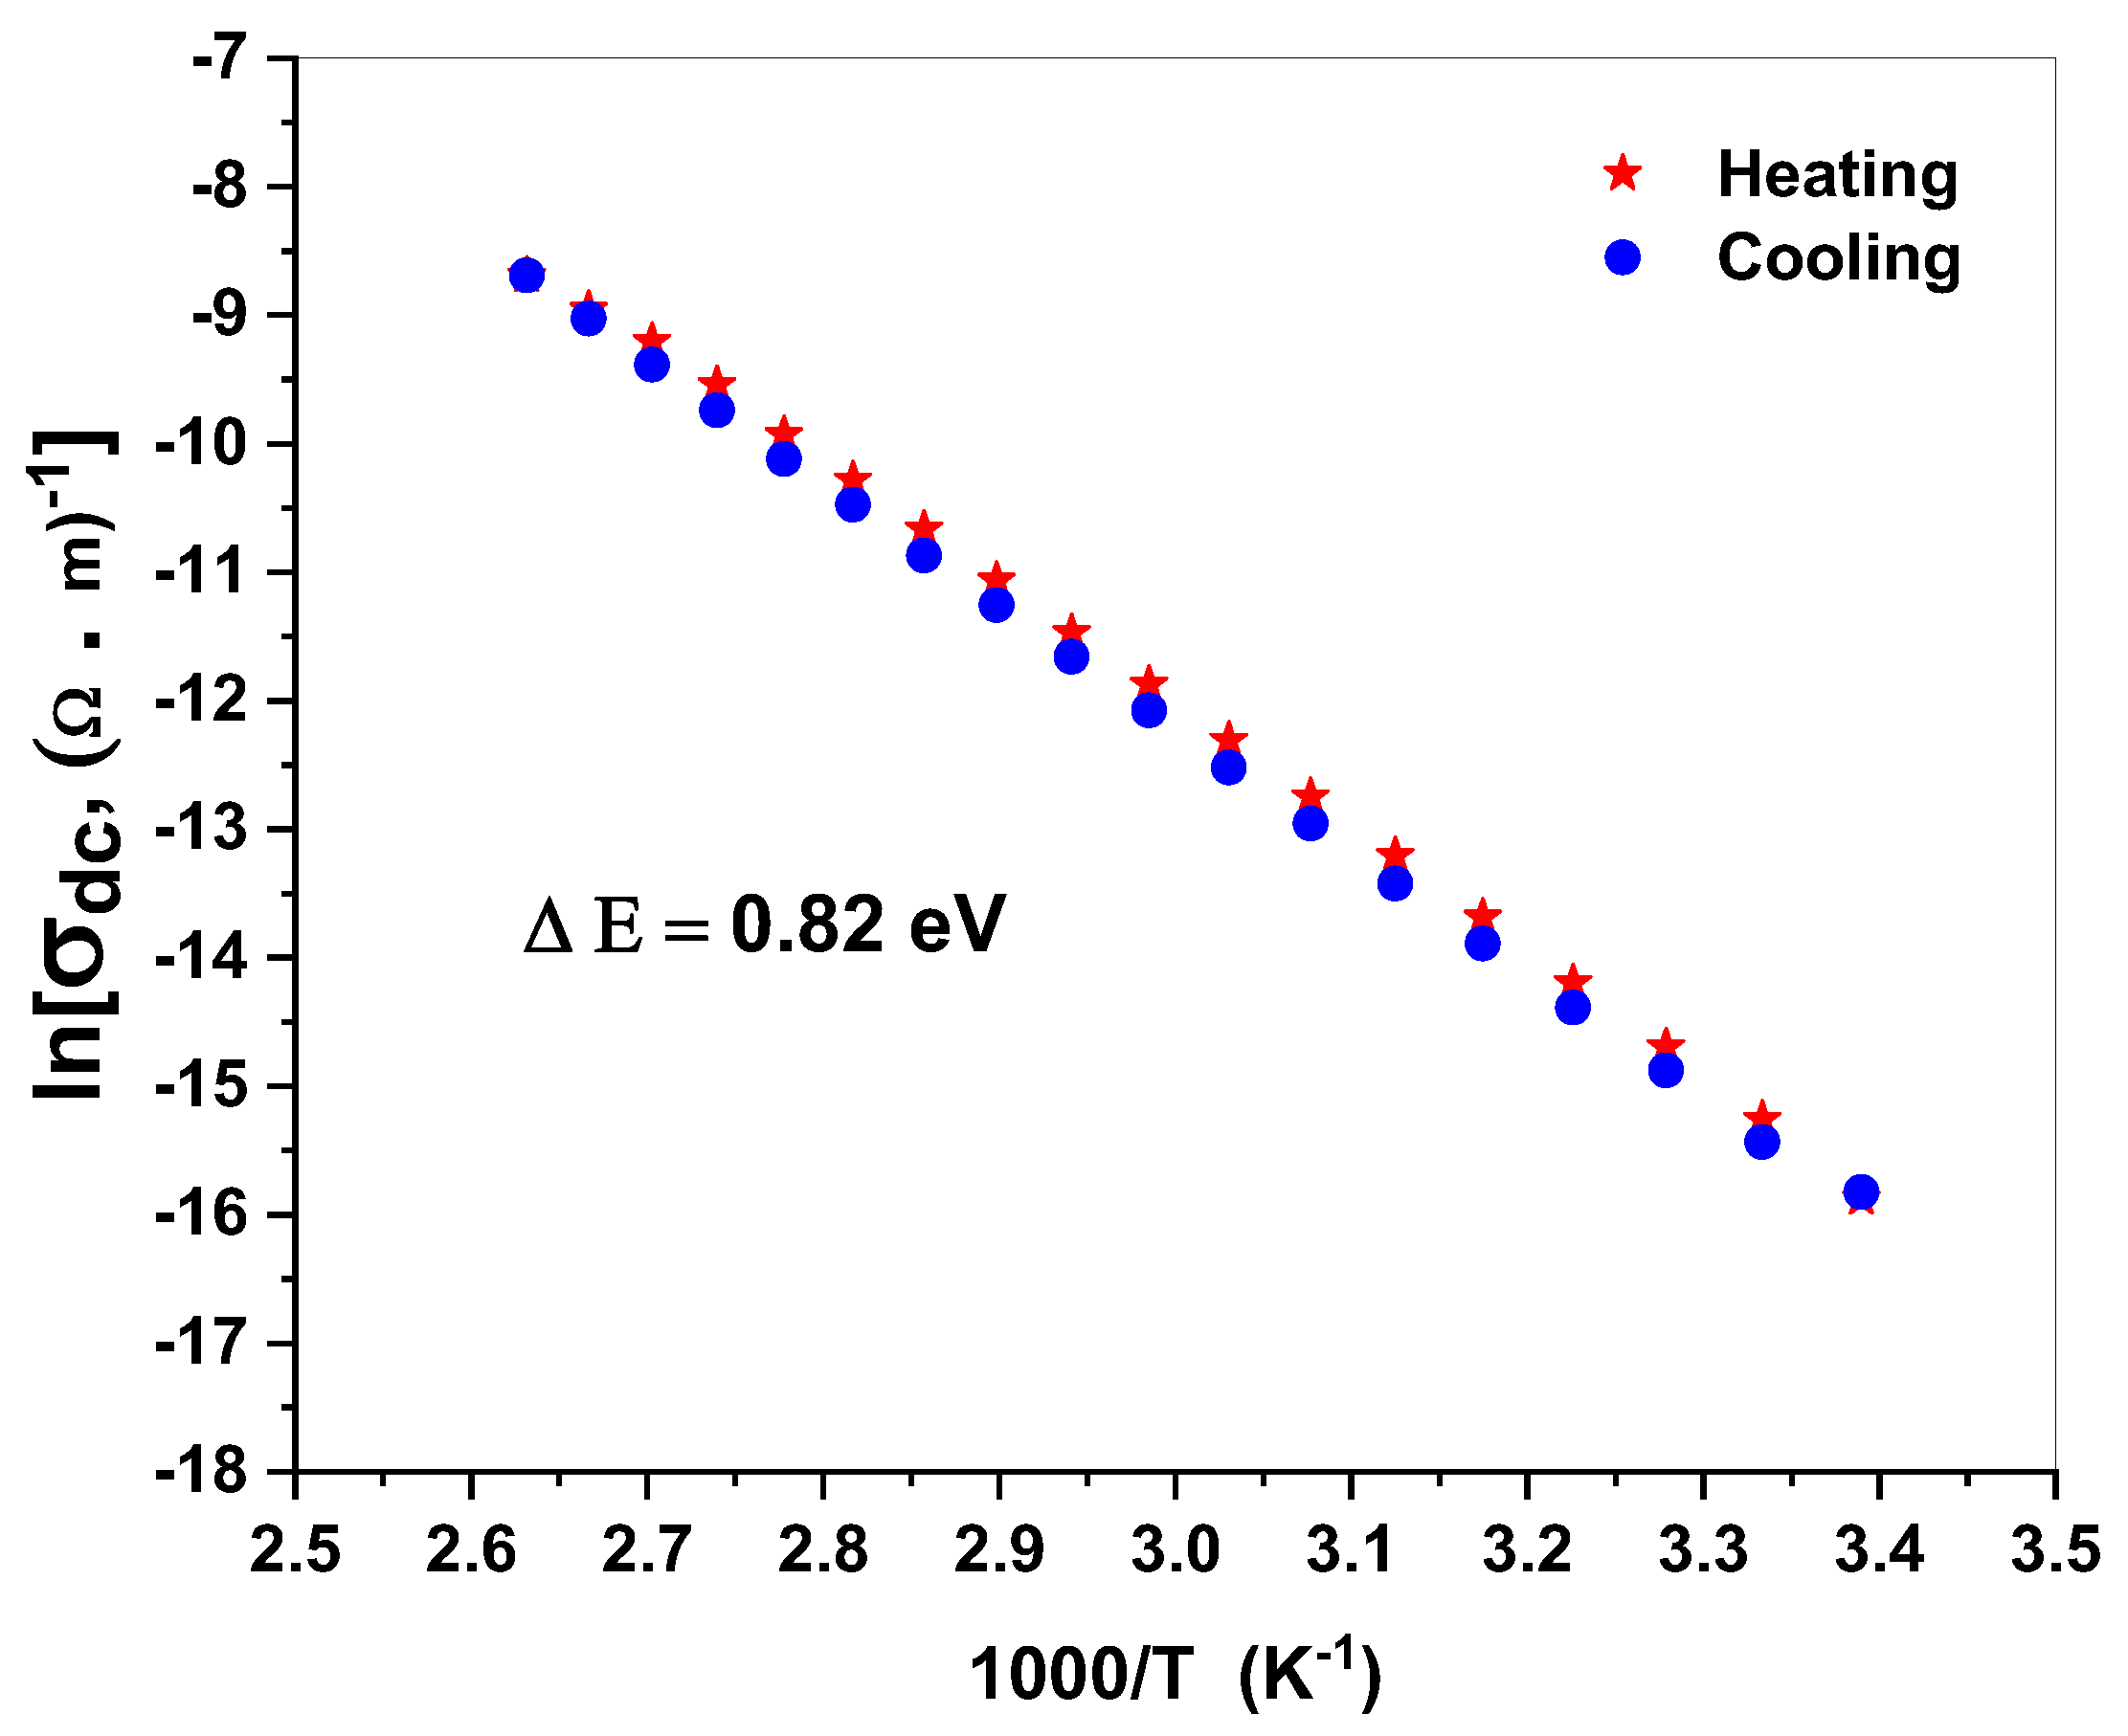
3.3. Kinetic Thermodynamic Parameter Calculations
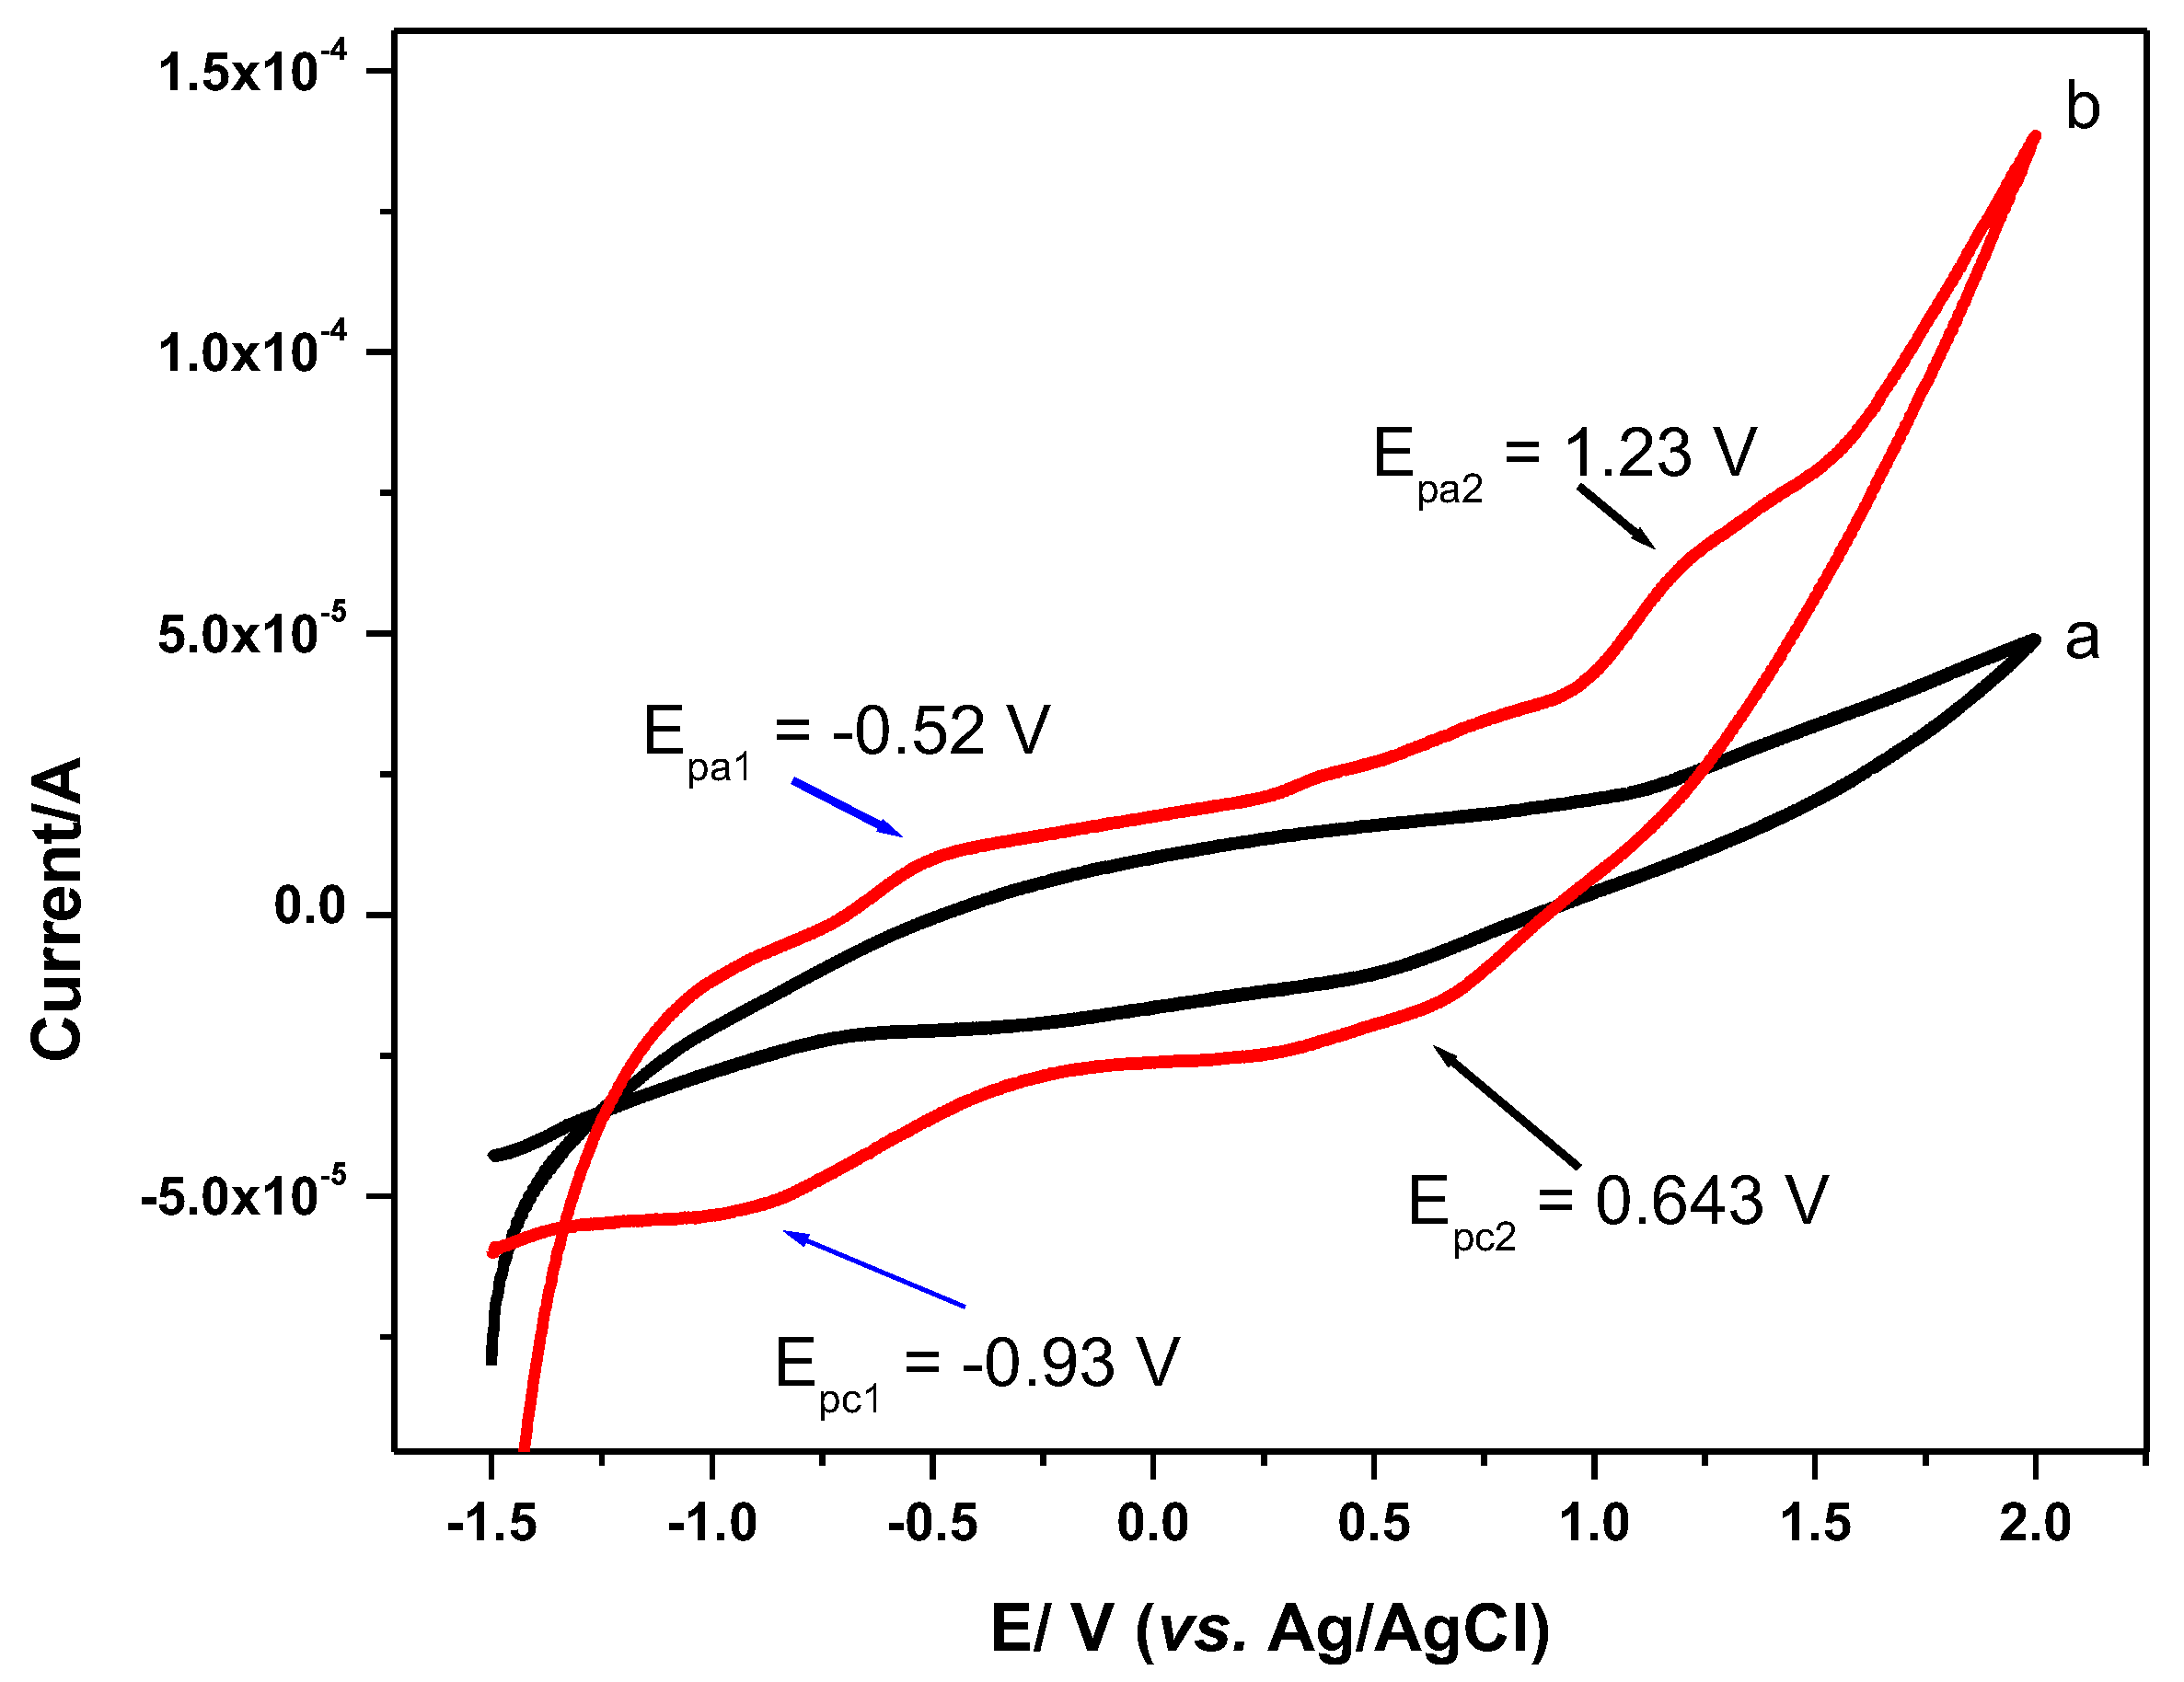
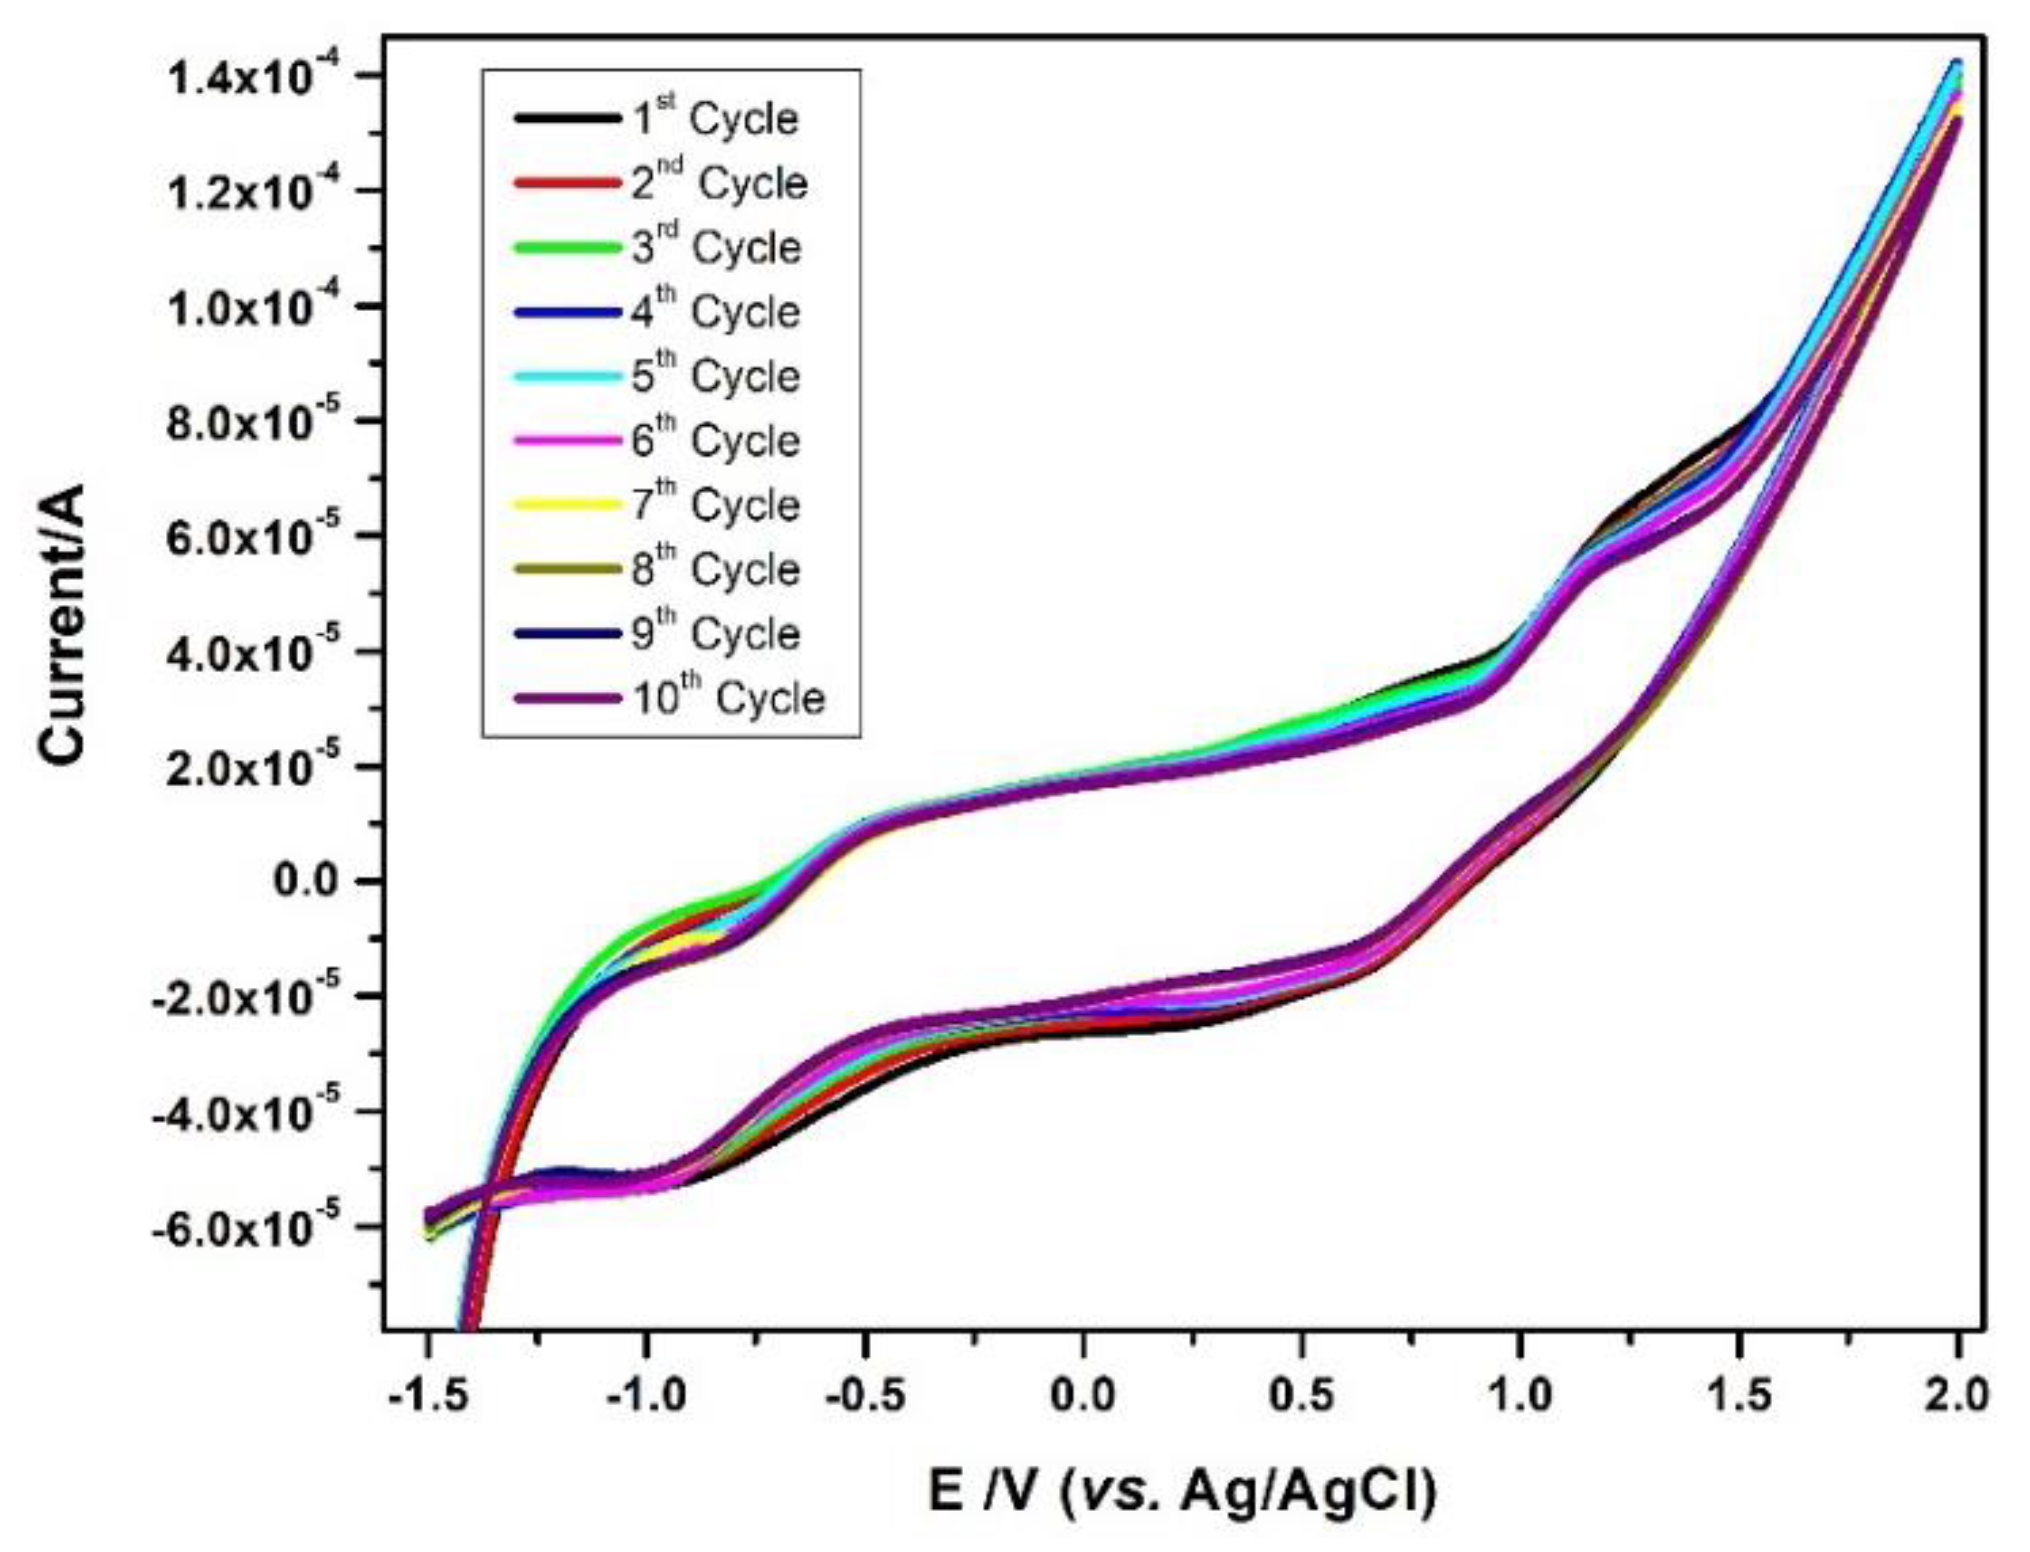
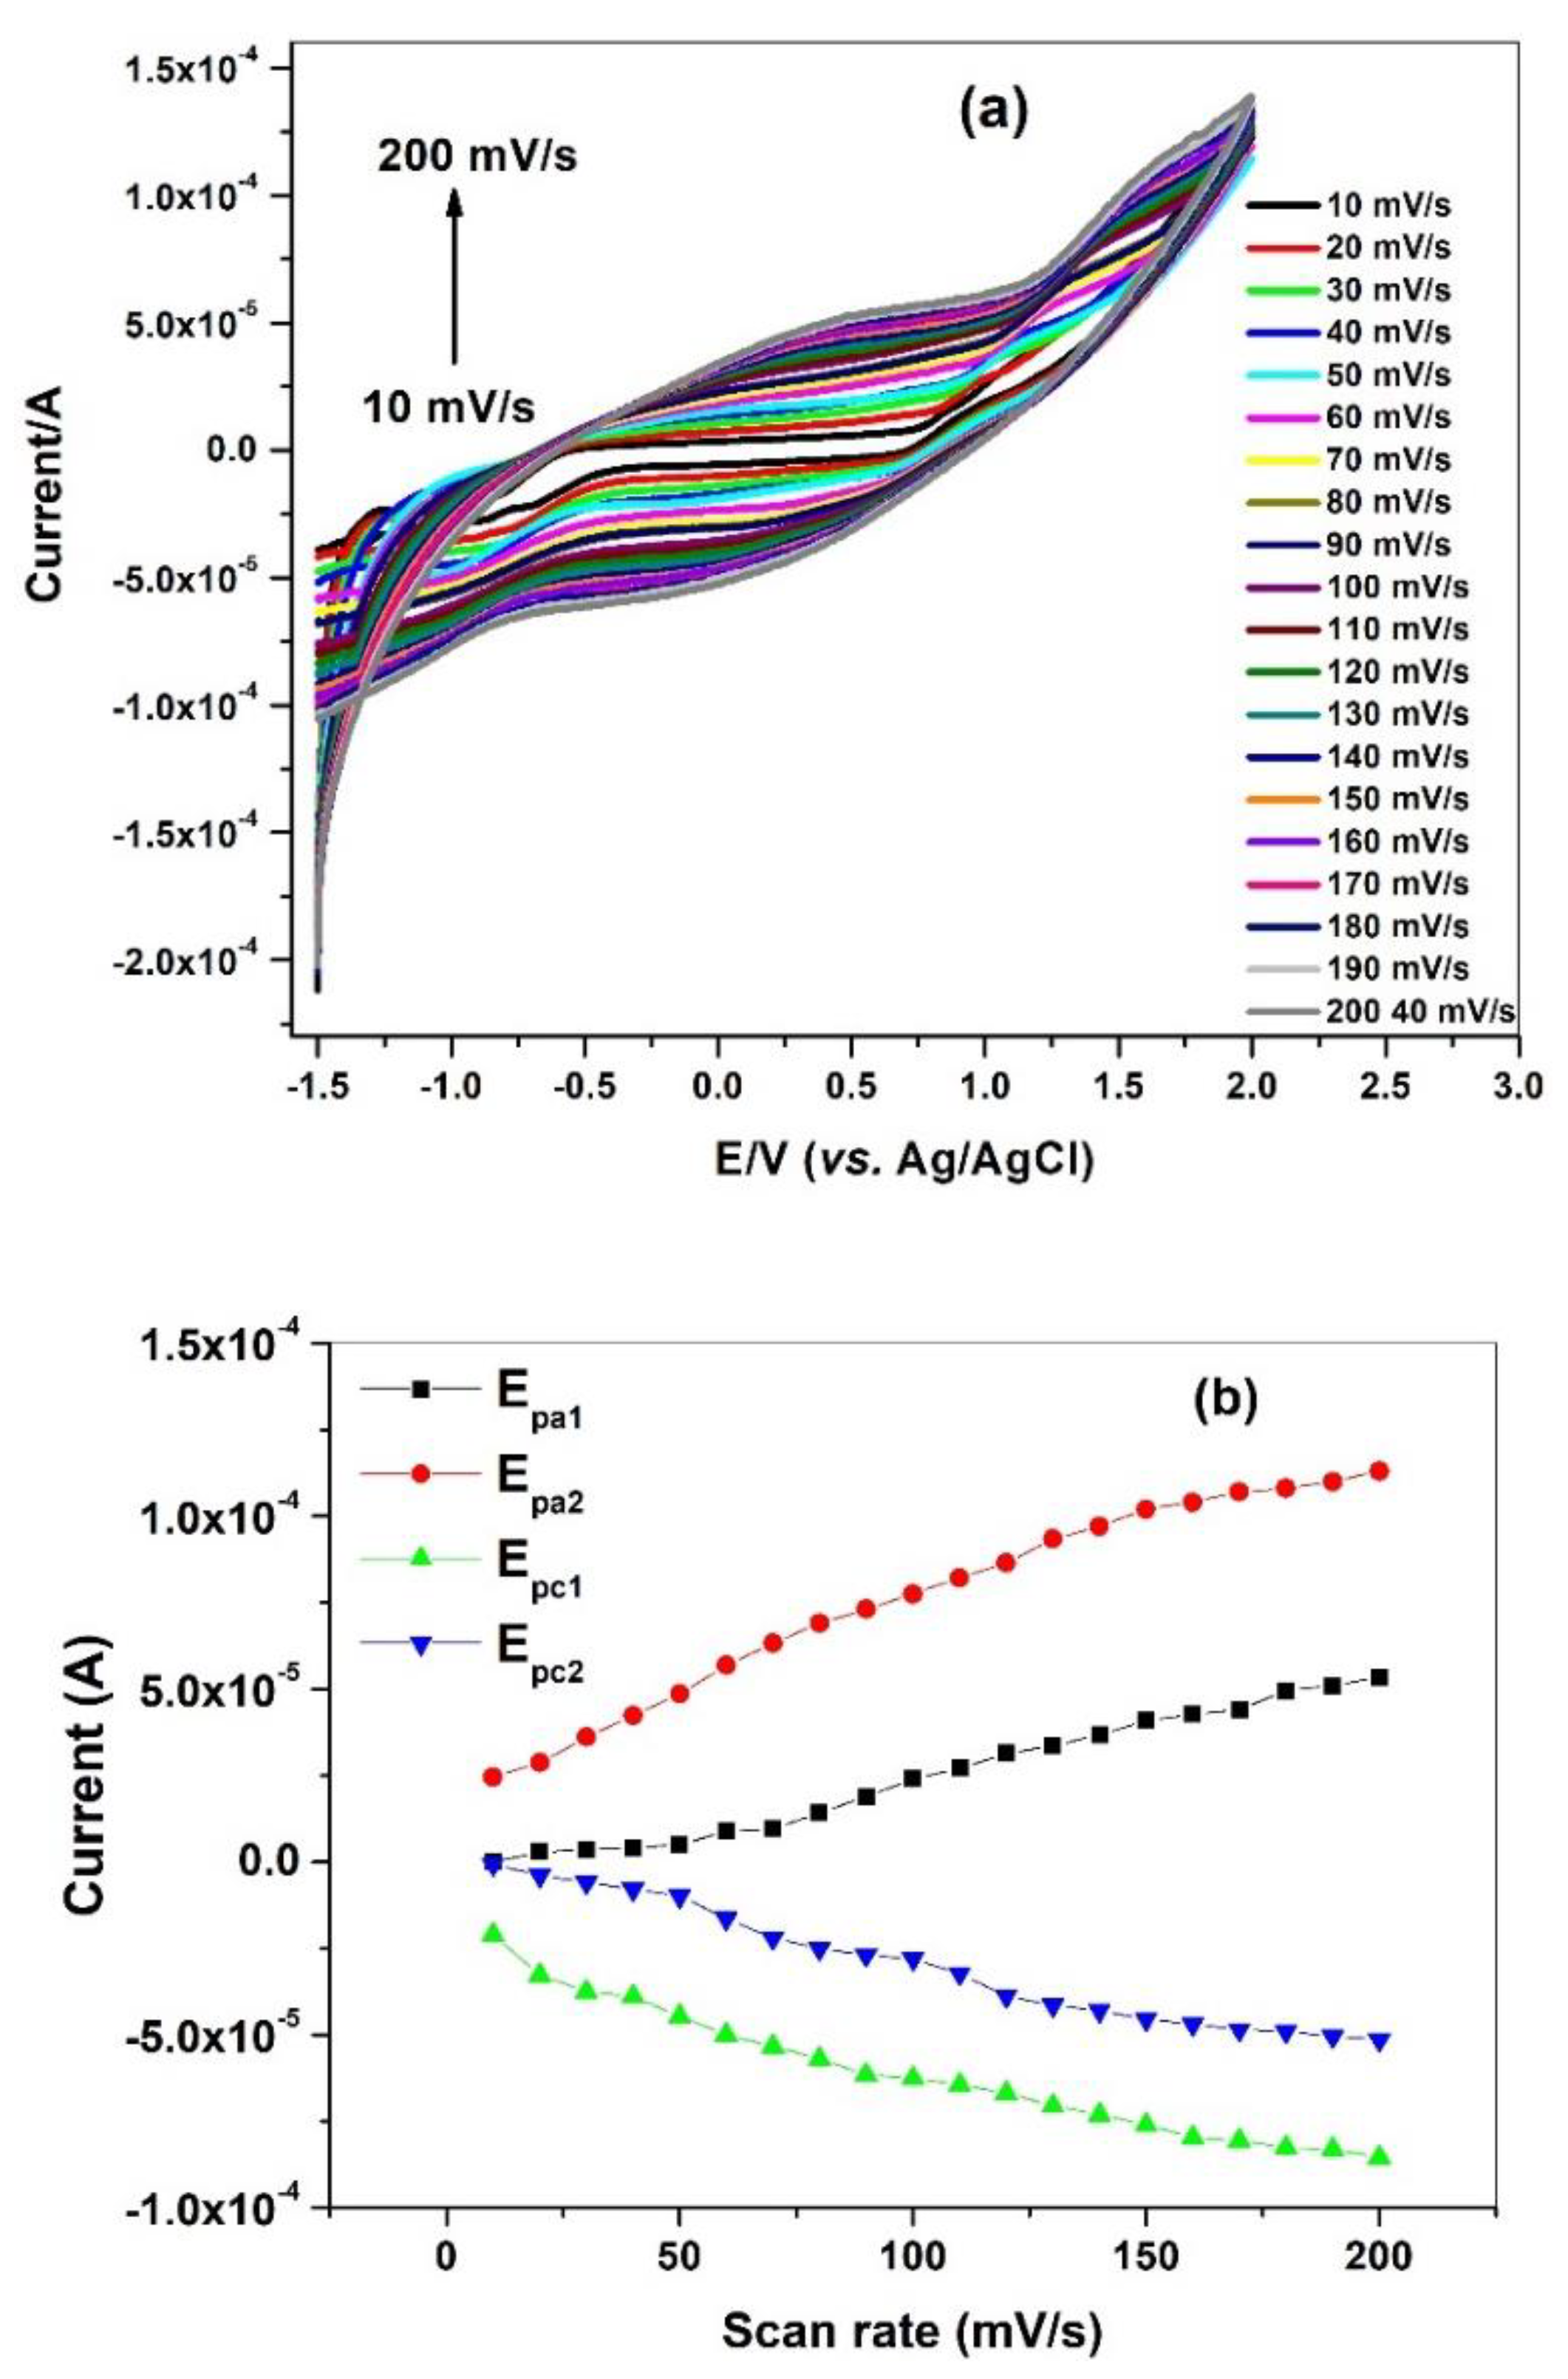
3.4. Cyclic Voltammetric Studies
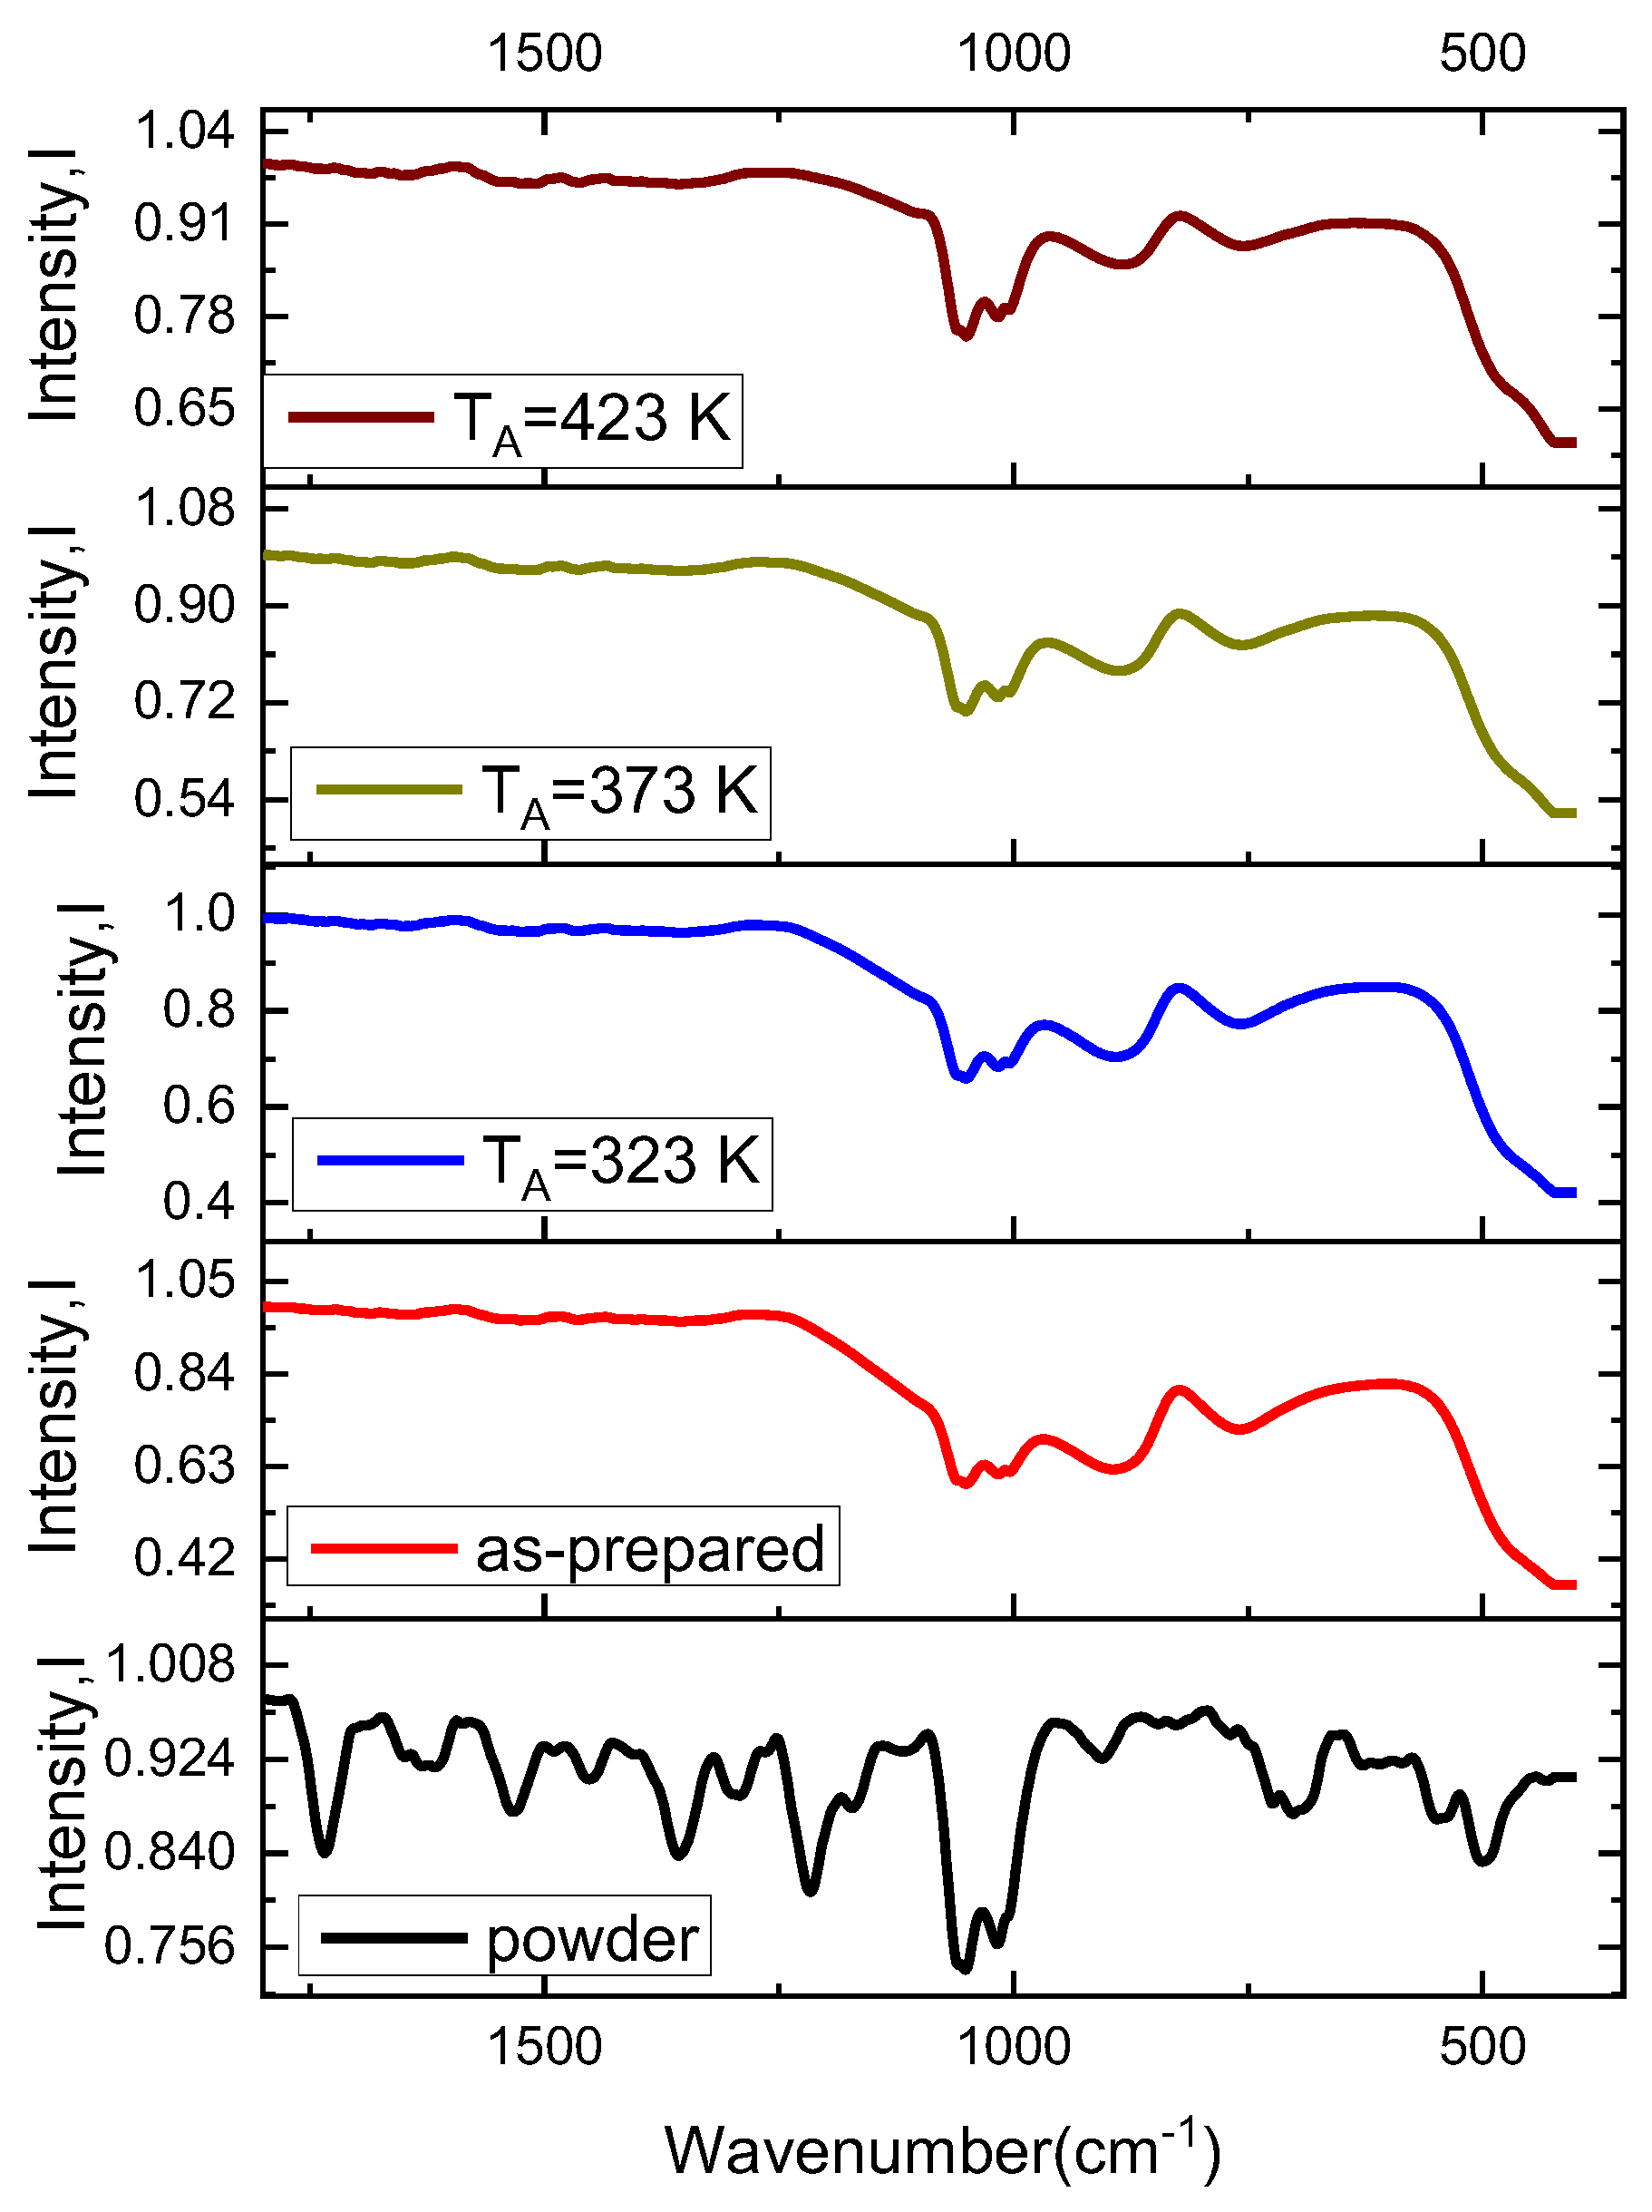
3.5. Infrared Spectral Study
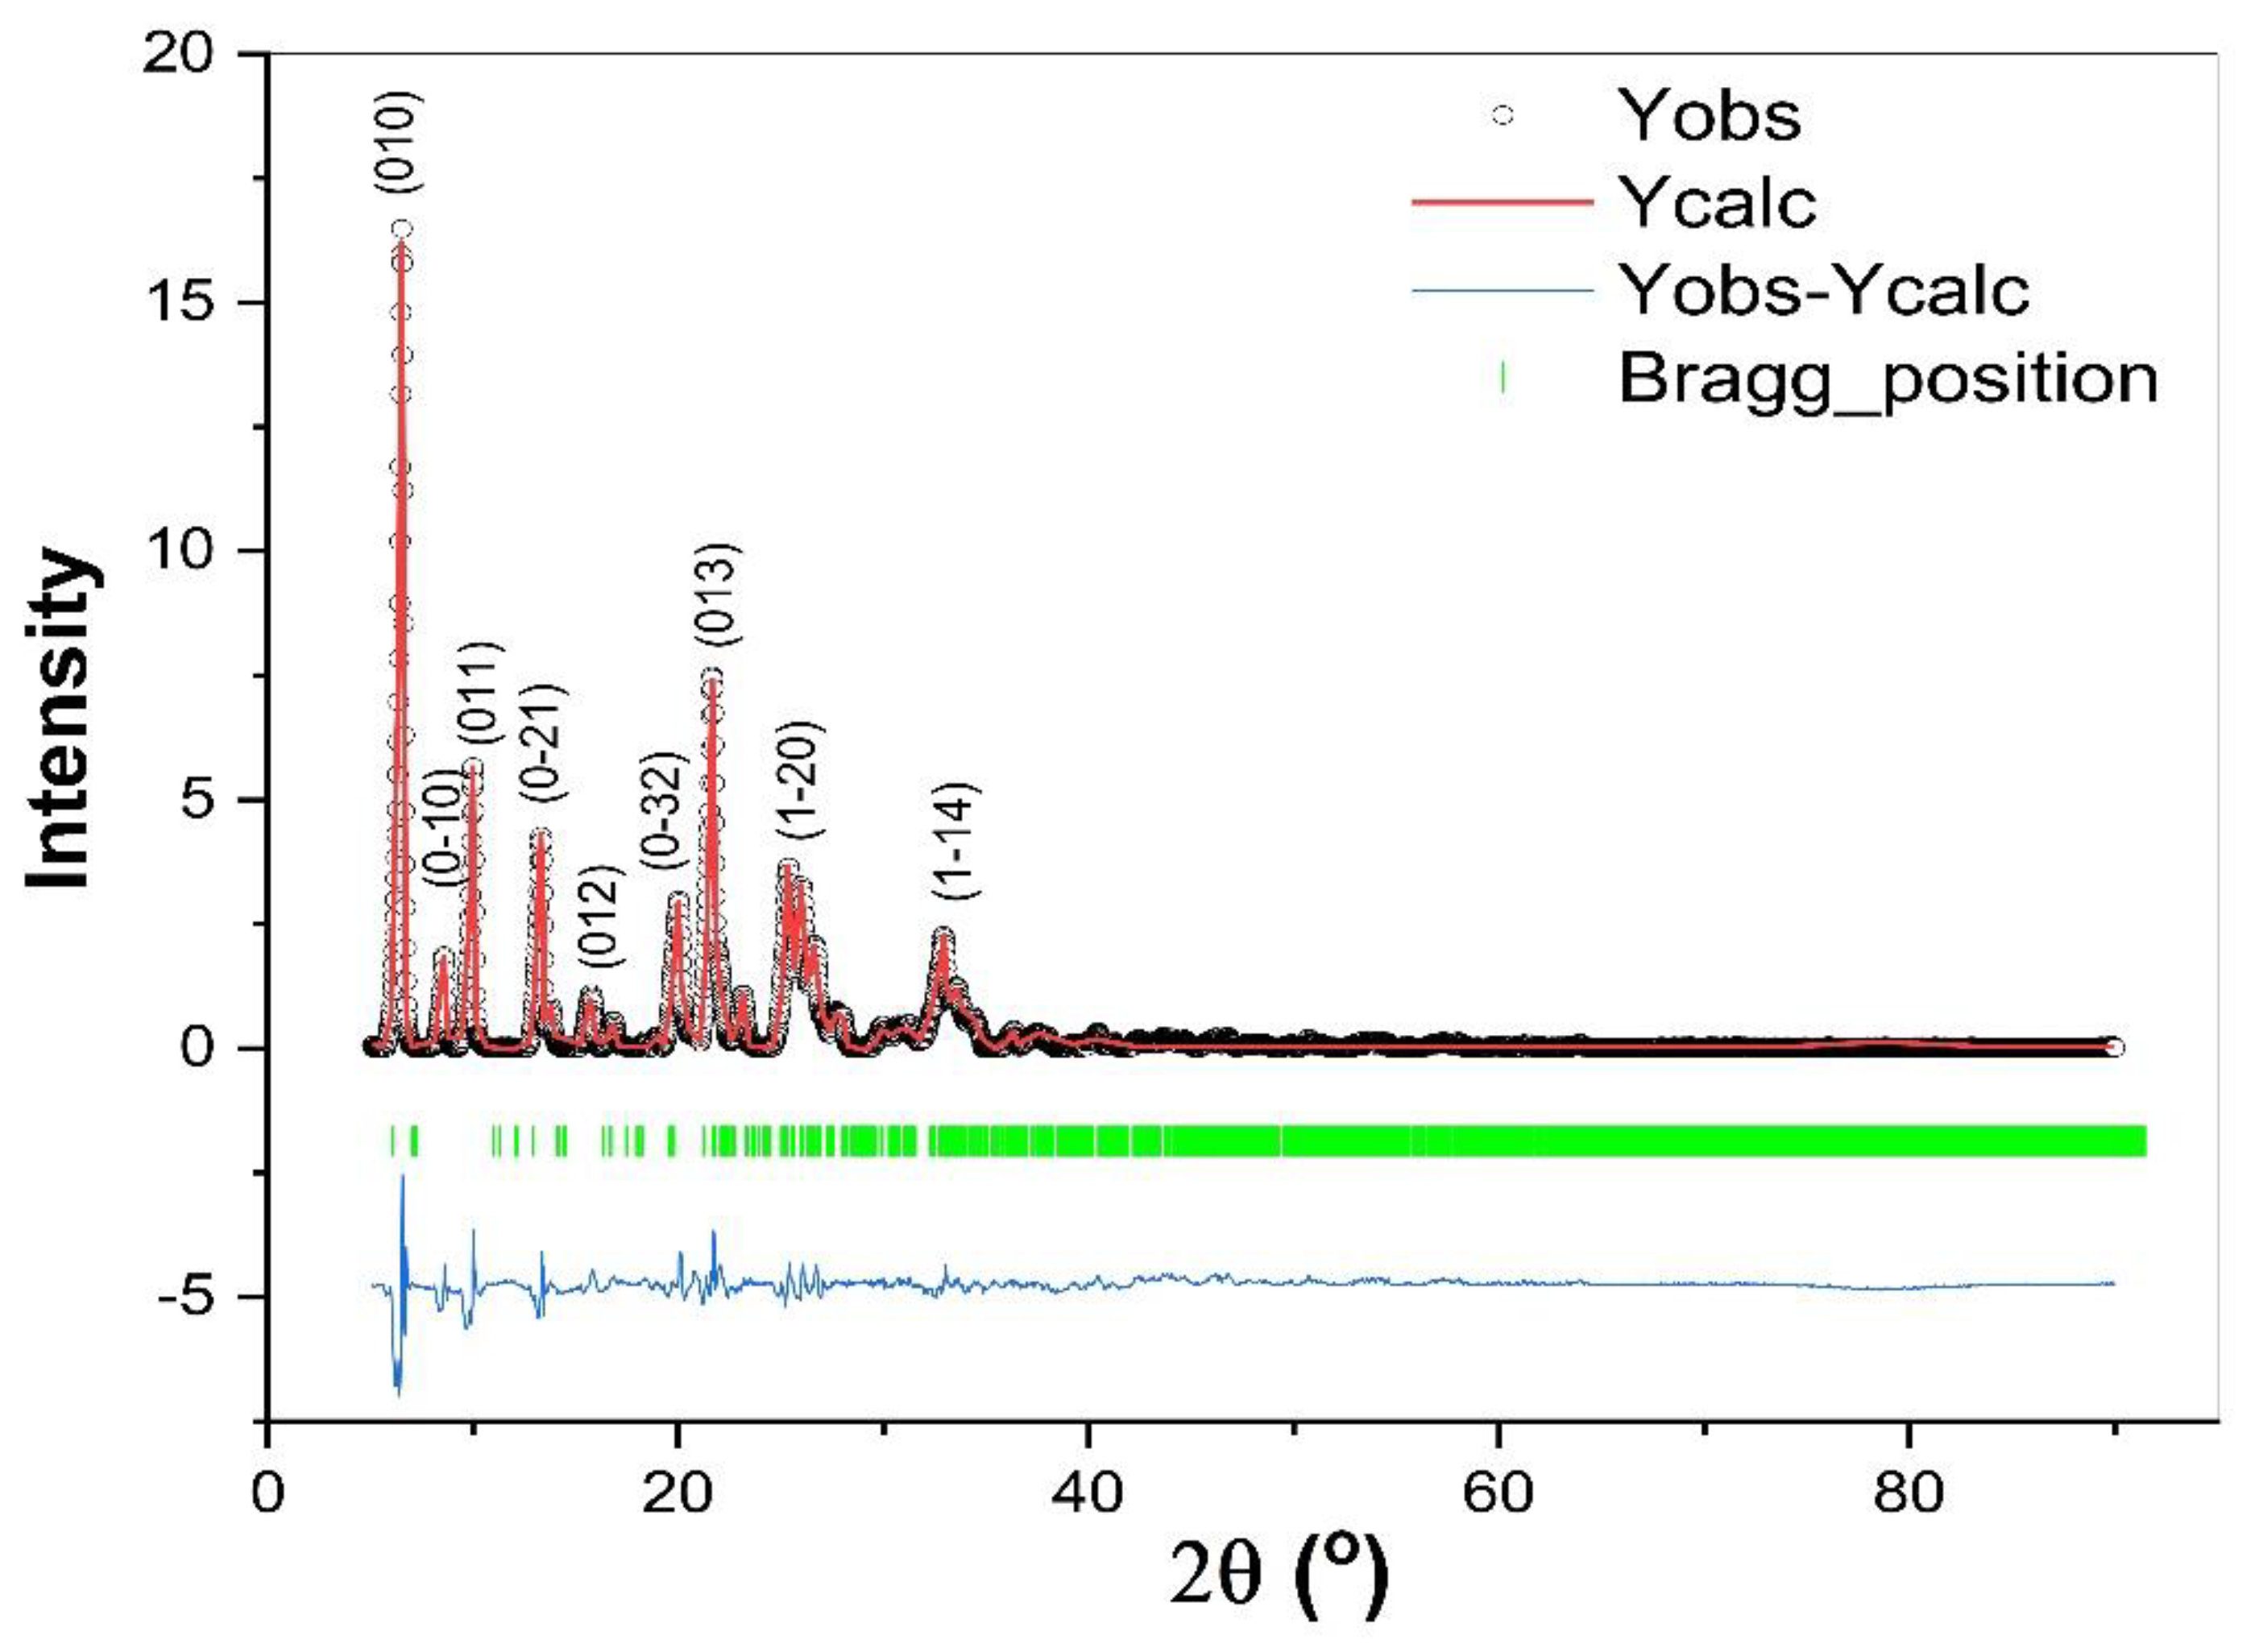
3.6. X-ray Analysis
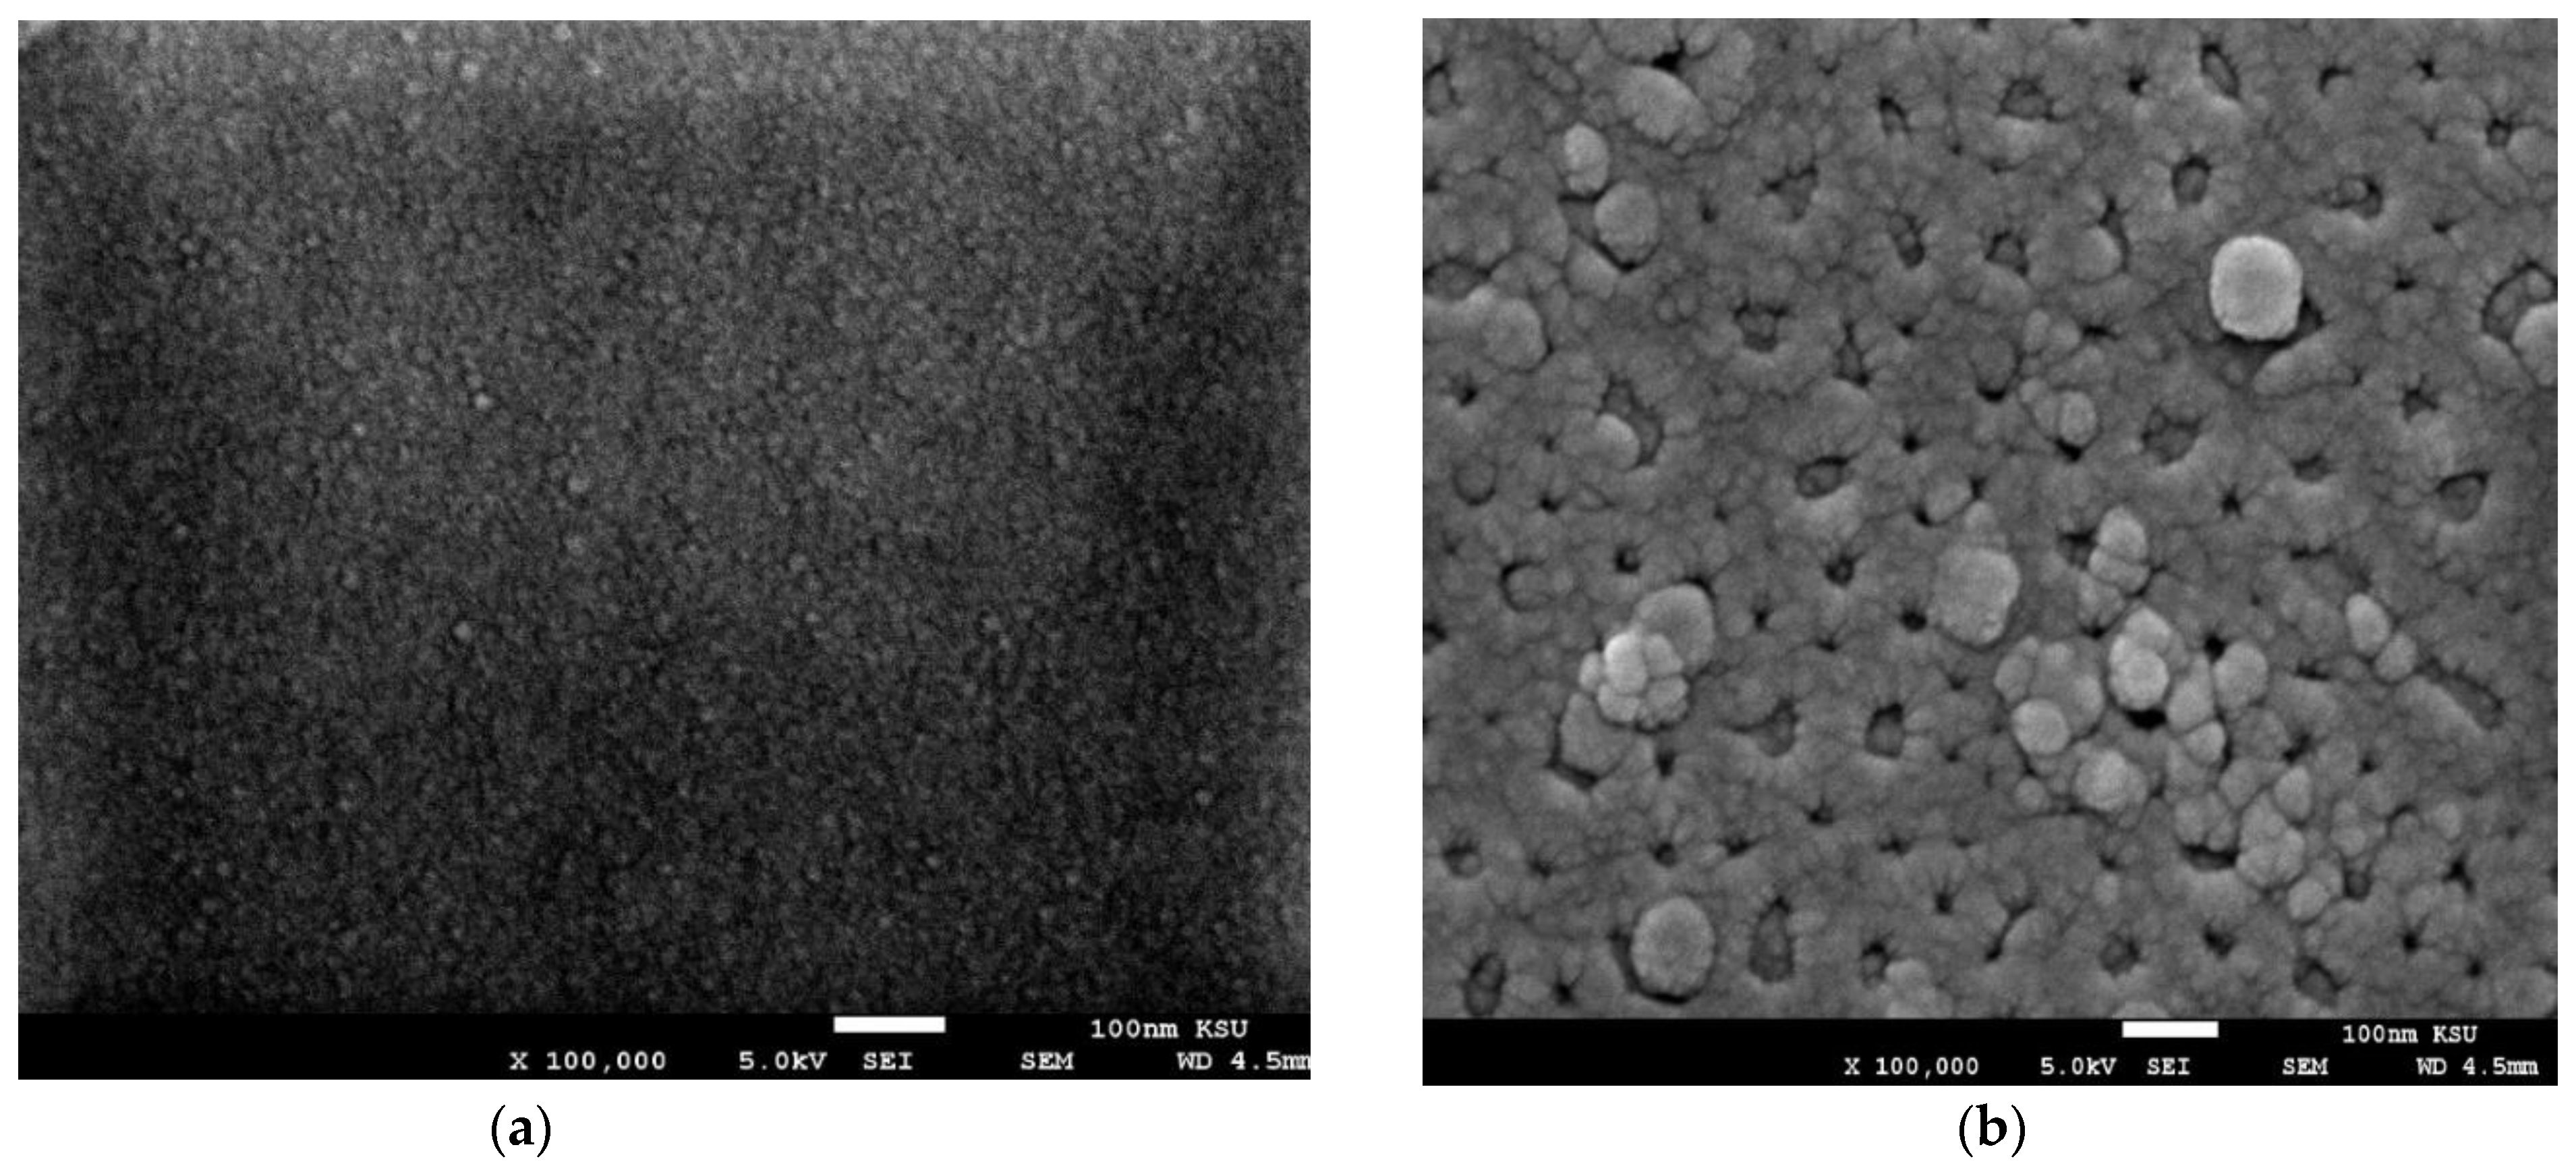
3.7. FESEM Analysis
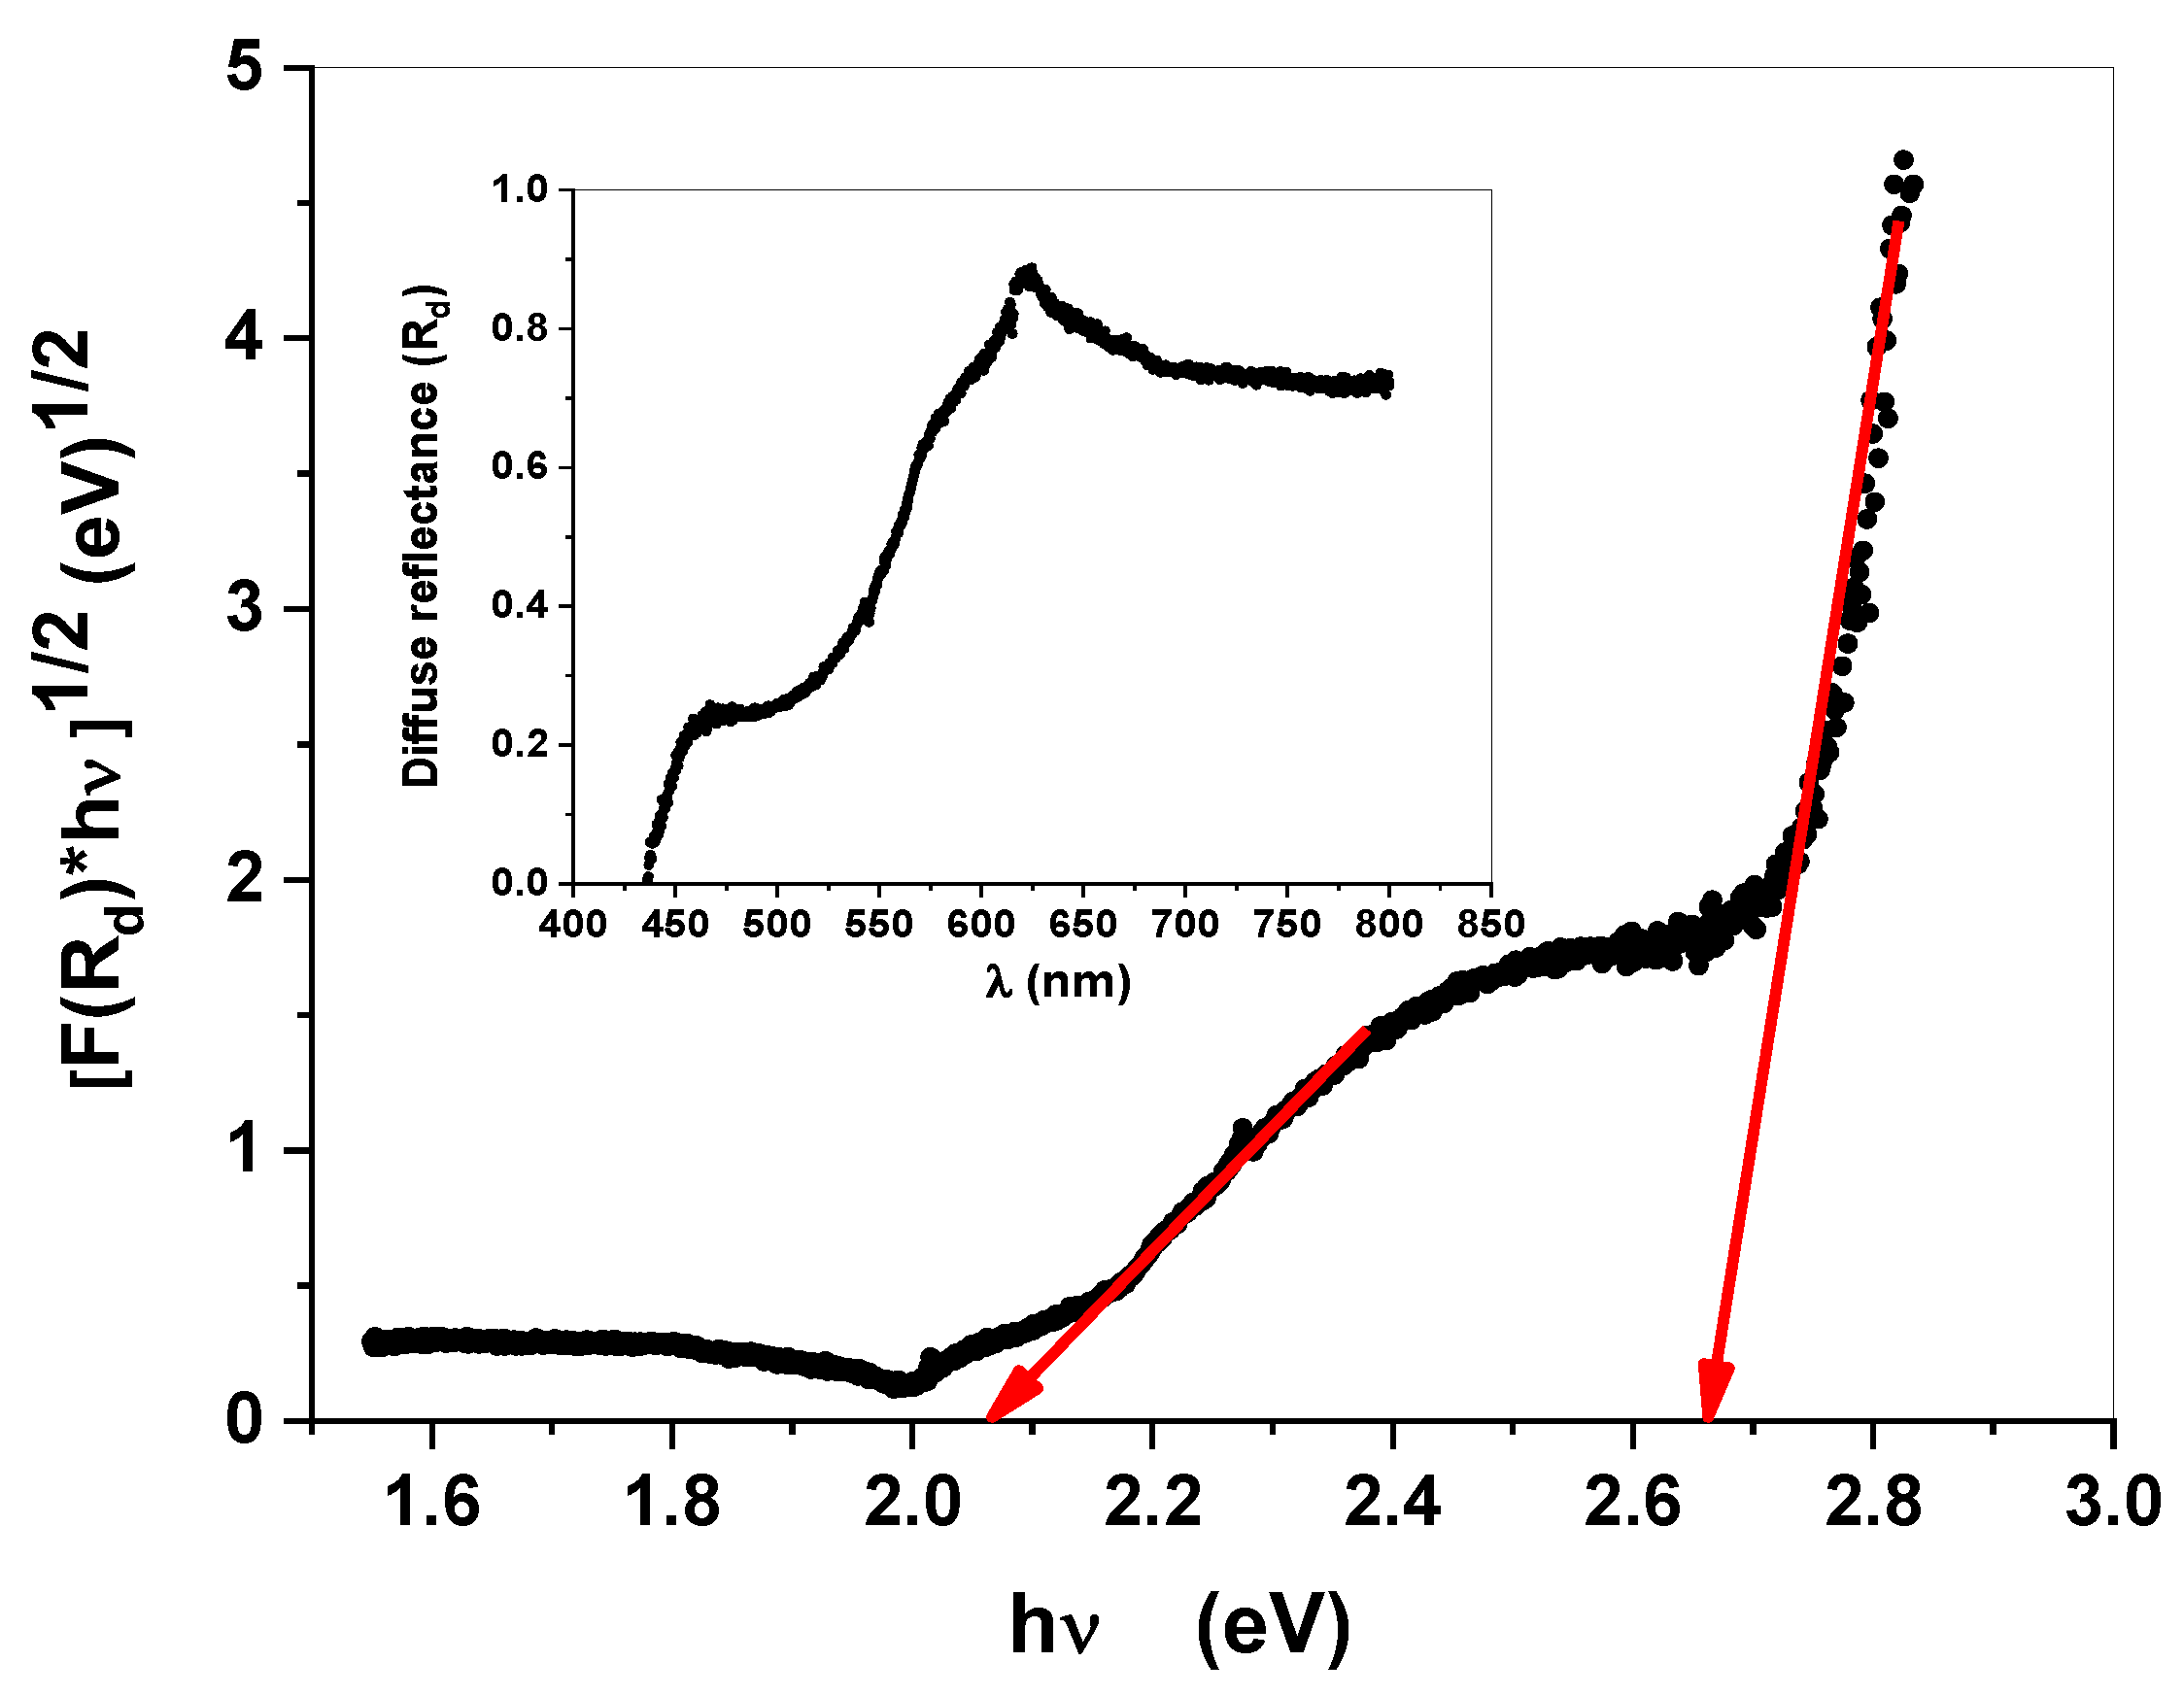
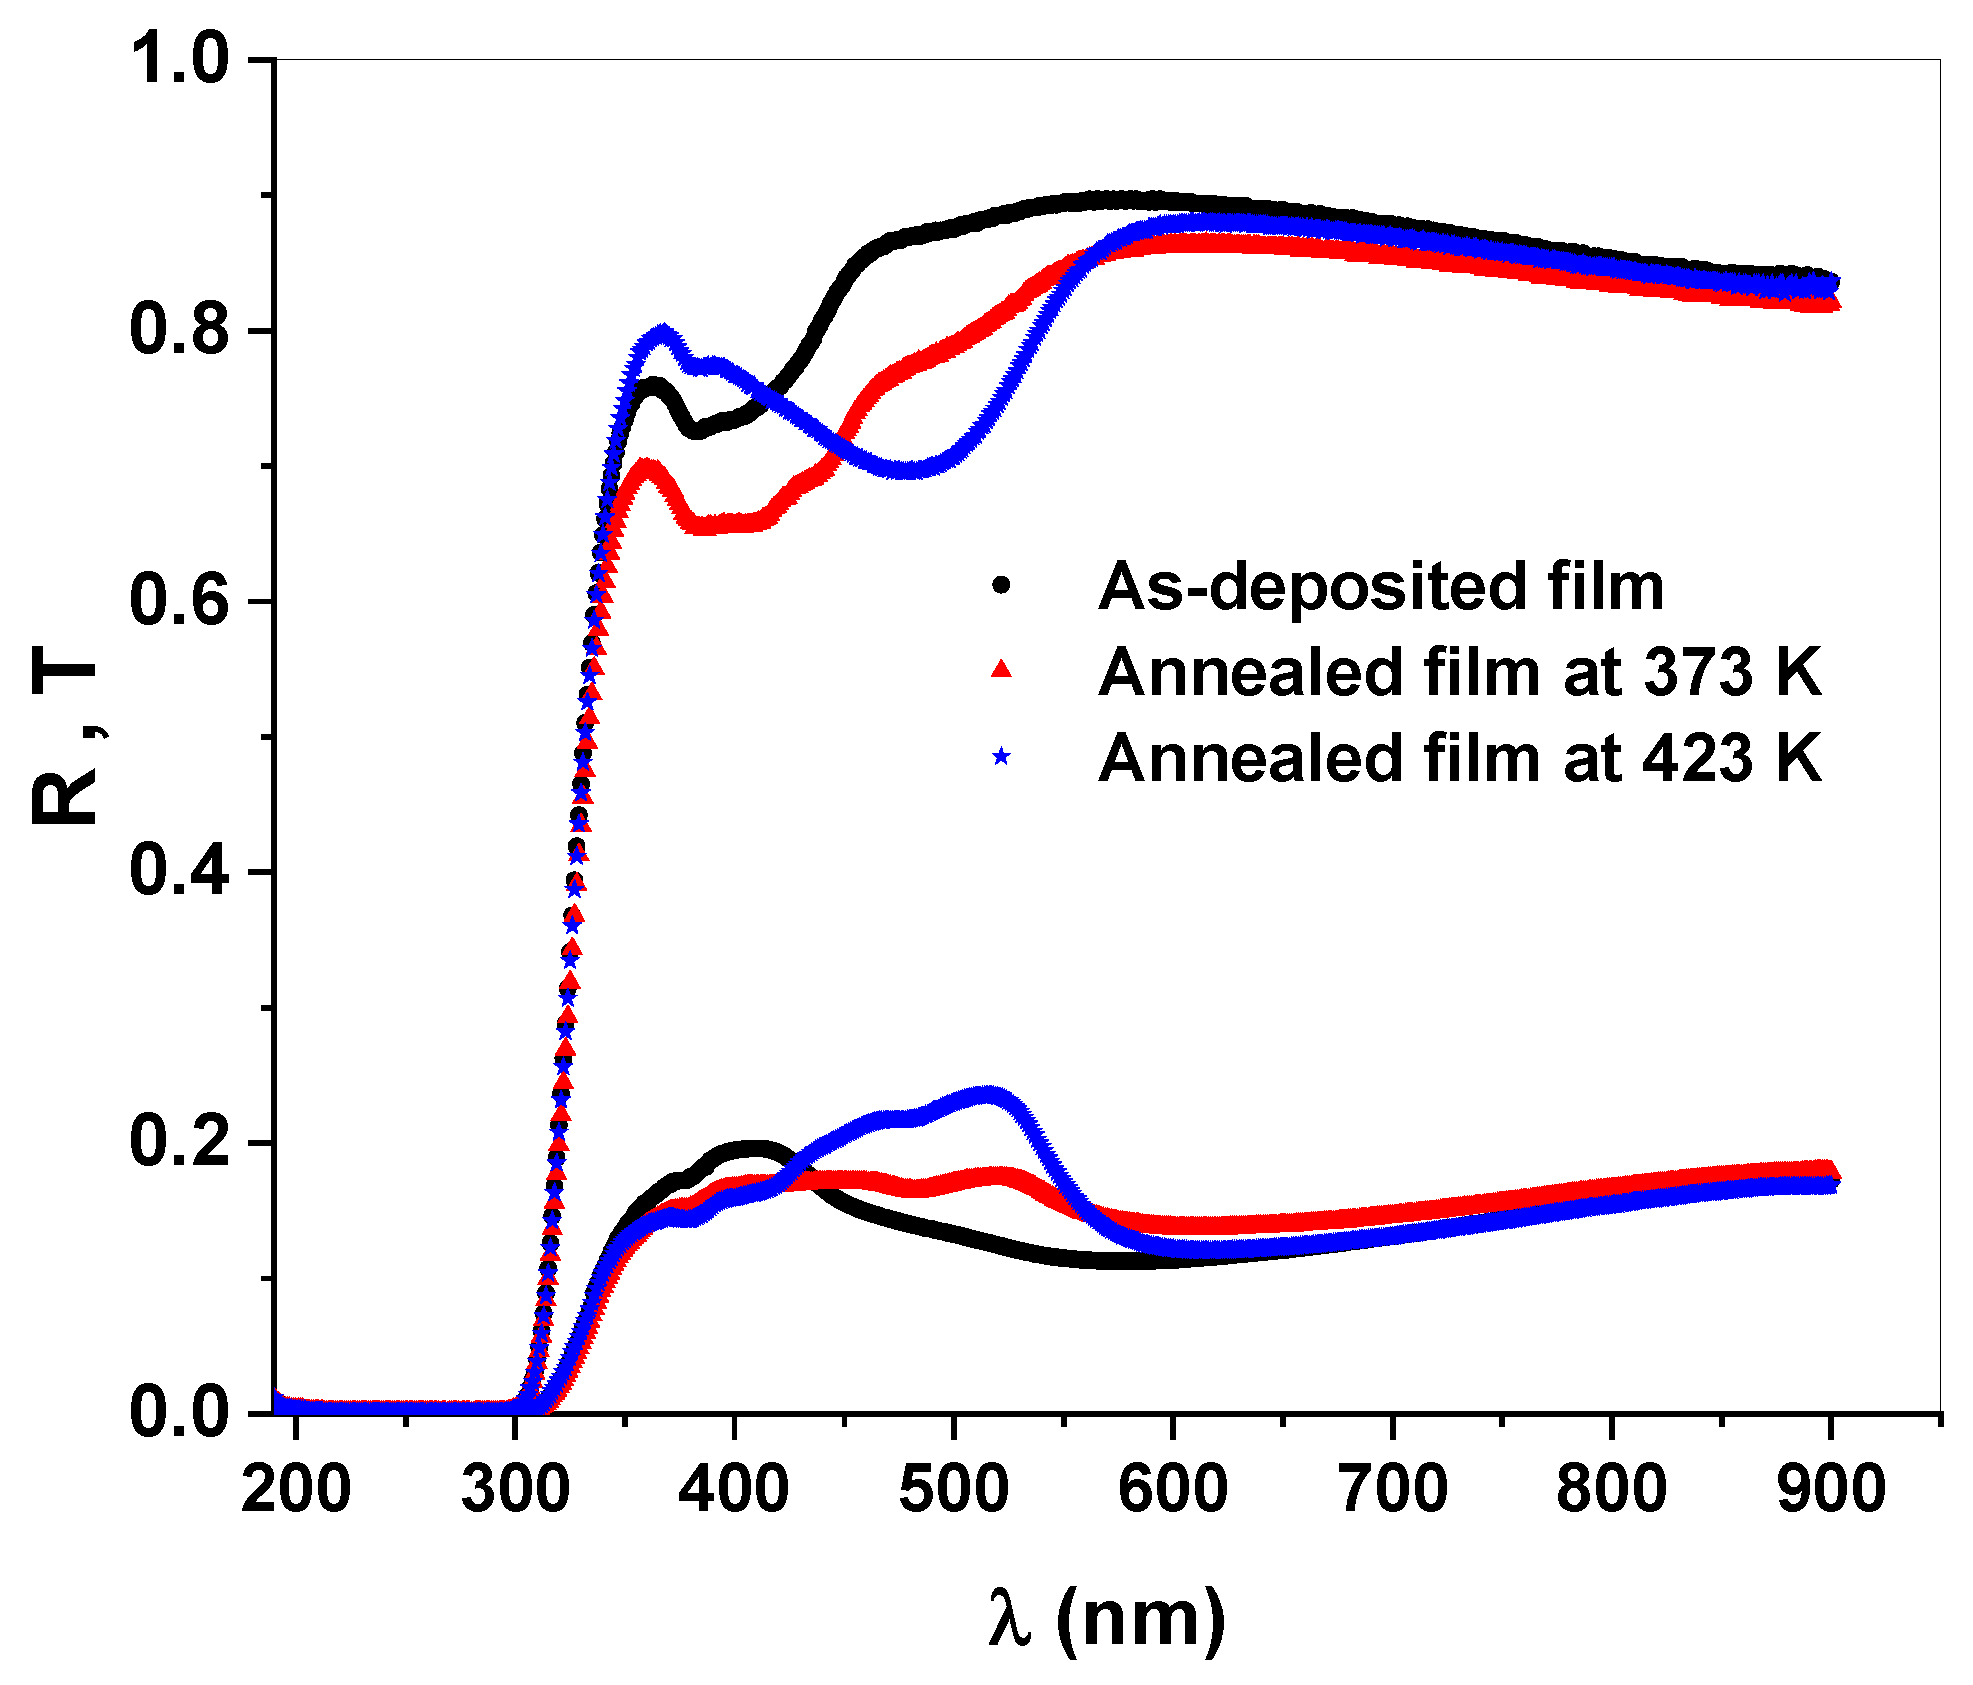
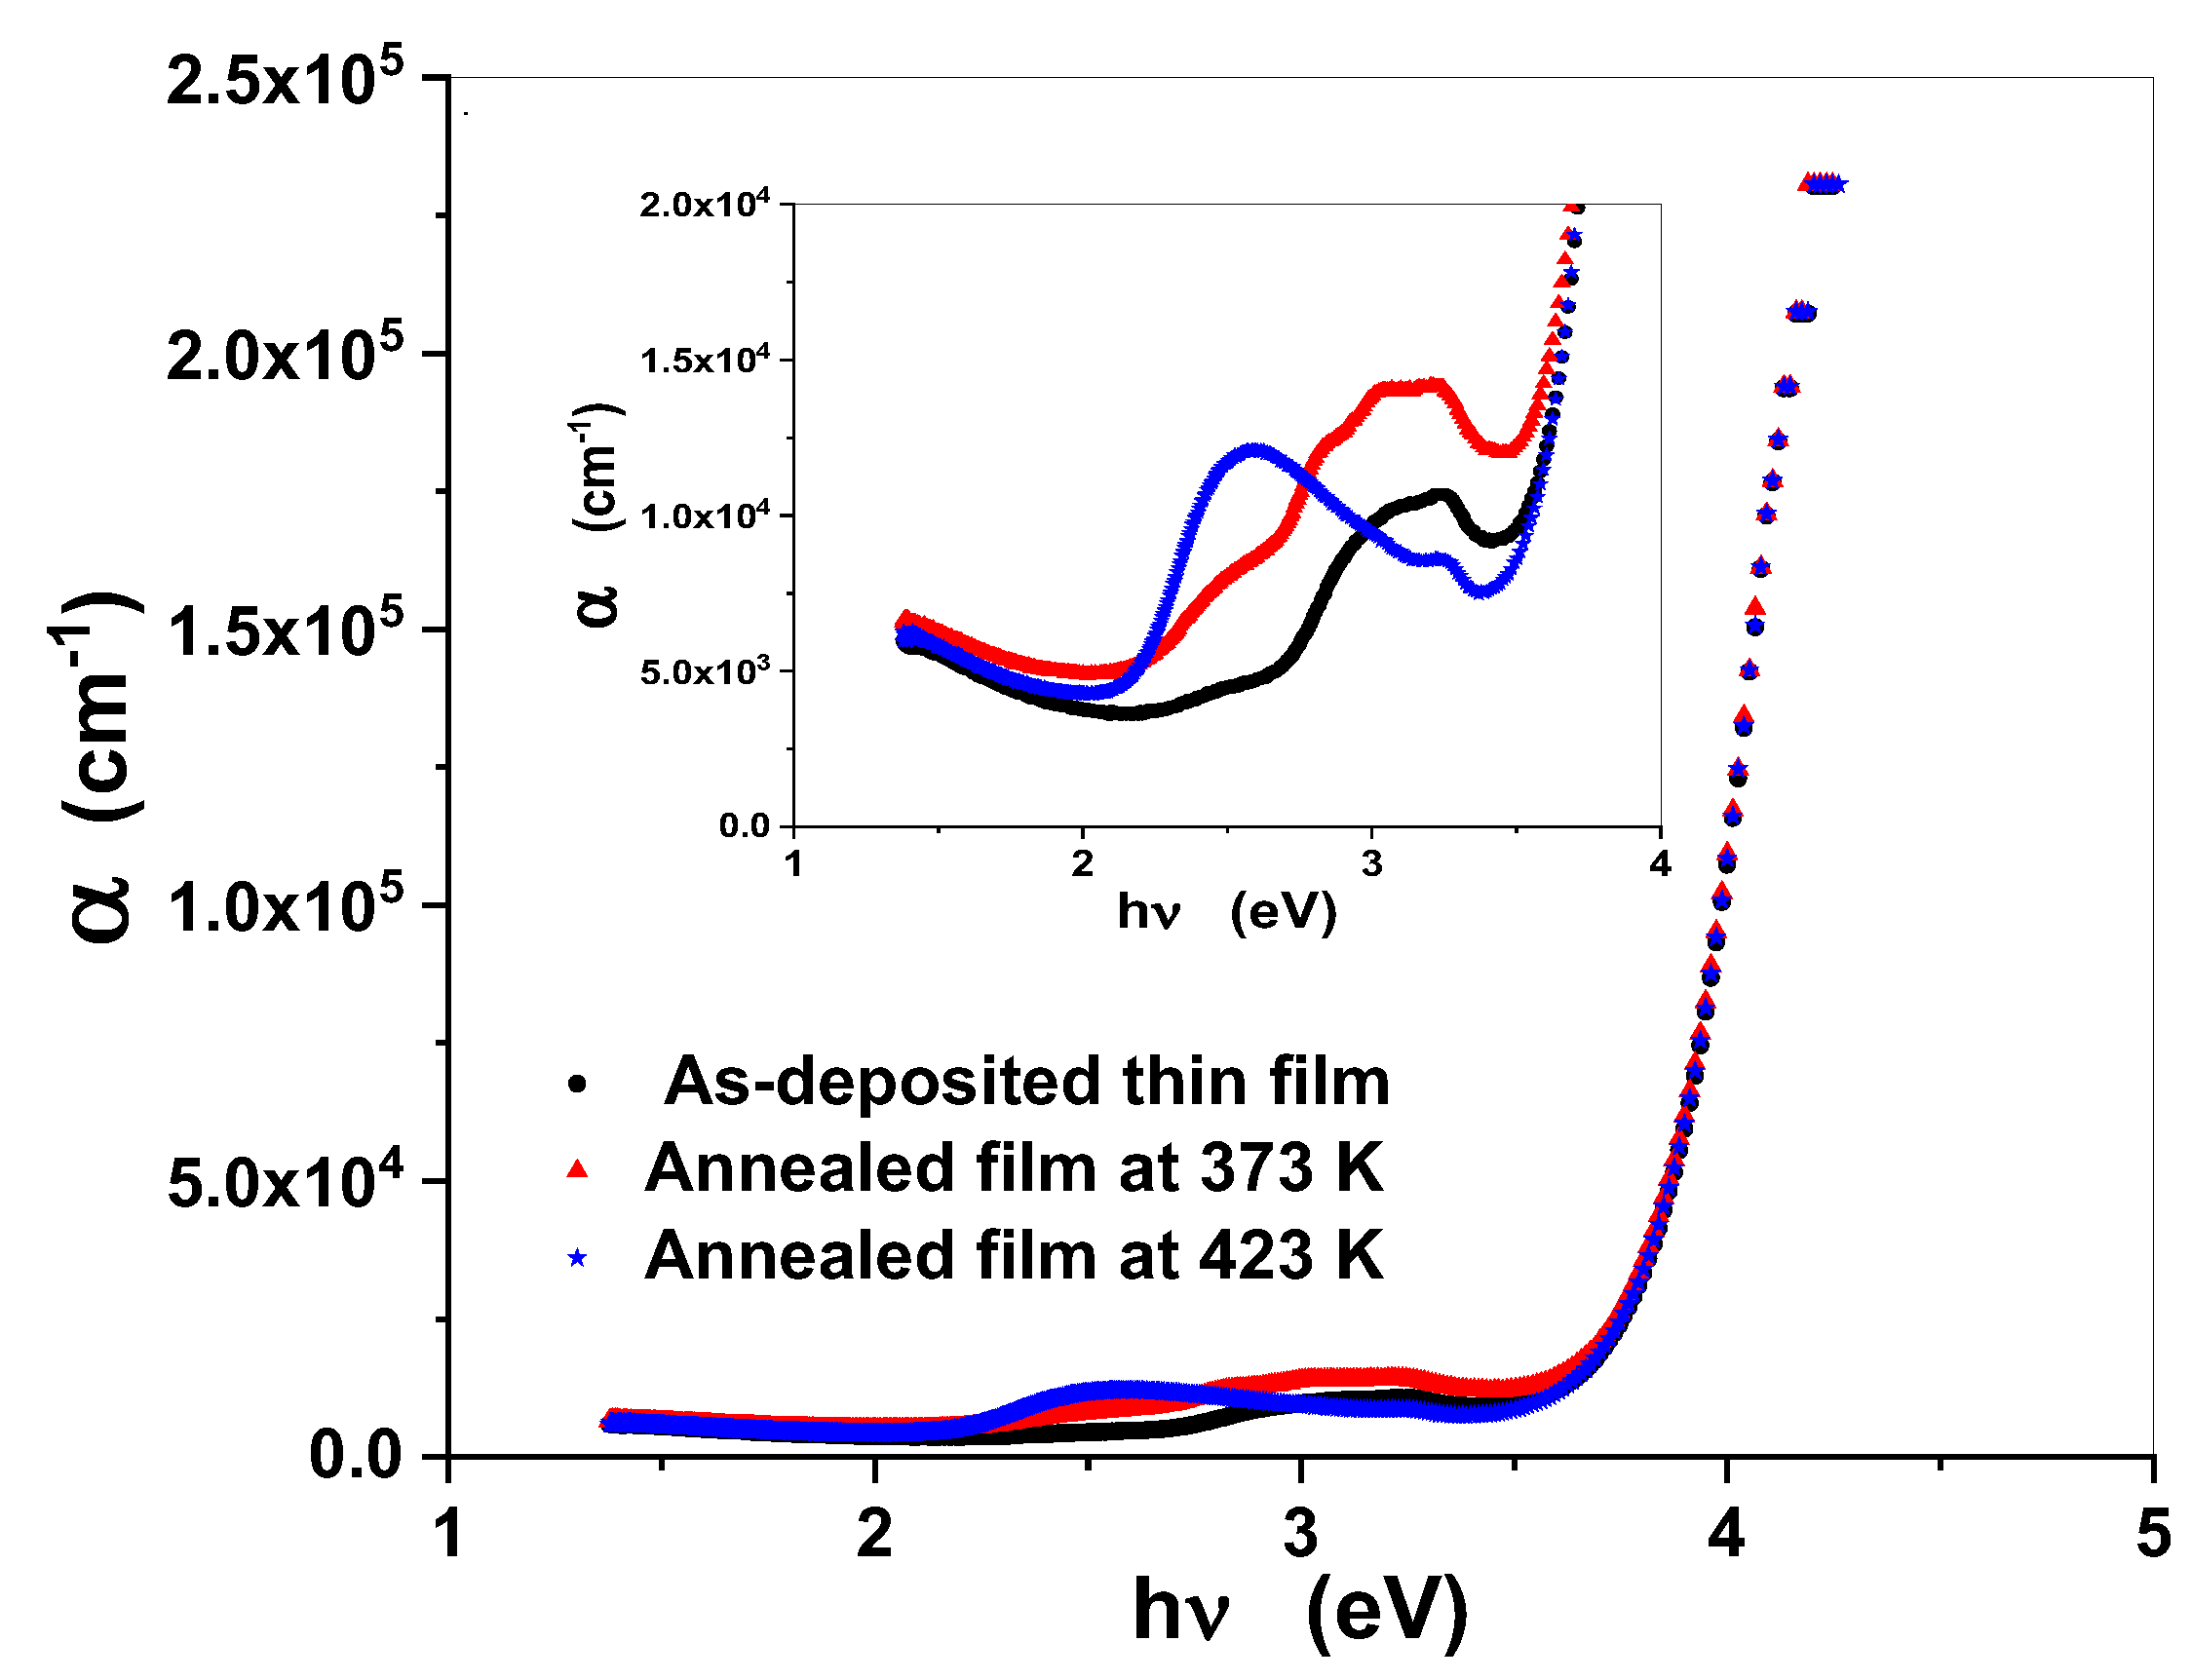
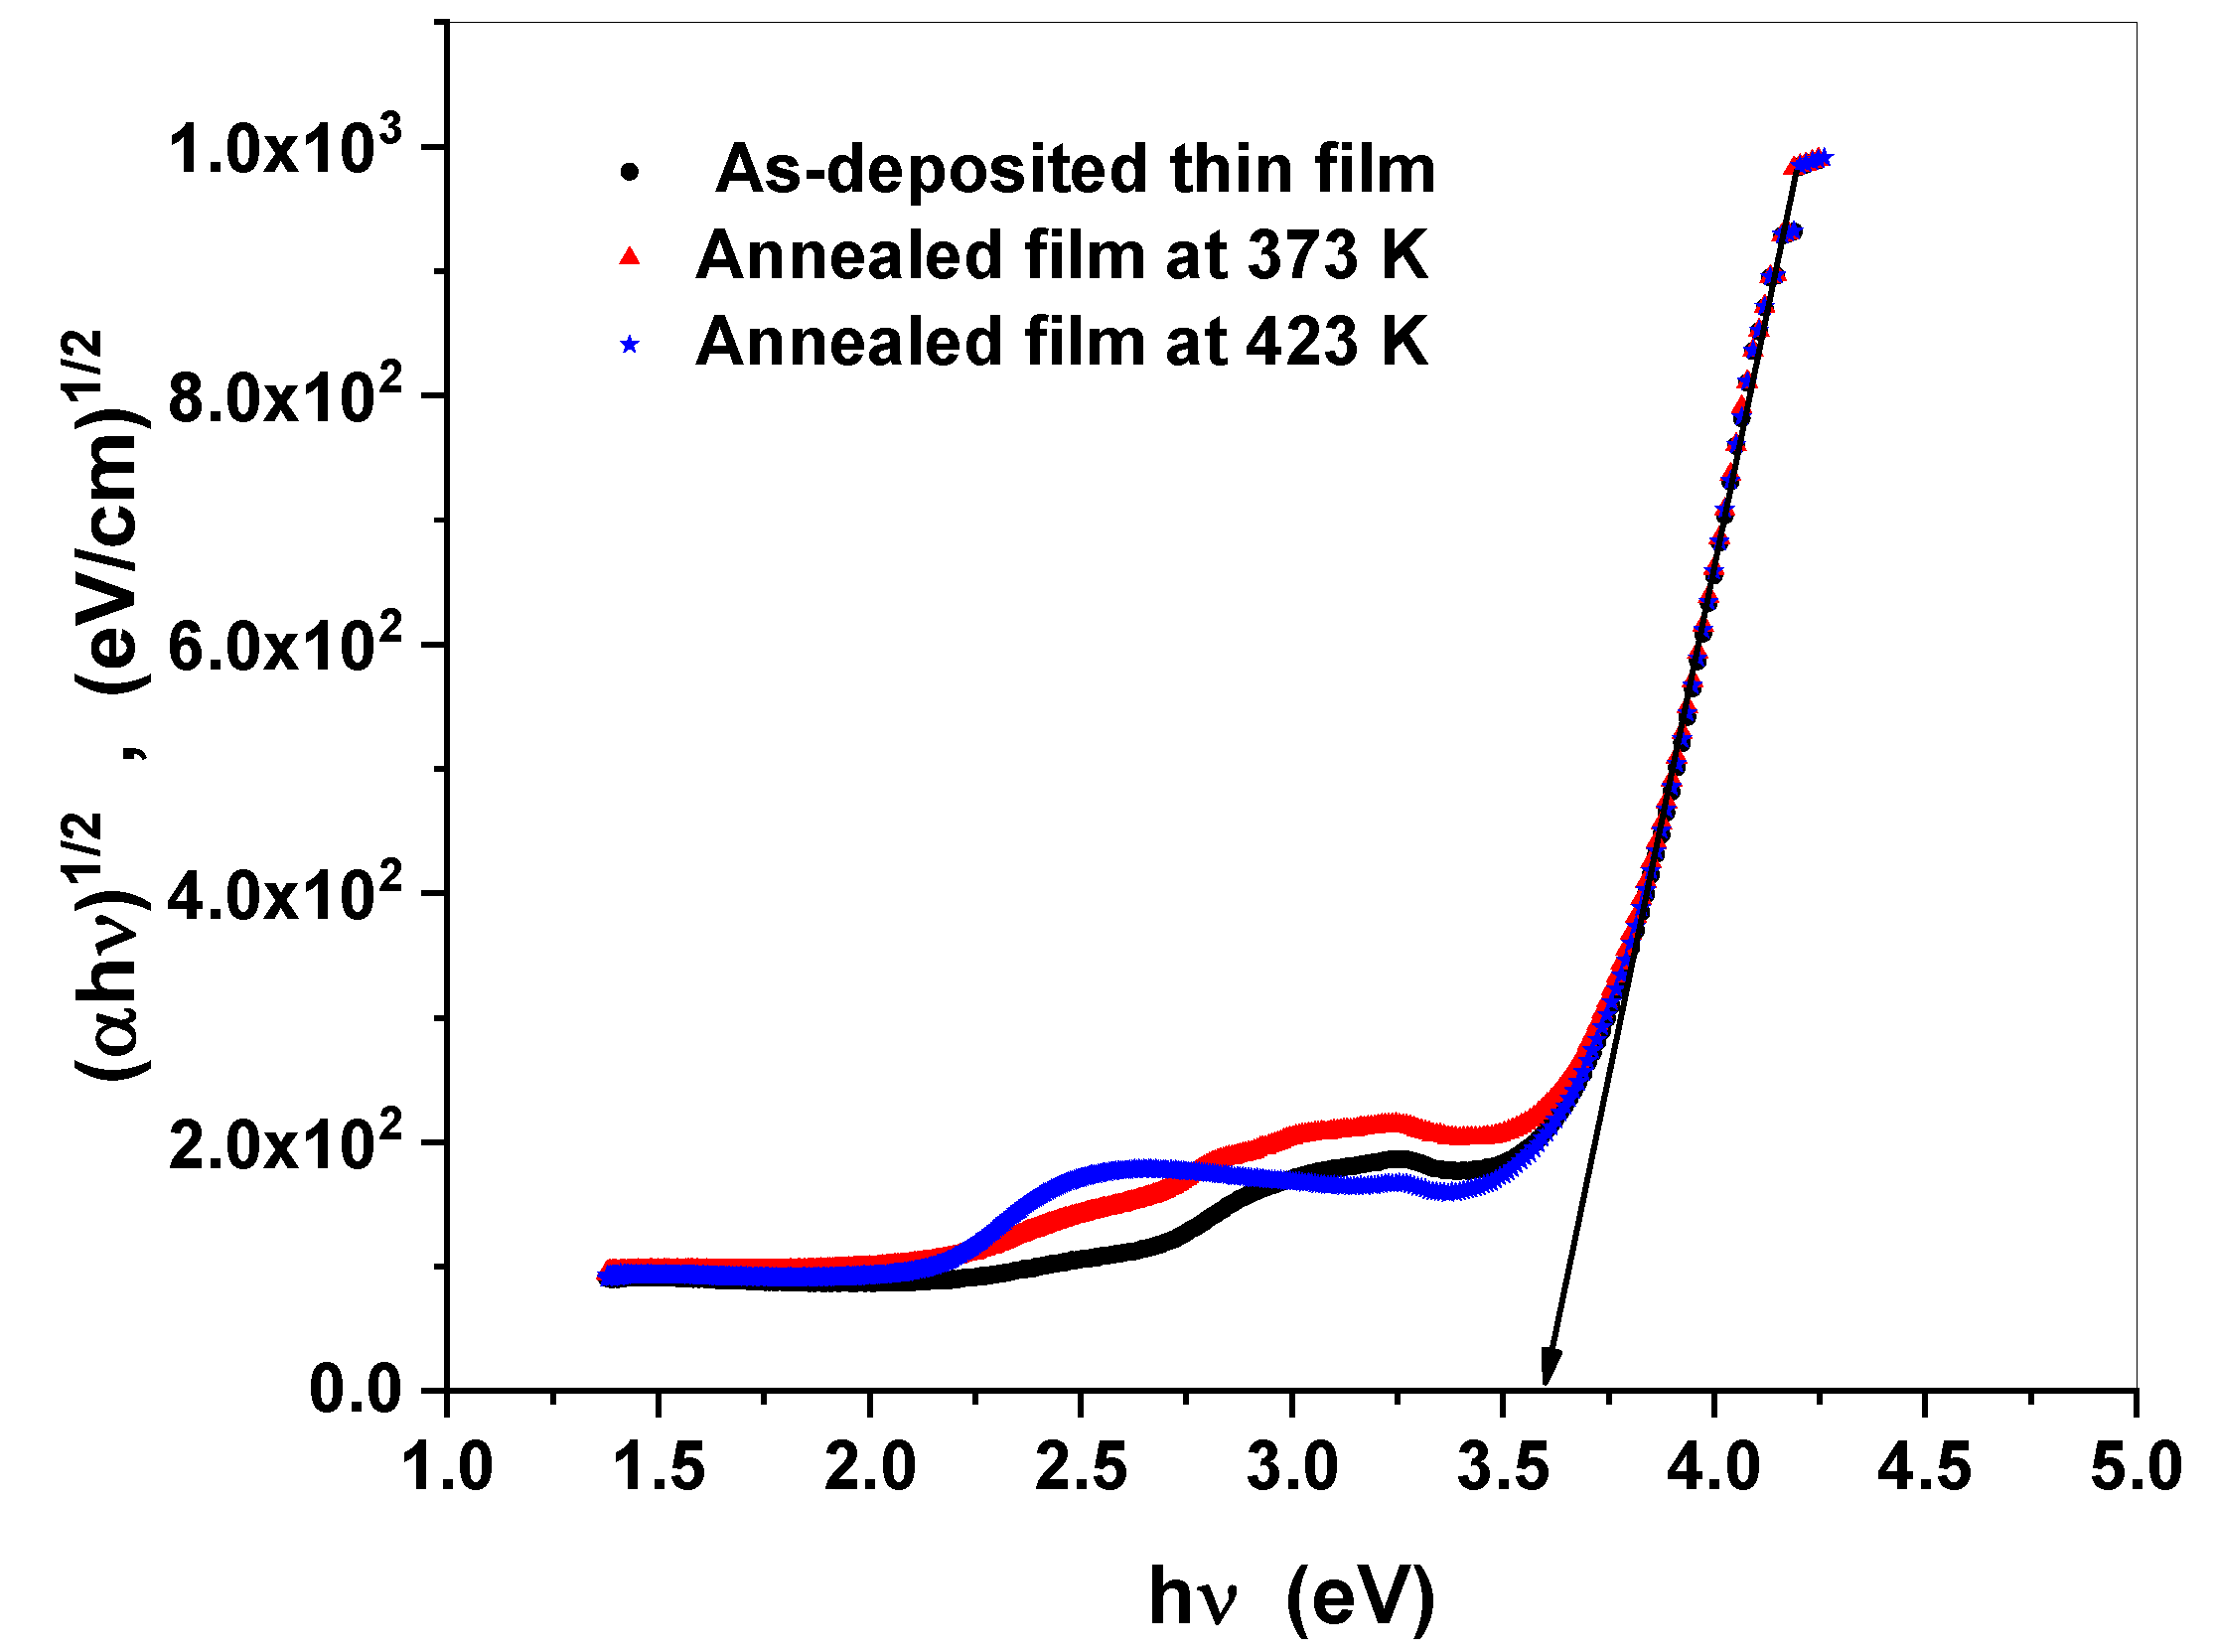
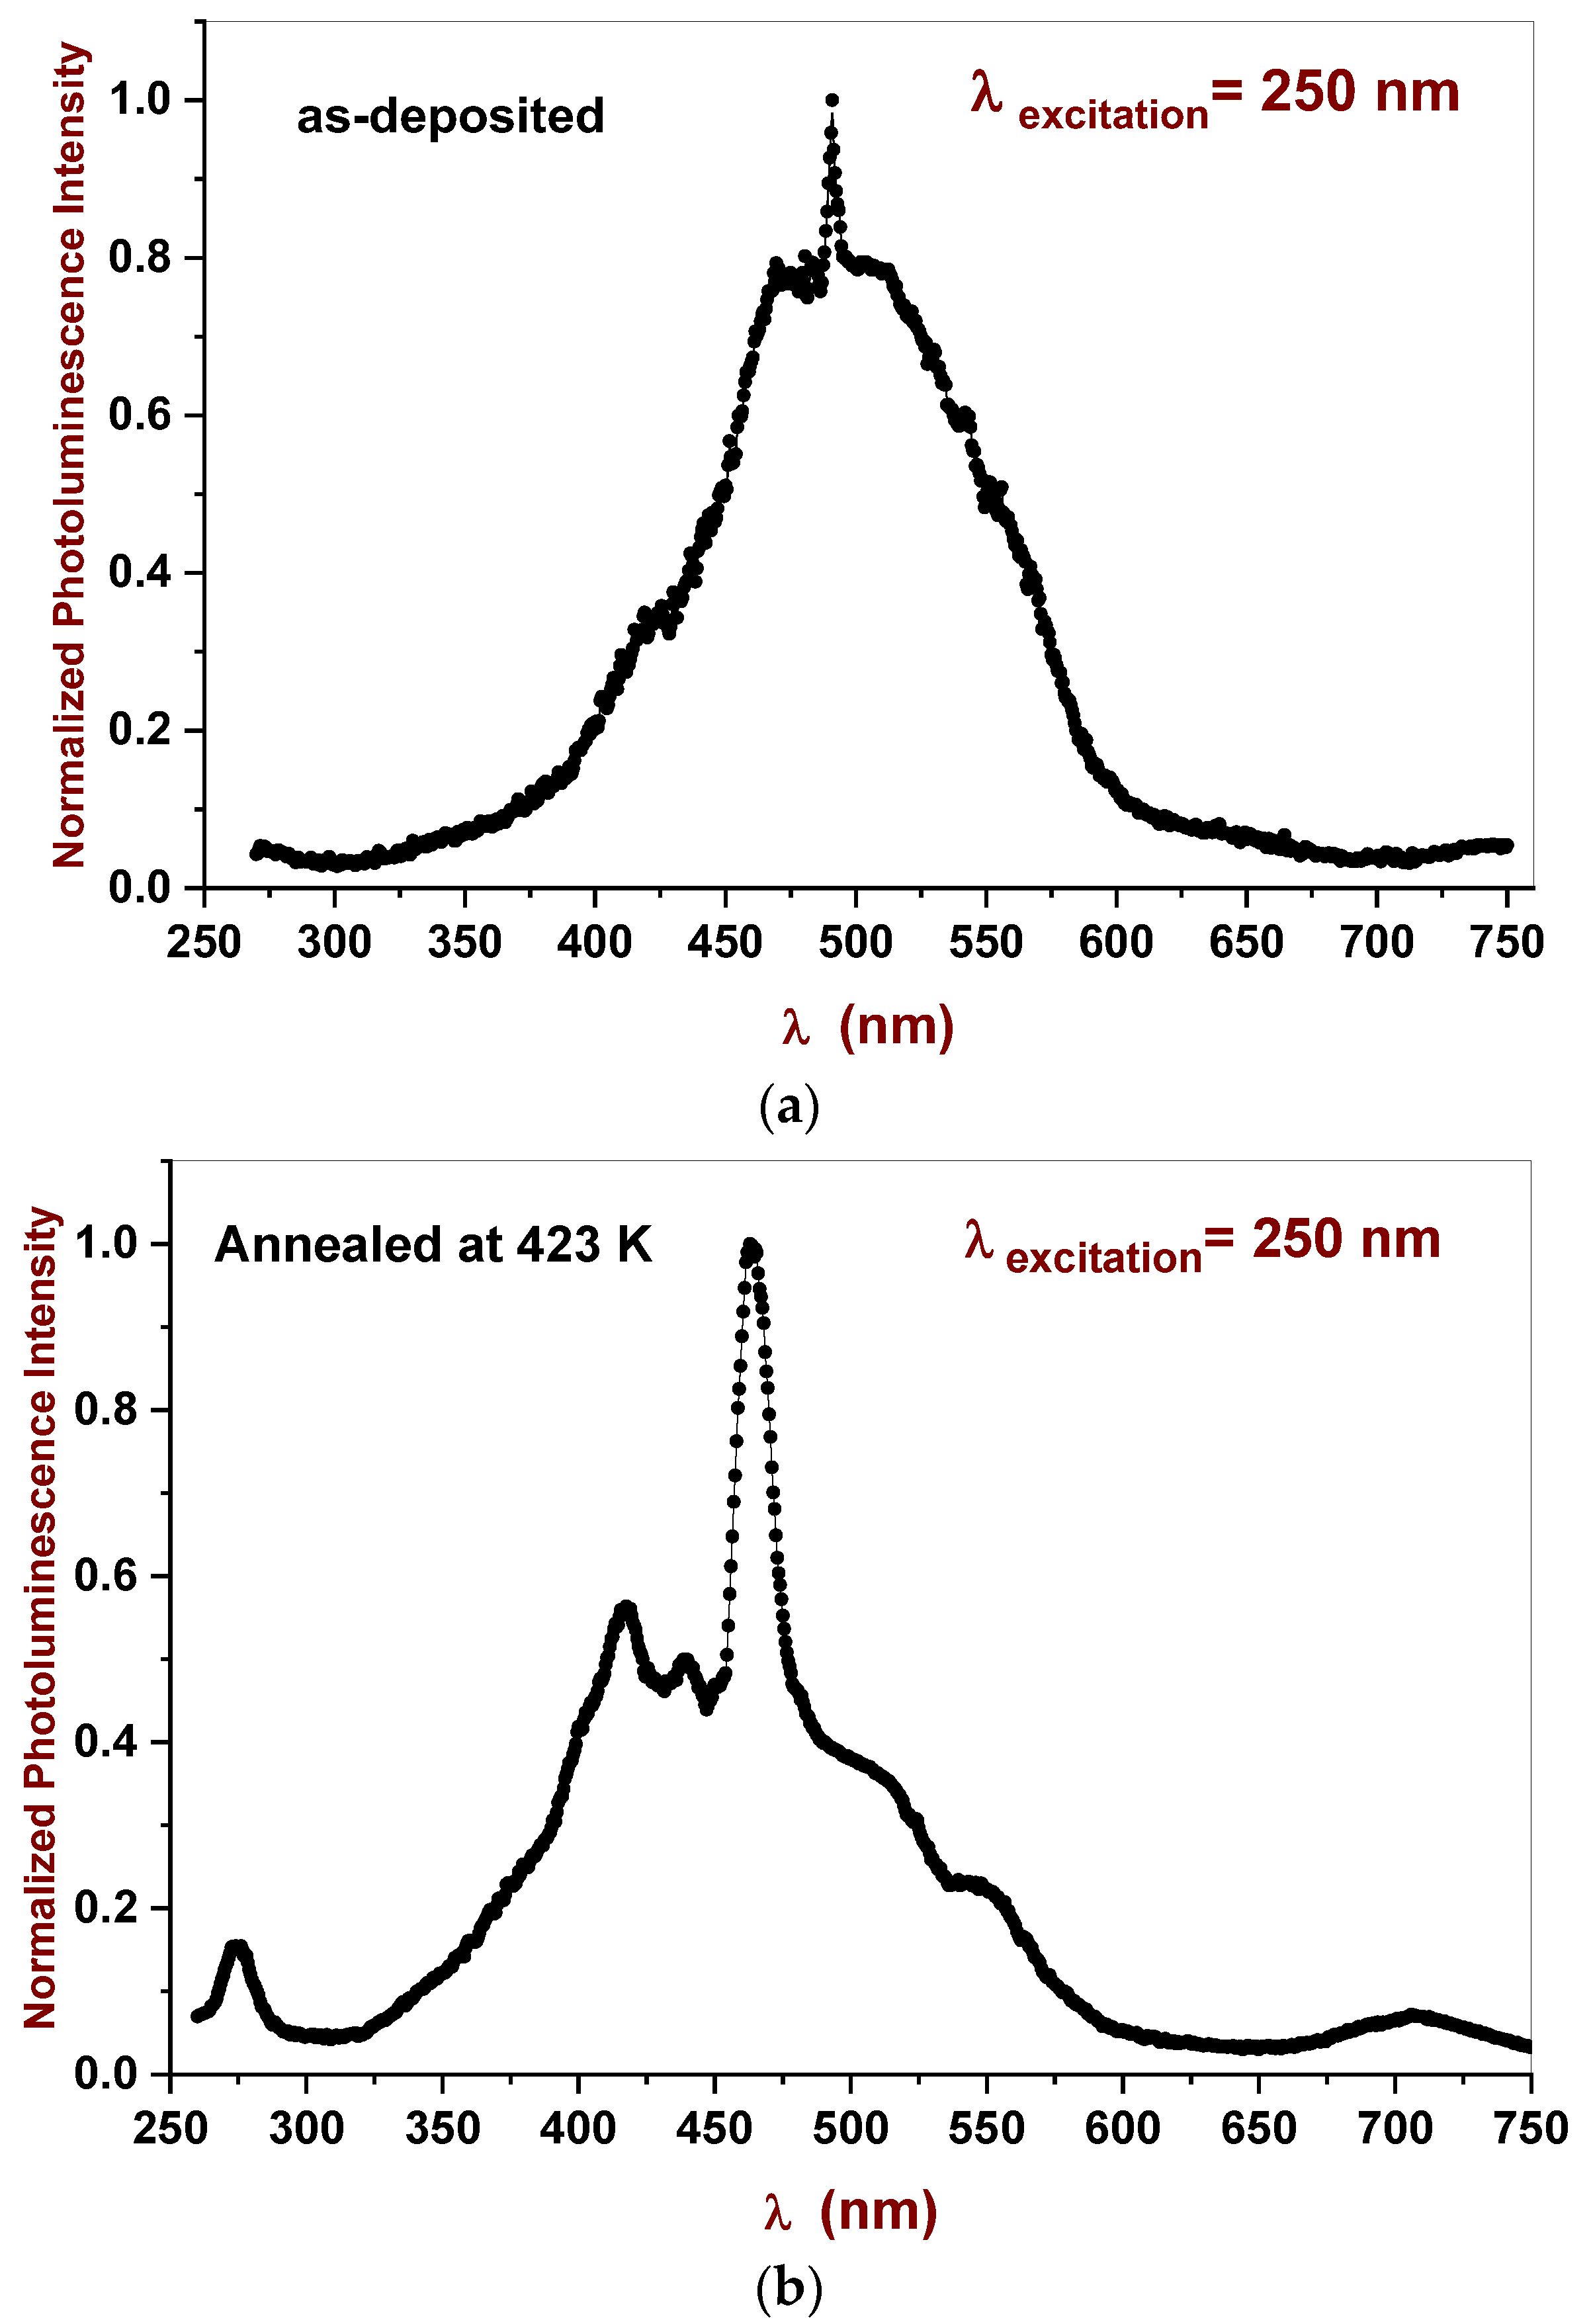
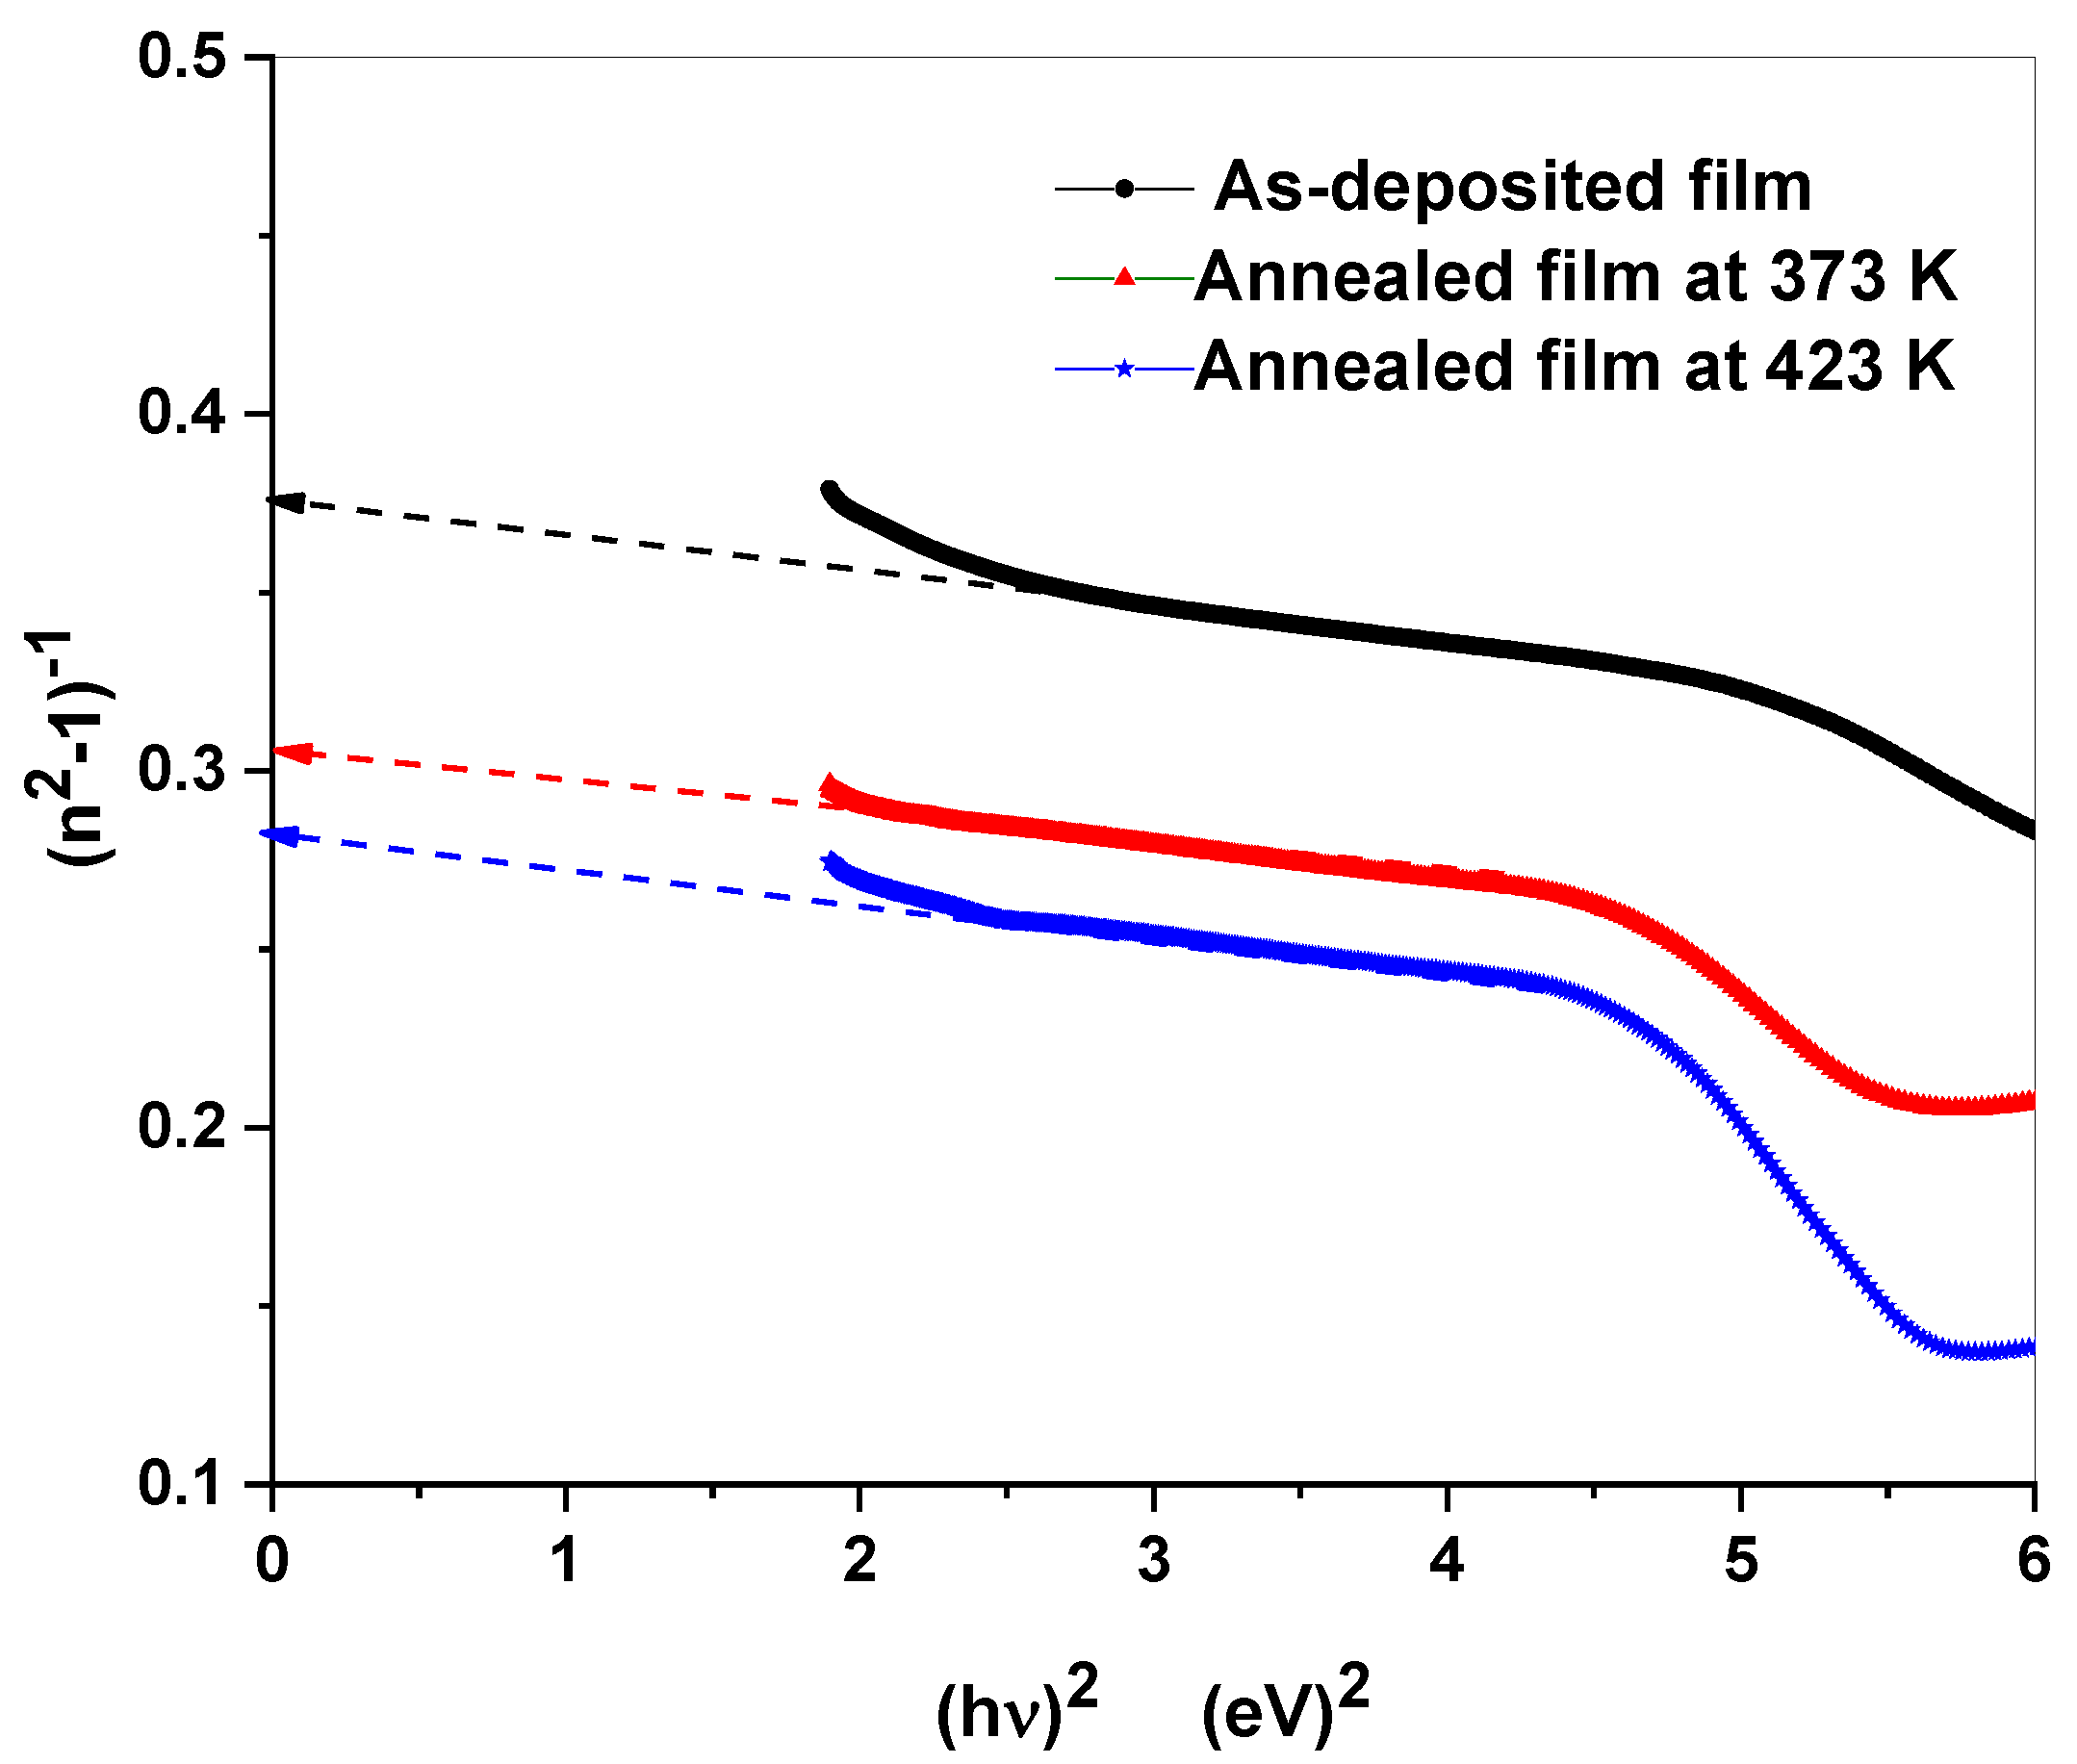
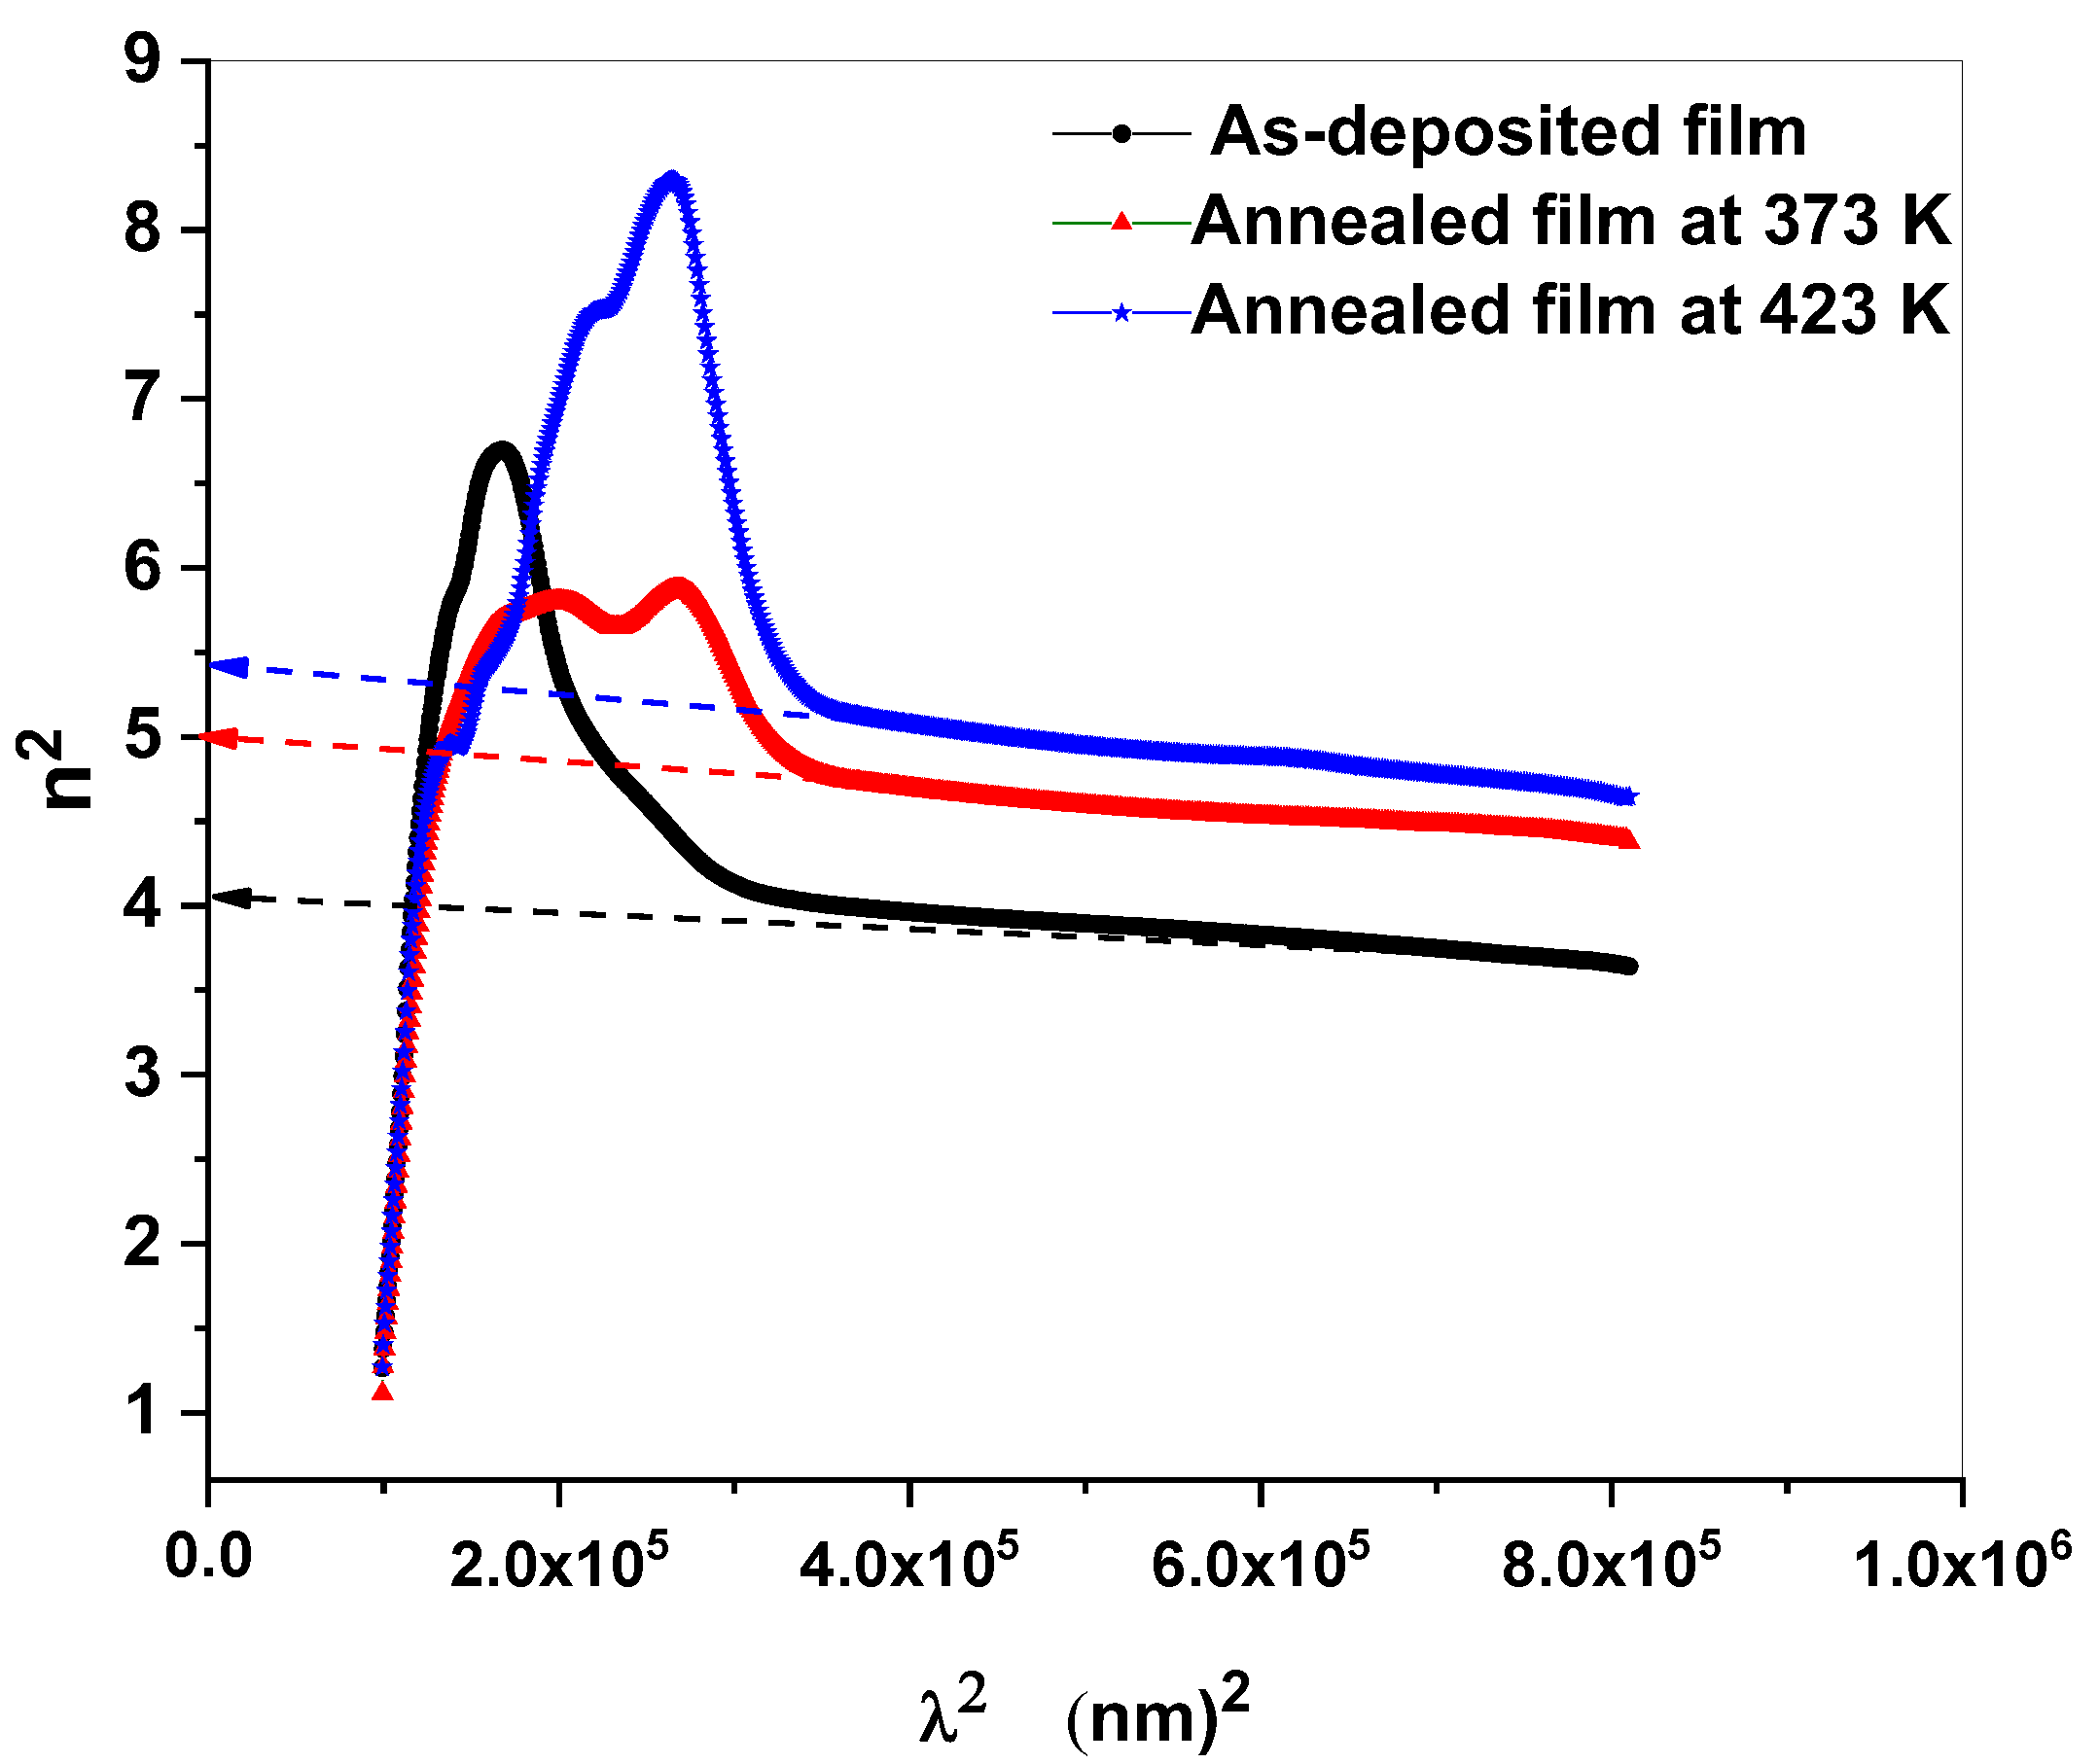
3.8. UV-Vis-NIR Spectroscopic Studies
4. Conclusions
Author Contributions
Funding
Institutional Review Board Statement
Informed Consent Statement
Data Availability Statement
Acknowledgments
Conflicts of Interest
References
- Yu, H.; He, Y.; Wu, Y.; He, Y.; He, C.; Meng, H. Thermally stable organic thin film transistors based on 2-(anthracen-2-yl)tetracene. Org. Electron. 2020, 85, 105787. [Google Scholar] [CrossRef]
- Lia, J.-N.; Wu, Y.; Zhang, X.; Zeng, D.; Luo, Y.; Duan, X.; Gao, X.; Cai, P.; Zhang, Q.; Zhang, J.; et al. A new fluorinated pyran-bridged A-D-A type small molecular acceptor for organic solar cells. Dye. Pigment. 2020, 175, 108165. [Google Scholar] [CrossRef]
- Madrid-Úsuga, D.; Mora-Leόn, A.G.; Cabrera-Espinoza, A.M.; Insuasty, B.; Ortiza, A. Theoretical characterization of photoactive molecular systems based on BODIPY-derivatives for the design of organic solar cells. Comput. Theor. Chem. 2021, 1197, 113165. [Google Scholar] [CrossRef]
- Yen, Y.-S.; Hsu, J.-L.; Ni, J.-S.; Lin, J.T. Influence of various dithienoheterocycles as conjugated linker in Naphtho [2,3-d] [1,2,3]triazole-based organic dyes for dye-sensitized solar cells. Dye. Pigment. 2021, 188, 109220. [Google Scholar] [CrossRef]
- Bibi, S.; Khera, R.A.; Farhat, A.; Iqbal, J. Triphenylamine based donor-acceptor-donor type small molecules for organic solar cells. Comput. Theor. Chem. 2021, 1198, 113176. [Google Scholar] [CrossRef]
- Sharif, A.; Jabeen, S.; Iqbal, S.; Iqbal, J. Tuning the optoelectronic properties of dibenzochrysene (DBC) based small molecules for organic solar cells. Mater. Sci. Semicond. Process. 2021, 127, 105689. [Google Scholar] [CrossRef]
- D.Branowska, E.; Olender, W.; Wysocki, Z.; Karczmarzyk, I.; Bancerz, P.; Ledwon, M.; Lapkowski, B.; Mirosław, Z.; Urbańczyk-Lipkowska, P. Kalicki, Synthesis and electrochemical characterization of oligothiophenes with 1,2,4-triazine and 5,5/ -bi-1,2,4-triazine as strong electron acceptor units. Electrochim. Acta 2016, 214, 19. [Google Scholar]
- Sakr, M.E.M.; Kana, M.T.H.A.; Elwahy, A.H.M.; El-Daly, S.A.; Ebeid, E.M. Novel far UV-Vis absorbing bis(dihydrophenanthro[9,10-e][1,2,4] triazine) derivative dyes: Synthesis, optical, photophysical and solvatochromic properties. J. Mol. Struct. 2020, 1206, 127690. [Google Scholar] [CrossRef]
- Grimsdale, A.C.; Chan, K.L.; Martin, R.E.; Jokisz, P.G.; Holmes, A.B. Synthesis of light-emitting conjugated polymers for applications in electroluminescent devices. Chem. Rev. 2009, 109, 897. [Google Scholar] [CrossRef]
- Braga, D.; Horowitz, G. High-performance organic field-effect transistors. Adv. Mater. 2009, 21, 1473. [Google Scholar] [CrossRef]
- Radford, R.J.; Chyan, W.; Lippard, S.J. Peptide-based targeting of fluorescent zinc sensors to the plasma membrane of live cells. Chem. Sci. 2013, 4, 3080–3084. [Google Scholar] [CrossRef] [Green Version]
- Facchetti, A. π-Conjugated polymers for organic electronics and photovoltaic cell applications. Chem. Mater. 2011, 23, 733. [Google Scholar] [CrossRef]
- Reineke, S.; Lindner, F.; Schwartz, G.; Seidler, N.; Walzer, K.; Lussem, B.; Leo, K. White organic light-emitting diodes with fluorescent tube efficiency. Nature 2009, 459, 234. [Google Scholar] [CrossRef] [PubMed]
- Xiao, L.X.; Chen, Z.J.; Qu, B.; Luo, J.X.; Kong, S.; Gong, Q.H.; Kido, J.J. Full phosphorescent white-light organic light-emitting diodes with improved color stability and efficiency by fine tuning primary emission contributions. Adv. Mater. 2011, 23, 926. [Google Scholar] [CrossRef] [PubMed]
- Zhang, W.; Zhu, C.; Huang, Z.; Gong, C.; Tang, Q.; Fu, X. Electrochromic 2,4,6-triphenyl-1,3,5-triazine based esters with electron donor-acceptor structure. Org. Electron. 2018, 67, 302–310. [Google Scholar] [CrossRef]
- Wu, N.; Ma, L.; Zhao, S.; Xiao, D. Novel triazine-centered viologen analogues for dual-band electrochromic devices. Sol. Energy Mater. Sol. Cells 2019, 195, 114–121. [Google Scholar] [CrossRef]
- Data, P.; Zassowski, P.; Lapkowski, M.; Grazulevicius, J.V.; Kukhta, N.A.; Reghu, R.R. Electrochromic behavior of triazine based ambipolar compound. Electrochim. Acta 2016, 192, 283–295. [Google Scholar] [CrossRef]
- Zeng, W.D.; Cao, Y.M.; Bai, Y.; Wang, Y.H.; Shi, Y.S.; Zhang, M.; Wang, F.F.; Pan, C.Y.; Wang, P. Efficient Dye-Sensitized Solar Cells with an Organic Photosensitizer Featuring Orderly Conjugated Ethylenedioxythiophene and Dithienosilole Blocks. Chem. Mater. 2010, 22, 1915. [Google Scholar] [CrossRef]
- Arias, A.C.; MacKenzie, J.D.; McCulloch, I.; Rivnay, J.; Salleo, A. Materials and applications for large area electronics: Solution-based approaches. Chem. Rev. 2010, 110, 3. [Google Scholar] [CrossRef]
- Rahulan, K.M.; Balamurugan, S.; Meena, K.; Yeap, G.Y.; Kanakam, C.C. Synthesis and nonlinear optical absorption of novel chalcone derivative compounds. Opt. Laser Technol. 2014, 56, 142–145. [Google Scholar] [CrossRef]
- Huang, D.-C.; Wu, J.-T.; Fan, Y.-Z.; Liou, G.-S. Preparation and optoelectronic behaviours of novel electrochromic devices based on triphenylamine-containing ambipolar materials. J. Mater. Chem. C 2017, 5, 9370–9375. [Google Scholar] [CrossRef]
- Lv, X.; Li, W.; Ouyang, M.; Zhang, Y.; Wright, D.S.; Zhang, C. Polymeric electrochromic materials with donor–acceptor structures. J. Mater. Chem. C 2017, 5, 12–28. [Google Scholar] [CrossRef]
- Signore, G.; Nifosií, R.; Albertazzi, L.; Storti, B.; Bizzarri, R. Polarity-Sensitive Coumarins Tailored to Live Cell Imaging. J. Am. Chem. Soc. 2010, 132, 1276–1288. [Google Scholar] [CrossRef] [PubMed]
- Cheng, Y.-J.; Yang, S.-H.; Hsu, C.-S. Synthesis of Conjugated Polymers for Organic Solar Cell Applications. Chem. Rev. 2009, 109, 5868–5923. [Google Scholar] [CrossRef]
- Thirumurugan, P.; Perumal, P.T. The synthesis and photophysical studies of pyridinyl-1,2,4-triazine derivatives and use as a fluorescent sensor for ferric salts. Dye. Pigment. 2011, 88, 403–412. [Google Scholar] [CrossRef]
- Guo, Z.-H.; Jin, Z.-X.; Wang, J.-Y.; Pei, J. A donor–acceptor–donor conjugated molecule: Twist intramolecular charge transfer and piezochromic luminescent properties. Chem. Commun. 2014, 50, 6088–6090. [Google Scholar] [CrossRef]
- Richard, A.; Klenklera, H.A.; Tranc, A.; Popovic, D.Z.; Xu, G. High electron mobility triazine for lower driving voltage and higher efficiency organic light emitting devices. Org. Elect. 2008, 9, 285. [Google Scholar]
- Zinatloo-Ajabshir, S.; Emsaki, M.; Hosseinzadeh, G. Innovative construction of a novel lanthanide cerate nanostructured photocatalyst for efficient treatment of contaminated water under sunlight. J. Colloid Interface Sci. 2022, 619, 1–14. [Google Scholar] [CrossRef]
- Zinatloo-Ajabshir, S.; Morassaei, M.S.; Salavati-Niasari, M. Eco-friendly synthesis of Nd2Sn2O7–based nanostructure materials using grape juice as green fuel as photocatalyst for the degradation of erythrosine. Compos. Part B 2019, 167, 643–653. [Google Scholar] [CrossRef]
- Mahdavi, K.; Zinatloo-Ajabshir, S.; Yousif, Q.A.; Salavati-Niasari, M. Enhanced photocatalytic degradation of toxic contaminants using Dy2O3-SiO2 ceramic nanostructured materials fabricated by a new, simple and rapid sonochemical approach. Ultrason. Sonochem. 2022, 82, 105892. [Google Scholar] [CrossRef]
- Tabatabaeinejad, S.M.; Zinatloo-Ajabshir, S.; Amiric, O.; Salavati-Niasari, M. Magnetic Lu2Cu2O5-based ceramic nanostructured materials fabricated by a simple and green approach for an effective photocatalytic degradation of organic contamination. RSC Adv. 2021, 11, 40100–40111. [Google Scholar] [CrossRef] [PubMed]
- Zinatloo-Ajabshir, S.; Salavati-Niasari, M. Preparation of nanocrystalline cubic ZrO2 with different shapes via a simple precipitation approach. J. Mater. Sci. Mater. Electron. 2016, 27, 3918–3928. [Google Scholar] [CrossRef]
- Ghavidast, A.; Mahmoodi, N.O. A comparative study of the photochromic compounds incorporated on the surface of nanoparticles. J. Mol. Liq. 2016, 216, 552–564. [Google Scholar] [CrossRef]
- Zinatloo-Ajabshir, S.; Morassaei, M.S.; Salavati-Niasari, M. Facile fabrication of Dy2Sn2O7-SnO2 nanocomposites as an effective photocatalyst for degradation and removal of organic contaminants. J. Colloid Interface Sci. 2017, 497, 298–308. [Google Scholar] [CrossRef]
- El-Nahass, M.M.; Metwally, H.S.; El-Sayed, H.E.A.; Hassanien, A.M. Electrical and photovoltaic properties of FeTPPCl/p-Si heterojunction. Synth. Met. 2011, 161, 2253–2258. [Google Scholar] [CrossRef]
- Alrooqi, A.; Al-Amshany, Z.M.; Al-Harbi, L.M.; Altalhi, T.A.; Refat, M.S.; Hassanien, A.M.; Atta, A.A. Impact of Charge Transfer Complex on the Dielectric Relaxation Processes in Poly(methyl methacrylate) Polymer. Molecules 2022, 27, 1993. [Google Scholar] [CrossRef]
- Hassanien, A.M.; Atta, A.; Ward, A.A.; Ahmed, E.M.A.; Alsubaie, A.; El-Nahass, M.; Altalhi, T. Investigation of structural, electrical and optical properties of chitosan/fullerene composites. Mater. Res. Express 2019, 6, 125304. [Google Scholar] [CrossRef]
- Zinatloo-Ajabshir, S.; Morassaei, M.S.; Amiri, O.; Salavati-Niasari, M. Green synthesis of dysprosium stannate nanoparticles using Ficus carica extract as photocatalyst for the degradation of organic pollutants under visible irradiation. Ceram. Int. 2019, 46, 6095–6107. [Google Scholar] [CrossRef]
- Zinatloo-Ajabshir, S.; Mousavi-Kamazani, M. Recent advances in nanostructured Sn-Ln mixed-metal oxides as sunlight-activated nanophotocatalyst for high-efficient removal of environmental pollutants. Ceram. Int. 2021, 47, 23702–23724. [Google Scholar] [CrossRef]
- Zinatloo-Ajabshir, S.; Salavati-Niasari, M.; Zinatloo-Ajabshir, Z. Nd2Zr2O7-Nd2O3 nanocomposites: New facilesynthesis, characterization and investigation of photocatalytic behaviour. Mater. Lett. 2016, 180, 27–30. [Google Scholar] [CrossRef]
- Etemadi, H.; Afsharkia, S.; Zinatloo-Ajabshir, S.; Shokri, E. Effect of alumina nanoparticles on the antifouling properties of polycarbonate-polyurethane blend ultrafiltration membrane for water treatment. Polym Eng Sci. 2021, 61, 2364–2375. [Google Scholar] [CrossRef]
- Nemytov, A.I.; Utepova, I.A.; Kiskin, M.A.; Efimov, N.N.; Fedin, M.V.; Eremenko, I.L.; Musikhina, A.A.; Slepukhin, P.A.; Chupakhin, O.N. Synthesis, structure and magnetic properties of binuclear 3d-metal complexes of new 3-(2-pyridyl)-6-phenyl-1,2,4-triazine derivative. Polyhedron 2020, 193, 114901. [Google Scholar] [CrossRef]
- Saloutina, L.; Zapevalov, A.Y.; Kodess, M.; Slepukhin, P.; Ganebnykh, I.; Saloutin, V.; Chupakhin, O. Trifluoromethyl–containing 1,2,4-triazines. Synthesis on the base of perfluorobiacetyl and reactions with thiosemicarbazide and thiourea. J. Fluor. Chem. 2019, 227, 109362. [Google Scholar] [CrossRef]
- Coats, A.W.; Redfern, J.P. Kinetic Parameters from Thermogravimetric Data. Nature 1964, 201, 68–69. [Google Scholar] [CrossRef]
- Dodd, J.W.; Tonge, K.H. Thermal Methods; John Wiley& Sons: New York, NY, USA; London, UK, 1987. [Google Scholar]
- Kong, Z.; Liu, D.; He, J.; Wang, X. Electrode buffer layers producing high performance nonvolatile organic write-once-read-many-times memory devices. RSC Adv. 2017, 7, 13171–13176. [Google Scholar] [CrossRef] [Green Version]
- Li, J.; Zhong, H.; Liu, H.; Zhai, T.; Wang, X.; Liao, M.; Bando, Y.; Liua, R.; Zou, B. One dimensional ternary Cu–Bi–S based semiconductor nanowires: Synthesis, optical and electrical properties. J. Mater. Chem. 2012, 22, 17813–17819. [Google Scholar] [CrossRef]
- Altalhi, T.; Gobouri, A.A.; Refat, M.S.; El-Nahass, M.M.; Hassanien, A.M.; Atta, A.A.; Saad, H.A.; Alhazaa, A.N. Structural, electrochemical and optical properties of 1,2,4-triazine derivative. Appl. Phys. A 2020, 126, 815. [Google Scholar] [CrossRef]
- Philips-Invernizzi, B.; Dupont, D.; Caze, C. Bibliographical review for reflectance of diffusing media. Opt. Eng. 2001, 40, 1082–1092. [Google Scholar] [CrossRef]
- Mishra, V.; Warshi, M.K.; Sati, A.; Kumar, A.; Mishra, V.; Sagdeo, A.; Kumar, R.; Sagdeo, P.R. Diffuse reflectance spectroscopy: An effective tool to probe the defect states in wide band gap semiconducting materials. Mater. Sci. Semicond. Process. 2018, 86, 151–156. [Google Scholar] [CrossRef]
- Altalhi, T.; Gobouri, A.A.; Refat, M.S.; El-Nahass, M.M.; Hassanien, A.M.; Atta, A.A.; al Otaibi, S.; Kamal, A.M. Optical spectroscopic studies on poly(methyl methacrylate) doped by charge transfer complex. Opt. Mater. 2021, 117, 111152. [Google Scholar] [CrossRef]
- Kafle, B.P. Chemical Analysis and Material Characterization by Spectrophotometry. Elsevier: Amsterdam, The Netherlands, 2020; pp. 269–296. [Google Scholar]
- Wemple, S.H.; DiDomenico Jr., M. Behavior of the Electronic Dielectric Constant in Covalent and Ionic Materials. Phys. Rev. B 1971, 3, 1338. [Google Scholar] [CrossRef]
- Wemple, S.H. Refractive-Index Behavior of Amorphous Semiconductors and Glasses. Phys. Rev. B 1973, 7, 3767–3777. [Google Scholar] [CrossRef]
- El-Nahass, M.M.; Zayed, H.A.; Elgarhy, E.E.; Hassanien, A.M. Effect of γ- irradiation on structural, optical and electrical properties of thermally evaporated iron (III) chloride tetraphenylporphyrin thin films, Radiat. Phys. Chem. 2017, 139, 173–178. [Google Scholar]
- Edward Palik, D. Handbook of Optical Constants of Solids; Academic Press: New York, NY, USA, 1985; p. 265. [Google Scholar]
- El-Nahass, M.; El-Deeb, A.; Metwally, H.; Hassanien, A. Influence of annealing on the optical properties of 5,10,15,20-tetraphenyl-21H, 23H-porphine iron (III) chloride thin films. Mater. Chem. Phys. 2011, 125, 247–251. [Google Scholar] [CrossRef]
- El-Nahass, M.; El-Deeb, A.; Metwally, H.; El-Sayed, H.; Hassanien, A. Influence of X-ray irradiation on the optical properties of iron (III) chloride tetraphenylporphyrin thin films. Solid State Sci. 2010, 12, 552–557. [Google Scholar] [CrossRef]
- Leontie, L.; Druta, I.; Danac, R.; Prelipceanu, M.; Rusu, G.I. Electrical properties of some new high resistivity organic semiconductors in thin films. Prog. Org. Coat. 2005, 54, 175–181. [Google Scholar] [CrossRef]
- Hassanien, A.M. Surface topology, optical spectroscopic and electrical studies on boron subphthalocyanine chloride thin films. J. Dispers. Sci. Technol. 2021, 1–8. [Google Scholar] [CrossRef]
- Mott, N.F.; Davis, E.A. Electronic Processes in Non-Crystalline Materials, 2nd ed.; Clarendon Press: Oxford, UK, 1979. [Google Scholar]


| r | Z s−1 | Tmax K | KJ/mol−1 | ||||
|---|---|---|---|---|---|---|---|
| 0.9998 | 0.8 | 3.65 × 10⁶ | 527 | 132 | −125 | 128 | 191 |
Publisher’s Note: MDPI stays neutral with regard to jurisdictional claims in published maps and institutional affiliations. |
© 2022 by the authors. Licensee MDPI, Basel, Switzerland. This article is an open access article distributed under the terms and conditions of the Creative Commons Attribution (CC BY) license (https://creativecommons.org/licenses/by/4.0/).
Share and Cite
Alrooqi, A.; Al-Amshany, Z.M.; Al-Harbi, L.M.; Altalhi, T.A.; Refat, M.S.; Hassanien, A.M.; Mersal, G.A.M.; Atta, A.A. Spectroscopic and Physicochemical Studies on 1,2,4-Triazine Derivative. Coatings 2022, 12, 714. https://0-doi-org.brum.beds.ac.uk/10.3390/coatings12050714
Alrooqi A, Al-Amshany ZM, Al-Harbi LM, Altalhi TA, Refat MS, Hassanien AM, Mersal GAM, Atta AA. Spectroscopic and Physicochemical Studies on 1,2,4-Triazine Derivative. Coatings. 2022; 12(5):714. https://0-doi-org.brum.beds.ac.uk/10.3390/coatings12050714
Chicago/Turabian StyleAlrooqi, Arwa, Zahra M. Al-Amshany, Laila M. Al-Harbi, Tariq A. Altalhi, Moamen S. Refat, Ali M. Hassanien, Gaber A. M. Mersal, and Ahmed A. Atta. 2022. "Spectroscopic and Physicochemical Studies on 1,2,4-Triazine Derivative" Coatings 12, no. 5: 714. https://0-doi-org.brum.beds.ac.uk/10.3390/coatings12050714