Article

Aggregate-Bitumen Interface Enhancement Mechanism of Utilization of Oil Shale Waste as Fine Aggregate in Open Grade Friction Course

1
School of Transportation, Jilin University, Changchun 130022, China
2
School of Transportation, Changchun college of architecture, Changchun 130604, China
*
Author to whom correspondence should be addressed.
Submission received: 3 September 2019 / Revised: 26 September 2019 / Accepted: 30 September 2019 / Published: 3 October 2019
(This article belongs to the Collection Pavement Surface Coatings)

Abstract

:
Oil shale waste (OSW), as fine aggregate in the mixture (particle size less than 4.75 mm), can effectively improve the overall properties of open grade friction course (OGFC), but the reinforcement mechanism is not clear. Thus, a comprehensive investigation of the reinforcement mechanism of OSW as fine aggregate is essential to provide better understanding for promoting its engineering application. In this paper, the reinforcement mechanism of OSW was explored through numerical calculations and laboratory tests from three aspects: macroscopic mechanical characteristics of mixture, micromechanics of asphalt mortar containing OSW filler, and adsorption characteristics of OSW. Numerical simulation results showed that the aggregate with a particle size greater than 4.75 mm in OGFC is the skeleton, which is the main loading bearing aggregate, and the skeleton bears more than 85% of external loads. The beam bending test and indirect tensile test results illustrated that the introduction of OSW improves the shear resistance and flexure-tension resistance properties of asphalt mortar, which is beneficial the overall properties of OGFC. From the Brunauer Emmett Tell test and Scanning Electron Microscope test, it was known that OSW has large specific surface area, dense pore structure, and various mesoporous shapes, which means a larger adsorption area and stronger adsorption with asphalt binder. Three self-developed tests containing asphalt adsorption capacity test, infiltrated asphalt saturation test and aggregate-bitumen interface observation test manifested that the existence of “claws”-pointed synapses at OSW-bitumen interface is the main reason for the significant improvement of properties of asphalt mortar containing OSW filler.

1. Introduction

Asphalt binder is a composite material that is mainly obtained from petroleum refinery, and is widely used in pavements due to the special properties such as impermeability and viscoelasticity [1,2,3]. More than 94% of the 2.7 million miles of paved roads in the United States are surfaced with asphalt [4,5,6]. There are approximately 400 million tons of asphalt mixture per year are combined for pavement construction in the US [7,8]. However, with the rapid and large-scale construction and maintenance of highway and airfield pavements, the availability of non-renewable, limited, and essential construction materials is declining [9,10,11,12]. Hence, pavement engineering needs to move away from a resource-consumption industry, shifting toward being more environment-friendly and sustainable [13,14,15,16,17].
In order to facilitate sustainable development of pavements, attempts to recycle and reuse the waste generated from industries have received much attention in the past decades, such as coal waste, waste glass powder, red mud, construction, and demolition waste [18,19,20,21,22]. The utilization of waste in asphalt pavement can be summarized as two aspects, modifying asphalt and replacing aggregate [23,24]. Abo and Ragab evaluated the benefits utilization the recycle polyethylene terephthalate waste plastic materials (PTP) as a modifier to asphalt mixtures. The conclusions showed that the addition of 12% of PTP increased the pavement service life 2.81 times and saved about 20% of the asphalt layer thickness [25]. Ziari et al. assessed the effect of nano-clay as bitumen modifier on rutting performance of asphalt mixtures containing high content of rejuvenated reclaimed asphalt pavement. The laboratory test results indicated that the reduction of flow number due to adding rejuvenator in the mixture can be compensated by using nano-clay modified virgin bitumen [26]. Tarbay et al. presented the use of waste materials (marble and granite) and by-product material (steel slag) as an alternative to the mineral conventional filler. The test results showed that the introduction of all waste materials enhanced overall properties compared to the traditional limestone filler [27]. Hainin et al. investigated utilization of steel slag as an aggregate replacement in porous asphalt mixtures. It was observed that the use of steel slag could perform admirably during high traffic loading [28]. In conclusion, the utilization of some industrial waste in pavement has been confirmed, and the utilization of industrial waste as partial aggregate is a promising solution to minimize environmental pollution by sinking more waste materials compared with modified asphalt method, which results in a reduction of the construction costs.
In a previous study [29], we assessed the mechanical properties of a modified open grade friction course (SM-OGFC), with oil shale waste as fine aggregate in open grade friction course. The test results showed that the Marshall stability and dynamic stability of SM-OGFC are 35.4% and 48.9% higher than that of OGFC. The −15 °C splitting strength and −10 °C bending-tensile strength of SM-OGFC are 35.4% and 31.5% higher than that OGFC, respectively. The immersion Marshall stability and spring-thawing stability of SM-OGFC were increased by 41.3% and 42%, respectively, compared with OGFC. Moreover, the Canatbro losses of SM-OGFC are 26.4% lower than that of OGFC. In summary, the utilization of oil shale waste as fine aggregate improved the overall properties of OGFC. However, the enhancement mechanism of utilization of oil shale waste as fine aggregate in OGFC is unclear. Thus, a comprehensive investigation of the mechanism of reinforcing the overall properties of OGFC by replacing the fine aggregate with oil shale waste is essential to provide better understanding for promoting its engineering application. The primary objectives of this study are to:
  • Evaluate the mechanical characteristics of OGFC through discrete element numerical simulation to see whether oil shale waste as a fine aggregate would have a significant impact on the mechanical characteristics of OGFC.
  • Investigate the micromechanics of asphalt mortar containing OSW filler with beam bending test and indirect tensile test to see if the asphalt mortar containing OSW filler would show better shear resistance and flexure-tension resistant properties.
  • Determine adsorption characteristics of OSW based on Brunauer Emmett Tell test and Scanning Electron Microscope test, and three self-developed tests, namely the asphalt adsorption capacity test, infiltrated asphalt saturation test, and aggregate-bitumen interface observation test.

2. Materials and Methodology

2.1. Asphalt

AH-90# “Panjin” base asphalt acquired from Qilu Branch of Sinopec Corp was used in this study, the technical parameters of the asphalt according to Chinese Standard Test Methods of Bitumen and Bituminous Mixtures for Highway Engineering (JTG E20-2011) are summarized in Table 1.

2.2. Oil Shale Waste

Oil shale waste (OSW) is an acidic inorganic material formed by oil shale after dry distillation or combustion; it has the characteristics of porosity and high-activity. The oil shale waste selected in this paper is the waste residue generated after the combustion of Huadian Longteng Power Plant in Jilin Province China. The color of oil shale waste is gray-brown, and it has a layered joint structure of shale and a large amount of flake particles. The chemical composition of oil shale waste is shown in Figure 1. The oil shale waste used in this paper is accumulated outdoors for a long time. Since the oil shale waste has a high moisture absorption rate, the oil shale waste should be pretreated before utilization. The pretreatment procedure of oil shale waste includes two steps of drying and smashing.

2.3. Aggregate

The aggregate used in the paper was the granite produced from Jiutai stone factory, and the technical parameters of coarse aggregate, fine aggregate, and mineral powder are shown in Table 2, Table 3 and Table 4.

2.4. Preparation of Asphalt Mortar Containing OSW Filler

In the previous study, the asphalt-aggregate ratio of OGFC and SM-OGFC is 4.8% and 5.18%, respectively, and the mass proportion of OSW that replaces the aggregates with particle size less than 4.75 mm is 23.5%. The asphalt-aggregate ratio of asphalt mortar and asphalt mortar containing OSW filler is 20.4% and 22.04%, respectively, according to the mass ratio, which obviously does not meet the requirements. According to the previous theoretical results, there are two methods for calculating the asphalt-aggregate ratio of asphalt mortar: the specific surface area conversion method and the δ volume correction method. The main principle of the specific surface area conversion method is based on the principle that the same surface area of the aggregate adsorbs the same amount of asphalt. The asphalt-aggregate ratio of asphalt mortar calculated with the specific surface area conversion method is generally low [30,31]. Thus, the δ volume correction method was employed for the calculation of asphalt-aggregate ratio of asphalt mortar in this study.
According to the δ volume correction method, the asphalt-aggregate ratio of asphalt mortar can be calculated to be 11.2%. In order to ensure the consistency of the comparative test, the asphalt-aggregate ratio of asphalt mortar containing OSW filler was also selected to be 11.2%. Since the aggregate of asphalt mortar is below 4.75 mm and the asphalt content is high, the asphalt mortar samples were prepared according to the static pressure method (T 0704, JTJ 052-2000).

2.5. Methodology

The main procedure of this study was divided into three steps as follows:
  • Mechanical characteristics of OGFC was explored according to Particle Flow Code (PFC) software to find the contribution rate of aggregate with different particle size for loading bearing, so as to determine the role of fine aggregate replaced by OSW in the whole mechanical system. For this aim, a two-dimensional (2D) PFC model with size of 100 mm × 65 mm was established, and the particle size of main loading-bearing aggregate was determined. the aggregate with a particle size greater than 4.75 mm in OGFC is the skeleton, which is the main loading bearing aggregate, and the skeleton bears more than 85% of external loads.
  • Asphalt mortar containing OSW filler were manufactured according to δ volume correction method, and the beam bending test and indirect tensile test to explore the shear resistance and flexure-tension resistant properties. Three replicates were conducted for each test.
  • BET and SEM test were applied to characterize the appearance of the surface of oil shale waste. Moreover, three self-developed test containing asphalt adsorption capacity test, infiltrated asphalt saturation test and aggregate-bitumen interface observation test were designed to explore the bonding strength and contact mode of OSW-bitumen interface.
The main procedure of this study is shown in Figure 2.

2.5.1. Beam Bending Test and Indirect Tensile Test

The flexure-tension resistant properties of asphalt mortar containing OSW filler is observed via beam bending test. The bending-tensile strength (RB), maximum bending strain (εB), and the bending stiffness modulus (SB) of mixture is acquired through −10 °C beam bending test according to Chinese standards GB/T 0715-2011 [32]. Indirect tensile test was carried out to evaluate the shear properties of asphalt mortar containing OSW filler. The splitting strength (ST) of asphalt mortar is obtained by −10 °C splitting test according to Chinese standards GB/T 0716-2011 [32]. The splitting strength is an important factor for assessing the capacity of asphalt mortar to bear dynamic loads.

2.5.2. BET and SEM Test

The roughness of the fine aggregate surface determines the adhesion area and combination form of the fine aggregate and asphalt. In general, the rougher the surface of fine aggregate, the fuller the contact between fine aggregate and asphalt, and the better the bonding properties. Thus, the specific surface area, pore volume and aperture of OSW, and stone with a particle size of 0.6 mm were measured through the automatic specific surface and micropore diameter analyzer (ASAP 2020M, Micrometric ltd, Georgia, USA). Scanning Electron Microscopy test (SEM) was used to magnify the sample and observe its microscopic structure. In this research study, Hitachi SU8000 scanning electronic microscopy (Hitachi, Ltd, Tokyo, Japan) was utilized to observe the micro-structure of OSW particles and stone with a particle size of 0.6 mm.

2.5.3. Three Self-Developed Tests of Adsorption Characteristics of OSW

At present, the aggregate-bitumen interface bond strength is generally evaluated through water boiling method, but the method is too old and not intuitive. Thus, three self-developed test method was designed to evaluate the adsorption characteristics of OSW and asphalt. The asphalt adsorption test is based on the Schellenberg binder drainage test to evaluate the asphalt adsorption capacity of OSW. The capacity of OSW to absorb infiltrated asphalt was determined according to the infiltrated asphalt saturation test. Aggregate-bitumen interface observation test was designed to explore the contact mode of OSW-bitumen interface with liquid silica gel.

3. Mechanical Structure Characterization of OGFC

3.1. Two-Dimensional Mesoscopic Model of OGFC

According to distributing states of coarse mineral aggregates in the mixture, semi-rigid base course material is divided into three structural types: “suspend-dense” structure, “framework-dense” structure, and “framework-pore” structure [33]. OGFC as a “framework-pore” structure of asphalt mixture, its mechanical characteristics are different from the other two types of asphalt mixture under external load. In order to discuss the mechanical characteristics of OGFC, two-dimensional mesoscopic models of OGFC and asphalt concrete (AC, a “suspend-dense” structure) were established through PFC software in this paper. The mesoscopic model, which is based on non-continuum mechanics, consists of different particle shape and contact state that evaluating the macroscopic mechanical properties of medium from the perspective of microstructure. In recent years, PFC software, as a simulation software based on discrete element method, has been used to analyze the microscopic mechanical behavior of asphalt mixture. The basic idea of PFC is to describe the complex mechanical behavior of the medium based on the most basic unit of the medium—the particle—and the most basic mechanical relationship—Newton’s second low; thus, it is an essential and fundamental concept [34,35,36]. Since asphalt mixture is a bulk medium, its deformation is mainly caused by the relative sliding and rolling of the internal medium or the opening and closing of the weak interface, rather than its own deformation [
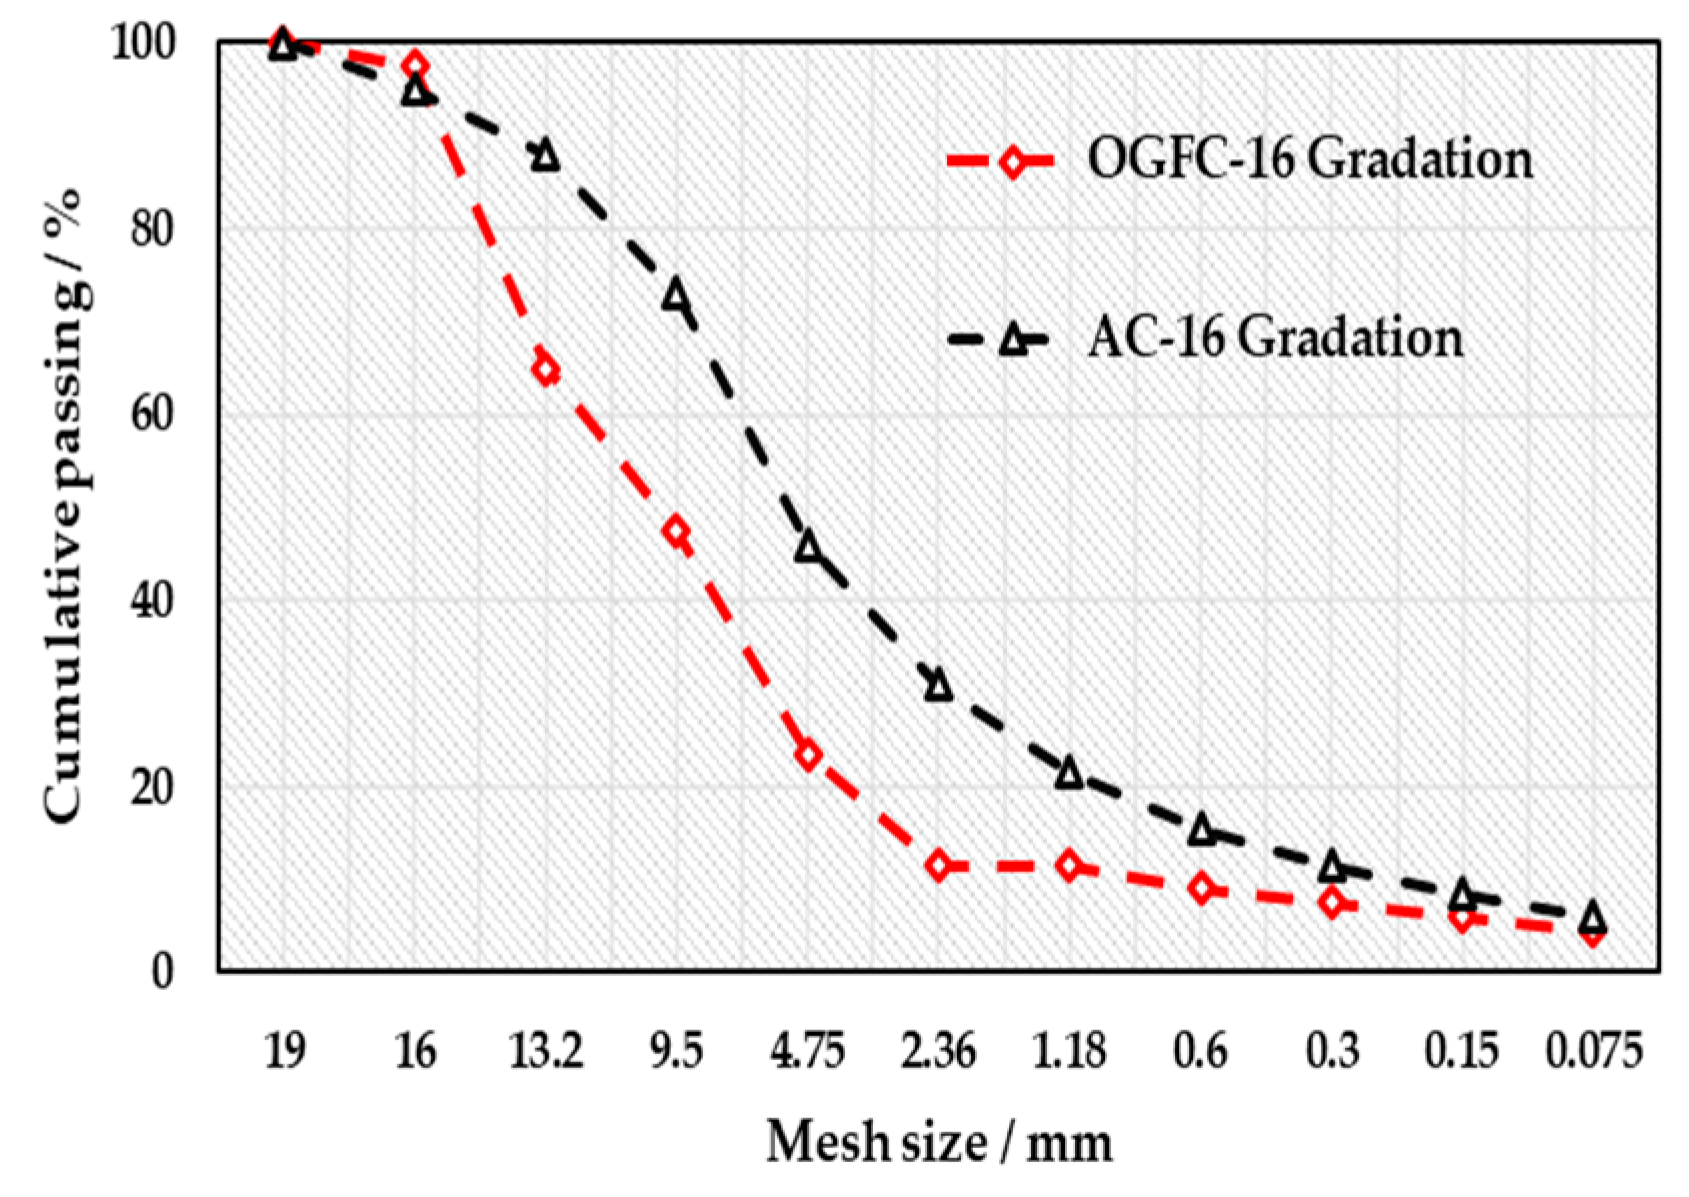
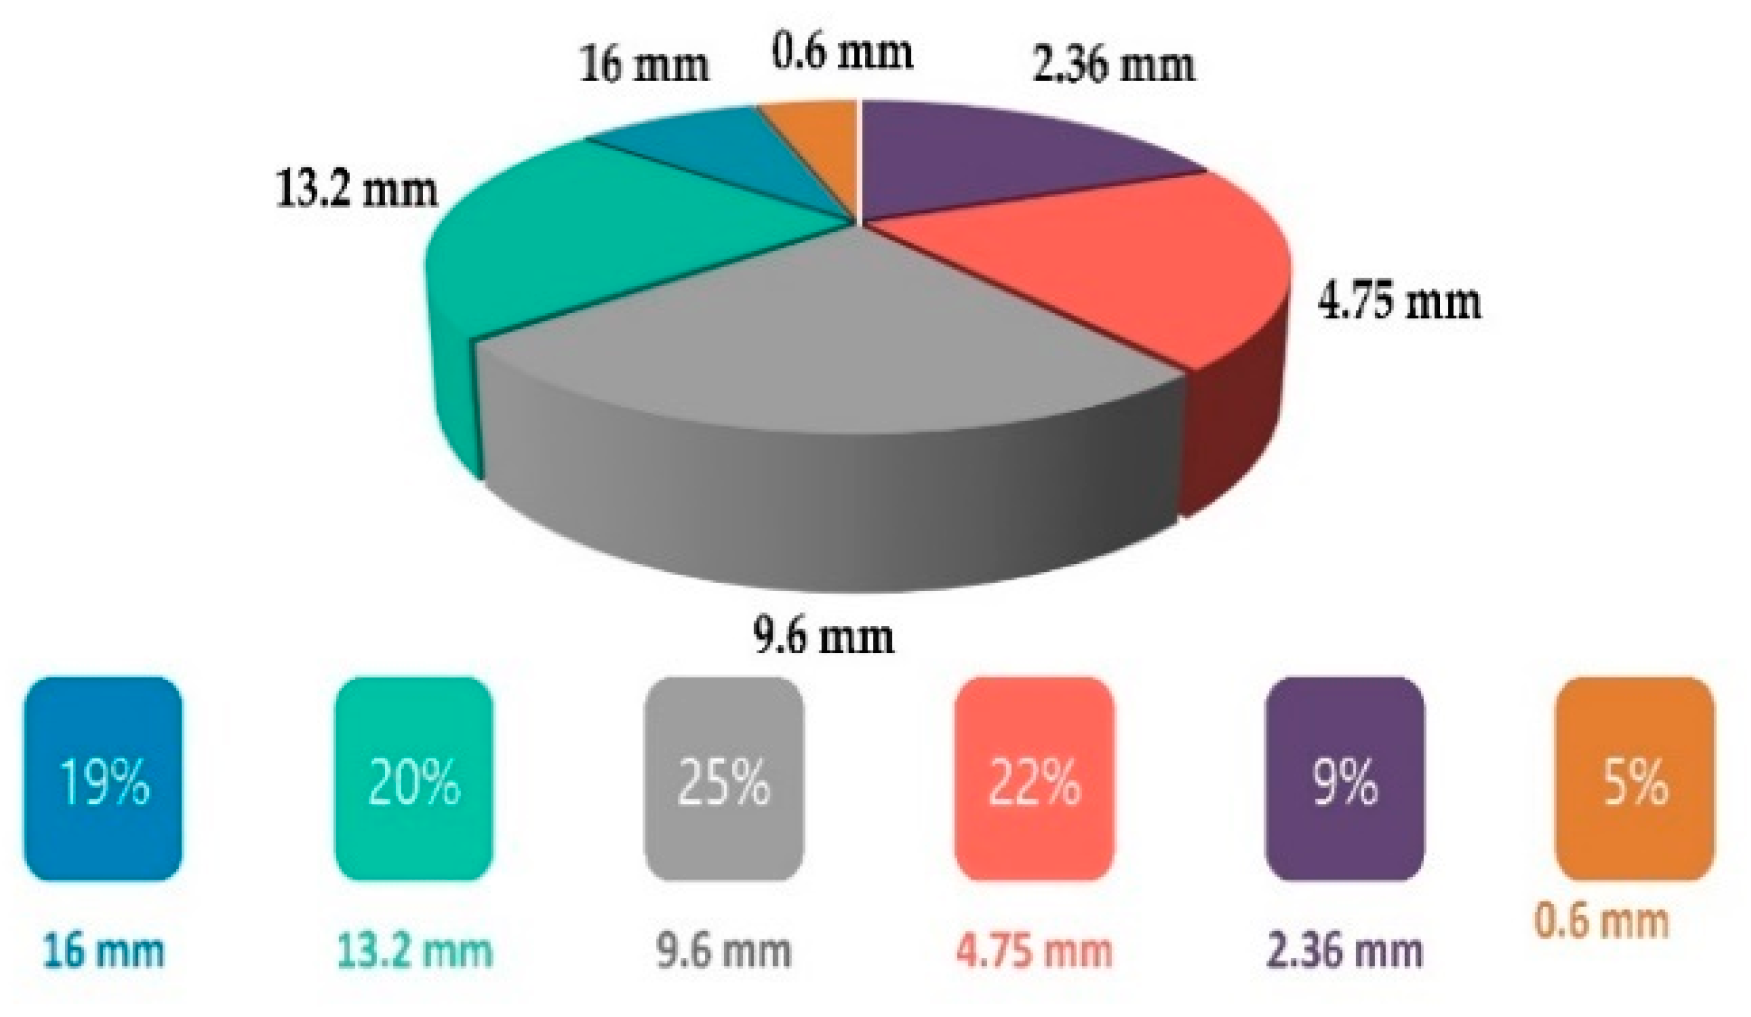
37]. Therefore, the PFC software based on the discrete element calculation method is widely used in the numerical simulation of asphalt mixture. The operation of PFC software is mainly divided into seven steps: Step 1: defining mock objects; Step 2: establishing the basic concept of mechanical model; Step 3: constructing and running a simplified model; Step 4: supplement model parameters such as: geometric properties, material properties, external loads, etc.; Step 5: preparation before running, such as: determining the running step, setting the monitoring point; Step 6: running the model for calculation; Step 7: data analysis. The PFC software used in this study is developed by the Itasca company in the USA. Based on the 2D PFC model, the aggregate skeleton in asphalt mixture and internal mechanical characteristics of asphalt mixture was studied. The gradation of AC-16 and OGFC-16 used in the test is shown in Figure 3.
The aggregate with smaller particle size and the mineral powder mainly play the role of filler in the asphalt mixture. After the interaction of between asphalt, fine aggregate, and mineral powder, the asphalt is rearranged on the surface of fine aggregate and mineral powder to form a layer of diffusion solvent chemical film. A mixture containing asphalt, fine aggregate, and mineral powder is wrapped around the surface of the stone and joined to form a contact between the particles and the particles. Moreover, in order to avoid the instability or even collapse of the PFC software caused by the excessive generation of “balls”, the aggregate with a particle size below 0.3 mm, mineral powder, and asphalt were ignored, and the contact between stones is defined as a viscoelastic contact to characterize the adhesion of mixture containing asphalt, fine aggregate, and mineral powder.
Numerous investigations have shown that the irregular shape of the coarse aggregate has a significant effect on the mechanical properties of asphalt mixture [38]. Therefore, the irregular shape of the coarse aggregate must be considered in the numerical simulation of asphalt mixture. The in-built compiled language—“Fish” language—was employed for the coarse aggregate generation algorithm. Since the actual mesh is square, the irregular shape of coarse aggregates with the same actual particle size is generated through the plane random division method, and then, the shape is filled with the “Clump” command to achieve the generation of coarse aggregate. The aggregate of 0.3–1.18 mm particle size is filled with the “Ball” generation command. In order to prevent the overflowing of “Balls”, the model is restricted with the “Wall” command to form a boundary constraint, and the calculation area is 100 mm × 65 mm.
In the high-precision numerical simulation process of asphalt mixture, it is necessary to determine the mesoscopic parameters of the aggregate and the contact parameters between the aggregates. Asphalt mixture is a coarse dispersion system formed by dispersing coarse aggregates in the asphalt mortar. The contact between components is mainly the aggregate-aggregate contact, aggregate internal contact, aggregate-asphalt mortar contact. According to the previous study, the main contact parameters of the model are shown in Table 5 [39].
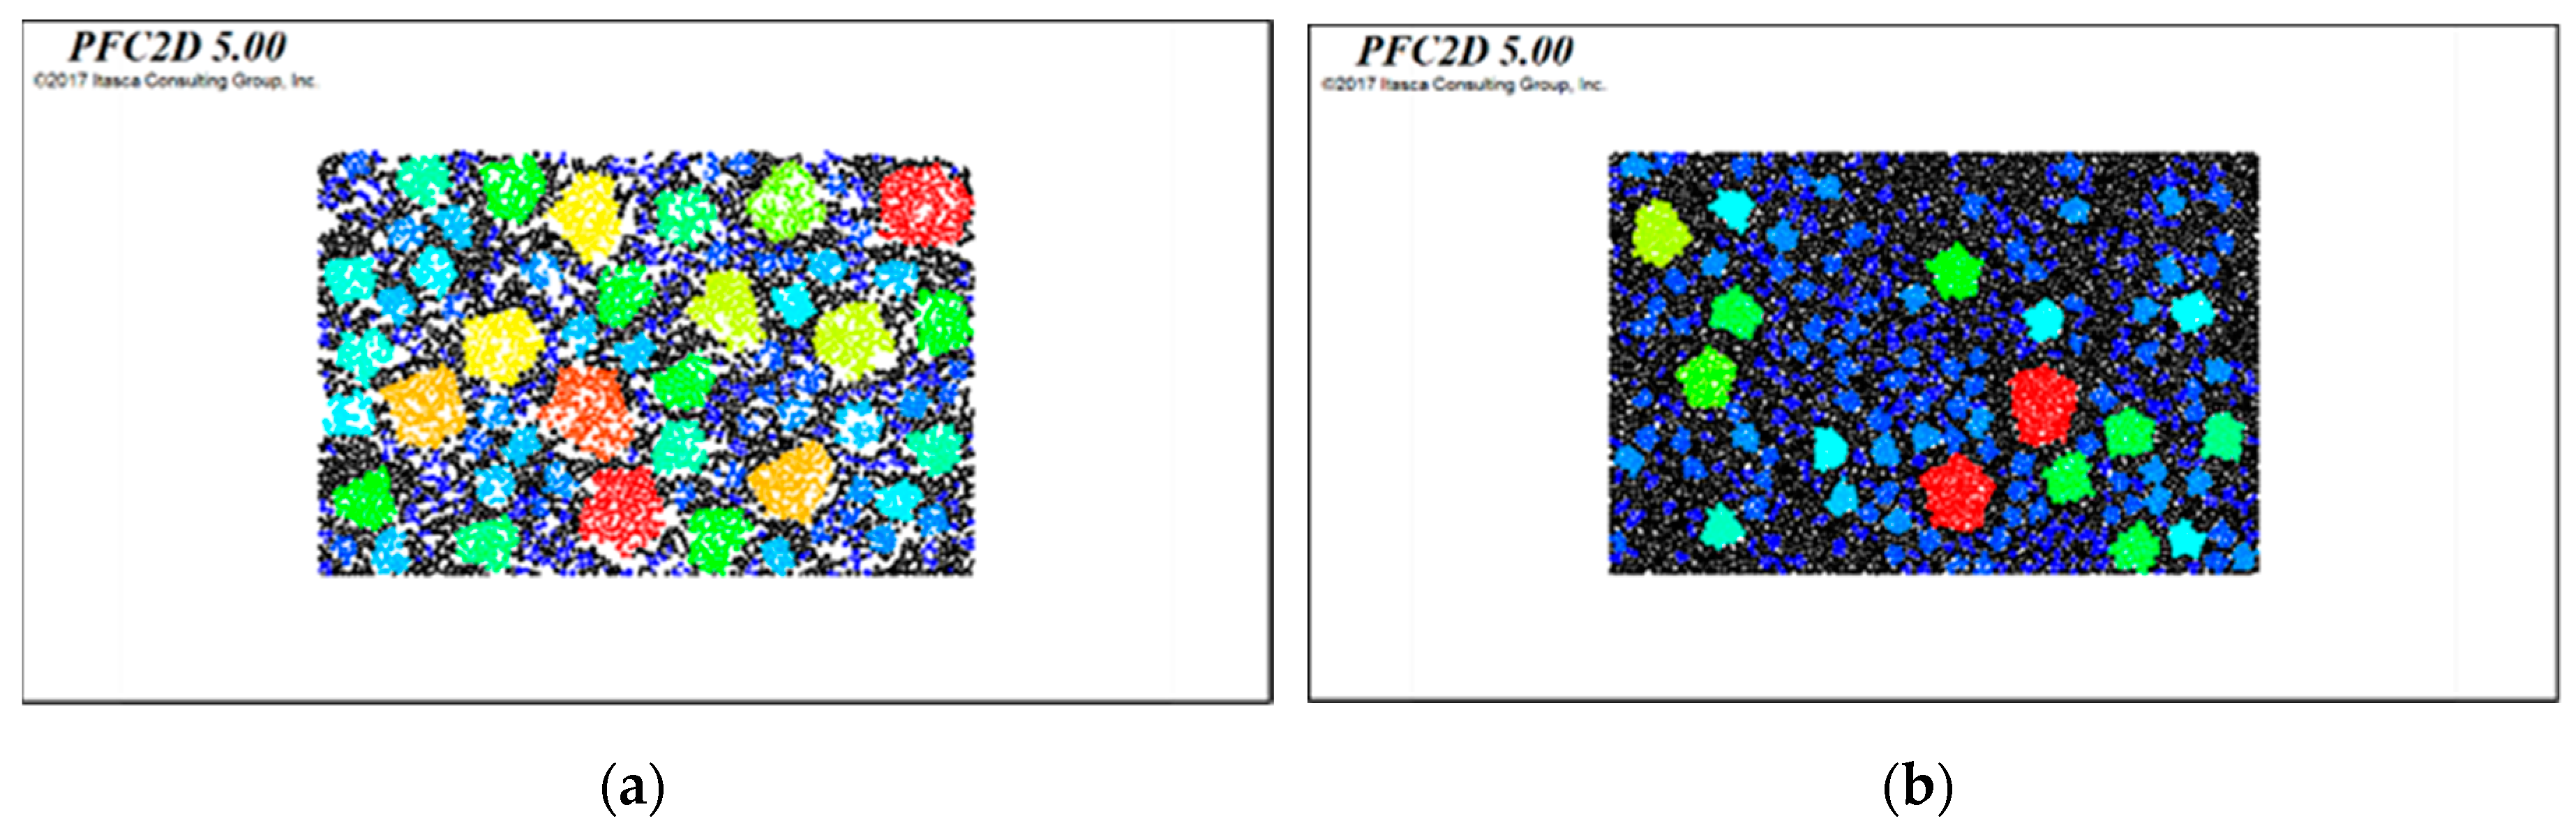
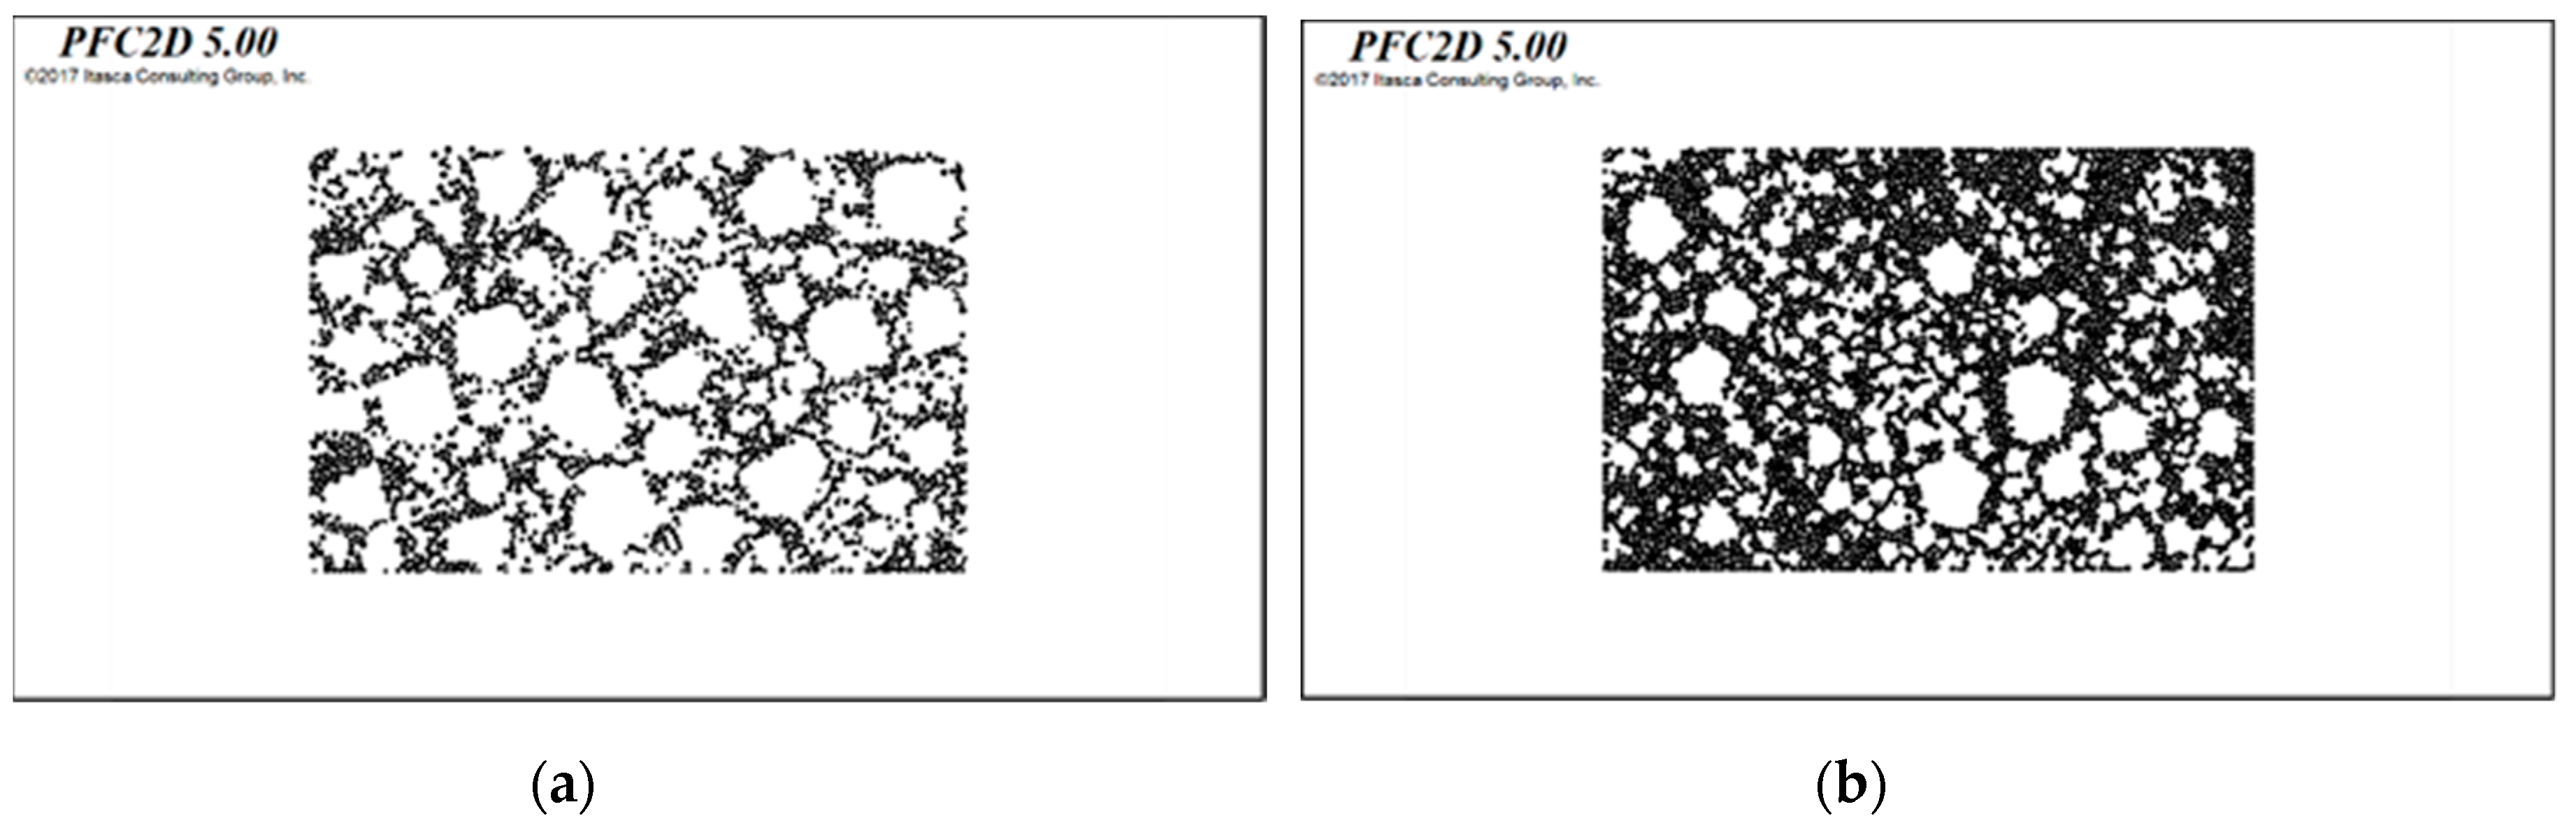
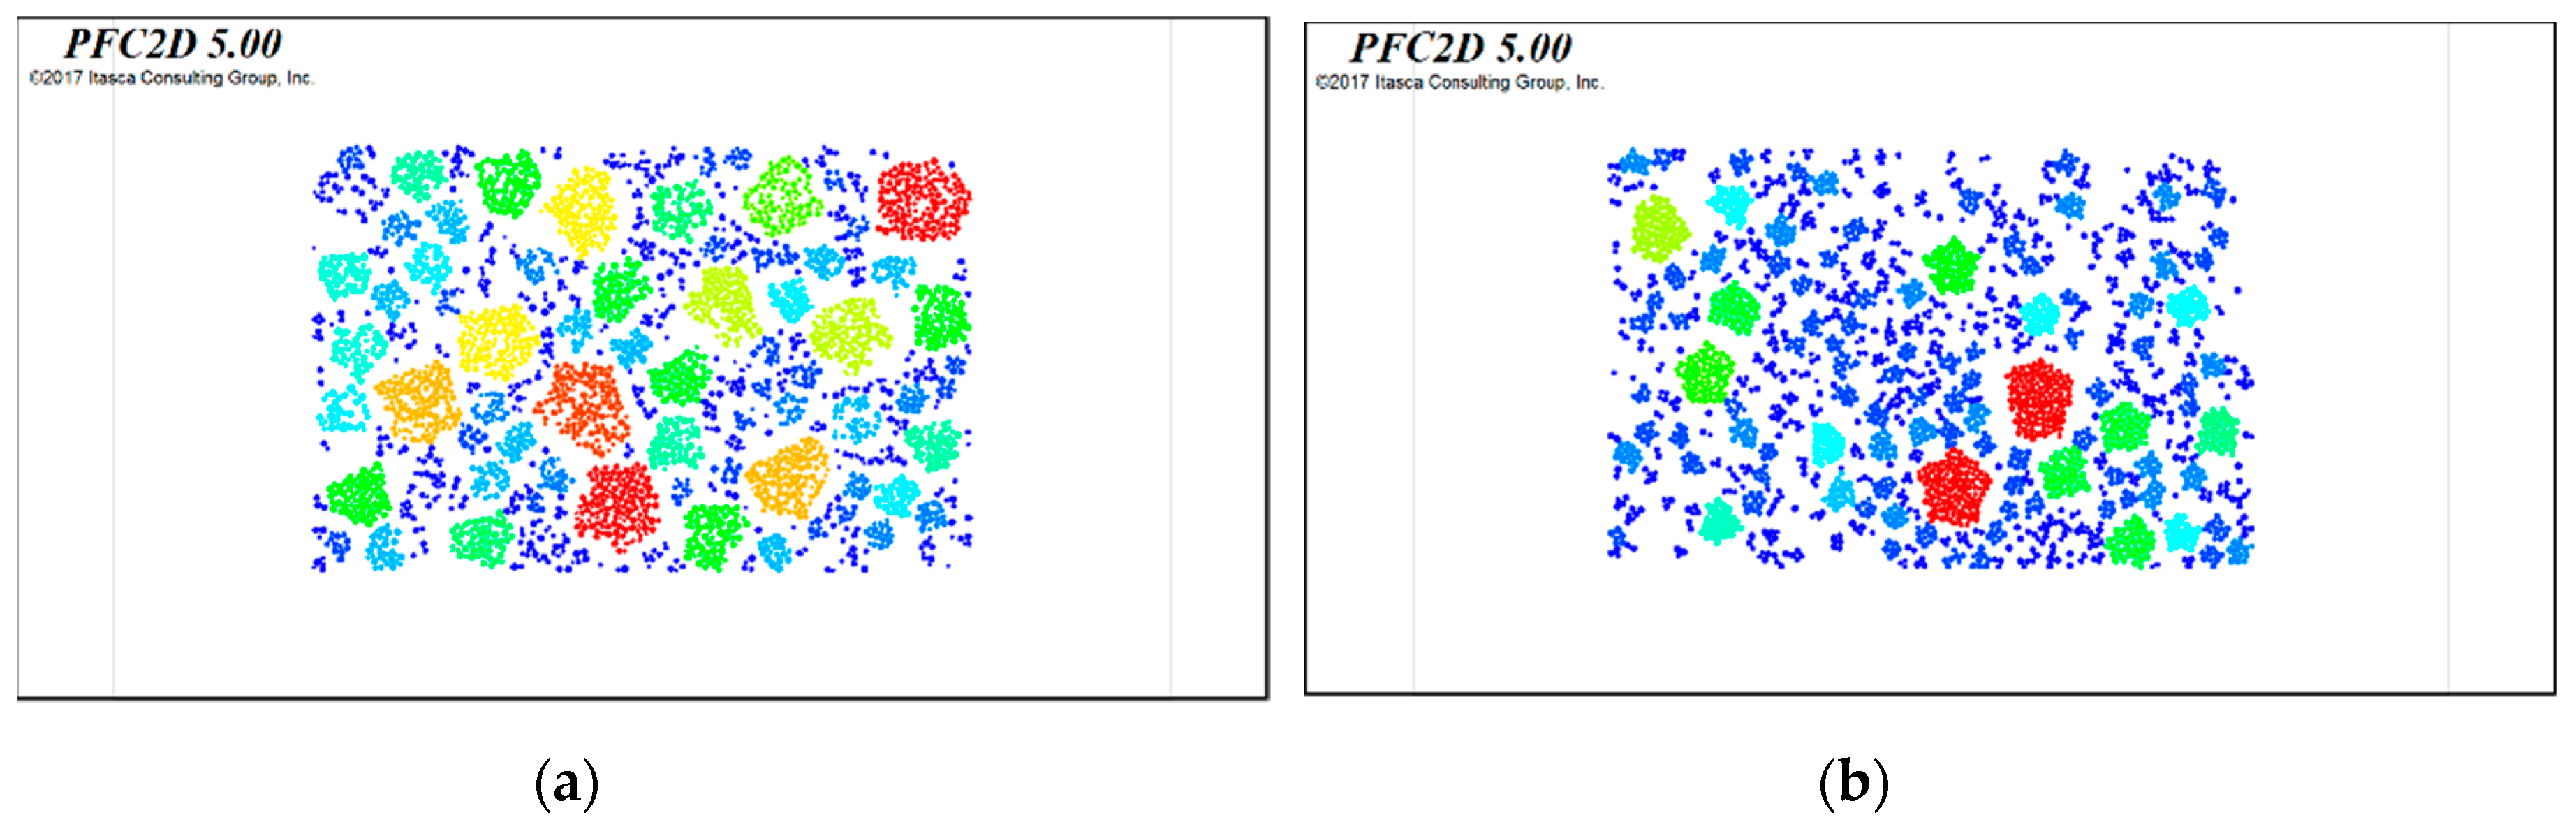
The two-dimensional PFC model of OGFC and AC based on gradation are shown in Figure 4.
It can be clearly seen from Figure 5 and Figure 6 that there are obvious differences in the meso-structure of the two asphalt mixtures. The coarse aggregate of OGFC has a higher proportion and the fine aggregate is rare. The coarse aggregates are easy to gather together to form a skeleton, but the amount of fine materials is too small and the gap between the coarse aggregates cannot be fully filled; thus, the “framework-pore” structure is formed. The “framework-pore” structure is the key to ensure the permeability of OGFC. The two-dimensional mesoscopic models are equivalent to the longitudinal section of OGFC Marshall test piece, thus, the interconnected voids are not easily observed. If the model is a three-dimensional structure, the pore distribution of OGFC can be seen more intuitively. AC is a continuous dense mineral mixture, and the voids are significantly smaller than that of OGFC. AC can achieve a large degree of compactness due to more fine aggregates and less coarse aggregates. The aggregate at each level are separated by secondary aggregates. The aggregates cannot be directly gathered together to form a skeleton, but can exist in a suspended state between the secondary aggregate and the asphalt mortar, which is a “suspend-dense” structure. The upper surface of OGFC is rougher than AC, which is consistent with the actual characteristics.

3.2. Mechanical Characteristics of OGFC

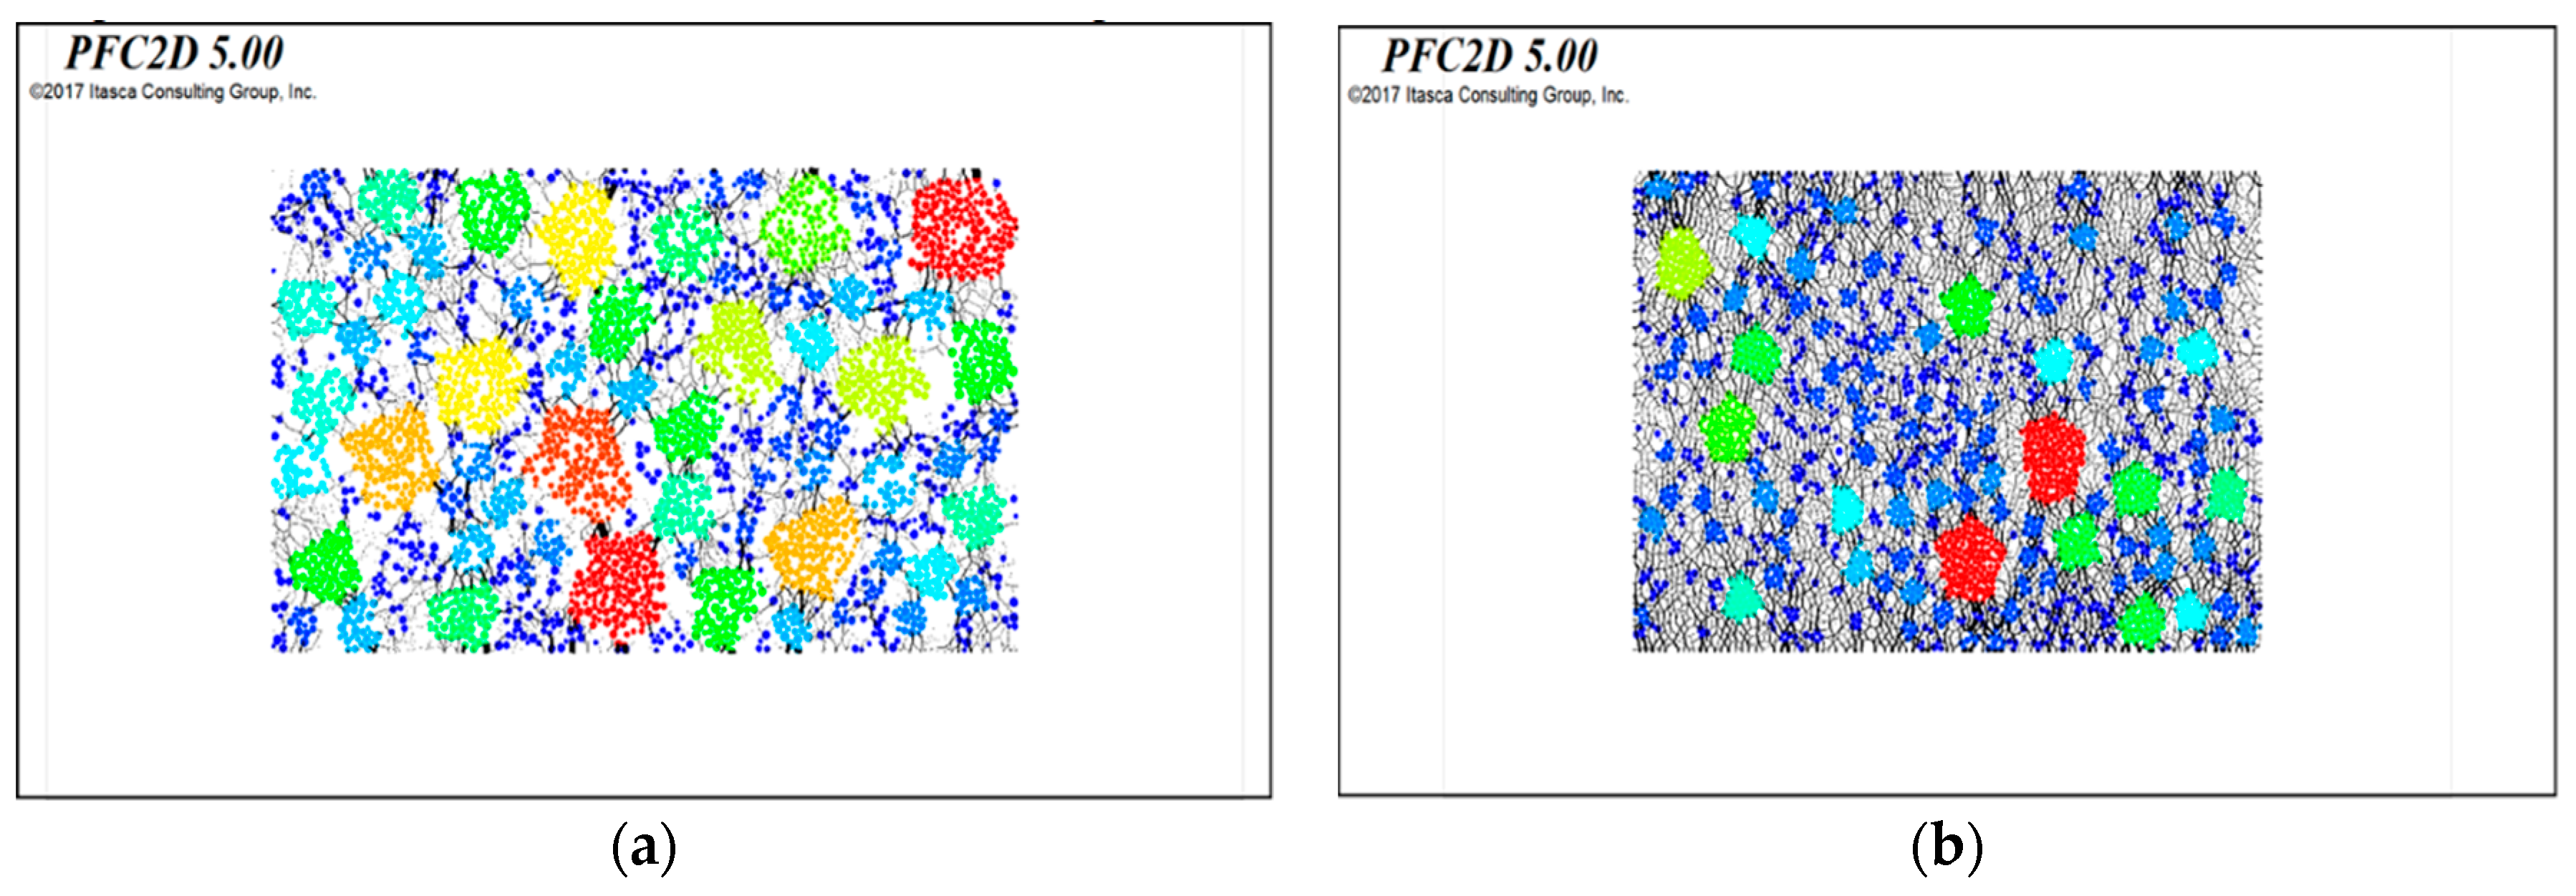
In order to study the mechanical properties of OGFC and AC pavement materials under external load, two rigid walls were set at the top and bottom of the model. A strain-control mode was used in the simulation test, which was based on dynamic creep test. The rigid bottom wall of the model was fixed. In PFC2D, walls are assigned at constant or variable velocity. The variable speed of the top wall can be regulated by writing a servo-control code at a speed of 1/1000 mm. The displacement of the rigid top wall of the model was the vertical deformation of the model. The total stiffness of the particles was updated at each time-step. The multiplication of the total stiffness and the vertical deformation was the load on the model. In each cycle, the moving speed of the top could be black-calculated by the target load and stiffness. The speed of the top wall was controlled by the continuous sinusoidal load function, and the simulation terminates when the total deformation of the mixture is 1 mm. Under the action of gravity and external load, contact occurs between adjacent particles, forming a plurality of force chains with different strengths. The chains cross each other to form a network, which penetrates non-uniformly into the particulate matter and supports most of the weight and external load of the particles system. The force chain is the way to transfer the load. In the PFC software, the force chain is the connection between the centroid and the contact point of the particles that are in contact with each other. The thicker the force chain, the more concentrated the force is. Since the coarse aggregates is generated by the “Clump” command, the force chain of it will only be generated in the surrounding “Pebble” units of the “Clump”, and will not penetrate the centroid of the “Clump”. In order to facilitate the observation and discussion, the fine aggregates would be hidden in the force chain diagram. The force chain diagram of OGFC and AC under loading is shown in Figure 7, the black connection in the diagram is the force chain.
It can be clearly seen from Figure 7 that the force chain is more evenly distributed in AC, and the force chain of OGFC is mainly concentrated at the contact point between the coarse aggregate, and the force chain is relatively thick. This is because AC has more fine aggregate than OGFC, and the asphalt mortar formed by fine aggregate and asphalt binder can exist between the coarse aggregates in a suspended state. The load is mainly transferred through the asphalt mortar when subjected to external load, and the force chain distribution is relatively uniform due to the high density of AC. In the structure of OGFC, due to the less fine aggregates, the gap between the coarse aggregates cannot be fully filled, and the load can only be transferred through the skeleton formed by the intrusion of coarse aggregate. Therefore, the strength, stability, and stiffness of the skeleton determine the ability of OGFC to resist external loads.
In order to quantitatively evaluate the structural characteristics of OGFC, the Contribution rate of Aggregate for Load bearing index (referred to as CAL) was applied for the further discussion. When OGFC is subjected to external loads, the loads are transmitted through the contact points between aggregates, and the number of contact points and the contact force of each contact point can be measured through the traversal command in PFC software. Assuming that there are K particles in the aggregate in S-grade, the average contact force of aggregate in S-grade can be calculated by the following formula:
F s ¯ = i = 1 k F i k
The proportion of the average contact force of the aggregate in S-grade in the total average contact force of the aggregates is defined as the contribution rate of aggregate for load bearing index, the formula is as follows:
CAL s = F s ¯ s = 1 n F s ¯
In the formula, n is the partition number of aggregates in the asphalt mixture, and the F s ¯ ¯ is the average contact force of aggregate in S-grade. The CAL of aggregates with different particle sizes is shown in Figure 8.
From Figure 8, the CAL value of aggregates with the maximum nominal size of 4.75, 9.6, 13.2, and 16 mm is relatively large, indicating that the coarse aggregates play a major role in resisting external loads. Moreover, the aggregates with the particle size larger than 4.75 mm bears more 85% of the contact force, which indicates that the aggregates with the particle size larger than 4.75 mm in OGFC is the skeleton, and it is the main loading bearing particle. The effect of aggregates with the particle size less than 4.75 mm on resistance to external loads also cannot be ignored. The main function of asphalt mortar formed by fine aggregates and asphalt binder is to fill the pores, support the skeleton, enhance the stability of the skeleton, and prevent the overturn of skeleton, but the asphalt mortar is not part of the loading bearing skeleton in OGFC.

4. Micromechanics of Asphalt Mortar Containing OSW Filler

According to the above numerical simulation analysis, it is found that the aggregates with the particle size larger than 4.75 mm in OGFC is the main loading bearing particle. However, in the previous study, only aggregates with particle size less than 4.75 mm are substituted by oil shale waste, which did not change the gradation and mechanical structure of OGFC. Therefore, the main reason for the significant improvement in properties of SM-OGFC is related to the mechanical properties of asphalt mortar containing OSW filler. The micromechanics of asphalt mortar containing OSW filler is analyzed in the following three aspects: mechanical properties of asphalt mortar containing OSW filler, material characteristics of OSW, and adsorption characteristics of OSW.

4.1. Mechanical Properties of Asphalt Mortar Containing OSW Filler

4.1.1. Beam Bending Test

Table 6 shows the beam bending test results of two asphalt mortar samples.
As can be seen, the asphalt mortar and asphalt mortar containing OSW have obvious differences in mechanical properties during the process of blending-tension failure. The bending-tensile strength reflects the ultimate load that the asphalt mortar can withstand during the bending process. The greater the bending-tensile strength, the greater the bending failure capacity of the asphalt mortar. The bending-tensile strength of asphalt mortar containing OSW filler is 14.3% higher than that of asphalt mortar, indicating that the introduction of OSW can effectively improve the flexure-tension resistant properties of asphalt mortar. The maximum bending strain of asphalt mortar containing OSW filler is very close to that of asphalt mortar. This may be because the maximum bending strain of asphalt mortar is mainly determined by the cohesive properties of asphalt. The asphalt used in the test is the same bitumen; thus, the maximum bending strain of two asphalt mortar samples is relatively close. The bending stiffness modulus of asphalt mortar containing OSW filler is greater than that of asphalt mortar, which indicates that the introduction of OSW can effectively improve the tenacity and flexure-tension resistant properties of asphalt mortar.

4.1.2. Indirect Tensile Test

The ST value of asphalt mortar and asphalt mortar containing OSW filler were found to be 1.424 and 1.892, respectively. Additionally, the ST value of asphalt mortar containing OSW filler was 52.9% higher than asphalt mortar. The higher ST value indicates that the asphalt mortar has better resistance against pressure, horizontal, and shear stress induced from the loading. The test results illustrated that the utilization of oil shale waste as fine aggregate in OGFC greatly improves the shear properties of asphalt mortar. According to the mechanical structure analysis of OGFC in Section 3.2, the load bearing structure of OGFC is mainly composed of two parts: one part is the skeleton formed by the coarse aggregates, the main function of the skeleton is to transmit the load through the point contact between the coarse aggregates; the other part is the asphalt mortar formed by the fine aggregate and asphalt, the main function of the asphalt mortar is to wrap the skeleton and provide horizontal support for the skeleton. This also indicates that the shear resistance and flexure-tension resistant properties of asphalt mortar determines the anti-overturning property of the skeleton and the stability of the whole structure. The introduction of OSW may change the contact between asphalt and aggregate, which improves the shear resistance and flexure-tension resistant properties of asphalt mortar, and further improves the overall mechanical properties of OGFC.

4.2. Material Characteristics of OSW

4.2.1. BET Test

The roughness of the fine aggregate surface determines the adhesion area and combination form of the fine aggregate and asphalt. In general, the rougher the surface of fine aggregate, the fuller the contact between fine aggregate and asphalt, and the better the bonding properties. In this section, the specific surface area, pore volume, and aperture of OSW and stone with a particle size of 0.6 mm were measured through the automatic specific surface and micropore diameter analyzer (ASAP 2020M, Micrometric ltd, US), and the test results are shown in Table 7.
It can be seen from Table 7 that the morphology parameters of OSW are quite different from those of stone. OSW is a typical porous material with large specific surface area. The specific surface area refers to the sum of the internal surface area and the external surface area of a unit mass of material. The larger the specific surface area, the greater the activity of the surface of the material and the stronger the adsorption capacity. The specific surface area of OSW is 1.59 times that of stone. The larger specific surface area means that OSW can be more fully contacted with asphalt, and the bonding area is larger, and the adhesion properties are better.
The pore volume, also known as the total pore volume of a unit mass of porous solid, can be used to characterize the effective adsorption volume of porous solid; the larger the pore volume of OSW, the larger the volume of adsorbate that the porous solid can accommodate. Table 7 shows that the pore volume of OSW is more than 12 times higher than that of stone, indicating that the OSW can hold more asphalt binder.
Average aperture and aperture range are used to characterize the distribution of pores on the surface of the material. The average aperture of OSW is much smaller than that of stone, thus, it can be concluded that the surface of OSW has a dense pore structure combined with the pore volume data, and the coverage density of pore structure on the surface of OSW is much higher than that of stone. From the perspective of the aperture range index, the pore size distribution of OSW is wider, especially the minimum pore diameter of OSW, which is almost a nanometer. These pore structures determine the larger specific surface area and pore volume of OSW.

4.2.2. Scanning Electronic Microscopy Test

Scanning Electron Microscopy test (SEM) was used to magnify the sample and observe its microscopic structure. In this research study, Hitachi SU8000 scanning electronic microscopy was utilized to observe the micro-structure of OSW particles and stone with a particle size of 0.6 mm, and the test results are shown in Figure 9.
It can be found from Figure 9 that compared with the stone particles, the surface of OSW is rough, the micro-void is relatively developed, and the porosity is high. On the SEM image with a magnifying power of ×1000, it was found that OSW has many micron-sized pores, and the edge of the pores is surrounded by mossy and petal-like protrusions. The aperture of the pores is mostly 5–30 um. On the SEM image with a magnifying power of ×10,000, it can be found that a plurality of cave-like pores is embedded in the micron-sized pores, which are connected to each other in the deep part, and exhibits an irregular laminar columnar connected structure. On the SEM image with a magnifying power of ×60,000, many small cell-like structural antennae appeared inside the pores. This structure has an internal surface area provided by the interlayer structure compared with stone. Due to the unique laminar columnar connected structure and cell-like structural antennae of OSW, it can achieve a better bonding effect with asphalt [29].

4.3. Adsorption Characteristics of OSW and Asphalt

At present, the aggregate-bitumen interface bond strength is generally evaluated through water boiling method, but the method is too old and not intuitive. Thus, three self-developed test method was designed to evaluate the adsorption characteristics of OSW and asphalt, asphalt adsorption capacity test, infiltrated asphalt saturation test, and aggregate-bitumen interface observation test, respectively.

4.3.1. Asphalt Adsorption Capacity Test

The asphalt adsorption test is based on the Schellenberg binder drainage test to evaluate the asphalt adsorption capacity of OSW, and the test method is as follows.
Step 1: Aggregate with the particle size larger than 4.75 mm were prepared according to the gradation of OGFC; then, the aggregate with grading characteristics were placed in an oven at 185 °C to be dried to constant weight. The weight of the aggregate is m0.
Step 2: The dried aggregate was placed into the mixing pot for the first mixing, and then added 10 wt % asphalt for the second mixing. Then, the mixed asphalt mixture was placed in a sieve and weighed. The total weight of the sieve and asphalt is m1.
Step 3: The asphalt mixture and the sieve were placed into the oven at 170 °C for 60 min; then, the asphalt mixture and the sieve were taken out without ant vibration or impact.
Step 4: The asphalt mixture in the sieve was poured out and the sieve was weighed. The total weight of sieve and the asphalt remaining on the sieve is m2.
As described above, the asphalt adsorption capacity test has been completed. In order to ensure the validity of the test data, four sets of parallel tests of OSW and stone were carried out. The asphalt adsorption capacity of the aggregate was calculated as the following formula:
η = m 1 m 2 m 0 m 0
where η is the asphalt adsorption capacity of aggregate, %; m0 is the weight of aggregate, g; m1 is the total weight of the sieve and asphalt, g; and m2 is the total weight of sieve and the asphalt remaining on the sieve, g.
The larger η is, the stronger the asphalt adsorption capacity of aggregate, and the more asphalt is absorbed by a unit mass of aggregate. The asphalt adsorption capacity test results of OSW and stone are shown in Table 8 and Figure 10.
It can be clearly seen from Table 8 that OSW has a higher η value compared with stone. This indicates that OSW has better asphalt adsorption capacity than stone, which can enhance the interaction between aggregate and asphalt in the asphalt mortar, and improve the aggregate-bitumen interface bond strength.

4.3.2. Infiltrated Asphalt Saturation Test

The above test manifests that OSW is a porous material; due to the large specific surface and dense pore structure of OSW, the flowing asphalt may infiltrate into the OSW or be absorbed on the surface of OSW with occlusal contact in the preparation process of the mixture. However, the occlusal contact is different from the parallel bonding contact of asphalt and the smooth stone. The occlusal contact and parallel bonding contact are shown in Figure 11.
It can be seen from Figure 11 that when the shear force and tensile force occurs between the aggregate and the asphalt, there is a parallel bonding interaction between the OSW and the asphalt film. Additionally, there is an interaction between the aggregate and the part of asphalt that infiltrates into the interior of OSW; the part of the asphalt that infiltrates into the interior of OSW is the key to improve the mechanical properties of the asphalt mixture. In this paper, the asphalt infiltrated into the aggregate is defined as the infiltrated asphalt, and the ratio of the maximum mass of infiltrated asphalt and the mass of aggregate is defined as the infiltrated asphalt saturation (IAS). The IAS index reflects the capacity of aggregate to absorb infiltrated asphalt. The larger the IAS value, the more infiltrated asphalt can be adsorbed by the aggregate, and the better the adhesion between the aggregate and the asphalt. In order to quantitatively evaluate the infiltrated asphalt saturation of OSW and stone, the infiltrated asphalt saturation test was designed for the OSW and stone with a particle size of 2.36 mm. The procedure of infiltrated asphalt saturation test is as follows.
Step 1: OSW and stone with the same particle size and the same quality were immersed in the molten asphalt for 10 min. After the adsorption quality of the two materials is completely stable, the OSW and stone were taken out for cooling and consolidation.
Step 2: A soft rag with small amount of kerosene was employed to wipe the surface of OSW and stone gently, ensuring only asphalt attached to the OSW and stone surface was removed.
Step 3: The treated and untreated OSW and stone were prepared for the TGA test, and the IAS of OSW and stone were evaluated through the TG curves of the treated and untreated OSW and stone.
The TGA curves of treated and untreated OSW and stone are shown in Figure 12.
It can be seen from Figure 12 that the quality of stone changes with temperature is relatively flat. The mass loss rate of stone is only 3.66% at 1200 °C. The quality of stone has been significantly reduced during the temperature range of 750–900 °C, a total loss of 1.61%, which accounted for 44% of the total loss. This is due to the decomposition of calcium carbonate in the stone. Moreover, the TGA curve of treated stone is almost the same as that of stone. The mass percentage of stone is slightly higher than treated stone during the temperature range of 400–800 °C, indicating that the treated stone has a relatively large mass loss rate in the temperature. In the previous study, it was shown that the main pyrolysis temperature range of asphalt is 400–800 °C, which means that the mass loss of treated stone during the temperature range of 400–800 °C is mainly due to the pyrolysis of asphalt.
It can be seen from Figure 12b that the TGA curve of OSW is relatively steep compared with stone. The mass loss rate of OSW is 7.4% at 1200 °C, much higher than stone. The mass loss of OSW is mainly concentrated in the temperature range of 600–800 °C, the main reason is that the release of methane caused by the cleavage of aryl methyl and aromatic heterocyclic structures during the temperature range. The pyrolysis process of oil shale is mainly divided into four stages. The first stage: the heating temperature range is 300–450 °C, the methane production during the temperature range accounts for 2.90% of the total methane production; the second stage: the heating temperature range is 450–660 °C, the methane production during the temperature range accounts for 74.19% of the total methane production; the third stage: the heating temperature is between 580 °C and 770 °C, the contribution rate of this stage to the total amount of methane production is 13.72%; the fourth stage: the heating temperature range is 450–660 °C, the contribution rate of this stage to the total amount of methane production is 7.52%. At present, most of the utilization of oil shale is mainly concentrated on the first 77% of methane production, and the combustion or distillation temperature is about 600 °C, which causes insufficient combustion or pyrolysis of oil shale, resulting in some organic matter remaining in the oil shale waste. Thus, the mass loss of OSW is mainly concentrated in the temperature range of 600–800 °C can be explained by the cleavage of residual organic matter. Moreover, there is a big difference between the TGA curve of treated OSW and untreated OSW. The mass loss of treated OSW is mainly occurring during the temperature range of 300–870 °C, which is mainly caused by the pyrolysis and volatilization of residual organic matter and residual asphalt in the OSW. The mass loss of treated OSW is 16.42% at 1200 °C, while the mass loss rate of untreated OSW is 3.42% at the corresponding temperature, and the mass loss rate with a difference of 13% is mostly caused by the pyrolysis of infiltrated asphalt and residual organic matter. In order to quantitatively evaluate the IAS of OSW and stone, the mass loss difference of treated and untreated OSW and stone at different temperature was calculated through ORIGIN software v10.4, and exhibited in Figure 13.
As can be seen from Figure 13, the mass loss difference curve of OSW and stone has a different growth trend with temperature. The mass loss difference of stone slowly increases during the temperature range of 0–420 °C, and then enters a rapid growth phase, and the growth ends at 580 °C. The growth of mass loss difference is mainly due to the pyrolysis of infiltrated asphalt. The mass loss difference of stone enters a stationary stage after 600 °C, which indicates that treated stone shows the same pyrolysis property as the untreated stone after 600 °C. The TGA curve of treated stone is approximately the same as that of the untreated stone after 600 °C, which reveals that the mass loss difference between treated and untreated stone is mainly due to the pyrolysis of infiltrated asphalt. The mass loss difference of OSW increases steadily during the temperature range of 0–580 °C, and then enters the stationary phase, which is mainly due to the pyrolysis of infiltrated asphalt. The mass loss difference of OSW increases rapidly during the temperature range of 700–820 °C, which is due to the difference in the proportion of organic matter remaining in the OSW. For the test piece selected in this test, the proportion of residual organic matter in treated OSW is 5.96% higher than that of untreated OSW.
The terminating pyrolysis temperature of asphalt is about 580 °C, which can also explain that the mass loss difference of stone and OSW before 580 °C is mostly the pyrolysis of infiltrated asphalt. In this study, the mass loss difference of stone and OSW at 580 °C is defined as the IAS. The IAS value of stone and OSW is 1.17% and 3.5%, respectively. The higher the IAS value, the more asphalt is infiltrated into the aggregate, the better the adhesion between the asphalt and the aggregate, and the stronger the shear property of asphalt mixture. The IAS value of OSW is much higher than that of stone, which indicates that OSW can absorb more surplus asphalt after replacing fine aggregate, enhance the shear property of asphalt mixture and improve the overall properties of OGFC. The increase of IAS value is due to the large specific surface area and dense pore structure of OSW, which has been confirmed in the Section 4.2.

4.3.3. Aggregate-Bitumen Interface Observation Test

The above studies showed that the asphalt mortar containing OSW filler has excellent shear and tensile properties, which may be due to the special contact between asphalt and OSW. The existing research suggests that the adhesion behavior of asphalt and aggregate is mostly in parallel bonding contact, that is, the asphalt film adheres to the surface of the aggregate. In the preparation of SM-OGFC, the OSW is introduced and replaced the fine aggregate. Considering the large specific surface area and dense pore structure of OSW, there may be other special contact in addition to the parallel bonding contact between asphalt and OSW. Thus, an aggregate-bitumen interface observation test was designed for the search of special contact between asphalt and OSW. Since the asphalt is black, the aggregate-bitumen interface morphology is difficult to observe. Moreover, the cured asphalt has poor ductility and cannot be completely peeled off form the aggregate. Therefore, it is necessary to find a material that can replace asphalt and characterize the aggregate-bitumen interface. The material should have high viscosity and good fluidity at high temperature and good ductility after curing, etc. In a previous study, we have attempted to replace asphalt with materials such as OEPEI and hot-melt acrylic sheets. Due to the insufficient tear strength and high solid-liquid conversion temperature of these materials, all the attempts ended in failure. Finally, the liquid silica gel was found as an alternative to asphalt. The liquid silica gel is nontoxic, has good fluidity, and can enter pores of less than 0.1 mm. The viscosity of liquid silica gel is 58 pa∙s, which can adhere to the surface of the aggregate. The liquid silica gel can be turned into an opaque solid with a tear strength of up 6.1 MPa. All indicators of liquid silica gel meet the requirements of the expected materials. In order to facilitate the operation and observation, it is proposed to wrap OSW and stone with a particle size of 2.36 mm with liquid silica gel, and separate the aggregate-liquid silica gel interface after consolidation, then perform microscopic observation of the aggregate-liquid silica gel interface. The test process is as follows.
Step 1: Relatively clean OSW and stone with a particle size of 2.36 mm were selected for pretreatment. The pretreatment procedure includes cleaning and drying the surface of OSW and stone.
Step 2: Enough liquid silica gel was poured into the beaker, then the OSW and stone were placed in the beak, which ensured that the OSW and stone were immersed in liquid silica gel for a while.
Step 3: The curing agent with 2 wt % of liquid silica gel was added into the beaker, and stirred sufficiently to convert liquid silica gel into solid state.
Step 4: Separated the aggregate-liquid silica gel interface after consolidation, then performed microscopic observation of the aggregate-liquid silica gel interface by employing microscope (XSP-06-1600X, Middle-sky Experimental Instrument Co., Ltd. Zhengzhou, China).
The morphology of aggregate-liquid silica gel interface are shown in Figure 14, Figure 15 and Figure 16.
From Figure 14, there is a small amount of OSW particles on the OSW-liquid silica gel interface, and it cannot be washed away. When the OSW-liquid silica gel interface was touched with a finger, the slight protrusion could be felt. However, the stone-liquid silica gel interface has no synaptic sensation and only a small amount of dust on the interface.
It can be seen from Figure 15 and Figure 16 that the OSW-liquid silica gel interface is a silica gel film with “claws”—pointed synapses. The existence of these synapses indicates that in addition to the parallel bonding contact, there is also occlusion contact in the interaction between asphalt and OSW. From the morphology of stone-liquid silica gel interface, it can be observed that only dust was present on the interface, and no pointed synapse existed on the interface. It can be concluded that the existence of pointed synapses at OSW-bitumen interface is the main reason for the significant improvement of properties of asphalt mortar containing OSW filler.

5. Conclusions

Oil shale waste (OSW), as fine aggregate in the mixture (particle size less than 4.75 mm), can effectively improve the overall properties of open grade friction course (OGFC), but the reinforcement mechanism is not clear. Thus, a comprehensive investigation of the reinforcement mechanism of OSW as fine aggregate is essential to provide better understanding for promoting its engineering application. In this paper, the reinforcement mechanism of OSW was explored through numerical calculations and laboratory tests from three aspects: macroscopic mechanical characteristics of mixture, micromechanics of asphalt mortar containing OSW filler, and adsorption characteristics of OSW. The main conclusions are as follows:
  • A two-dimensional mesoscopic model of OGFC was established by PFC software, and the mechanical characteristics of OGFC were analyzed. It was found that the aggregate with a particle size greater than 4.75 mm in OGFC is the skeleton, which is the main loading bearing aggregate, and the skeleton bears more than 85% of external loads.
  • The beam bending test and indirect tensile test results showed that the introduction of OSW improves the shear resistance and flexure-tension resistance properties of asphalt mortar, which is beneficial the overall properties of OGFC.
  • From the BET and SEM test, it was known that OSW has a large specific surface area, dense pore structure, and various mesoporous shapes. The morphological feature of OSW determines a larger adsorption area, stronger adsorption, and better bonding properties with asphalt binder.
  • Three self-developed tests containing asphalt adsorption capacity test, infiltrated asphalt saturation test, and aggregate-bitumen interface observation test, were carried out to evaluate the adsorption characteristics of OSW and asphalt. It was found that the existence of “claws”—pointed synapses—at OSW-bitumen interface is the main reason for the significant improvement of properties of asphalt mortar containing OSW filler.

Author Contributions

Conceptualization, W.D.; Data curation, W.G., X.C., Y.L., and Z.L.; Formal analysis, Y.L.; Funding acquisition, X.G.; Investigation, Z.L.; Methodology, W.G. and X.C.; Project administration, X.G. and W.D.; Writing—original draft, X.C.; Writing—review and editing, W.G., X.G., and W.D.

Funding

This research was funded by the National Nature Science Foundation of China (NSFC) (Grant No. 51178204) and the Jilin Province Science and Technology Development Plan Project (20190303033SF).

Conflicts of Interest

The authors declare that there is no conflict of interests regarding the publication of this paper.

References and Note

  1. Mansourian, A.; Goahri, A.R.; Khosrowshahi, F.K. Performance evaluation of asphalt binder modified with EVA/HDPE/nanoclay based on linear and non-linear viscoelastic behaviors. Constr. Build. Mater. 2019, 208, 554–563. [Google Scholar] [CrossRef]
  2. Yu, J.; Ren, Z.; Gao, Z.; Wu, Q.; Zhu, Z.; Yu, H. Recycled heavy bio oil as performance enhancer for rubberized bituminous binders. Polymers 2019, 11, 800. [Google Scholar] [CrossRef] [PubMed]
  3. Han, M.; Zeng, X.; Muhammad, Y.; Li, J.; Yang, J.; Yang, S.; Wei, Y.; Meng, F. Preparation of octadecyl amine grafted over waste rubber powder (ODA-WRP) and properties of its incorporation in SBS-modified asphalt. Polymers 2019, 11, 665. [Google Scholar] [CrossRef] [PubMed]
  4. Karnati, S.R.; Oldham, D.; Fini, E.H.; Zhang, L.F. Surface functionalization of silica nanoparticles to enhance aging resistance of asphalt binder. Constr. Build. Mater. 2019, 211, 1065–1072. [Google Scholar] [CrossRef]
  5. Kumbargeri, Y.S.; Biligiri, K.P. Understanding aging behavior of conventional asphalt binders used in India. Transp. Res. Procedia. 2019, 17, 282–290. [Google Scholar] [CrossRef]
  6. Mousavi, M.; Pahlavan, F.; Oldham, D.; Hosseinnezhad, S.; Fini, E.H. Multiscale investigation of oxidative aging in biomodified asphalt binder. J. Phys. Chem. C 2016, 120, 17224–17233. [Google Scholar] [CrossRef]
  7. Wang, P.E.Y.; Zhao, K.C.; Glover, C.; Chen, L.; Wen, Y.; Chong, D.; Hu, C. Effects of aging on the properties of asphalt at the nanoscale. Constr. Build. Mater. 2015, 80, 244–254. [Google Scholar] [CrossRef]
  8. Arafat, S.; Kumar, N.; Wasiuddin, N.M.; Owhe, E.O.; Lynam, J.G. Sustainable lignin to enhance asphalt binder oxidative aging properties and mix properties. J. Cleaner Prod. 2019, 217, 456–468. [Google Scholar] [CrossRef]
  9. Khan, J.; Hussain, A.; Haq, F.; Ahmad, K.; Mushtaq, K. Performance evaluation of modified bitumen with replaced percentage of waste cooking oil & tire rubber with bagasse ash as modifier. Civ. Eng. J. 2019, 5, 587–596. [Google Scholar]
  10. Hopwood, B.; Mellor, M.; O’Brien, G. Sustainable development: Mapping different approaches. Sustain. Dev. 2005, 13, 38–52. [Google Scholar] [CrossRef]
  11. Aziz, M.M.A.; Rahman, M.T.; Hainin, M.R.; Abu Bakar, W.A.W. An overview on alternative binders for flexible pavement. Constr. Build. Mater. 2015, 84, 315–319. [Google Scholar] [CrossRef]
  12. Fernandes, S.R.M.; Silva, H.M.R.D.; Oliveira, J.R.M. Carbon dioxide emissions and heavy metal contamination analysis of stone mastic asphalt mixtures produced with high rates of different waste materials. J. Clean. Prod. 2019, 226, 463–470. [Google Scholar] [CrossRef] [Green Version]
  13. Cai, J.; Song, C.; Zhou, B.C.; Tian, Y.; Li, R.; Zhang, J.; Pei, J. Investigation on high-viscosity asphalt binder for permeable asphalt concrete with waste materials. J. Clean. Prod. 2019, 228, 40–51. [Google Scholar] [CrossRef]
  14. Dong, Z.J.; Zhou, T.; Luan, H.; Williams, R.C.; Wang, P.; Leng, Z. Composite modification mechanism of blended bio-asphalt combining styrene-butadiene-styrene with crumb rubber: A sustainable and environmental-friendly solution for wastes. J. Cleaner Prod. 2019, 214, 593–605. [Google Scholar] [CrossRef]
  15. Casado-Barrasa, R.; Lastra-Gonzalez, P.; Indacoechea-Vega, I.; Castro-Fresno, D. Assessment of carbon black modified binder in a sustainable asphalt concrete mixture. Constr. Build. Mater. 2019, 211, 363–370. [Google Scholar] [CrossRef]
  16. Celauro, C.; Pratico, F.G. Asphalt mixtures modified with basalt fibres for surface courses. Constr. Build. Mater. 2018, 170, 245–253. [Google Scholar] [CrossRef]
  17. Moretti, L.; Mandrone, V.; D’Andrea, A.; Caro, S. Comparative “from cradle to gate” life cycle assessments of Hot Mix Asphalt (HMA) materials. Sustainability 2017, 9, 400. [Google Scholar] [CrossRef]
  18. Modarres, A.; Hamedi, H. Effect of waste plastic bottles on the stiffness and fatigue properties of modified asphalt mixes. Mater. Des. 2014, 61, 8–15. [Google Scholar] [CrossRef]
  19. Azahar, W.N.; Jaya, R.P.; Hainin, M.R.; Bujang, M.; Ngadi, N. Chemical modification of waste cooking oil to improve the physical and rheological properties of asphalt binder. Constr. Build. Mater. 2016, 126, 218–226. [Google Scholar] [CrossRef]
  20. Jamshidi, A.; Kurumisawa, K.; Nawa, T.; Igarashi, T. Performance of pavements incorporating waste glass: The current state of the art. Renew. Sustain. Energy Rev. 2016, 64, 211–236. [Google Scholar] [CrossRef]
  21. Rashad, A.M. A comprehensive overview about recycling rubber as fine aggregate replacement in traditional cementitious materials. Int. J. Sustain. Built Environ. 2016, 5, 46–82. [Google Scholar] [CrossRef] [Green Version]
  22. Khan, T.A.; Sharma, D. Effect of waste polymer modifier on the properties of bituminous concrete mixes. Constr. Build. Mater. 2011, 25, 3841–3848. [Google Scholar]
  23. Lo Presti, D. Recycled tyre rubber modified bitumens for road asphalt mixtures: A literature review. Constr. Build. Mater. 2013, 49, 863–881. [Google Scholar] [CrossRef]
  24. Cao, W. Study on properties of recycled tire rubber modified asphalt mixtures using dry process. Constr. Build. Mater. 2016, 21, 1011–1015. [Google Scholar] [CrossRef]
  25. Abo El-Naga, I.; Ragab, M. Benefits of utilization the recycle polyethylene terephthalate waste plastic materials as a modifier to asphalt mixtures. Constr. Build. Mater. 2019, 219, 81–90. [Google Scholar] [CrossRef]
  26. Ziari, H.; Moniri, A.; Norouzi, N. The effect of nanoclay as bitumen modifier on rutting performance of asphalt mixtures containing high content of rejuvenated reclaimed asphalt pavement. Pet. Sci. Technol. 2019, 37, 1946–1951. [Google Scholar] [CrossRef]
  27. Tarbay, E.W.; Azam, A.M.; El-Badawy, S.M. Waste materials and by-products as mineral fillers in asphalt mixtures. Innov. Infrastruct. Solut. 2019, 4, 5. [Google Scholar] [CrossRef]
  28. Hainin, M.R.; Rusbintardjo, G.; Hameed, M.A.S.; Hassan, N.A.; Yusoff, N.I.M. Utilisation of steel slag as an aggregate replacement in porous asphalt mixtures. J. Teknol. 2014, 69, 67–73. [Google Scholar] [CrossRef]
  29. Guo, W.; Guo, X.D.; Chen, X.; Dai, W. Properties analysis of oil shale waste as partial aggregate replacement in open grade friction course. Appl. Sci. 2018, 8, 1626. [Google Scholar] [CrossRef]
  30. Rondon-Quintana, H.A.; Ruge-Cardenas, J.C.; de Farias, M.M. Behavior of hot-mix asphalt containing blast furnace slag as aggregate: Evaluation by mass and volume substitution. J. Mater. Civ. Eng. 2019, 31, 04018364. [Google Scholar] [CrossRef]
  31. Li, N.N. Study on Crack Propagation of Basalt Fiber Asphalt Mixture. Master’s Thesis, Inner Mongolia University of Technology, Hohhot, China, 2018. [Google Scholar]
  32. Standard Test Methods of Bitumen and Bituminous Mixtures for Highway Engineering. JTGE20-2011, Occupation Standard of the People’s Republic of China.
  33. Wang, Z.J.; Xiao, J.J. Evaluation of air void distributions of cement asphalt emulsion mixes using an X-ray computed tomography scanner. J. Test. Eval. 2012, 40, 273–280. [Google Scholar] [CrossRef]
  34. Li, X.L.; Lv, X.C.; Liu, X.Y.; Ye, J. Discrete element analysis of indirect tensile fatigue test of asphalt mixture. App. Sci. 2019, 9, 327. [Google Scholar] [CrossRef]
  35. Wu, W.L.; Tu, Z.X.; Zhu, Z.H. Effect of gradation segregation on mechanical properties of an asphalt mixture. App. Sci. 2019, 9, 308. [Google Scholar] [CrossRef]
  36. Wu, J.M.; Li, D.W.; Zhu, B.H. Milling process simulation of old asphalt mixture by discrete element. Constr. Build. Mater. 2018, 186, 996–1004. [Google Scholar] [CrossRef]
  37. Gong, F.Y.; Zhou, X.D.; You, Z.P.; Liu, Y.; Chen, S. Using discrete element models to track movement of coarse aggregates during compaction of asphalt mixture. Constr. Build. Mater. 2018, 189, 338–351. [Google Scholar] [CrossRef]
  38. Ma, T.; Zhang, D.Y.; Zhang, Y. Microstructure modeling and virtual test of asphalt mixture based on three-dimensional discrete element method. J. Cent. South. Univ. 2016, 23, 1525–1534. [Google Scholar] [CrossRef]
  39. Wu, J.W.; Collop, A.C.; McDowell, G.R. Discrete element modeling of constant strain Rate compression tests on idealized asphalt mixture. J. Mater. Civ. Eng. 2011, 23, 2–11. [Google Scholar] [CrossRef]
Figure 1. Chemical composition of oil shale waste of Huadian Longteng Power Plant in Jilin Province China. OSW: oil shale waste.
Coatings 09 00637 g001
Figure 2. Main procedure of this research. OGFC: open grade friction course.
Coatings 09 00637 g002
Figure 3. Gradation of asphalt concrete (AC)-16 and OGFC-16 in the study.
Coatings 09 00637 g003
Figure 4. Two-dimensional Particle Flow Code (PFC) model of (a) OGFC and (b) AC.
Coatings 09 00637 g004
Figure 5. Distribution of fine aggregate in the (a) OGFC and (b) AC PFC model.
Coatings 09 00637 g005
Figure 6. Distribution of coarse aggregate in the (a) OGFC and (b) AC PFC model.
Coatings 09 00637 g006
Figure 7. The force chain diagram of OGFC and AC under loading. (a) The force chain diagram of OGFC; (b) the force chain diagram of AC.
Coatings 09 00637 g007
Figure 8. The contribution rate of aggregates with different maximum nominal sizes for Load bearing
Coatings 09 00637 g008
Figure 9. Scanning electron micrographs of stone and OSW with a grain size of 0.6 mm.
Coatings 09 00637 g009
Figure 10. Appearance of OSW and stone after asphalt adsorption capacity test. (a) OSW; (b) stone.
Coatings 09 00637 g010
Figure 11. Schematic diagram of occlusal contact and parallel bonding contact.
Coatings 09 00637 g011
Figure 12. TGA curves of treated and untreated OSW and stone. (a) TGA curves of treated and untreated Stone; (b) TGA curves of treated and untreated OSW.
Coatings 09 00637 g012
Figure 13. Mass loss difference of treated and untreated OSW and stone at different temperature.
Coatings 09 00637 g013
Figure 14. OSW and Stone after separating liquid silica gel. (a) OSW after separating liquid silica gel; (b) stone after separating liquid silica gel.
Coatings 09 00637 g014
Figure 15. Microscopic morphology of OSW—liquid silica gel interface (a) pointed synapses; (b) Magnified morphology of pointed synapses.
Coatings 09 00637 g015
Figure 16. Microscopic morphology of Stone—liquid silica gel interface (a) Smooth interface; (b) Magnified morphology of smooth interface.
Coatings 09 00637 g016
Table 1. Technical parameters of AH-90# “Panjin” base asphalt.
ItemTest ResultsSpecification RequirementTest Procedure
Density/15 °C, g·cm−31.003N/AJTG E20-2011T 0603-2011
25 °C penetration/100g, 5s, 0.1 mm81.380–100T 0604-2011
Softening point/°C44.2≥42T 0606-2011
Ductility/25°C, cm>130≥100T 0605-2011
Wax content/%≤1.8≤3T 0615-2011
Flash point/°C340N/AT 0611-2011
Solubility/%≥99.9≥99T 0607-2011
Table 2. Technical parameters of coarse aggregate.
Technical ParametersUnitValuesRequirements
Crushing value%21.2≤26
Los Angeles abrasion value%25≤28
Elongated particles content%9.3≤15
Water absorption%0.61≤2.0
Apparent specific gravityNominal maximum size of aggregate16 mmg·cm−32.788≥2.6
13.2 mmg·cm−32.787
9.5 mmg·cm−32.787
4.75 mmg·cm−32.749
Table 3. Technical parameters of fine aggregate.
Technical ParametersUnitValuesRequirements
Apparent specific gravityg·cm−32.71≥2.5
Specific gravity of gross volumeg·cm−32.64N/A
Surface dry specific gravityg·cm−32.60N/A
Mud content%1.02≤3.0
Table 4. Technical parameters of mineral powder.
Technical ParametersUnitValuesRequirements
Apparent specific gravityg·cm−32.83≥2.5
Water absorption%0.2≤1
Appearance characteristicN/ANo agglomerationNo agglomeration
Granular compositionParticle size<0.6 mm%100100
<0.15 mm%9890–100
<0.075 mm%9275–100
Table 5. Mesoscopic parameters of the two-dimensional mesoscopic model.
ComponentMesoscopic ParametersUnitSymbolValue
BallDensityKg/m2 ρ 2600
Friction coefficientn/a μ 0.5
Normal stiffnessN/m k n 5 × 10⁸
Tangential stiffnessN/m k s 5 × 10⁸
Normal parallel bond stiffnessN/m p b _ k n 1 × 10⁵
Tangential parallel bond stiffnessN/m p b _ k s 1 × 10⁵
Normal viscosity of Kelvin modelMPa C k n 519.37
Normal stiffness of Kelvin modelMPa K k n 43.07
Normal viscosity of Maxwell modelMPa C m n 14933
Normal stiffness of Maxwell modelMPa K m n 56.19
Parallel bonding radiusn/a r 0.5
WallFriction coefficientn/a μ w 0
Normal stiffnessN/m k w n 2 × 10⁸
OthersLocal damping coefficientn/a D 0.8
Table 6. Beam bending test results of two asphalt mortar.
TypesBending-Tensile Strength (MPa)Maximum Bending Strain (με)Bending Stiffness Modulus (MPa)
Asphalt mortar2.865214549
Asphalt mortar containing OSW3.275783565
Table 7. BET test results of stone and OSW.
ItemUnitStoneOSW
Specific surface aream2/g2.00463.1965
Pore volumecm3/g0.0022820.028035
Average aperturenm99.341115.6935
Aperture rangenm68.5–124.71.9–145.7
Table 8. Asphalt adsorption capacity test results of OSW and stone.
Typesm0/gm1/gm2/gη/%
Stone225.4425.2176.18.43
OSW225.4425.2180.810.51

