1. Introduction
Flat plate systems are commonly used in reinforced concrete (RC) structures such as parking garages and bridges. These systems are susceptible to punching shear failure at the slab-column connections where the column along with a surrounding portion of the slab punches through the remainder of the slab. This type of failure is very brittle and sudden in nature and should be avoided. In cold weather regions, these types of structures are usually vulnerable to corrosion of steel reinforcement since they are subjected to harsh conditions such as freeze/thaw cycles, wet/dry cycles, and diffusion of de-icing salts. Using the non-corrodible fiber-reinforced polymer (FRP) bars instead of steel in such structures has proven to be a viable solution to overcome the corrosion problems associated with steel reinforcement. However, FRP bars have linear-elastic behavior up to failure and relatively low modulus of elasticity, especially for GFRP. These mechanical properties result in more brittle failure and wider crack width compared to steel-RC counterparts with the same amount of reinforcement. Therefore, the punching shear resistance of GFRP-RC slab-column connections needs to be investigated.
Punching shear failure occurs as a result of the high shear stresses caused by the inevitable combination of shear force and unbalanced bending moment transferred between the slab and the column at a slab-column connection. In the case of interior connections, the unbalanced moment occurs due to pattern loading conditions, different lengths of adjacent spans, and/or the presence of lateral loads. The punching shear behavior of FRP-RC interior slab-column connections under concentric load (shear force) has been investigated [
1,
2,
3,
4]. Reinforcement ratio and concrete compressive strength were the main studied parameters. It was concluded that increasing the reinforcement ratio had a pronounced effect on the punching capacity of the slab-column connection rather than the concrete compressive strength. Meanwhile, there is only one published study for FRP-RC interior slab-column connections tested under eccentric load [
5], where six half-scale prototypes reinforced with carbon fiber-reinforced polymer (CFRP) grid were tested up to failure with different moment-to-shear ratios.
Furthermore, the Canadian standard for FRP materials [
6] provides the following three equations to predict the punching shear stresses at 0.5
d from the column face. The least value obtained from the equations should be used in the design.
where
νc is the factored shear stress resistance of concrete, λ is the concrete density factor, ϕ
c is the concrete resistance factor, β
c is the ratio of longer to shorter sides of the column,
Ef is the elastic modulus for the FRP flexural reinforcement, ρ
f is the FRP flexural reinforcement ratio,
is the concrete compressive strength (up to 60 MPa), α
s = 4.0 for interior connections,
d is the slab average depth, and
b0.5d is the critical section perimeter.
Also, the American guideline [
7] introduces the following equation to predict the punching capacity of FRP-RC slab-column connections.
where
Vc is the nominal shear strength provided by concrete,
is the concrete compressive strength,
c is the depth of the neutral axis of the cracked transformed section,
k is ratio of depth of neutral axis to reinforcement depth, ρ
f is the FRP flexural reinforcement ratio, and
nf is the modular ratio.
Generally, finite element modeling (FEM) was used to investigate the punching shear behavior of the FRP-RC bridge deck slab tested under concentric vertical shear force [
8,
9,
10]. It was concluded that the FEM method can be used successfully to predict the behavior of FRP-RC slabs.
To date, there is no published research evaluating the behavior of full-scale FRP-RC interior slab-column connections tested to failure under shear force in addition to unbalanced moment, either experimentally or analytically. Therefore, an extensive study was carried out at the University of Manitoba to investigate the punching shear behavior of interior slab-column connections. The study included experimental testing and finite element modeling of such connections. In this paper, the experimental results of five full-scale FRP-RC interior slab-column specimens were used for verification purposes. The experimentally investigated parameters were concrete compressive strength, reinforcing bar material and type, and flexure reinforcement ratio. Afterwards, parametric analysis using FEM was conducted to investigate more parameters. The FE model was constructed using a three-dimensional (3D) non-linear finite element analysis program [
11] to predict the performance of the connections reinforced with GFRP bars. The efficiency and accuracy of the constructed model were verified against the experimental results. This parametric study aimed at studying the effects of a wide range of key parameters such as (1) a wide range of flexural reinforcement ratios; (2) shear perimeter-to-depth ratio; and (3) column aspect ratios.
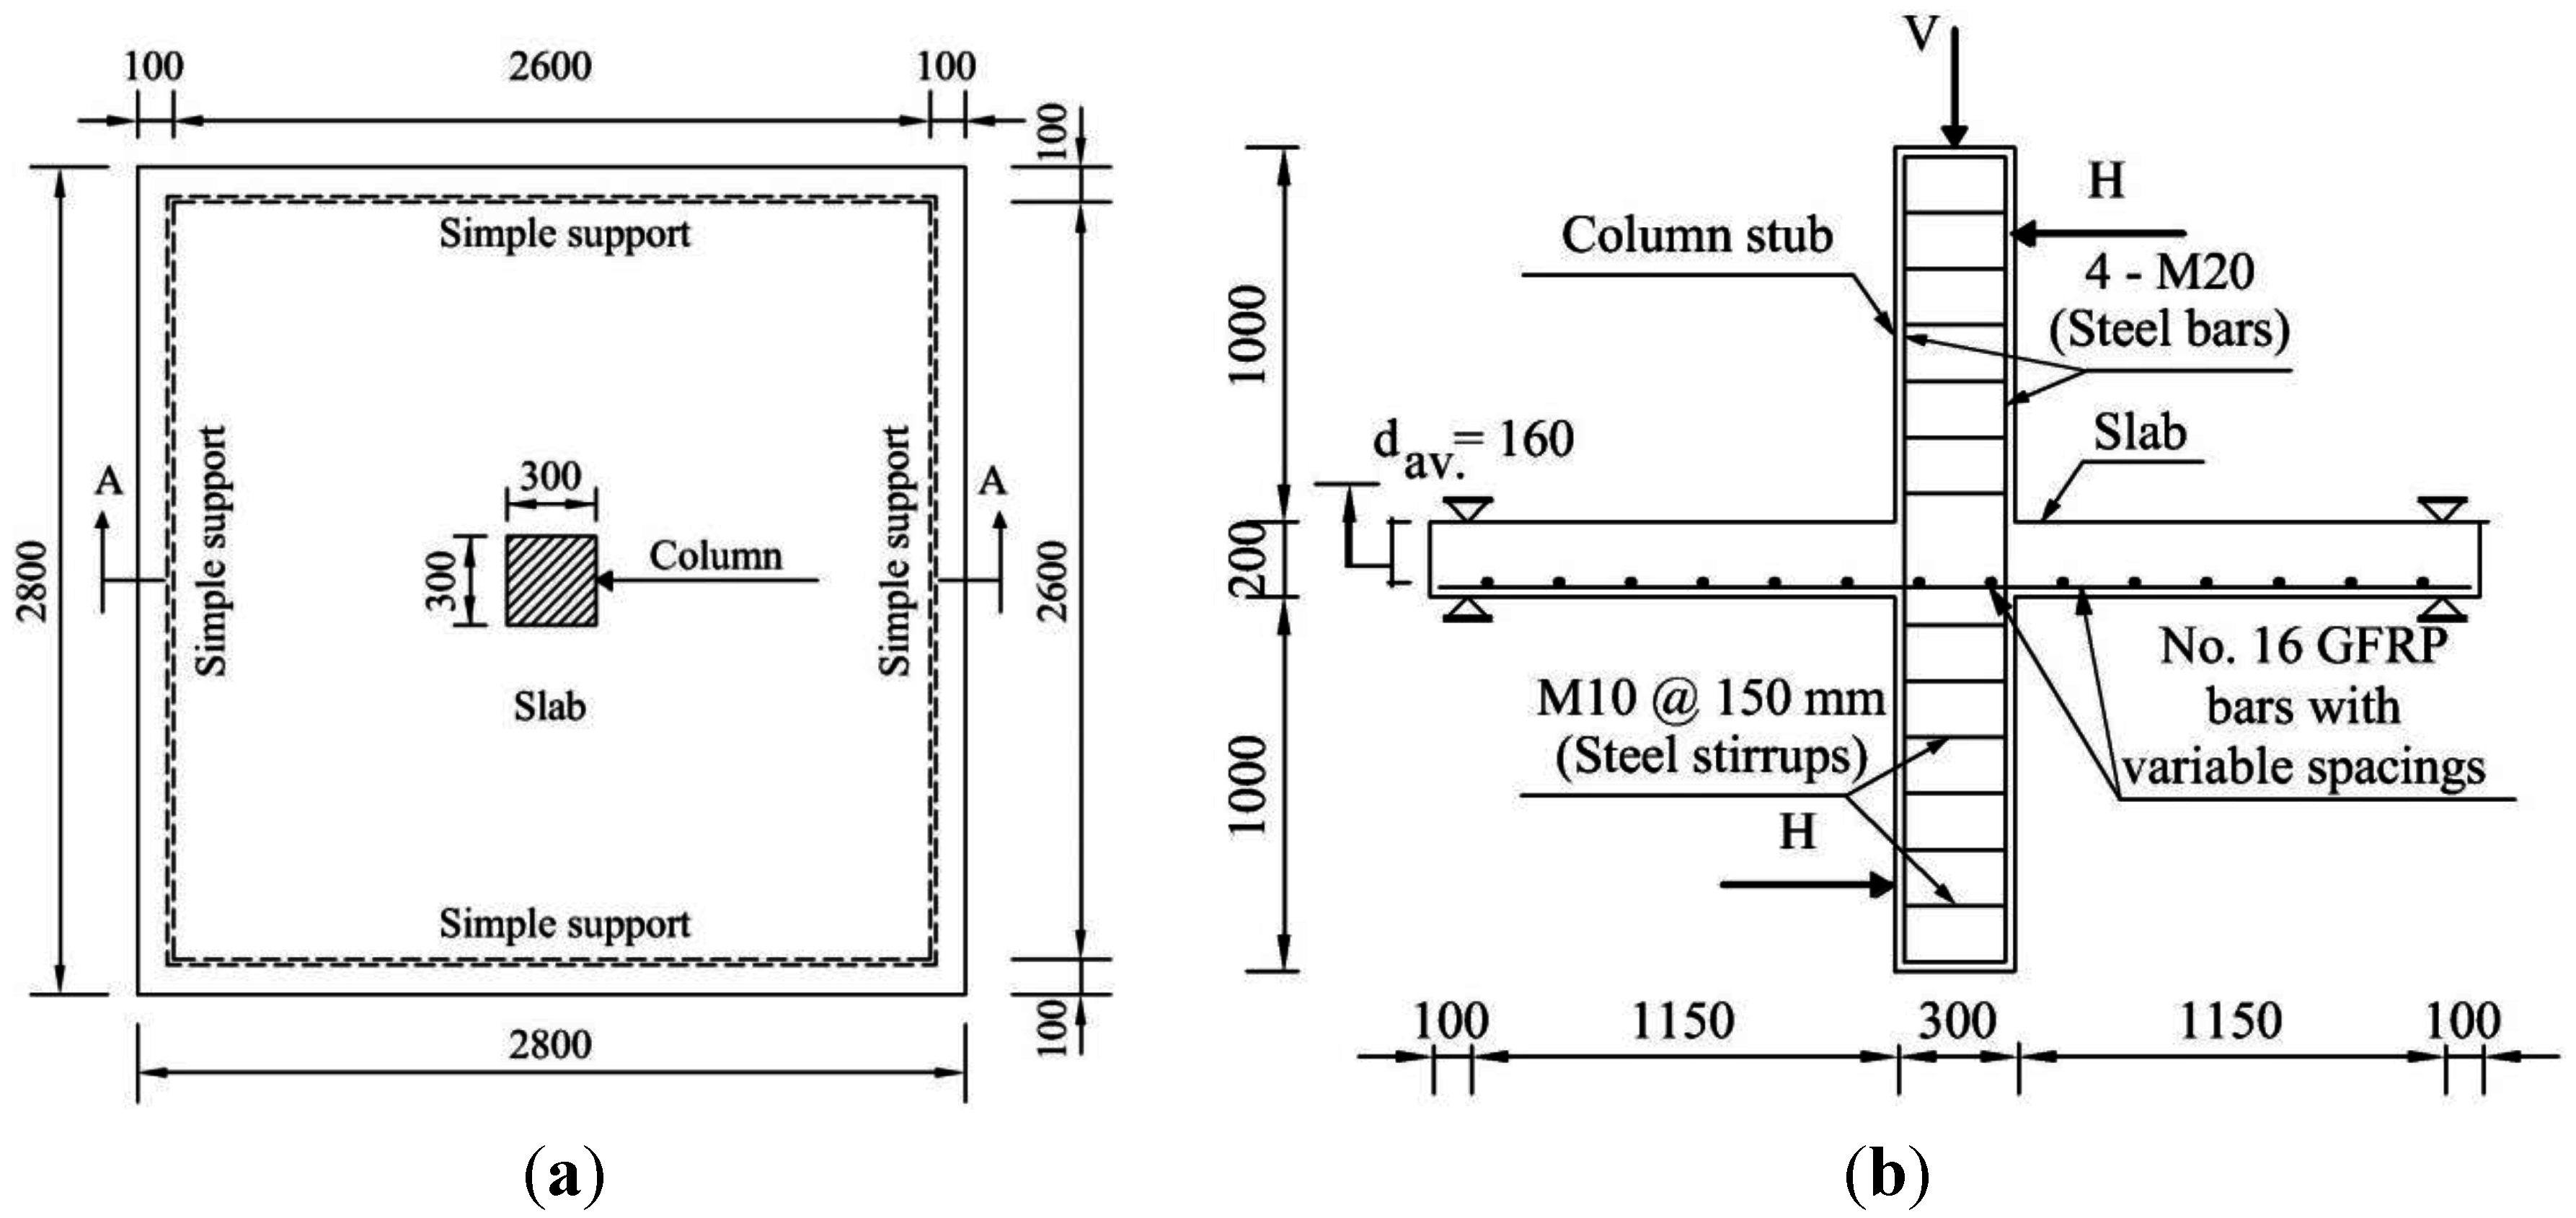
A summary of the experimental program is presented below to provide the essential information before discussing the FEM part. More details about the experimental phase and a complete discussion of the test results can be found elsewhere [
12].
3. Finite Element Modeling
A 3D finite element model was constructed using a specialized finite element software package, ATENA [
11]. The elements used to model concrete, FRP, and steel bars in addition to the boundary conditions are briefly discussed in the following sections.
3.1. Reinforcing Bars
A truss element (CCIsoTruss) was used to model the reinforcing bars with transition degrees of freedom in
x,
y,
z directions at the element nodes. The reinforcement was modeled as individual sub-elements within the concrete elements. Rebar sub-element stiffness is superimposed on the concrete element stiffness in which the rebar resides. Two material types were used for the reinforcing bars, one for the GFRP bars to simulate the slab reinforcement, and the other one for the steel reinforcement to simulate the longitudinal bars and stirrups of the column. A perfectly linear elastic stress-strain curve was defined for the GFRP reinforcement using the mechanical properties documented in
Table 2. Also, bi-linear isotropic material was used for the steel reinforcement with a 200 GPa modulus of elasticity and a 480 MPa yield strength.
3.2. Concrete Material
In this study, a built-in fracture-plastic constitutive model called CC3DNonLinCementitious2 was used to define the concrete. The fracture model employs the Rankine failure criterion, while the plastic model is based on the Menétrey-Willam failure surface [
11]. This fracture-plastic model was developed to combine both fracture and plastic models into a single model that can use plasticity to simulate concrete crushing and fracture mechanics to simulate cracking. This model accounts for material nonlinearity, crushing, plastic deformation, and cracking in
x,
y,
z directions. The main features of that model are as follows:
- (1)
Non-linearity in compression including softening and hardening;
- (2)
Cracking of concrete in tension based on the non-linearity fracture mechanics;
- (3)
Biaxial strength failure criterion;
- (4)
Reducing the compressive strength after cracking;
- (5)
Tension stiffening effect;
- (6)
Reduction of the stiffness in shear after cracking.
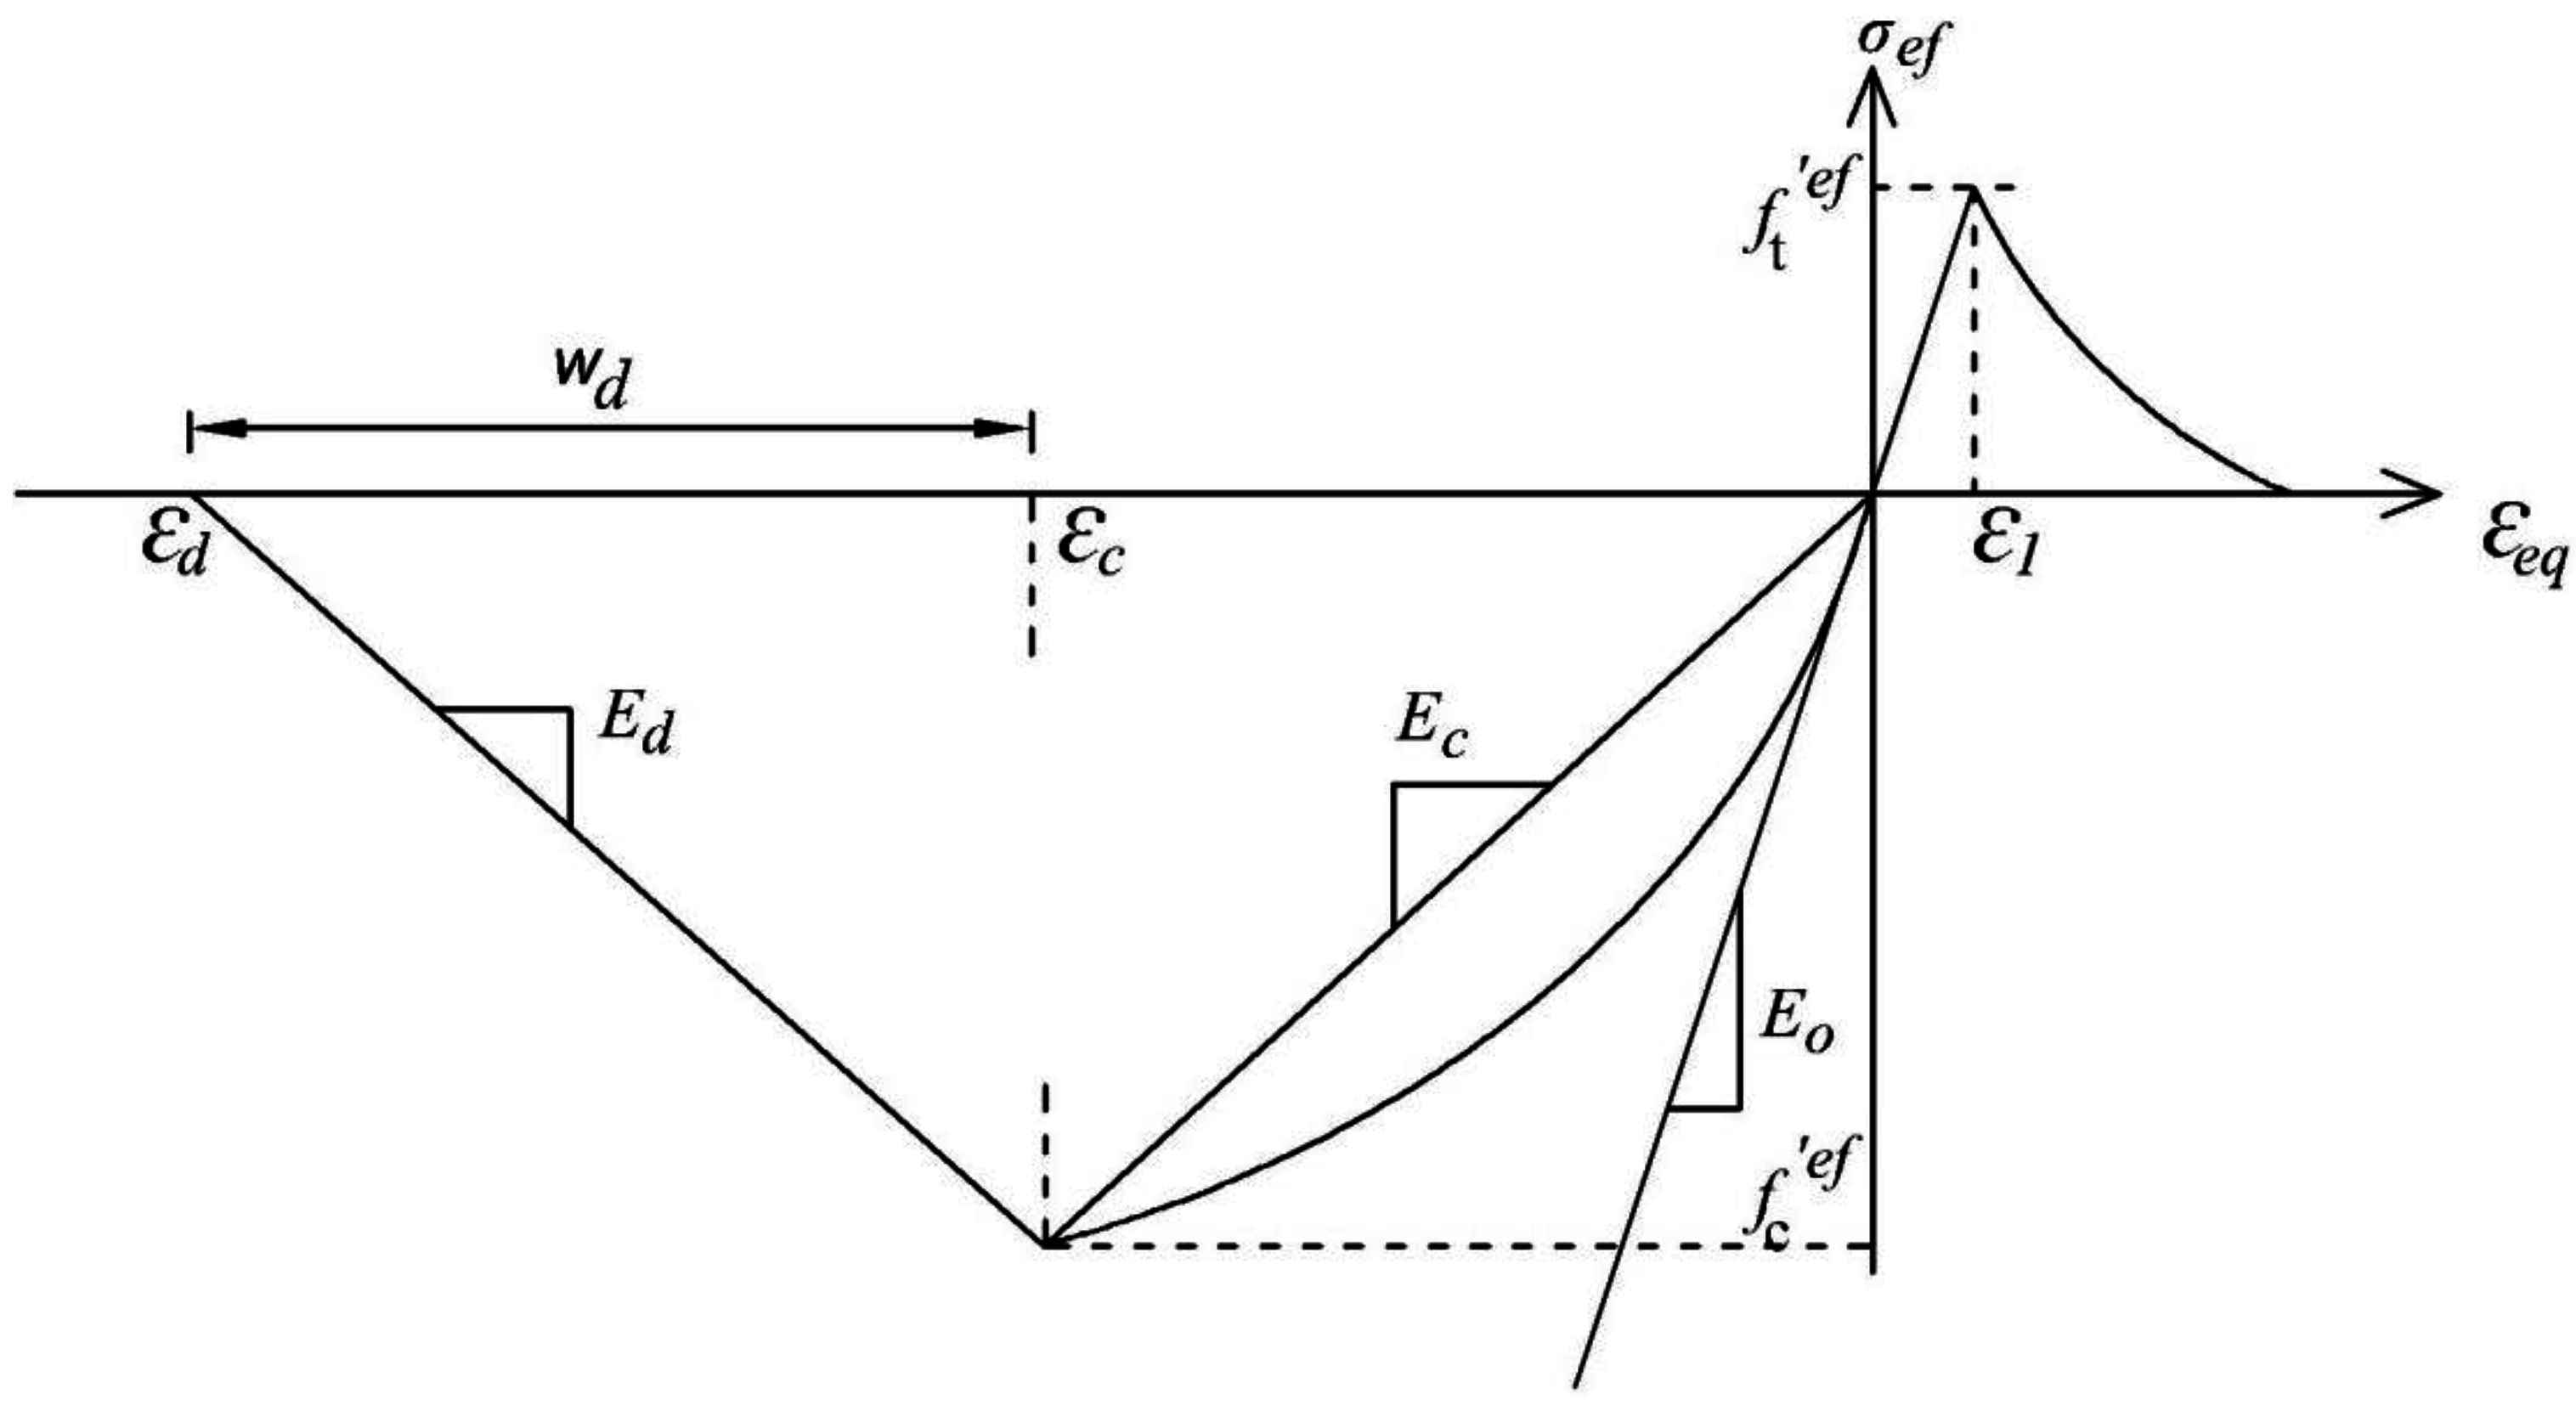
According to the model, a nonlinear elastic approach is used to derive the material stiffness matrix. This nonlinear elastic approach is based on the equivalent uniaxial law (
Figure 3). In this figure, the stress-strain relationship of the concrete before the peak stress is based on the recommended formula by the European Committee for Concrete and the International Federation for Prestressing “Comite Euro-International du Beton—the Fédération internationale de la précontrainte” (CEB-FIP) Model Code [
14] which can be used for all types of concrete from normal to high-strength concrete. After the peak compressive stress is reached, the descending (softening) part of the stress-strain curve is linear. The model assumes that the compression failure takes place in a plane perpendicular to the direction of the maximum compressive stress (principle stress) and the energy dissipation and compressive peak displacement lie in that plane. Also, concrete behavior, in tension, is assumed to be perfectly elastic in the uncracked zone. However, after cracking, the stress-strain relationship in tension follows the exponential crack opening law that was derived experimentally [
15]. In addition, the tangent modulus that was used to build the stiffness matrix for the concrete for the iterative trials is defined as the slope of the stress-strain curve at a given strain and it is always with a positive sign. Furthermore, it is worth mentioning that the mathematical values for the parameters of the constitutive model were calculated based on the concrete compressive strength (
Table 1) through the equations adapted by the FEM program, which can be found elsewhere [
11].
Figure 3.
Uniaxial stress-strain law for concrete, reproduced with permission [
11].
Figure 3.
Uniaxial stress-strain law for concrete, reproduced with permission [
11].
Also, for cracking, the model uses the Rankine failure criterion, which assumes that the stresses and strain directions in the concrete material are corresponding to the principle directions. More information can be found elsewhere [
11].
3.3. Bearing Plates
For supports and loading, steel plates were used. The main purpose for those plates was to distribute and transfer the stresses to the different elements of the slab-column model. A tetra element (CCIsoTetra) with three translations degrees of freedom in x, y, z directions at each node was used to simulate those plates. Also, the material used for the plates was linear-elastic with a 200 GPa modulus of elasticity and a 0.3 Poisson’s ratio.
3.4. Reinforcement-Concrete Interface
In this study, two bond-slip models were used to define the reinforcement-concrete interface: one for the sand-coated GFRP bars and one for the steel bars (
Figure 4). The data used to define the bond-slippage relationship between the GFRP bars and the concrete elements was obtained from an experimental study conducted at the University of Manitoba to obtain the bond strength of the sand-coated GFRP bars [
16].
Figure 4.
Bond-slip relationship.
Figure 4.
Bond-slip relationship.
For the steel reinforcement, the program uses the bond-slip model proposed by the CEB-FIP Model Code [
14]. The used bond-slip relationship is suggested for the unconfined concrete. This relationship consists of an ascending branch in an approximately parabolic shape, a linear descending part in a linear form, and, finally, the horizontal plateau in which the slip continues to increase at a constant bond stress (
Figure 4). Also, the ascending branch of the curve followed the equation given by the CEB-FIP Model Code (Equation (5)).
3.5. Model Geometry and Boundary Conditions
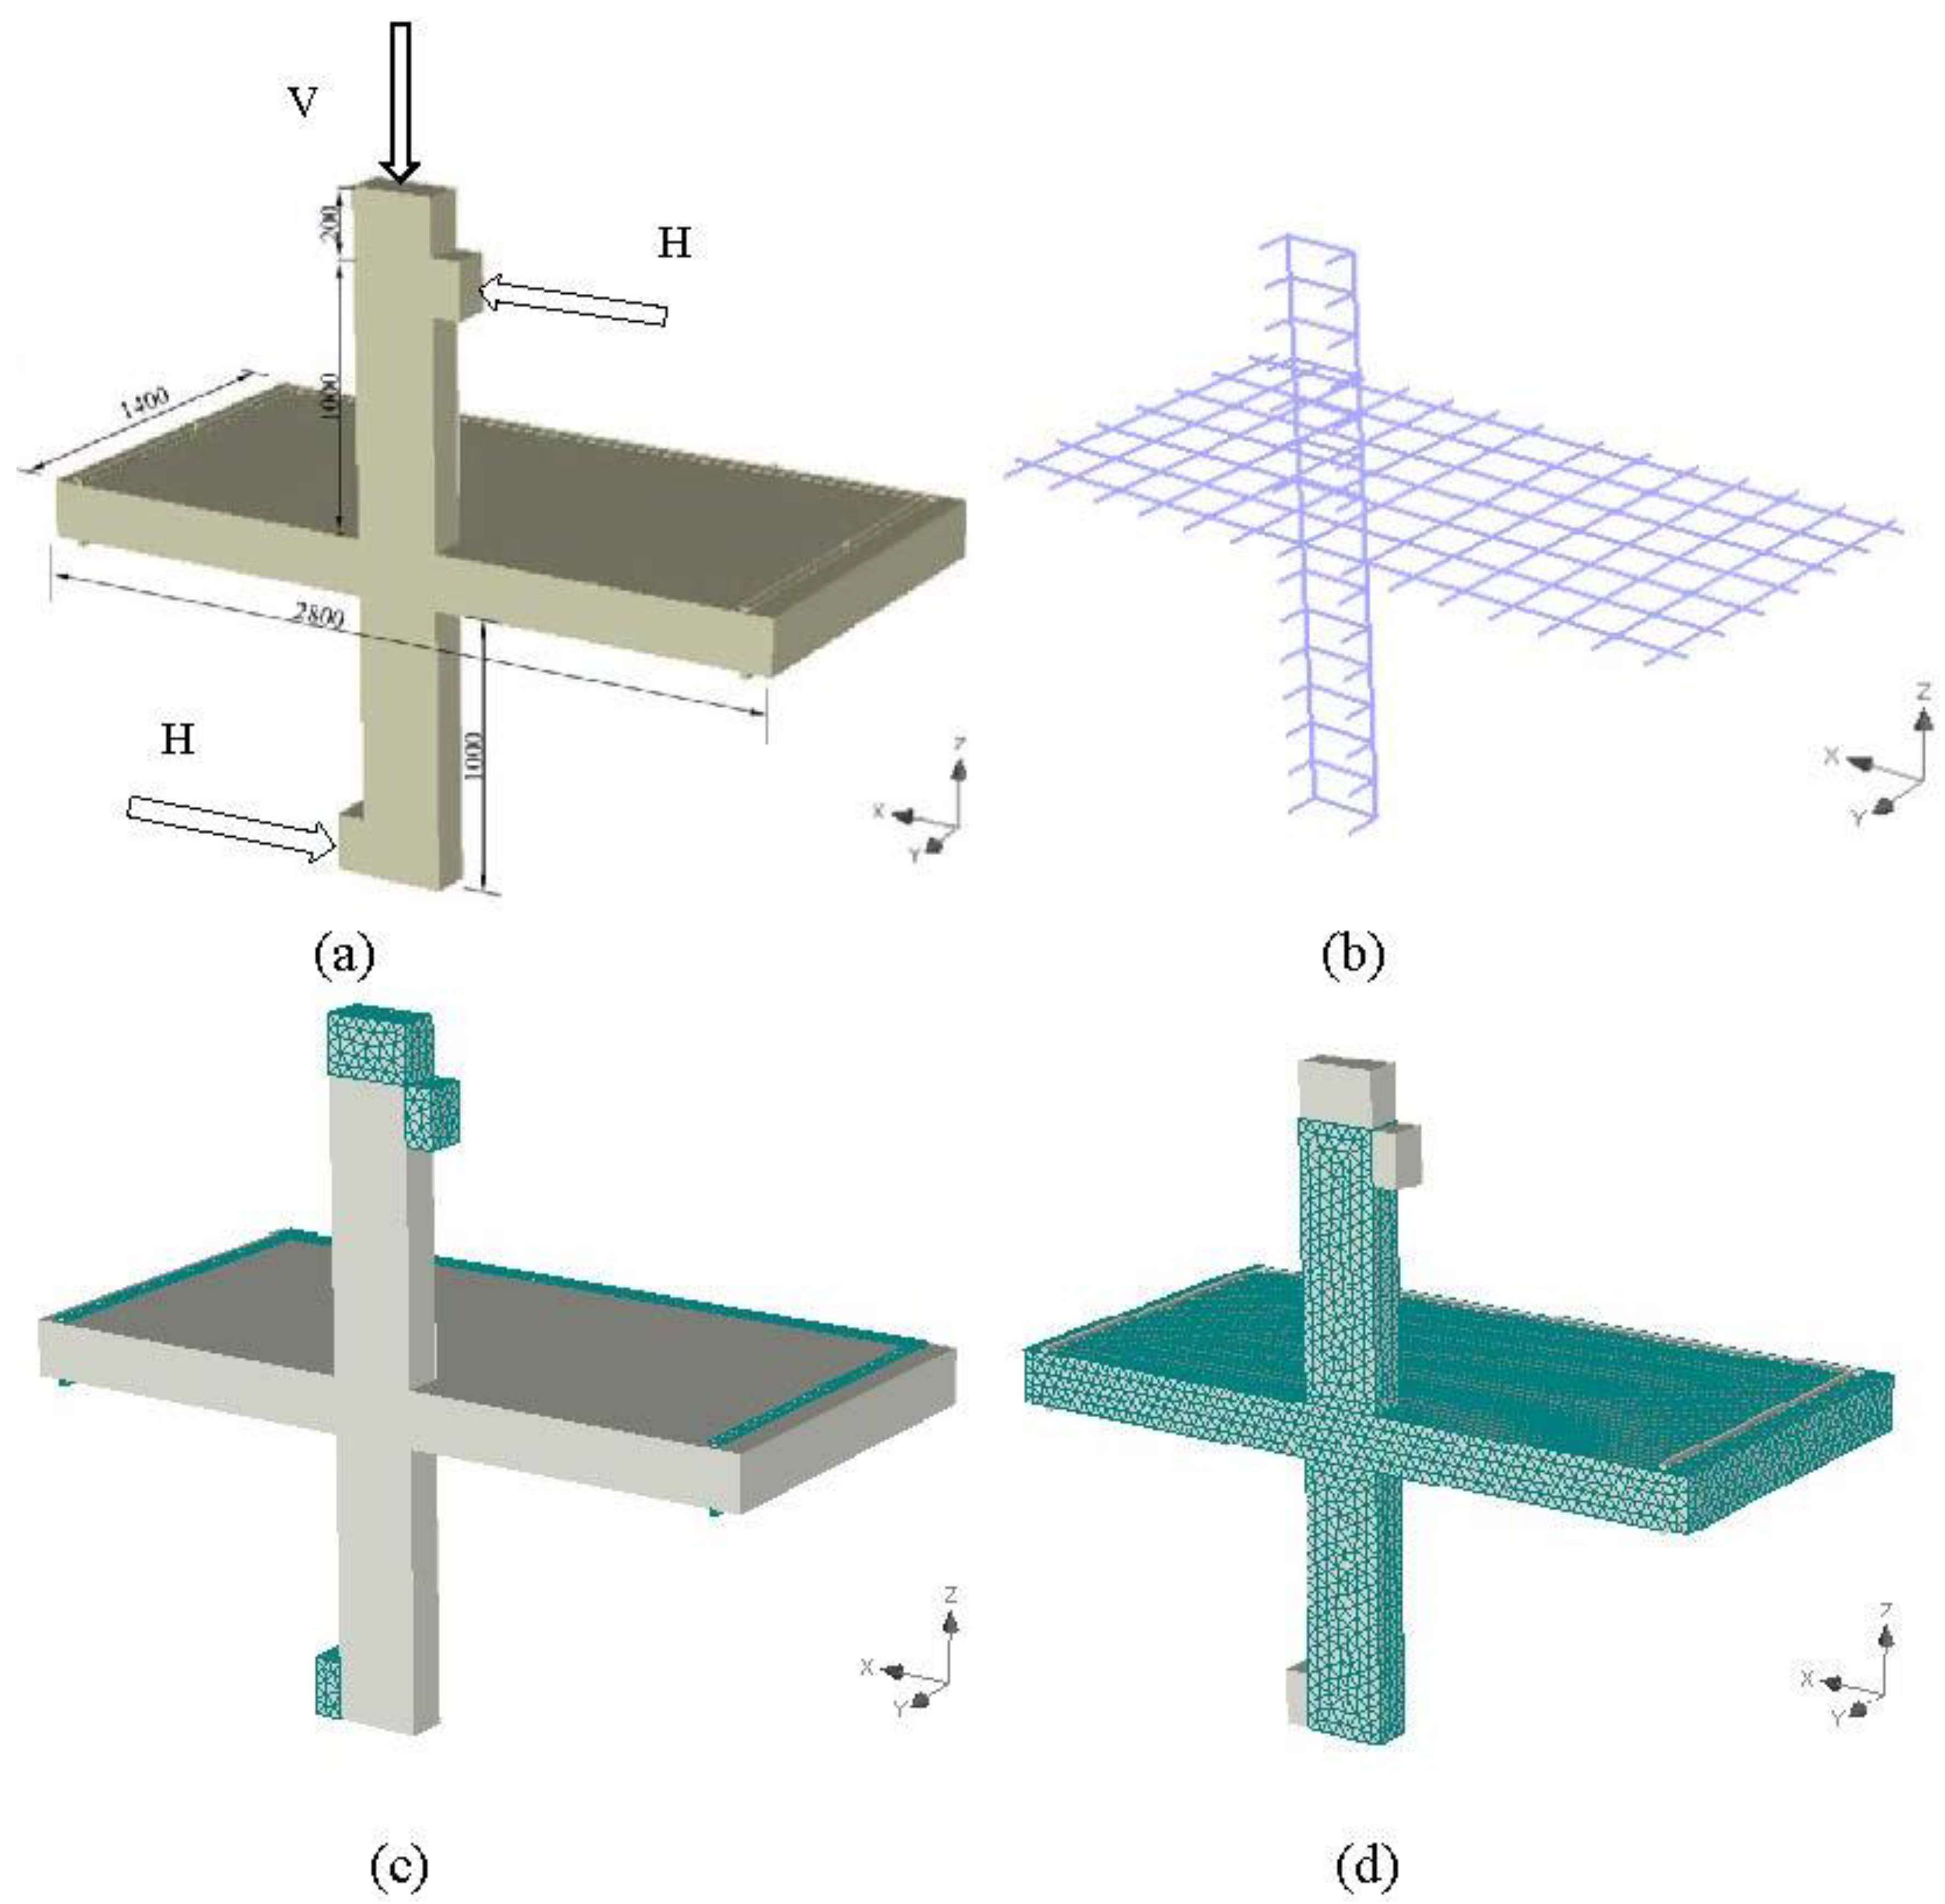
All the slab-column models are symmetrical in the direction of the unbalanced moment in internal reinforcement, loading, and geometry about the axis passing through the center line of the slab and the columns. Therefore, only half of the specimen was modeled to save time and to reduce the required storage disk space to solve the model. Also, the boundary conditions at the axis of symmetry were chosen carefully to simulate the effect of continuity.
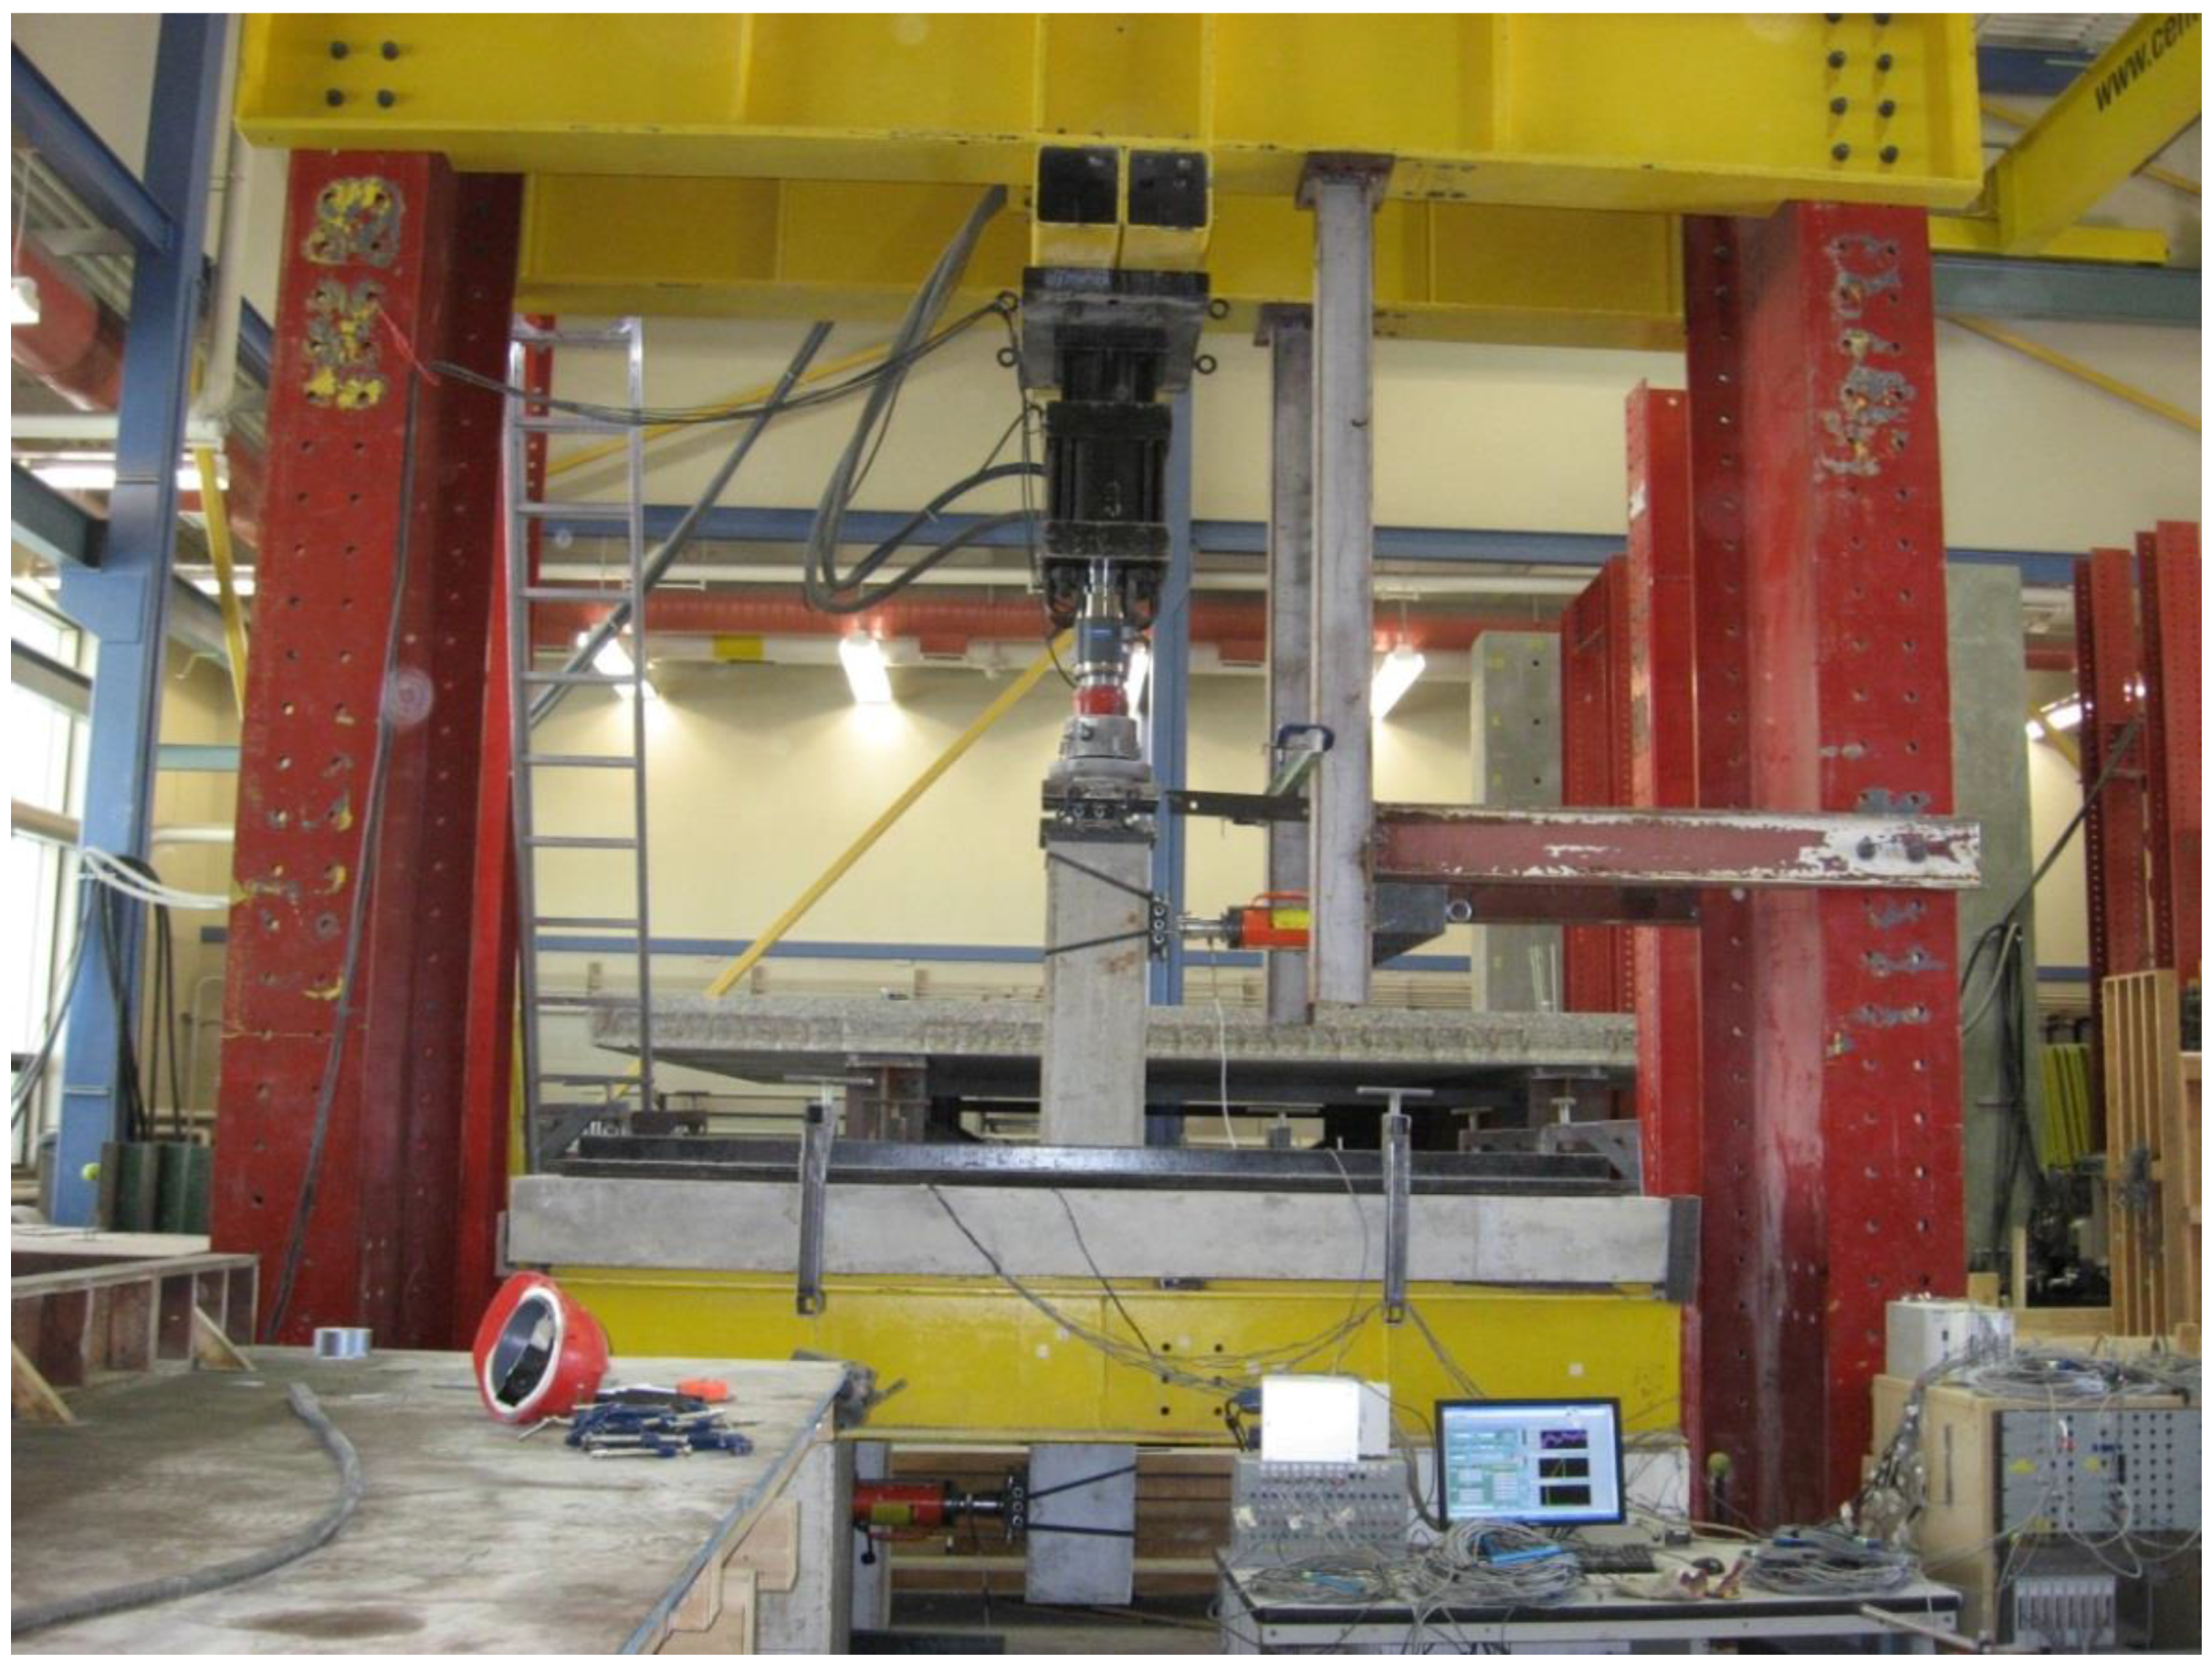
Figure 5 shows a photo of the constructed model and the reinforcement details. Simple supports (hinges) were provided for a bottom steel frame at 0.1 m from the outer perimeter of the slab. In addition, for the continuity effect at the axis of symmetry, all the translations in the
y direction were restricted.
Figure 5.
ATENA-3D model. (a) Model geometry; (b) Reinforcement configuration; (c) Loading and supporting plates (meshed); (d) Slab and column (meshed).
Figure 5.
ATENA-3D model. (a) Model geometry; (b) Reinforcement configuration; (c) Loading and supporting plates (meshed); (d) Slab and column (meshed).
Furthermore, the size of the mesh was chosen to obtain results with the least possible errors. The mesh size used in this study was 0.05 m in all three directions for the full model. Mesh sensitivity analysis was performed by using different mesh sizes including 0.2, 0.15, 0.1, 0.05, and 0.025 m. It was concluded that decreasing the mesh size beyond 0.05 m did not result in any significant change in the results; however, it increased the run time significantly.
In addition, the loads were applied through three steel plates as shown in
Figure 5a. Two plates were used for the horizontal loads to simulate the effect of the unbalanced moment and one plate was used for the vertical load. The moment-to-shear ratio was kept constant at 0.15 m, as this value resulted from the analysis of the parking garage mentioned earlier. Also, monitoring points were used to monitor and record the applied vertical force, the value of the deflection of the slab at 50 mm from the column face, and the strain of the internal reinforcement at the column face.
3.6. Model Verification
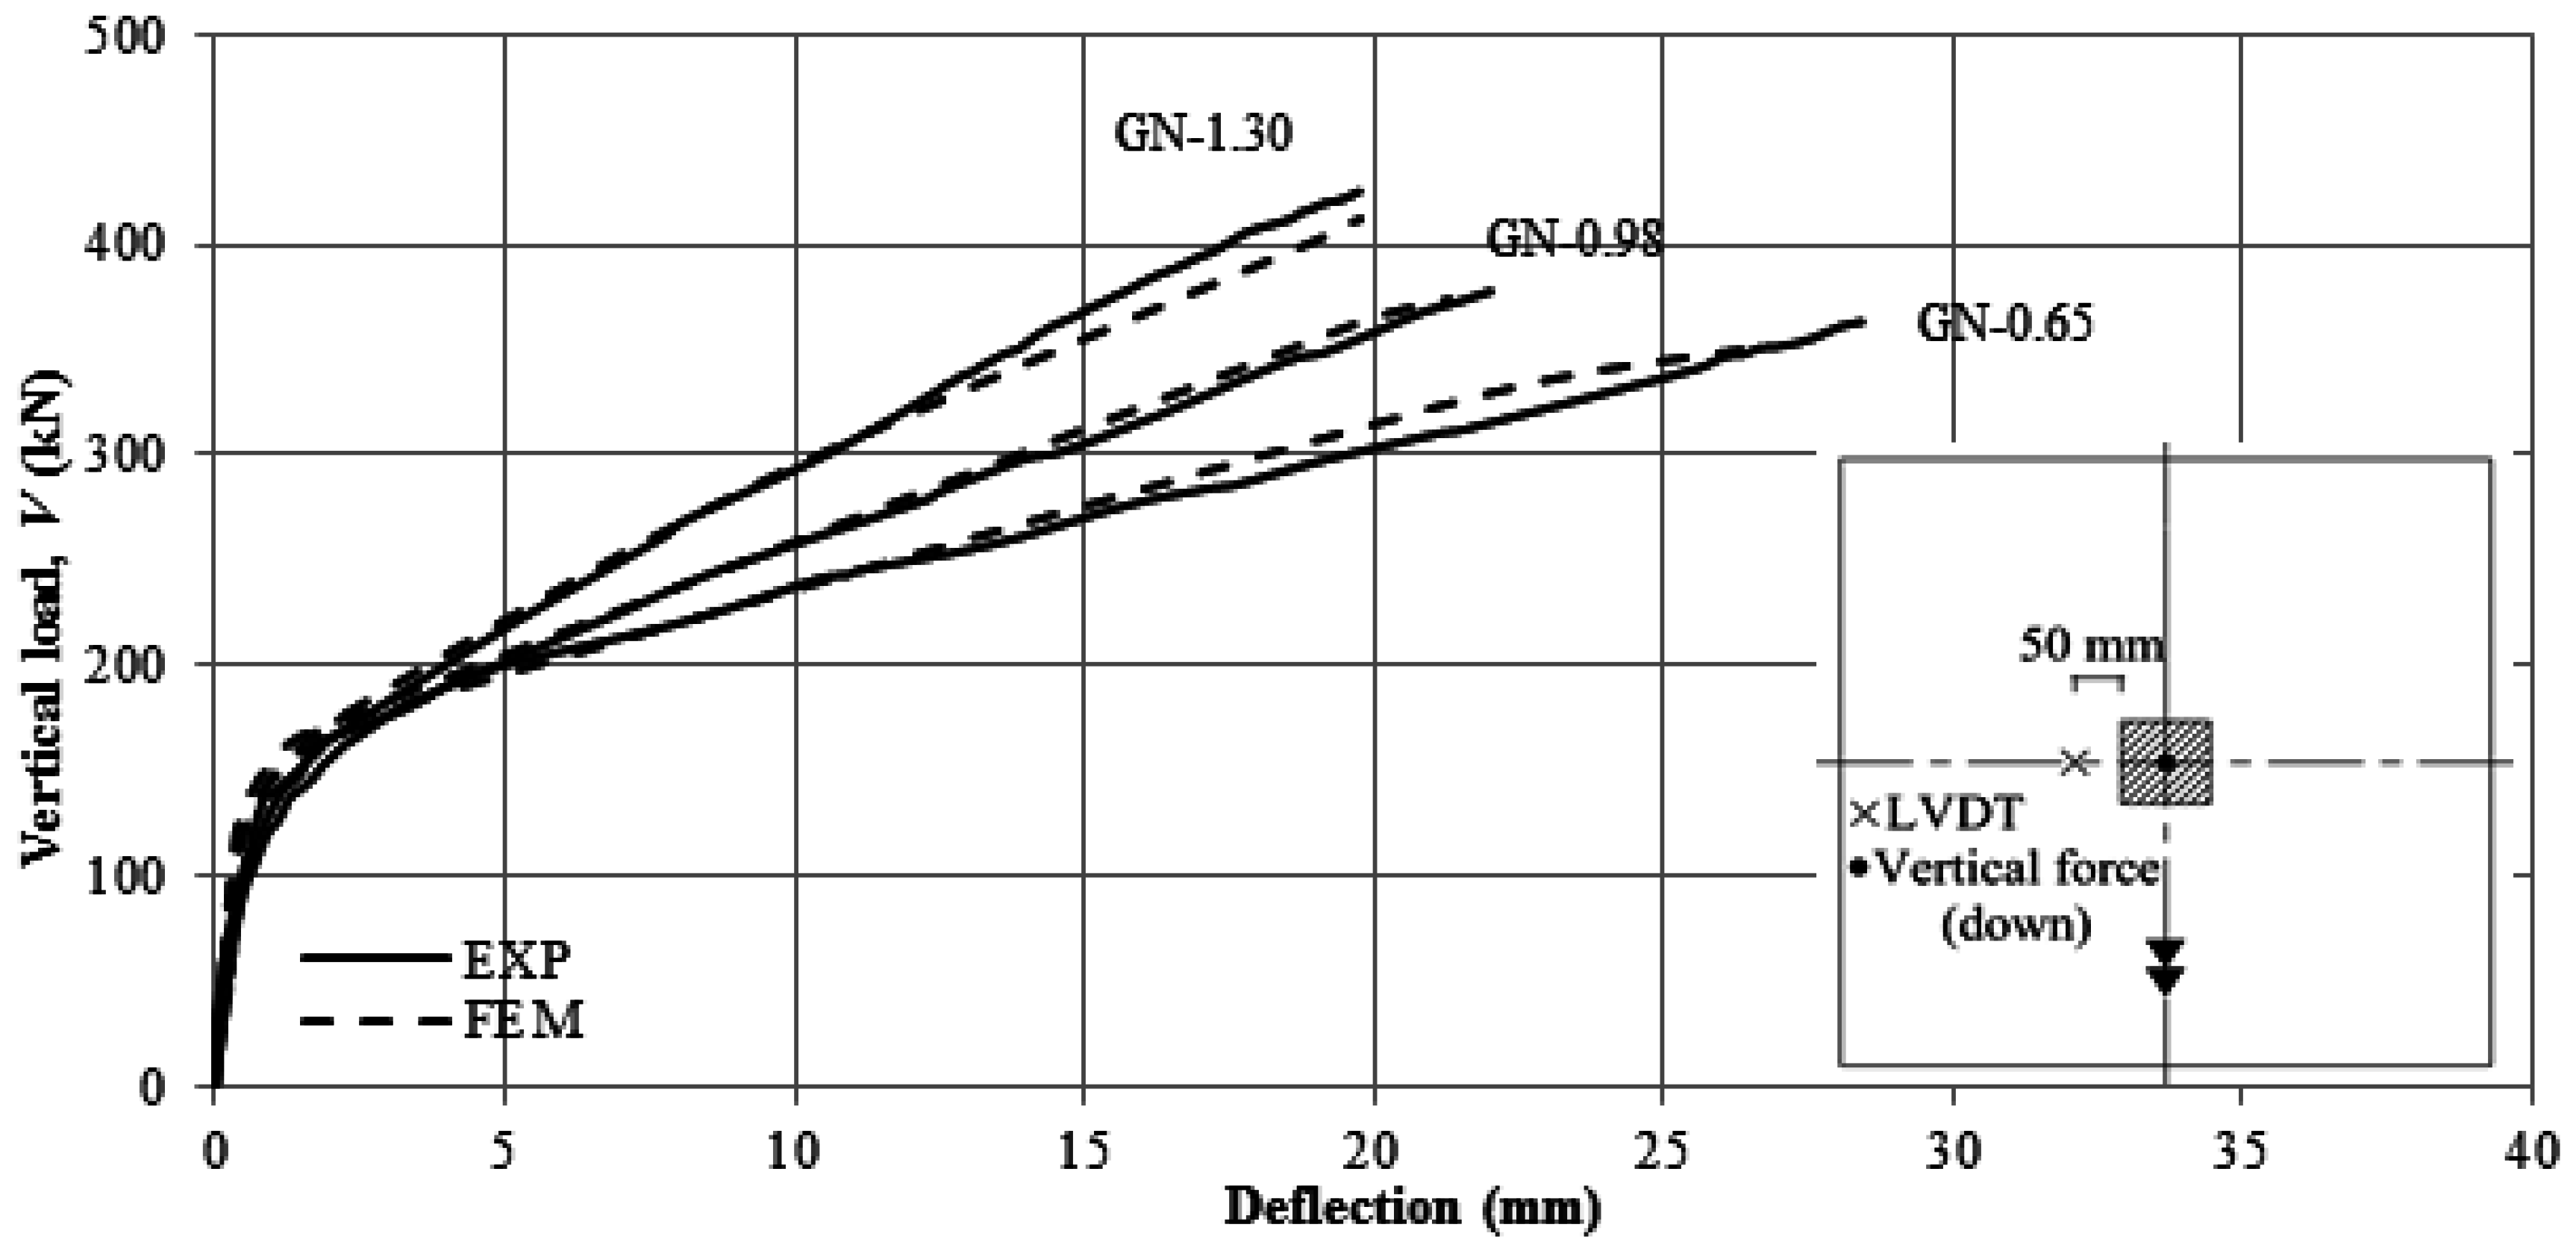
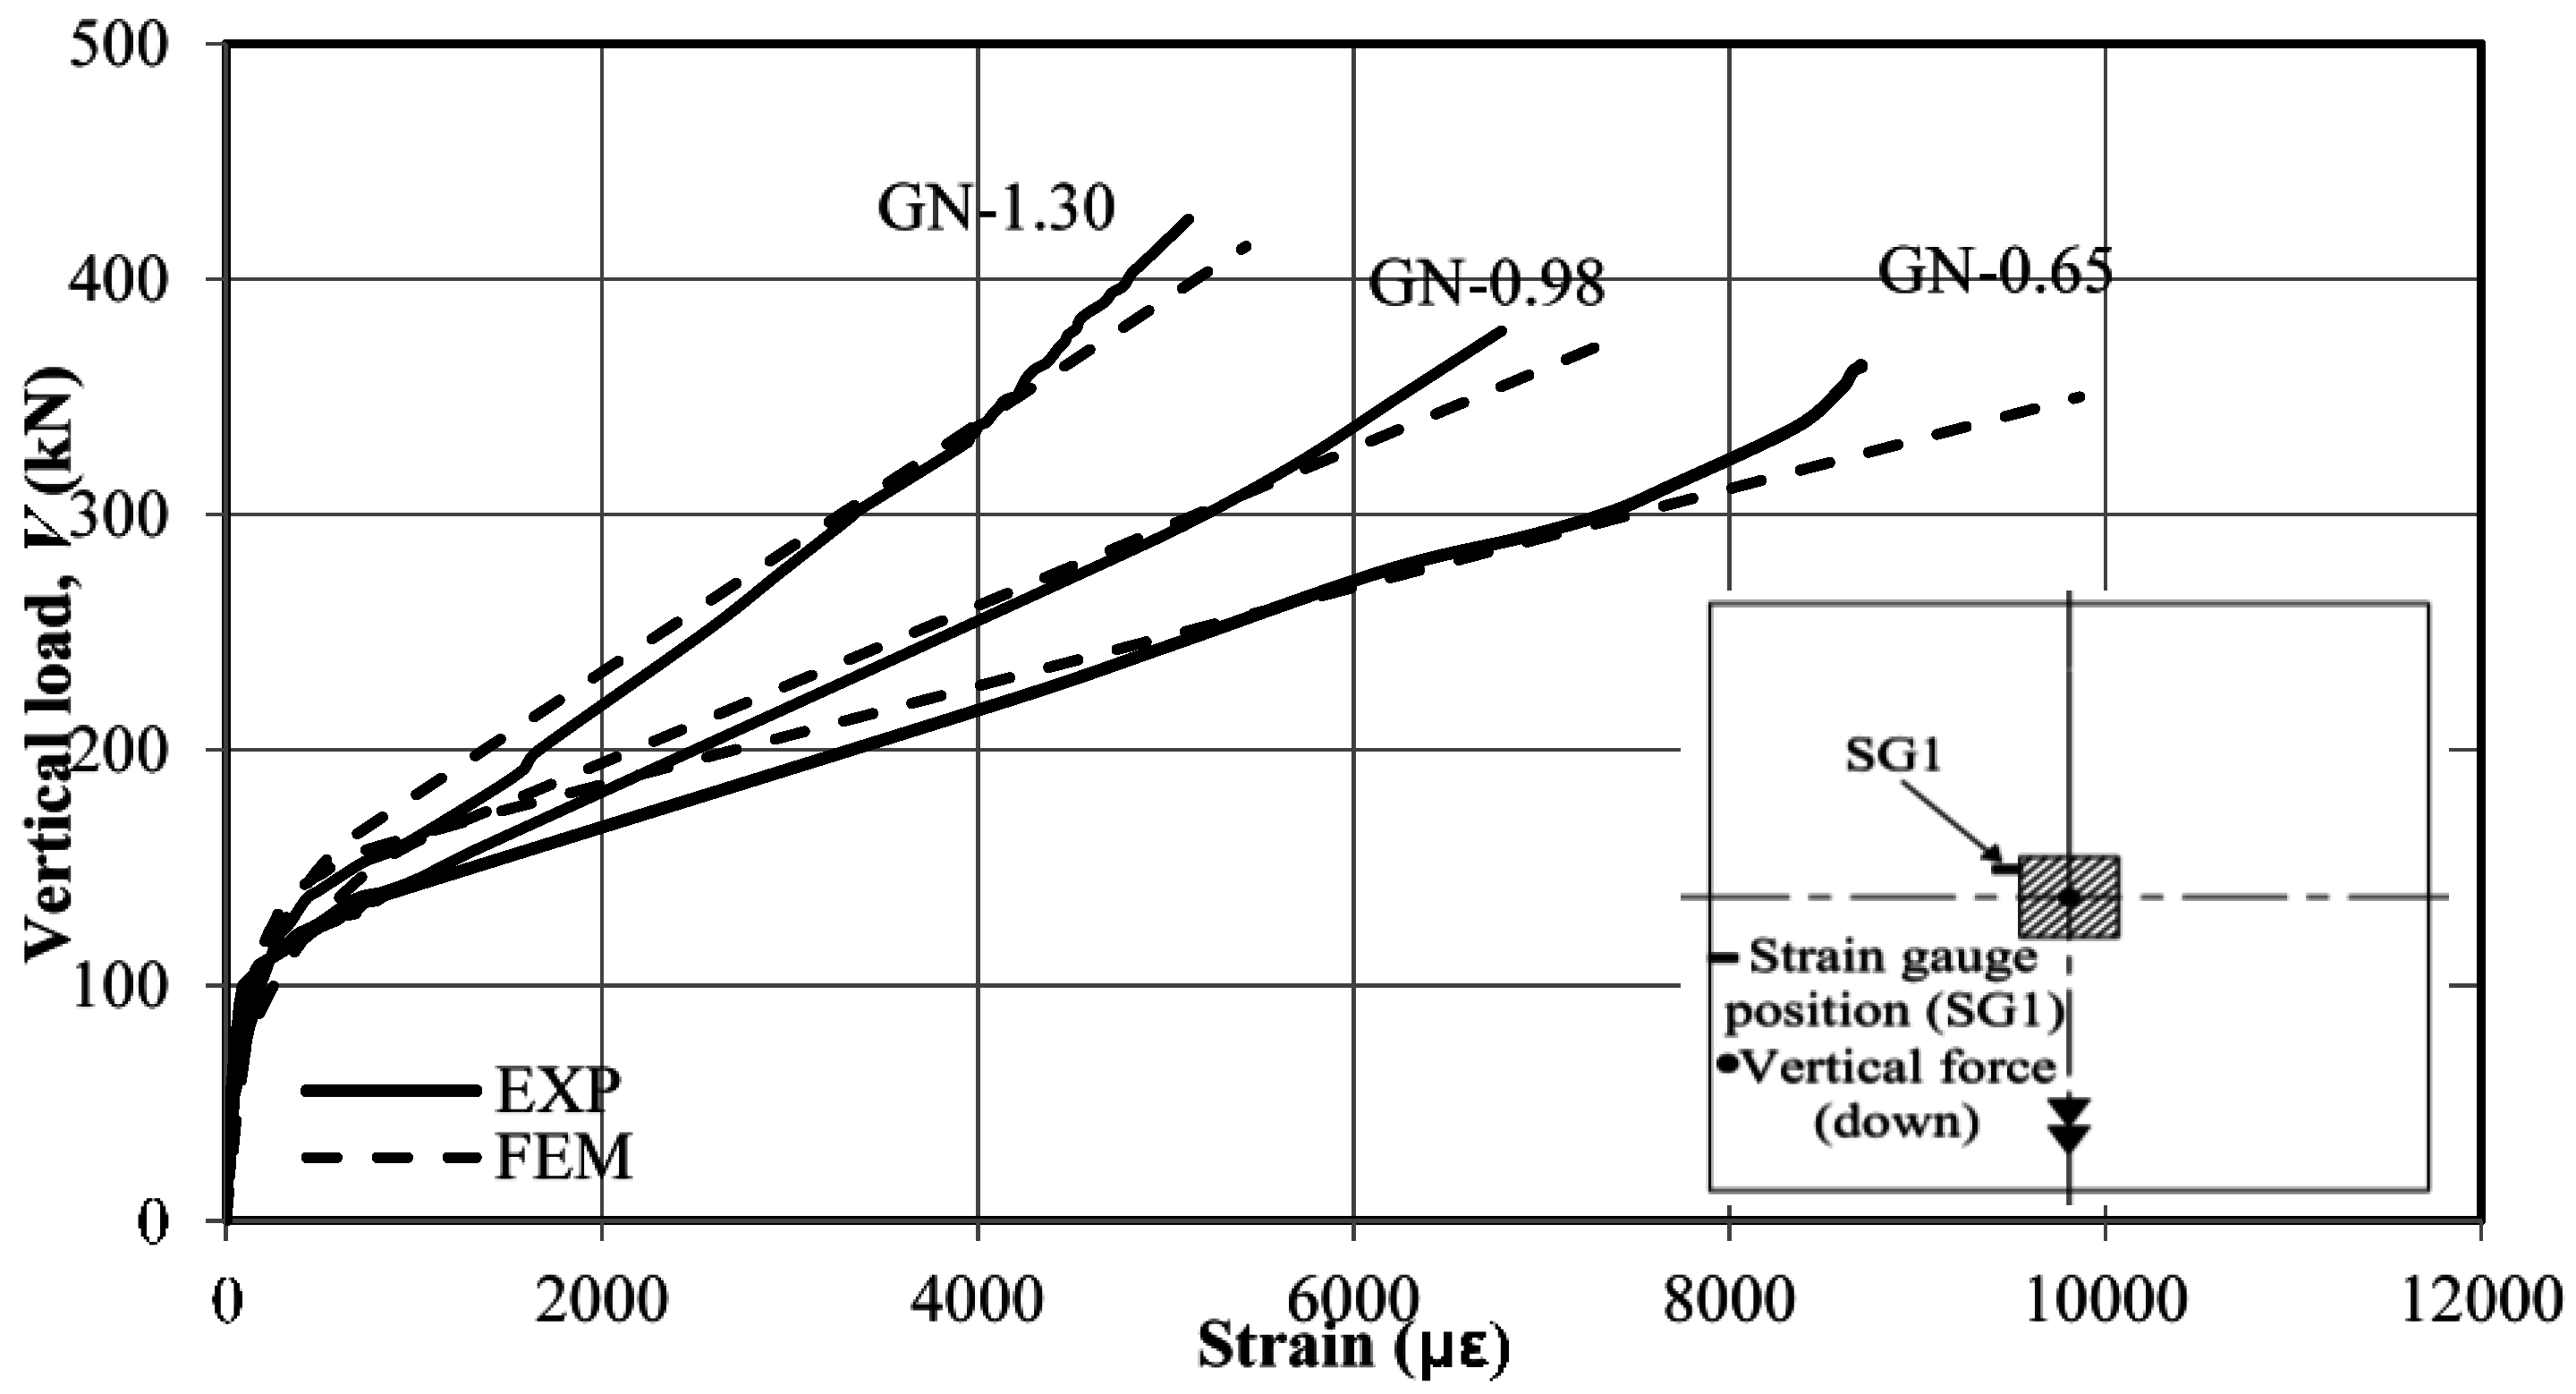
The results from the constructed FEM were verified against the experimental results of the tested slab-column connections. Three specimens were chosen for the verification process, connections GN-0.65, GN-0.98, and GN-1.30. The comparison was performed with respect to the load-deflection curve, the tensile strains in the GFRP bars, and the failure loads.
Figure 6 shows the vertical load-deflection relationship for the experimental and FEM results of the selected connections. It can be seen that the model was able to predict the load-deflection response of the experimental results with very reasonable accuracy. This holds true for both the uncracked and cracked stages. Also, the model was able to predict the reduction in the stiffness after cracking as shown in the figure. Similarly, the strains measured in the FEM and the strains obtained experimentally are in good agreement, as can be seen in
Figure 7. In addition, the FEM punching strength was very similar to the experimental one where the model failure loads were 2% to 5% less than the experimental failure loads.
Figure 6.
Load-deflection relationship.
Figure 6.
Load-deflection relationship.
Figure 7.
Load-strain relationship.
Figure 7.
Load-strain relationship.
Figure 8 shows a photo for the cracking pattern of the model with a 0.65% reinforcement ratio (GN-0.65), which is similar to the cracking patterns of the other models. The first crack was a radial crack started from the corner of the column and propagated toward one of the slab corners in the direction of the unbalanced moment, followed by similar cracks with different inclination angles at the tension face of the slab. With increasing the applied loads, circumferential cracks appeared at the vicinity of the central column to connect the radial cracks together. This cracking pattern is in very good agreement with the observed ones in the literature for slabs reinforced with FRP bars [
5,
12] and steel bars [
17]. The FEM results similar to the experimental data strengthen the confidence in the capability of the program to model the behavior of the slab-column connections. Therefore, the constructed model was used to run a parametric study to investigate more parameters affecting the punching shear behavior of such connections.
Figure 8.
Cracking pattern for the model with a 0.65% reinforcement ratio. (a) FEM; (b) Experiment.
Figure 8.
Cracking pattern for the model with a 0.65% reinforcement ratio. (a) FEM; (b) Experiment.
4. Parametric Study
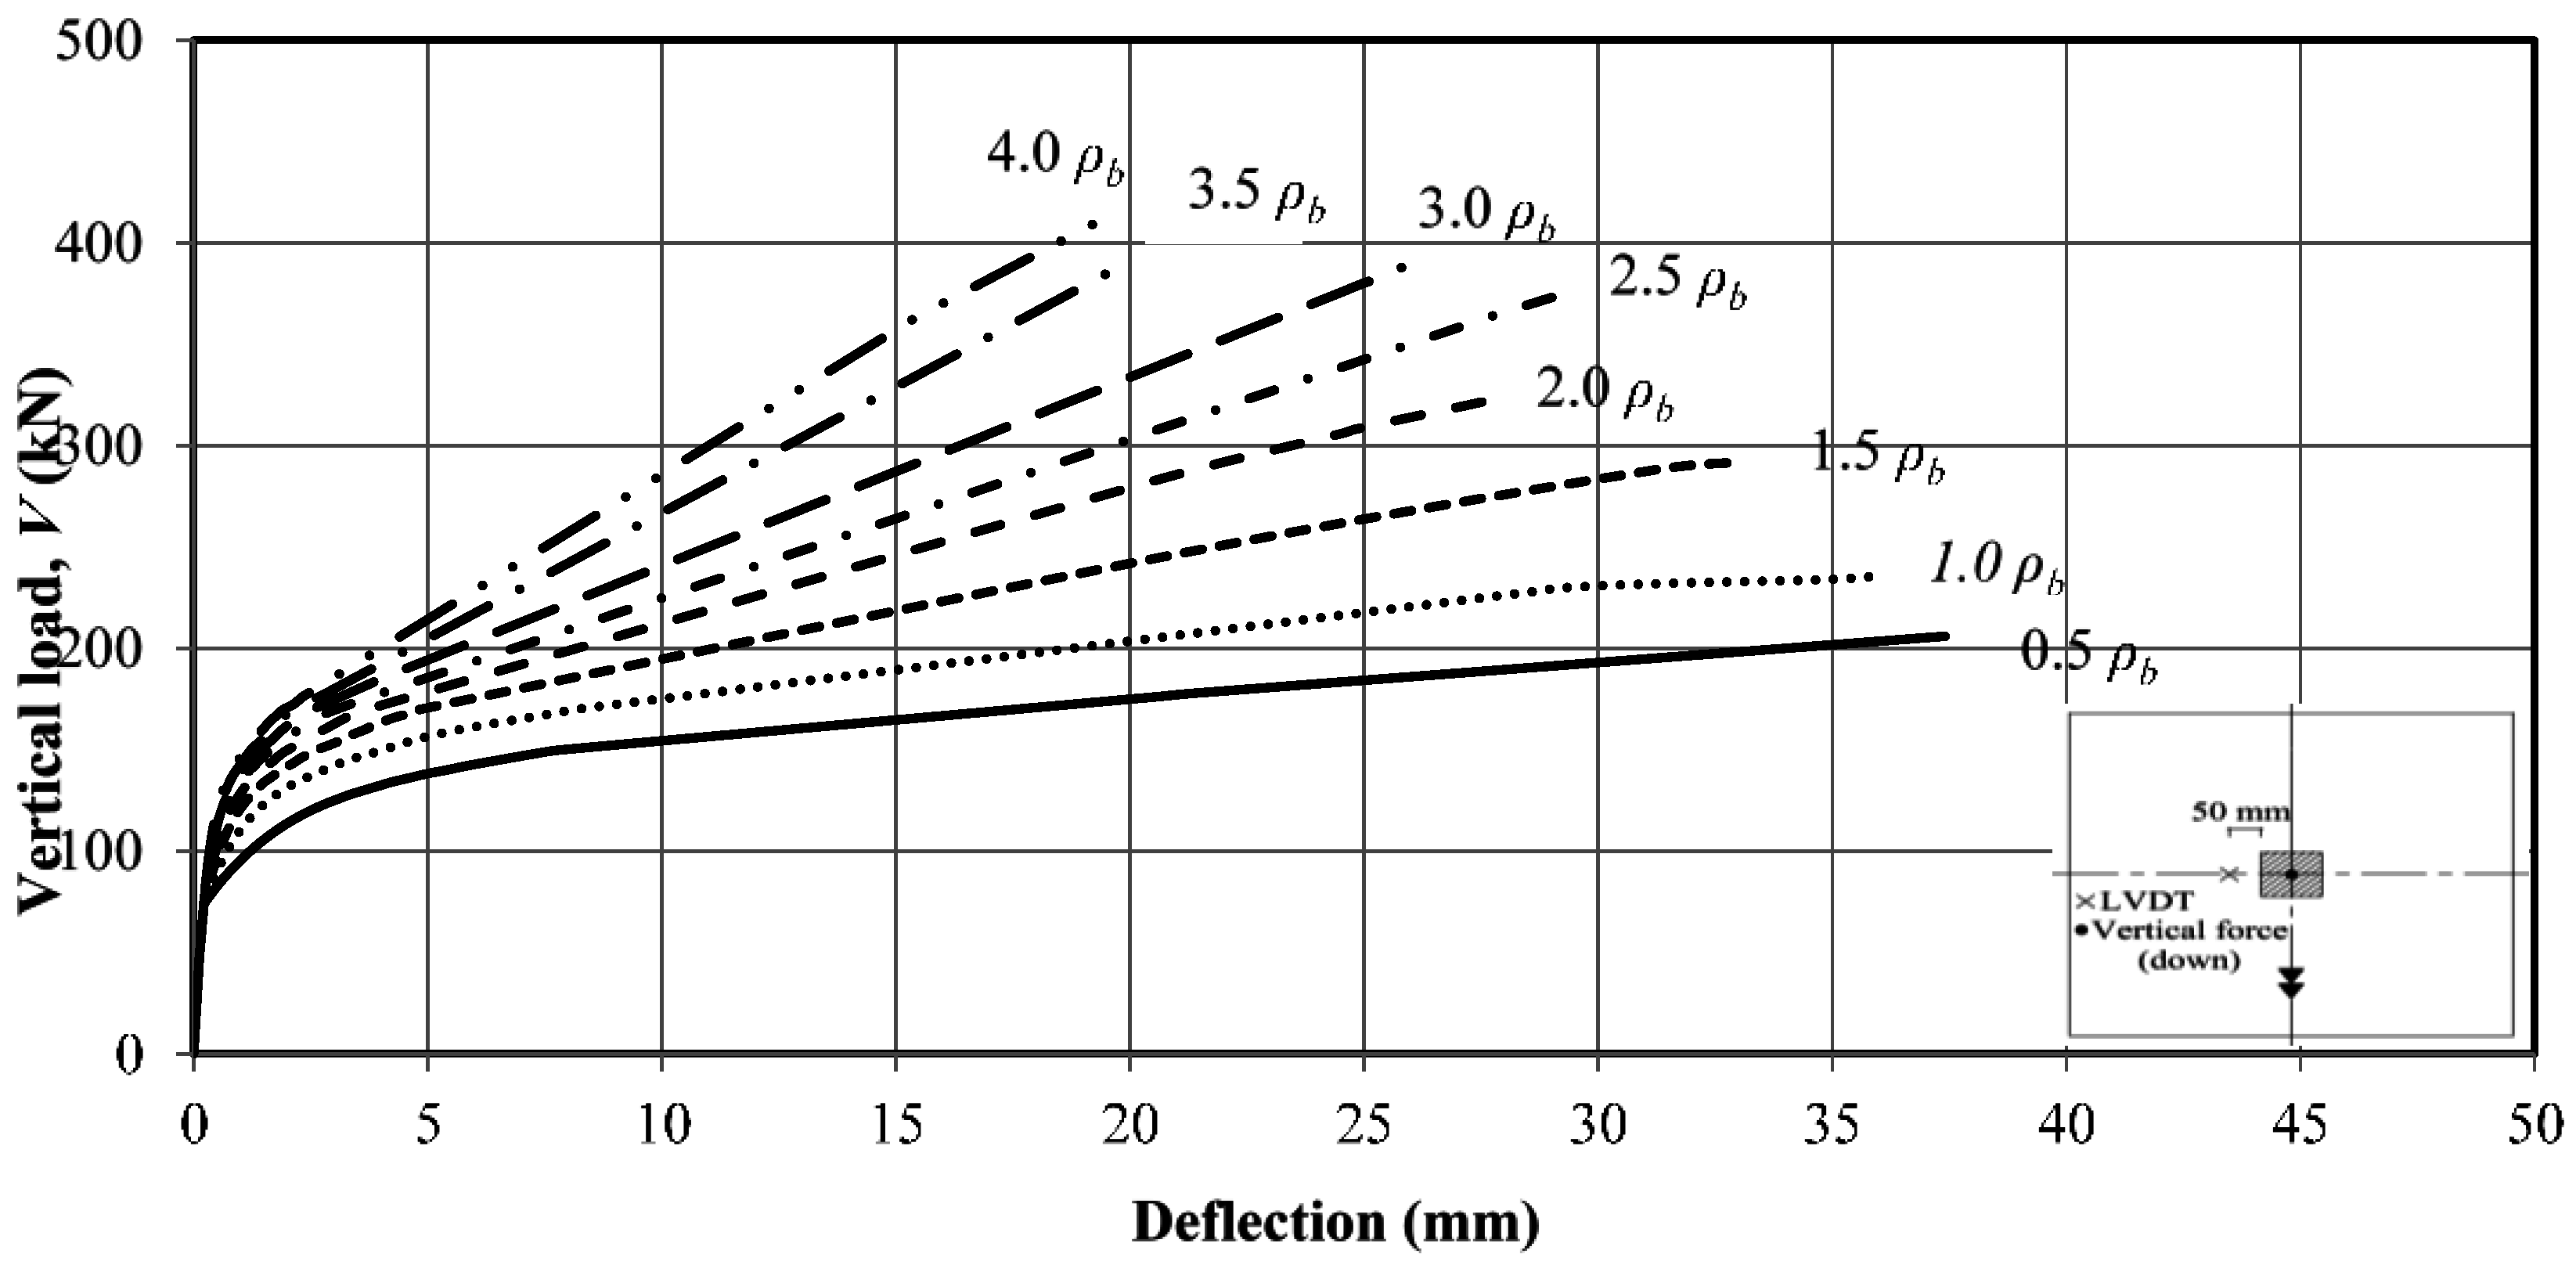
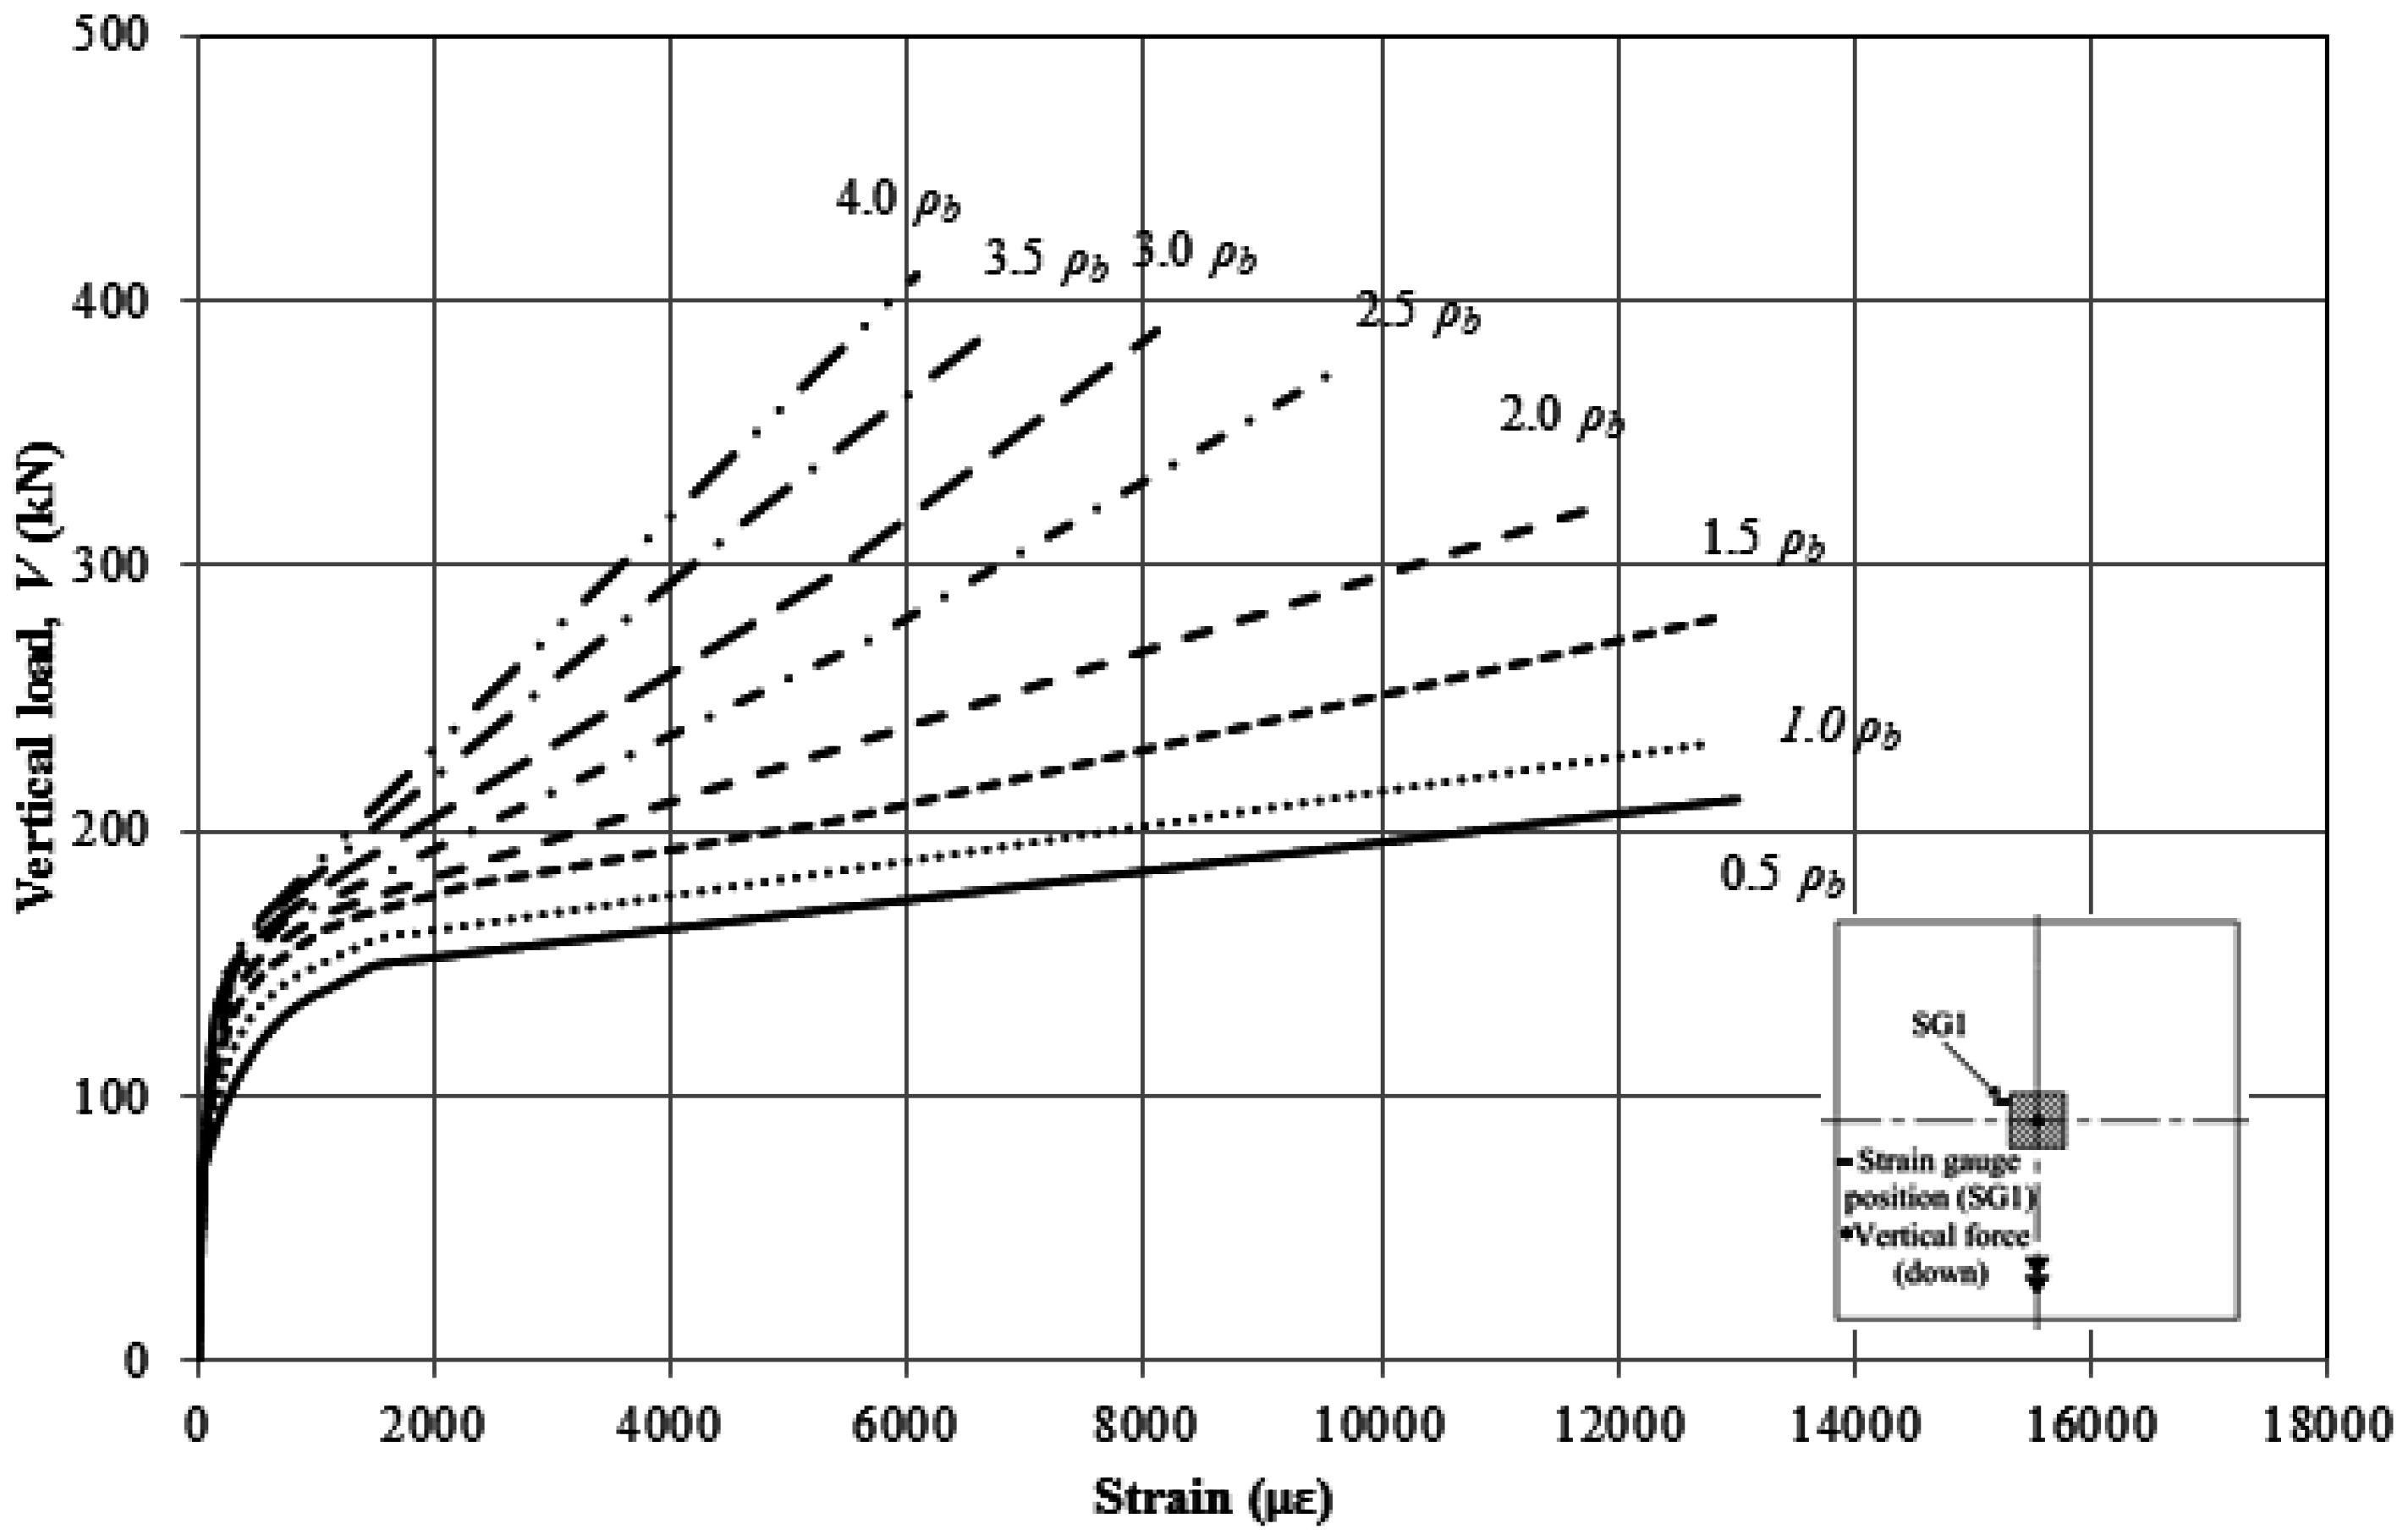
The analytical study was based on the materials, properties, and geometry of the control specimen GN-0.65. The discussed parameters are: (1) a wide range of flexural reinforcement ratios (between 0.5 ρb and 4.0 ρb, with 0.5 ρb increments, where ρb is the balanced reinforcement ratio, defined as the ratio at which concrete crushes and GFRP bars rupture simultaneously); (2) shear perimeter-to-depth ratio (11.5, 15.25, and 19, corresponding to the square column cross-section with side dimensions of 300, 450, and 600 mm and effective slab depth of 160 mm); (3) column aspect ratios (between 1.0 and 5.0). For each parameter, a comparison has been performed in terms of load-deflection curve, load-strain curve in the GFRP bars, and failure capacity.
4.1. Flexure Reinforcement Ratio
The Canadian standard [
6] recommends that FRP-RC members be over-reinforced, so the failure is initiated by concrete crushing rather than rupture of the bars. Also, FRP bars are elastic materials with a smaller stiffness compared to that of steel; therefore, large cracks are expected to spread in the FRP-RC members. Consequently, those cracks would reduce the effective compressive area and the contribution of aggregate interlock resisting the punching shear stresses. Moreover, the code limits the maximum strain in the GFRP bars at the service load stage to be less than 25% of the ultimate strain of the bars to control crack width. In the meantime, the American guideline [
7] allows for tension and compression failures. Also, at the service stage, the American guideline limits the maximum strain in the GFRP bars to be less than 20% of the ultimate strain of the bars (Clause 8.4.1).
The relationship between the deflection and the vertical shear force is shown in
Figure 9. Similar to the experiments, the behavior of the FE models can be described as a bi-linear relation with a smooth transition. In the uncracked zone the deflection increased linearly up to initiation of the first crack. The behavior of the models in that zone represents the stiffness of the uncracked specimens. Also, nonlinearity in the load-deflection curve was observed when the tensile stresses exceeded the tensile strength of the concrete. Furthermore, once the cracks initiated in the models, the uncrack stiffness tended to decrease, but the rate of the loss in the stiffness is inversely proportional with the increase in the axial stiffness of the reinforcement, ρ
f Ef, of the models. Generally, increasing the axial stiffness from half the balanced reinforcement ratio to four times the balanced reinforcement ratio increased the post-cracking stiffness of the model, which in turn decreased the deflection at the same load level.
Figure 9.
Variation in load-deflection relationship with the reinforcement ratio.
Figure 9.
Variation in load-deflection relationship with the reinforcement ratio.
Figure 10 depicts the relationship between the vertical shear force and the measured strain in the GFRP bars for the models with different axial stiffness of the slab reinforcement. In general, before cracking, the measured strain values were insignificant and did not exceed 500 micro-strains for all the models. In addition, when the tensile stresses overcome the tensile capacity of the concrete, the strains in the reinforcement increase at a higher rate. The maximum measured strain was almost 13,000 με in the model with half the balanced reinforcement ratio. This value of strain is approximately 63% of the rupture strain of the sand-coated GFRP bars used in the current study. Also, this value confirmed that the failure of the models was not initiated by the rupture of the reinforcement. Furthermore, increasing the reinforcement ratio decreased the strain at the same load-level. In addition, the strain at failure decreased by approximately 57% when the reinforcement ratio was increased from half to four times the balanced reinforcement ratio. At the service load stage the strains in the models with reinforcement ratios of 0.6 (2.0 ρ
b), 0.75 (2.5 ρ
b), 0.9 (3.0 ρ
b), 1.05 (3.5 ρ
b), and 1.2% (4.0 ρ
b) were 9980, 6620, 5300, 4110, and 3510 με, respectively, which represent 48%, 32%, 25%, 20%, and 17% of the ultimate tensile capacity of the GFRP bar. In addition, the models with 0.15% (0.5 ρ
b), 0.3% (1.0 ρ
b), and 0.45% (1.5 ρ
b) reinforcement ratios failed before reaching the calculated service load of 295 kN.
Figure 10.
Variation in load-strain relationship with the reinforcement ratio.
Figure 10.
Variation in load-strain relationship with the reinforcement ratio.
The relation between the axial stiffness of the slab reinforcement and the normalized ultimate punching shear stresses calculated at 0.5
d (80 mm) from the column face is presented in
Figure 11. Moreover, an interpolation equation was introduced in the figure (Equation (6)) to find the mathematical correlation between the normalized punching shear stresses and the axial stiffness of the slab reinforcement. The equation was obtained using the method of least squares. On the basis of the results of that formula, the normalized punching shear stress is found to be proportional to the axial stiffness of the slab reinforcement with a power of 0.34. In addition, the constant value in the interpolation equation is 0.0562. This equation is similar to Equation (3) of the Canadian standard [
6].
Figure 11.
Relationship between the normalized punching shear stress at failure and the axial stiffness of the slabs.
Figure 11.
Relationship between the normalized punching shear stress at failure and the axial stiffness of the slabs.
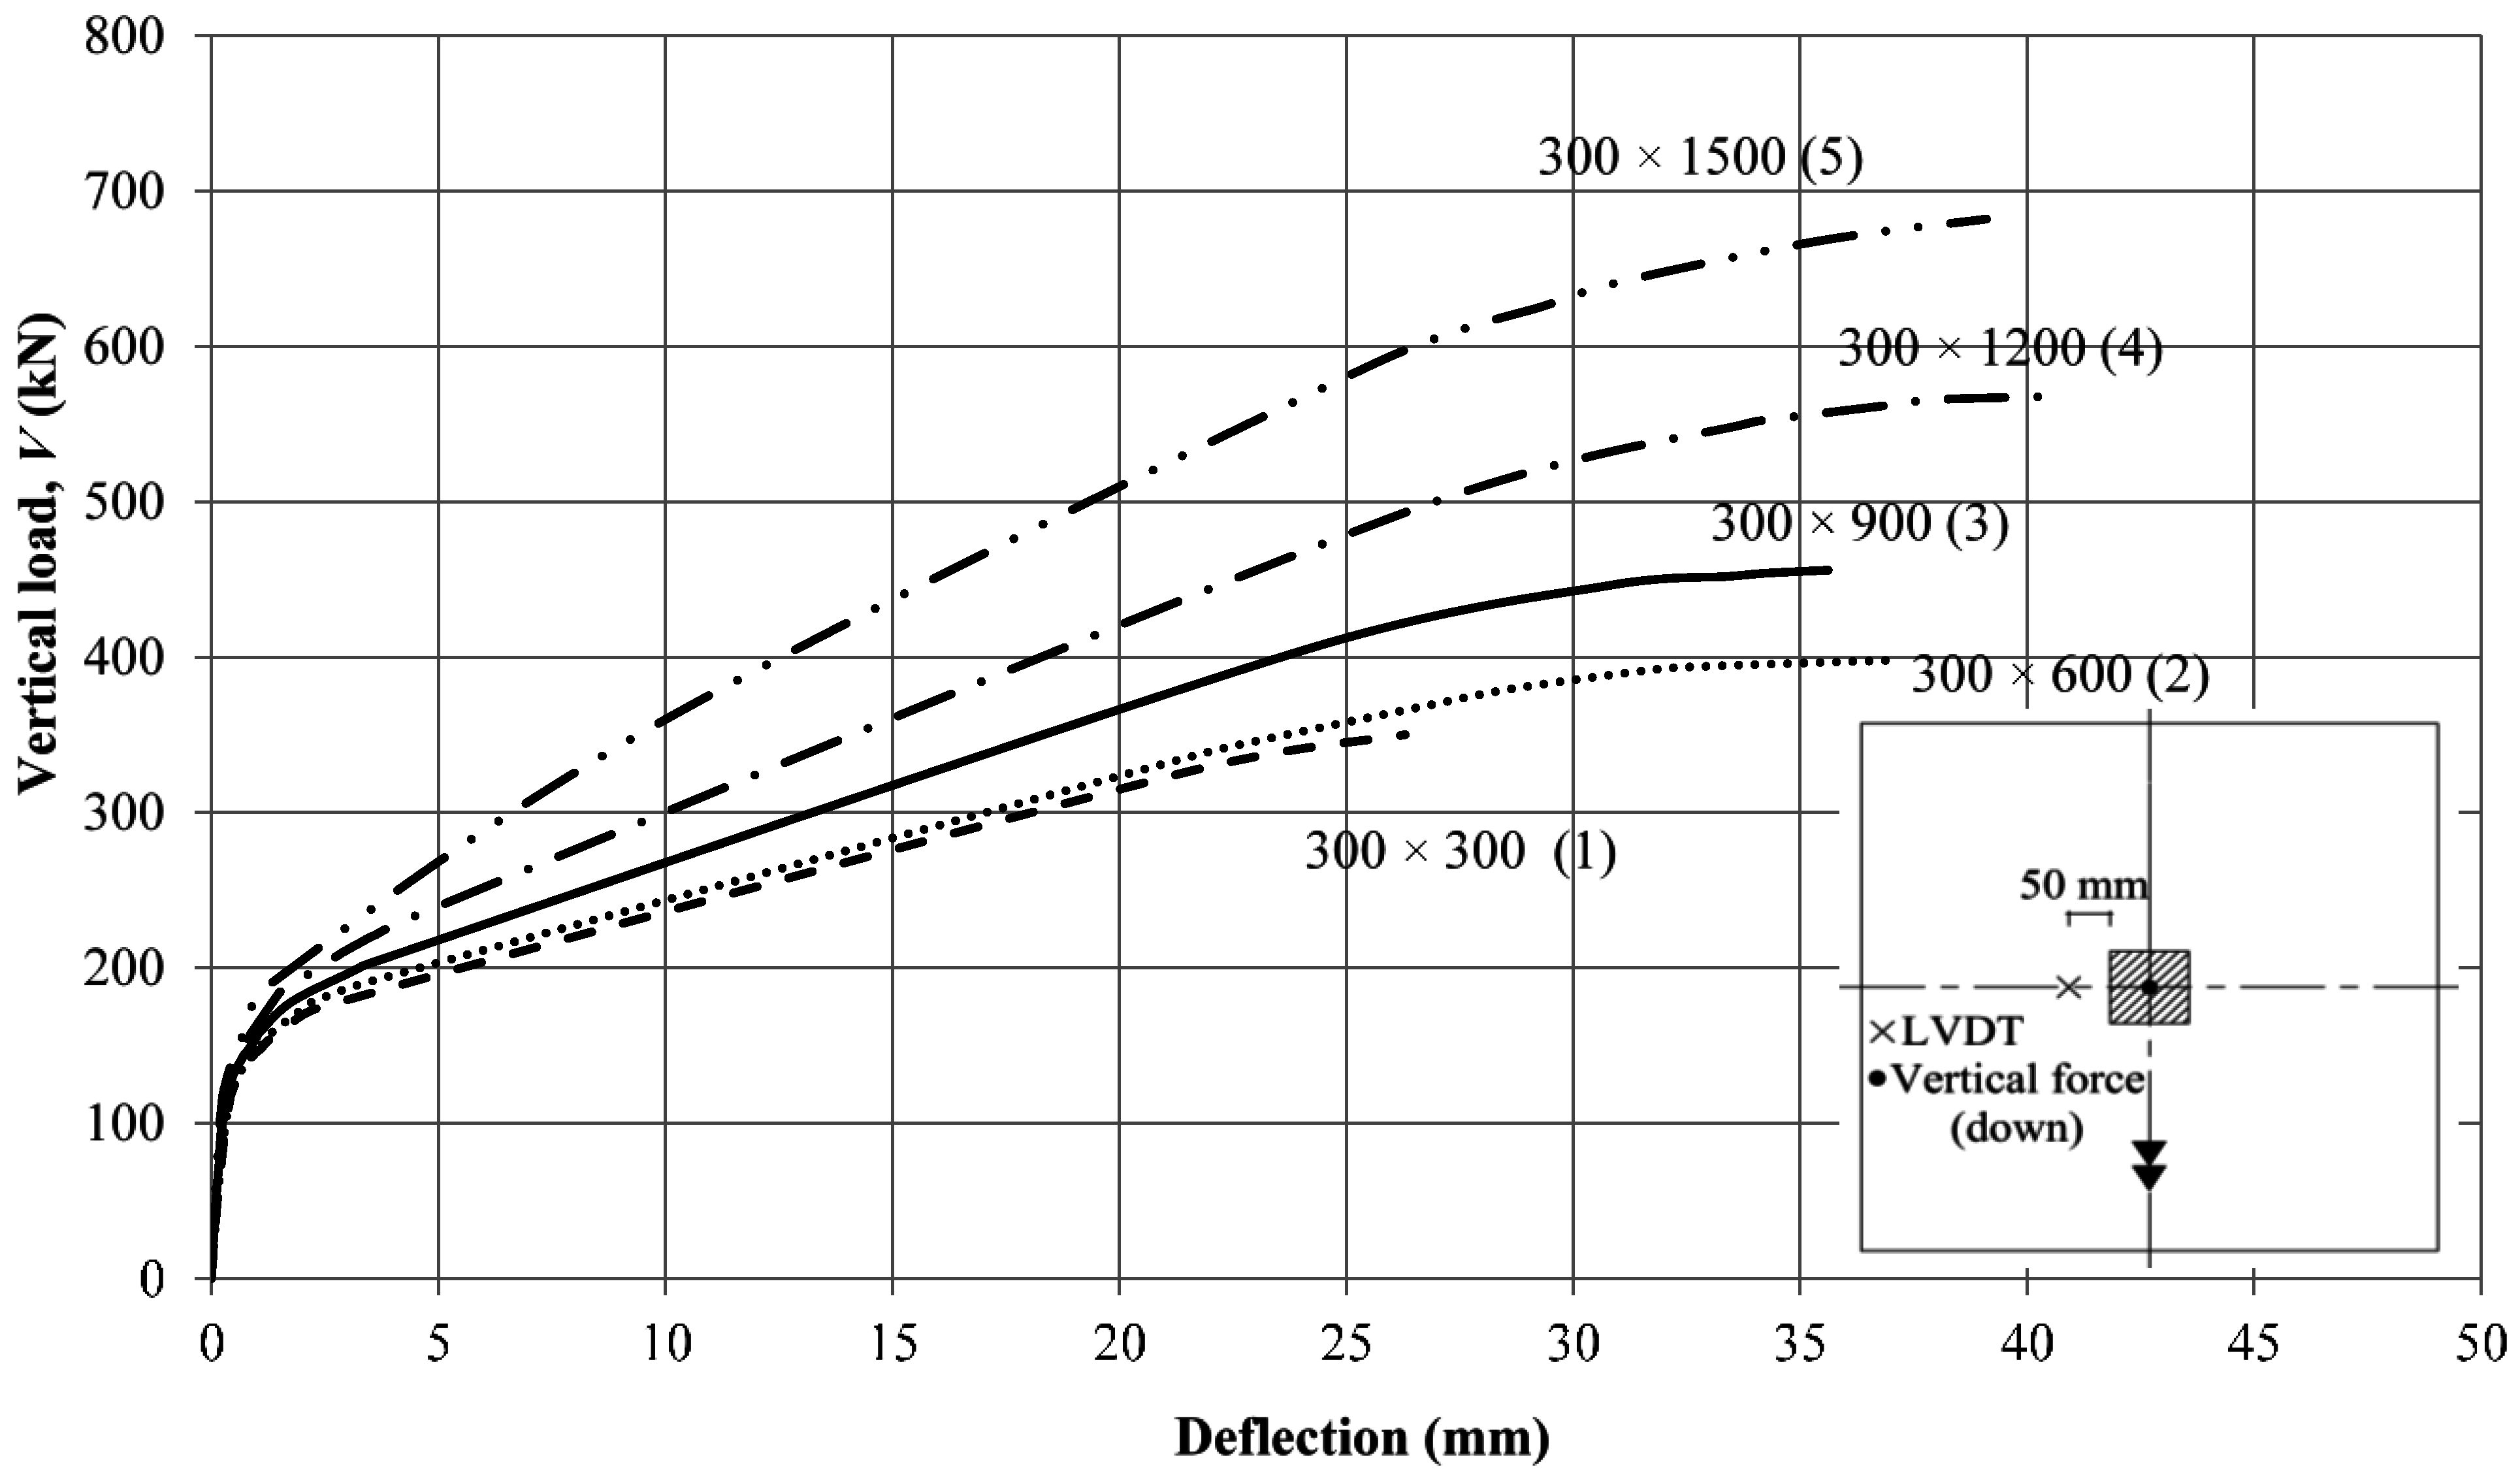
4.2. Shear Perimeter-to-Depth Ratio (Σo/d)
Figure 12 presents the relation between the vertical load and the measured deflection at 50 mm from the column face. Generally, the behavior of the models is similar to that illustrated earlier in the “flexural reinforcement ratio” section. The specimen with a perimeter-to-depth ratio of 11.5 experienced the lowest failure load and post-cracking stiffness. Also, as the dimensions of the column increased, considerable improvement was observed in the failure load and the deflection at the same load level. At the service load stage, increasing the perimeter-to-depth ratio from 11.5 to 19 reduced the deflection by approximately 33%. In addition, it seems that increasing the column cross-section increased the degree of nonlinearity of the model at failure. Furthermore, the post-cracking stiffness increased by approximately 25% due to the increase in the perimeter-to-depth ratio from 11.5 to 19. This is due to the fact that the increase in the dimensions of the column increased the overall stiffness of the connection.
Figure 12.
Load-deflection relationship for the models with different perimeter-to-depth ratios.
Figure 12.
Load-deflection relationship for the models with different perimeter-to-depth ratios.
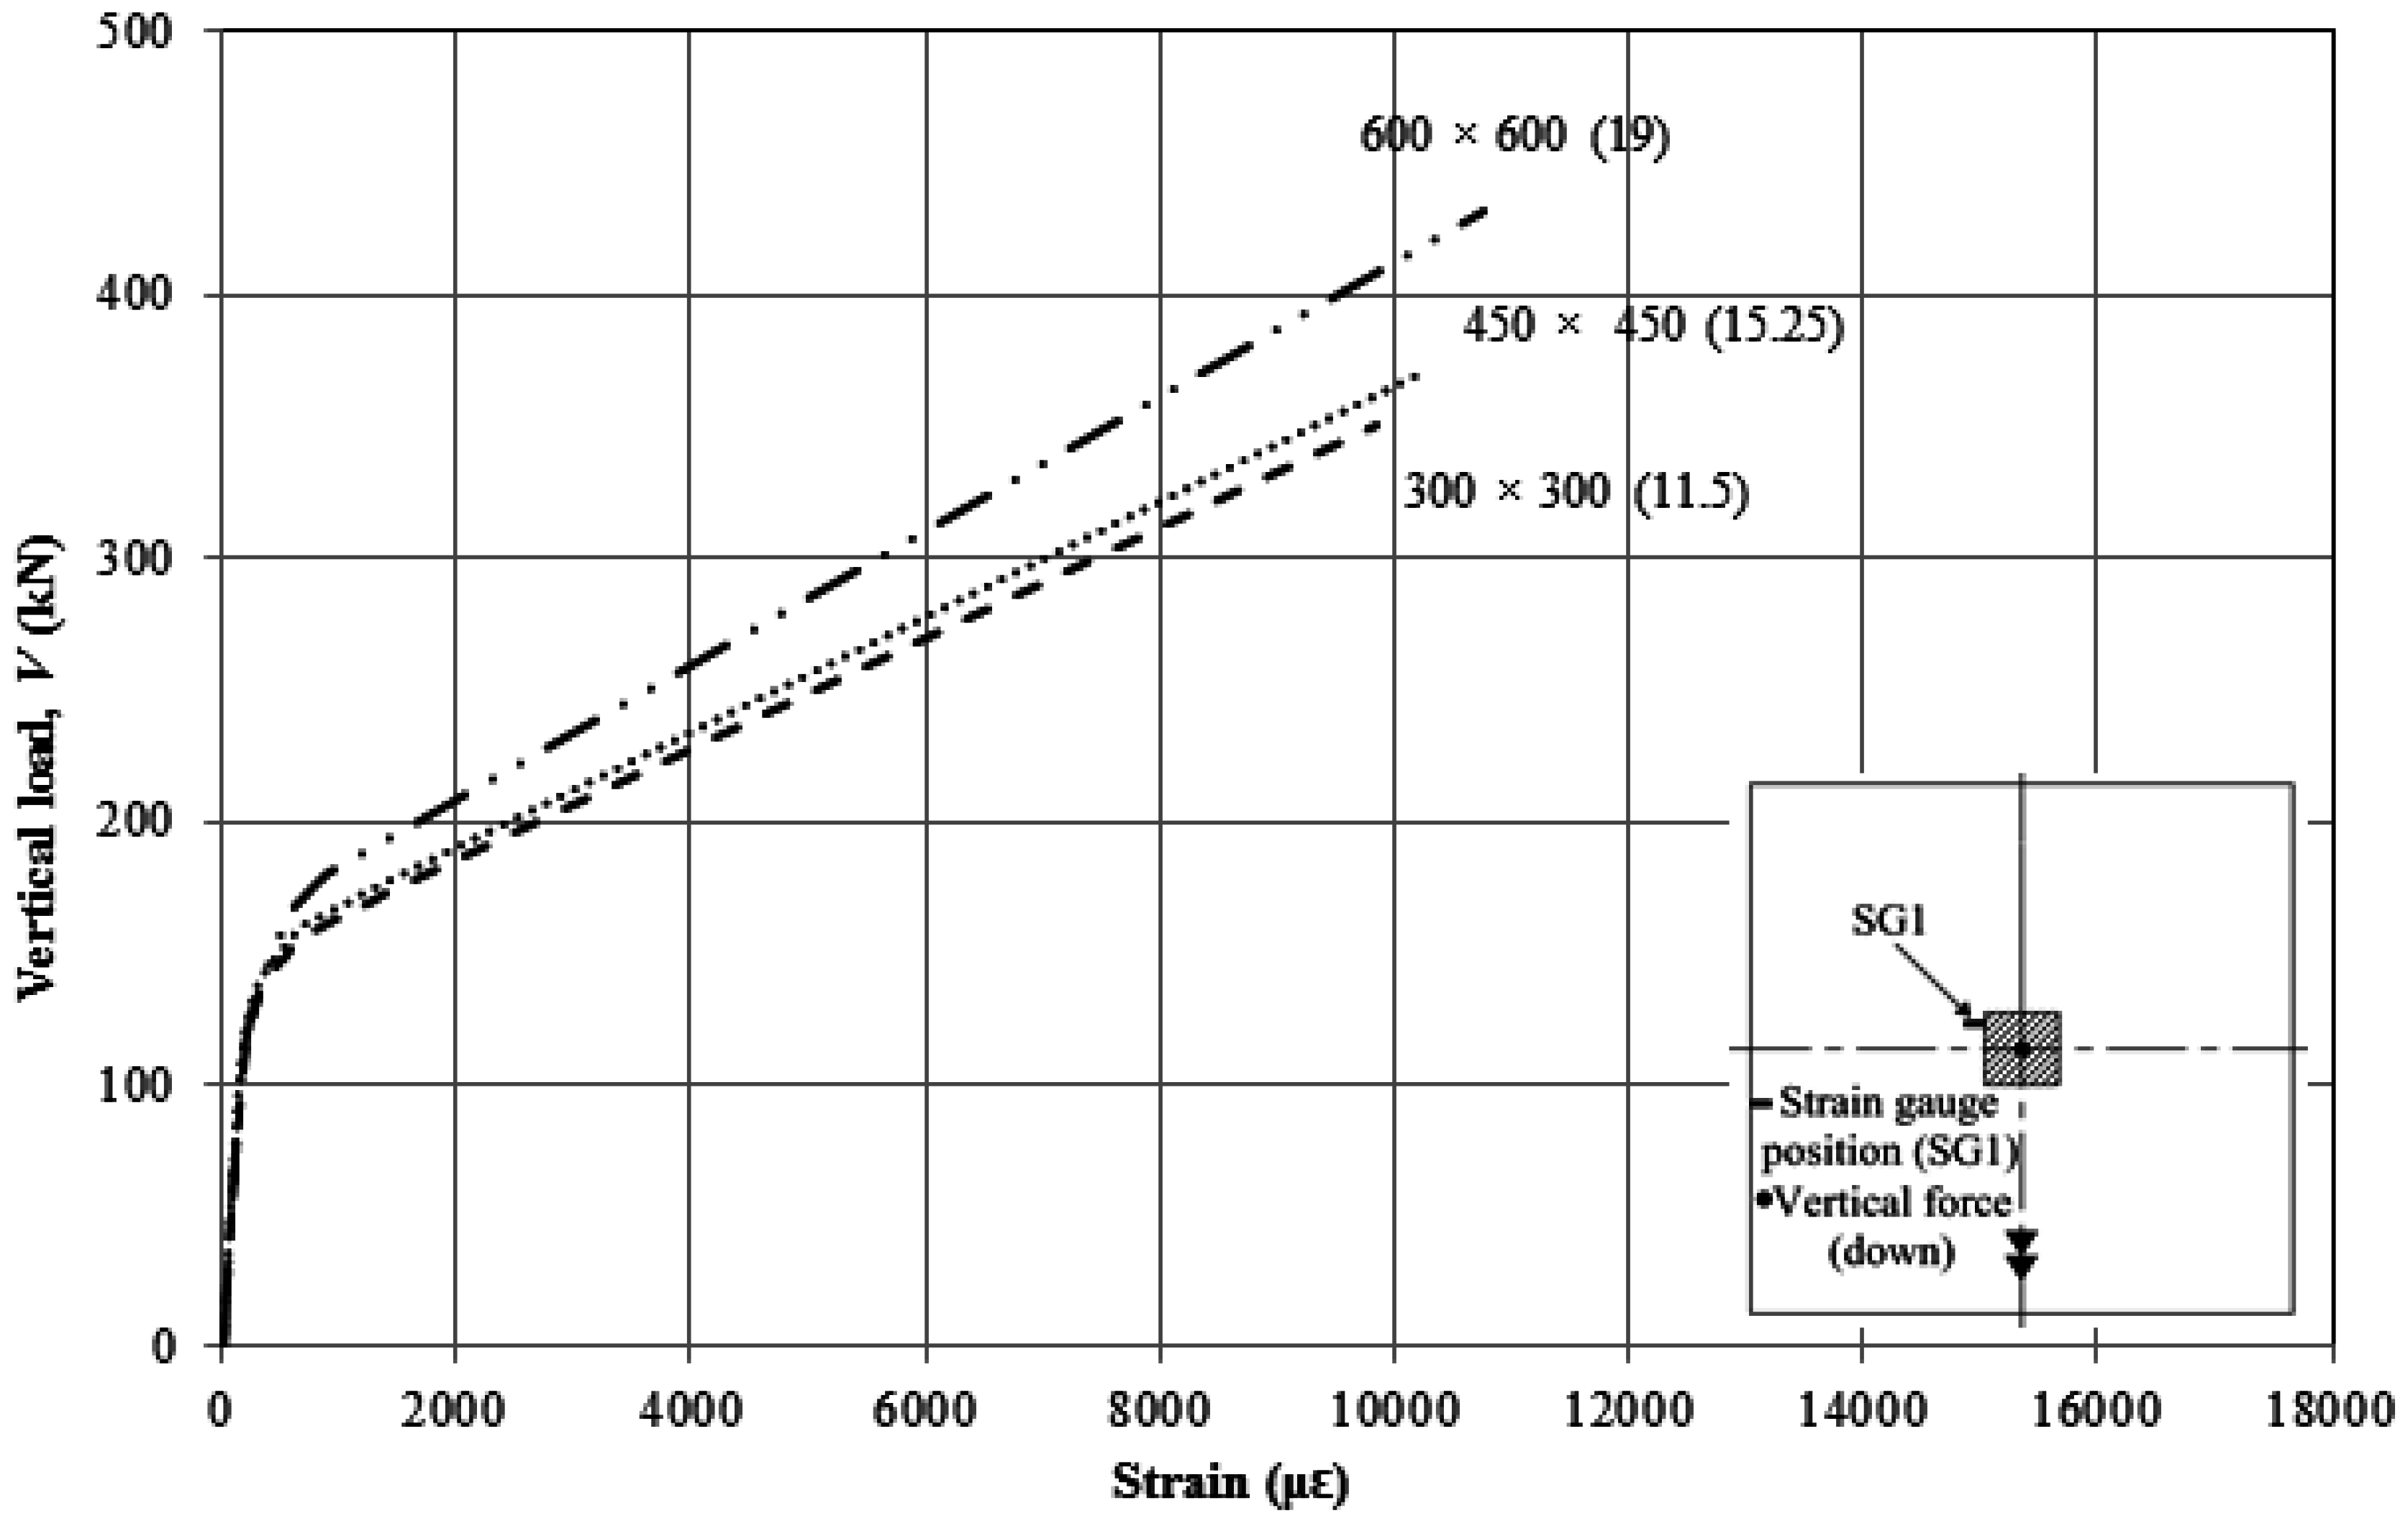
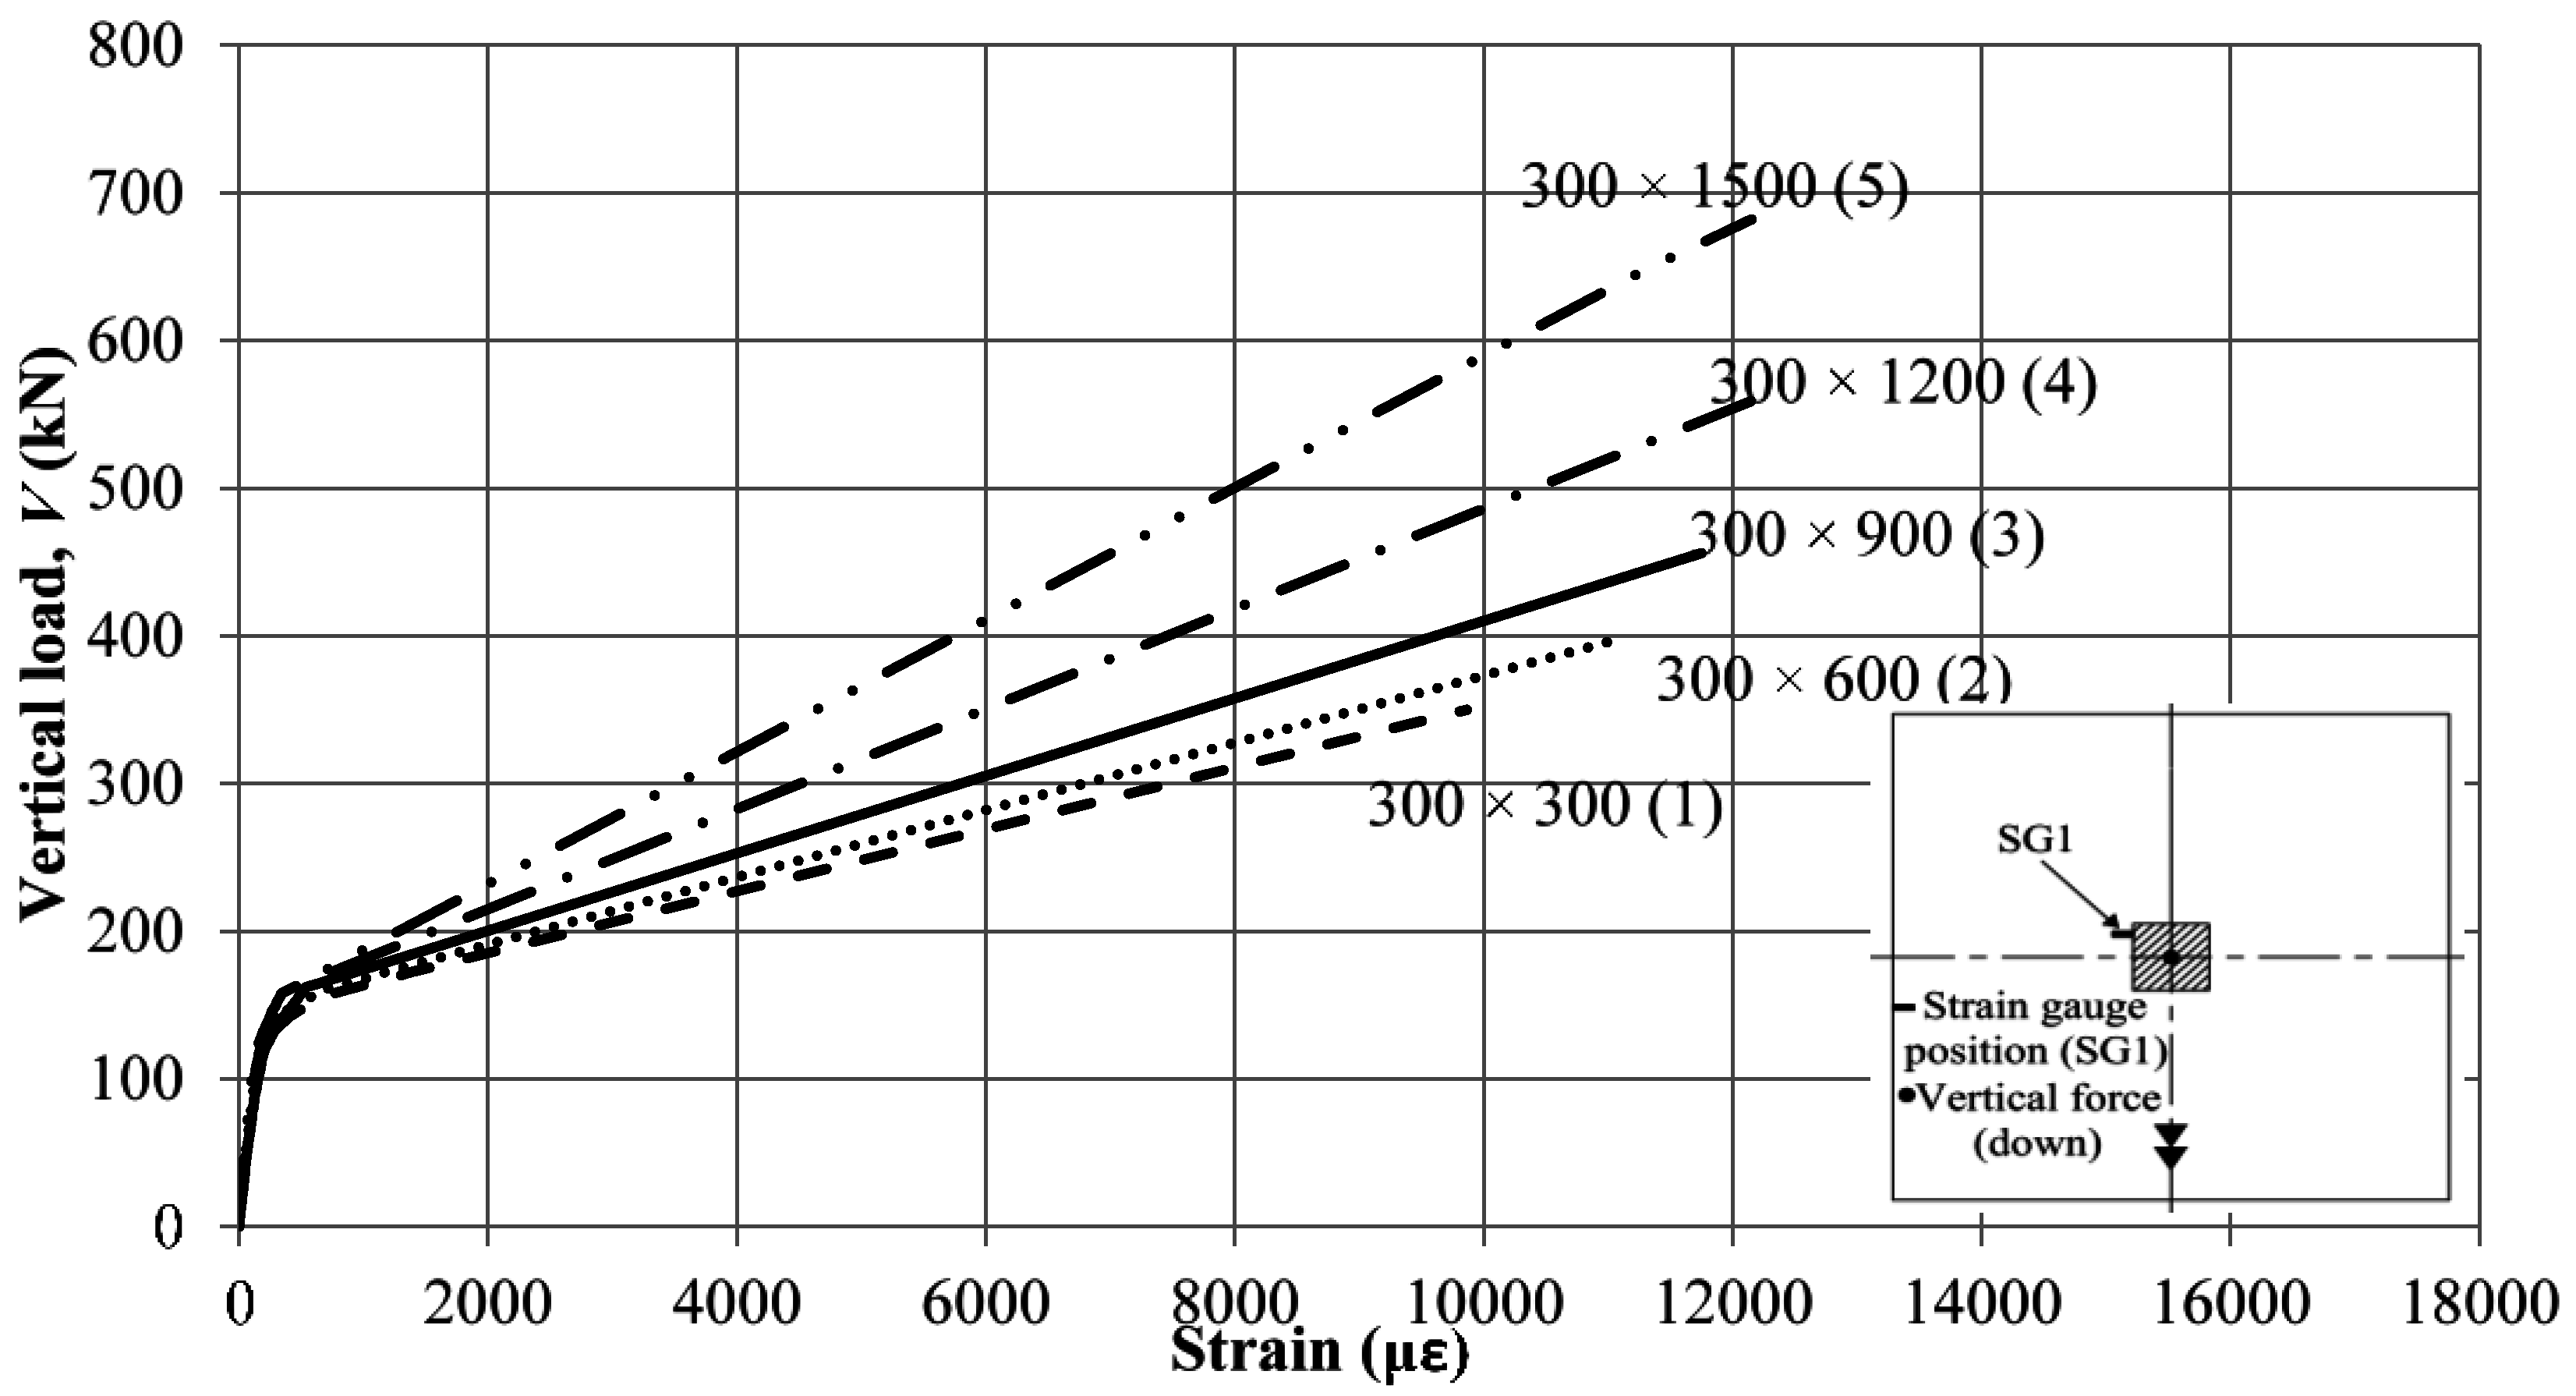
Figure 13 illustrates the relationship between the strains measured at the column face on the horizontal axis and the vertical load. Again, the behavior of the models is similar to that mentioned earlier in the “flexural reinforcement ratio” section. The strain decreased by approximately 28% at the service load level when the perimeter-to-depth ratio increased from 11.5 to 19. The maximum measured strain in that group was approximately 10,760 μϵ. This value is 52% of the ultimate strain of the sand-coated GFRP bars. Also, at the service load stage, the strain in models with perimeter-to-depth ratios of 11.5, 15.25, and 19 was 7280, 6730, and 5350 μɛ, which represent 35%, 33%, and 26% of the rupture strain of the GFRP bar.
Figure 13.
Load-strain relationship for the models with different perimeter-to-depth ratios.
Figure 13.
Load-strain relationship for the models with different perimeter-to-depth ratios.
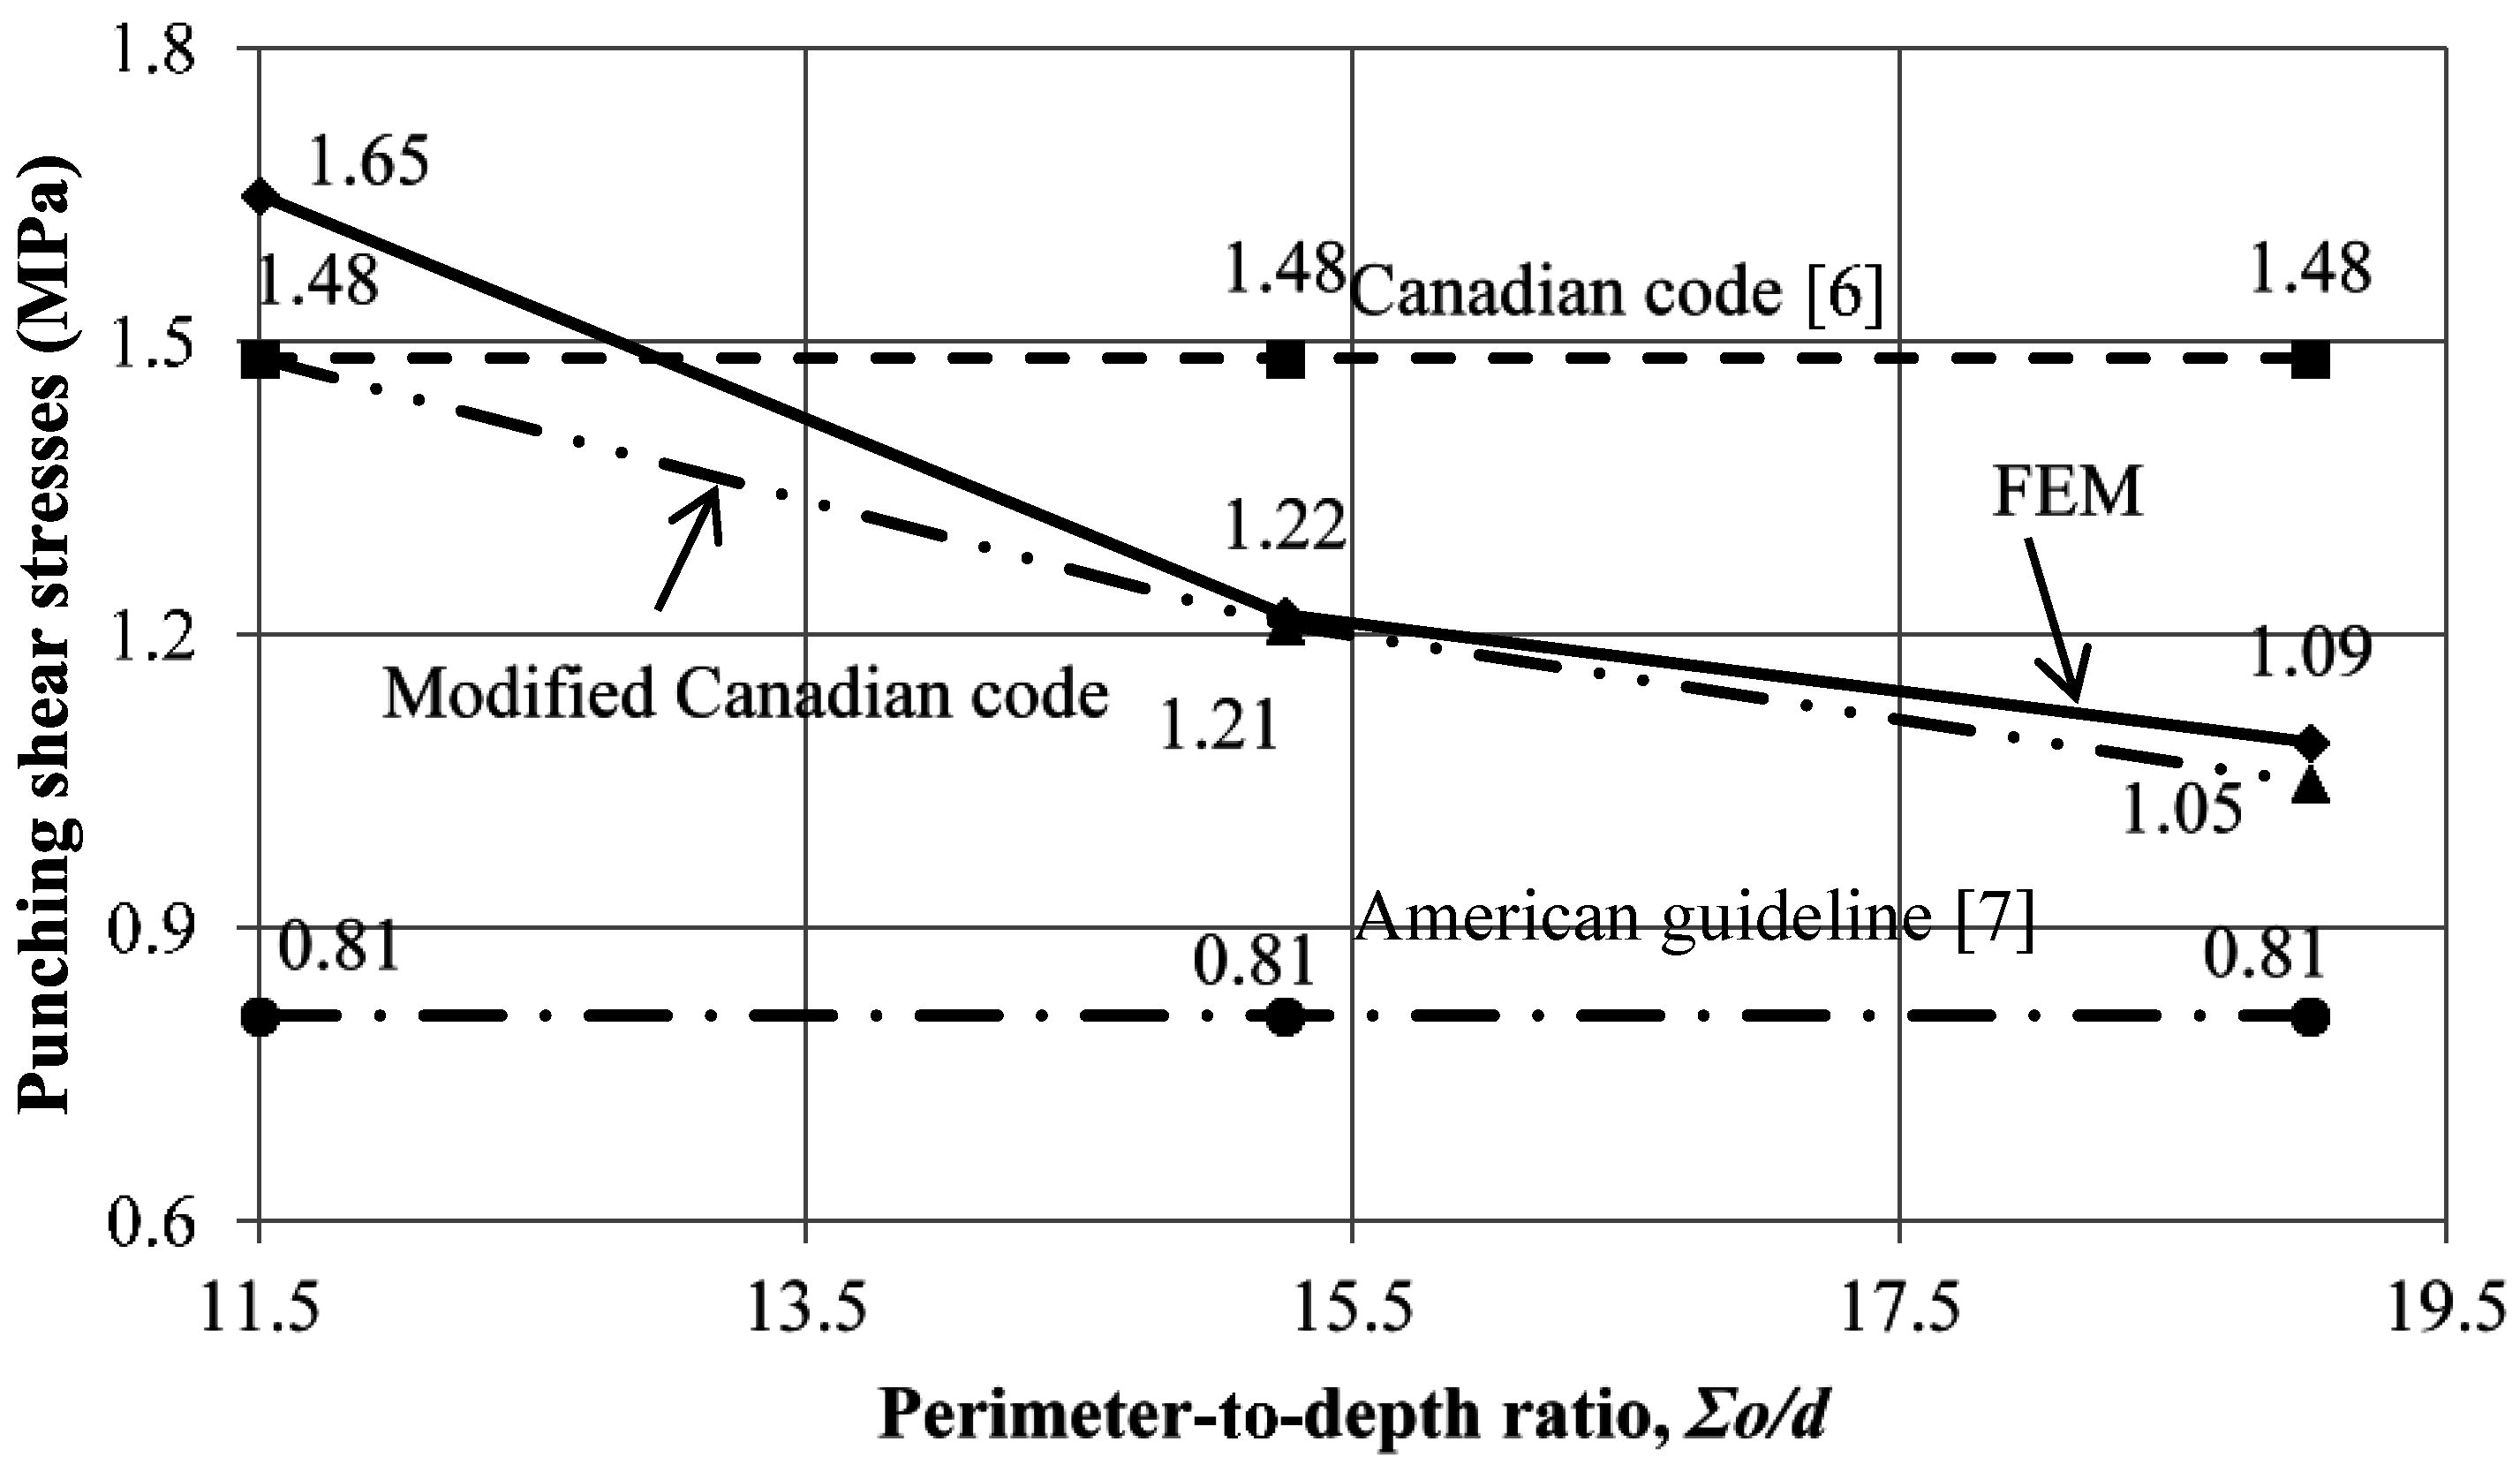
As the column cross-section increases, the perimeter that resists the shear forces increases as well, which leads to better resistance in the form of decreasing the shear stresses around the column face.
Figure 14 depicts the relation between the failure stress calculated at 0.5
d (80 mm) from the column face and the perimeter-to-depth ratio. Increasing the perimeter-to-depth ratio from 11.5 to 15.25 and 19 decreased the failure punching shear stresses by 26% and 34%, respectively. These results are in very good agreement with the finding of the available literature [
3], where two GFRP-RC specimens with 200 mm thickness and square column cross-sections with side lengths of 300 mm and 450 mm were tested under concentric load. It was reported that a 29% decrease in the failure stresses was observed with increasing the square column dimensions from 300 mm to 450 mm. Also, it was found that the Canadian standard [
6] underestimated the failure load for the specimen with a 300 mm square column cross-section and overestimated the failure load for the connection with a 450 mm square column cross-section. In addition, similar results were reported for two edge steel-RC slab-column connections tested under eccentric load [
18]. A reduction by 20% in the punching shear stresses was found when the perimeter-to-depth ratio was increased from 6.5 to 11.0.
The Canadian code [
6] takes into account the effect of the perimeter-to-depth ratio in Equation (2). According to this equation, increasing the perimeter-to-depth ratio from 11.5 to 15.25 and 19 decreased the predicted punching shear stresses by 16% and 25%, respectively. However, Equation (2), which does not account for the effect of reducing the punching shear stresses due to the increase in the perimeter-to-depth ratio (
Figure 13), gives more conservative predictions and, thus, it governs the design. To overcome this problem, Equation (3) needs to be multiplied by a reduction factor (Equation (7)). However, further investigation is still needed to evaluate the adequacy of this reduction factor. On the other hand,
Figure 14 shows that the American guideline [
7] underestimated the punching shear stresses of the slab-column connections.
Figure 14.
Relationship between the punching shear stress at failure and the perimeter-to-depth ratio.
Figure 14.
Relationship between the punching shear stress at failure and the perimeter-to-depth ratio.
4.3. Column Aspect Ratio
Five models with column aspect ratios ranging between one and five were constructed to evaluate the effect of that parameter. The unbalanced moment was applied in a direction parallel to the direction of the smaller dimension of the column for two reasons. The first is to keep the span-to-depth ratio constant for all the models and the second is to consider the critical case by applying the unbalanced moment in the direction of the lower moment of inertia of the column.
Figure 15 shows the variation of the load-deflection relationship with different column aspect ratios. The model with a column aspect ratio equal to one demonstrated the lowest failure load and post-cracking stiffness. Also, as the column aspect ratio increased, significant improvement in the carrying load capacity and the post-cracking stiffness was observed due to the distribution of the stresses on longer perimeter. Increasing the column aspect ratio from one to five reduced the deflection at the service load stage by approximately 65%. In addition, it seems that the non-linearity increased in the models at the failure stage with increasing the column aspect ratio. Also, the post-cracking stiffness increased by approximately 85% due to increasing the column aspect ratio by four folds.
Figure 15.
Load-deflection relationship for the models with different column aspect ratios.
Figure 15.
Load-deflection relationship for the models with different column aspect ratios.
Figure 16 illustrates the load-strain relationship for the investigated column aspect ratios. The maximum measured strain was approximately 12,300 με in model with a column aspect ratio equal to 4.0. This value of strain is 60% of the ultimate strain of the GFRP bars. Also, at the service load stage, increasing the column aspect ratio from one to five decreased the strain by approximately 59%. At the failure stage the strain increased by approximately 26% due to the increase in the column aspect ratio from one to four, which, in turn, increased the ultimate loading capacity. Furthermore, the strain at failure for the models with column aspect ratios equal to 4 and 5 was almost the same. The strains in the models with 1.0, 2.0, 3.0, 4.0, and 5.0 column aspect ratios were 7280, 6520, 5570, 4330, and 3380 με, respectively, at the service load stage. These values represent 35%, 32%, 27%, 21%, and 16% of the ultimate strain of the GFRP bar.
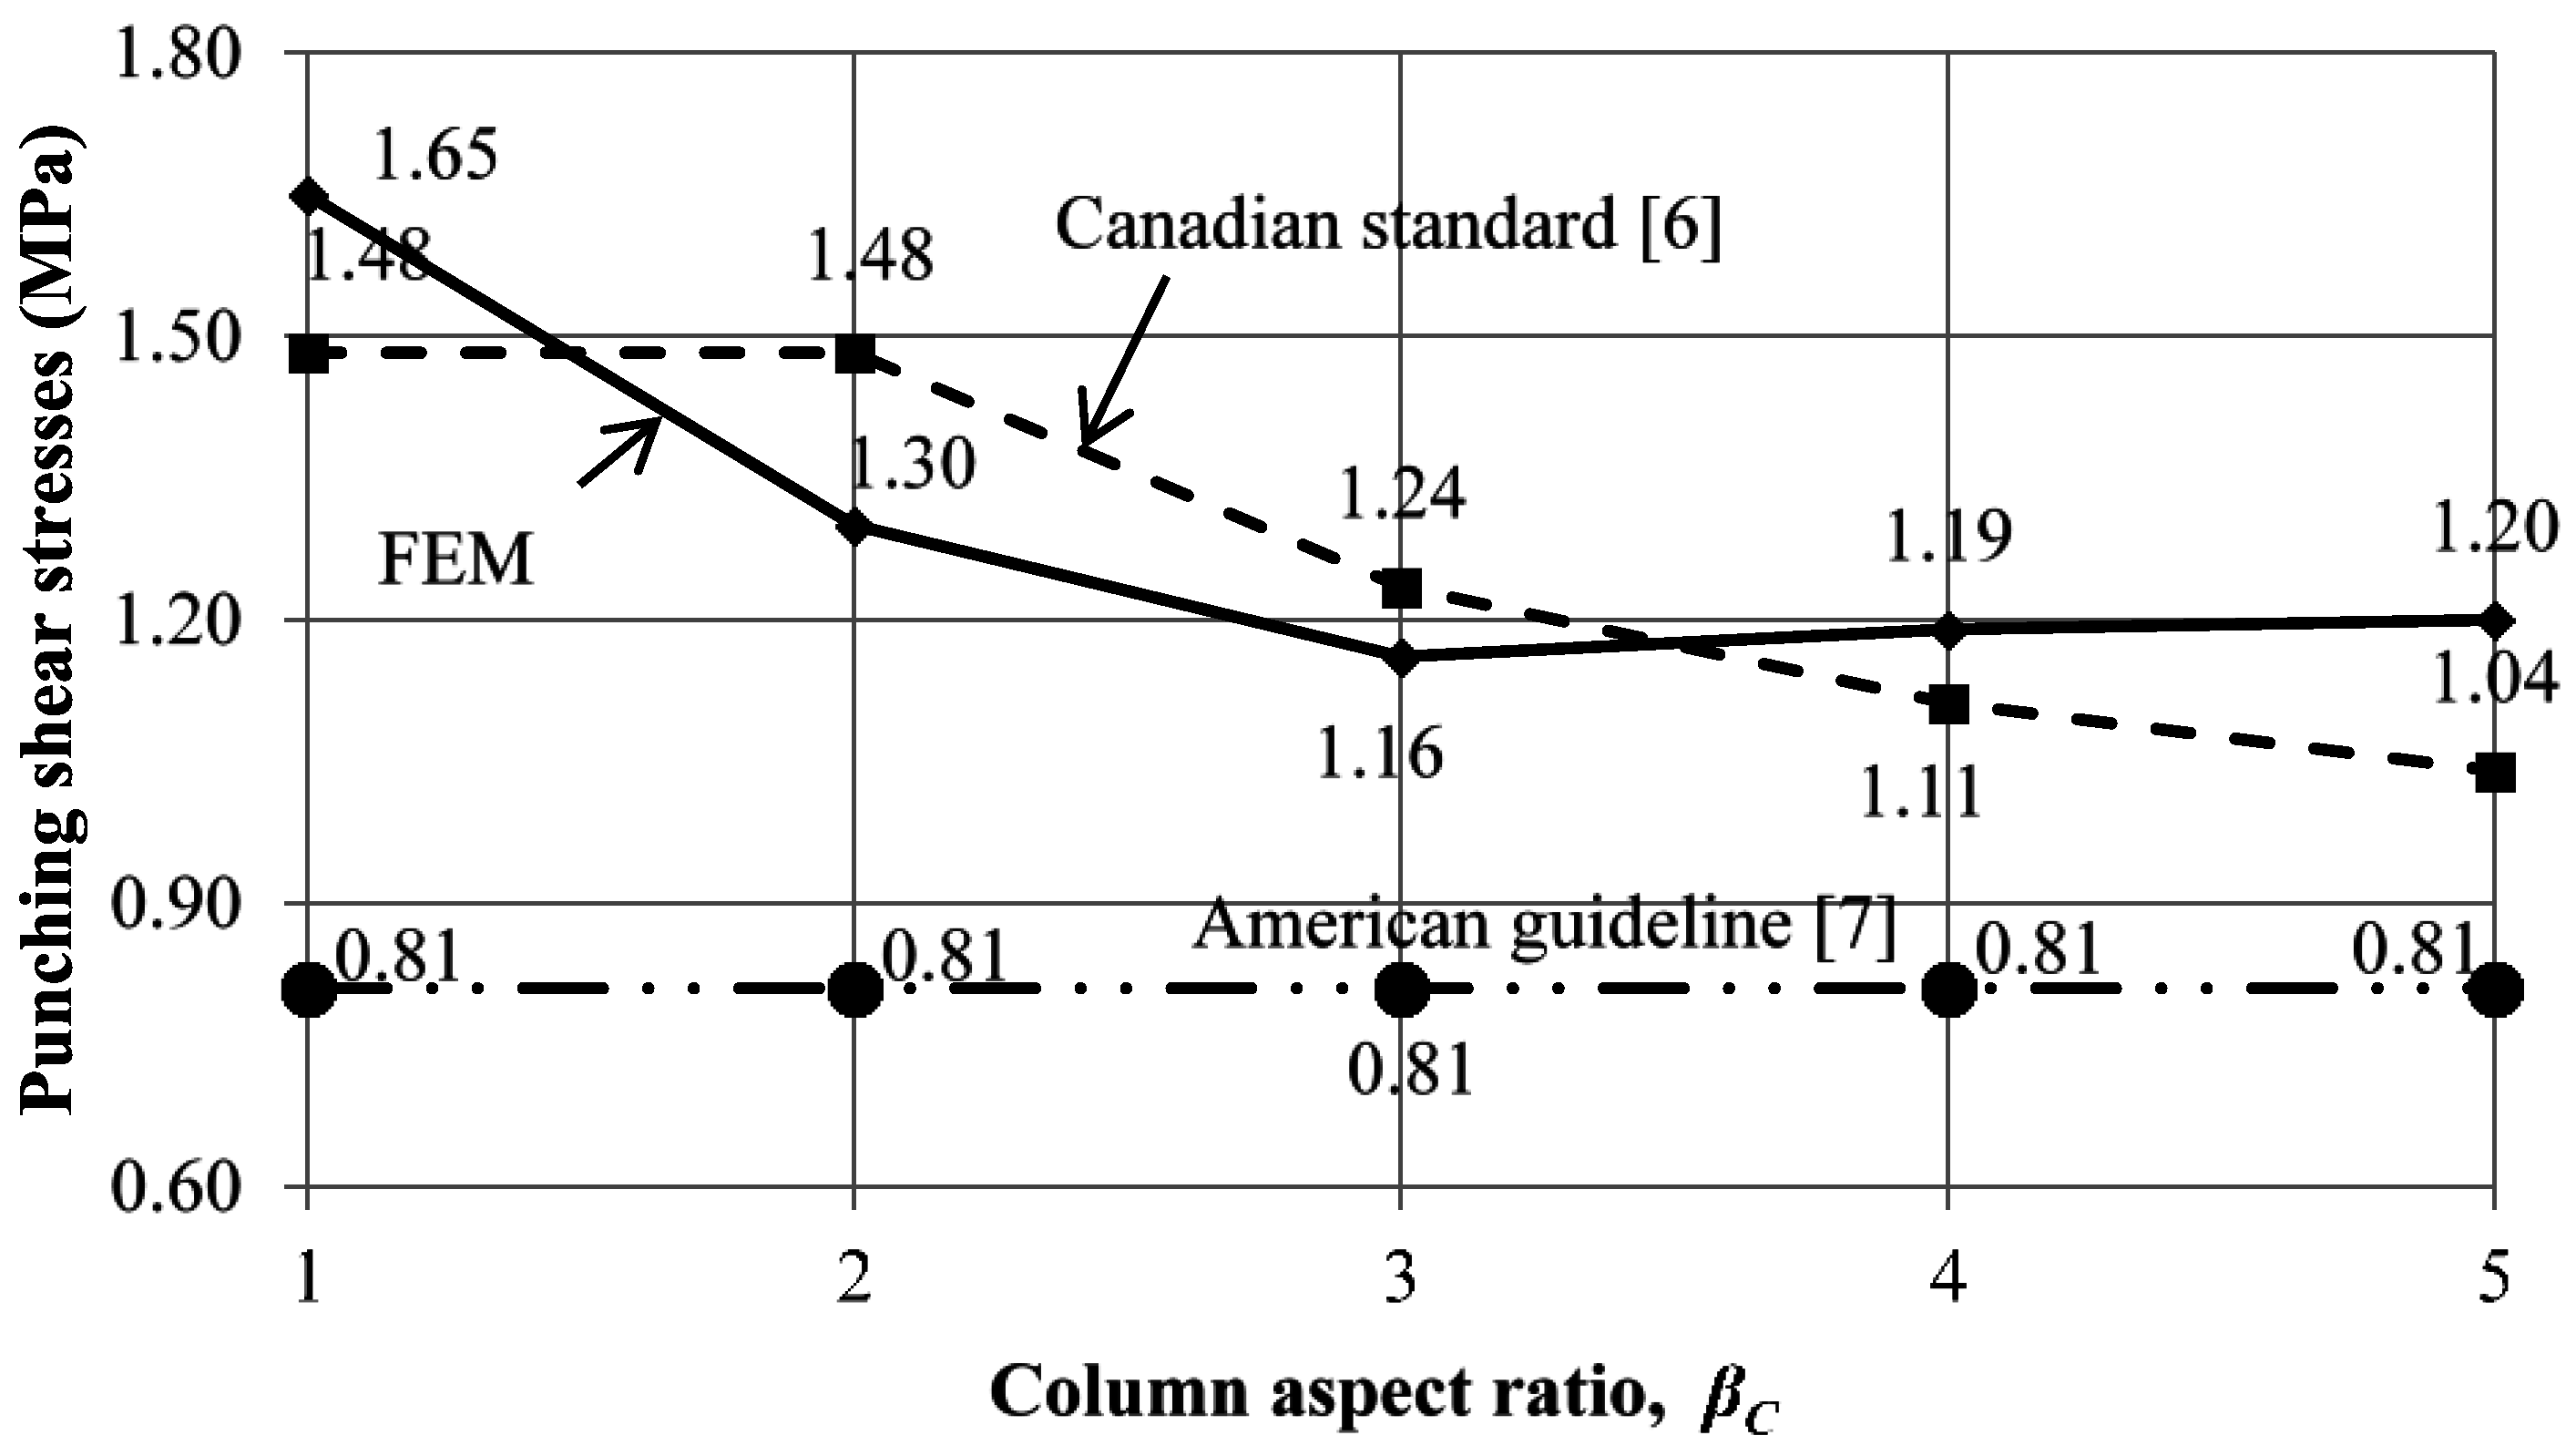
The relation between the column aspect ratio and the punching shear stresses calculated at 0.5
d (80 mm) from the column face at the failure stage is presented in
Figure 17. Also, the models showed that the punching shear stress at failure decreased by 30% up to column aspect ratio of 3.0; however, increasing the column aspect ratio from 3 to 4 increased the shear strength from 1.16 to 1.19 MPa. A further increase in the column aspect ratio (from 4 to 5) had no effect, and the stress remained unchanged. This indicates that the effect of column rectangularity vanishes after a value greater than three. These results are in very good agreement with the findings of the literature [
19] where several steel-RC interior slab-column connections with different column rectangularity were tested. According to the test results, it was found that the stresses at failure decreased up to a column aspect ratio equal to 3.0 and after that value, the stresses increased. Based on these results, it was concluded that the effect of the column rectangularity diminishes for ratios greater than three. Also, as seen in
Figure 17, the Canadian standard [
6] takes the effect of column rectangularity into consideration when it exceeds a value of two. In addition, the code predictions continue decreasing the punching shear stresses with increasing the column rectangularity. Again, the American guideline [
7] produced very conservative predictions for the capacity of the models with 0.81 MPa constant punching shear stresses.
Figure 16.
Load-strain relationship for the models with different column aspect ratios.
Figure 16.
Load-strain relationship for the models with different column aspect ratios.
Figure 17.
Relationship between the punching shear stress at failure and the column rectangularity.
Figure 17.
Relationship between the punching shear stress at failure and the column rectangularity.


