Article

Further Progress in Functional Interlayers with Controlled Mechanical Properties Designed for Glass Fiber/Polyester Composites

1
Remarkplast s.r.o., Luka 152, CZ-783 24 Luka, Czech Republic
2
Department of Mechanics, Biomechanics and Mechatronics, Czech Technical University in Prague, Technicka 4, CZ-166 07 Prague 6, Czech Republic
3
Composite Materials and Structures Center, Michigan State University, 2100 Engineering Building, East Lansing 48824, MI, USA
4
Institute of Materials Chemistry, Faculty of Chemistry, Brno University of Technology, Purkynova 118, CZ-612 00 Brno, Czech Republic
*
Author to whom correspondence should be addressed.
Submission received: 19 July 2018 / Revised: 7 August 2018 / Accepted: 14 August 2018 / Published: 16 August 2018
(This article belongs to the Special Issue Glass Fibers 2018)

Abstract

:
Compatible interlayers must be coated on reinforcing fibers to ensure effective stress transfer from the polymer matrix to the fiber in high-performance polymer composites. The mechanical properties of the interlayer, and its interfacial adhesion on both interfaces with the fiber and polymer matrix are among the key parameters that control the performance of polymer composite through the interphase region. Plasma-synthesized interlayers, in the form of variable materials from polymer-like to glass-like films with a Young’s modulus of 10–52 GPa, were deposited on unsized glass fibers used as reinforcements in glass fiber/polyester composites. Modulus Mapping (dynamic nanoindentation testing) was successfully used to examine the mechanical properties across the interphase region on cross-sections of the model composite in order to distinguish the fiber, the interlayer, and the modified and bulk polymer matrix. The interfacial shear strength for plasma-coated fibers in glass fiber/polyester composites, determined from the microindentation test, was up to 36% higher than those of commercially sized fibers. The effects of fiber pretreatment, single and double interlayers, and post-treatment of the interlayer on interfacial shear strength were also discussed. Functional interlayers with high shear yield strength and controlled physicochemical properties are promising for high-performance polymer composites with a controlled interphase.

Graphical Abstract

1. Introduction

Fiber-reinforced polymer composites are significant materials for transportation, building/construction, electrical/electronic applications, and consumer goods mainly because of their low density and high specific strength. The performance of the polymer composite is controlled by the properties of the fiber reinforcement, the polymer matrix, and the interphase [1], which is the region of material between the fiber and the polymer matrix responsible for the effective stress transfer from the matrix to the fiber. The composite interphase comprises a functional interlayer, and eventually, a modified matrix region. The functional interlayer is a material in the form of thin film that is deposited on the fiber surface to improve compatibility and create a strong but tenacious link between both components. The modified matrix is the part of the polymer matrix affected by the presence of the coated fiber. It is the interphase that is very important for the resultant performance of the composite material. Even reinforcing fibers with high modulus or high strength and polymers with high thermal or chemical resistance result in inefficient composites in the case of a poor interphase. The interphase is built in polymer composites using functional interlayers through fiber sizing, coating, or grafting in a wet chemical process or through chemical vapor deposition [2].
Investigating interphase properties is very important for understanding its functionality and the possibility of its optimization for a specific composite system, i.e., the fiber and the polymer matrix. The reinforcement and the polymer matrix are mostly very different materials in terms of their mechanical, electrical, and chemical properties. The interphase can, therefore, be identified between the two composite phases based on differences in material structure, Young’s modulus, hardness, coefficient of friction, dielectric permittivity, elemental composition, or chemical structure. The cross-section of the polymer composite was investigated using microscopic infrared spectroscopy [3]; however, the interphase region is tiny since the interphase thickness is generally less than several microns, and nanoscale imaging techniques are necessary to ensure sufficient lateral resolution. Transmission electron microscopy (TEM) has sufficient lateral resolution to distinguish the interphase region based on differences in the atomic mass of the elements, and even the element composition profile across the composite phases can be determined using electron energy loss spectroscopy (EELS) [4,5]. The results show some limitations depending on the technique used to fabricate a sample for TEM imaging, such as focus ion beam (FIB), ion beam etching, and ultramicrotomy [6].
Another principal technique suitable for interphase characterization is atomic force microscopy (AFM), which is used in different modes. Standard AFM tips with a radius of less than 10 nm provide sufficient lateral resolution. Electrostatic force microscopy (EFM) is one of the modes used to measure electrostatic interactions between the AFM tip and the composite phases made from dielectric materials. The interaction is sensitive to charge distribution or local differences in dielectric permittivity of composite phases [7]. During scanning in phase-imaging AFM mode, the oscillating tip is influenced by contact with composite components of different viscoelastic properties, resulting in a phase shift of the tip against the applied oscillating force. The interphase area can be identified due to changes in phase distribution over the sample surface [8,9]. Similarly, lateral force microscopy using AFM contact mode can be used to characterize the distribution of lateral forces on the sample surface to distinguish the interphase area due to a different coefficient of friction [9]. In this mode, the constant force-feedback on the sample adjusts the height of the AFM cantilever to compensate for the topographic features of the surface, and the torsion of the cantilever bearing the tip characterizes lateral forces as a result of surface friction. In the intermodulation AFM, the cantilever is simultaneously excited by two frequencies near the resonance, and the cantilever response at a new frequency contains information on the surface mechanical properties of the composite sample [10]. Atomic force acoustic microscopy (AFAM) is a combination of ultrasonics with AFM, where the composite sample is excited with ultrasonic frequency by means of a piezoelectric transducer that causes vibrations of the sample surface, and the vibration behavior of the AFM cantilever in contact with the surface of the sample is sensitive to its local elastic properties [9,11]. All of the aforementioned AFM modes have some limitations in order to sufficiently differentiate the interphase region.
The difference between the mechanical properties of composite constituents is sufficient to potentially distinguish the interphase region. Nanoindentation techniques [12,13] are, therefore, ideal for characterizing the distribution of mechanical properties across the fiber/matrix interface in terms of Young’s modulus and hardness. Quantitative nanomechanical measurements are possible, starting with forces ≤1 µN, but the lateral resolution is not as high as in AFM measurements due to a higher radius of commercially available diamond indenters with a radius of 50 nm (Berkovich) or 40 nm (cube corner). However, nanoindentation together with nanoscratch measurements is influenced by fiber constraint [8], because the indenter induces stress near the fiber surface, and the critical distance is approximately twenty times the indentation depth [14,15]. Dynamic nanoindentation may be operated as a Modulus Mapping mode that appears to be more suitable for observing the cross-section of the composite sample using detailed maps of the complex modulus, the storage, and the loss modulus, just a few nanometers below the sample surface, thereby avoiding the fiber constraint [9,16]. This technique is carried out by superimposing a small sinusoidal force on a greater but constant force during the indentation test.
Recently, force mapping spectroscopy (nanomechanical mapping) [17,18,19,20,21] was applied in order to characterize the interphase region in polymer composites and nanocomposites. In this AFM mode, a force–distance curve is recorded in each pixel of the map, and a linear portion of this curve corresponding to an elastic regime is used to determine the Young’s modulus using the Derjaguin–Muller–Toporov (DMT) model. However, the determined values of Young’s modulus are not realistic for the range of moduli from the polymer matrix to the reinforcement, and they are strongly affected by the surface topography of the composite sample. It was found that surface formations (grains), with a radius similar or larger than that of the AFM tip or diamond indenter, have a critical influence on probe (AFM or nanoindentation) measurements used to characterize mechanical properties based on the geometry of contact between the tip and the sample [22].
Plasma-enhanced chemical vapor deposition (PECVD) is a technique for depositing thin films with controlled mechanical properties [23], which are intended to be used as functional interlayers for glass fiber/polyester composites in order to improve their interfacial shear strength (IFSS). This study is focused on examining the mechanical properties of such interlayers in model composites using Modulus Mapping based on our previous experience [9]. Selected interlayers with controlled mechanical and chemical properties were tested to determine how they affect the IFSS in glass fiber/polyester composites determined by the microindentation test [24]. Also, the effects of pretreatment, plasma coating (thin-film deposition), and post-treatment of glass fibers (GF) on determined IFSS were firstly discussed.

2. Materials and Methods

2.1. Thin-Film Deposition

A plasma reactor [25] equipped with a radio-frequency (RF; 13.56 MHz) capacitive coupling system using asymmetric plan-parallel plate electrodes was employed to deposit thin films on silicon wafers (polished on both sides (1 0 0) with an overlayer of native SiO2 (3 nm), infrared (IR), transparent, 0.8 × 10 × 10 mm3; ON Semiconductor, Roznov pod Radhostem, Czech Republic) and single GFs (unsized (bare) E-glass, 1200 tex, mean diameter 19 µm; Saint-Gobain Adfors, Litomysl Czech Republic). Fifteen GFs separated from the GF bundle were placed parallel to each other on silicon wafers and fixed with adhesive carbon tape suitable for vacuum applications. Hydrogenated amorphous carbon-silicon (a-CSi:H) films were deposited from pure tetravinylsilane (TVS; Si–(CH=CH2)4 purity 97%, Sigma Aldrich, Prague, Czech Republic) precursor, and hydrogenated amorphous carbon-silicon oxide (a-CSiO:H) films were deposited from TVS in a mixture with oxygen gas (TVS/O2 mixture) using PECVD. Firstly, the silicon wafer (alone or with single GFs) was loaded into the RF bottom electrode, and the plasma reactor was evacuated to a basic pressure of 1 × 10⁻⁵ Pa. Then, the silicon wafer was pretreated with argon (Ar) plasma (10.0 sccm, 5.7 Pa, continuous wave 5.0 W) for 10 min to remove adsorbed gases and to ensure the reproducible adhesion of deposited films. The a-CSi:H or a-CSiO:H films were deposited using pulsed plasma at a mass flow rate of 3.8 sccm, a pressure of 2.7 Pa, and an effective power of 2.0–10 W. The effective power, Weff, was set by changing the ratio of the time the plasma is switched on, ton, to the period, T, defined as T = ton + toff, and thus, Weff = ton/T × Wtotal, where toff is the time the plasma is switched off and Wtotal is the total RF power. An oxygen fraction of 0.92 was used for the TVS/O2 mixture as the mass flow rates for TVS and O2 gas were 0.30 sccm and 3.5 sccm, respectively. A movable shutter was used to deposit the films in steady-state plasma conditions monitored by mass spectrometry (Process Gas Analyser HPR-30, Hiden Analytical, Warrington, UK). When the deposition process was completed, the plasma reactor was flushed with Ar gas (10.0 sccm, 5.7 Pa) to remove residual gases for 60 min, and the reactor was then evacuated to a basic pressure of 1 × 10⁻⁵ Pa. The deposited sample was moved to the load-lock chamber after 12 h, and the chamber was then flooded with air to atmospheric pressure [25].
Another plasma reactor [26], an RF helical coupling system operated in a pulsed regime, was used to deposit (PECVD) thin films on special glass slides without flaws (1.0 × 26 × 76 mm3; Knittel Glaser, Braunschweig, Germany), silicon wafers, and GF bundles specified above. This cylindrical discharge is axially symmetrical, and therefore, more suitable for film deposition on the GF bundle mounted in the discharge axis. This plasma reactor was first evacuated to a basic pressure of 5 × 10⁻⁴ Pa. The planar substrate or GF bundle was pretreated with O2 plasma (5.0 sccm, 4.0 Pa, 25 W) for 60 min to desorb gases and remove hydrocarbons from the substrate surface (planar or fibrous). The oxygen fraction X = O2/(TVS + O2) in the gas mixture was varied from 0–0.46 (0, 0.10, 0.21, 0.33, and 0.46) at a total flow rate (TVS + O2) of 0.80 sccm, and the corresponding pressure was 1.4 Pa. To deposit all films, an effective power of 5.0 W (time-on pulse, period, and total power were 1 ms, 10 ms, and 50 W, respectively) was used. Finally, after film deposition, the apparatus was flushed with Ar gas (10.0 sccm, 10 Pa). After 60 min, the reactor was evacuated to a basic pressure, and, after 12 h, was flooded with air at atmospheric pressure.

2.2. Thin-Film Analysis

The thickness of the films deposited on the silicon wafers was determined using a phase-modulated spectroscopic ellipsometer, UVISEL (HORIBA Scientific, Longjumeau, France), at a wavelength of 250–830 nm in a 2-nm step; the angle of incidence was 70° and the spot size was 100 × 300 μm2. The average deposition rate was given by the ratio of film thickness to deposition time. The thickness of the film deposited on planar or fibrous substrate was controlled by the deposition time at a constant deposition rate.
Infrared measurements in the 500–4000 cm−1 wavenumber range were made using a VERTEX 80 vacuum Fourier-transform infrared (FTIR) spectrometer (Bruker Optics, Billerica, MA, USA). Transmission spectra were obtained on films deposited on infrared-transparent silicon wafers. To remove the spectral properties of the silicon wafer, an absorption-subtraction technique was used, and background correction was carried out before each measurement. The spectral resolution was 4 cm−1, and 256 scans were recorded in order to achieve a reasonable signal-to-noise ratio. The bulk chemical composition of the thin films was investigated using conventional and resonant Rutherford backscattering spectrometry (RBS) and elastic recoil detection analysis (ERDA) methods on a Tandetron 4130MC accelerator (High Voltage Engineering Europa B.V., Amersfoort, The Netherlands (HVEE)) using 2.73-MeV alpha particles.
The Young’s modulus of the films deposited on the silicon wafers was determined with the Oliver–Pharr method [27] from nanoindentation measurements using a two-dimensional (2D) TriboScope (Hysitron, Eden Prairie, MN, USA) attached to an NTegra Prima Scanning Probe Microscope (NT-MDT), Zelenograd, Russia. A Berkovich tip with a radius of curvature of 50 nm was used. The experiment was performed in cyclic mode to obtain the depth profile of Young’s modulus to 15–20% of the film thickness, applying 19 loading and partial unloading cycles in a single indentation, while the unloading fraction was kept constant at 0.8, and the loading was increased using a displacement exponent of 2 (exponential function) [28]. The experimental depth profile was extrapolated to the zero-contact depth (film surface) to estimate the correct Young’s modulus of the film not influenced by the substrate properties [29].

2.3. Sample Preparation and Modulus Mapping

After thin-film deposition, 15 GFs fixed with adhesive carbon tape were transferred from the silicon wafer into a silicon rubber mold, which was filled with unsaturated polyester resin (isophthalic) Viapal HP 349 F (Sirca S. p. A., Sandono di Massanzago, Italy), and cured at 140 °C to form a polymer block, 5 × 13 × 25 mm3 with unidirectional fibers. This block was inserted into the metallographic sample holder with GFs placed normally to the sample surface, and the surface was polished using conventional metallographic techniques.
The mechanical properties of the interphase region around a single GF in the polyester matrix were characterized using a Hysitron TI 950 TriboIndenter nanomechanical test instrument (Hysitron, Eden Prairie, MN, USA) with a nanoDMA III (Dynamic Mechanical Analysis) package. The Modulus Mapping mode combines the in situ scanning probe microscopy (SPM) imaging capability of Hysitron’s nanomechanical testing instruments with the ability to perform nanoDMA III tests. During the test, the indenter is scanned over the surface to image the topography of the sample. During scanning, the probe is oscillated with the specified frequency and amplitude of the load. The resulting signal from the transducer is then analyzed to determine the displacement amplitude and phase delay of the oscillation at each pixel in the image [9]. The software plots these measurements in separate image files, and after scanning is complete, the images can be analyzed to determine the storage, E’, and loss, E’’, modulus at each point using the following equations:
E = k s π 2 A , E = ω C s π 2 A
where ks and Cs are the stiffness and damping of the specimen determined from the displacement amplitude and phase difference between the force and the displacement, A is the projected contact area, and ω is the frequency used [27,30]. A cube diamond indenter (NorthStar, Hysitron, Eden Prairie, MN, USA) with a radius of curvature of 40 nm was used for Modulus Mapping. The amplitude of a dynamic force of 5 μN at an oscillation frequency of 220 Hz was superimposed to a normal contact force of 15 μN in order to maintain the dynamic displacement amplitude at 4 nm when scanning the sample surface in an in situ SPM mode. The radius of the tip was carefully calibrated using Modulus Mapping in standard silica at the above conditions, and with the same displacement as in the test specimen. The map resolution in the 3 × 3 µm2 scan area was 256 × 256 pixels.

2.4. Composite Fabrication and Microindentation Test

After the GF bundle was surface-modified in an RF helical coupling system, the bundle was impregnated with unsaturated polyester resin and then axially placed in a silicon rubber mold that was filled with resin, before being cured at 140 °C to form a polymer disc of 14 mm in diameter and 5 mm in height [31]. Similar to the resin block with unidirectional fibers, the disc was embedded in a metallographic specimen and polished using conventional metallographic techniques.
The polished cross-section of the composite, with the fibers normal to the surface of the sample 3 mm high, was used to characterize the interfacial adhesion of GF in the polyester matrix using the microindentation test [24]. Using an Interfacial Testing System (ITS) (Dow Chemical Company, Midland, MI, USA) [32], a diamond tip with a diameter of 12 µm was applied to push the single fiber from its surrounding polyester resin. The tested fiber was indented at increased normal loading until failure of adhesion. The de-bonding of the fiber is visible as a dark shadow around the fiber. When the shadow appears around the fiber at an angle of between 90° and 120°, the fiber is considered to be de-bonded [32]. The IFSS was determined from the de-bond load, P, using a generalized empirical equation,
I F S S = A P D 2 [ B ( G m E f ) 1 2 C log ( d D ) E ]
where D is the fiber diameter, Gm and Ef are the matrix shear modulus and fiber axial modulus, respectively, d is the matrix thickness between the tested fiber and its nearest neighbor, and A = 1.249 × 10⁴, B = 0.8757, C = 0.01863, and E = 0.02,650. A matrix shear modulus of 1.5 GPa and a fiber axial modulus of 73 GPa correspond to the polyester resin used and the GF, respectively [32].

3. Results

3.1. Mapping of Storage Modulus across the Interphase Region

Two polymer blocks, 5 × 13 × 25 mm3, each with 15 unidirectional fibers (mean diameter 19 µm) embedded in polyester resin, were fabricated using unsized and commercially sized GFs to examine the interphase region with Modulus Mapping. The commercial sizing based on silane coupling agents was designated by the GF manufacturer for GF/polyester composites. After polishing, the metallographic specimen with GFs placed normally to the surface was scanned in a 3 × 3 µm
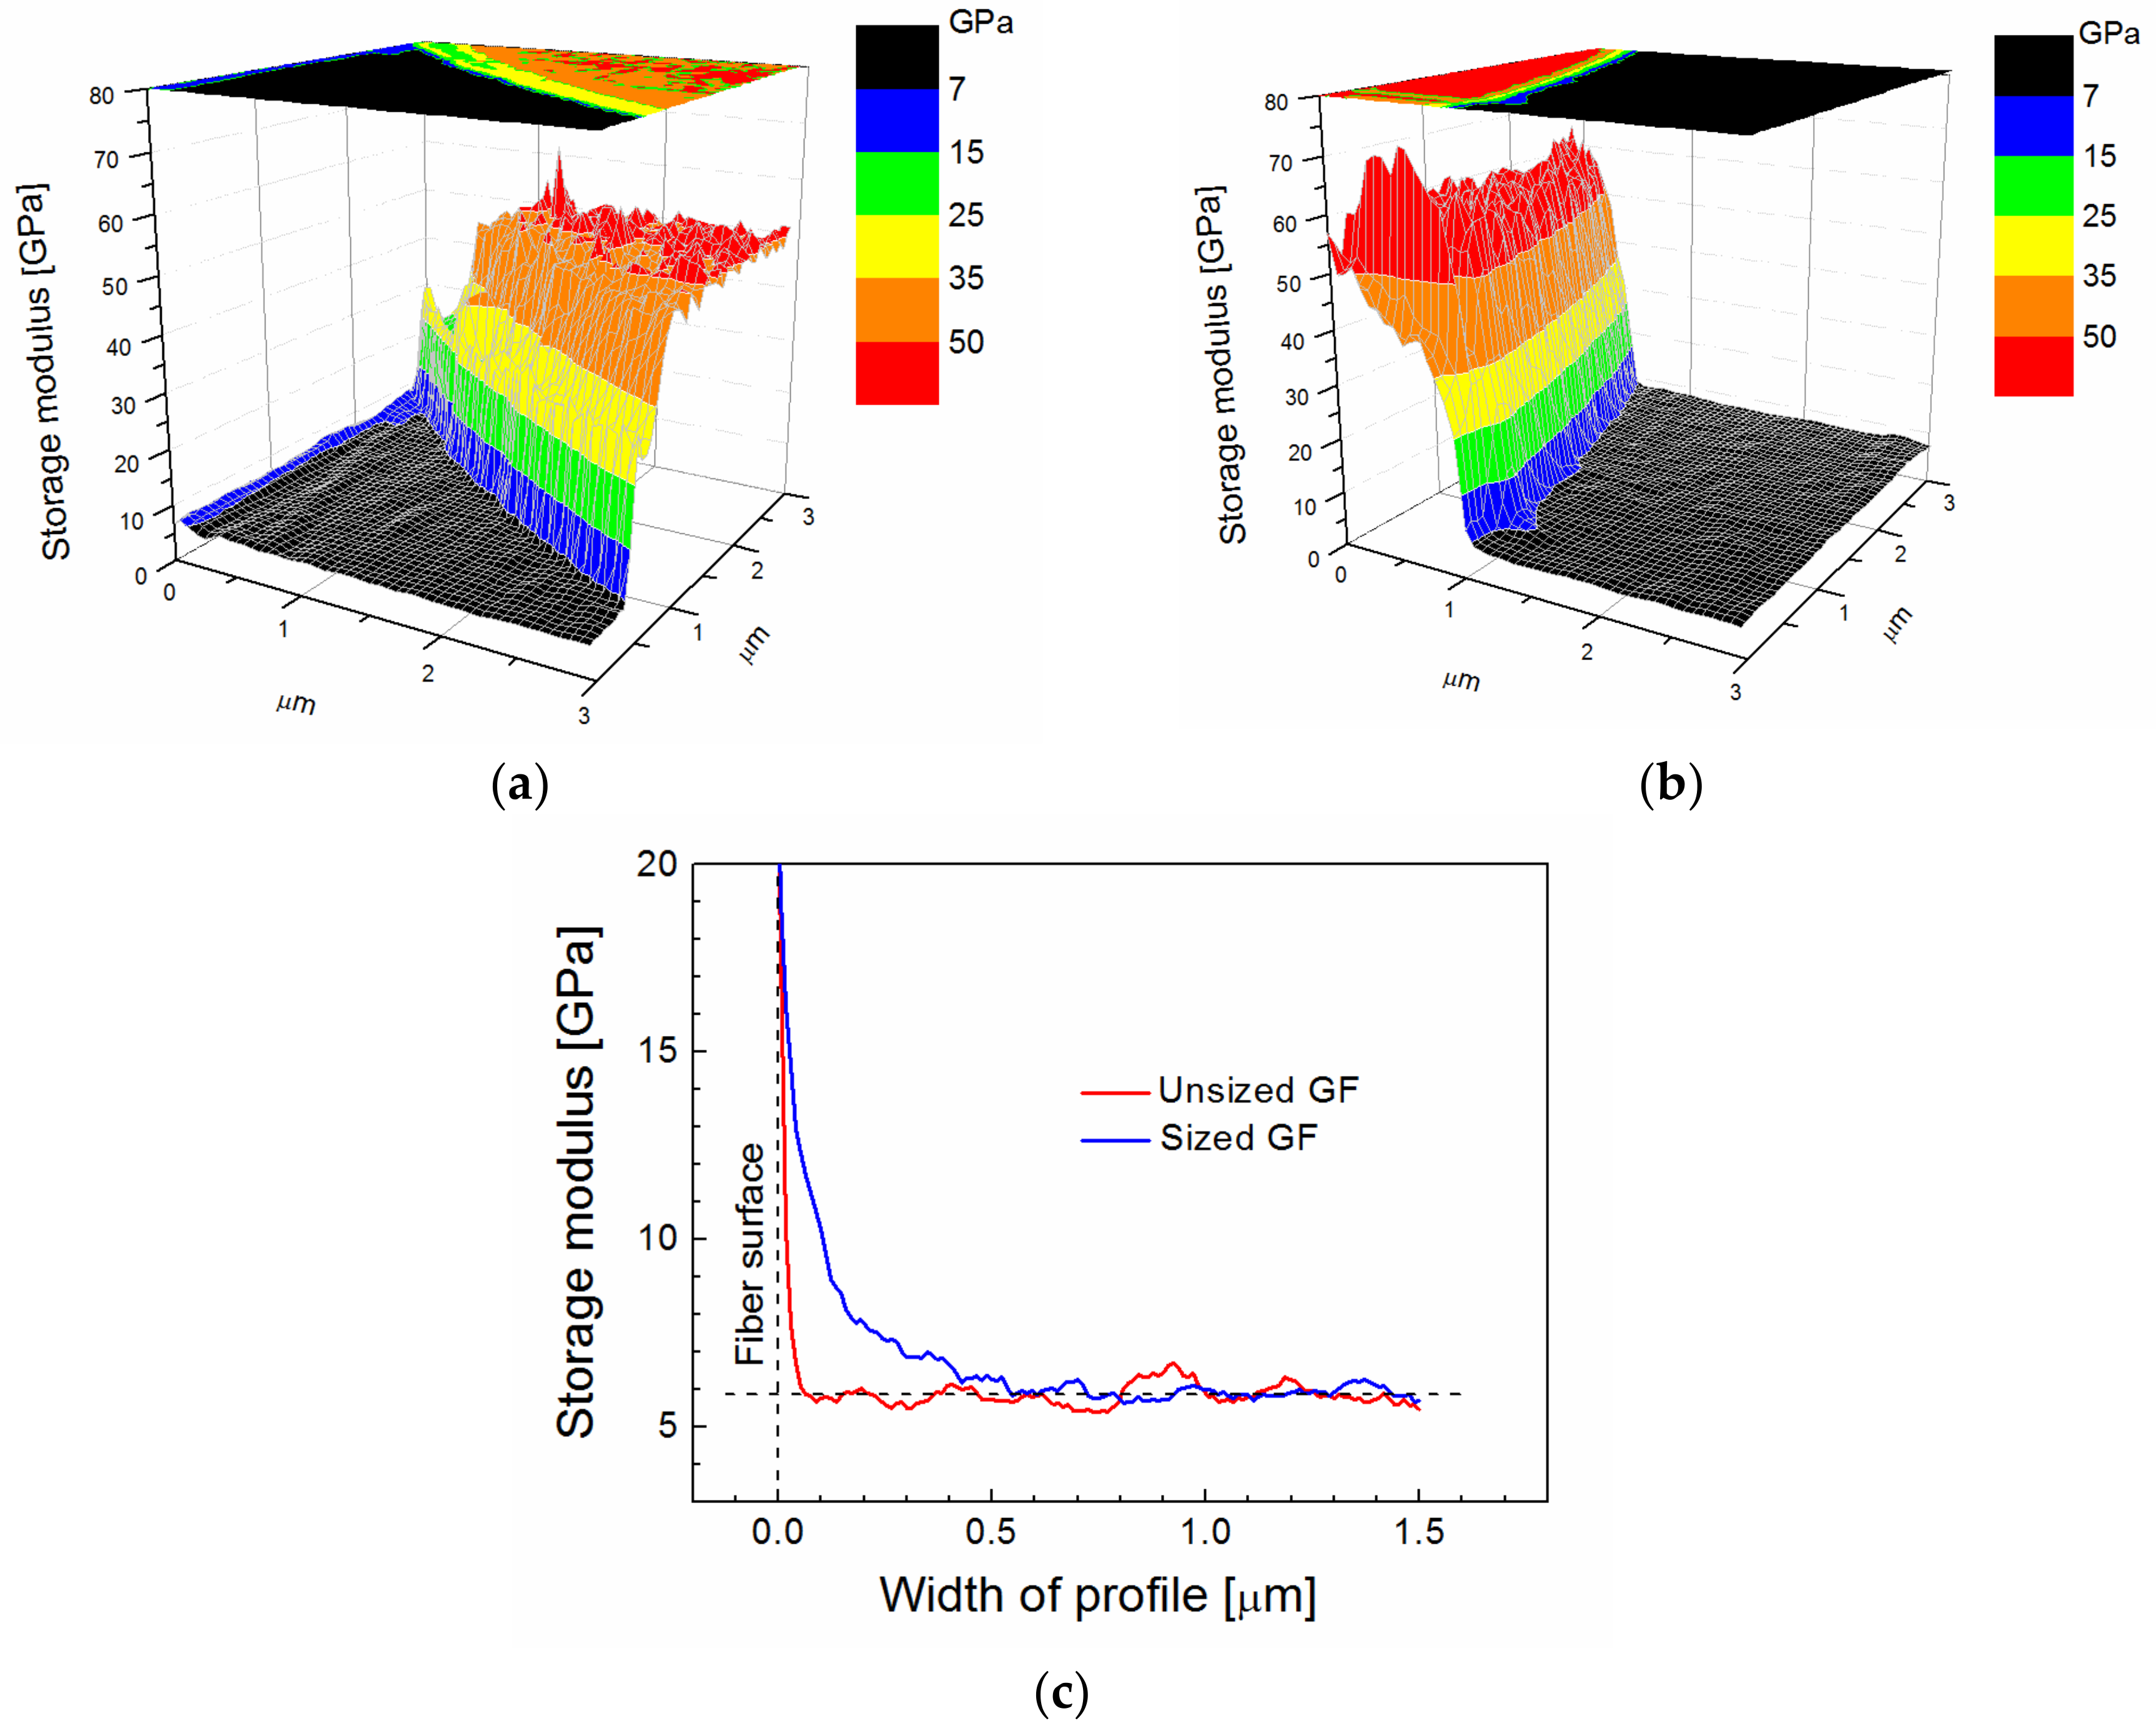
2 area using a cube corner indenter with a radius of 40 nm. The storage modulus across the fiber/polymer interface for the unsized GF is shown in Figure 1a. A three-dimensional (3D) image with a storage modulus in a color scale, which is used for better orientation, shows the black area corresponding to the polymer matrix and a part of the fiber with a sharply raised modulus at the fiber/polymer interface. The 2D projection of the storage modulus is visible at the top of Figure 1a. A similar image of the storage modulus was obtained for the commercially sized GF (Figure 1b). The detailed profile of the storage modulus close to the fiber/polymer interface (Figure 1c) enabled the finding of characteristic differences. The red line for the unsized GF rises in the immediate vicinity of the fiber surface, and the 0.07-µm-thick area on which the modulus was changed corresponds to the fiber constraint area rather than the interphase region. However, the blue line corresponding to the commercially sized GF indicates the wider area of the modulus change that can be assigned to the interphase region with a thickness of 0.5 µm. The interphase region around the commercially sized GF was non-regular, and the thickness varied from 0.1 (GF without sizing) to 0.5 µm. The storage modulus for the polyester resin outside the interphase region was approximately 6 GPa, as shown in Figure 1c, which appears to be a little overvalued because a Young’s modulus of 4 GPa was evaluated from the quasi-static tensile test of the polyester resin. An increased storage modulus was found in the subsurface layer up to a depth of 40 nm of metallographic specimen, probably due to resin polishing.
The polymer-like a-CSi:H film was deposited (68.7 nm/min) on single GFs and silicon wafers at an effective power of 2.0 W (time-on pulse, period, and total power were 1 ms, 5 ms, and 10 W, respectively) from a pure TVS precursor using the plasma reactor with plan-parallel electrodes. The film thickness was 895 nm, which was determined from the ellipsometric spectrum of the film on the silicon wafer, and we expect that approximately the same thickness of the film was deposited on the GFs. A Young’s modulus of 10.0 ± 0.5 GPa was evaluated for the film on the silicon wafer using cyclic nanoindentation measurements. RBS/ERDA spectra of a-CSi:H film allowed determining the chemical composition and calculating the element ratios to the silicon concentration, resulting in a stoichiometric formula a-C5.6Si:H5.0. The high concentration of hydrogen (43 atom%) that is bonded to silicon and carbon atoms is responsible for the relatively low cross-linking of the mainly carbon network in the a-CSi:H film, resulting in the low Young’s modulus that corresponds to a polymer-like material. GFs coated with this interlayer (a-C5.6Si:H
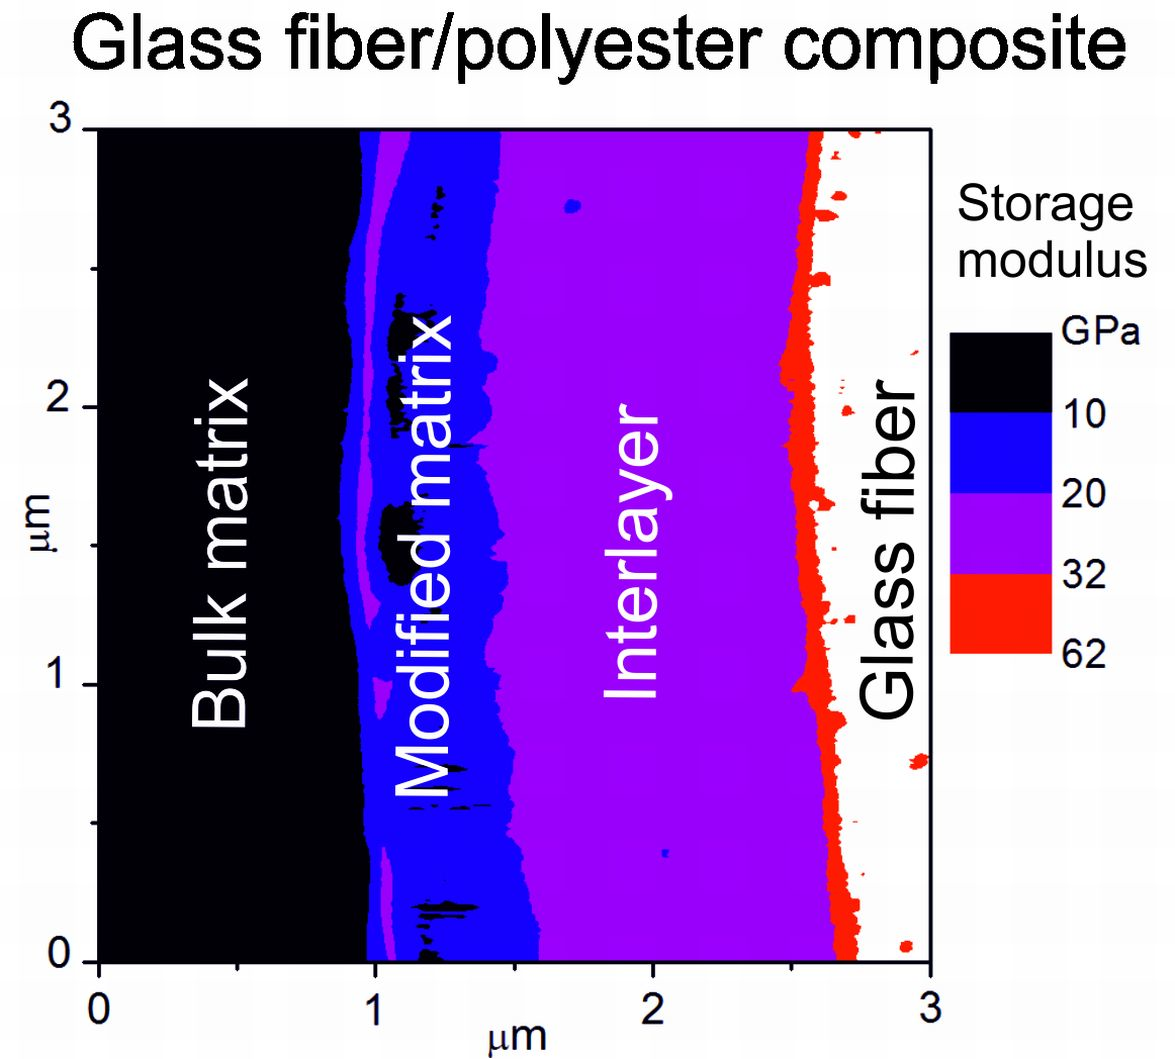
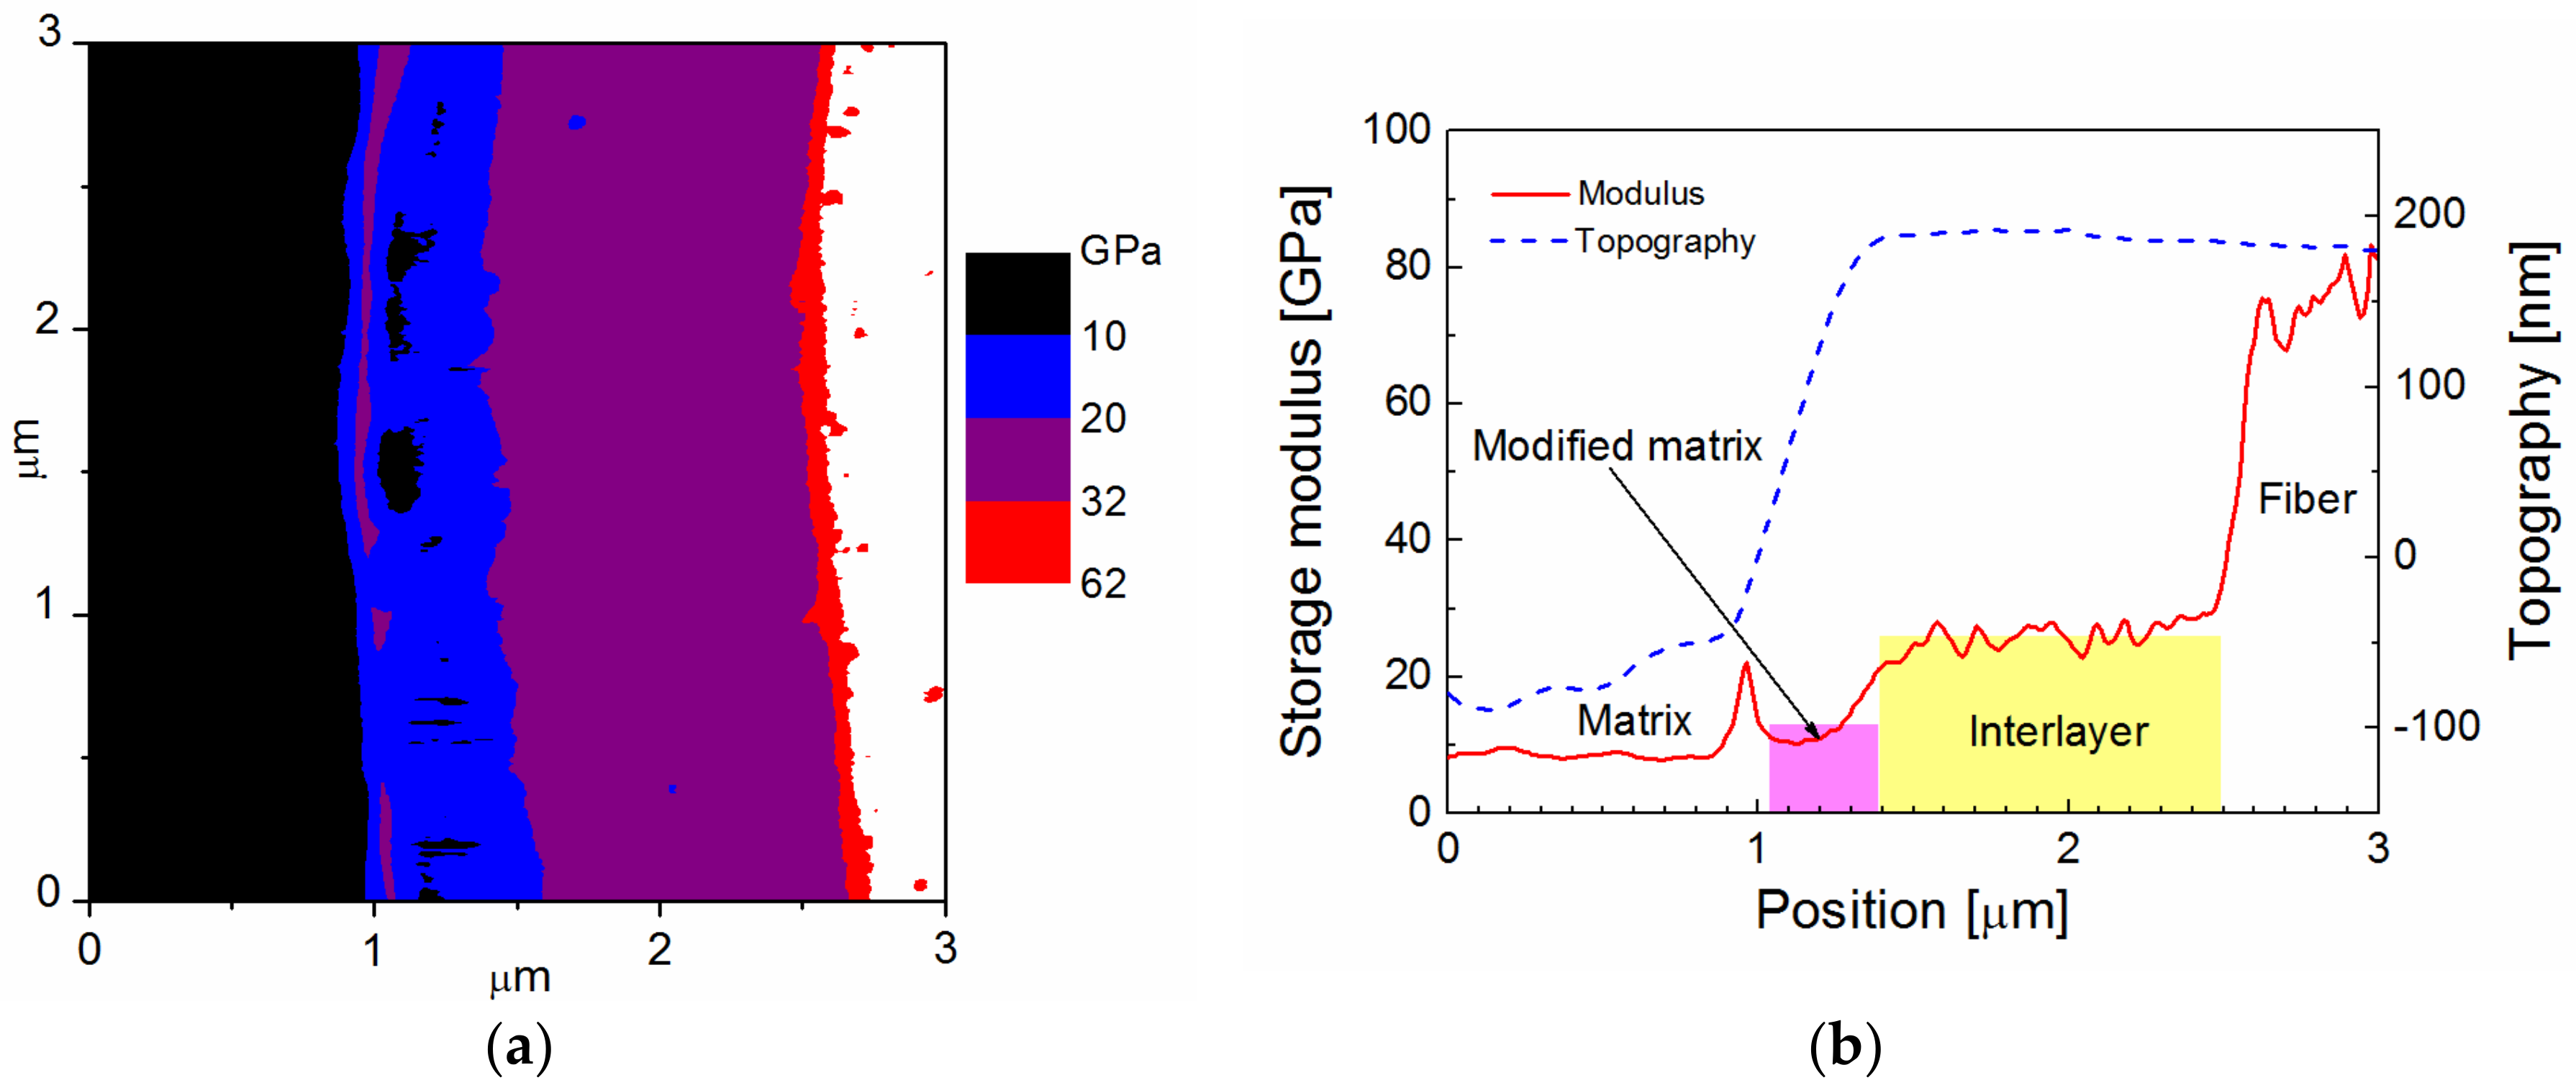
5.0 film) were inserted in polyester resin to fabricate a model composite, whose cross-section was analyzed with Modulus Mapping to distinguish the interlayer between the fiber and the polymer matrix, and to characterize its mechanical properties. The storage modulus in a color scale across the interphase region in a model GF/polyester composite is shown in Figure 2a. The lateral resolution of this map is 11.7 nm. The scan area of 3 × 3 µm2 shows the white area with a modulus above 62 GPa corresponding to GF surrounded by a ring with a modulus similar to the polymer matrix (black area on the left) with a blue contour. Profiles of the storage modulus (red line) and surface topography (blue line), corresponding to the GF with the polymer-like interlayer, are plotted in Figure 2b. Interpretation of mechanical properties is not easy due to the surface topography of the composite sample marked with a blue dashed line. Generally, the indentation measurement analysis is based on the assumption that the process is initiated by penetrating the indenter into a flat surface. The influence of surface roughness on nanoindentation measurements was interpreted using model simulations [22]. The polymer composite is a hybrid material, and its polished surface exhibits roughness in the interphase region due to the different mechanical properties of the composite phases. Based on the thickness of the interlayer, its position is expected at the GF surface, indicated by the yellow area in Figure 2b. At the interface between the interlayer and the polymer matrix, there is an elevated modulus, but it is an artefact due to the side contact of the indenter with the rough surface of the composite sample. In this case, the measured contact stiffness is higher than that corresponding to the flat surface, and the projected contact area is underestimated, resulting in an overestimated storage modulus. The slope of the surface across the interlayer provides a slightly underestimated modulus, corresponding to model simulations [22], but part of the interlayer close to the interlayer/fiber interface corresponds to the correct value of the storage modulus of 10 GPa. The surface roughness of the interphase region complicates the differentiation between the polymer-like interlayer and the polymer matrix with similar mechanical properties.
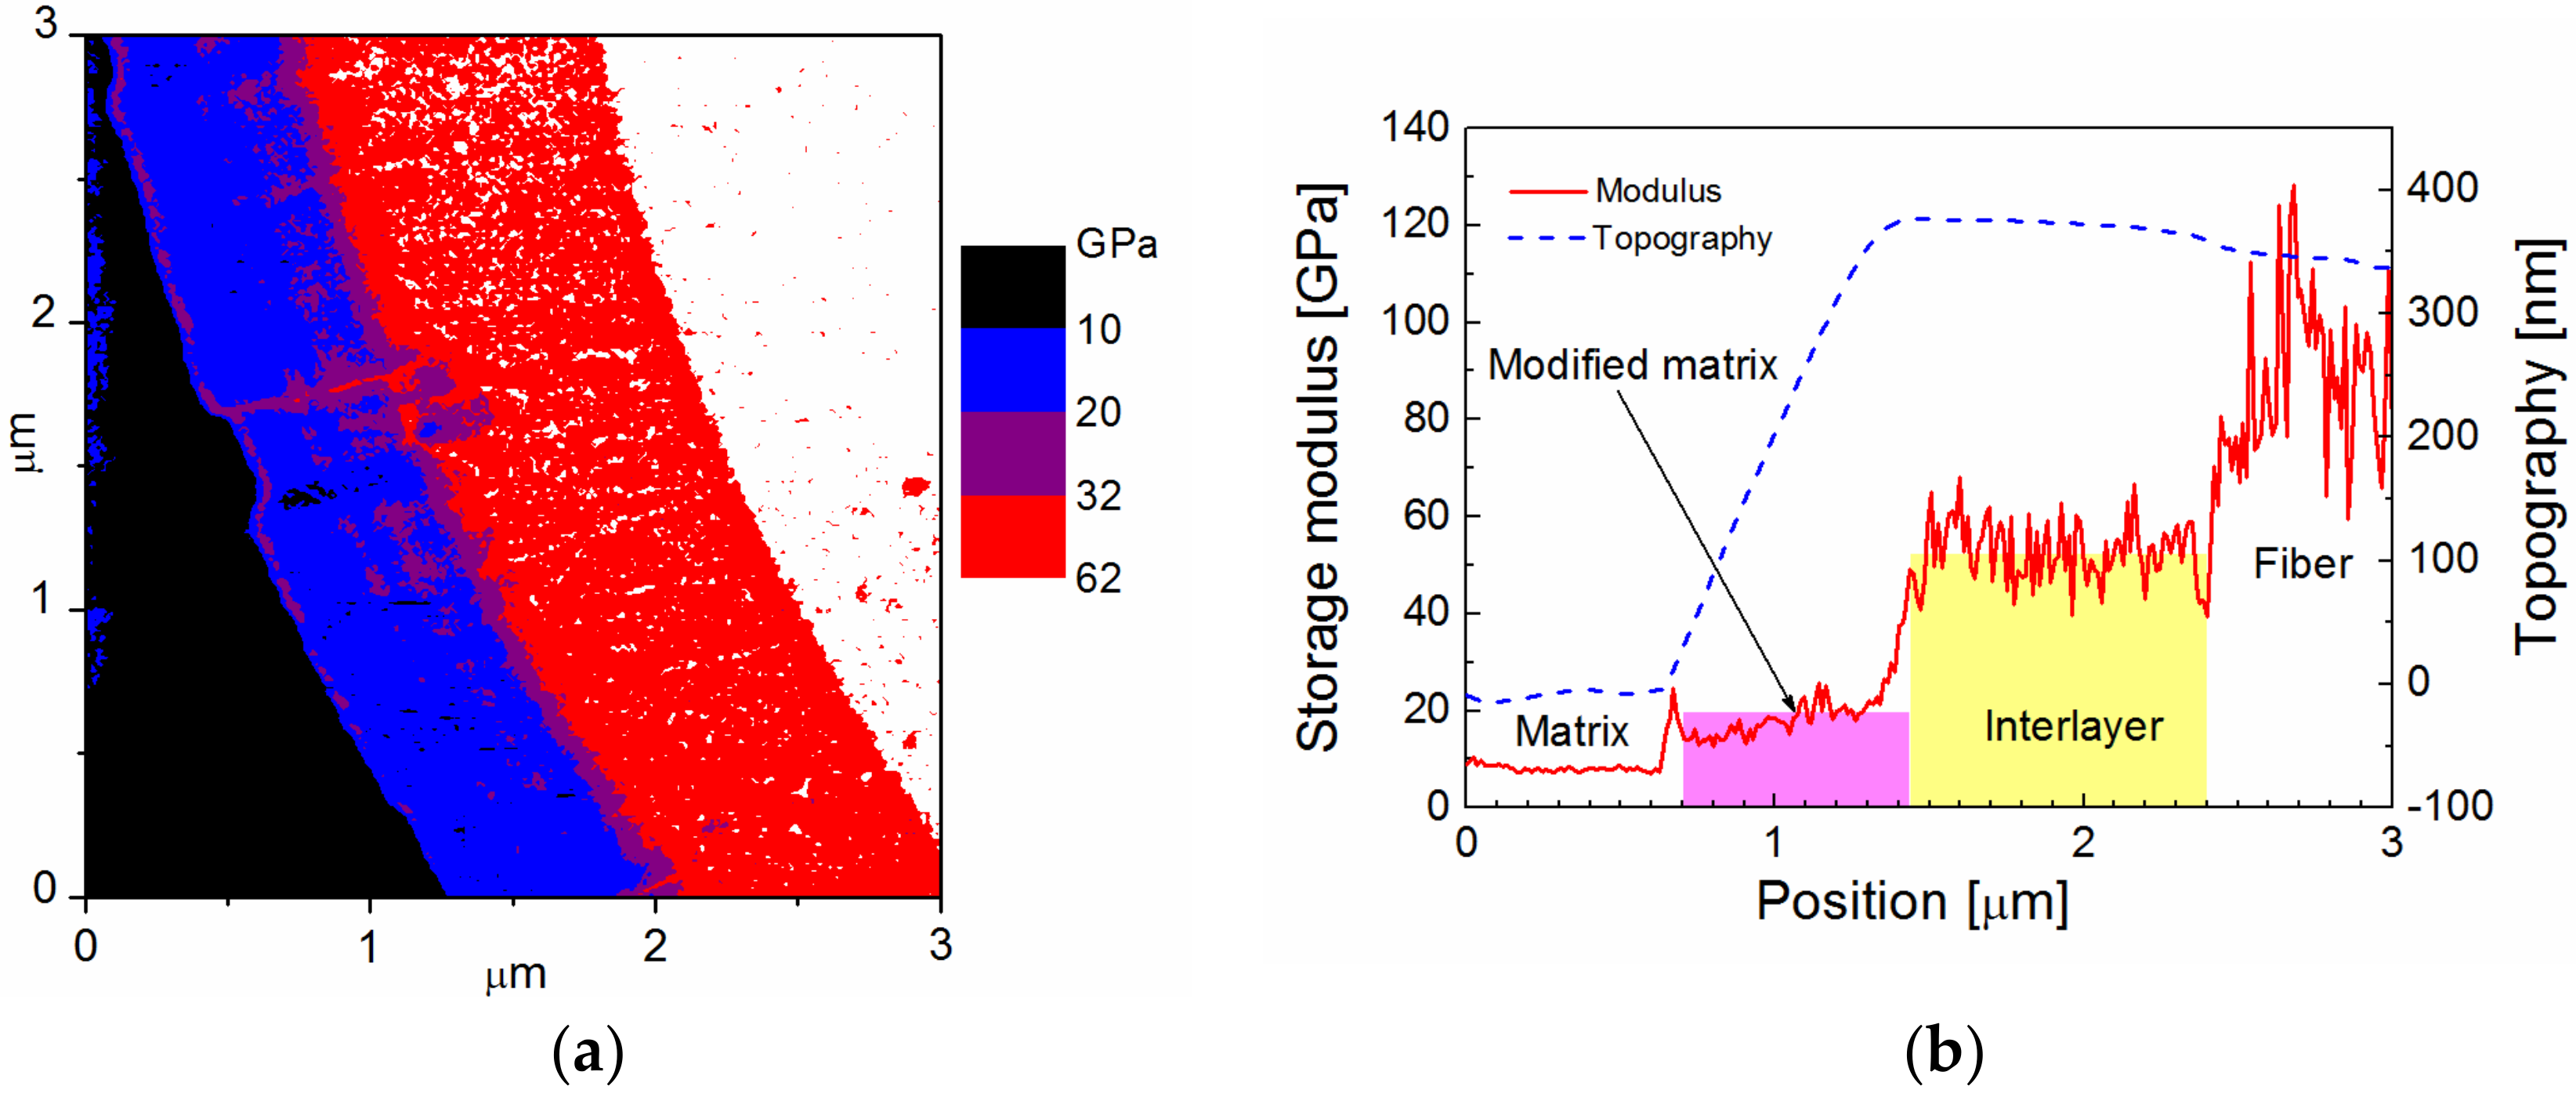
An interlayer with a higher Young’s modulus of 16.3 ± 0.8 GPa was deposited (9.7 nm/min) on single GFs at an effective power of 2.0 W (1 ms, 5 ms, and 10 W) from TVS in a mixture with oxygen gas with a 0.92 oxygen fraction. Oxygen atoms (34 atom%) were incorporated into the thin film, but carbon (29 atom%) and hydrogen (24 atom%) concentrations were reduced in the a-C2.2SiO2.6:H1.8 film with a thickness of 966 nm, unlike the polymer-like a-C5.6Si:H5.0 film. Cross-linking of the carbon-silicon oxide network is still relatively low due to Si–H, Si–OH, C–H, C–OH, and C=O bonding species. The results of Modulus Mapping across the interphase region in a model GF/polyester composite with a-C2.2SiO2.6:H1.8 interlayer are plotted in Figure 3. The map of the storage modulus in Figure 3a provides easy orientation in specific composite phases; the red/white area corresponds to a fiber, surrounded by a blue belt, indicating an interlayer with a higher modulus than the polymer matrix that is marked with a black area. The surface topography across the interlayer, marked by the yellow area, was flat, and was, therefore, favorable for determining the correct value of the storage modulus (Figure 3b). The storage modulus of the interlayer slightly increased from the interface between the interlayer and the polymer matrix to the interlayer/fiber interface, but the mean value was 16 GPa. A small portion of the interphase region with a thickness of 0.1–0.2 µm between the interlayer and the polymer matrix had a slightly elevated modulus, and could, therefore, correspond to the modified matrix.
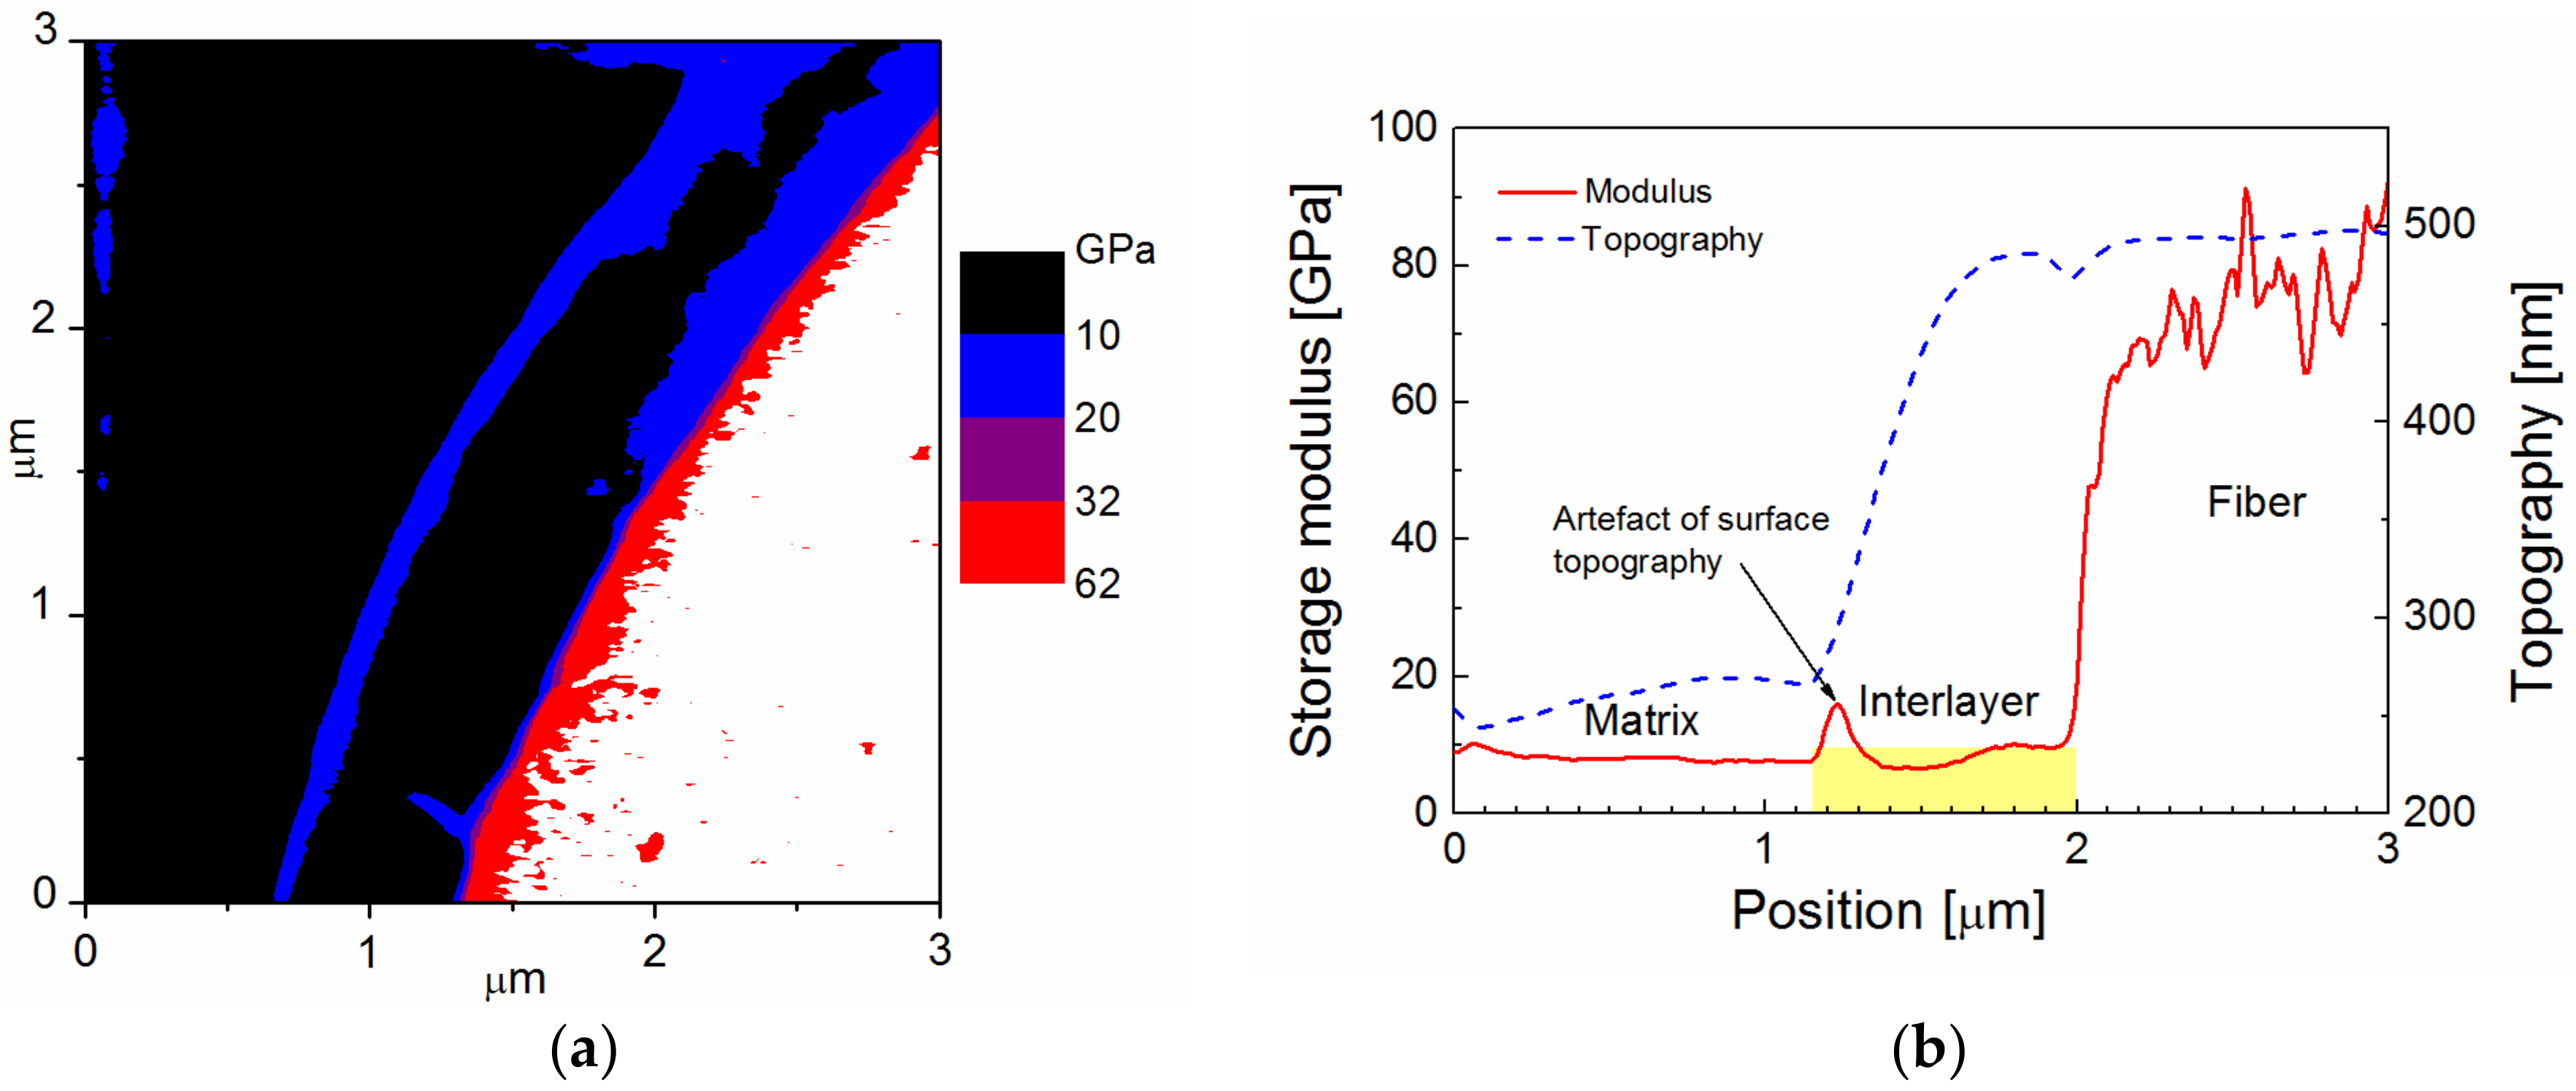
Another interlayer in the form of a silicon oxide film with a carbon concentration of 16 atom% was deposited (7.5 nm/min) at 4.5 W (1 ms, 11 ms, and 50 W) from TVS in a mixture with oxygen gas with a 0.92 oxygen fraction. The a-C0.7SiO2.1:H0.8 interlayer with a thickness of 1109 nm was more cross-linked, with a Young’s modulus of 29.6 ± 1.5 GPa. Modulus Mapping in Figure 4a distinguished the fiber (white area) from the interlayer (purple area) and the polymer matrix (black area). A part of the blue belt with a thickness of 0.3 to 0.4 μm between the interlayer and the polymer matrix may represent a modified matrix region characterized by a gradually increasing modulus. The beginning of the step in the surface topography between the modified and the bulk matrix was responsible for the elevated modulus, which is an artefact caused by a specific surface topography, and can be seen as a purple contour in the blue belt (Figure 4b). In this case, the mechanical properties of the interlayer were sufficiently high to avoid any surface roughness between the fiber and the interlayer. This means that the surface topography was flat for the interlayer, delineated with the yellow area, and the storage modulus of the interlayer increased from 21 to 31 GPa at the interlayer/fiber interface at a mean value of 26 GPa.
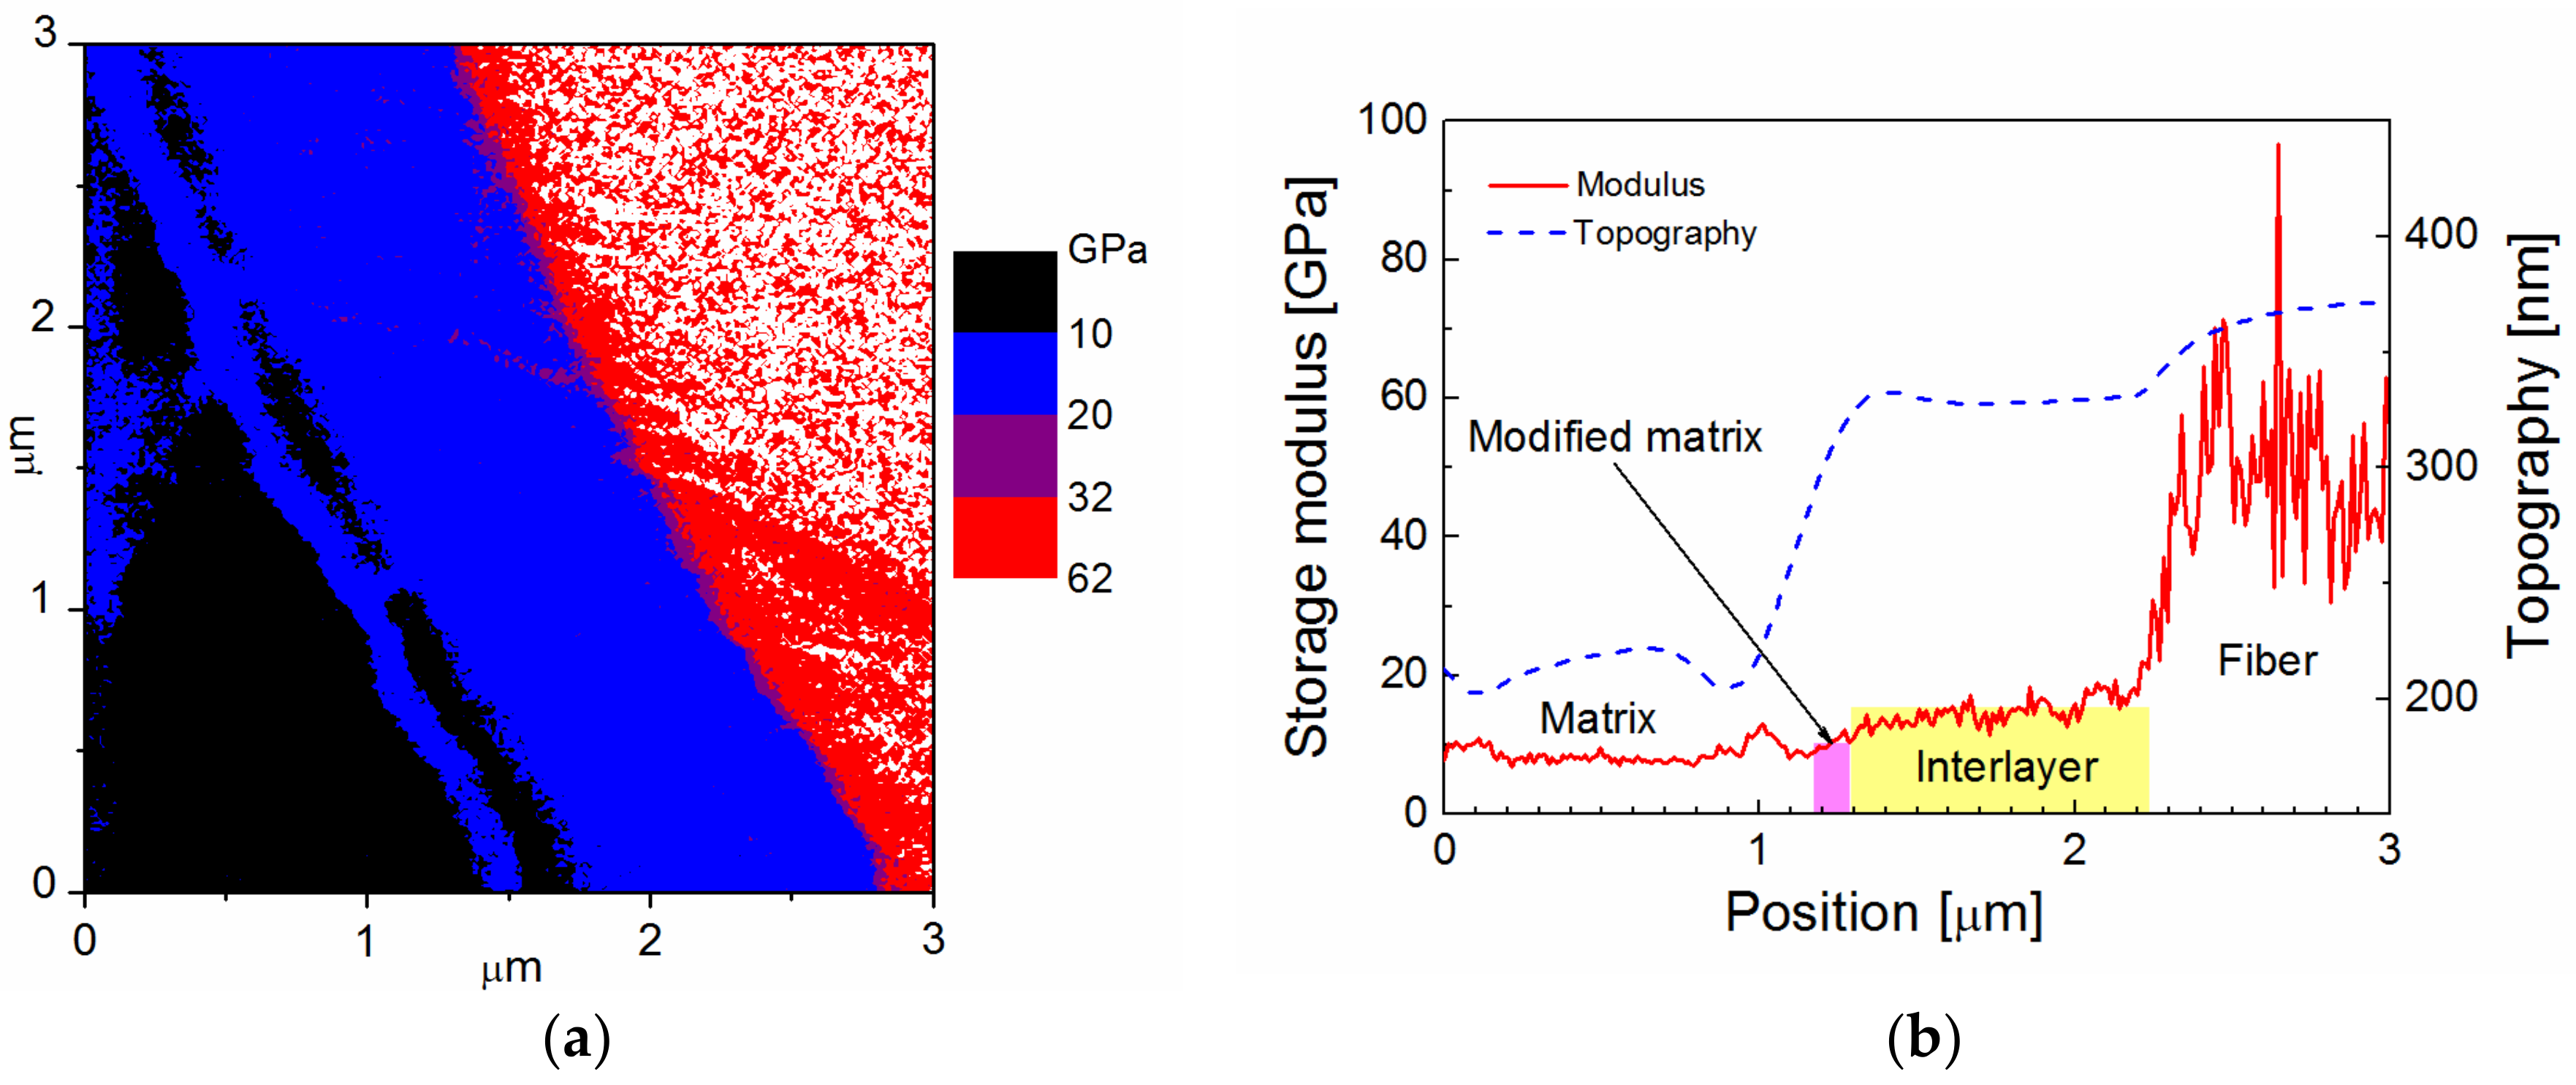
An SiO2-like interlayer with a small concentration of carbon (3 atom%) and hydrogen (11 atom%) was deposited (5.5 nm/min) at 10 W (1 ms, 5 ms, and 50 W) from TVS in a mixture with oxygen gas with a 0.92 oxygen fraction. The a-C0.1SiO1.9:H0.4 interlayer with a thickness of 950 nm was highly cross-linked resulting in a Young’s modulus of 51.7 ± 3.3 GPa. Figure 5a shows a map of the storage modulus corresponding to the fiber (white area), interlayer (red area), modified matrix (blue area), and the bulk matrix (black area). The same deposition time resulted in consistent film thickness for films deposited on planar and fibrous substrates. The thickness of the modified matrix was increased for the SiO2-like interlayer, and varied from 0.5 to 0.7 µm. The mean value of the storage modulus for the flat surface of the interlayer was 52 GPa (Figure 5b), as expected from cyclic nanoindentation. The storage modulus across the interlayer varied like across the GF surface. This means that the interlayer material was as brittle as the glass, and the composite surface was specifically modified (slightly scratched) with 50-nm alumina nanoparticles, which were used to polish composite samples. The root-mean-square (RMS) roughness of the composite surface was 30 nm for a scan area of 100 × 100 µm2 measured by AFM. The varying modulus was caused by surface topography. Nanoindentation measurements of the material with a higher modulus are more sensitive to surface roughness [22]. The wide region of the modified matrix with the elevated modulus between the interlayer and the bulk matrix is evident for the SiO2-like interlayer in Figure 5b. We can assume that the modified matrix region was created as a result of a chemical bonding at the interface between the interlayer and the polymer matrix, unlike the unsized GF (Figure 1c). The polymer network was firmly anchored onto the surface of the interlayer, which increased the rigidity of the polymer network. The interlayer/polymer matrix interface was sharp, and no interpenetrating network between the interlayer and the polymer matrix can be expected, unlike commercially sized GFs that are surface-modified by silane coupling agents [33]. Analysis of the depth profile for the interlayers and GFs revealed that the subsurface layer, up to a depth of 5–10 nm, showed an increase in the storage modulus due to the mechanical modification of the material during the polishing procedure. Therefore, the storage modulus in the maps may be overestimated by up to 10% for the SiO2-like interlayer and GFs, as the average displacement of the indenter was approximately 5 nm, but it cannot affect the polymer-like interlayer with an average displacement of 15 nm. The differences in storage modulus among the composite phases were significantly higher compared to the differences in loss modulus, and were, therefore, more appropriate for the distinction of the specific phase.

3.2. Selected Interlayers for GF/Polyester Composite

As shown in Section 3.1, a wide range of materials from polymer-like to SiO
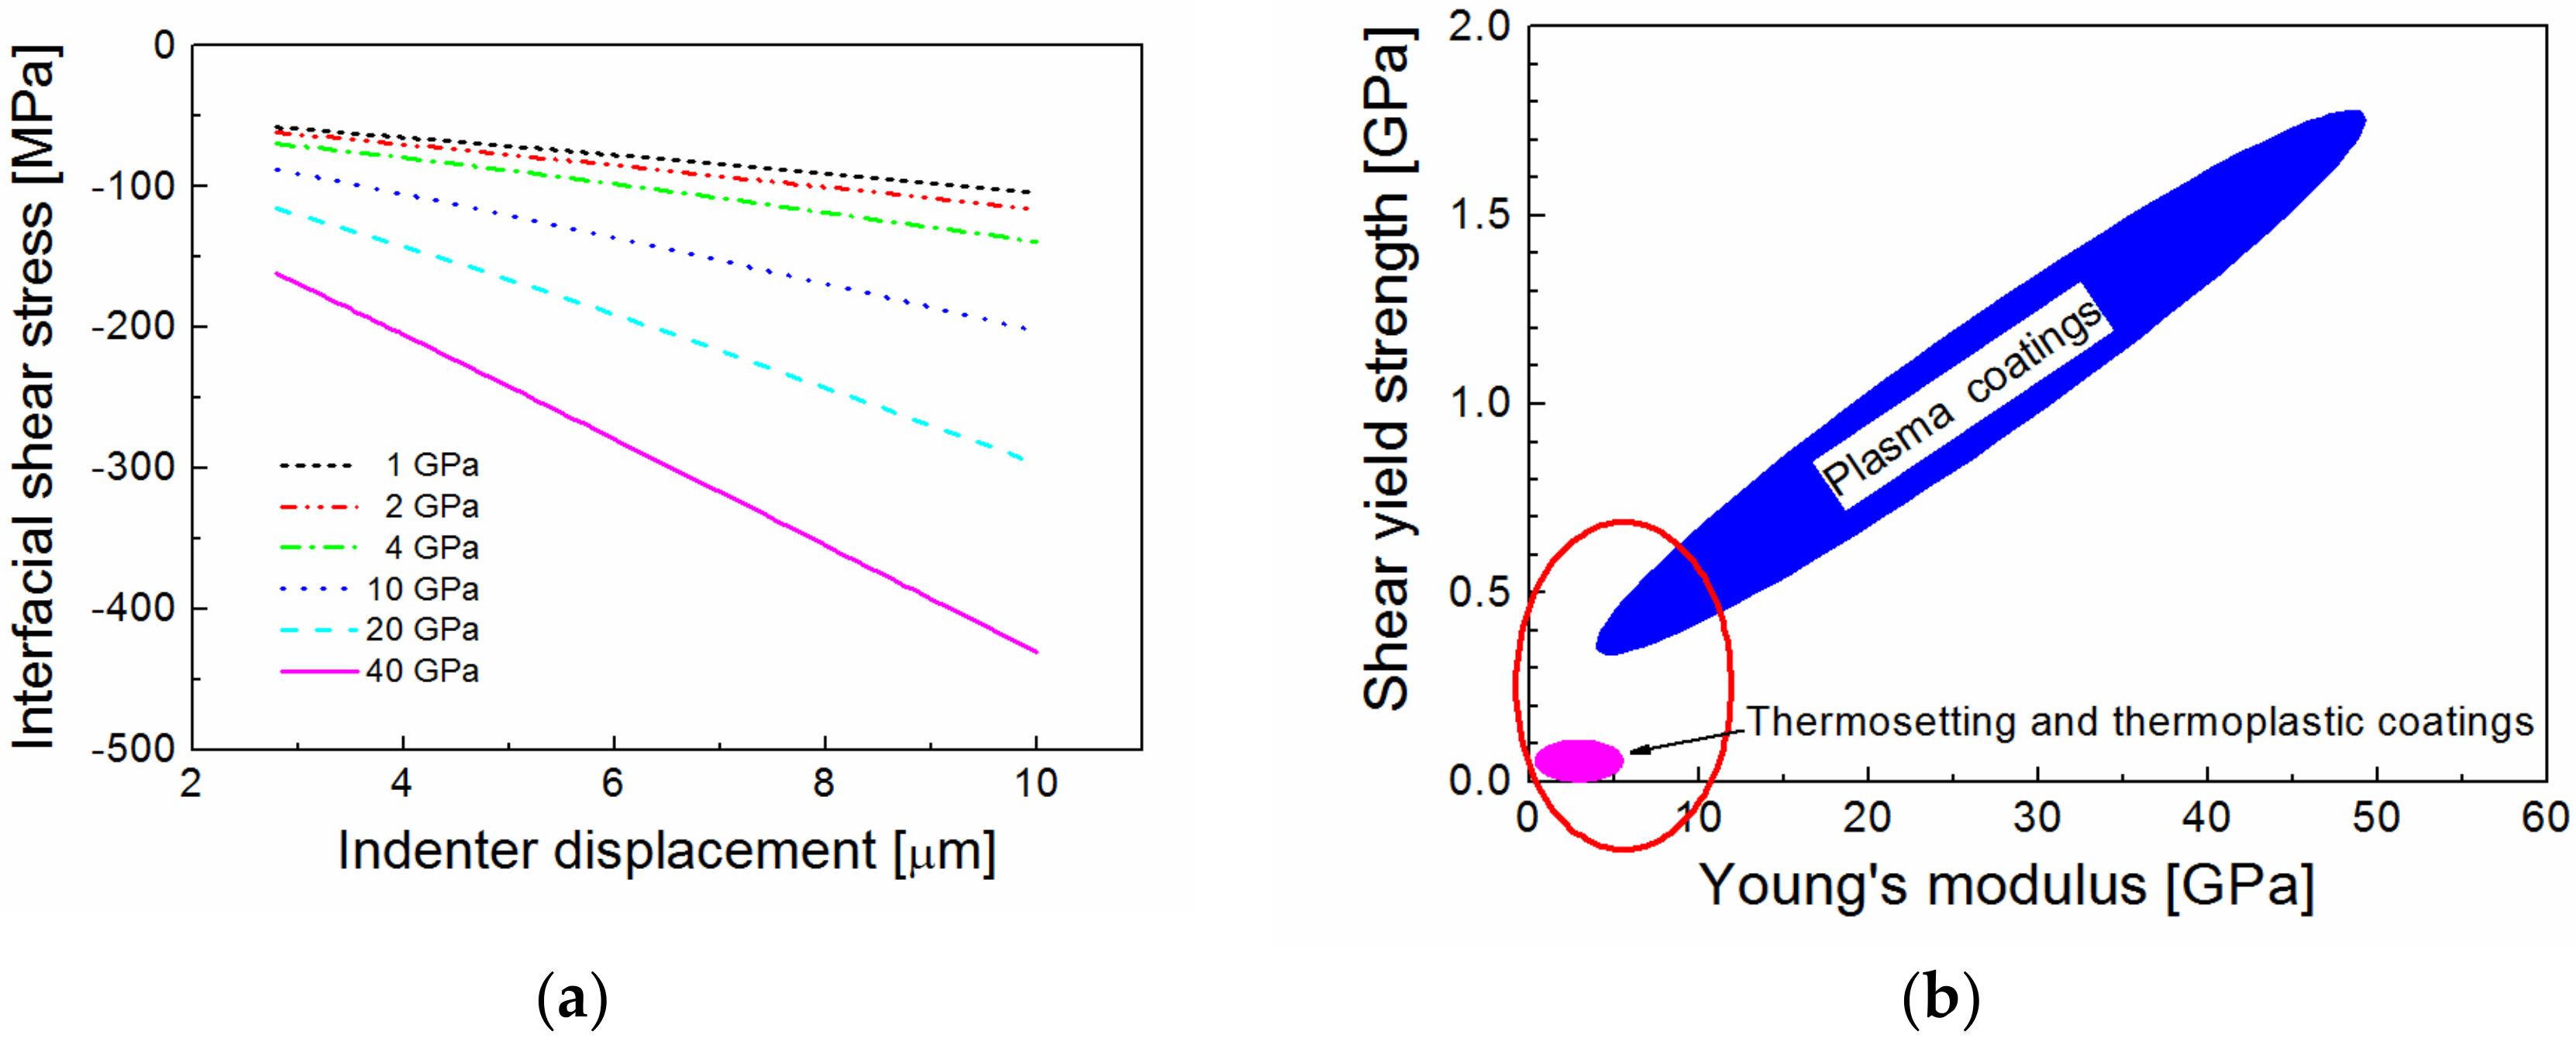
2-like films with a Young’s modulus of 10 to 52 GPa can be used as interlayers for GF/polyester composites. The chemical and physical compatibility of the interlayer and the polymer matrix was increased for the polymer-like interlayers with the lower (≤16 GPa) Young’s modulus as the thickness of the modified matrix region was decreased. Model simulations (finite element analysis) enabled calculating the interfacial stress fields in a GF/polyester composite during the microindentation test. The simulation showed that inserting a suitable interlayer between the fiber and the polymer matrix resulted in a significant reduction in shear stress across the interphase region when the polymer composite was under mechanical or thermal loading. If the indenter pushed the individual fiber into the polyester resin during the microindentation test, the interfacial shear stress at the interlayer/fiber interface increased with the raised Young’s modulus of the interlayer [34]. The interfacial shear stress as a function of the indenter displacement for the interlayer Young’s modulus in the range of 1 to 40 GPa is shown in Figure 6a. As can be seen from Figure 6a, the use of the interlayer with the higher modulus means that the interlayer/fiber interface must be stronger in order to avoid interphase shear failure. Also, the shear yield strength of the interlayer must be higher than the applied shear stress. Thermosetting or thermoplastic coatings are poor in shear [35], and are, therefore, unsuitable for use as functional interlayers in high-performance fiber-reinforced polymer composites. However, the plasma coatings deposited (PECVD) from organosilicon precursors have a sufficiently high shear yield strength at a relatively low Young’s modulus [25], as opposed to thermosetting or thermoplastic coatings (see the schematic comparison in Figure 6b). Therefore, the plasma coatings may be more suitable as functional interlayers.
In our previous work, an oxygen-free TVS was successfully used for plasma coating of GFs in the RF helical coupling system to enhance the interfacial adhesion in GF/polyester composites [36]. In that case, the Young’s modulus of the interlayer was increased from 9.4 to 23 GPa, reducing the vinyl concentration with an enhanced power of 0.1–5.0 W, but the adhesion of the interlayer to the GF did not significantly improve. In another study, therefore, a mixture of TVS precursor in gaseous oxygen was used to deposit plasma coatings onto GFs. Incorporating oxygen atoms into plasma coatings can increase interfacial adhesion, not only on the GF surface, but also at the interface with the polyester matrix due to better wettability and higher density of interfacial bonds. Indeed, the IFSS for oxidized plasma coatings was up to 21% higher than that for the non-oxidized interlayer, indicating the direct chemical effect of oxygen atoms on the interphase properties [34]. A nanoscratch test was used to measure the interlayer adhesion on a flat glass substrate, as well as on a single GF. For a given film, consistent interlayer adhesion was identified for both fibrous and planar glass substrates [37]. The work of adhesion was used as the right parameter for the characterization of the interlayer adhesion measured by a nanoscratch test. A strong correlation was found between the IFSS in GF/polyester composites and the interlayer adhesion for the same plasma coating [38]. Model and experimental data showed that the shear strength at the interlayer/fiber interface is the key factor affecting the mechanical response of the plasma-coated fibers in a GF/polyester composite at microindentation testing.
Further enhancement of the adhesion of oxidized plasma coatings deposited at higher power was our motivation to test an improvement of IFSS for GF/polyester composites. A set of interlayers was deposited onto silicon wafers and GF bundles at a constant effective power of 5.0 W, but the various oxygen fractions in the TVS/O
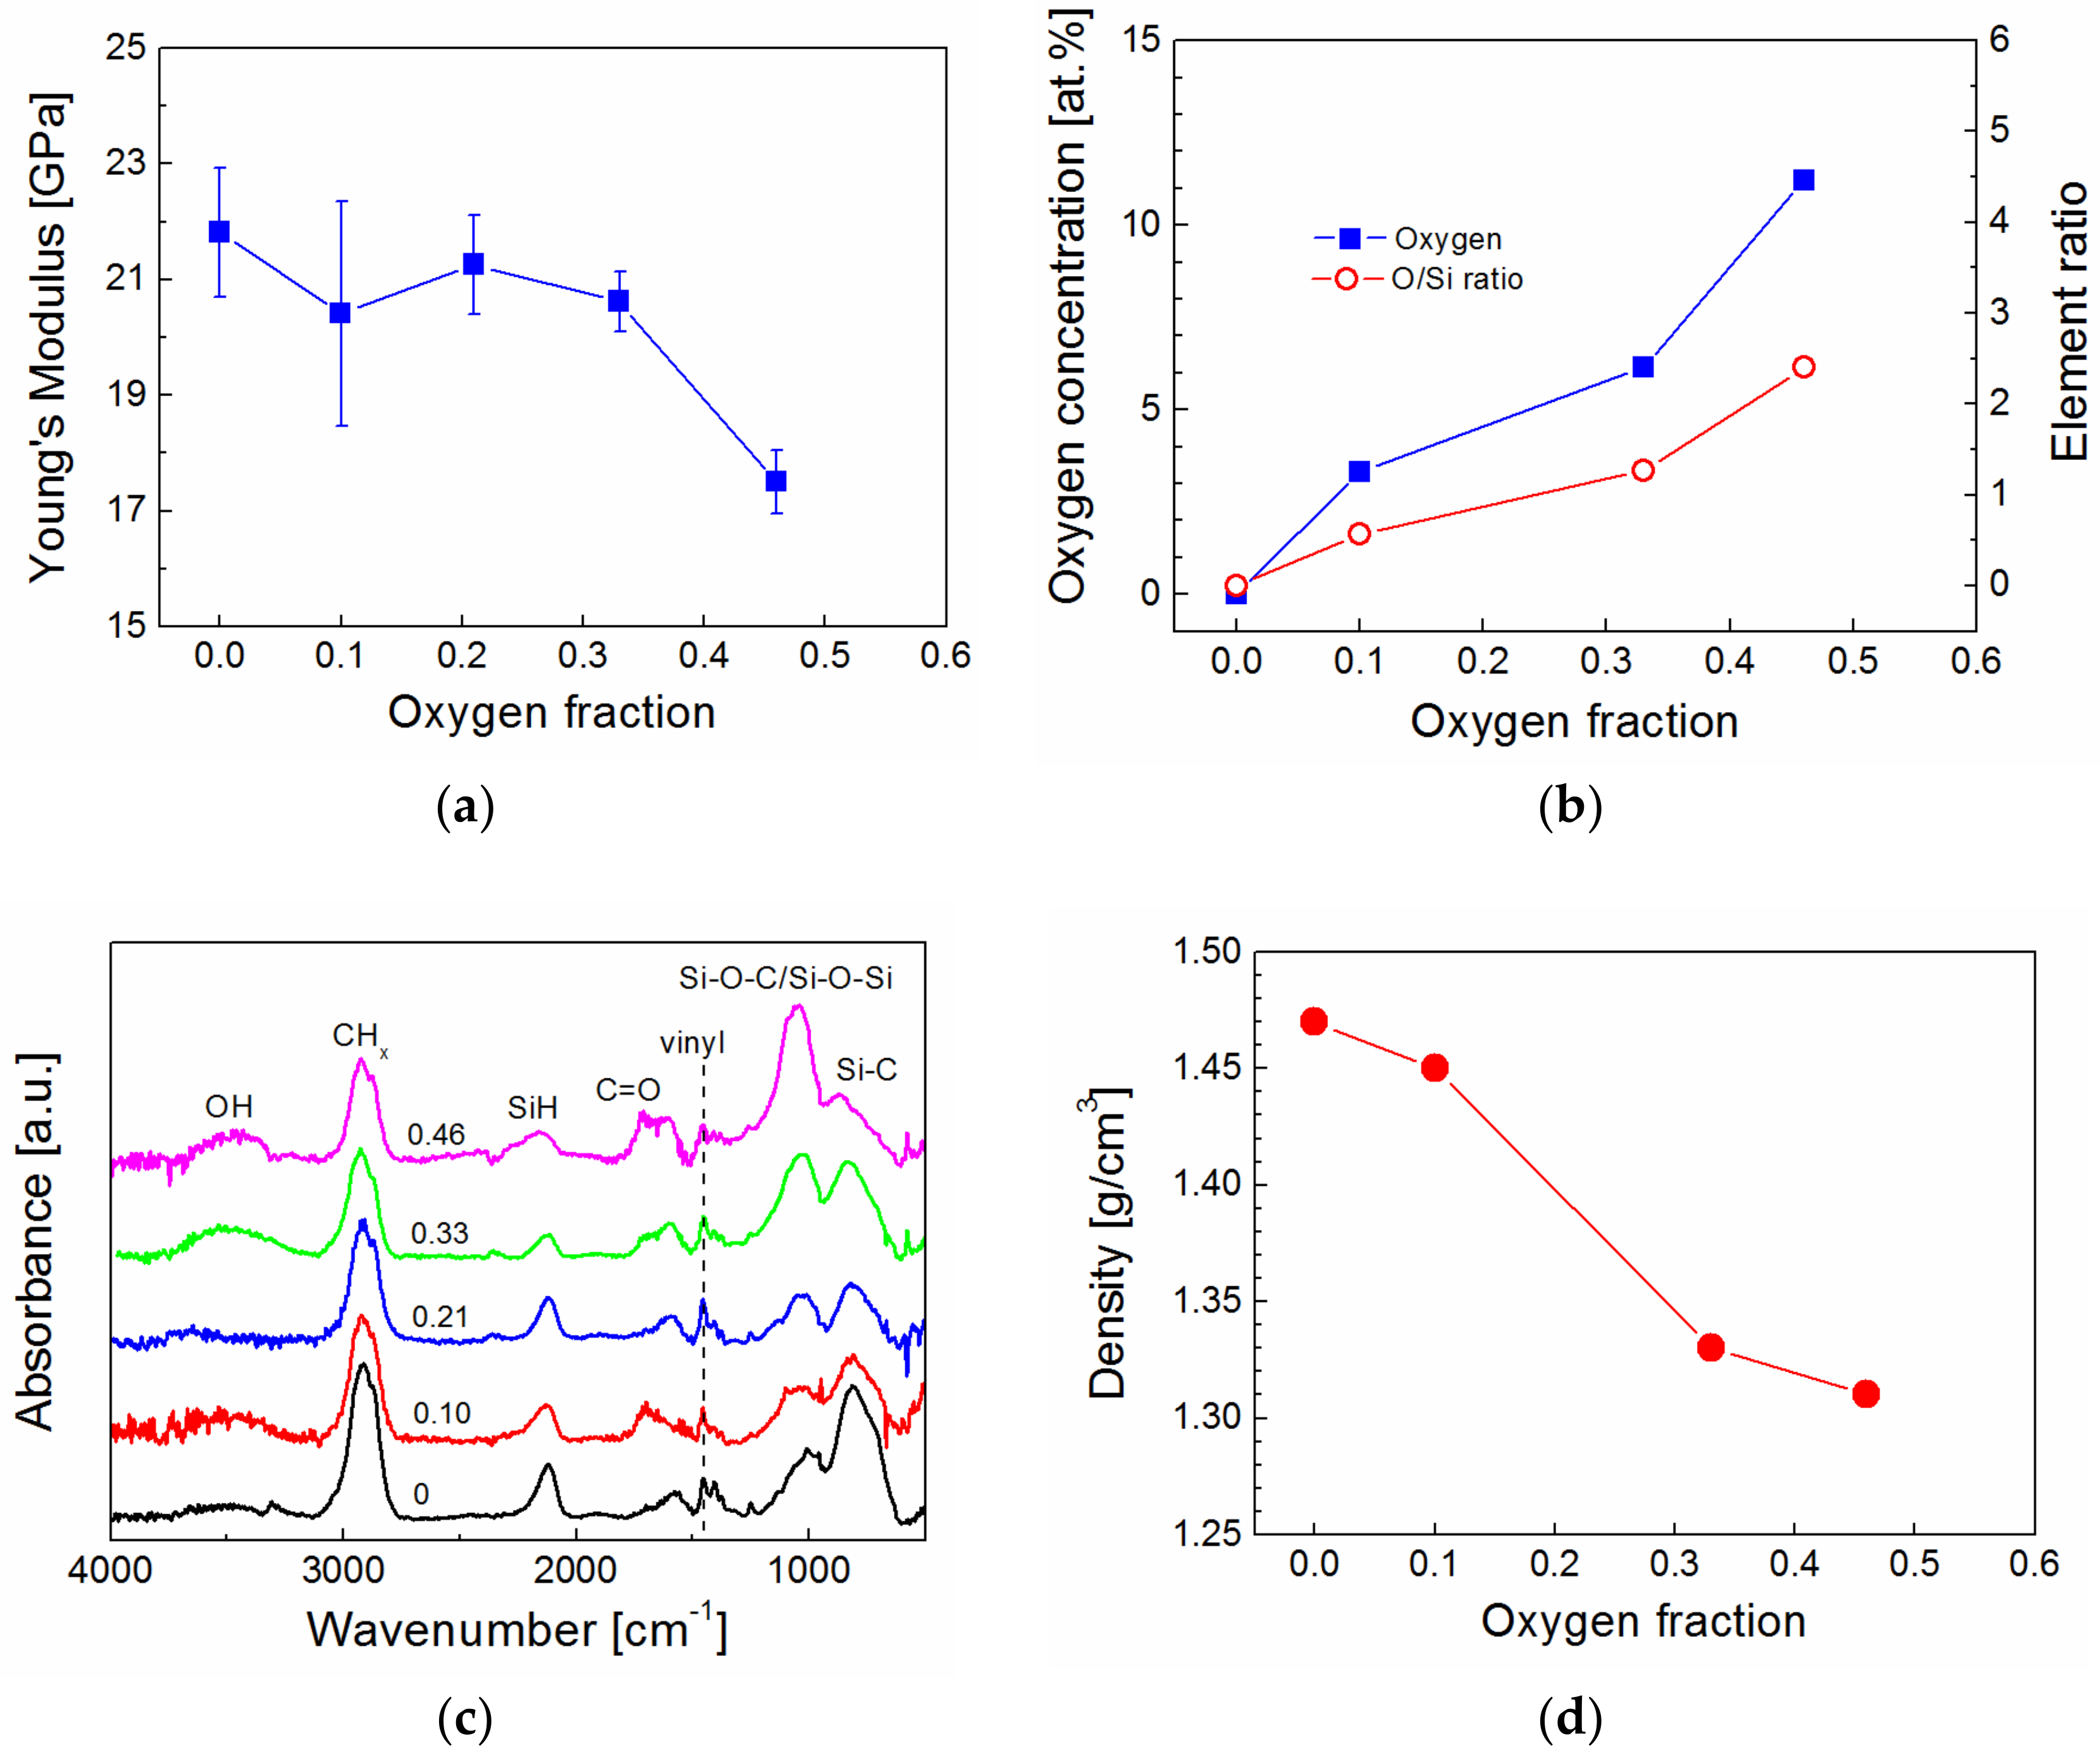
2 mixture varied from 0 to 0.46 (0, 0.10, 0.21, 0.33, and 0.46) in the RF helical coupling system. Using the same power, the power density in the RF helical coupling system was significantly lower, due to a higher volume of plasma discharge, compared to the plasma reactor equipped with parallel electrodes. This means that plasma coatings synthetized in the RF helical coupling system contain a higher concentration of hydrogen atoms and are less cross-linked. The Young’s modulus of plasma coatings deposited on silicon wafers was determined from nanoindentation measurements for various oxygen fractions in the TVS/O2 mixture (Figure 7a). The Young’s modulus decreased from 22 to 18 GPa as a result of an increase in oxygen concentration from 0 to 11 atom% in a-CSiO:H films (Figure 7b). Chemical analysis (RBS/ERDA) showed that the C/Si and H/Si ratios in all films were approximately 7.1 and 10, respectively, but the O/Si ratio increased from 0 to 2.4 with the enhanced oxygen fraction (Figure 7b). FTIR spectra indicate that oxygen atoms were incorporated into hydroxyl, carbonyl, and Si–O–C/Si–O–Si species, and the intensity and area of the absorption bands increased with enhanced oxygen fraction (Figure 7c). This trend is consistent with the previous analysis [39]. This means that the number of Si–C species in the a-CSi:H film deposited from pure TVS were reduced at the expense of the newly formed Si–O–C species in a-CSiO:H films synthetized from TVS in a mixture with oxygen gas. An increase in the number of Si–O–C/Si–O–Si species was important for increased adhesion at the interlayer/glass interface due to chemical reactions of plasma species with hydroxyl groups on the surface of the glass. By increasing the oxygen fraction, only a slight reduction of the vinyl groups in the film can be expected (Figure 7c). The vinyl groups on the interlayer surface are responsible for chemical bonding with the polyester resin during the curing process. The formation of hydroxyl and carbonyl groups eliminates one and two bonds, respectively, from each carbon atom that could potentially be used for cross-linking the network. Therefore, decreased cross-linking of the carbon-silicon oxide network with an increased oxygen fraction resulted in a film density reduction of 1.47 to 1.31 g/cm3 (Figure 7d), as determined from the RBS spectra, and also resulted in a reduced Young’s modulus (Figure 7a).
Interlayers with the properties shown in Figure 7 were also deposited on an unsized GF bundle of 1600 single filaments. The GF bundle was positioned along the axis of the axially symmetric plasma, resulting in the deposition of a uniform and homogeneous coating around the fibers [36]. TVS molecules were fragmented during the plasma process to form free radicals, and these highly reactive radicals recombined on the surface of the GFs to form an interlayer. Because of the low pressure (1.4 Pa) during the plasma process, free radicals diffuse into the central part of the GF bundle and form an interlayer even on the surface of the central fibers. The thickness of the interlayer is controlled by deposition time at a known deposition rate, which is constant during deposition. However, the interlayer on the central fibers is thinner than that on the fibers at the edge of the bundle, because the deposition rate decreases radially into the GF bundle due to the shadow effect of the surrounding fibers. We found that the thickness of the film deposited on the silicon wafer under a single GF was reduced by a factor of 0.9, due to the shadow effect, after the deposition process with plan-parallel electrodes. Multiple shielding can be expressed in a geometric series as tn = ts qn − 1, where ts is the film thickness on the fiber at the edge of the bundle, tn is the film thickness on the n-th fiber in the direction toward the center of the bundle shielded by n − 1 fibers, and q is the shielding factor. For the GF bundle with a circular cross-section of 1600 single filaments, 22 is the order of the fiber in the center of bundle, and for ts = 1.0 µm, q = 0.9, the film thickness is t22 = 109 nm on the central GF. The thickness of the interlayer on the central GF is, therefore, ten times smaller than the thickness of the interlayer on the fiber at the edge of the bundle. The expected thickness of the interlayer varied between 1.0 and 0.1 µm across the GF bundle for all tested GFs. The plasma-coated GF bundle was embedded in the polyester resin, and was cured to form a unidirectional GF/polyester composite. The polished cross-section of the composite sample was subjected to microindentation testing for the IFSS evaluation. The mean value and its standard deviation were calculated from measurements of ten fibers selected from different parts of the bundle cross-section. No evident differences between IFSS values for central and edge fibers were observed, which corresponds to the previous results [
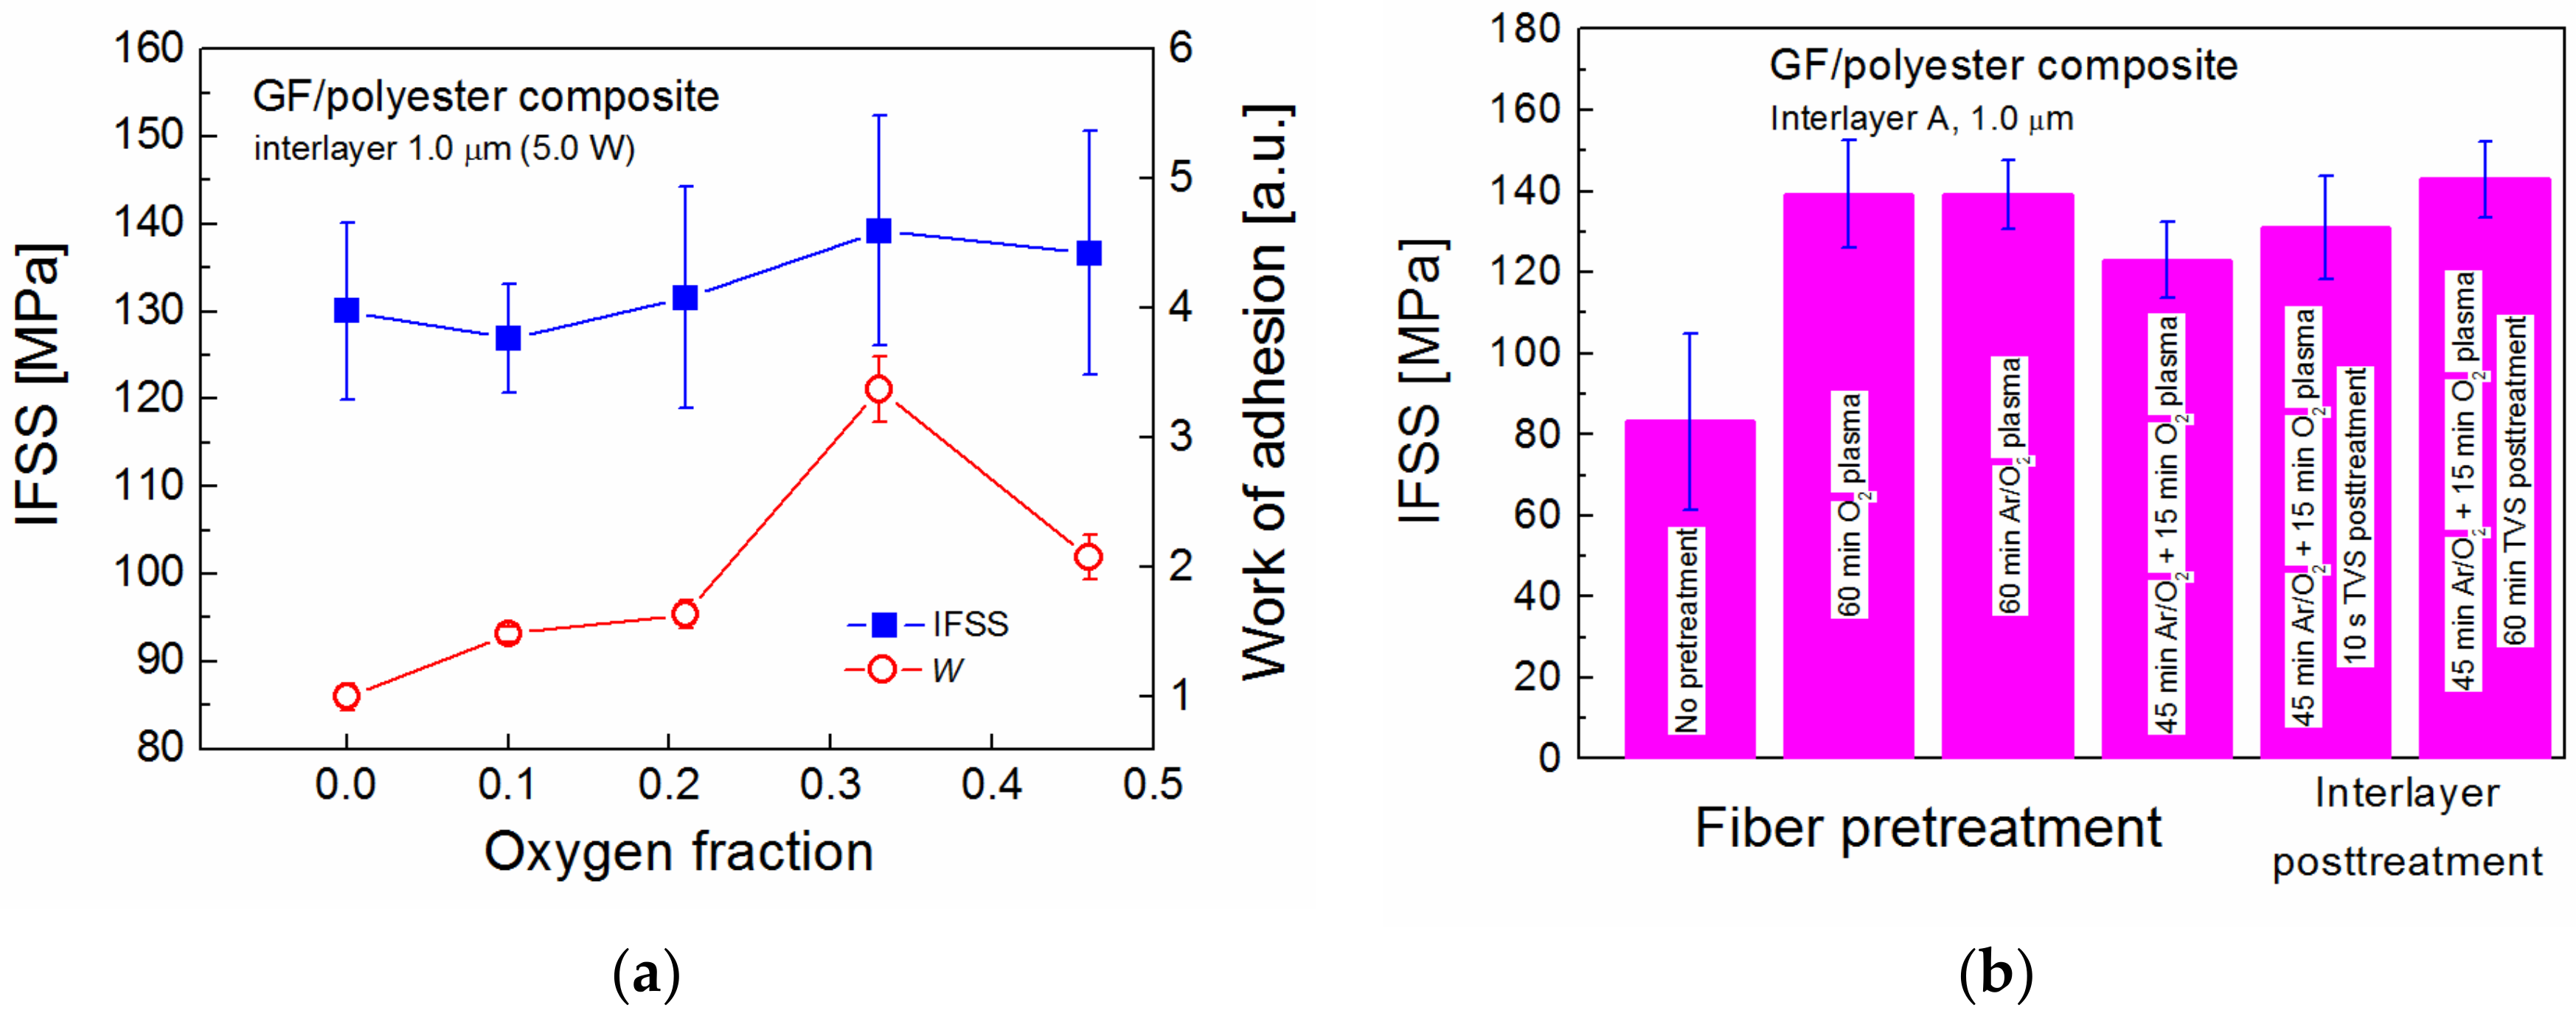
34]. The dependence of IFSS on the oxygen fraction in the TVS/O2 mixture for plasma-coated GFs with an interlayer thickness of 1.0 μm (edge fibers) at an effective power of 5.0 W is given in Figure 8a. The IFSS (blue square) ranged from 130 to 139 MPa at a fiber volume fraction of approximately 0.53 in the GF/polyester composite. The maximum IFSS at a 0.33 oxygen fraction corresponds to the highest adhesion of the interlayer on glass substrate characterized by the work of adhesion (red circle) [38]. A 3.4-fold increase in the adhesion of the a-CSiO:H film (0.33 oxygen fraction), due to a raised concentration of Si–O–C/Si–O–Si bonding species at the interlayer/glass interface, compared to the a-CSi:H film (zero oxygen fraction) was promising for using the adhesive film as a functional interlayer in the GF/polyester composite. The IFSS trend corresponds to the adhesion trend (Figure 8a), but the statistical significance of the maximum IFSS is not entirely convincing. Although there are differences between the microindentation test and the nanoscratch test in the specimen loading and failure mechanics, and both the IFSS and the work of adhesion are calculated based on simplified assumptions, the interlayer adhesion on the glass surface was shown to control the shear strength in the GF/polyester composite [38].
The effect of GF pretreatment and post-treatment of plasma-coated GFs on IFSS is demonstrated for the same Interlayer A (type A: 0.33 oxygen fraction, 5.0 W) in Figure 8b. The strong adhesion at the interlayer/fiber interface was primarily achieved by pretreatment of GFs with O2 plasma, which cleans and activates the fiber surface due to physical and chemical etching before the interlayer is deposited. The deposition of Interlayer A on GFs without pretreatment resulted in a significant reduction of IFSS to 83 MPa compared to 139 MPa for GFs pretreated with O2 plasma at 25 W for 60 min (Figure 8b). Ar gas (4.0 sccm) was mixed with O2 gas (0.5 sccm) to increase the degree of ionization during the pretreatment of GFs, but the IFSS of 139 GPa was the same as in the pretreatment with O2 plasma using the same Interlayer A. The IFSS value was reduced to 123 GPa when Ar/O2 plasma was applied for 45 min followed by O2 plasma for 15 min during the pretreatment procedure. This means that the cleaning and activation of the GF surface was not so effective, probably because of the interruption of the pretreatment process to change the gas mixture. This pretreatment method, however, was used for the other two samples, where, after the deposition of Interlayer A, the plasma-coated GFs were left in the reactor filled with TVS vapor for 10 s or 60 min without RF discharge. During this post-treatment procedure, the TVS molecules are not only physisorbed, but also chemisorbed on the chemically active surface of the interlayer that contains free radicals. An ultrathin overlayer, rich in vinyl groups, is formed on the interlayer surface during the application of TVS vapor. This layer may be important for improved adhesion at the polymer matrix/interlayer interface due to chemical bonding of vinyl groups with polyester resin during the curing process. Progress in the IFSS of 8 and 20 MPa (up to 143 MPa) was found for the interlayer, post-treated for 10 s and 60 min, respectively.
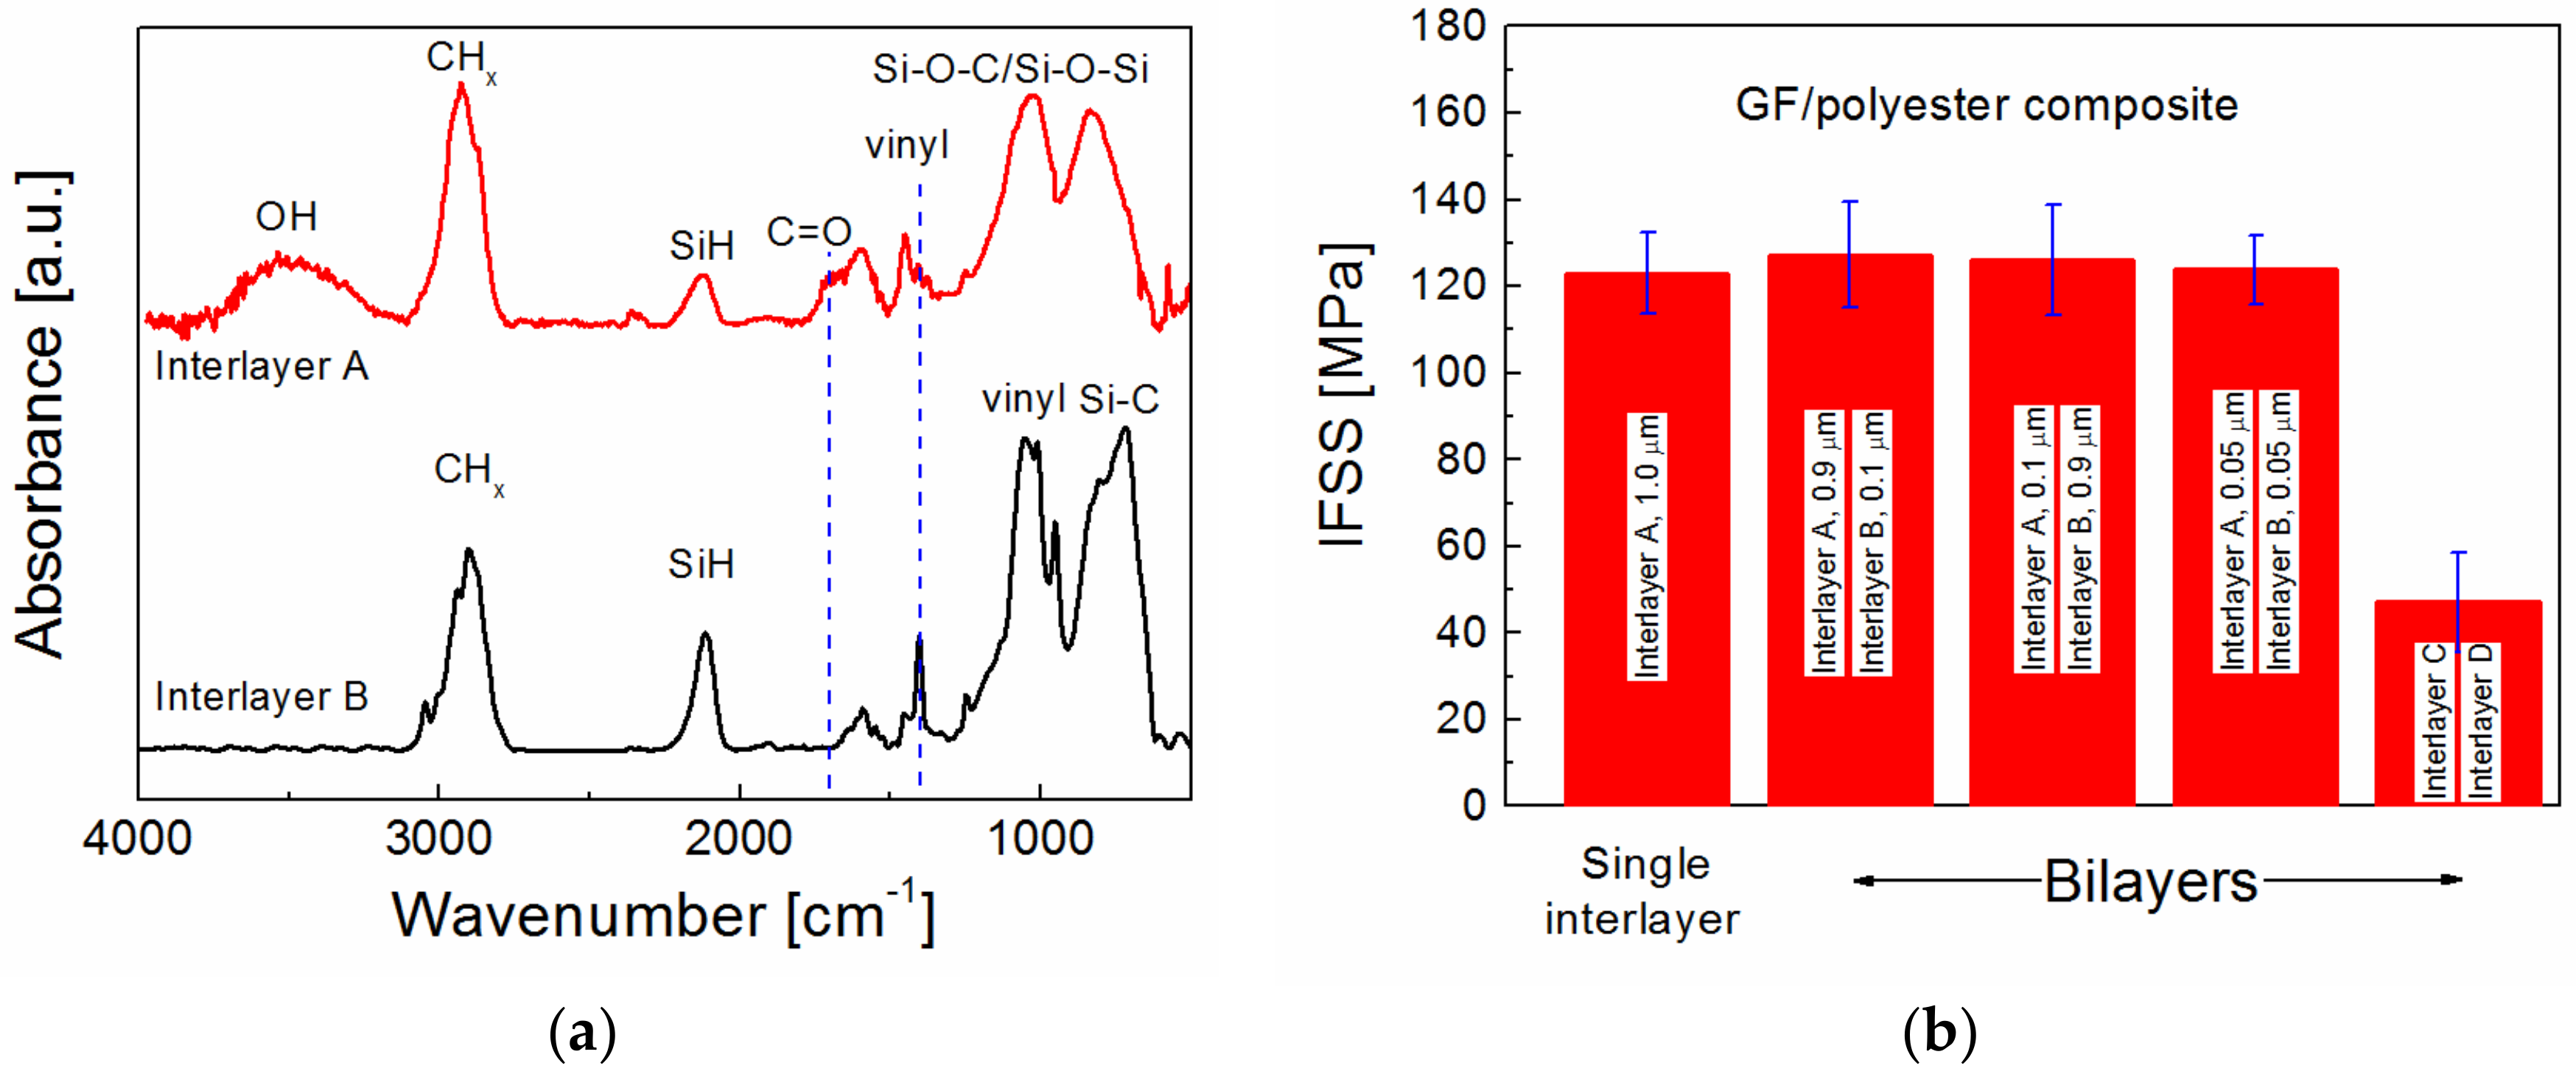
Interlayer B, deposited from pure TVS at an effective power of 0.1 W, contains no polar groups, but contains a higher concentration of vinyl groups compared to Interlayer A, as evident from the FTIR spectra (Figure 9a). Interlayer B could, therefore, be used to improve chemical bonding between the polymer matrix and the interlayer, similar to the ultrathin overlayer deposited from TVS vapor during the post-treatment procedure. In addition, Interlayer B has a lower Young’s modulus of 9.4 GPa [36], which is beneficial for decreasing shear stress across the interphase region (Figure 6a). Interlayer B was combined with Interlayer A to form a bilayer that was tested to improve the IFSS in GF/polyester composites. Interlayer A, containing 6.1 atom% of oxygen, was deposited on the GF bundle followed by the oxygen-free Interlayer B in three thickness variations: 0.9 µm (Interlayer A) + 0.1 µm (Interlayer B), 0.1 µm (Interlayer A) + 0.9 µm (Interlayer B), and 0.05 µm (Interlayer A) + 0.05 µm (Interlayer B). The resulting IFSS values were compared with the single Interlayer A in Figure 9b. All the results in Figure 9b correspond to GFs pretreated with Ar/O2 plasma for 45 min, followed by O2 plasma for 15 min. The IFSS for bilayers was slightly higher by 1 to 4 MPa, which was statistically insignificant. The bilayer thickness was only 0.1 µm on edge fibers for the third bilayer, meaning that the bilayer thickness was only 0.01 µm on the central fibers. The final bilayer was prepared from the C and D interlayers by diluting the deposition plasma by adding 1.0 sccm of Ar gas to increase the ionization degree, and the total flow rate was, therefore, 1.8 sccm. Interlayer C was deposited from a TVS/O2/Ar mixture with a 0.15 oxygen fraction and a 0.55 argon fraction at an effective power of 5.0 W, but Interlayer D was synthesized from a TVS/Ar mixture with a 0.55 argon fraction at 0.1 W. The deposition rates for this bilayer were not known, but a significantly reduced IFSS value of 47 MPa indicates that the bilayer thickness was not sufficient for a uniform fiber coating, probably <0.1 µm (edge fibers). This means that part of the GF surface was not covered by the interlayer.
The final comparison of IFSS values for the GF/polyester composite in Figure 10 includes unsized, O2-plasma pretreated but uncoated, commercially sized, and optimized plasma-coated GFs. No chemical bonding at the polymer matrix/fiber interface for unsized GFs with an IFSS of 29 MPa is expected. O2-plasma pretreatment of GFs without deposition of an interlayer resulted in improved interfacial adhesion at the polymer matrix/fiber interface, but the IFSS at 49–50 MPa was limited by the shear failure of the matrix, as demonstrated by model simulations [34]. The IFSS of 105 MPa for commercially sized GFs was twice as high compared to GFs pretreated with O2 plasma. However, the optimized Interlayer A deposited on O2- or Ar/O2-plasma pretreated GFs resulted in an IFSS of 139 MPa. A further increase in IFSS to 143 MPa was achieved by the subsequent post-treatment of Interlayer A in TVS vapor for 60 min.
Plasma coatings of tailored physicochemical properties have potential applications in high-performance polymer composites with a controlled interphase. Plasma nanotechnology is a promising technique for the construction of gradient interlayers needed for the new concept of composites without interfaces [40].

4. Conclusions

A wide range of polymer-to-glass materials was plasma synthesized (PECVD) to control their mechanical properties with Young’s moduli from 10 to 52 GPa. The oxygen-free (a-CSi:H) and oxygen-bound (a-CSiO:H) films of 1.0-µm thickness were deposited from pure TVS and TVS mixed with oxygen gas on planar and fibrous substrates. Cyclic nanoindentation was used to determine the Young’s modulus for films deposited on planar substrates. Single GFs coated by the interlayer were embedded into the polyester resin to form a model composite. The polished cross-section of the model composite was used to distinguish the composite phases, due to their different mechanical properties, with Modulus Mapping. The maps of storage modulus allowed defining the interlayer between the fiber surface and the polymer matrix. The results showed that the mechanical properties, along with the deposition rates, are consistent for films on planar and fibrous substrates. Modulus Mapping revealed that the thickness of the modified matrix increased up to 0.7 µm with the raised Young’s modulus at 52 GPa for the SiO2-like interlayer. We assumed that the modified matrix region was created due to chemical bonding at the polymer matrix/interlayer interface, unlike the unsized fiber, where no interphase region was observed. Thus, a strong interfacial adhesion between the polymer matrix and stiffer material (interlayer) may result in the formation of a modified matrix region with gradually increased Young’s modulus. The thickness of the modified matrix increased with the increasing difference between the interlayer and the polymer matrix moduli. Plasma organosilicon coatings with a relatively low Young’s modulus (polymer-like material) have a shear yield strength that is significantly higher than that for thermosetting and thermoplastic coatings. This means that the plasma coatings with controlled interfacial adhesion and Young’s modulus are promising as interlayers in polymer composites. Selected compatible interlayers with increased interlayer adhesion were deposited onto a 1600-filament GF bundle. The interlayer thickness on the fibers at the edge of the bundle was found to be reduced by one order for fibers in the center of the bundle as a result of the shadow effect. Optimized interlayer adhesion (0.33 oxygen fraction, 5.0 W) resulted in an IFSS of 139 MPa, supported by O2 and Ar/O2 pretreatment of GFs. The IFSS was reduced to 83 MPa if the pretreatment procedure was omitted. The GF pretreatment was, therefore, very important for cleaning and activating the surface of the fibers. Following the plasma coating, the optimized interlayer was then post-treated in TVS vapor to increase the concentration of vinyl groups on the interlayer surface. The post-treatment procedure increased the IFSS to 143 MPa, which is 3.9 times higher than unsized GFs, 1.9 times higher than O2-plasma pretreated GFs, and 36% higher than commercially sized GFs.

Author Contributions

A.K. deposited the interlayers, produced the composite samples, performed the microindentation tests, and analyzed the data; J.L. designed and performed the Modulus Mapping, and analyzed the data; L.T.D. provided the model simulations, as well as advice and discussions about the microindentation test and interface/interphase phenomena; V.C. provided the idea for this study, proposed the deposition conditions and experiments, analyzed and discussed the data, and wrote the paper.

Funding

This research was funded by the Grantová Agentura České Republiky, grant no. 16-09161S.

Acknowledgments

The authors would like to thank Petr Kucharcik for technical assistance, Erik Palesch for cyclic nanoindentation measurements, Vratislav Perina for RBS/ERDA analysis, and Miroslav Sirovy and Saint-Gobain Adfors CZ s.r.o. for providing glass fibers.

Conflicts of Interest

The authors declare no conflict of interest.

References

  1. Drzal, L.T.; Rich, M.J.; Lloyd, P.F. Adhesion of graphite fibers to epoxy matrices: I. the role of fiber surface treatment. J. Adhes. 1983, 16, 1–30. [Google Scholar] [CrossRef]
  2. Karger-Kocsis, J.; Mahmood, H.; Pegoretti, A. Recent advances in fiber/matrix interphase engineering for polymer composites. Prog. Mater. Sci. 2015, 73, 1–43. [Google Scholar] [CrossRef] [Green Version]
  3. Ikuta, N.; Yanagawa, A.; Suzuki, Y.; Ochiai, S. Investigation on resin interphase produced near silane-treated glass fiber in vinyl ester resin. Compos. Interfaces 2000, 7, 511–515. [Google Scholar] [CrossRef]
  4. Wu, Q.; Li, M.; Gu, Y.; Li, Y.; Zhang, Z. Nano-analysis on the structure and chemical composition of the interphase region in carbon fiber composite. Compos. Part A 2014, 56, 143–149. [Google Scholar] [CrossRef]
  5. Uribe, B.E.B.; Tarpani, J.R. Interphase analysis of hierarchical composites via transmission electron microscopy. Compos. Interfaces 2017, 24, 849–859. [Google Scholar] [CrossRef]
  6. Wu, Q.; Li, M.; Gu, Y.; Li, Y.; Zhang, Z. Imaging the interphase of carbon fiber composites using transmission electron microscopy: Preparations by focused ion beam, ion beam etching, and ultramicrotomy. Chin. J. Aeronaut. 2015, 28, 1529–1538. [Google Scholar] [CrossRef]
  7. Deschler, J.; Seiler, J.; Kindersberger, J. Detection of charges at the interphase of polymeric nanocomposites. IEEE Trans. Electr. Insul. 2017, 24, 1027–1037. [Google Scholar] [CrossRef]
  8. Gao, S.L.; Mäder, E. Characterisation of interphase nanoscale property variations in glass fibre reinforced polypropylene and epoxy resin composites. Compos. Part A 2002, 33, 559–576. [Google Scholar] [CrossRef]
  9. Cech, V.; Palesch, E.; Lukes, J. The glass fiber-polymer matrix interface/interphase characterized by nanoscale imaging techniques. Compos. Sci. Technol. 2013, 83, 22–26. [Google Scholar] [CrossRef]
  10. Huang, H.; Dobryden, I.; Thoren, P.A.; Ejenstam, L.; Pan, J.; Fielden, M.L.; Haviland, D.B.; Claesson, P.M. Local surface mechanical properties of PDMS-silica nanocomposite probed with Intermodulation AFM. Compos. Sci. Technol. 2017, 150, 111–119. [Google Scholar] [CrossRef]
  11. Sharahi, H.J.; Shekhawat, G.; Dravid, V.; Park, S.; Egberts, P.; Kim, S. Contrast mechanisms on nanoscale subsurface imaging in ultrasonic AFM: Scattering of ultrasonic waves and contact stiffness of the tip–sample. Nanoscale 2017, 9, 2330–2339. [Google Scholar] [CrossRef] [PubMed]
  12. Gibson, R.F. A review of recent research on nanoindentation of polymer composites and their constituents. Compos. Sci. Technol. 2014, 105, 51–65. [Google Scholar] [CrossRef]
  13. Hardiman, M.; Vaughan, T.J.; McCarthy, C.T. A review of key developments and pertinent issues in nanoindentation testing of fibre reinforced plastic microstructures. Compos. Struct. 2017, 180, 782–798. [Google Scholar] [CrossRef]
  14. Hardiman, M.; Vaughan, T.J.; McCarthy, C.T. The effect of fibre constraint in the nanoindentation of fibrous composite microstructures: A finite element investigation. Comput. Mater. Sci. 2012, 64, 162–167. [Google Scholar] [CrossRef]
  15. Hardiman, M.; Vaughan, T.J.; McCarthy, C.T. Fibrous composite matrix characterisation using nanoindentation: The effect of fibre constraint and the evolution from bulk to in-situ matrix properties. Compos. Part A 2015, 68, 296–303. [Google Scholar] [CrossRef]
  16. Gu, Y.; Li, M.; Wang, J.; Zhang, Z. Characterization of the interphase in carbon fiber/polymer composites using a nanoscale dynamic mechanical imaging technique. Carbon 2010, 48, 3229–3235. [Google Scholar] [CrossRef]
  17. Martínez-Tong, D.E.; Najar, A.S.; Soccio, M.; Nogales, A.; Bitinis, N.; López-Manchado, M.A.; Ezquerra, T.A. Quantitative mapping of mechanical properties in polylactic acid/natural rubber/organoclay bio nanocomposites as revealed by nanoindentation with atomic force microscopy. Compos. Sci. Technol. 2014, 104, 34–39. [Google Scholar] [CrossRef]
  18. Joliff, Y.; Rekik, W.; Belec, L.; Chailan, J.F. Study of the moisture/stress effects on glass fibre/epoxy composite and the impact of the interphase area. Compos. Struct. 2014, 108, 876–885. [Google Scholar] [CrossRef]
  19. Niu, Y.F.; Yang, Y.; Gao, S.; Yao, J.W. Mechanical mapping of the interphase in carbon fiber reinforced poly(ether-ether-ketone) composites using peak force atomic force microscopy: Interphase shrinkage under coupled ultraviolet and hydro-thermal exposure. Polym. Test. 2016, 55, 257–260. [Google Scholar] [CrossRef]
  20. Huang, H.; Dobryden, I.; Ihrner, N.; Johansson, M.; Ma, H.; Pan, J.; Claesson, P.M. Temperature-dependent surface nanomechanical properties of a thermoplastic nanocomposite. J. Colloid Interface Sci. 2017, 494, 204–214. [Google Scholar] [CrossRef] [PubMed]
  21. Riaño, L.; Belec, L.; Chailan, J.F.; Joliff, Y. Effect of interphase region on the elastic behavior of unidirectional glass fiber/epoxy composites. Compos. Struct. 2018, 198, 109–116. [Google Scholar] [CrossRef]
  22. Cech, V.; Lasota, T.; Palesch, E.; Lukes, J. The critical influence of surface topography on nanoindentation measurements of a-SiC:H films. Surf. Coat. Technol. 2015, 261, 114–121. [Google Scholar] [CrossRef]
  23. Cech, V.; Lukes, J.; Palesch, E.; Lasota, T. Elastic modulus and hardness of plasma-polymerized organosilicones evaluated by nanoindentation techniques. Plasma Process. Polym. 2015, 12, 864–881. [Google Scholar] [CrossRef]
  24. Drzal, L.T.; Herrera-Franco, P.J.; Ho, H. Fiber-matrix interface tests. In Comprehensive Composite Materials, 1st ed.; Kelly, A., Zweben, C., Eds.; Elsevier: Amsterdam, The Netherlands, 2000. [Google Scholar]
  25. Cech, V.; Hosein, H.A.; Lasota, T.; Drzal, L.T. Mechanical properties of plasma-polymerized tetravinylsilane films. Plasma Process. Polym. 2011, 8, 138–146. [Google Scholar] [CrossRef]
  26. Cech, V. Plasma polymer film as a model interlayer for polymer composites. IEEE Trans. Plasma Sci. 2006, 34, 1148–1155. [Google Scholar] [CrossRef]
  27. Oliver, W.C.; Pharr, G.M. An improved technique for determining hardness and elastic modulus using load and displacement sensing indentation experiments. J. Mater. Res. 1992, 7, 1564–1583. [Google Scholar] [CrossRef]
  28. Trivedi, R.; Hoferek, L.; Cech, V. Depth profile of mechanical properties of plasma-polymerized tetravinylsilane films evaluated by cyclic nanoindentation. Surf. Coat. Technol. 2011, 205, S470–S474. [Google Scholar] [CrossRef]
  29. Fischer-Cripps, A.C. The IBIS Handbook of Nanoindentation; Fischer-Cripps Laboratories: Forestville, Australia, 2005; p. 42. [Google Scholar]
  30. Syed Asif, S.A.; Wahl, K.J.; Colton, R.J.; Warren, O.L. Quantitative imaging of nanoscale mechanical properties using hybrid nanoindentation and force modulation. J. Appl. Phys. 2001, 90, 1192–1200. [Google Scholar] [CrossRef] [Green Version]
  31. Cech, V.; Janecek, P.; Lasota, T.; Bursa, J. A fiber-bundle pull-out test for surface-modified glass fibers in GF/polyester composite. Compos. Interfaces 2011, 18, 309–322. [Google Scholar] [CrossRef]
  32. The Interfacial Testing System (ITS); The Dow Chemical Company: Freeport, TX, USA, 2002.
  33. Cech, V.; Knob, A.; Lasota, T.; Lukes, J.; Drzal, L.T. Surface modification of glass fibers by oxidized plasma coatings to improve interfacial shear strength in GF/polyester composites. Polym. Compos. 2017. [Google Scholar] [CrossRef]
  34. Jones, F.R. A review of interphase formation and design in fibre-reinforced composites. J. Adhes. Sci. Technol. 2010, 24, 171–202. [Google Scholar] [CrossRef]
  35. Liu, K.; Piggott, M.R. Shear strength of polymers and fibre composites: 1. Thermoplastic and thermoset polymers. Composites 1995, 26, 829–840. [Google Scholar] [CrossRef]
  36. Cech, V.; Knob, A.; Hosein, H.A.; Babik, A.; Lepcio, P.; Ondreas, F.; Drzal, L.T. Enhanced interfacial adhesion of glass fibers by tetravinylsilane plasma modification. Compos. Part A 2014, 58, 84–89. [Google Scholar] [CrossRef]
  37. Palesch, E.; Cech, V. Characterization of interlayer adhesion on single glass fibers and planar glass using the nanoscratch test technique. Thin Solid Films 2017, 636, 353–358. [Google Scholar] [CrossRef]
  38. Palesch, E.; Knob, A.; Plichta, T.; Cech, V. Functional interlayers with controlled adhesion developed for polymer composites. Thin Solid Films 2018, 656, 37–43. [Google Scholar] [CrossRef]
  39. Bussey, D.; Perina, V.; Jones, F.R.; Cech, V. Effect of chemical modification on the mechanical properties of plasma-polymerized organosilicones. Prog. Org. Coat. 2018, 119, 85–90. [Google Scholar] [CrossRef]
  40. Cech, V. Plasma polymer films: From nanoscale synthesis to macroscale functionality. In Nanostructured Thin Films and Coatings; Zhang, S., Ed.; CRC Press: New York, NY, USA, 2010; Volume 1, pp. 481–527. ISBN 9781420094039. [Google Scholar]
Figure 1. Storage modulus mapping of the interphase region in model glass fiber (GF)/polyester composites for (a) unsized GF, (b) sized GF, and (c) a detailed profile close to the fiber/polymer interface.
Fibers 06 00058 g001
Figure 2. Modulus Mapping (scan area 3 × 3 µm2) across the interphase region with a polymer-like (hydrogenated amorphous carbon-silicon (a-C5.6Si:H5.0)) interlayer in a model GF/polyester composite: (a) map of the storage modulus, (b) storage modulus and topography profiles.
Fibers 06 00058 g002
Figure 3. Modulus Mapping (scan area 3 × 3 µm2) across the interphase region with the a-C2.2SiO2.6:H1.8 interlayer in a model GF/polyester composite: (a) map of the storage modulus, (b) storage modulus and topography profiles.
Fibers 06 00058 g003
Figure 4. Modulus Mapping (scan area 3 × 3 µm2) across the interphase region with a hydrogenated amorphous carbon-silicon oxide (a-C0.7SiO2.1:H0.8) interlayer in a model GF/polyester composite: (a) map of storage modulus, (b) storage modulus and topography profiles.
Fibers 06 00058 g004
Figure 5. Modulus Mapping (scan area 3 × 3 µm2) across the interphase region with the SiO2-like (a-C0.1SiO1.9:H0.4) interlayer in a model GF/polyester composite: (a) map of storage modulus, (b) storage modulus and topography profiles.
Fibers 06 00058 g005
Figure 6. Model simulations: (a) shear stress at interlayer/fiber interface as a function of indenter displacement for interlayers with different Young’s moduli during the microindentation test, (b) schematic correlation between shear yield strength and Young’s modulus for plasma coatings [25] and thermosetting or thermoplastic coatings.
Fibers 06 00058 g006
Figure 7. Analysis of thin films deposited on silicon wafers at 5.0 W from the tetravinylsilane (TVS)/O2 mixture at different oxygen fractions 0–0.46: (a) Young’s modulus determined from nanoindentation measurements, (b) oxygen concentration together with the O/Si ratio evaluated from Rutherford backscattering spectrometry (RBS)/elastic recoil detection analysis (ERDA) spectra, (c) infrared spectra for oxygen fractions 0–0.46, and (d) density of the film estimated from RBS spectra.
Fibers 06 00058 g007
Figure 8. Interfacial shear strength (IFSS) for plasma-coated glass GFs in the GF/polyester composite: (a) IFSS as a function of oxygen fraction in the TVS/O2 mixture used to deposit the interlayer at 5.0 W, (b) effect of GF pretreatment and post-treatment of plasma-coated GFs on IFSS for the same Interlayer A.
Fibers 06 00058 g008
Figure 9. (a) Infrared spectra of Interlayers A and B, (b) effect of the bilayer on IFSS for the same pretreatment of GFs.
Fibers 06 00058 g009
Figure 10. Interfacial shear strength (IFSS) for the GF/polyester composite reinforced with unsized, O2-plasma pretreated but uncoated, commercially sized, and optimized plasma-coated GFs.
Fibers 06 00058 g010

