Applying Image Processing to the Textile Grading of Fleece Based on Pilling Assessment


Department of Industrial Engineering & Management, National Chin-Yi University of Technology, Taichung 411, Taiwan
*
Author to whom correspondence should be addressed.
Fibers 2018, 6(4), 73; https://0-doi-org.brum.beds.ac.uk/10.3390/fib6040073
Submission received: 3 August 2018
/
Revised: 11 September 2018
/
Accepted: 26 September 2018
/
Published: 28 September 2018
(This article belongs to the Special Issue Smart Coatings on Fibers and Textiles)
Abstract
:Textile pilling causes an undesirable appearance on the surface of garments, which is a long-standing problem. In this study, textile grading of fleece based on pilling assessment was performed using image processing and machine learning methods. Two image processing methods were used. The first method involved using the discrete Fourier transform combined with Gaussian filtering, and the second method involved using the Daubechies wavelet. Furthermore, binarization was used to segment the textile pilling from the background. Morphological and topological image processing methods were applied to extract the essential characteristics of textile image information to establish a database for the textile. Finally, machine learning methods, namely the artificial neural network (ANN) and the support vector machine (SVM), were used to objectively solve the textile grading problem. When the Fourier-Gaussian method was used, the classification accuracies of the ANN and SVM were 96.6% and 95.3%, and the overall accuracies of the Daubechies wavelet were 96.3% and 90.9%, respectively.
1. Introduction
Standard testing methods of textile grading are based on wear resistance numbers and visual determination of the textile grade. These visual detection methods may cause errors. Using high-resolution images, Zheng et al. [1] proposed a two-step method to detect the yarn location and weave structure in a woven fabric. The results indicated that their methodology was effective in detecting the fabric structure and yarn float. Liu et al. [2] proposed an algorithm to integrate local texture features and whole-image texture information for detecting texture defects. The techniques used by Liu et al. [2] included the local binary pattern, salient region detection, and segmentation.
In a related work by Kuo et al. [3], a textile image processing technique was applied to detect textile defects; the study applied the wavelet transform to extract textile features and classified textile images into seven categories by using a neural network. The proposed method saved grading time and enhanced inspection capability. Deng et al. [4] applied the continuous wavelet transform to the pilling of textile images. Six textile features, namely entropy ratio, volume, area, area standard deviation, height standard deviation, and the location deviation coefficient, were confirmed as variables in the input layer of the back-propagation neural network to classify textile grades. Bissi et al. [5] presented an algorithm using the Gabor filter and principal component analysis to detect texture defects on a patch basis. Uniformly textured fabrics, visibly textured fabrics, and grid-like structured fabrics were tested, and the results outperformed those of other relevant studies.
Saharkhiz et al. [6] applied the two-dimensional (2D) fast Fourier transform method for image processing, considering low-pass filtering and a suitable cutoff frequency. Three features were extracted: The number of pilling points, volume, and area. This study used clustering methods, including median-cut, k-means, and competitive learning, to classify textile pilling. Yun et al. [7] applied the fast Fourier transform and fast wavelet transform for image processing. The following three crucial features were identified: The number of pilling points, total pixel area of pilling, and the sum of the gray values of pilling images. Jing et al. [8] developed an objective fabric pilling evaluation method that incorporated the wavelet transform and local binary pattern. Their study normalized the values of extracted features and applied the support vector machine as a classifier to evaluate pilling grades; the results indicated a grading accuracy of 95%. Based on a standard of the Woolmark SM50 blanket set, Zhang et al. [9] proposed an objective pilling evaluation method for nonwoven fabrics. The developed method was a combination of pilling identification, characterization, and a neural network; the results indicated the proposed classifier to be feasible.
This paper proposes an objective grading method for fleece based on pilling assessment to replace the subjective visual grading method and make textile grading robust through hierarchical steps. First, textile images are processed using image processing methods. In image processing, the Gaussian filter is ideal for image smoothing, and the Daubechies wavelet is commonly used in the medical field. In this study, two image processing methods were used, and their results were compared. One method involved the discrete Fourier transform (DFT) combined with Gaussian filtering, whereas the other method involved Daubechies wavelet filtering. After filtering the images, binarization was used to segment the pilling from the background. The textile grade worsens as the pilling increases. To develop an objective grading system, morphological and topological image processing methods were used to extract the essential parameters of the pilling. The textile image database featured five parameters, namely the number of pilling points, pilling area, average pilling area, pilling area ratio, and pilling density, which were extracted for each textile image. Artificial neural network (ANN) and support vector machine (SVM) models were used to train the data and objectively classify the textile grade.
2. Experiment
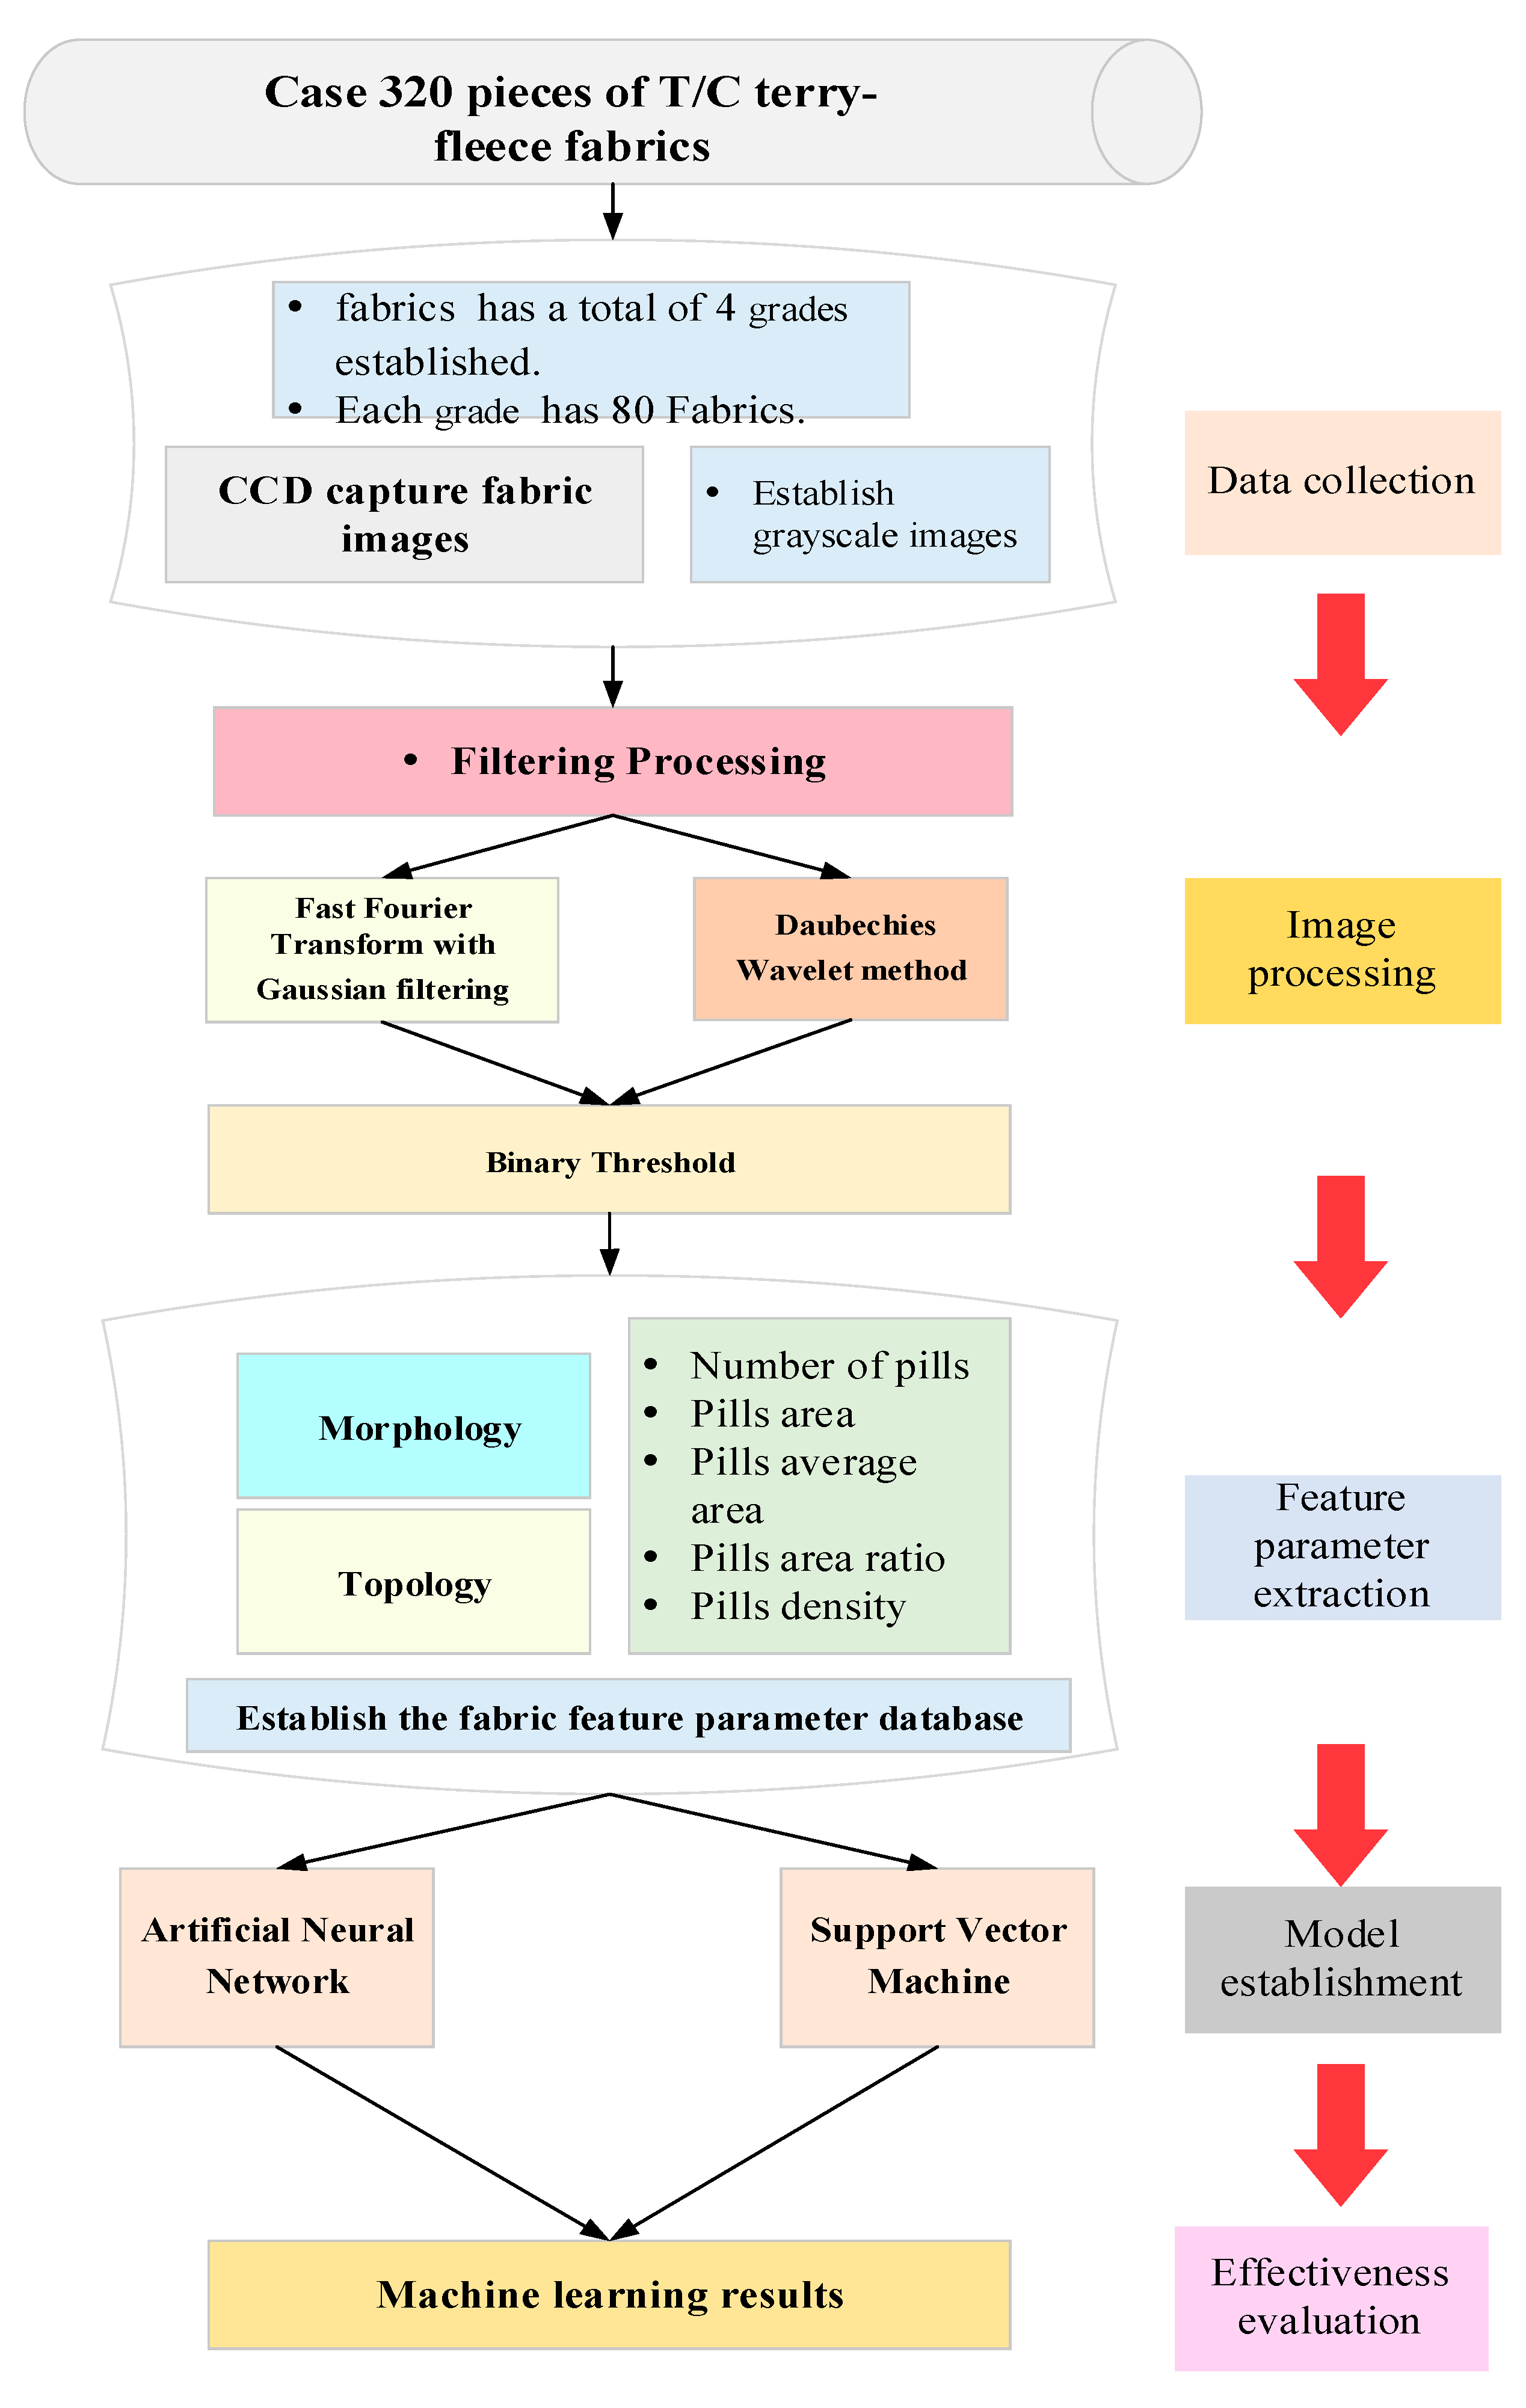
The proposed method involved five steps: Data acquisition, image processing, feature extraction, model building, and performance evaluation, see Figure 1.
Step 1: A total of 320 representative samples were collected and classified as grade 2, 3, 4, or 5. Each grade comprised of 80 samples. A charge coupled device (CCD) camera was used to capture the fabric image for constructing the grayscale image dataset of the 320 samples. The camera was placed over the sample to capture the image.
Step 2: The obtained grayscale images were filtered using two methods: the DFT method combined with Gaussian filtering and the Daubechies wavelet method. The DFT method combined with Gaussian filtering was used to smooth the grayscale images. The Daubechies wavelet method was used to compresses the grayscale images. To retain the information of textile pilling, the filtered images were transformed into black and white through binarization.
Step 3: Morphological and topological image processing methods were used to extract the essential parameters of the pilling. Five parameters were considered in this study, namely the number of pilling points, pilling area, average pilling area, pilling area ratio, and pilling density. The size of the database was 320 × 5.
Step 4: ANN and SVM models were used to classify the pilling. Finally, the classification rates of different classifiers were compared.
2.1. Sample
Textiles used in this study complied with the ISO 12945-2:2000 Martindale wear standards of textile grading. Five grades are present in this standard. Textiles categorized as grade 1 have the lowest quality, whereas textiles categorized as grade 5 have the highest quality. No grade 1 textiles were used in this study. Thus, 80 samples in each grade between 2 and 5 were examined. The appearance of grades 2–5 is shown in Table 1.
2.2. Textile Sample Collection
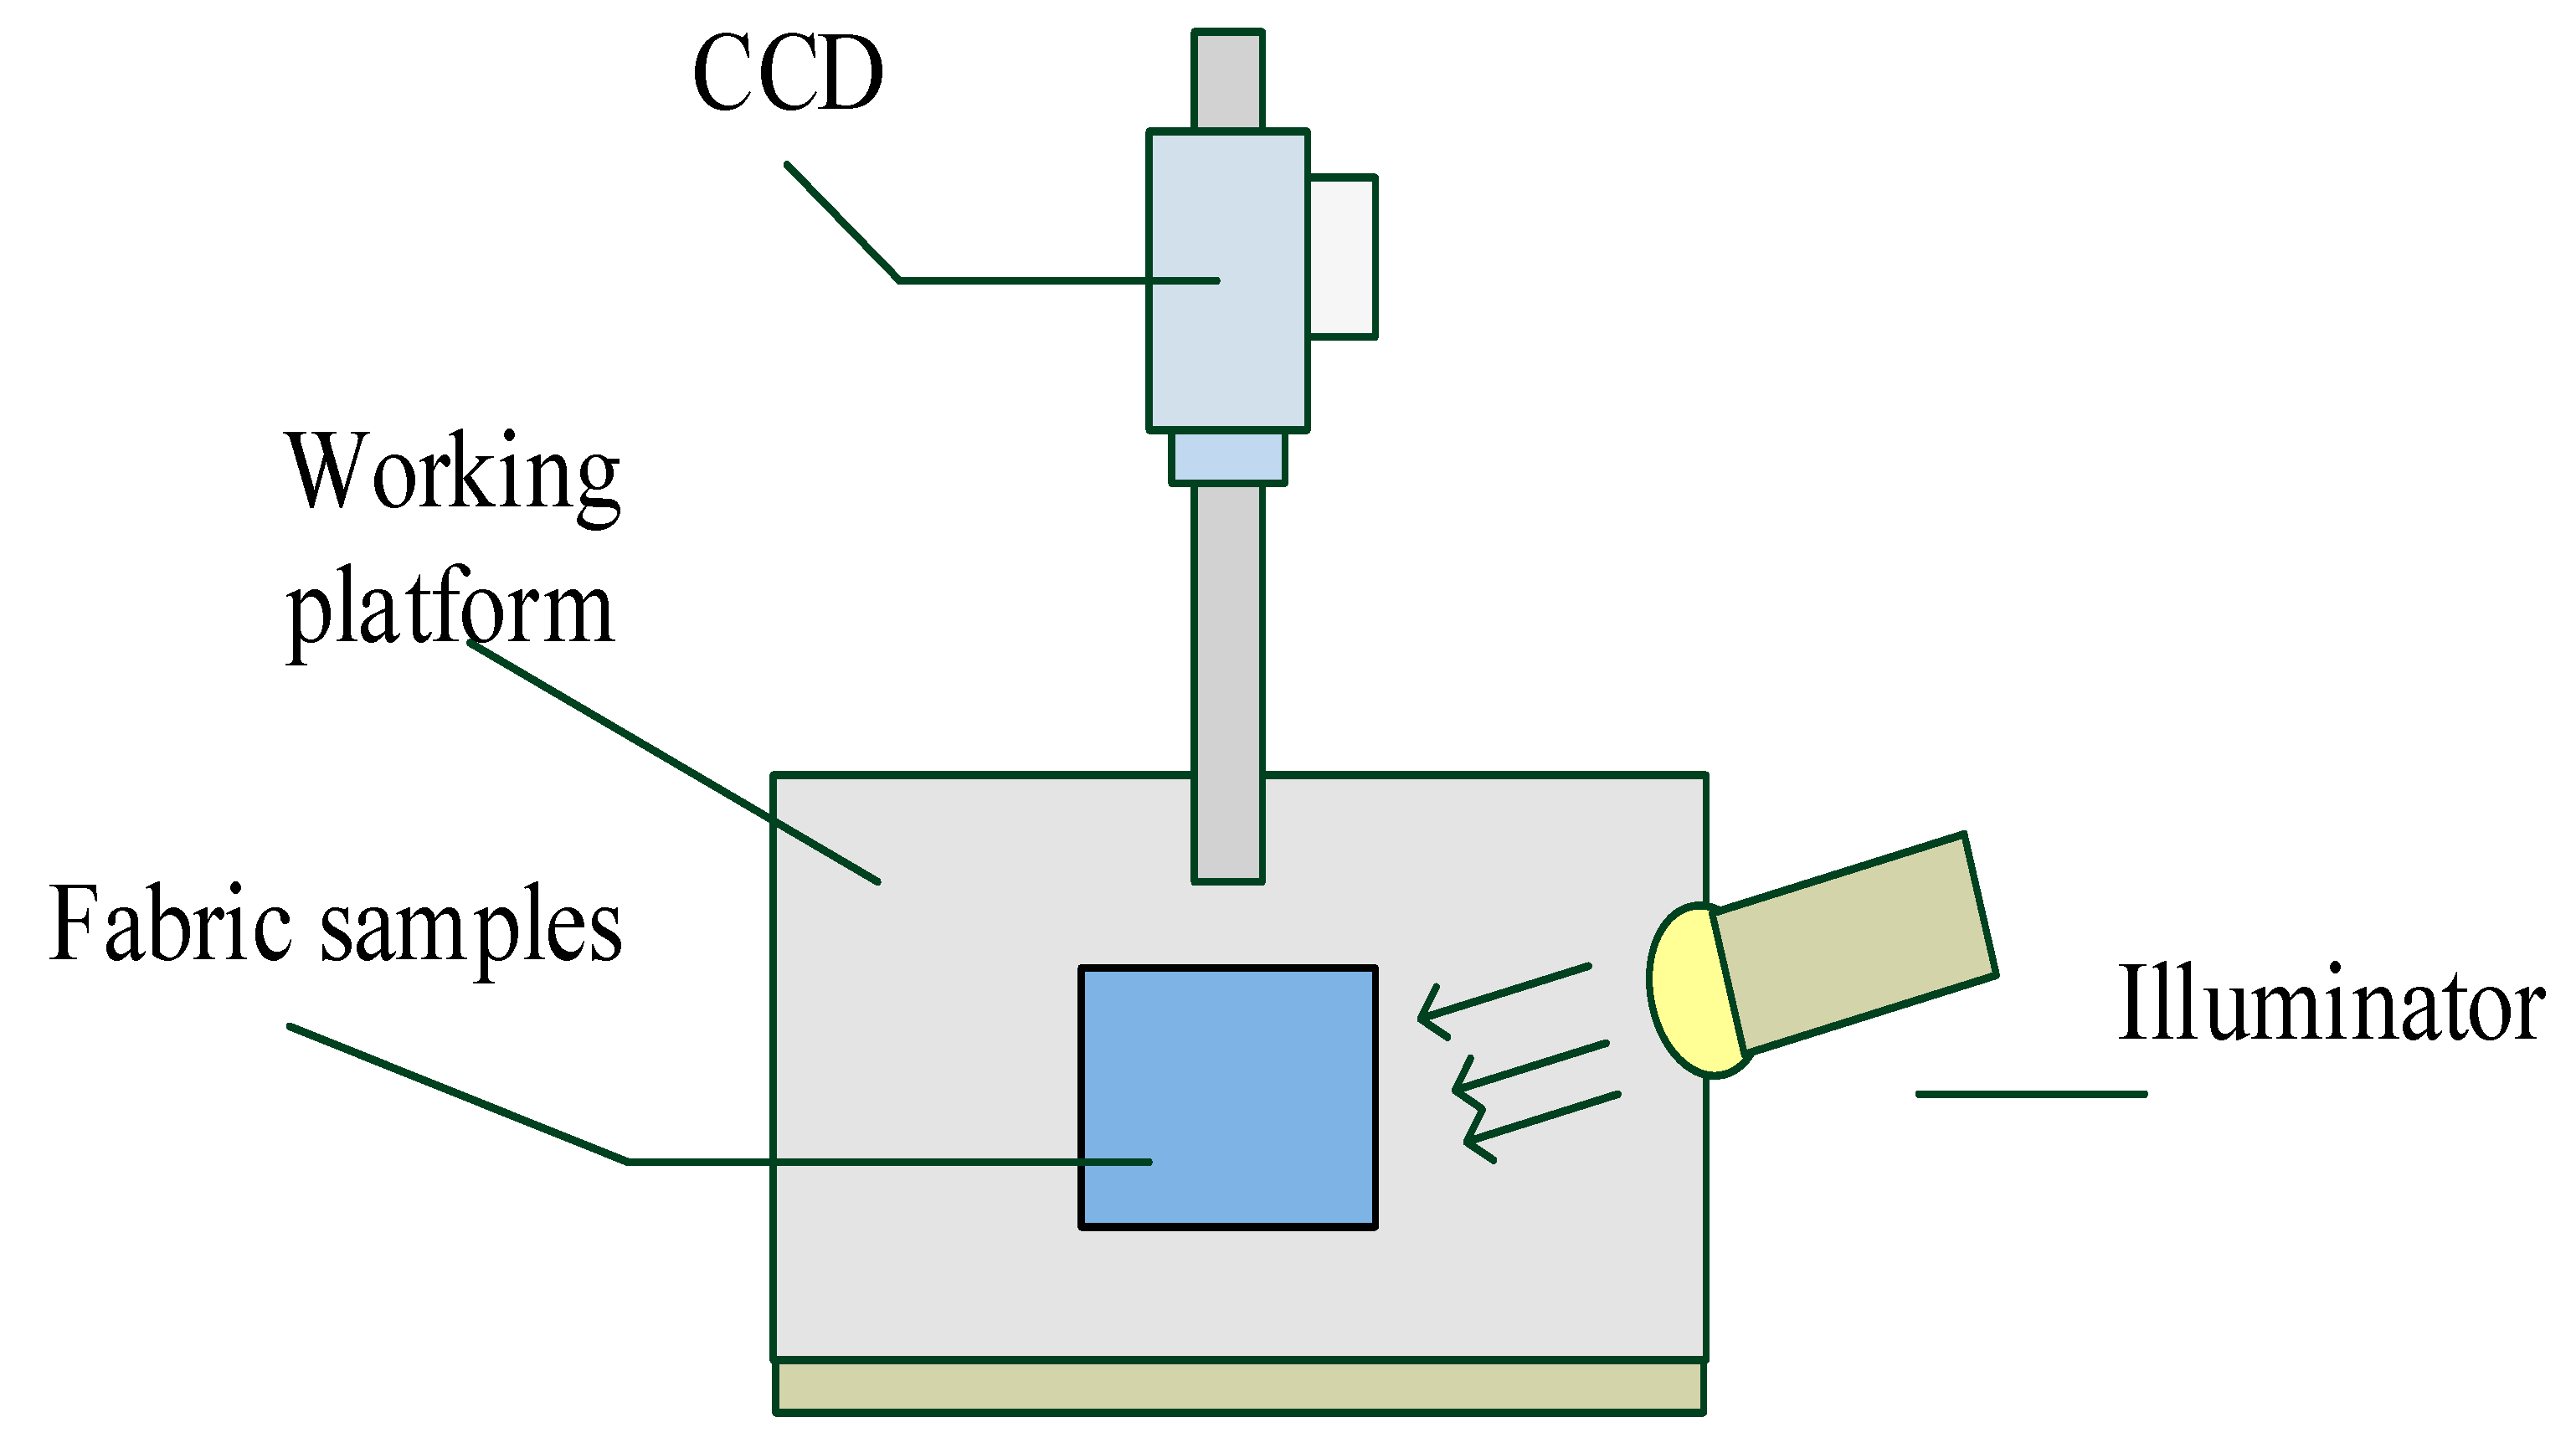
The specifications of the experimental equipment are listed in Table 2. The Basler A601f-2 CCD camera (Basler Vision Technologies, Hsinchu, Taiwan) with a resolution of 656 × 491 pixels and a frequency of 58 fps was used in this study. The fabric examined in this study was fleece; a testing sample was placed on the work platform with a 13 W light source, as displayed in Figure 2. The low-angle oblique illumination method suggested by Kayseri and Kirtay [10] and Saharkhiz et al. [6] was used to obtain positive lighting for capturing textile images. Low-angle oblique illumination is commonly used to detect and examine raised and depressed flaws on a flat surface. Low-angle oblique illumination reduces shadow generation and produces evenly illuminated images. Its disadvantage is that the flat surface may have a strong reflection. Table 3 presents the grayscale images of textile grades 2–5.
2.3. Image Processing
2.3.1 DFT with Gaussian Filtering
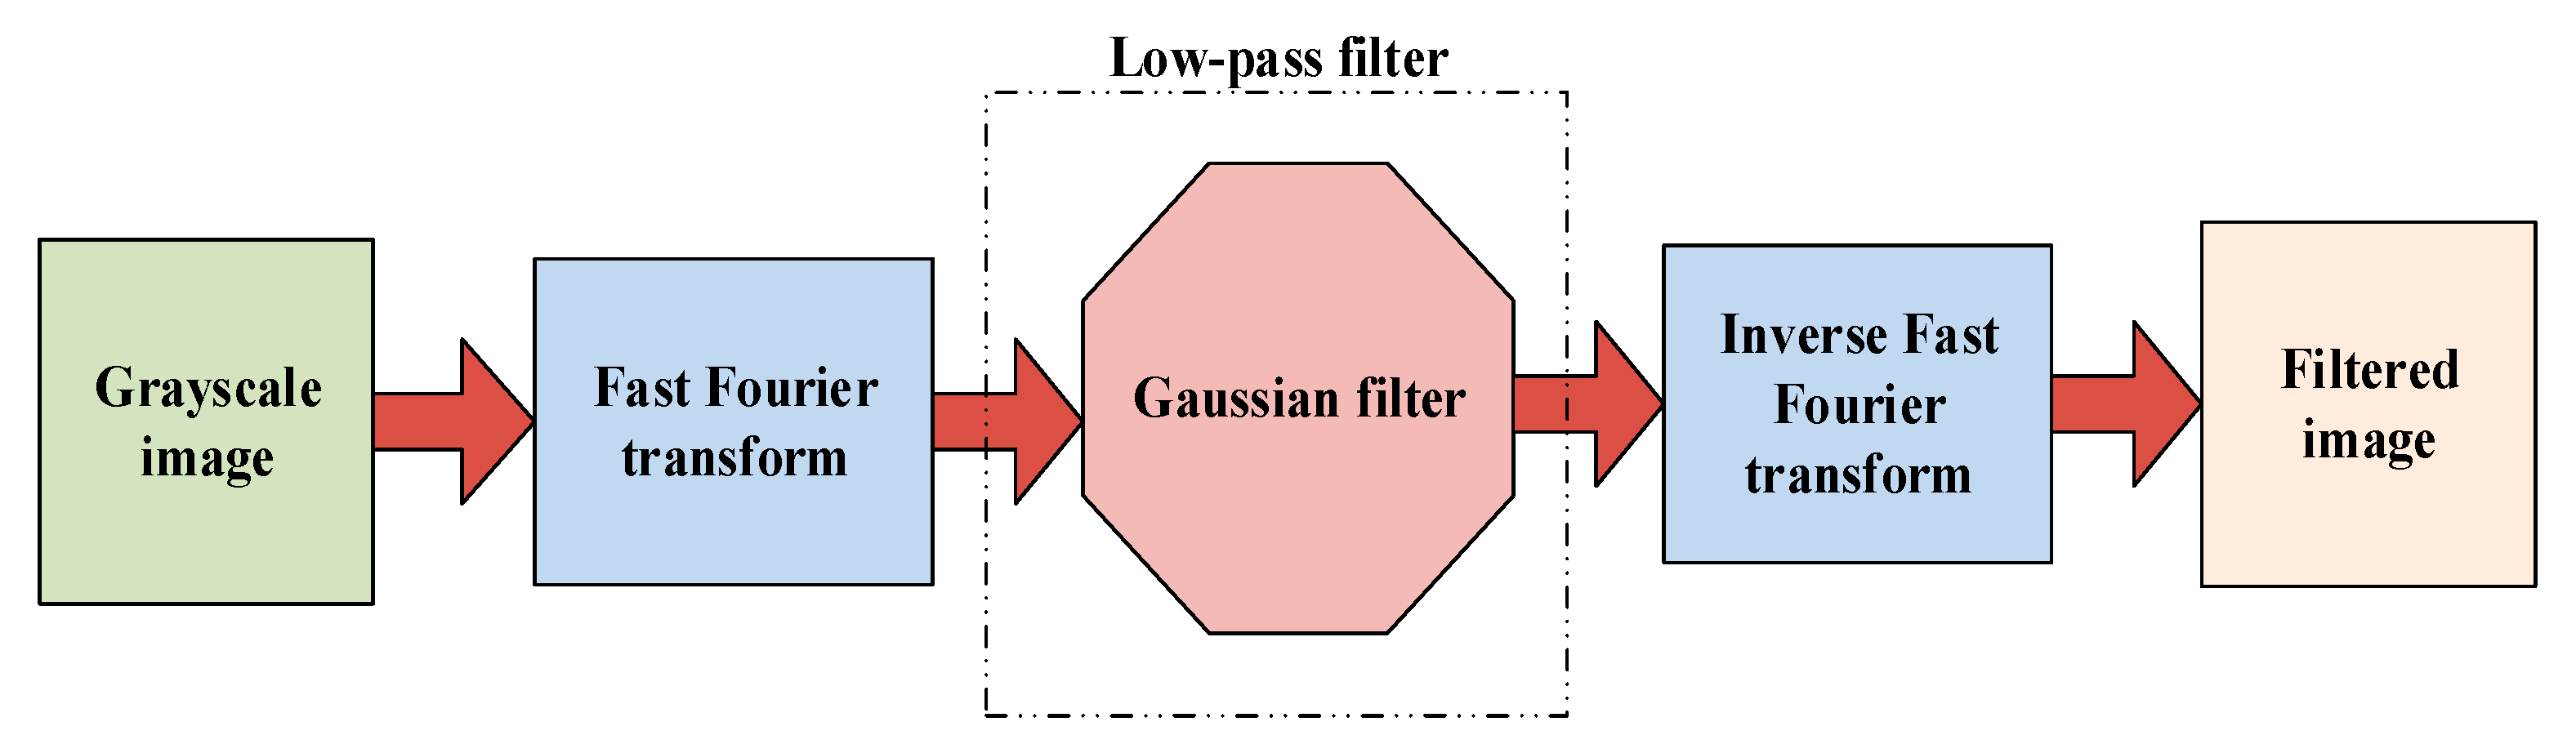
A low-pass filter is commonly used for image blurring or smoothing, whereas a high-pass filter is used for image edge enhancement. The Gaussian filter is the most widely used smoothing filter. The formula of the Gaussian filter is expressed as follows:
where u and v are the horizontal and vertical distances from the origin, respectively, and σ is the standard deviation of the Gaussian distribution. The DFT is designed for discrete and periodical signals. The DFT formula for discrete signals with and is presented in Equation (2). Using Equation (2), we can obtain an inverse conversion [F(x, y)] image with the signal and . The formula of the inverse DFT is provided in Equation (3).
In this study, the DFT and Gaussian filter were combined for image processing. A textile image of size M × N is filtered using Equation (4).
The purpose of the filtering procedure is to dilute the background texture of the textile. The image filtering process is illustrated in Figure 3. Matlab software was used to perform the filtering procedure. In the conversion of Gaussian filtering, we must set a value for the parameter, sigma. The default sigma value in Matlab is 0.5 for an image of size 3 × 3 pixels. The size of the textile images used in this study was 320 × 240 pixels. Several values of sigma between 10 and 50 were tested to compare the filtering performance for original and filtered textile images, see Table 4. A small value of sigma results in blurry images, as shown in Table 4. The larger the sigma value, the clearer the filtered image is.
The mask size of the filter was also considered in this study. The larger the value of sigma, the higher the distortion in the image is. When the sigma value was set to 50, the mask was larger than the image size, and the image exhibited distortion. Therefore, the sigma value of the filter mask size was set to 40 in this study. The filtered images and corresponding sigma values of the mask size are presented in Table 5.
2.3.2 Daubechies Wavelet
The Daubechies wavelet comprises the scaling function and wavelet function , as presented in Equations (5) and (6), respectively.
The commonly used filter lengths are between 2 and 20. Daubechies 4 (called D4) was used in this study. The expanded formulas for the Daubechies wavelet are as follows:
Commonly used image evaluation methods include the mean square error (MSE), signal to noise ratio (SNR), and peak signal to noise ratio (PSNR). Smaller MSE and larger SNR and PSNR values represent superior image quality. In this study, these indices were applied to evaluate image processing quality. In the Daubechies wavelet step, various scale values were simulated, and the evaluation indices MSE, SNR, and PSNR were computed to determine the image quality. Table 6 presents the image evaluation results for various scales. This study used Scale 1 because it had the lowest MSE value and the highest SNR and PSNR values.
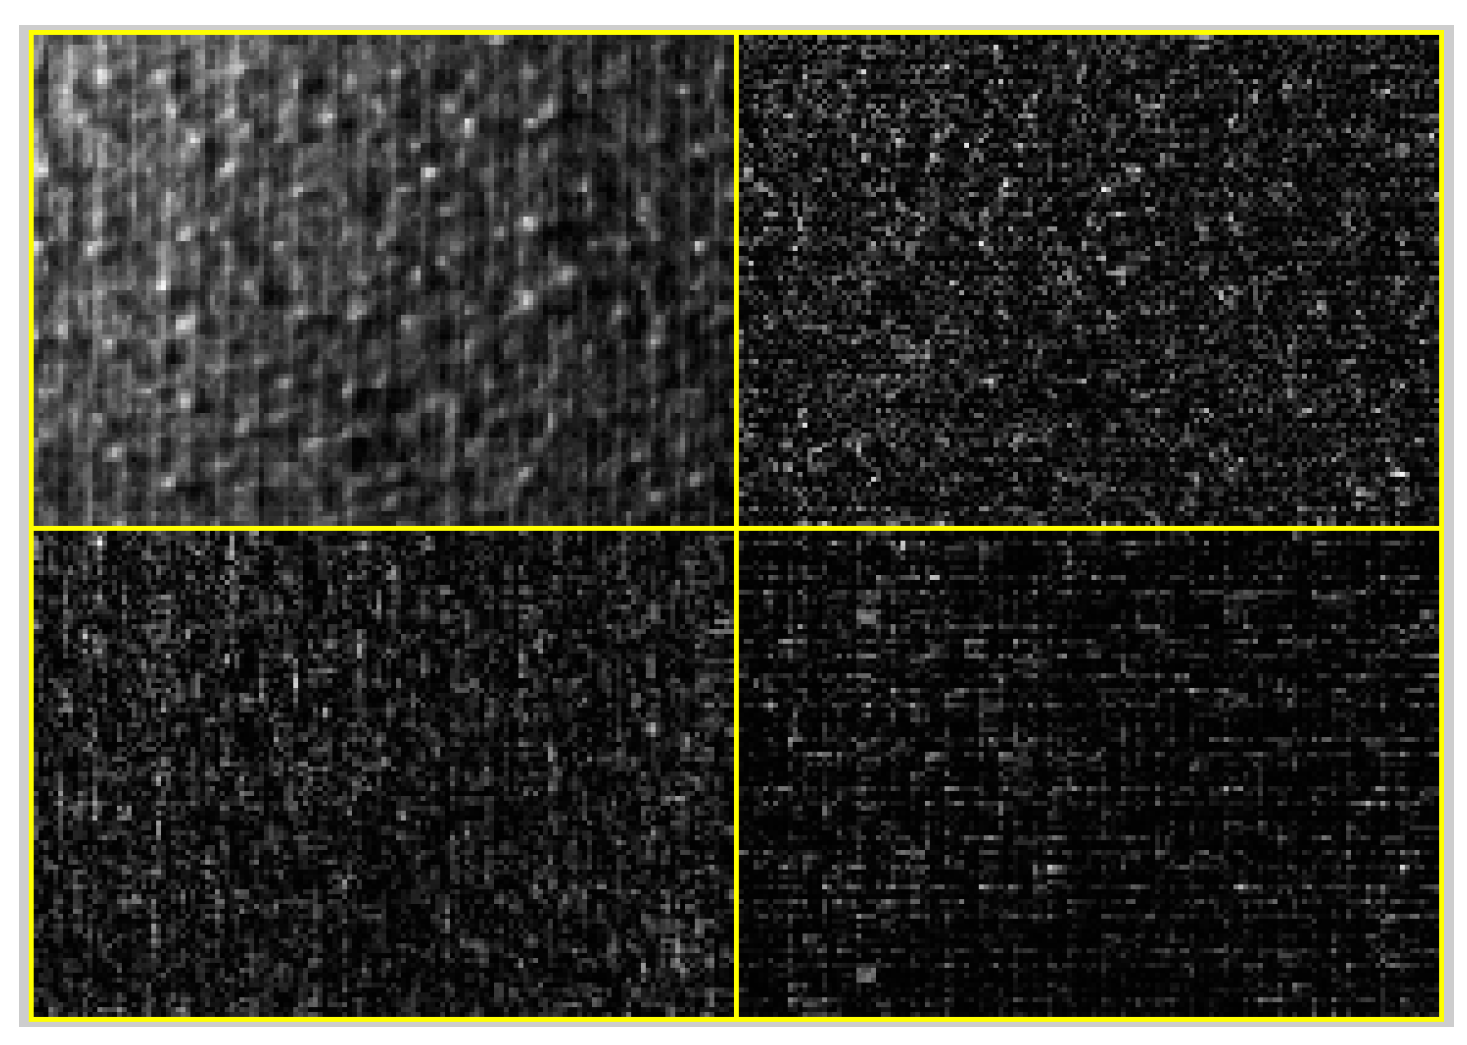
Based on the aforementioned discussion and the conversion steps of Umbaugh [11], six conversion steps were designed for the textile images in this study. Figure 4 shows the result of the wavelet transform.
- Wavelet conversion step 1: Use the low-pass filter to compute the convolution in the horizontal direction of the image.
- Wavelet conversion step 2: Use the low-pass filter to compute the convolution in the vertical direction of the image.
- Wavelet conversion step 3: Use the high-pass filter to compute the convolution in the horizontal direction of the image.
- Wavelet conversion step 4: Use the high-pass filter to compute the convolution in the vertical direction of the image.
- Wavelet conversion step 5: Use the low-pass filter to compute the convolution in the vertical direction of the image.
- Wavelet conversion step 6: Use the high-pass filter to compute the convolution in the vertical direction of the image.
2.3.3. Binarization
Binarization of the textile image was performed using the im2bw function in the Matlab DIP toolbox to convert the grayscale image to black and white. Thus, the converted image included only pure black and pure white pixels with values of 0 and 255, respectively. The default threshold value was 0.5. Thus, if the pixel value of the image was higher than 127.5 (255 × 0.5), the final value was set to 255. The final value was set to 0 if the pixel value was less than 127. Table 7 lists the results for the threshold values of 0.4, 0.5, and 0.6. A value of 0.6 was used in this study because it could extract the most critical characteristics of pills.
2.4. Step 3: Feature Extraction of the Filtered Textile Image
2.4.1. Morphological Image Processing
Morphological image processing was used to extract the essential characteristics of the filtered textile images. Erosion and dilation are the two basic operations in morphological image processing. The “opening operation” was used to handle binary images.
Opening operation: The given A and structuring element B (denoted by AB) represent an erosion followed by a dilation.
In the opening operation, erosion shrinks the image to remove any unessential information. The regions remaining after shrinking are dilated to the original size to highlight the essential pilling characteristics of the textile image.
2.4.2. Image Topology
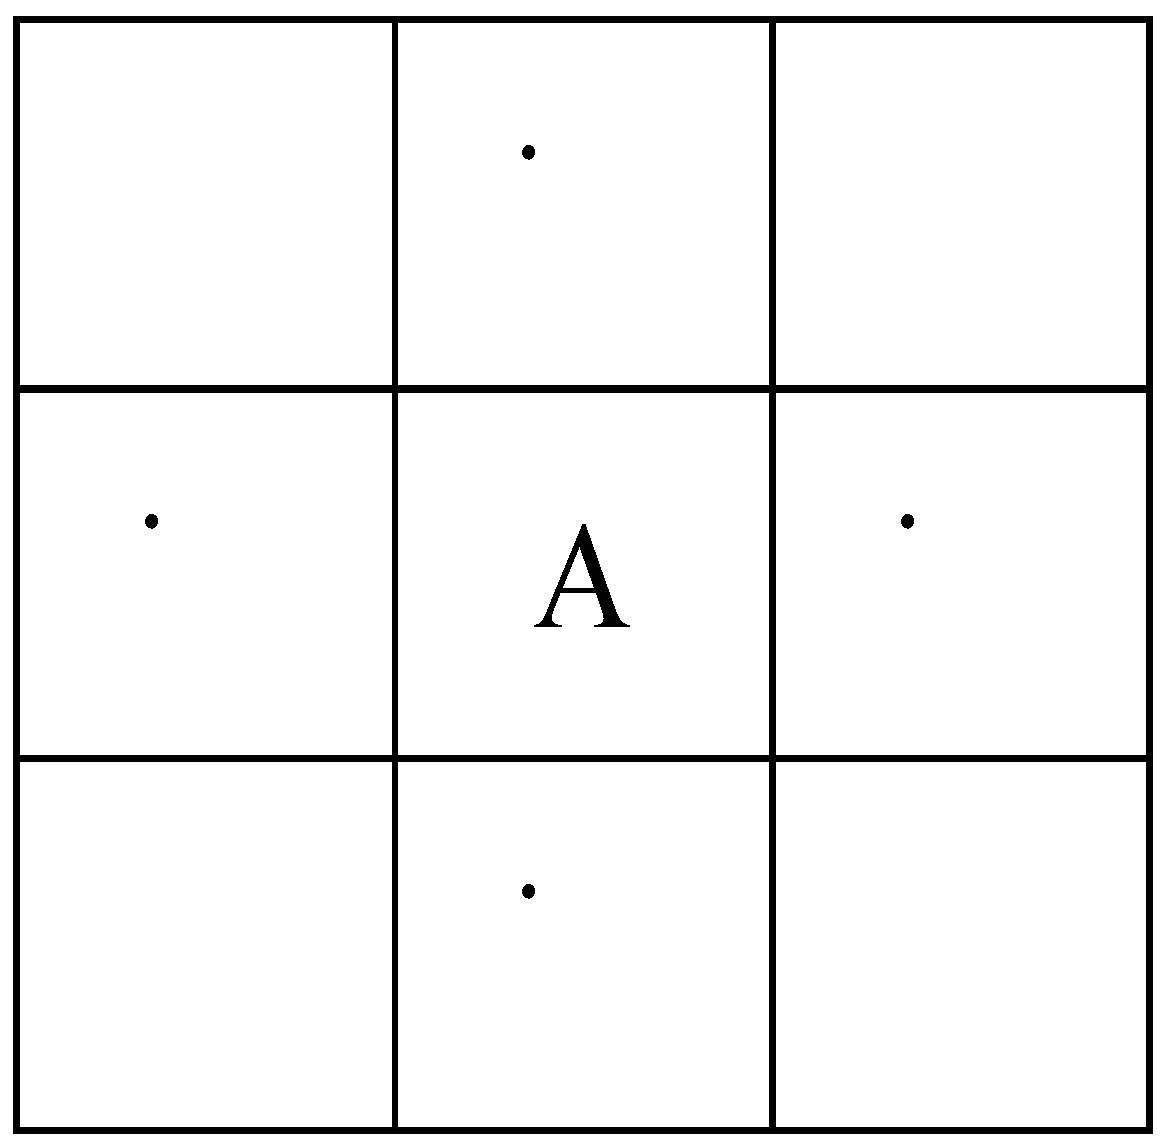
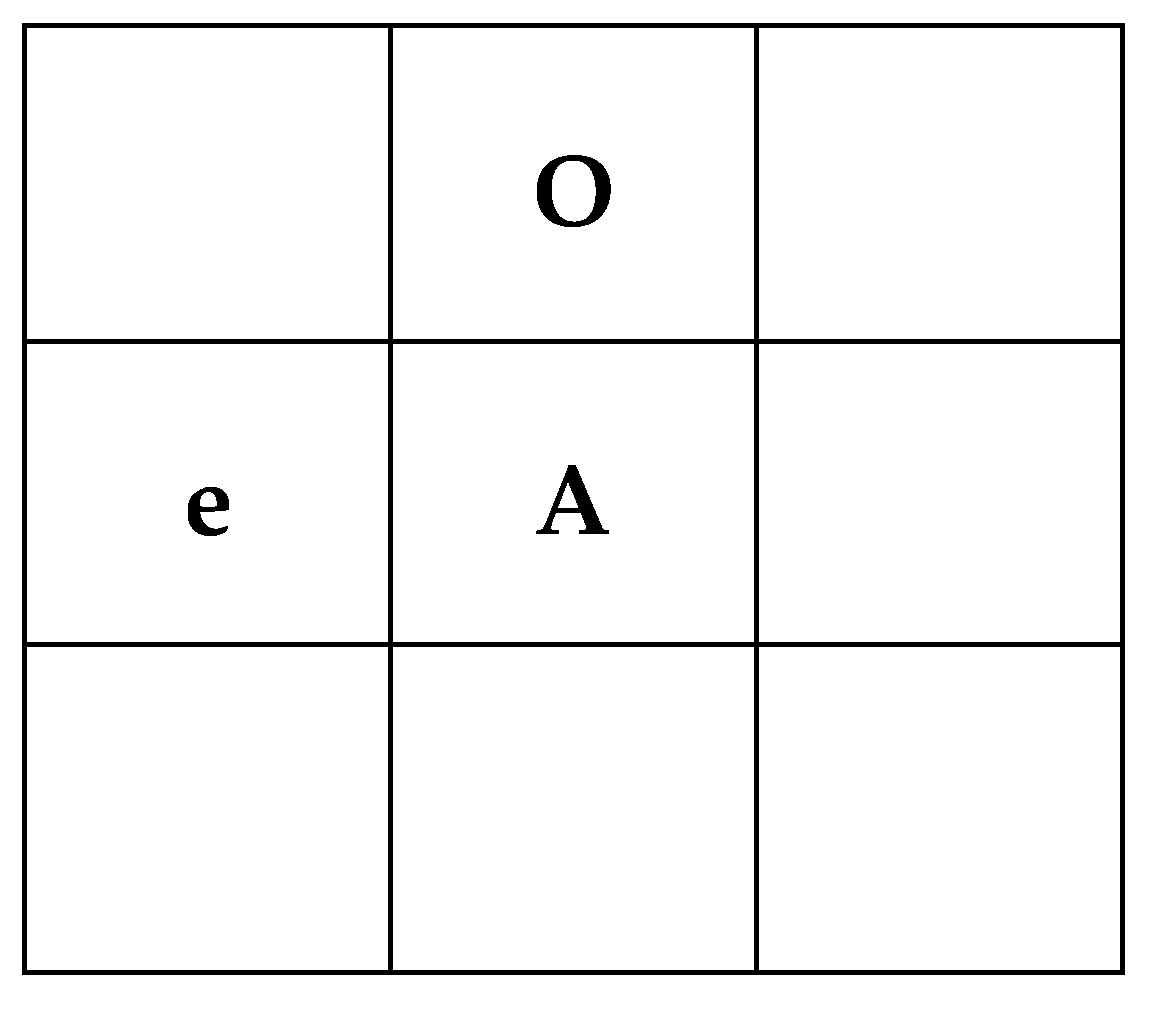
Image topology involves analyzing discrete objects in a 2D digital image and constructing a mathematical model to considerably simplify the algorithmic design. Assume that A is the current pixel. The top neighbor of A is o, and the left neighbor of A is e. A four-adjacency relationship defined for pixel A by adjacent positions is displayed in Figure 5 and Figure 6.
In this study, the topological approach was used, where pixels in the image were defined as foreground pixels and pixels not in the image were defined as background pixels, to calculate the number of pilling points and pilling area from the textile image.
2.4.3. Database Creation
The commonly used characteristics for textile grading are described as follows. Saharkhiz et al. [6] used the number of pilling points, pilling volume, and pilling area for textile grading. Eessouki et al. [12] used the number of pilling points, average pilling area, pilling area ratio, and pilling density extracted from the textile image for textile grading. The grading method proposed in this study involved examining five characteristics, namely the number of pilling points, pilling area, average pilling area, pilling area ratio, and pilling density extracted from the textile image. These five characteristics were examined for each sample. Based on the number of pilling points and the pilling area obtained from the textile image, the average pilling area, pilling area ratio, and pilling density were computed using Equations (10)–(12). The average pilling area is the pilling area divided by the number of pilling points. The pilling area ratio is the pilling area divided by the image size. The pilling density is the pilling area divided by the number of pilling points.
2.5. Step 4: Model Building for Textile Grading
2.5.1. ANN
An ANN is a machine learning tool in artificial intelligence that mimics the thoughts of humans. It can be applied in a wide range of areas, such as nonlinear models. An ANN usually includes three layers: input, hidden, and output layers. The presence of a large number of neurons in the hidden layer increases the accuracy of the results; however, it slows the convergence rate of the network. The data from Section 2.4.3 were used as the input. The number of neurons used in this study was the average number of variables in the input and output layers [i.e., (5 + 1)/2 = 3]. The number of pilling points, pilling area, average pilling area, pilling area ratio, and pilling density extracted from the textile image were used as input items in the ANN. The training set comprised 80% of the database, and the remaining 20% was used as the test set. Ten-fold cross-validation was applied in the ANN.
2.5.2. SVM
SVMs use a hyperplane in n-dimensional space to distinguish between two or more categories of information. The linear, polynomial, and radial functions are the commonly used core functions in an SVM. The performance of the radial function is superior to that of the other functions for high-dimensional information. Thus, the radial function was used in this study for textile grading. The Weka software (Version 3.6, The WEKA Workbench, Machine Learning Group at the University of Waikato, New Zealand) was used for SVM execution. The input items in the SVM were the same as those in the ANN. The parameter settings in the SVM are described as follows. The sigma value was set to 0.05, and the penalty function (C value) was set to 1 by default. The SVM termination condition was set to 1.0 × 10⁻⁶. The training set comprised 80% of the database, and the remaining 20% was used as the test set. Ten-fold cross-validation was applied in the SVM.
3. Experiment Results
3.1. Image Processing Results
Image processing results are presented in this section. Table 8 presents the image processing results of grade 2 textiles for each step. The second row in Table 8 represents the original textile image. The filtering results obtained using the DFT method combined with Gaussian filtering and the Daubechies wavelet method are displayed in the third row of Table 6. The textile image filtered using the DFT method combined with Gaussian filtering exhibited a diluted background texture. The Daubechies wavelet method filtered and compressed the original textile image to remove noise and enhance pilling characteristics. Through binarization, the image background was separated from the pilling. However, some white spots remained in the image. Morphological methods were then used to retain essential information and remove unessential information. The results obtained through binarization and morphological methods are displayed in the fourth and fifth rows in Table 6, respectively. The pilling features were highlighted and extracted to construct the dataset for machine learning to complete the final step of textile grading.
3.2. Classification Results Using Machine Learning
Using the dataset from Section 2.4.3, ANN and SVM models were executed. The grading performance of the models was compared. When the Fourier-Gaussian method was used, the classification accuracies of the ANN and SVM were 96.6% and 95.3%, respectively, see Table 9 and Table 10. Compared with human inspection and grading, textile grading through machine learning requires less processing time and achieves higher classification accuracy.
In the experiment, each grade comprised of 80 samples. When the Fourier-Gaussian method was used with the ANN, five grade 2 samples were classified as grade 3, one grade 2 sample was classified as grade 4, and five grade 3 samples were classified as grade 2, see Table 9. All the samples of grades 4 and 5 were correctly classified. Of the 320 samples, 309 were correctly graded, and 11 were misgraded. Thus, the overall accuracy was 96.6%.
When the Fourier-Gaussian method was used with the SVM, 12 grade 3 samples were classified as grade 2, and three grade 4 samples were classified as grade 3, see Table 10. All the grade 2 and 5 samples were correctly classified. Of the 320 samples, 305 were correctly graded, and 15 were misgraded. Thus, the overall accuracy was 95.3%.
When the Daubechies wavelet method was used with the ANN, five grade 2 samples were classified as grade 3, three grade 2 samples were classified as grade 4, two grade 3 samples were classified as grade 2, and two grade 3 samples were classified as grade 4, see Table 11. All the samples of grades 4 and 5 were correctly classified. Of the 320 samples, 308 were correctly graded, and 12 were misgraded. Thus, the overall accuracy was 96.3%.
When the Daubechies wavelet method was used with the SVM, 13 grade 2 samples were classified as grade 3, two grade 2 samples were classified as grade 4, 13 grade 3 samples were classified as grade 2, and one grade 3 sample was classified as grade 4, see Table 12. All the samples of grades 4 and 5 were correctly classified. Of the 320 samples, 291 were correctly graded, and 29 samples were misgraded. Thus, the overall accuracy was 90.9%.
Table 13 summarizes the performance of the two filters for the same grade 2 sample. The number of pilling points obtained through the Fourier-Gaussian method was 61, which was higher than that obtained through the Daubechies wavelet method. With the Fourier-Gaussian method, the pilling area was 1552, whereas the pilling area with the Daubechies wavelet method was only 545. Thus, the performance of the Fourier-Gaussian filter was superior to that of the Daubechies wavelet filter.
3.3. Comparison with Related Studies
The method used by Saharkhiz et al. [6] was applied to the textile images used in this study. The image processing results obtained using the Fourier transform with an ideal filter are presented in Table 14. After filtering, we followed the procedure described in Section 2.4. The final grading performance is listed in Table 15. When using the ANN, the grading accuracy of the Fourier transform with an ideal filter was 96.8%. When using the SVM, the grading accuracy of the Fourier transform with an ideal filter was 92.2%. When the ANN was selected as the classifier, the grading accuracies of the three image processing methods were similar. However, when the SVM was used, the DFT method with Gaussian filtering had the highest grading accuracy of 95.3%.
4. Discussion and Conclusions
Several machine learning and filtering methods have been proposed for pilling assessment. In the present study, a combination of the Fourier-Gaussian method with an ANN, a combination of Fourier-Gaussian with an SVM, a combination of Daubechies wavelet with an ANN, and a combination of Daubechies wavelet with an SVM were investigated; these have not been applied to the fabric grading of fleece in any related studies. To demonstrate the performance achieved by the proposed techniques, the method used by Saharkhiz et al. [6] was applied to textile images. The results indicated the grading accuracies to be close (approximately 96%) when ANN machine learning was used along with various filtering methods between the proposed methods and the related work. In addition, when using the SVM machine learning method, the grading accuracy from Fourier-Gaussian dominated the other two methods.
In this study, a textile grading method that comprises of image processing and machine learning classification is proposed as a replacement for visual textile grading. Two filtering methods were used in this study, namely the DFT combined with Gaussian filtering as well as Daubechies wavelet filtering. Binarization was used to segment the pilling from the background, and morphological and topological image processing methods were used to extract the essential parameters of the pilling. Two machine learning methods, ANN and SVM, were used to train the data and objectively classify the textile grade. Although the grading accuracies of the proposed methods were satisfactory, other image filtering and machine learning methods can be used for textile grading in future research.
This study demonstrates various filtering techniques with different machine learning algorithms for the fabric grading of fleece. The effectiveness of the grading results depends on different colors and materials as well as other factors. Due to the diverse characteristics of fabric textures, colors, and densities, a general grading system for all types of fabric may not result in accurate grading; therefore, extracting crucial attributes and developing specific grading methods for different fabrics are the optimal solutions.
Author Contributions
M.-L.H. conceived of the presented idea and verified the analytical methods. C.-C.F. carried out the experiments. Mei-Ling Huang wrote the paper. All authors discussed the results and contributed to the final version of the manuscript.
Funding
This study was partially supported by the Ministry of Science and Technology, Taiwan, ROC, under the grant MOST 106-2221-E-167-015. The APC was funded by the Ministry of Science and Technology, Taiwan, ROC.
Conflicts of Interest
The authors declare no conflicts of interest.
References
- Zheng, D.; Han, Y.; Hu, J.L. A new method for classification of woven structure for yarn-dyed fabric. Text. Res. J. 2014, 84, 78–95. [Google Scholar] [CrossRef]
- Liu, Z.; Li, C.; Zhao, Q.; Liao, L.; Dong, Y. A fabric defect detection algorithm via context-based local texture saliency analysis. Int. J. Cloth. Sci. Technol. 2015, 27, 738–750. [Google Scholar] [CrossRef]
- Jeffrey Kuo, C.-F.; Shih, C.-Y.; Huang, C.-C.; Wen, Y.-M. Image inspection of knitted fabric defects using wavelet packets. Text. Res. J. 2016, 86, 553–560. [Google Scholar] [CrossRef]
- Deng, Z.; Wang, L.; Wang, X. An integrated method of feature extraction and objective evaluation of fabric pilling. J. Text. Inst. 2011, 102, 1–13. [Google Scholar] [CrossRef]
- Bissi, L.; Baruffa, G.; Placidi, P.; Ricci, E.; Scorzoni, A.; Valigi, P. Automated defect detection in uniform and structured fabrics using gabor filters and pca. J. Vis. Commun. Image Represent. 2013, 24, 838–845. [Google Scholar] [CrossRef]
- Saharkhiz, S.; Abdorazaghi, M. The Performance of Different Clustering Methods in the Objective Assessment of Fabric Pilling. J. Eng. Fibers Fabr. 2012, 7, 35–41. [Google Scholar]
- Yun, S.Y.; Kim, S.; Park, C.K. Development of an objective fabric pilling evaluation method. II. Fabric pilling grading using artificial neural network. Fibers Polym. 2013, 14, 2157–2162. [Google Scholar] [CrossRef]
- Jing, J.; Zhang, Z.; Kang, X.; Jia, J. Objective evaluation of fabric pilling based on wavelet transform and the local binary pattern. Text. Res. J. 2012, 82, 1880–1887. [Google Scholar] [CrossRef]
- Zhang, J.; Wang, X.; Palmer, S. Objective pilling evaluation of wool fabrics. Text. Res. J. 2007, 77, 929–936. [Google Scholar] [CrossRef]
- Kayseri, G.O.; Kirtay, E. Part 1. Predicting the Pilling Tendency of the Cotton Interlock Knitted Fabrics by Regression Analysis. J. Eng. Fibers Fabr. 2015, 10, 110–120. [Google Scholar]
- Umbaugh, S.E. Computer Vision and Image Processing: A Practical Approach Using CVIP Tools; Prentice Hall: Bergen county, NJ, USA, 1998. [Google Scholar]
- Eessouki, M.; Bukhari, H.A.; Hassan, M.; Qashqari, K. Integrated Computer Vision and Soft Computing System for Classifying the Pilling Resistance of Knitted Fabrics. Fibres Text. East. Eur. 2014, 22, 106–112. [Google Scholar]
Figure 1.
Research flowchart.

Figure 2.
Image capture diagram.

Figure 3.
Filtering process.

Figure 4.
Result of the wavelet transform.

Figure 5.
Four neighbors.

Figure 6.
Four adjacency positions.


Table 1.
Sample of the textile grade.
| Grade 2 | Grade 3 | Grade 4 | Grade 5 |
|---|---|---|---|
 |  |  |  |
Table 2.
Specifications of the experimental equipment.
| CCD | Model | Pixels | Frequency |
|---|---|---|---|
 | Basler A601f-2 | 656 × 491 | 58FPS |
| Lens | Model | Focal Length | Maximum Aperture Ratio |
 | M2514-MP2 | 25 mm | 1:1.4 |
Table 3.
CCD images of textiles.
| Picture | Grade 2 | Grade 3 | Grade 4 | Grade 5 |
|---|---|---|---|---|
| Grayscale image |  |  |  |  |
Table 4.
Filtered images with corresponding sigma values.
| Original Image | Sigma Value | Filtered Image |
|---|---|---|
 | 10 |  |
 | 20 |  |
 | 30 |  |
 | 40 |  |
 | 50 |  |
Table 5.
Filter mask size.
| Sigma = 30 | Sigma = 40 | Sigma = 50 |
|---|---|---|
 |  |  |
Table 6.
Image evaluation results.
| Image | MSE | SNR | PSNR |
|---|---|---|---|
| Original | 0 | Infinite | Infinite |
| Scale 1 | 2.010 | 23.902 | 33.491 |
| Scale 2 | 4.937 | 19.570 | 29.170 |
| Scale 3 | 8.468 | 16.118 | 25.234 |
| Scale 4 | 8.656 | 16.306 | 25.924 |
| Scale 5 | 9.269 | 15.609 | 25.239 |
| Scale 6 | 10.108 | 14.770 | 24.414 |
| Scale 7 | 12.562 | 13.128 | 22.693 |
Table 7.
Results using different thresholds.
| Threshold 0.4 | Threshold 0.5 | Threshold 0.6 |
|---|---|---|
 |  |  |
Table 8.
Image processing results of the textile image.
| Grade 2 | Fourier with Gaussian | Daubechies Wavelet |
|---|---|---|
| The original image |  |  |
| Filtering processing |  |  |
| Binarization |  |  |
| Morphology |  |  |
| Mark the results |  |  |
Table 9.
Results of Fourier-Gaussian Method with artificial neural network (ANN).
| Predict Actual | Grade 2 | Grade 3 | Grade 4 | Grade 5 | Correct number | 309 |
| Grade 2 | 74 | 5 | 1 | 0 | ||
| Grade 3 | 5 | 75 | 0 | 0 | Wrong number | 11 |
| Grade 4 | 0 | 0 | 80 | 0 | ||
| Grade 5 | 0 | 0 | 0 | 80 | Accuracy | 96.6% |
Table 10.
Results of Fourier-Gaussian Method with support vector machine (SVM).
| Predict Actual | Grade 2 | Grade 3 | Grade 4 | Grade 5 | Correct number | 305 |
| Grade 2 | 80 | 0 | 0 | 0 | ||
| Grade 3 | 12 | 68 | 0 | 0 | Wrong number | 15 |
| Grade 4 | 0 | 3 | 77 | 0 | ||
| Grade 5 | 0 | 0 | 0 | 80 | Accuracy | 95.3% |
Table 11.
Results of the Daubechies wavelet method with the ANN.
| Predict Actual | Grade 2 | Grade 3 | Grade 4 | Grade 5 | Correct number | 308 |
| Grade 2 | 72 | 5 | 3 | 0 | ||
| Grade 3 | 2 | 76 | 2 | 0 | Wrong number | 12 |
| Grade 4 | 0 | 0 | 80 | 0 | ||
| Grade 5 | 0 | 0 | 0 | 80 | Accuracy | 96.3% |
Table 12.
Results of the Daubechies wavelet method with the SVM.
| Predict Actual | Grade 2 | Grade 3 | Grade 4 | Grade 5 | Correct number | 291 |
| Grade 2 | 65 | 13 | 2 | 0 | ||
| Grade 3 | 13 | 66 | 1 | 0 | Wrong number | 29 |
| Grade 4 | 0 | 0 | 80 | 0 | ||
| Grade 5 | 0 | 0 | 0 | 80 | Accuracy | 90.9% |
Table 13.
Comparison of Grade 2 Textile Filtering Methods.
| Filtering Method | The Number of Pilling | Pilling Area |
|---|---|---|
| Fourier-Gaussian | 61 | 1552 |
| Daubechies wavelet | 41 | 545 |
Table 14.
Results of the Fourier transform with ideal filtering.
| Method | Grade 2 | Grade 3 | Grade 4 | Grade 5 |
|---|---|---|---|---|
| Fourier-Ideal |  |  |  |  |
Table 15.
Comparison of textile grading methods.
| Author | Filter | ANN | SVM |
|---|---|---|---|
| Saharkhiz et al. [6] | Fourier-Ideal | 96.8% | 92.2% |
| This research | Fourier-Gaussian | 96.6% | 95.3% |
| Daubechies wavelet | 96.3% | 90.9% |
© 2018 by the authors. Licensee MDPI, Basel, Switzerland. This article is an open access article distributed under the terms and conditions of the Creative Commons Attribution (CC BY) license (http://creativecommons.org/licenses/by/4.0/).
Share and Cite
MDPI and ACS Style
Huang, M.-L.; Fu, C.-C. Applying Image Processing to the Textile Grading of Fleece Based on Pilling Assessment. Fibers 2018, 6, 73. https://0-doi-org.brum.beds.ac.uk/10.3390/fib6040073
AMA Style
Huang M-L, Fu C-C. Applying Image Processing to the Textile Grading of Fleece Based on Pilling Assessment. Fibers. 2018; 6(4):73. https://0-doi-org.brum.beds.ac.uk/10.3390/fib6040073
Chicago/Turabian StyleHuang, Mei-Ling, and Chien-Chang Fu. 2018. "Applying Image Processing to the Textile Grading of Fleece Based on Pilling Assessment" Fibers 6, no. 4: 73. https://0-doi-org.brum.beds.ac.uk/10.3390/fib6040073
Note that from the first issue of 2016, this journal uses article numbers instead of page numbers. See further details here.