Effect of Density and Fiber Size on Porosity and Thermal Conductivity of Fiberboard Mats

1
Centre de Recherche sur les Matériaux Renouvelables (CRMR), Université Laval, 2425 rue de la Terrasse, Québec, QC G1V 0A6, Canada
2
Direction de la Modernisation de L’industrie des Produits Forestiers, Ministère des Forêts, de la Faune et des Parcs, 5700, 4e avenue Ouest, bureau A-202, Québec, QC G1H 6R1, Canada
*
Author to whom correspondence should be addressed.
Fibers 2018, 6(4), 81; https://0-doi-org.brum.beds.ac.uk/10.3390/fib6040081
Submission received: 31 August 2018
/
Revised: 11 October 2018
/
Accepted: 14 October 2018
/
Published: 19 October 2018
(This article belongs to the Special Issue Natural Fibre Biocomposites)
Abstract
:The thermal conductivity and porosity of fiberboard mats are crucial parameters for efficient energy consumption of the hot-pressing process and for final panel quality. In this work, the effect of fiber size and mat density on porosity and thermal conductivity of the mat were investigated. The fiber size was characterized as fine, medium and coarse. The mat porosity was measured by image analysis using the black and white contrast method. The thermal conductivity was determined at different density levels with a temperature gradient of 1.6 °C mm−1 and 7.6% (s = 0.3) moisture content. The results showed that fiber size was a dominant variable governing heat conduction and mat porosity. The mats made with medium size fibers showed a higher resistance to compression. The thermal conductivity of coarse fiber mats decreased drastically between 700 kg m−3 and 810 kg m−3. This was likely due to a higher fracture frequency observed for coarse fibers in comparison to the other fiber sizes studied. Hence, the fine and medium fibers conducted heat more efficiently. Moreover, fiber bundles and fractured fibers were observed during the mat porosity measurements, principally in mats made with fine fiber size.
1. Introduction
Medium density fiberboard (MDF) is a wood-based composite widely used in residential applications and recognized for its easy machining, excellent surface properties and finishing quality. In the industrial manufacture of MDF, hot pressing is a key step due to its impact on the performance of the final panel and the plant productivity. Hot pressing is a complex process because the thickness, density and internal structure of the fiberboard mat change during compression. There is a common agreement that hot pressing of fiber mats involves two different mechanisms: Heat and mass transfer and mat rheological behavior [1,2,3,4,5]. During hot pressing, heat and mass transfer take place in the fibrous material and in the void spaces of the fiber mat. This heat is transferred from press platens to the fiber mat by conduction. The heated fibers generate vapor due to the evaporation of the moisture contained in the fibers. The vapor migrates through void spaces due to a differential vapor pressure between the fibers and the void spaces. Then, part of this vapor is condensed and absorbed partially by the fibers and the remaining vapor flows through the void network by convection and migrates to the environment [1,6,7]. Therefore, mat porosity may affect this moisture transfer and the mechanical behavior of the fiber mat during the development of the density profile through the mat thickness.
The characterization of the mat thermal conductivity and porosity is fundamental because these mat properties are needed in hot-pressing simulation models. An important issue for heat and mass transfer is the behavior of the mat internal structure during hot pressing. The dominant mechanisms of heat and mass transfer during hot pressing are convection of water vapor and heat conduction [1,4,8]. Thermal conductivity determines the conductive heat transfer from the press platens to the mat core and the edges of the fiber mat [8,9]. Besides, convective heat and vapor transfer take place mainly within the void network in the fiber mat [10].
Thermal conductivity is a physical property characterizing the ability of a material to conduct heat. Siau [11] has described thermal conductivity as a relationship between heat flux and the temperature gradient. Later, Von Haas [1] has defined the thermal conductivity of MDF as a function of density as follows:
where ρ is mat density (kg m−3).
Given that during hot pressing, heat flows by conduction in the fiber mat, fiber size may have a significant impact. The characterization of the effect of particle size on heat conduction through mat thickness is essential to improving the energy efficiency of hot pressing. Previous works performed by Kavazović et al. [9] and Hata et al. [12] have shown that particle size could affect the physical mechanisms involved during hot pressing and also the quality of simulation models’ predictions.
Mat porosity is related to transfer mechanisms and to the density profile development. A closer look at the effect of fiber size and density on mat porosity could help to determine the optimal conditions for the vertical density profile development, improving the final properties of fiberboard. However, few studies have been devoted to this topic. Kamke and Zylkowski [13] have proposed that the void network of the fiberboard mat is more homogeneous than other wood-based composite materials such as oriented strandboard (OSB) and particleboard mats because of a more homogeneous particle size. Delisée et al. [14] have proposed that during the first stages of mat compression, the reduction of the void space between fibers could explain the reduced volume of the mat. Inside this network, fiber bundles produce irregular structures in the mat. Moreover, in fiberboard manufacturing, long fibers are often desirable because they favor a better contact between fibers. This allows increasing the heat conduction during hot pressing. Nevertheless, small fibers may have an impact on the structure of the fiberboard mat, improving its compression efficiency [15,16].
Some studies have suggested that the fibrous structure of the panel affects its thermal conductivity. For instance, Kamke and Zylkowski [13] have found that at the same density, wood-based panels have a lower thermal conductivity than solid wood most likely due to the more continuous structure of solid wood. Suleiman et al. [17] proposed that the dominant factors for thermal conductivity of the mat could be mat porosity and thermal conductivity of the particles. Belley [18] suggested that mat density and fiber size effects may interact with the thermal conductivity of the mat.
The objective of this study was to evaluate the effect of fiber size and mat density on porosity and thermal conductivity of the mat. The relationship between mat porosity and heat conduction was also investigated. Accordingly, this study contributes to characterizing the relationship between various levels of mat compression and fiber size on the evolution of controlling properties of the temperature and internal gas pressure of the mat during hot pressing. This work is included in a broader research project aimed at characterizing the heat and mass transfer phenomena involved in the hot pressing process of fiberboard for use in a simulation model.
2. Materials and Methods
White spruce (Picea glauca (Moench) Voss) fibers obtained from wood chips at green-state of trees harvested at the Petawawa Research Forest, Mattawa, Ontario, Canada were used for fiberboard manufacturing.
2.1. Refining and Characterization of Fiber Size
Fiber refining was performed at FPInnovations, Québec City, Québec, Canada. For this process, an Andritz disk refiner with a disk diameter of 55.9 cm was used. Thus, 200 kg of air-dried white spruce chips were used to produce 150 kg of refined fibers. For panel manufacturing, an average of 2 to 3 kg of fibers was used for each panel. Accordingly, we used a total of 135 kg of refined fibers. The same refining temperature and pressure were applied to produce different fiber sizes, but the spacing and speed of the refiner disks were changed as presented in Table 1 [19]. The refined fibers were shipped to the Renewable Materials Research Center, Laval University, Québec, Canada.
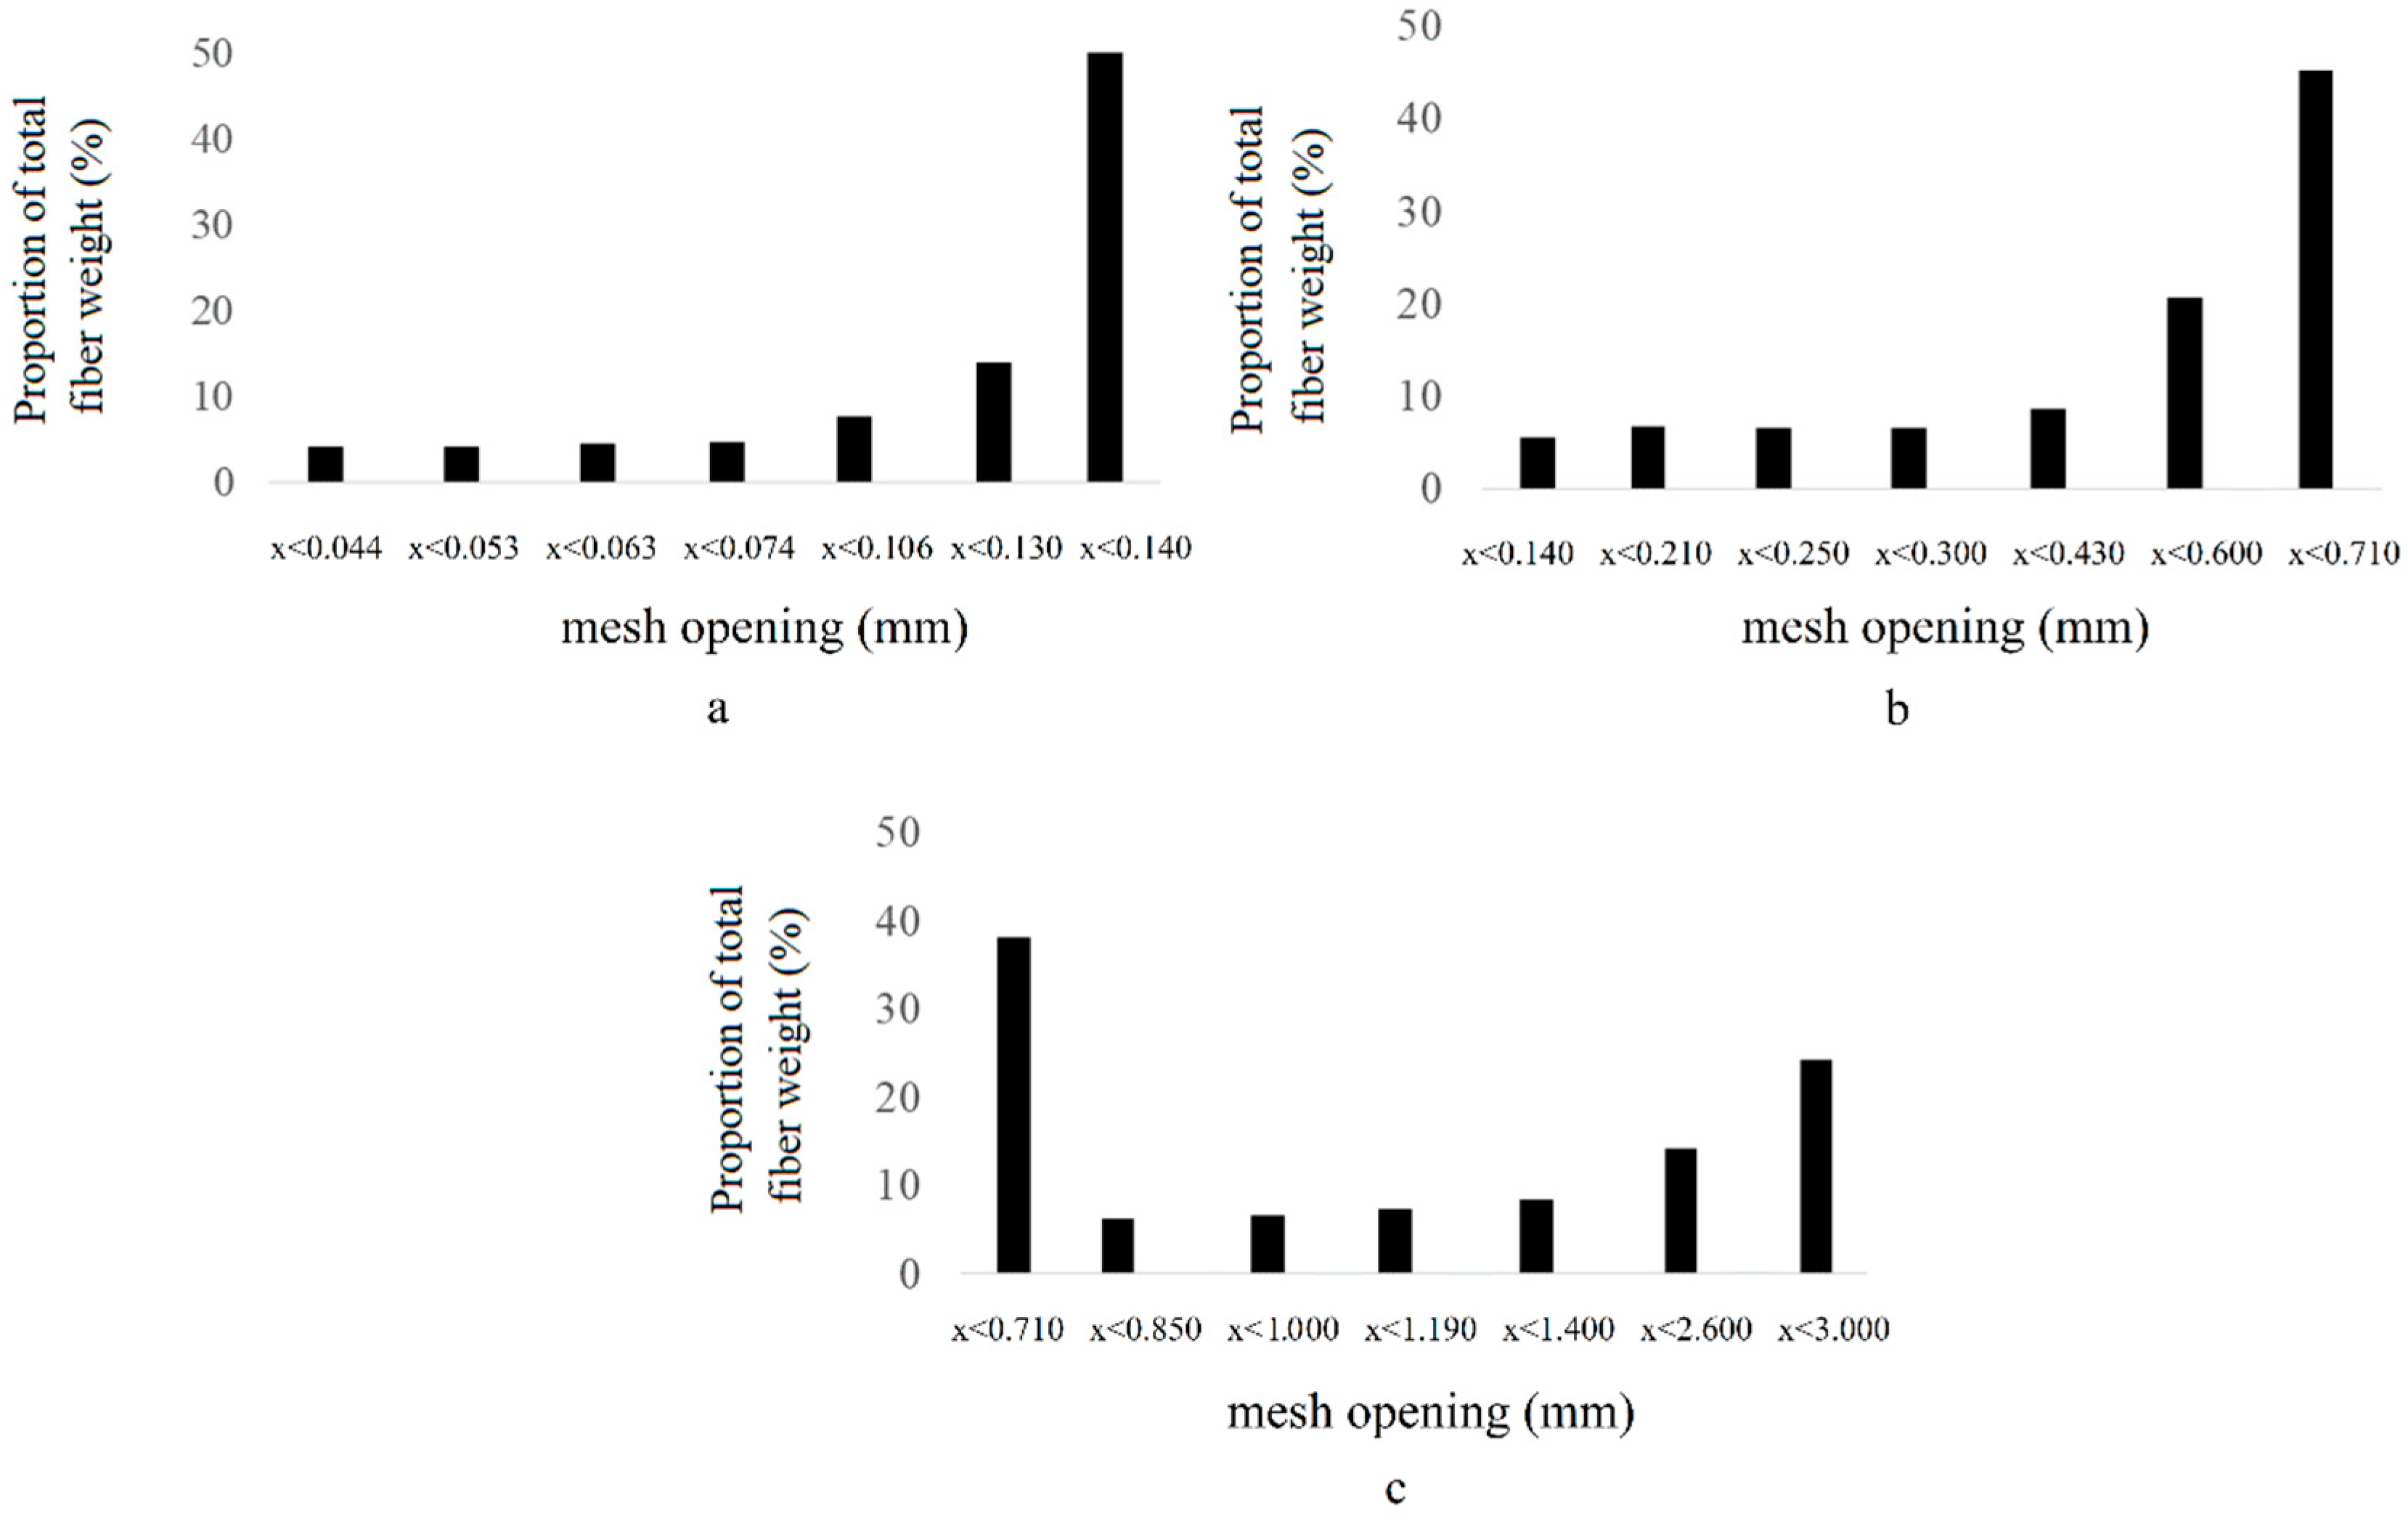
The fiber sizes were characterized. The fibers were sieved using a US Electrical Motors sieving machine model F844-SMA with a set of seven mesh openings (Fisher Scientific Company, Ottawa, ON, Canada), different for each fiber size according to Figure 1. Samples of 0.500 kg of each fiber size were sieved. Mesh openings between 0.044 mm and 3.00 mm were used [19]. During the fiber characterization, the screens were ordered from smallest to largest. A higher proportion of the total fiber weight was obtained in sieves with a large mesh opening for the three fiber sizes. However, for coarse fibers, a higher proportion of the total fiber weight was noticed in the smallest sieve (fiber size lower than 0.710 mm). For medium fibers, the highest percentage of weight was observed for mesh openings between 0.60 and 0.71 mm. For the fine fibers, the higher fiber weight was obtained for mesh openings between 0.13 and 0.14 mm. Therefore, a fiber size of 0.13 mm for fine fiber size, 0.71 mm for medium fiber size and 3.00 mm for coarse fiber size was considered to manufacture the fiberboards used in this work.
2.2. Homogeneous Density Profile Approach and Density Profile Measurements
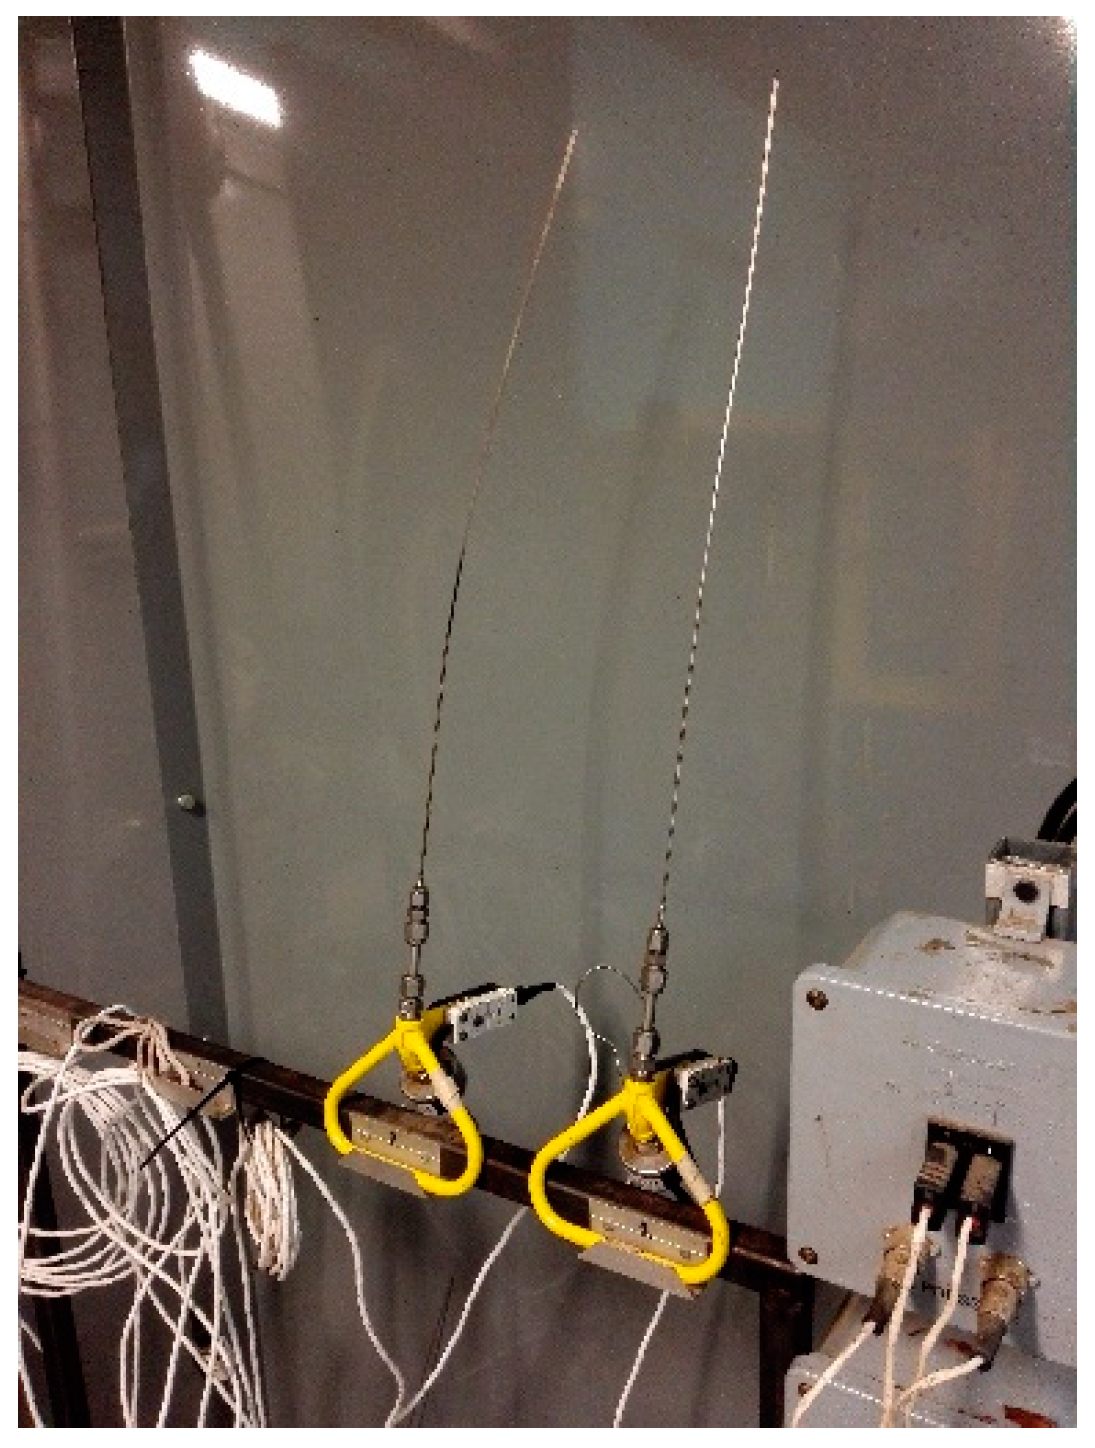
In the present work, laboratory panels with homogeneous or uniform density profile through their thickness were manufactured. This method allows the removal of the effect of density variation through the panel thickness. Hence, a total of 45 fiberboards were manufactured with this method at three different fiber sizes and five density levels: 200 kg m−3, 400 kg m−3, 600 kg m−3, 800 kg m−3 and 1000 kg m−3. Thus, each density level corresponded to a specific level of mat compression depicting the mat local density produced during hot pressing. The laboratory panels were prepared as follows [19]: First, the fibers were dried to a final moisture content of 2 to 3% in a lumber dryer with a capacity of 2.5 m3 at a temperature of 60 °C and a relative humidity of 17%. The dried fibers were stored in plastic bags to prevent any moisture uptake. Dried fibers were blended with 14% formaldehyde urea adhesive (UF) based on wood oven-dry mass at 70% solid content, 1% wax based on wood oven-dry mass at 58% solid content, 14% distilled water based on oven-dry mass and 0.2% liquid UF adhesive basis of ammonium chloride at a concentration of 25% to reduce the pH to 5 [19]. The equipment used for blending was an in-house built drum blender equipped with pneumatic atomizers. After blending, the fibers tended to form small balls. They were then passed through a screen refiner (Model PSKM6-350, Pallman, Zweibrücken, Germany) to eliminate these balls. After this process, the fine and medium size fibers had maintained their size distribution. However, the coarse fibers showed a more homogeneous size distribution through the different mesh openings. Next, 560 mm × 460 mm mats were hand-formed in a mold and pre-pressed to a thickness of 120 mm at room temperature using an in-house built cold. The pre-pressing was performed to reduce the closure time in the hot-pressing process. A hot press (Dieffenbacher, Alpharetta, GA, USA) temperature probe was located at the center of the mat to monitor core temperature and vapor pressure (Figure 2). The pre-pressed mats were then hot-pressed with the press platens temperature increasing from 86 °C to 103 °C to obtain the flat vertical density profiles desired. The mats were pressed to a target thickness of 16 mm in about 75 min. Once the target temperature of 86 °C was reached in the core of the mat, the temperature was increased by 5 °C steps every 15 min until 103 °C was reached in the core of the mat because the polymerization temperature of urea formaldehyde is about 100 °C (with NH4Cl catalyst). The panel was then kept in the hot press at 103 °C for 3 min [19]. The total manufacturing duration for each panel was 1 h approximately. Next, the laboratory panels were conditioned for 14 days to 65% relative humidity and 21 °C temperature.
The density profile was determined for each specimen extracted from each laboratory panel. Six specimens of 16 mm thickness and 50 mm diameter were extracted from each panel and conditioned to 65% relative humidity and 21 °C temperature. An X-ray densitometer (Quintek Measurement Systems Inc., model QDP-01X, Knoxville, TN, USA) was used to measure the vertical density profile of all the specimens. These measurements were made at intervals of 0.02 mm through the specimen thickness. The density profiles obtained revealed a homogeneous density profile through the mat thickness as expected [19].
2.3. Mat Anhydrous Density Determination
The mat density is a function of oven-dry density and moisture content [5,7]. In the present investigation, the oven-dry or anhydrous density was obtained from Equation (2):
where ρmat is mat density (kg m−3), and M is mat moisture content (dimensionless). The anhydrous density was determined for fiber mats made with fine, medium and coarse fiber sizes. A second-degree polynomial equation for thermal conductivity as a function of the anhydrous density was determined for fine, medium and coarse fiber mats.
2.4. Specimen Preparation for Porosity and Thermal Conductivity Determination
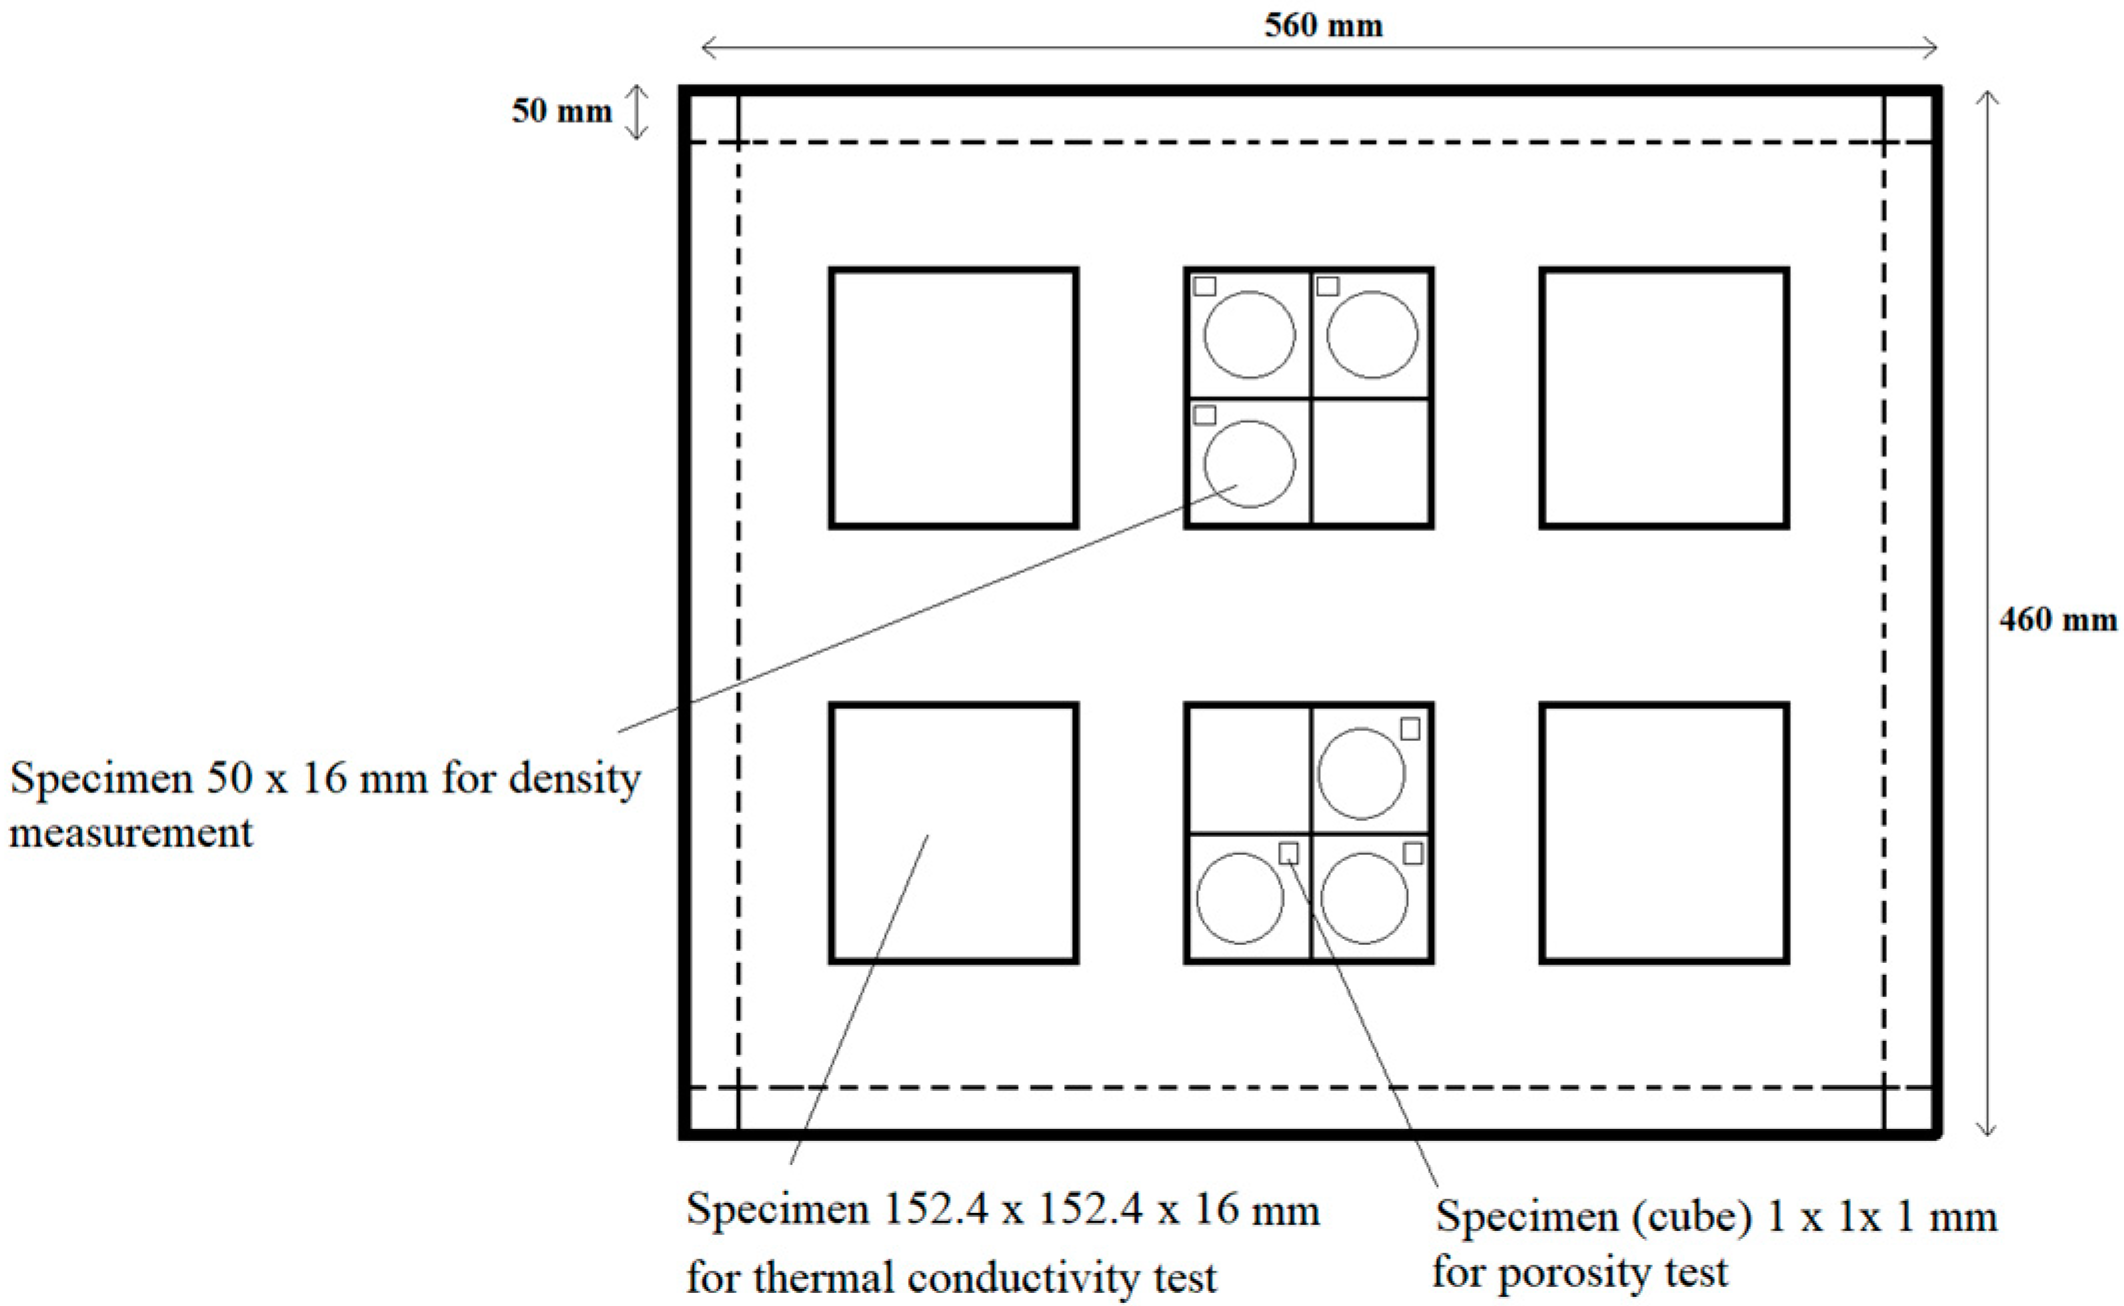
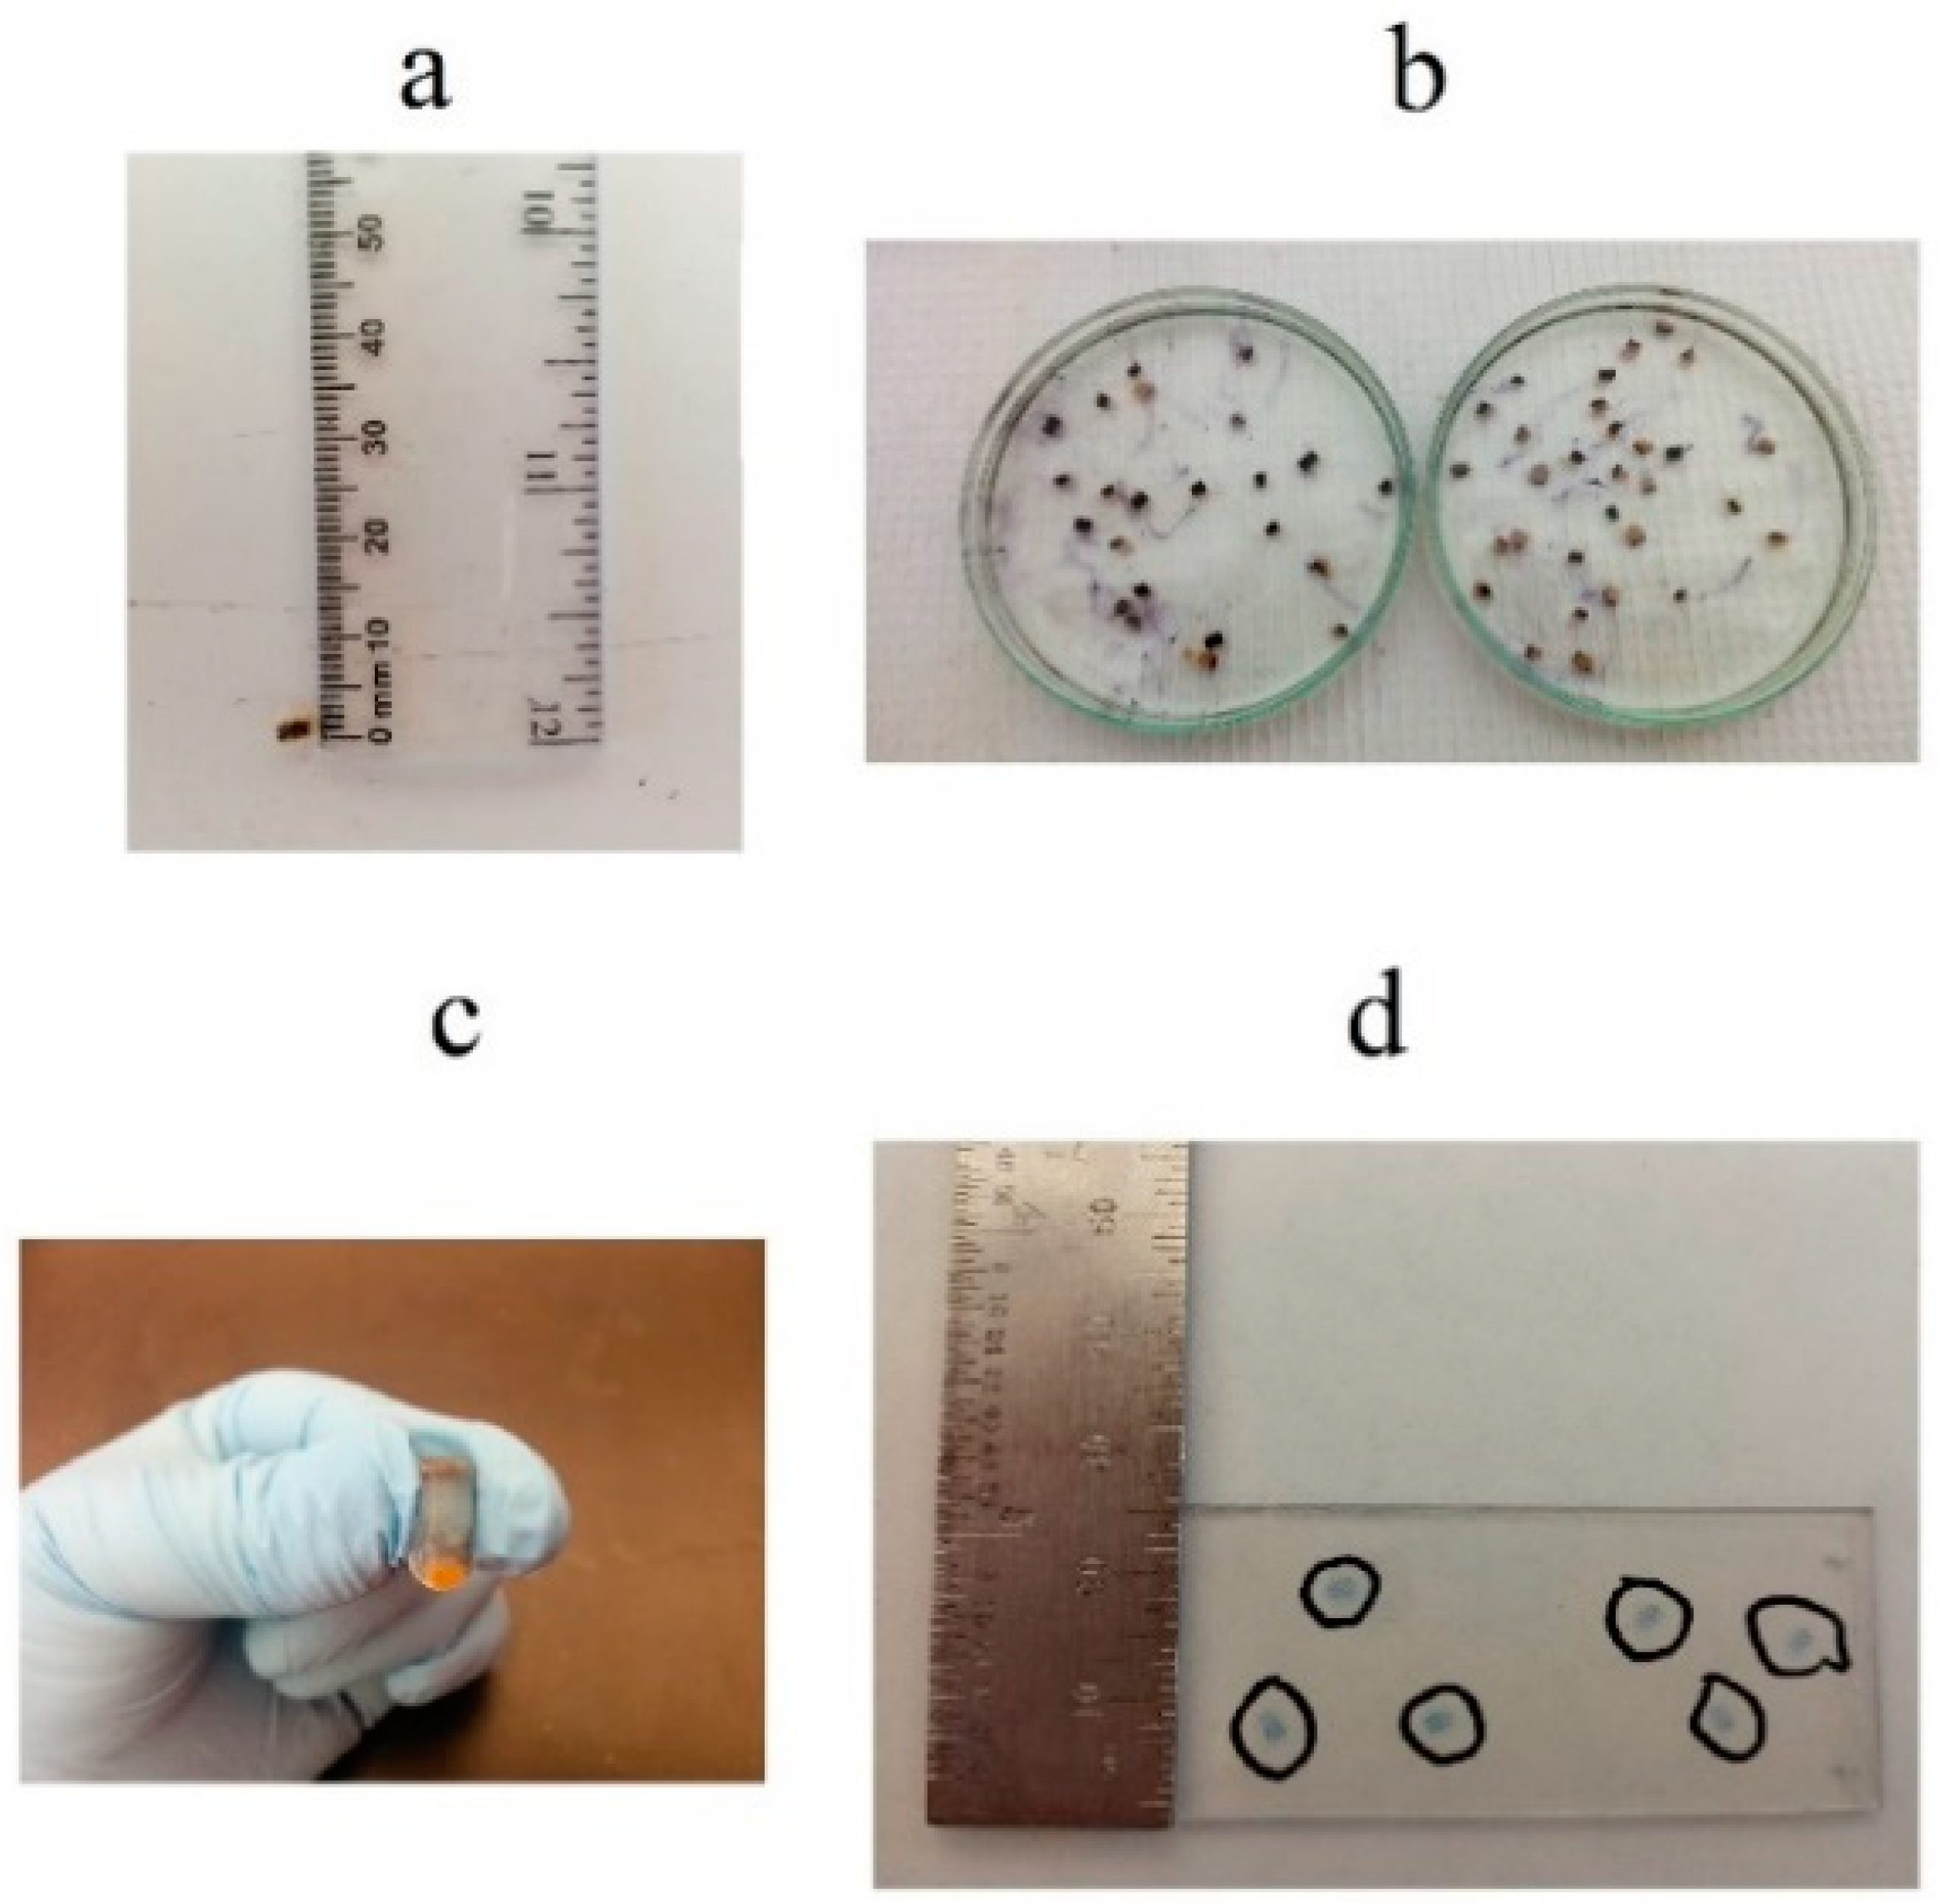
In the current study, samples for thermal conductivity and porosity determination were sawn from each panel as presented in Figure 3. For porosity determination, cubes of 1–2 mm3 were extracted from each laboratory panel of densities 198 kg m−3, 415 kg m−3, 598 kg m−3, 810 kg m−3 and 987 kg m−3 and fine, medium and coarse fiber sizes (Figure 4a). Eighteen observations were obtained from each treatment (15 treatments in total). This gave a total of 270 cubes for the whole experiment. The cubes were dried to anhydrous conditions and impregnated with LR White medium grade, acrylic resin, model 14381, manufactured by Electron Microscopy Sciences (Hatfield, PA, USA). (Figure 4b). The following procedure was developed in our laboratory. The dried cubes were submerged in acrylic resin. After one hour, the resin was purged. This treatment was applied three times. Subsequently, the cubes were submerged again in the acrylic resin for 24 h. The resin was purged and each cube was placed inside a clear gelatine capsule, 2 oz. size, model 7, manufactured by Galenova Inc (St-Hyacinthe, QC, Canada) and filled with resin. Then, each capsule was covered with a gel cover and immediately placed inside an oven at 60 °C for 24 h to polymerize the resin. Later, these capsules were submerged in cold water for 10 min for gel softening. Next, the gel was retired entirely from the resin capsule surface already hardened (Figure 4c). Afterward, three thin slices of 3 μm in thickness were cut with a microtome from each impregnated cube. A total of 810 thin slices were obtained for porosity measurement. Each slice was stained with a solution of methylene-blue at 1%, blue-methyl azur II at 1% and water at neutral pH. Next, each slice was put on a microscope slide forming a microtomed sample. The final dimension of each microtomed specimen was about 1.44 mm × 1.83 mm × 3 μm (Figure 4d).
Specimens of 152.4 mm × 152.4 mm × 16 mm for thermal conductivity determination were conditioned to 65% relative humidity and 21 °C temperature in 21 days. Average moisture content of these specimens was 7.6% (s = 0.3) which was determined by anhydrous mass method. Twelve observations were considered for each of the 15 treatments, which gave a total of 180 observations in total for this test.
2.5. Porosity Determination
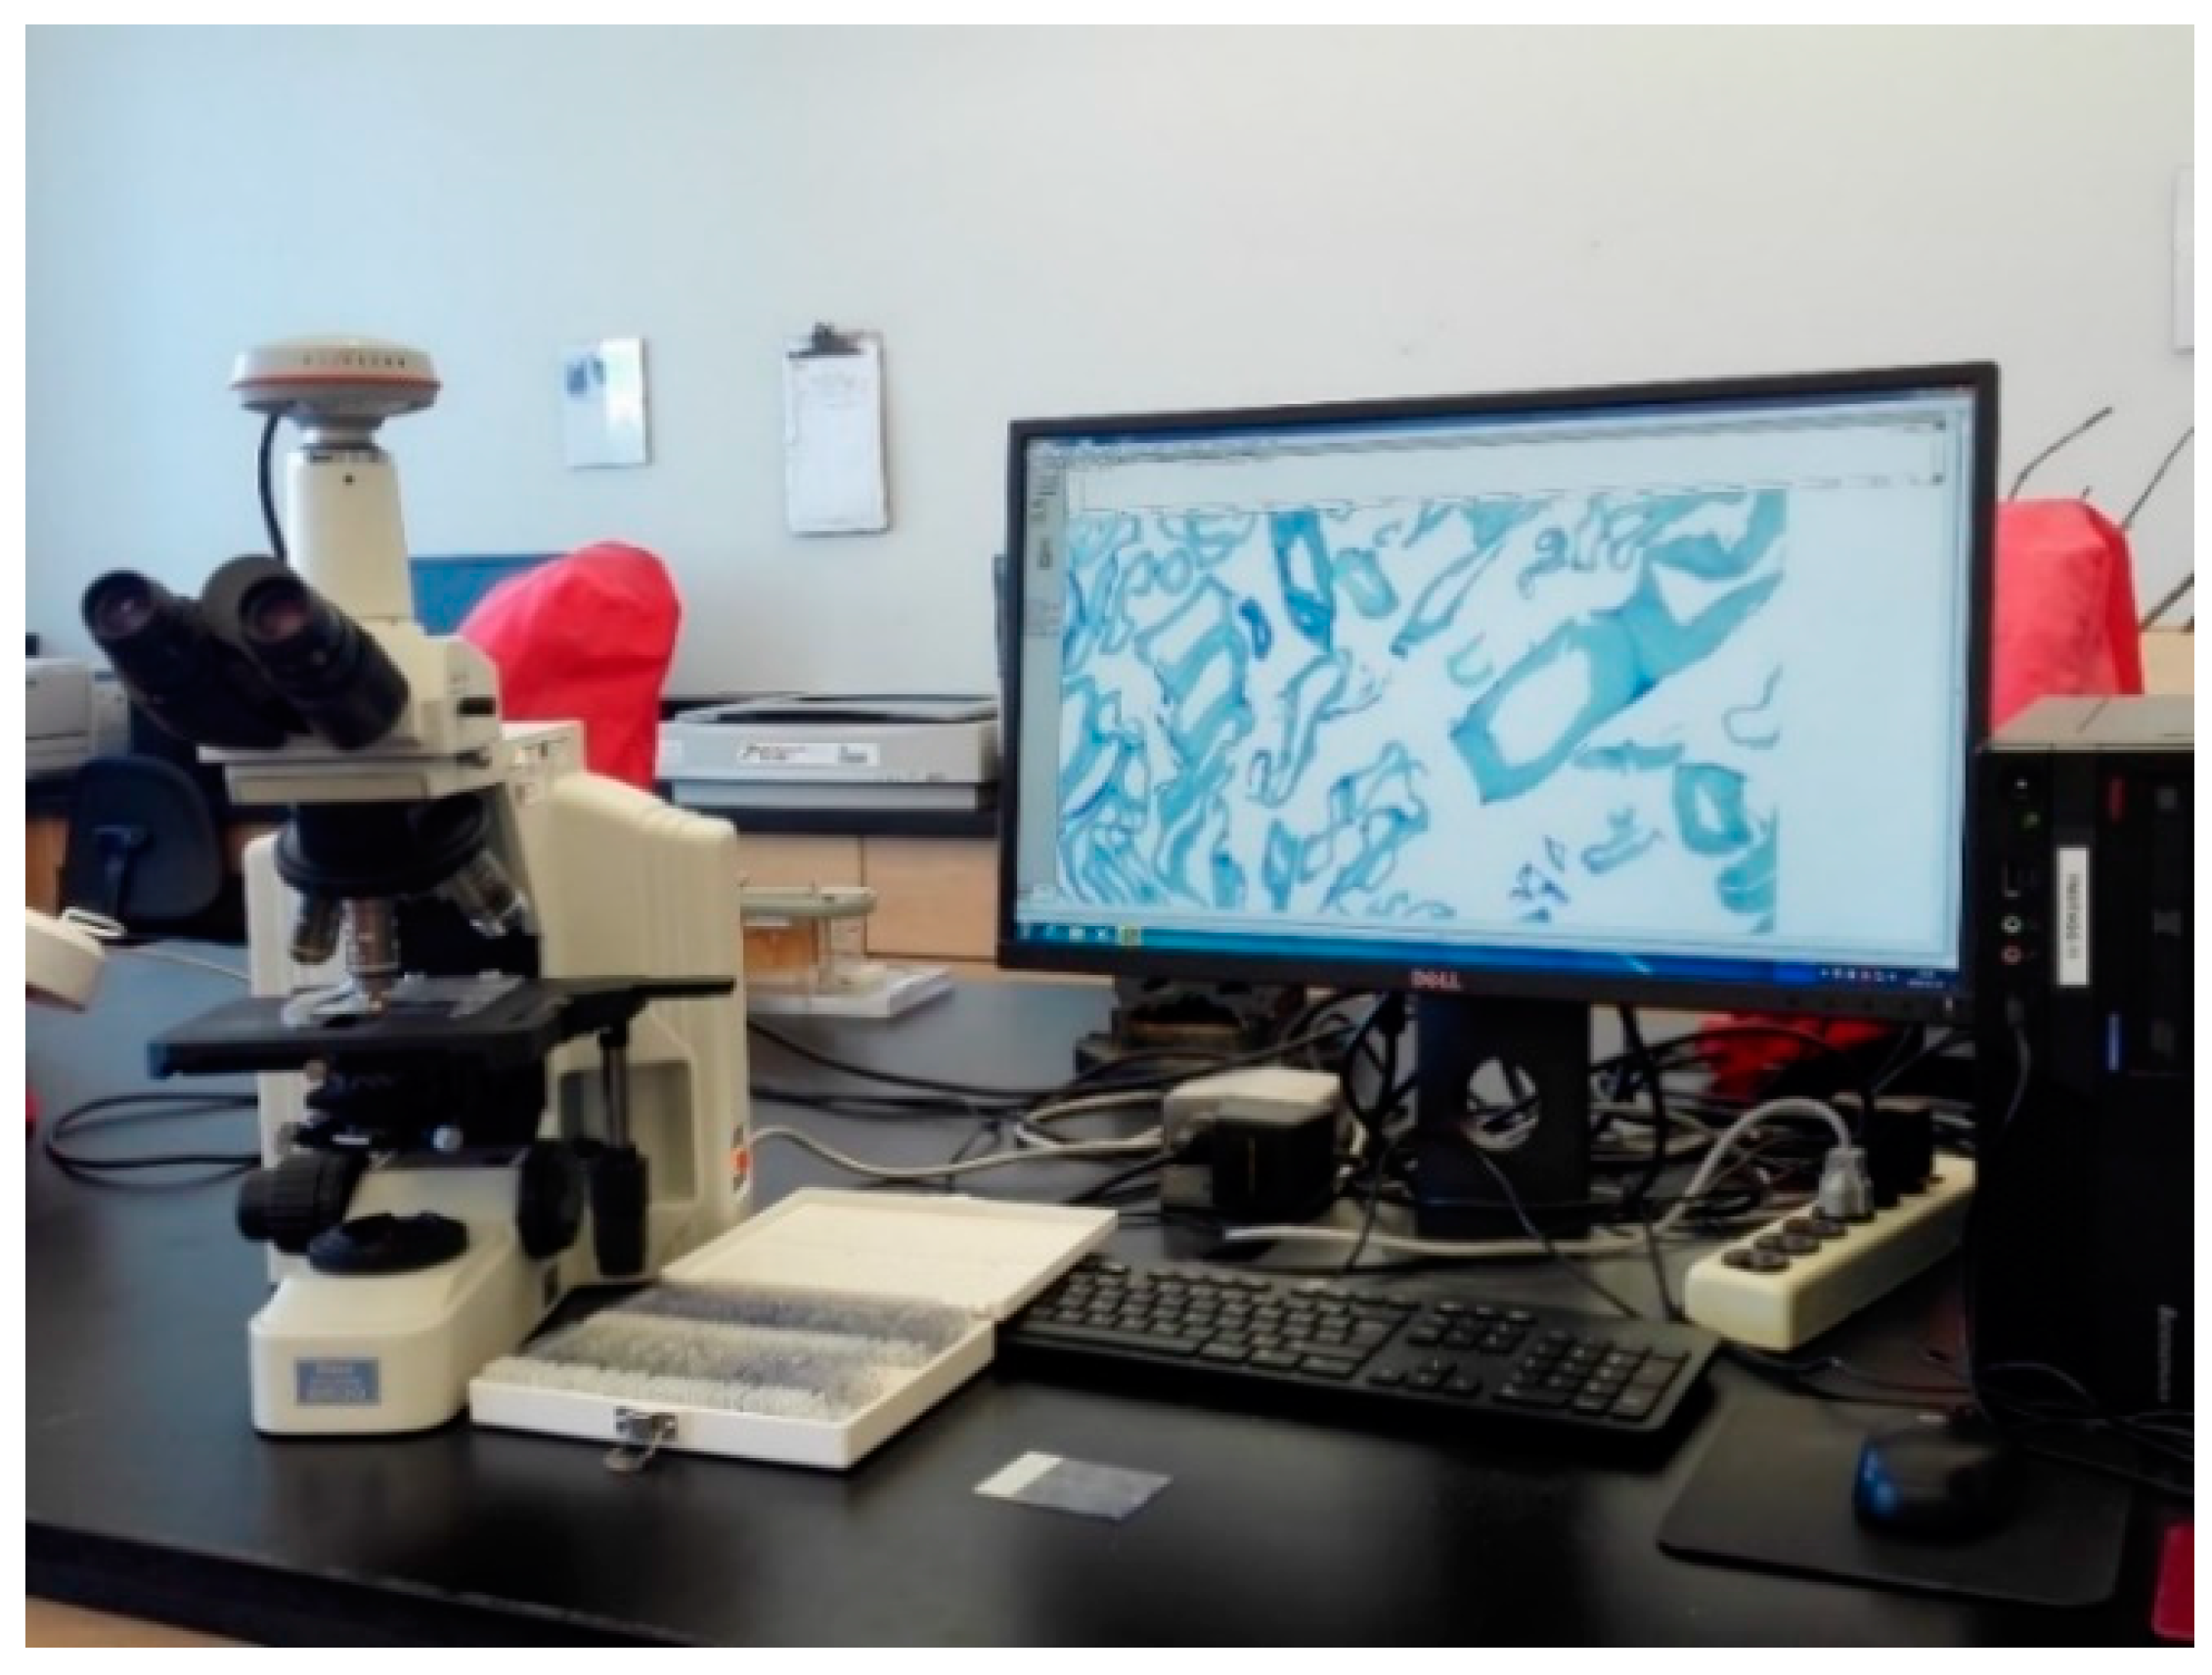
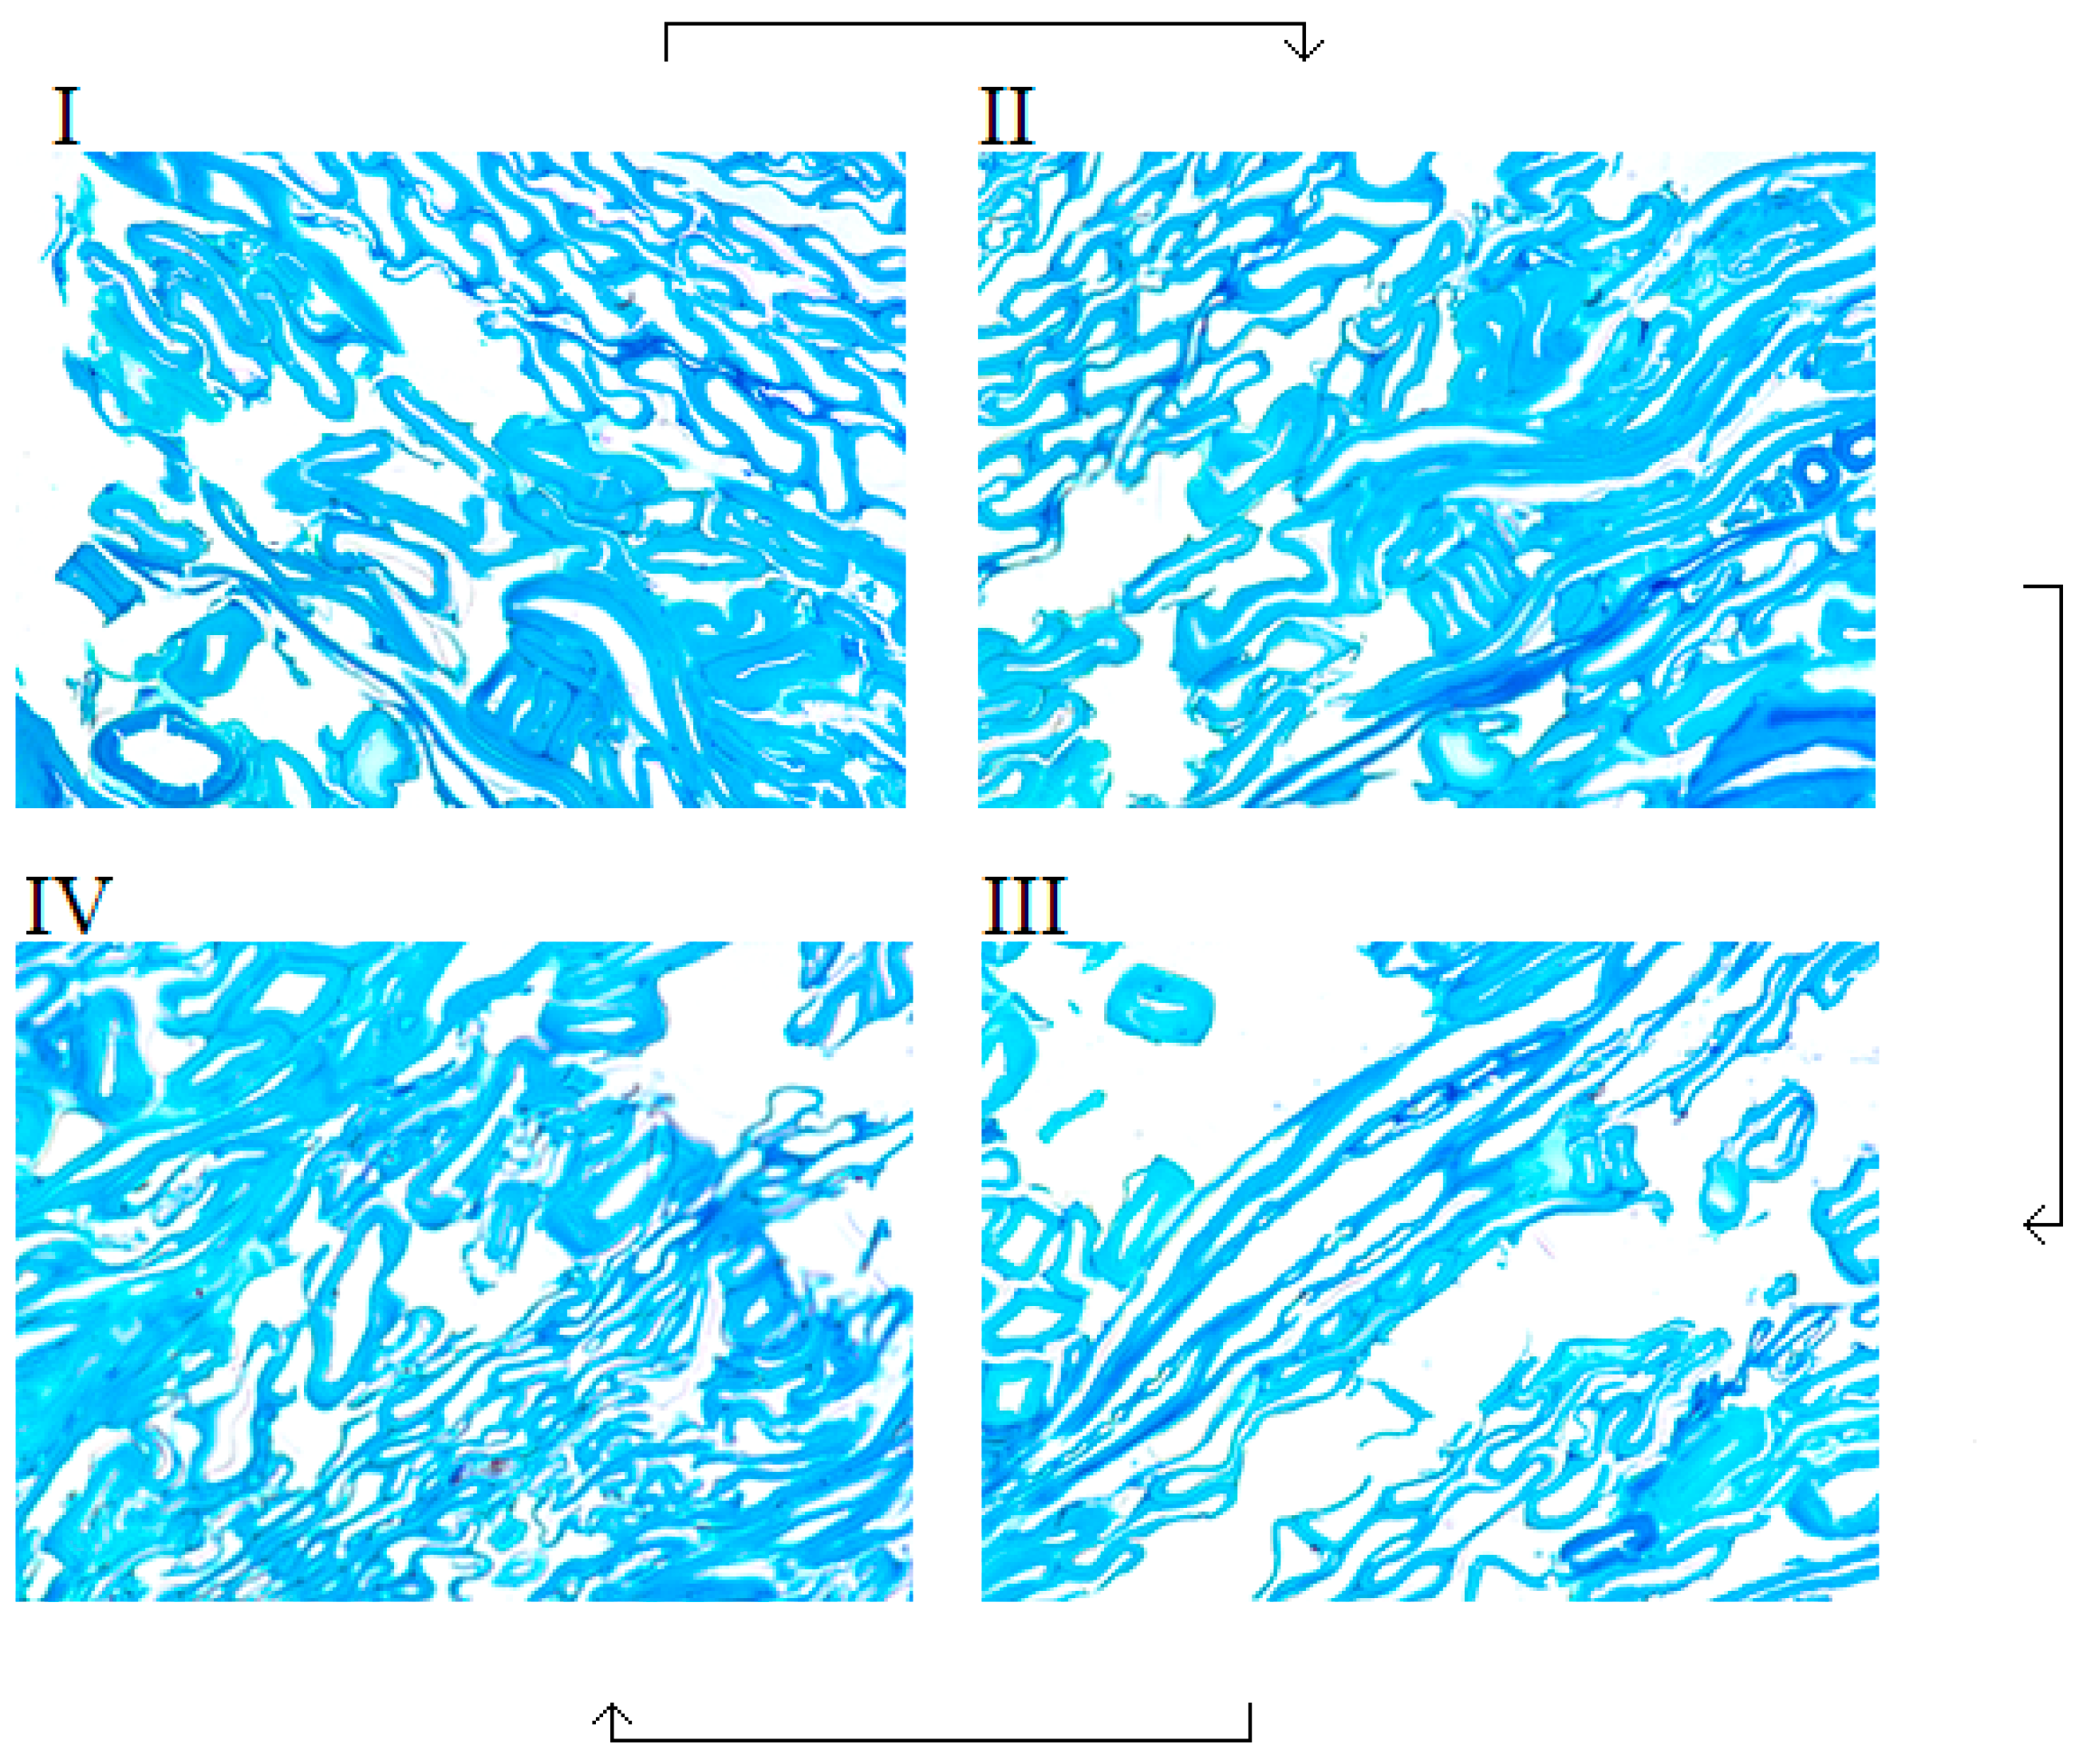
The porosity determination was performed using an image analysis method. This procedure consisted in measuring void spaces on an image taken from each microtomed sample (Figure 4d) using black and white contrast. Each image displayed on the screen was divided into four zones [20] during optical microscope observation (Nikon, model eclipse E600, Mississauga, ON, Canada) with a magnification of 40×. This equipment is presented in Figure 5. One image was taken for each of these zones with a Pixelink, model PL-A686C camera (Ottawa, ON, Canada), with a resolution of 2208 × 3000 pixels and an image size of 7.7 mm × 10.5 mm. Due to some noise and impurities, the images were corrected and improved with the Adobe Photoshop program, version CS6 Extended (Softchoice, Québec, QC, Canada). For each microtomed sample, four images were obtained, which gave a total of 3240 images. The porosity measurements were made for each of these images. Four images were taken for each microtomed sample according to Figure 6. The average value of these four images was considered as the porosity of the sample. When all the images were obtained, the porosity was calculated by black and white contrast with the Wincell program, version v2004a, manufactured by Regent Instruments Inc. (Softchoice, Québec, QC, Canada). This software calculated the percentage of black pixels in the image.
2.6. Thermal Conductivity Determination
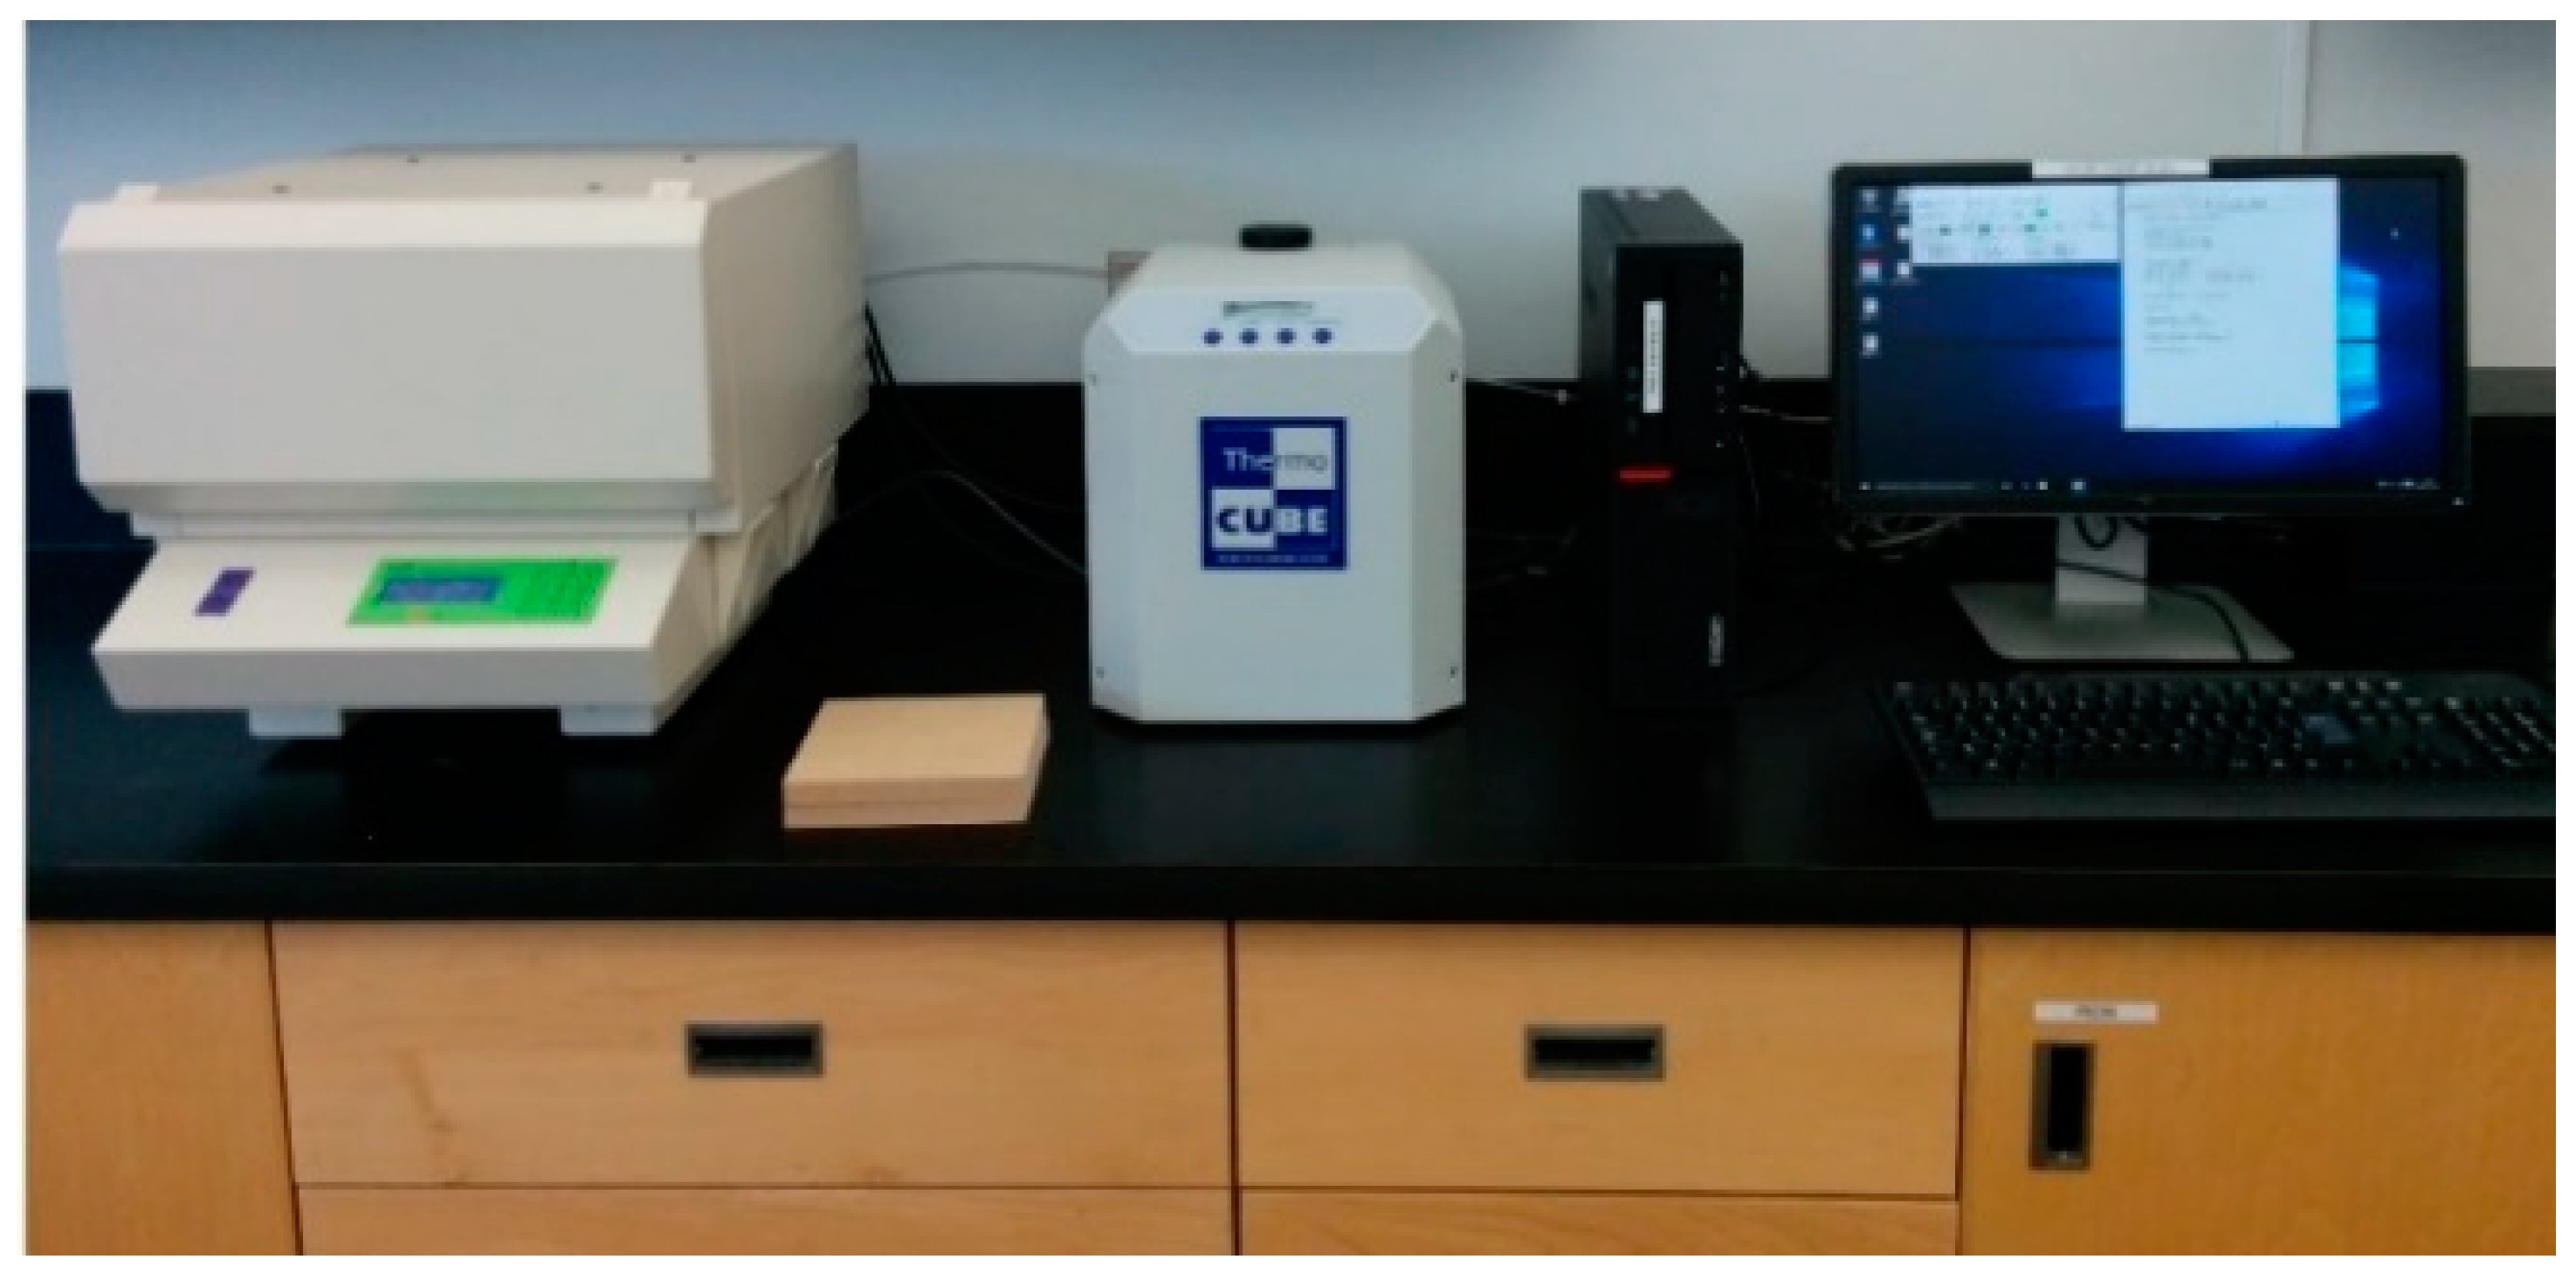
The thermal conductivity of 180 specimens was measured. The specimens were previously conditioned to 65% relative humidity and 21 °C temperature for 21 days. The measurements of thermal conductivity were determined according to the steady-state thermal resistance procedure decribed in ISO standard [21]. This test was performed with a LaserComp Fox 314 (TA instruments, New Castle, DE, USA) apparatus as shown in Figure 7. Each 16 mm thick specimen of was placed inside of this equipment. The upper and lower plates of the thermal conductivity equipment were heated at 10 °C and 35 °C respectively, corresponding to a temperature gradient of 1.6 °C mm−1. The measurement duration increased when the density level of the specimen decreased. For instance, with a low-density specimen (198 kg m−3 and 415 kg m−3) the measurements stabilization took 5 to 6 h compared to 1 h for a higher density specimen.
2.7. Experimental Design
A full factorial design was used. The effects of two sources of variation, namely mat density and fiber size on thermal conductivity and mat porosity were examined. Tests of normality and variance homogeneity were performed to validate the hypotheses of the analysis of variance. Five density levels (198 kg m−3, 415 kg m−3, 598 kg m−3, 810 kg m−3 and 987 kg m−3) and three fiber sizes (fine, medium and coarse) were studied for a total of 15 treatments. Each treatment was replicated three times. Additionally, a regression analysis was performed to investigate the porosity—thermal conductivity relationship. Statistical analyses were performed in the SAS 9.4 (SAS Institute Inc., Cary, NC, USA) software. Regression analyses were made in the MATLAB (version R2016a, Natick, MA, USA) numerical analysis software.
3. Results
3.1. Mat Porosity and Fiber Bundles
The evolution of porosity and thermal conductivity of the mat during compression was analyzed as a function of mat density. For this, it should be kept in mind that during hot pressing, a vertical density profile through the mat thickness is developed. Therefore, the local density evolution can be linked to local mat thermal conductivity and porosity. Hence, the knowledge of how mat density is related to these mat properties could help to understand how the vertical density profile is formed and improve simulation models’ predictions.
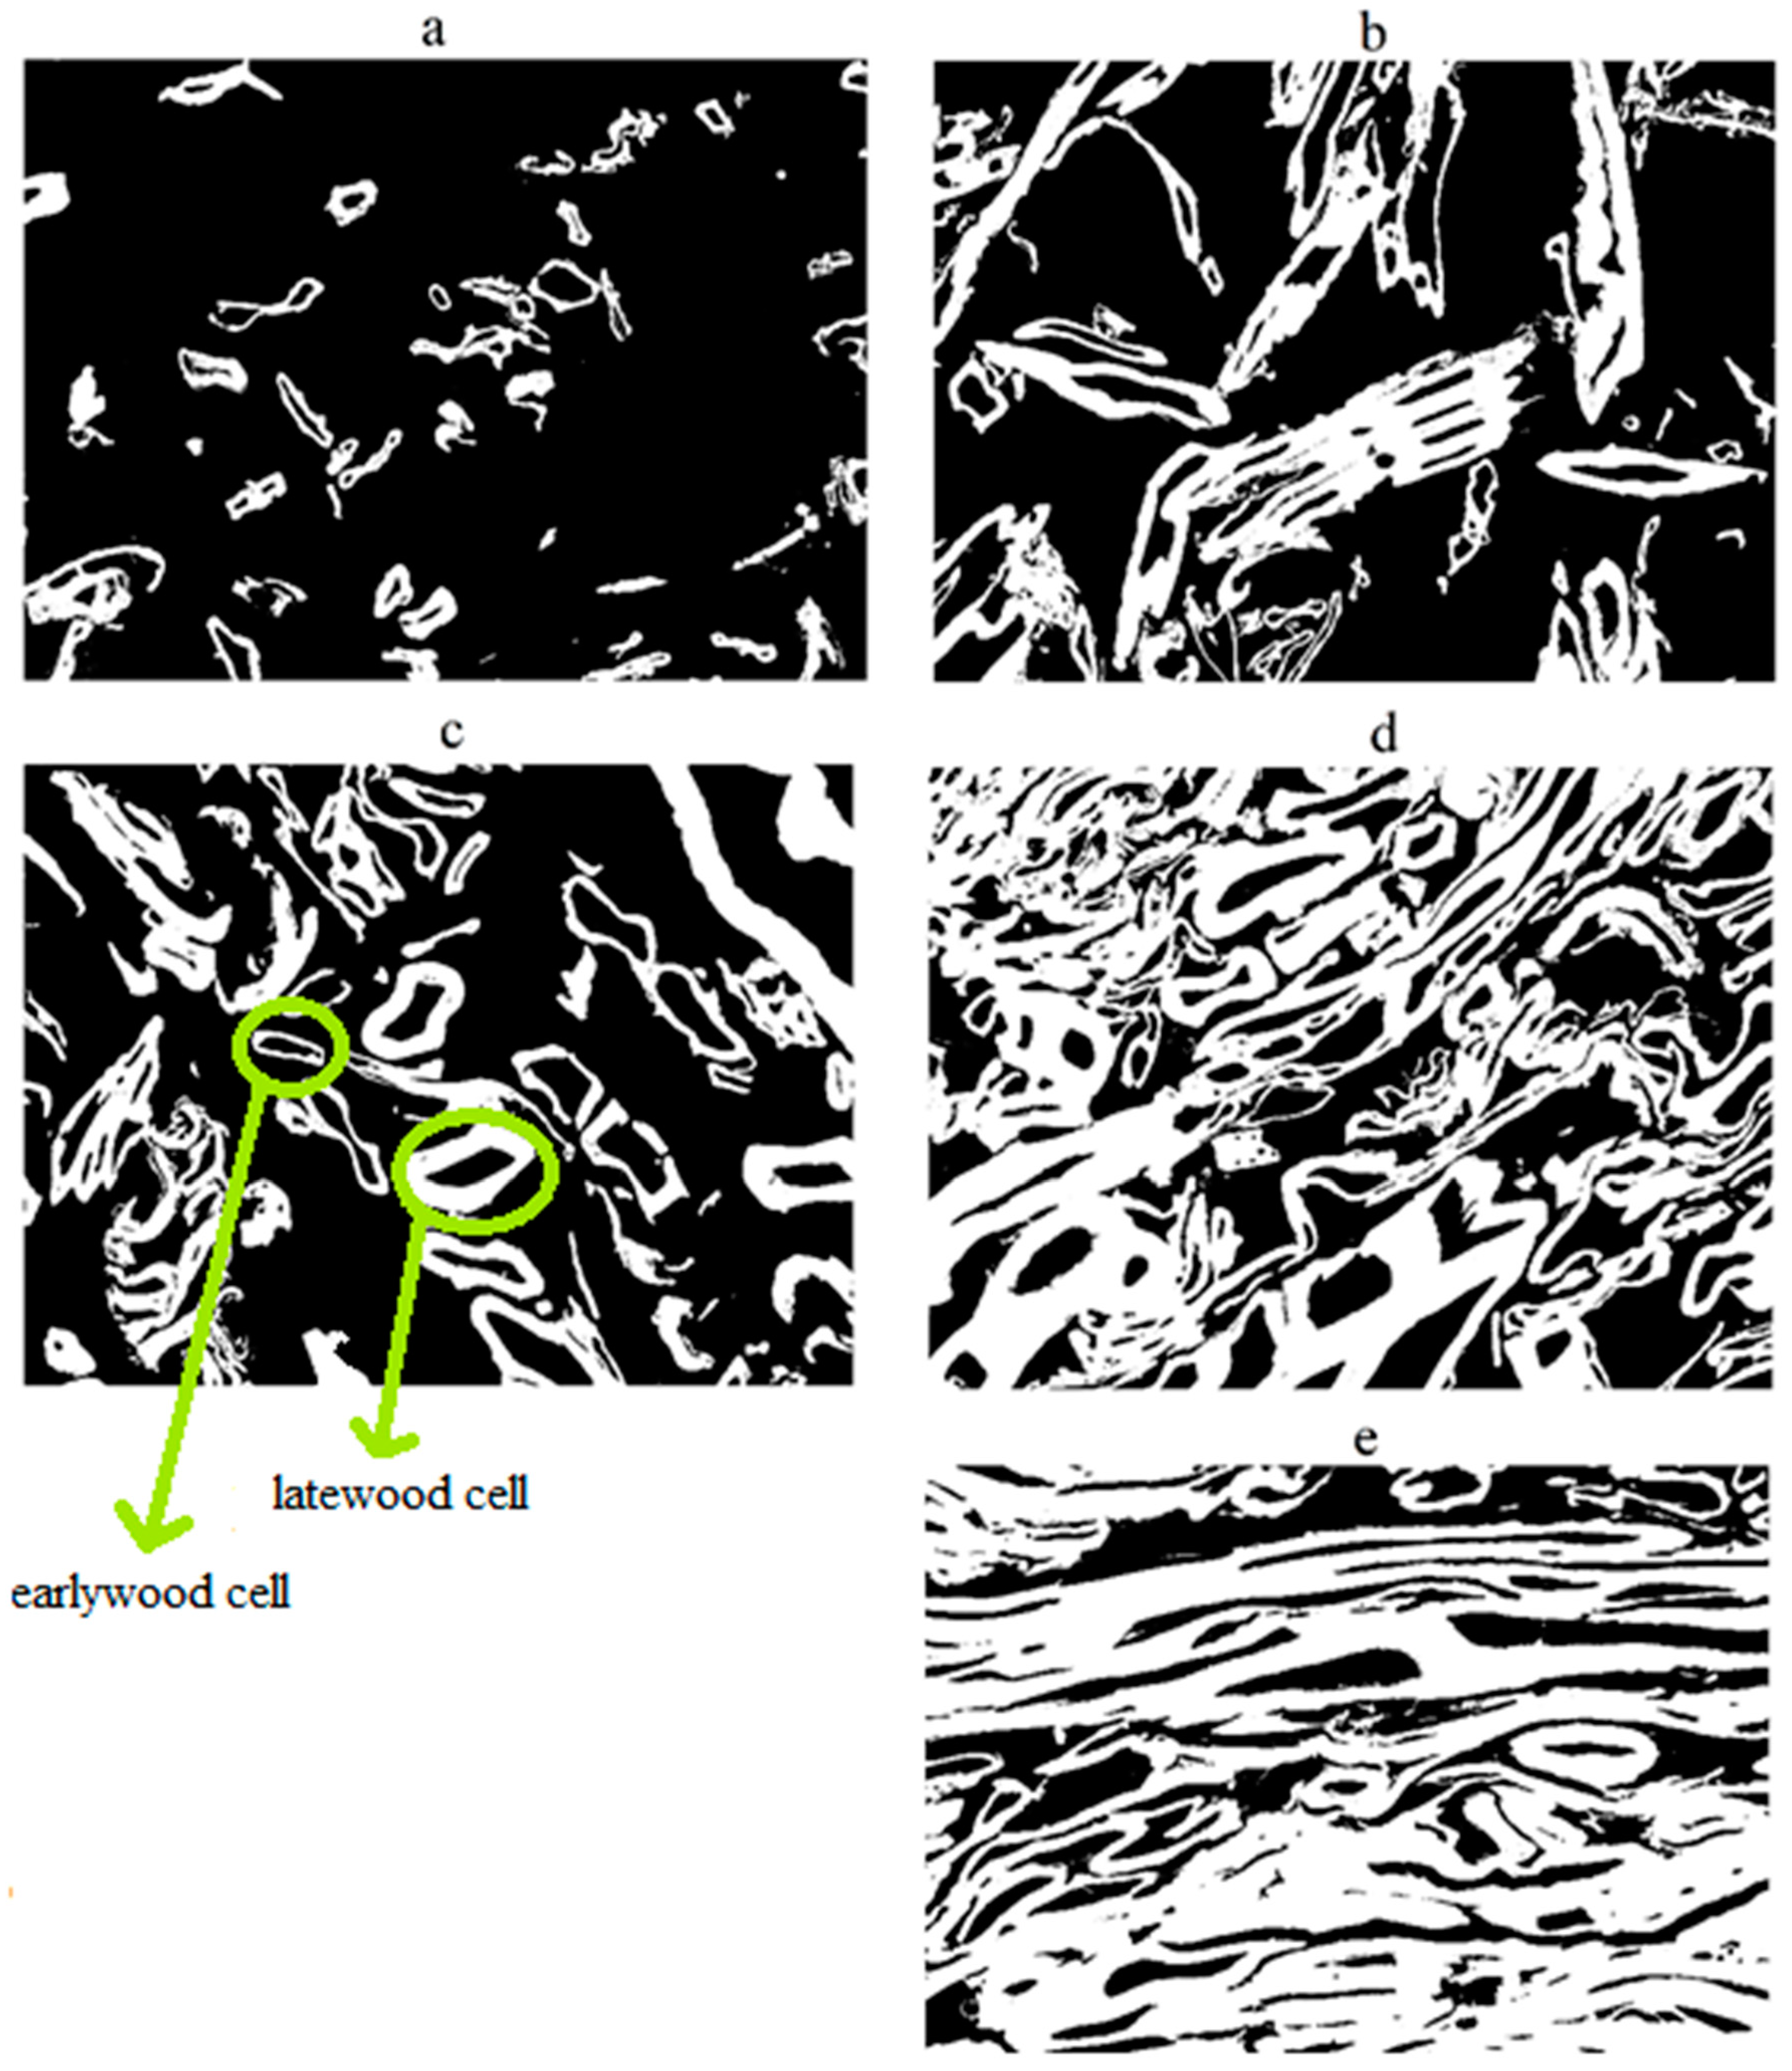
Figure 8 shows the black and white images used to calculate mat porosity. The porosity measurements were made with a magnification of 40× as mentioned. The black and white pixels in the images correspond to void spaces and fibrous material respectively.
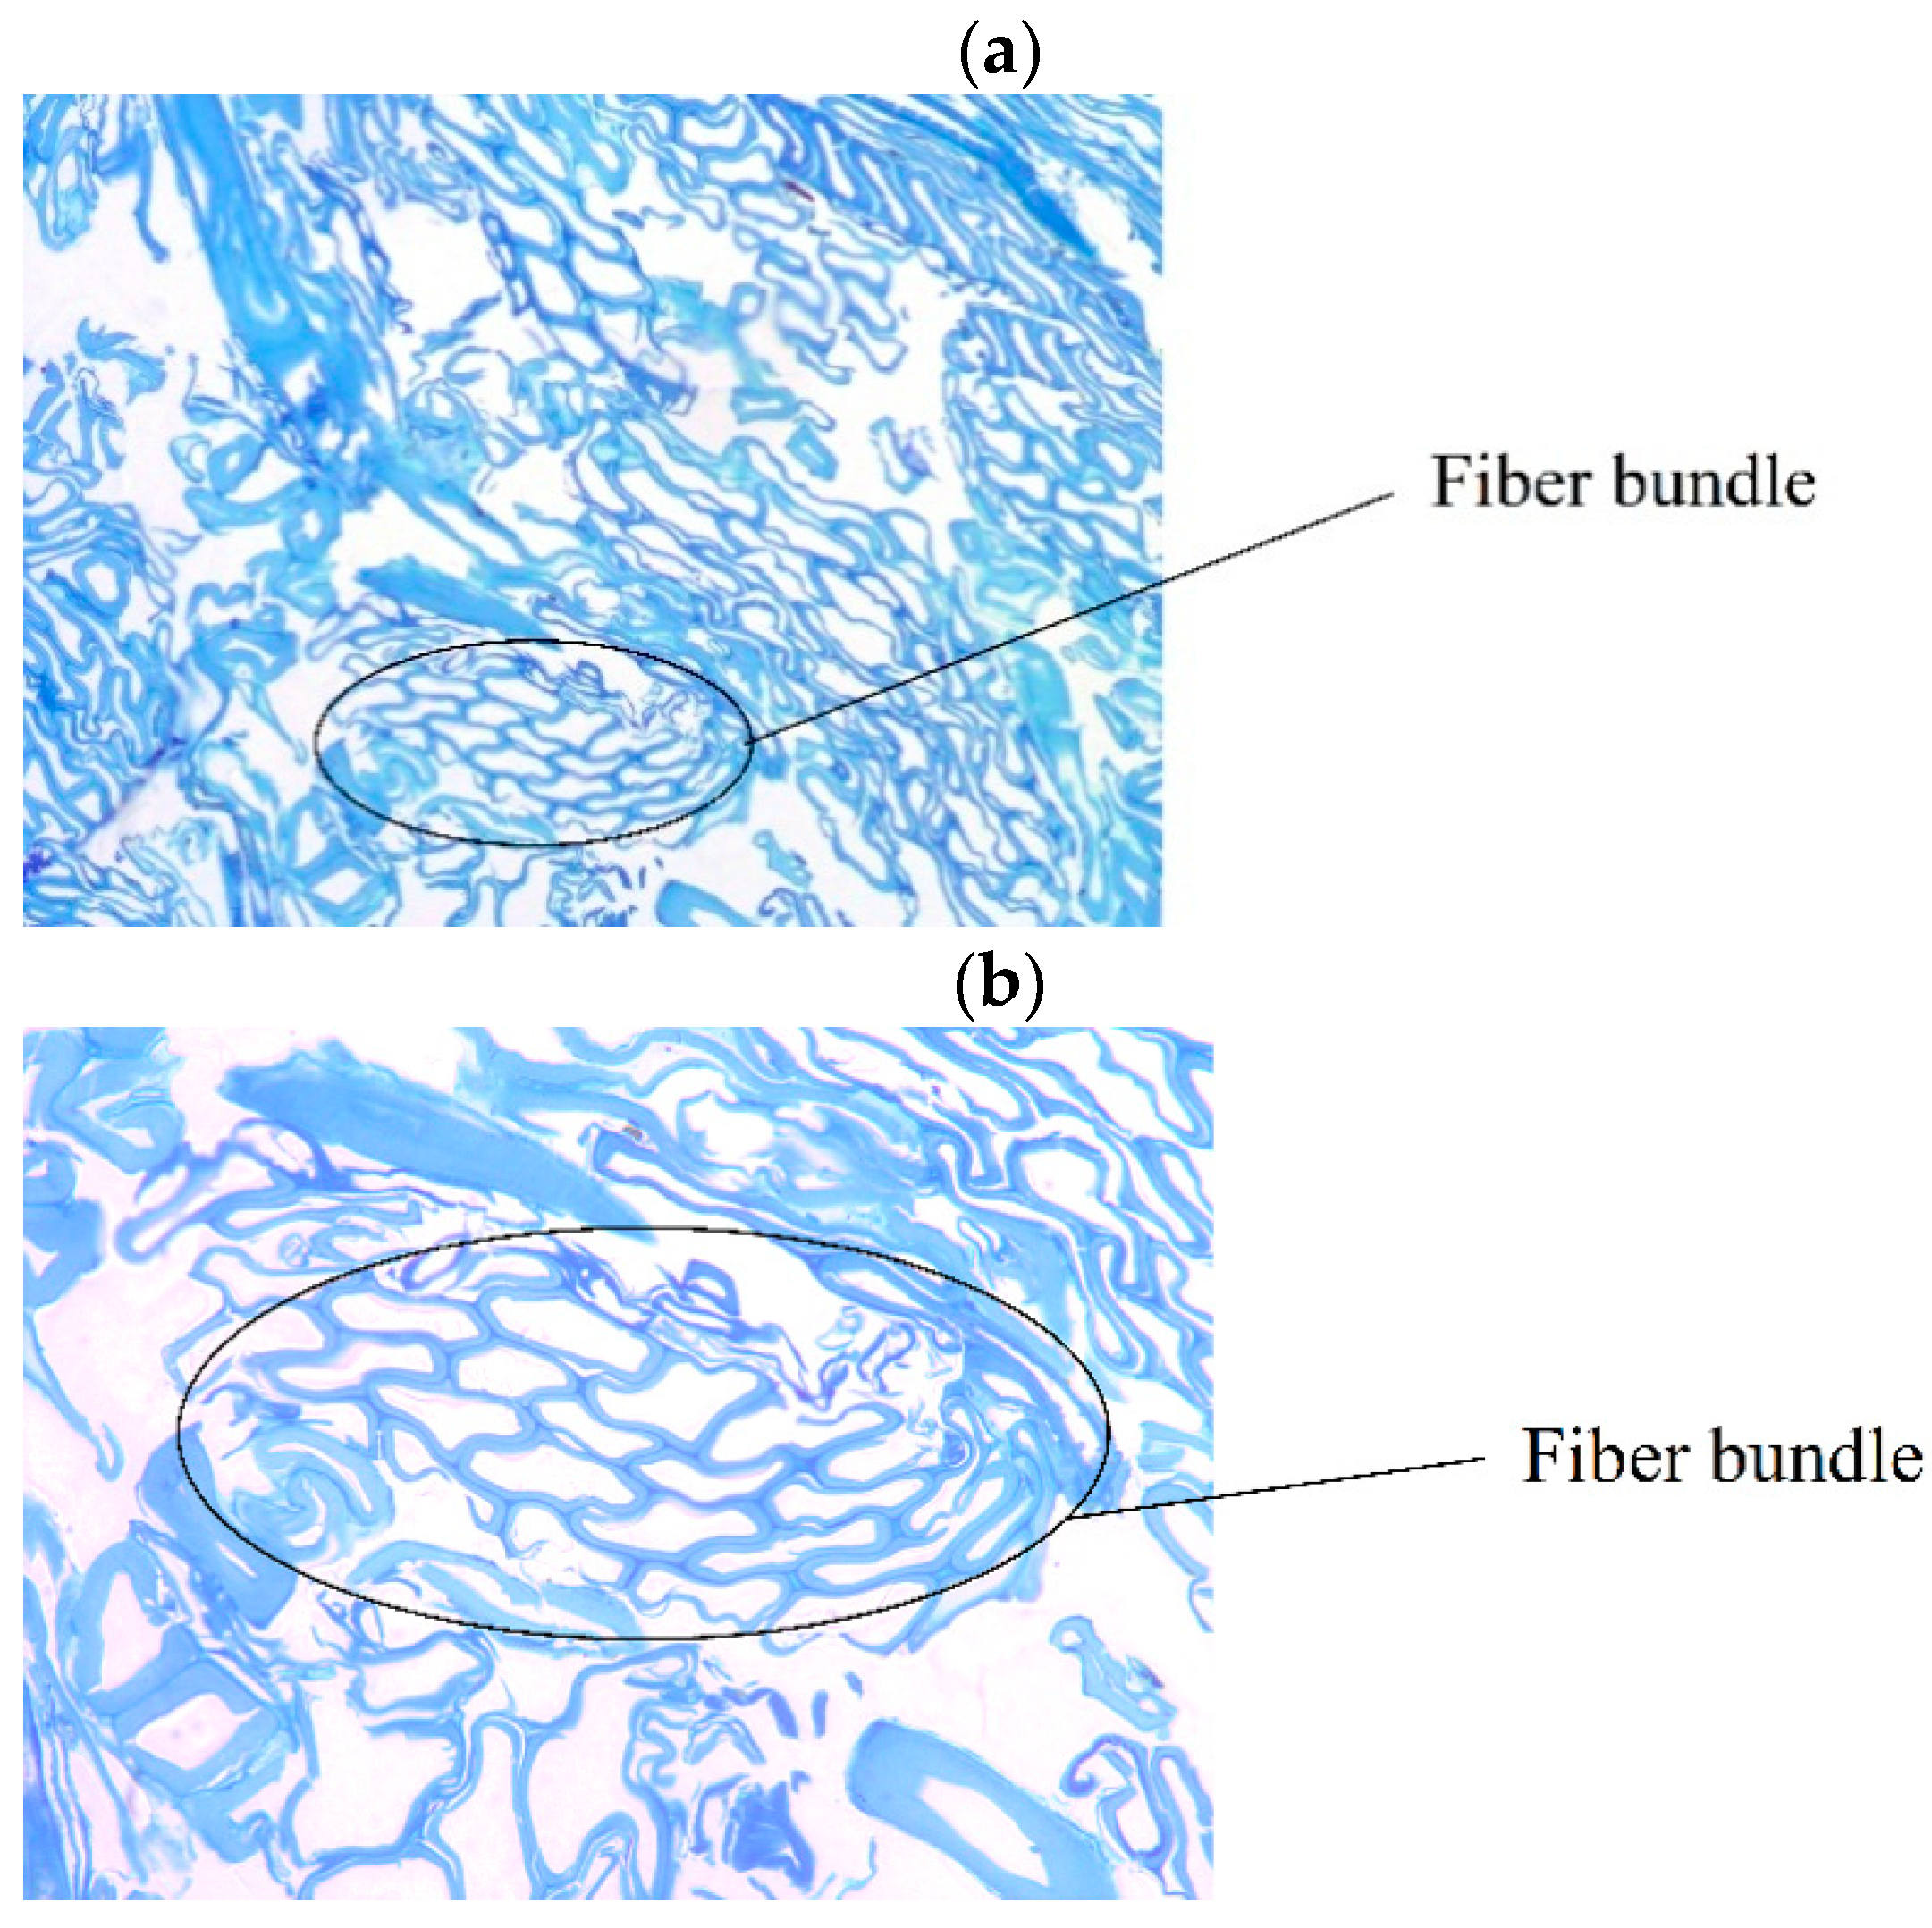
Most of the porosity images presented fiber bundles or shives, as shown in Figure 9a,b. This was observed at 20× and 40× magnifications.
3.2. Effect of Fiber Size and Density on Mat Porosity
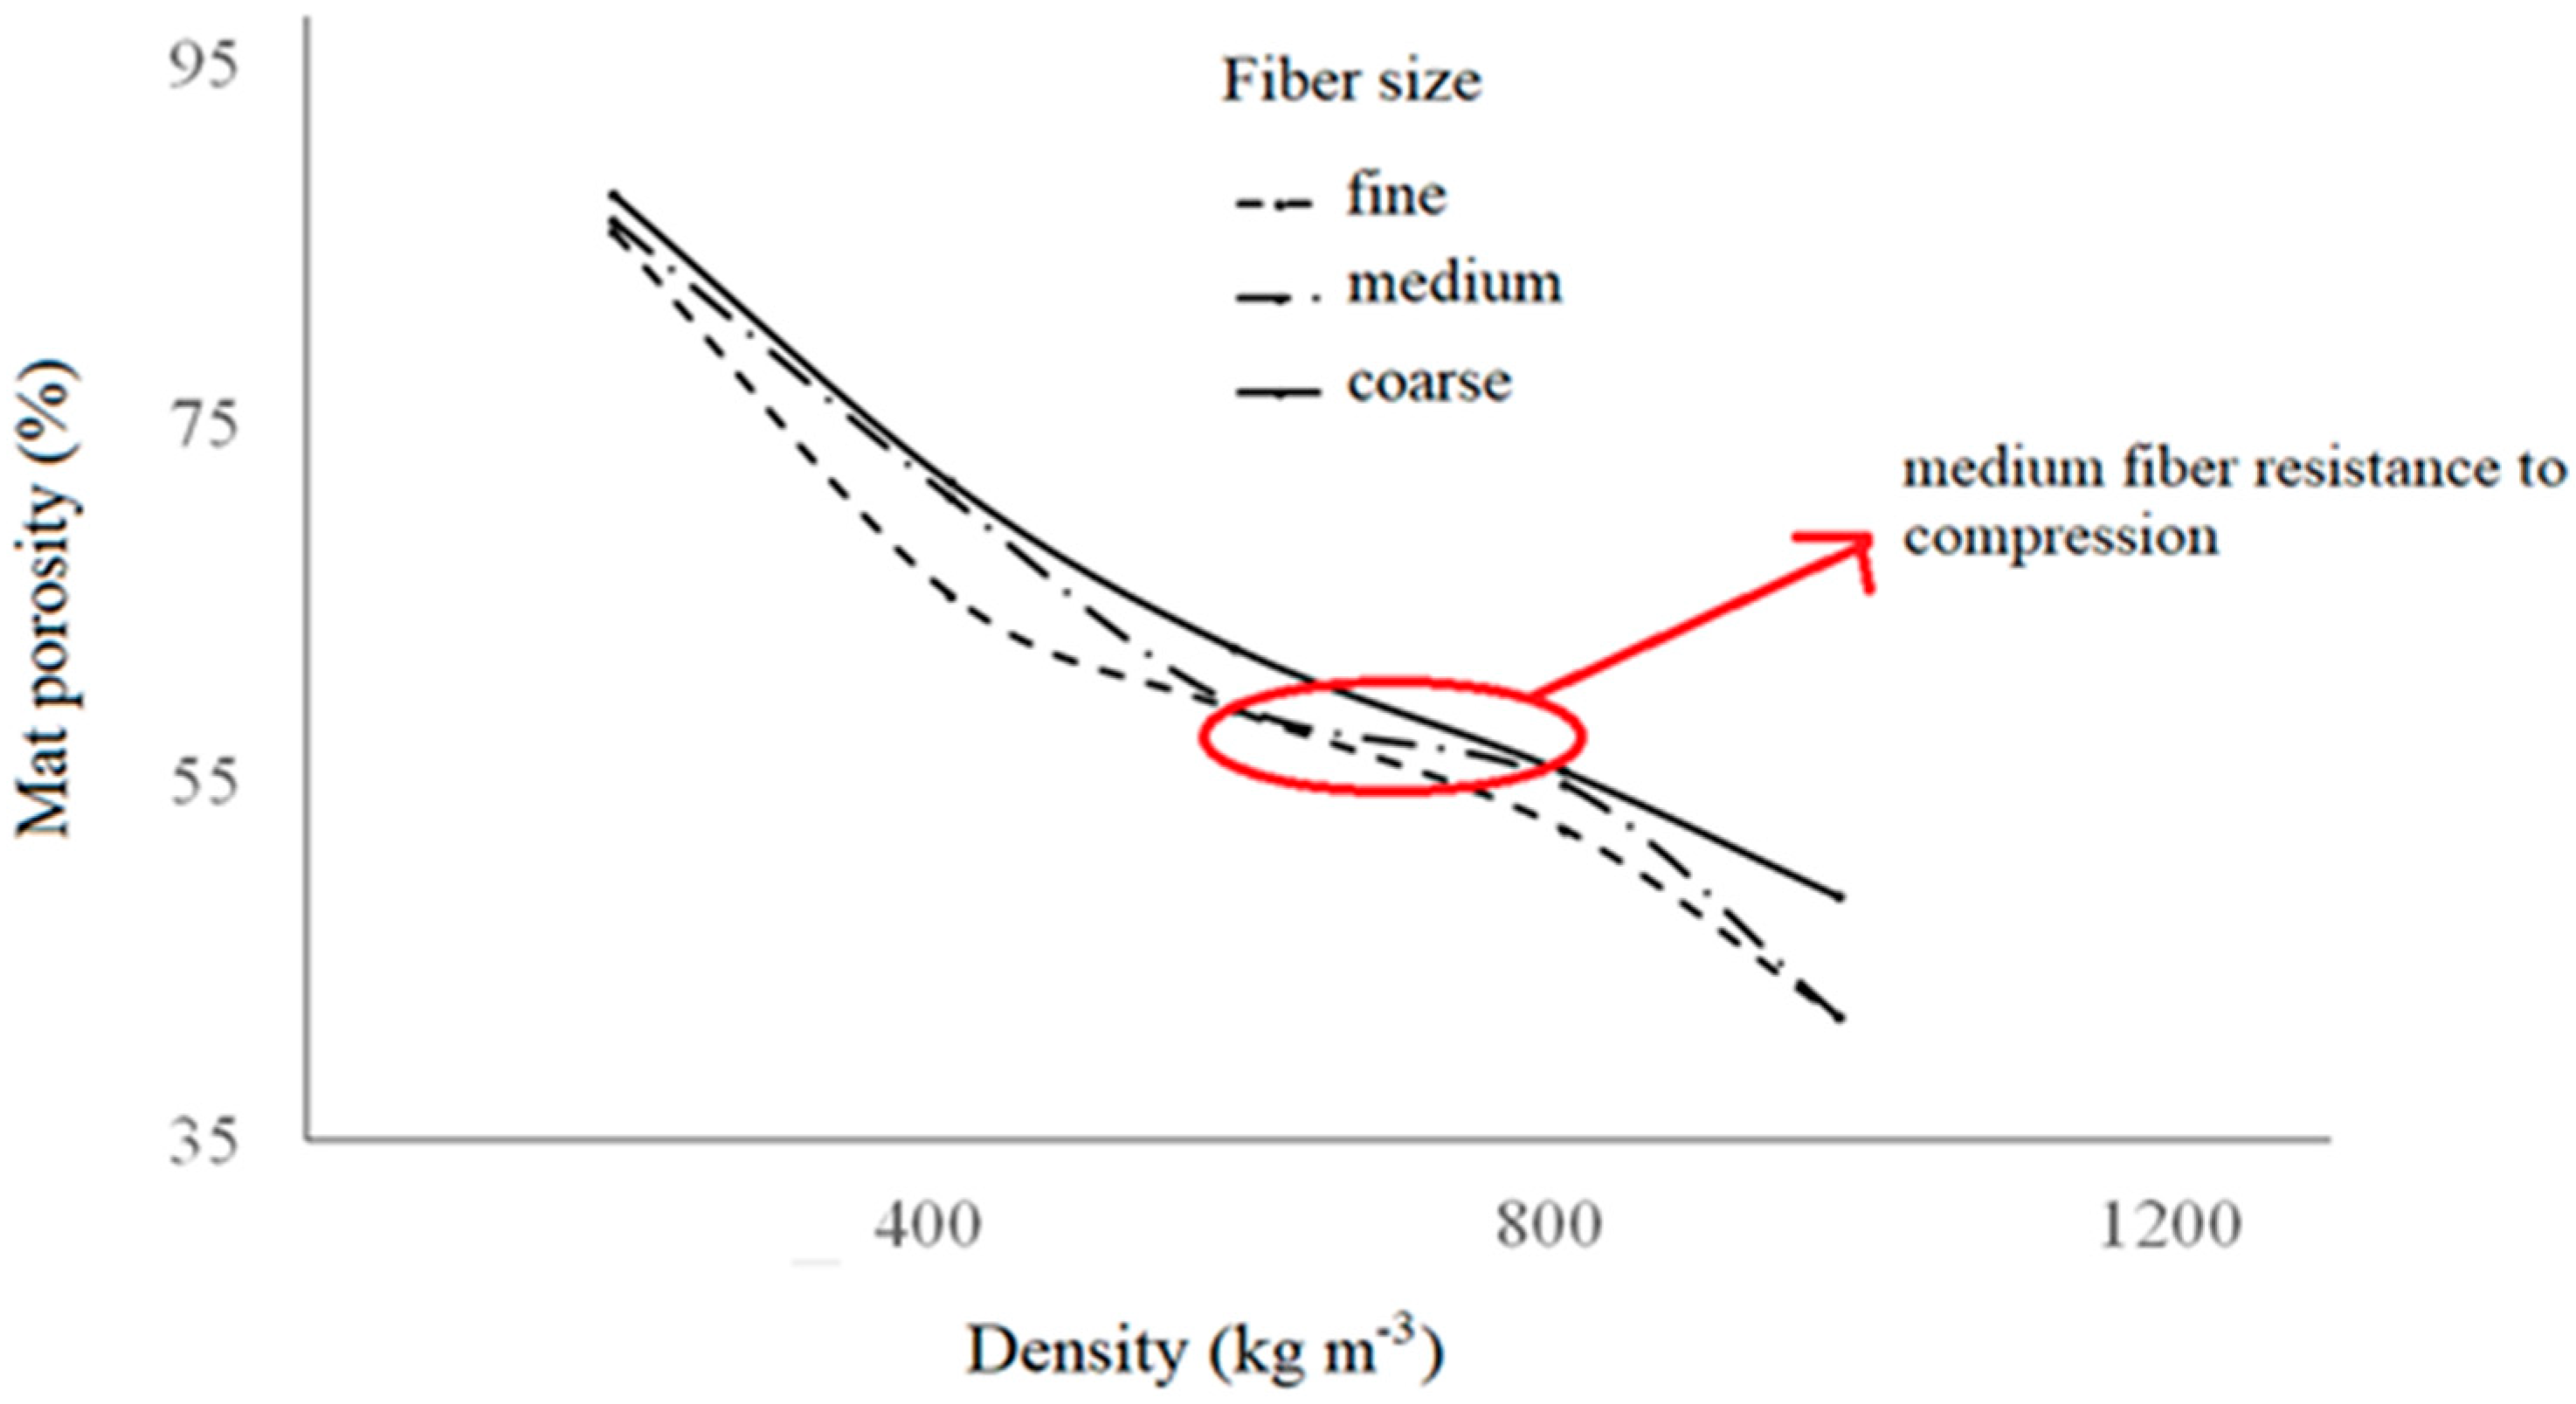
Table 2 shows the analysis of variance performed to evaluate the influence of density and fiber size on mat porosity. The p-value indicated a significant interaction between the effects of mat density and fiber size (p-value < 0.0001) on porosity. Figure 10 shows that the curves of fine, medium and coarse fiber sizes were not parallel. This demonstrates the interaction between variables fiber size and mat porosity, presented in Table 2, which indicates that the effect of density on mat porosity varies with fiber size.
As expected, mat porosity decreased from 198 kg m−3 to 987 kg m−3 (Figure 10). However, the porosity decreased more quickly in mats made with fine fibers. This suggested that the mats made with fine fibers presented a lower resistance to compression. The mats made with medium and coarse fibers presented a higher resistance to compression.
3.3. Effect of Fiber Size and Density on Thermal Conductivity of the Mat
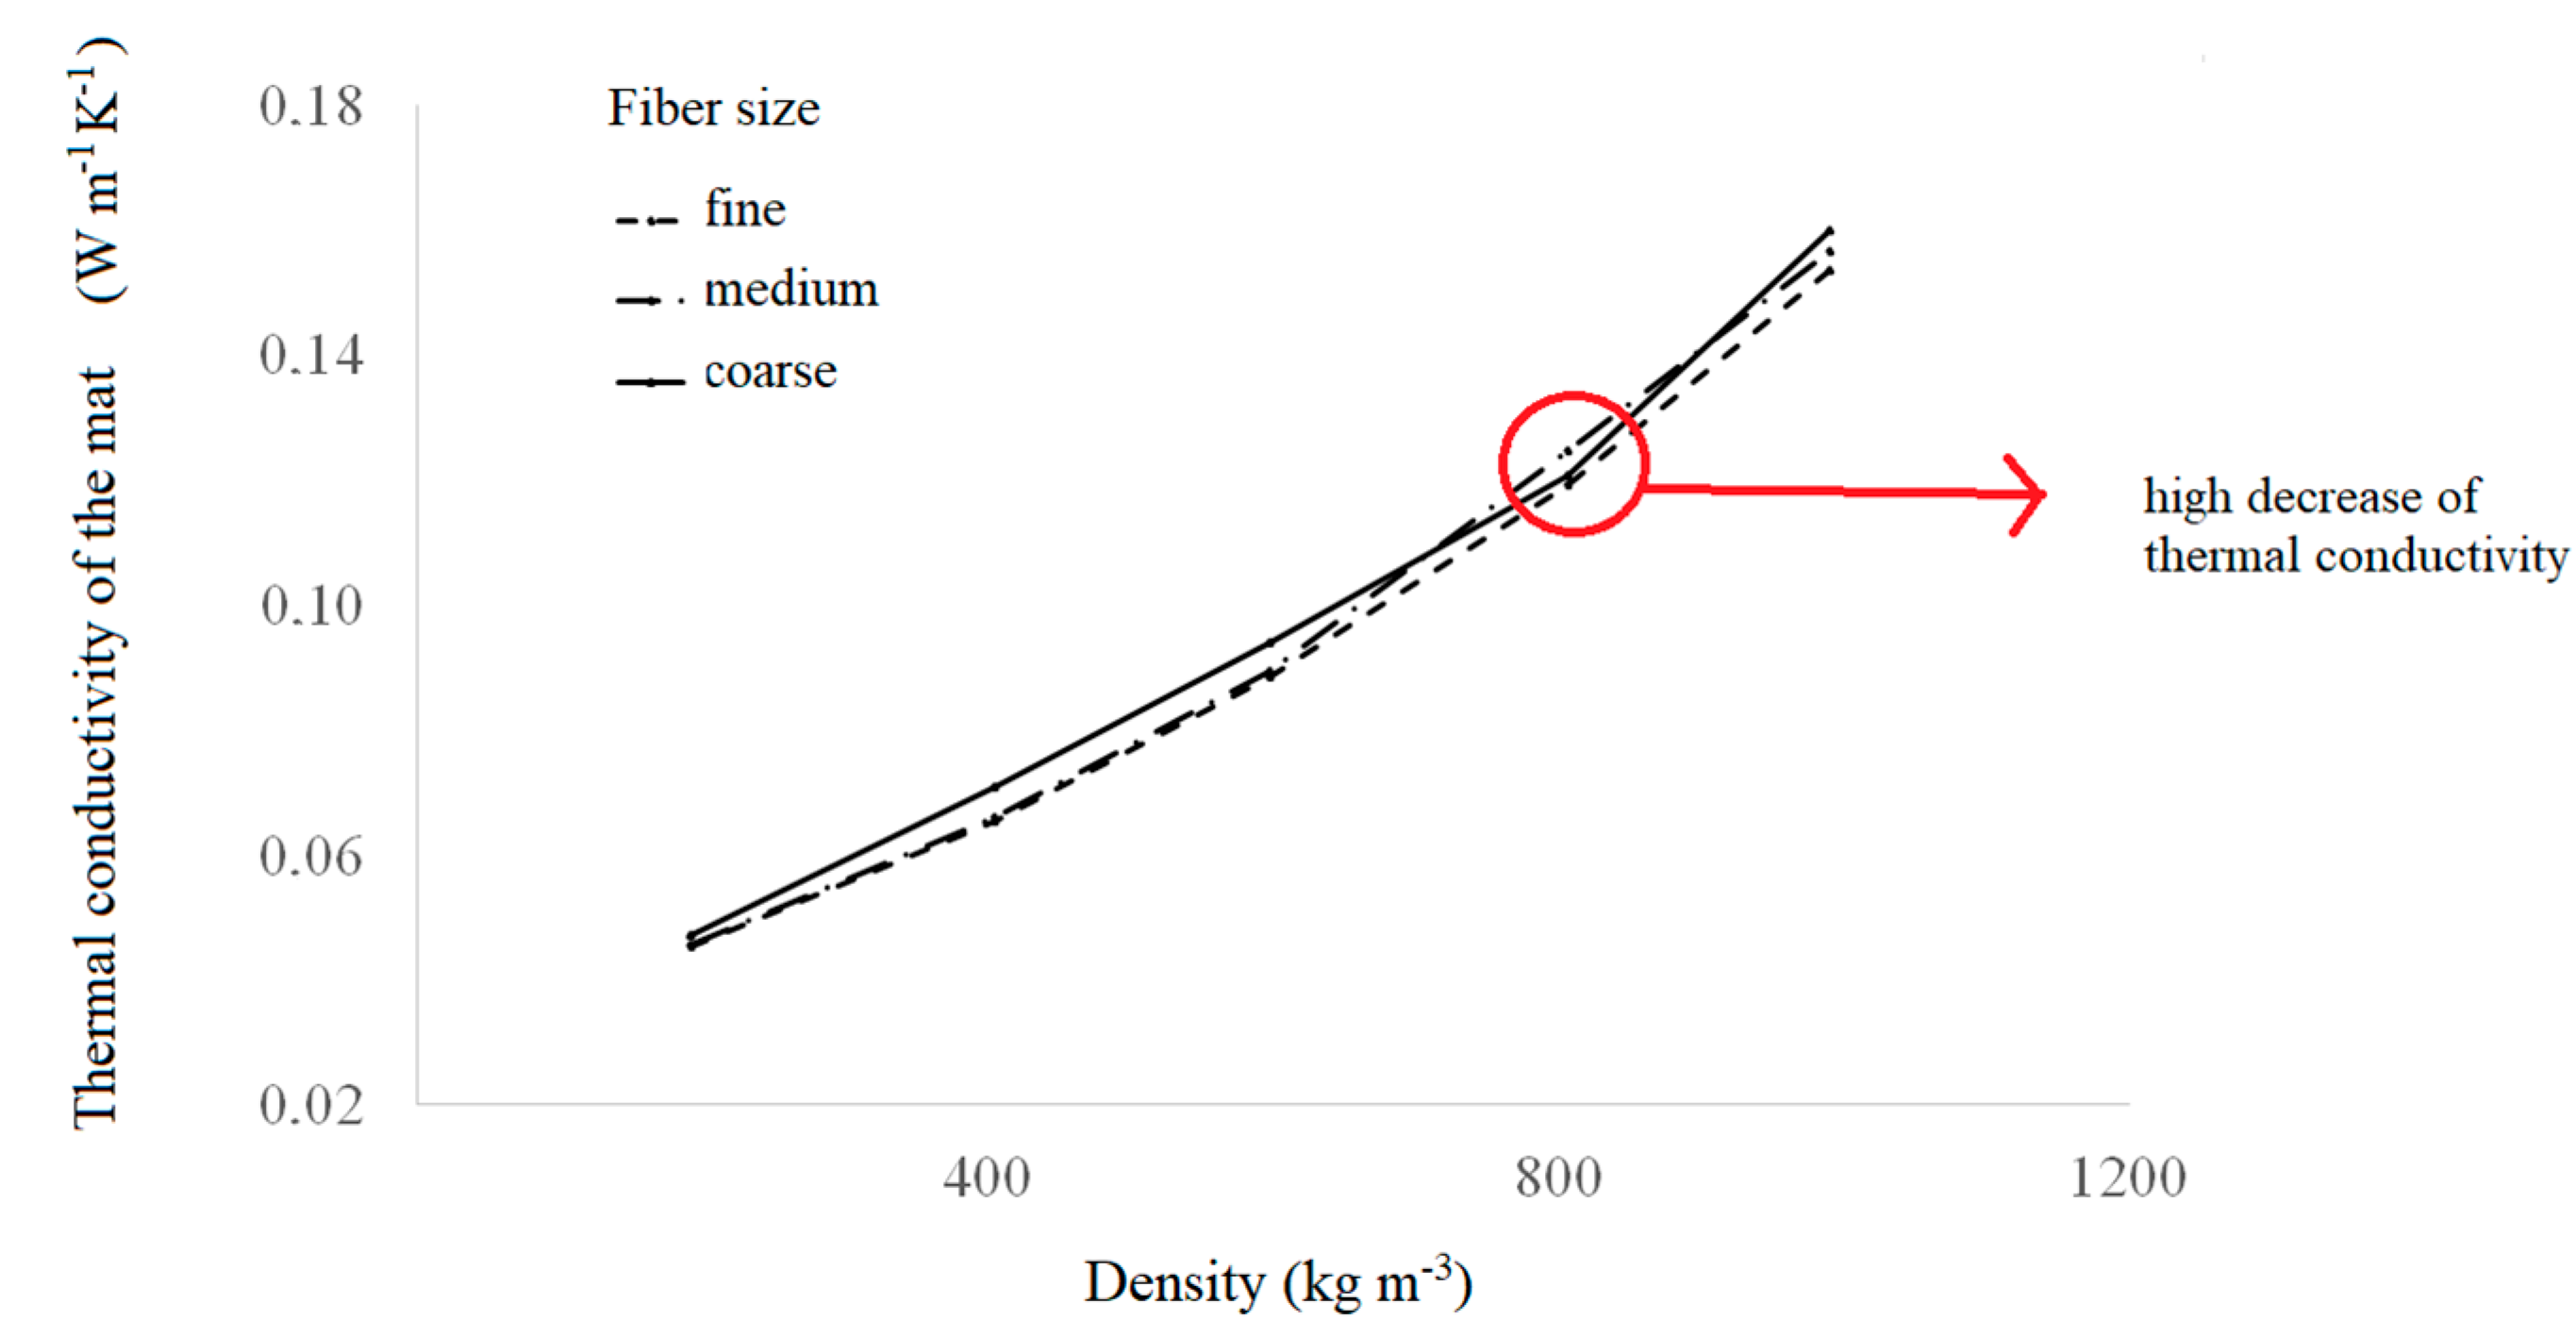
An analysis of variance was also performed to investigate the effect of mat density and fiber size on mat thermal conductivity (Table 3). The results showed a very significant interaction between mat density and fiber size. The interaction between the variables mat density and fiber size is illustrated in Figure 11 by the curves obtained for fine, medium and coarse fibers, which are not parallel. This indicated that heat conduction during mat compression is dependent on mat density and fiber size.
Coarse fibers thermal conductivity is higher than for medium and fine fibers according to Figure 11. At higher mat densities up to 810 kg m−3, thermal conductivity continued to increase but more slowly for coarse fiber mats. A low difference of heat conduction between fiber size through the mat thickness was observed at low densities (around 200 kg m−3).
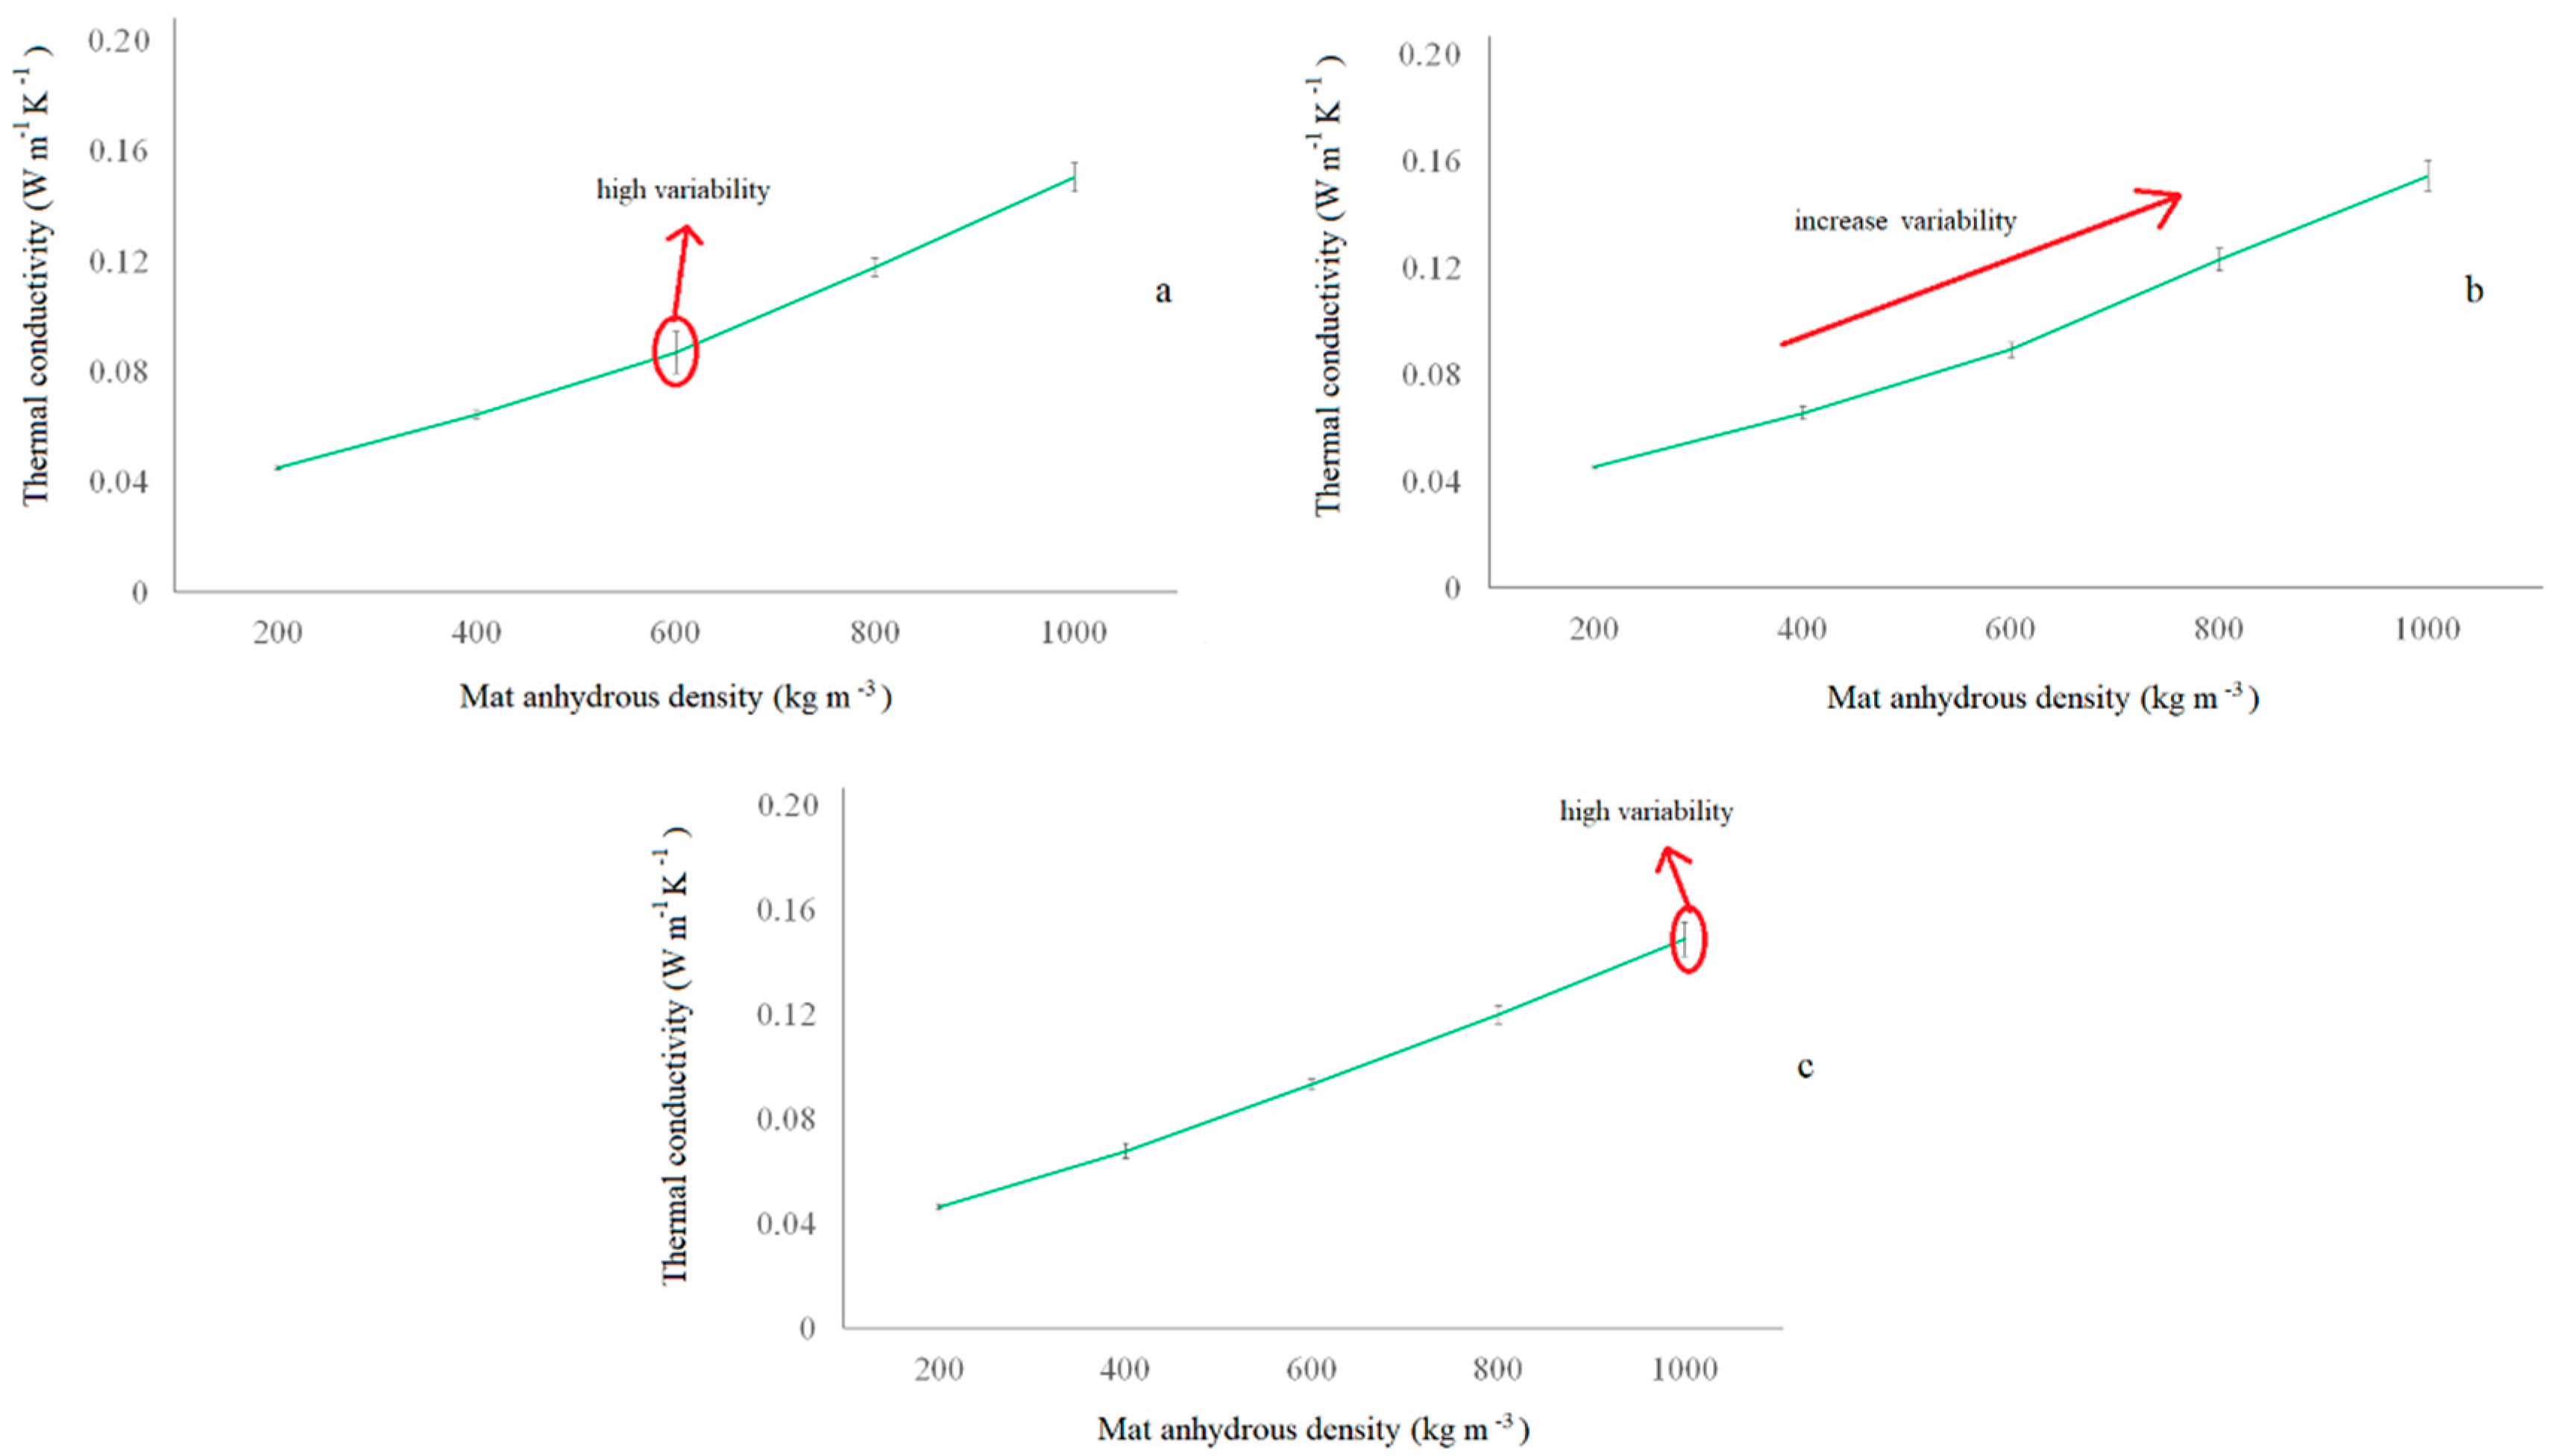
Figure 12 shows the thermal conductivity obtained for fine, medium and coarse fiber sizes against anhydrous mat density calculated from Equation (2). In the fine fiber size group, the highest variability of heat conduction was observed around 600 kg m−3. The variability in medium fiber size group increased with anhydrous density as well. In the case of the coarse fiber group, a higher variability can be noticed at 1000 kg m−3.
A second-degree polynomial expression was fitted to the experimental data of thermal conductivity as a function of oven-dry density for each fiber size studied (Equation (3)).
where TC is thermal conductivity of the fiber mat (W ), ρOD is anhydrous density of the fiber mat (kg m−3) and α1, α2 and α3 are coefficients depending on the fiber size. These coefficients are presented in Table 4 for the three fiber sizes considered. The coefficient of determination R2 of the three expressions was 0.98–0.99, which indicated that only 1–2% of the total thermal conductivity variation observed could not be explained by these models.
3.4. Thermal Conductivity in Relation to Mat Porosity
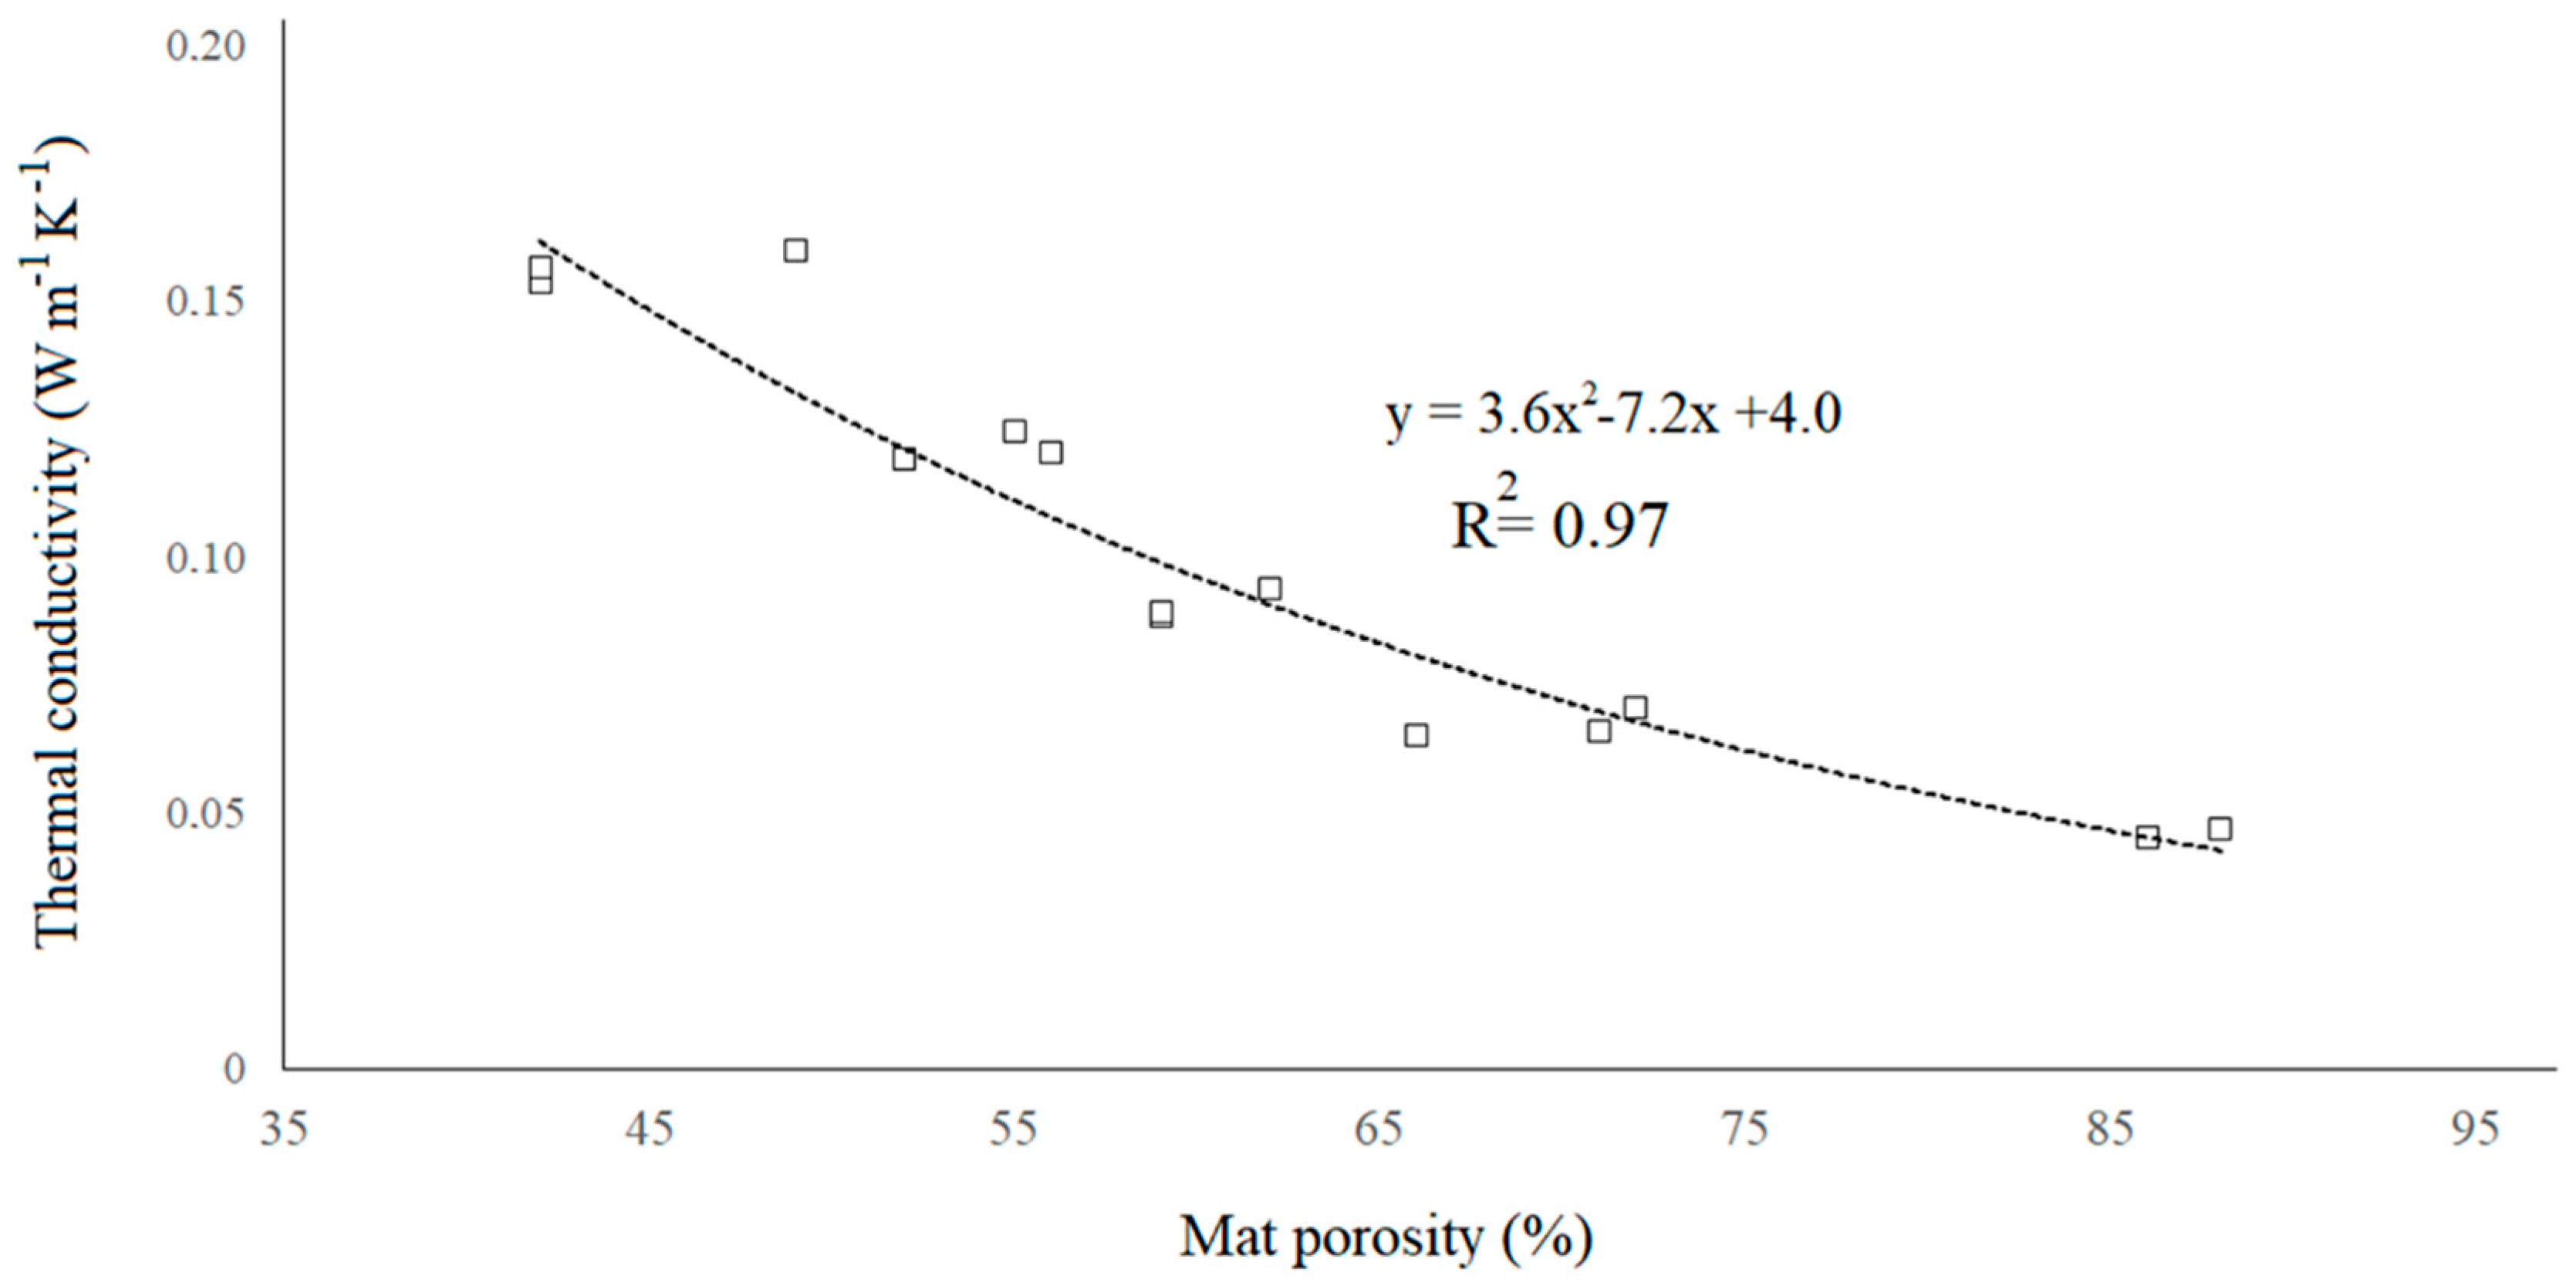
Figure 13 presents the thermal conductivity against mat porosity. A second-degree polynomial equation was fitted to the thermal conductivity porosity experimental data. The determination coefficient R2 obtained was 0.97, which indicated that 97% of the total variation of thermal conductivity observed was explained by this model.
4. Discussion
Figure 9 presents images used in the mat porosity measurements by the black and white contrast method. Collapse and fracture in latewood, as well as in earlywood cells were observed, principally between 810 kg m−3 and 987 kg m−3 of density. However, latewood cells have preserved their shape much more than earlywood cells. This higher deformation in earlywood cells is most likely due to its thinner cell wall thickness proposed by Dogu et al. [22] and Budakci et al. [23]. Furthermore, a progressive reduction of the void spaces between fibers from 198 kg m−3 to 987 kg m−3 was observed, as well as the tendency of fibers to preserve their shapes. These findings are in agreement with works performed by Delisée et al. [14] and Tran et al. [24] on low-density insulation panels. When the densification level of fiber mats increased, the fibers’ orientation in one direction also seemed to increased (Figure 7e). A notable change from a random orientation towards a better orientation of fibers also seems to occur from 598 kg m−3 to 987 kg m−3. Pettersson et al. [25], Zhou et al. [26], Dogu et al. [22] have suggested a similar behavior when the oriented strand board (OSB) mat is compressed, and the strands begin to align themselves in the same direction. The images at 810 kg m−3 and 987 kg m−3 (Figure 7d,e) exhibited a more homogeneous and oriented structure in comparison to lower densities.
According to Thoemen et al. [27] and Sliseris et al. [28], the presence of fiber bundles in the mat produces void spaces in its surrounding areas, which could affect the mat’s response to compression. Although the latewood and earlywood cells were scattered randomly inside the mat, the inhomogeneities found in the images were due principally to fiber bundles. This could have a significant effect on the physical properties of the mat during compression. A considerable deformation of fiber bundle cells compared to the surrounding cells was also observed (Figure 9b). According to Delisée et al. [14], these differences in the fibrous network could influence the mat response to compression due to the highest level of fiber orientation of bundles in comparison to the individual fibers.
Figure 10 showed the porosity results in relation to mat density. These results are in agreement with findings reported by Siau [11] and Belley [18]. Regarding the effect of mat density and fiber size on mat porosity, the results revealed a significant combined effect of density and fiber size (Table 2) as proposed by Bolton and Humphrey [29] and Dai et al. [30]. The mat porosity decreased significantly when the mat density increased. These results are in agreement with studies performed on wood-based composite materials by Dai et al. [31], Belley [18], Li et al. [32] and Ai et al. [33]. The impact of mat density on porosity was dependent on fiber size (Figure 10). Additionally, it was observed that when the mat density increased from 198 kg m−3 to 415 kg m−3 the porosity decreased faster in mats made with fine fibers in comparison with medium and coarse fiber mats. Then, when the mat density increased towards 598 kg m−3, the porosity of mats made with medium fibers decreased faster than the mats made with fine and coarse fibers. Next, at higher densities, the porosity decreased in a similar manner for mats made with fine and coarse fibers. The porosity of the mats made with medium fibers decreased more slowly when the density increased towards 810 kg m−3 and later it decreased quickly as the mat density reached 987 kg m−3. This showed that the medium fiber mats offered a higher resistance to compression when the mat was compressed from 598 kg m−3 to 810 kg m−3. Furthermore, the porosity decreases differently in mats made with fine, medium and coarse fibers due to the high impact of fiber size on the porous structure of the mat. Previous works performed by Bolton and Humphrey [29], Thoemen and Klueppel [15], Sliseris et al. [28] have suggested a particle size effect on the mat structure. This is in agreement with the current results which indicated that fiber size had an impact on void spaces. The fine fibers could tend to agglomerate more easily forming fiber bundles, thus decreasing the void spaces between fibers.
Fiber size and mat density are fundamental variables for the thermal conductivity of the mat because heat conduction is carried out principally through fibers as mentioned above. The results of the analysis of variance (Table 3) showed a high interaction between density and fiber size on heat conduction through mat thickness. Figure 11 presents this interaction. Thermal conductivity observed in coarse fiber mats was significantly higher than in mats made with fine and medium fibers between 198 kg m−3 and 598 kg m−3. Nonetheless, between 598 kg m−3 and 987 kg m−3, the thermal conductivity of coarse fiber mats decreased unexpectedly. This was probably due to the fracture of the fibers’ cell wall as mentioned above (see Figure 8d,e), when the mat was compressed to about 810 kg m−3 and its structure became more discontinuous for heat conduction. These fiber fractures could cause a significant change of the fibrous network structure when the mat density changes from 598 kg m−3 to around 810 kg m−3 as proposed by Bolton and Humphrey [29], Sun et al. [10]. Hence, the mat structure could be more affected in the case of coarse fibers because of their tendency to break, impacting more strongly heat conduction through mat thickness.
Figure 12a–c presented the thermal conductivity of mats made with fine, medium and coarse fiber against anhydrous density respectively. As already mentioned, the variability pattern of the three fiber sizes considered in this investigation was different. The thermal conductivity variability in fine and coarse fiber sizes was higher at 600 kg m−3 and 1000 kg m−3 respectively, while the variability of thermal conductivity in medium fiber sizes increased with density overall. This also suggested that fiber size had a significant impact on the internal structure of the mat. The quadratic parameter of the regression equations indicates the grade of the parabola curvature. A larger magnitude shows a higher increment of thermal conductivity with a sustained increase in density. The quadratic coefficient corresponding to thermal conductivity in mats made with fine fibers was higher than for mats made with medium and coarse fiber sizes. This indicated that the fine fibers conducted heat more efficiently than medium and coarse fibers most likely due to the lower void spaces. Furthermore, a higher frequency of cell wall rupture of coarse fibers in comparison to fine and medium size fibers could have caused a reduction in the heat conduction capacity of coarse fiber mats, as mentioned above. Additionally, it was found that thermal conductivity increased with an increase of mat densification levels as proposed by Kamke and Zylkowski [13], Zambori et al. [8], Belley [18], Sonderegger and Niemz [34], Suleiman et al. [17], Haselein [35] and Thoemen and Humphrey [2] (Equation (1)) in studies performed on wood and wood-based composites.
As it is known, composites materials such as MDF can be considered as materials with discontinuities in their fibrous structure. Thereby, the thermal conductivity of the fiberboard mat may also be affected by a discontinuous structure. Figure 13 presents thermal conductivity against mat porosity for all fiber sizes. The mat porosity had a substantial effect on thermal conductivity. This tendency was also reported by Dai et al. [31], Thoemen et al. [26], Sonderegger and Niemz [34] and Suleiman et al. [14] in investigations on wood-based composite materials. The drastic decrease of thermal conductivity below 65% of mat porosity was evident. Meanwhile, at mat porosities above this percentage, the thermal conductivity reduction was asymptotic. The heat conduction capacity of fiber mats decreased as mat porosity increased as suggested by Kamke and Casey [36]. When mat porosity increased towards 62%, the thermal conductivity decreased rapidly. This indicated that heat conduction was more effective at low porosity levels when the mat is more compressed, and the void spaces are lower. This could also be due to the collapse and fracture of the fibers below a porosity of 62%, producing a drastic decrease of the void spaces as observed in this study. Conversely, thermal conductivity decreased more slowly when the mat porosity increased above 62%. This indicated that the high proportion of void spaces in the fiber mat had a high impact on heat conduction. Thus, a high proportion of the void spaces between fibers could offer higher resistance to heat conduction than the intra-fibers void spaces, which usually predominate at lower porosity levels [14,24].
5. Conclusions
- Fiber size affected the porosity and thermal conductivity of the mat. This indicates that fiber size should be considered in predictive models.
- The fiber mats made with medium fiber size (between 0.60 and 0.71 mm) showed a higher resistance to compression. The mats made with coarse fibers (3.00 mm) presented a higher level of fracture and collapse which affected their capacity for heat conduction.
- The results of this investigation suggested that heat conduction is more efficient during the compression of mats with fine fibers (0.044–0.14 mm). This indicated that fine fibers had a lower tendency to produce void spaces in the fiber mat.
- The void space affected heat conduction efficiency through the mat thickness.
- During the porosity measurements, fiber bundles and fiber cell wall fractures were observed. This had an impact on mat compression and heat conduction of the fiber mats.
Author Contributions
All authors contributed extensively to the presented work, discussed, reviewed, and agreed to the modifications at all stages of the paper. P.R. carried out the experiment and prepared the first version of manuscript. P.R. and A.C. analyzed and discussed the results. A.C. and M.-C.Y. reviewed and corrected the manuscript.
Funding
This research was supported by the Natural Sciences and Engineering Research Council of Canada (NSERC) under Discovery Grant #121954-2012.
Acknowledgments
The authors are grateful to Richard Janvier and David Lagueux for their technical assistance in the samples preparation and porosity measurements respectively.
Conflicts of Interest
The authors declare no conflict of interest.
References
- Von Haas, G. Investigation of the Hot Pressing of Wood Composite-Mats under Special Consideration of the Compression Behavior, the Permeability, the Temperature Conductivity and Sorption-Speed. Ph.D. Thesis, Hamburg University, Hamburg, Germany, 1998. (In Germany). [Google Scholar]
- Thoemen, H.; Humphrey, P.E. Modeling the physical process relevant during hot pressing of wood-based composites. Part I. Heat and mass transfer. Holz Roh Werkst. 2006, 64, 1–10. [Google Scholar] [CrossRef]
- Thoemen, H.; Haselein, C.; Humphrey, P.E. Modeling the physical process relevant during hot pressing of wood-based composites. Part II. Rheology. Holz Roh Werkst. 2006, 64, 125–133. [Google Scholar] [CrossRef]
- Kavazović, Z.; Deteix, J.; Cloutier, A.; Fortin, A. Numerical modeling of the medium-density fiberboard hot pressing process, Part I: Coupled heat and mass transfer model. Wood Fiber Sci. 2012, 42, 168–188. [Google Scholar]
- Kavazović, Z.; Deteix, J.; Fortin, A.; Cloutier, A. Numerical modeling of the medium-density fiberboard hot pressing process, Part II: Mechanical and heat and mass transfer models. Wood Fiber Sci. 2012, 44, 243–262. [Google Scholar]
- Humphrey, P.E. Physical Aspects of Wood Particleboard Manufacture. Ph.D. Thesis, University of Wales, Cardiff, UK, 1982. [Google Scholar]
- Kayihan, F.; Johnson, J.A. Heat and moisture movement in wood composite materials during the pressing operation—A simplified model. In Book Numerical Methods in Heat Transfer, 2nd ed.; Lewis, K., Morgan, B.A., Eds.; John Wiley and Sons: New York, NY, USA, 1983; Volume 2, pp. 511–531. [Google Scholar]
- Zambori, B.G.; Kamke, F.A.; Watson, L.T. Sensibility analysis of internal mat environment during hot pressing. Wood Fiber Sci. 2004, 36, 195–209. [Google Scholar]
- Kavazović, Z.; Deteix, J.; Cloutier, A.; Fortin, A. Sensitivity study of a numerical model of heat and mass transfer involved during the medium-density fiberboard hot pressing process. Wood Fiber Sci. 2010, 42, 130–149. [Google Scholar]
- Sun, G.; Ibach, R.; Faillace, M.; Gnatowski, M.; Glaeser, J.; Haight, J. Laboratory and exterior decay of wood-plastic composite boards: Voids analysis and computed tomography. Wood Mater. Sci. Eng. 2017, 12, 263–278. [Google Scholar] [CrossRef]
- Siau, J. Wood: Influence of Moisture on Physical Properties; Department of Wood Science and Forest Products, Virginia polytechnic Institute and State University: Blacksburg, VA, USA, 1995; p. 227. [Google Scholar]
- Hata, T.; Kawai, S.; Ebihara, T.; Sasaki, H. Production of particleboards with a steam injection press V. Effects of particle geometry on temperature behaviors in particle mats and on-air permeabilities of boards. Mokuzai Gakkaishi 1993, 39, 161–168. [Google Scholar]
- Kamke, F.A.; Zylkowski, S.C. Effect of wood-based panel characteristics on thermal conductivity. For. Prod. J. 1989, 39, 19–24. [Google Scholar]
- Delisée, C.; Badel, E.; Lux, J.; Malvestio, J. Caractérisation microstructurale 3D et densification locale d`isolants fibreux cellulosiques sollicites en compression. Eur. J. Environ. Civ. Eng. 2009, 13, 429–442. [Google Scholar] [CrossRef]
- Thoemen, H.; Klueppel, A. An investigation on the permeability of different wood furnish materials. Holzforschung 2008, 62, 215–222. [Google Scholar] [CrossRef]
- Sackey, E.K.; Smith, G.D. Characterizing macro-voids of uncompressed mats and finished particleboard panels using response surface methodology and X-ray CT. Holzforschung 2010, 64, 343–352. [Google Scholar] [CrossRef]
- Suleiman, B.M.; Larfeldt, J.; Leckner, B.; Gustavsson, M. Thermal conductivity and diffusivity of wood. Wood Sci. Technol. 1999, 33, 465–473. [Google Scholar] [CrossRef]
- Belley, D. Détermination des Propriétés de Transfert de Chaleur et de Masse des Panneaux de Fibres de bois MDF. Master’s Thesis, Univeristé Laval, Québec, QC, Canada, 2009. (In French). [Google Scholar]
- Rebolledo, P.; Cloutier, A.; Yemele, M.-C. Gas permeability of fiberboard mats as a function of density and fiber size. Wood Mater. Sci. Eng. 2018, 1, 1–8. [Google Scholar] [CrossRef]
- Chaffey, N. Wood microscopical techniques. In Wood Formation in Trees; Chaffey, N., Ed.; Taylors and Francis: New York, NY, USA, 2002; Chapter 3; pp. 17–40. [Google Scholar]
- ISO 8302:1991. Thermal Insulation—Determination of Steady-State Thermal Resistance and Related Properties—Guarded Hot Plate Apparatus; Technical Committee ISO/TC 163; International Organization for Standardization: Geneva, Switzerland, 2013. [Google Scholar]
- Dogu, D.; Tirak, K.; Candan, Z.; Unsal, O. Anatomical investigation of thermally compressed wood panels. Bioresources 2010, 5, 2640–2663. [Google Scholar]
- Budakci, M.; Pelit, H.; Sonmez, A.; Korkmaz, M. The effects of densification and heat post-treatment on hardness and morphological properties of wood materials. Bioresources 2016, 11, 7822–7838. [Google Scholar] [CrossRef]
- Tran, H.; Doumalin, P.; Delisée, C.; Dupre, J.C.; Malvestio, J.; Germaneau, A. 3D mechanical analysis of low-density wood-based fiberboards by X-ray microcomputed tomography and Digital Volume Correlation. J. Mater. Sci. 2012, 48, 3198–3212. [Google Scholar] [CrossRef]
- Pettersson, P.; Staffan Lundström, T.; Wikström, T. A method to measure the permeability of dry fiber mats. Wood Fiber Sci. 2006, 38, 417–426. [Google Scholar]
- Zhou, C.; Dai, C.; Smith, G. A generalized mat consolidation model for wood composites. Holzforschung 2008, 62, 201–208. [Google Scholar] [CrossRef]
- Thoemen, H.; Walther, T.; Wiegmann, A. 3D simulation of macroscopic heat and mass transfer properties from the microstructure of wood fibre networks. Compos. Sci. Technol. 2008, 68, 608–616. [Google Scholar] [CrossRef] [Green Version]
- Sliseris, J.; Handra, H.; Kabel, M.; Dix, B.; Plinke, B. Virtual characterization of MDF fiber network. Eur. J. Wood Wood Prod. 2017, 75, 397–407. [Google Scholar] [CrossRef]
- Bolton, A.J.; Humphrey, P.E. The permeability of wood-based composite materials. Holzforschung 1994, 48, 95–100. [Google Scholar] [CrossRef]
- Dai, C.; Yu, C.; Xu, C.; He, G. Heat and mass transfer in wood composite panels during hot pressing. Part 4. Experimental investigation and model validation. Holzforschung 2007, 61, 83–88. [Google Scholar] [CrossRef]
- Dai, C.; Yu, C.; Zhou, X. Heat and mass transfer in wood composite panels during hotpressing: Part II Modeling void formation and mat permeability. Wood Fiber Sci. 2005, 37, 242–257. [Google Scholar]
- Li, P.; Dai, C.; Wang, S. A simulation of void variation in wood-strand composites during consolidation. Holzforschung 2009, 63, 357–361. [Google Scholar] [CrossRef]
- Ai, W.; Duval, H.; Pierre, F.; Perré, P. A novel device to measure gaseous permeability over a wide range of pressures: Characterization of slip flow for Norway spruce, European beech, and wood-based materials. Holzforschung 2017, 71, 147–162. [Google Scholar] [CrossRef]
- Sonderegger, W.; Nienz, P. Thermal conductivity and water vapour transmission properties of wood-based materials. Eur. J. Wood Wood Prod. 2009, 67, 313–321. [Google Scholar] [CrossRef]
- Haselein, C.R. Numerical Simulation of Pressing Wood-Fiber Composites. Ph.D. Thesis, Oregon State University, Corvallis, OR, USA, 1998. [Google Scholar]
- Kamke, F.A.; Casey, L. Fundamentals of flakeboard manufacture: Internal-mat conditions. For. Prod J. 1989, 38, 38–44. [Google Scholar]
Figure 1.
Fiber size distribution of white spruce according to the mesh opening [19]: (a) Fine fiber size, (b) Medium fiber size, (c) Coarse fiber size.
Figure 1.
Fiber size distribution of white spruce according to the mesh opening [19]: (a) Fine fiber size, (b) Medium fiber size, (c) Coarse fiber size.

Figure 2.
Probes used for mat temperature measurements.

Figure 3.
Specimen cutting scheme in each laboratory panel.

Figure 4.
Impregnation procedure of the fiberboard specimens for porosity determination: (a) Cutting a fiberboard cube of 1 mm3, (b) Submersion of fiberboard specimen in acrylic resin, (c) Fiberboard specimen in polymerized resin, (d) Microtomed slices obtained from impregnated specimens.
Figure 4.
Impregnation procedure of the fiberboard specimens for porosity determination: (a) Cutting a fiberboard cube of 1 mm3, (b) Submersion of fiberboard specimen in acrylic resin, (c) Fiberboard specimen in polymerized resin, (d) Microtomed slices obtained from impregnated specimens.

Figure 5.
Setup used to measure mat porosity by image analysis: Optical microscope, camera, and Wincell software.
Figure 5.
Setup used to measure mat porosity by image analysis: Optical microscope, camera, and Wincell software.

Figure 6.
Four images were taken in one fiberboard slice for analyses with the Wincell software. The arrows indicate the porosity measurement sequence. I: first measurement; II: second measurement; III: third measurement; IV: fourth measurement.
Figure 6.
Four images were taken in one fiberboard slice for analyses with the Wincell software. The arrows indicate the porosity measurement sequence. I: first measurement; II: second measurement; III: third measurement; IV: fourth measurement.

Figure 7.
Equipment for thermal conductivity measurements.

Figure 8.
Images (40×) used to calculate mat porosity by the black and white contrast method at different density levels: (a) 198 kg m−3, (b) 415 kg m−3, (c) 598 kg m−3, (d) 810 kg m−3, (e) 987 kg m−3. White is fibrous material, and black is void spaces.
Figure 8.
Images (40×) used to calculate mat porosity by the black and white contrast method at different density levels: (a) 198 kg m−3, (b) 415 kg m−3, (c) 598 kg m−3, (d) 810 kg m−3, (e) 987 kg m−3. White is fibrous material, and black is void spaces.

Figure 9.
Images of mat porosity at 810 kg m−3 with the same fiber bundle at different magnifications: (a) 20×, (b) 40×.
Figure 9.
Images of mat porosity at 810 kg m−3 with the same fiber bundle at different magnifications: (a) 20×, (b) 40×.

Figure 10.
Interaction of mat porosity versus density at different fiber sizes.

Figure 11.
Interaction of thermal conductivity of the mat versus density at different fiber sizes.

Figure 12.
Thermal conductivity versus mat anhydrous density for different fiber sizes: (a) Fine size, (b) medium size, (c) coarse size. Vertical lines show error bars.
Figure 12.
Thermal conductivity versus mat anhydrous density for different fiber sizes: (a) Fine size, (b) medium size, (c) coarse size. Vertical lines show error bars.

Figure 13.
Effect of porosity on the thermal conductivity of the mat for all fiber sizes.


Table 1.
Refining parameters for white spruce chips.
| Fiber Size | Plates Rotation Speed (rpm) | Pressure (bars) | Holding Time (s) | Plate Spacing (mm) | Temperature (°C) |
|---|---|---|---|---|---|
| Fine | 2750 | 8 | 120 | 0.10 | 170 |
| Medium | 2000 | 8 | 120 | 0.25 | 170 |
| Coarse | 2000 | 8 | 120 | 0.60 | 170 |
Table 2.
Analysis of variance performed for the mat porosity at different density levels and fiber sizes.
Table 2.
Analysis of variance performed for the mat porosity at different density levels and fiber sizes.
| Source | Degrees of Freedom | Sum of Squares | Mean Square | F-Value | p-Value |
|---|---|---|---|---|---|
| Mat density | 4 | 670,202 | 167,550 | 3907.4 | <0.0001 |
| Fiber size | 2 | 10,660 | 5330 | 124.3 | <0.0001 |
| Mat density × fiber size | 8 | 4515 | 564 | 13.2 | <0.0001 |
Table 3.
Analysis of variance for thermal conductivity at different levels of mat density and fiber sizes.
Table 3.
Analysis of variance for thermal conductivity at different levels of mat density and fiber sizes.
| Source | DF | Sum of Squares | Mean Square | F Value | Pr > F |
|---|---|---|---|---|---|
| Mat density | 4 | 0.25554 | 0.06388 | 5292.1 | <0.0001 |
| Fiber size | 2 | 0.00016 | 0.00008 | 6.7 | 0.0020 |
| Mat density × fiber size | 8 | 0.00041 | 0.00005 | 4.28 | 0.0001 |
Table 4.
Regression equation coefficients to calculate the thermal conductivity of the fiber mat as a function of mat anhydrous density (Equation (3)).
Table 4.
Regression equation coefficients to calculate the thermal conductivity of the fiber mat as a function of mat anhydrous density (Equation (3)).
| Fiber Size | α1 | α2 | α3 | R2 |
|---|---|---|---|---|
| Fine | 8.13 × 10⁻⁸ | 5.28 × 10⁻⁵ | 0.03 | 0.98 |
| Medium | 7.81 × 10⁻⁸ | 6.22 × 10⁻⁵ | 0.03 | 0.99 |
| Coarse | 6.27 × 10⁻⁸ | 7.25 × 10⁻⁵ | 0.03 | 0.99 |
© 2018 by the authors. Licensee MDPI, Basel, Switzerland. This article is an open access article distributed under the terms and conditions of the Creative Commons Attribution (CC BY) license (http://creativecommons.org/licenses/by/4.0/).
Share and Cite
MDPI and ACS Style
Rebolledo, P.; Cloutier, A.; Yemele, M.-C. Effect of Density and Fiber Size on Porosity and Thermal Conductivity of Fiberboard Mats. Fibers 2018, 6, 81. https://0-doi-org.brum.beds.ac.uk/10.3390/fib6040081
AMA Style
Rebolledo P, Cloutier A, Yemele M-C. Effect of Density and Fiber Size on Porosity and Thermal Conductivity of Fiberboard Mats. Fibers. 2018; 6(4):81. https://0-doi-org.brum.beds.ac.uk/10.3390/fib6040081
Chicago/Turabian StyleRebolledo, Pamela, Alain Cloutier, and Martin-Claude Yemele. 2018. "Effect of Density and Fiber Size on Porosity and Thermal Conductivity of Fiberboard Mats" Fibers 6, no. 4: 81. https://0-doi-org.brum.beds.ac.uk/10.3390/fib6040081
Note that from the first issue of 2016, this journal uses article numbers instead of page numbers. See further details here.