Preparation of Chitosan-Coated Poly(L-Lactic Acid) Fibers for Suture Threads

Faculty of Chemistry, Materials and Bioengineering, Kansai University, Suita, Osaka 564-8680, Japan
*
Author to whom correspondence should be addressed.
Fibers 2018, 6(4), 84; https://0-doi-org.brum.beds.ac.uk/10.3390/fib6040084
Submission received: 26 September 2018
/
Revised: 23 October 2018
/
Accepted: 24 October 2018
/
Published: 25 October 2018
(This article belongs to the Special Issue Smart Coatings on Fibers and Textiles)
Abstract
:Poly(L-lactic acid) (PLA) is a biodegradable fiber, and a promising material for use in biomedical applications. However, its hydrophobicity, low hydrolyzability, and poor cell adhesion can be problematic in some cases; consequently, the development of improved PLA-based materials is required. In this study, chitosan-coated (CS-coated) PLA was prepared by plasma treatment and the layer-by-layer (LBL) method. Plasma treatment prior to CS coating effectively hydrophilized and activated the PLA surface. The LBL method was used to increase the number of CS and sodium alginate (SA) coating layers by electrostatically superposing alternating anionic and cationic polymers. The prepared fibers were characterized by tensile testing, scanning electron microscopy (SEM), X-ray photoelectron spectroscopy (XPS), nitrogen analysis and degradation testing, which revealed that the 100 W plasma treatment for 60 s was optimum, and that plasma treatment and the LBL method effectively coated CS onto the PLA fibers. The existence or not of a coating on the PLA fiber did not appear to influence the degradation of the fiber, which is ascribable to the extremely thin coating, as evidenced by nitrogen analysis and SEM. The CS-coated PLA fibers were prepared without damaging the PLA surface and can be used in biomaterial applications such as suture threads.
1. Introduction
Suture threads require properties such as biocompatibility and strength for surgical applications, because the removal of stitches is cumbersome for the doctor, a burden to doctor and patient, and poses a risk of infection. Poly(L-lactic acid) (PLA) fiber is one of the biodegradable suture threads currently in use. PLA is an aliphatic lactic-acid-based polyester, and is well known to be a carbon-neutral material obtained from some plants [1]. PLA has good mechanical properties and characteristics, such as biodegradability, biocompatibility, and lack of toxicity [2,3,4]. Therefore, PLA is an interesting material for use in applications that include tissue engineering, drug delivery systems, and implants [5,6,7,8]. However, the hydrophobicity, low hydrolyzability, and poor cell adhesion exhibited by the PLA surface are problematic in some biomaterial applications [9]. Several techniques have recently been reported to modify PLA surfaces. For example, PLA surfaces can be coated by hydrophilic polymers, such as proteins, chitosan (CS), and sodium alginate (SA) by alkaline, enzymatic, or plasma treatments [10,11,12,13,14].
CS is derived from chitin, which is well known to be the most abundant natural biopolymer [15,16,17]. In addition, CS is used prominently as a biomaterial because of its numerous excellent properties, which include biocompatibility, biodegradability, and antibacterial and wound-healing abilities [18,19,20,21]. CS is a cationic polymer bearing amino (–NH2) groups, a consequence of its glucosamine units, and is soluble in acidic aqueous solutions [22]. SA is also a natural biopolymer composed of (1,4) β-D-mannuronate and α-L-guluronate [23]. SA is extracted from seaweed and used in the food industry as a thickener, stabilizer and gelatinizer, a consequence of its superior properties that include biocompatibility, moisture-retention, high viscosity, and easy gelation [24,25,26]. SA is the sodium salt of an anionic polymer bearing carboxylate (–COO−) groups, and is soluble in neutral and basic aqueous solution [27].
In this study, we modified the PLA surface with CS and SA coatings to improve its surface properties while maintaining its biodegradability. Plasma treatment and layer-by-layer (LBL) deposition were employed for preparation. To the best of our knowledge, this is the first report of a CS- and SA-coated PLA fiber prepared. Plasma treatment is effective for coating CS onto the PLA surface without damaging the PLA because it hydrophilizes and activates the surface layer. Moreover, the LBL method effectively increases the amount of CS coating. The LBL method has received attention as a coating technique capable of forming multiple layers of ionic polymers on the surface of a material, and many reports have noted that multilayers can be easily prepared via this method on several materials [28]. The prepared multilayers are uniform, thin, hard, adhesive, and slightly soluble; moreover, the surfaces can be readily modified through the formation of polyelectrolyte layers [29,30]. In this study, SA and CS, as anionic and cationic layers, were coated via the electrostatic superposition of alternating polymers onto PLA fibers with these methods. The mechanical properties, morphologies, CS–PLA and SA–CS interactions, nitrogen content, and degradability of the prepared fibers were characterized by tensile testing, scanning electron microscopy (SEM), X-ray photoelectron spectroscopy (XPS), nitrogen analysis, and degradation testing, respectively. The CS-coating-modified PLA will be applicable as suture threads, because the antibacterial and wound-healing abilities of CS reduce the risk of postoperative infections.
2. Materials and Methods
2.1. Materials
CS (FM-80, Mw = 24.8 × 10³, degree of deacetylation (DDA) = 84.7%) was provided by Koyo Chemical Co., Ltd. (Sakaiminato, Japan). The weight-average molecular weight (Mw) and the DDA of CS were determined by gel permeation chromatography (GPC) and 1H-NMR spectroscopy, respectively. SA (Grad IL-2, viscosity = 44 mPa∙s) was provided by Kimica Corporation (Tokyo, Japan). Other chemicals were purchased from FUJIFILM Wako Pure Chemical Corporation (Osaka, Japan), and were used without purification. PLA fiber (167T48) was composed of 48 filaments of diameter 20 μm.
2.2. Methods
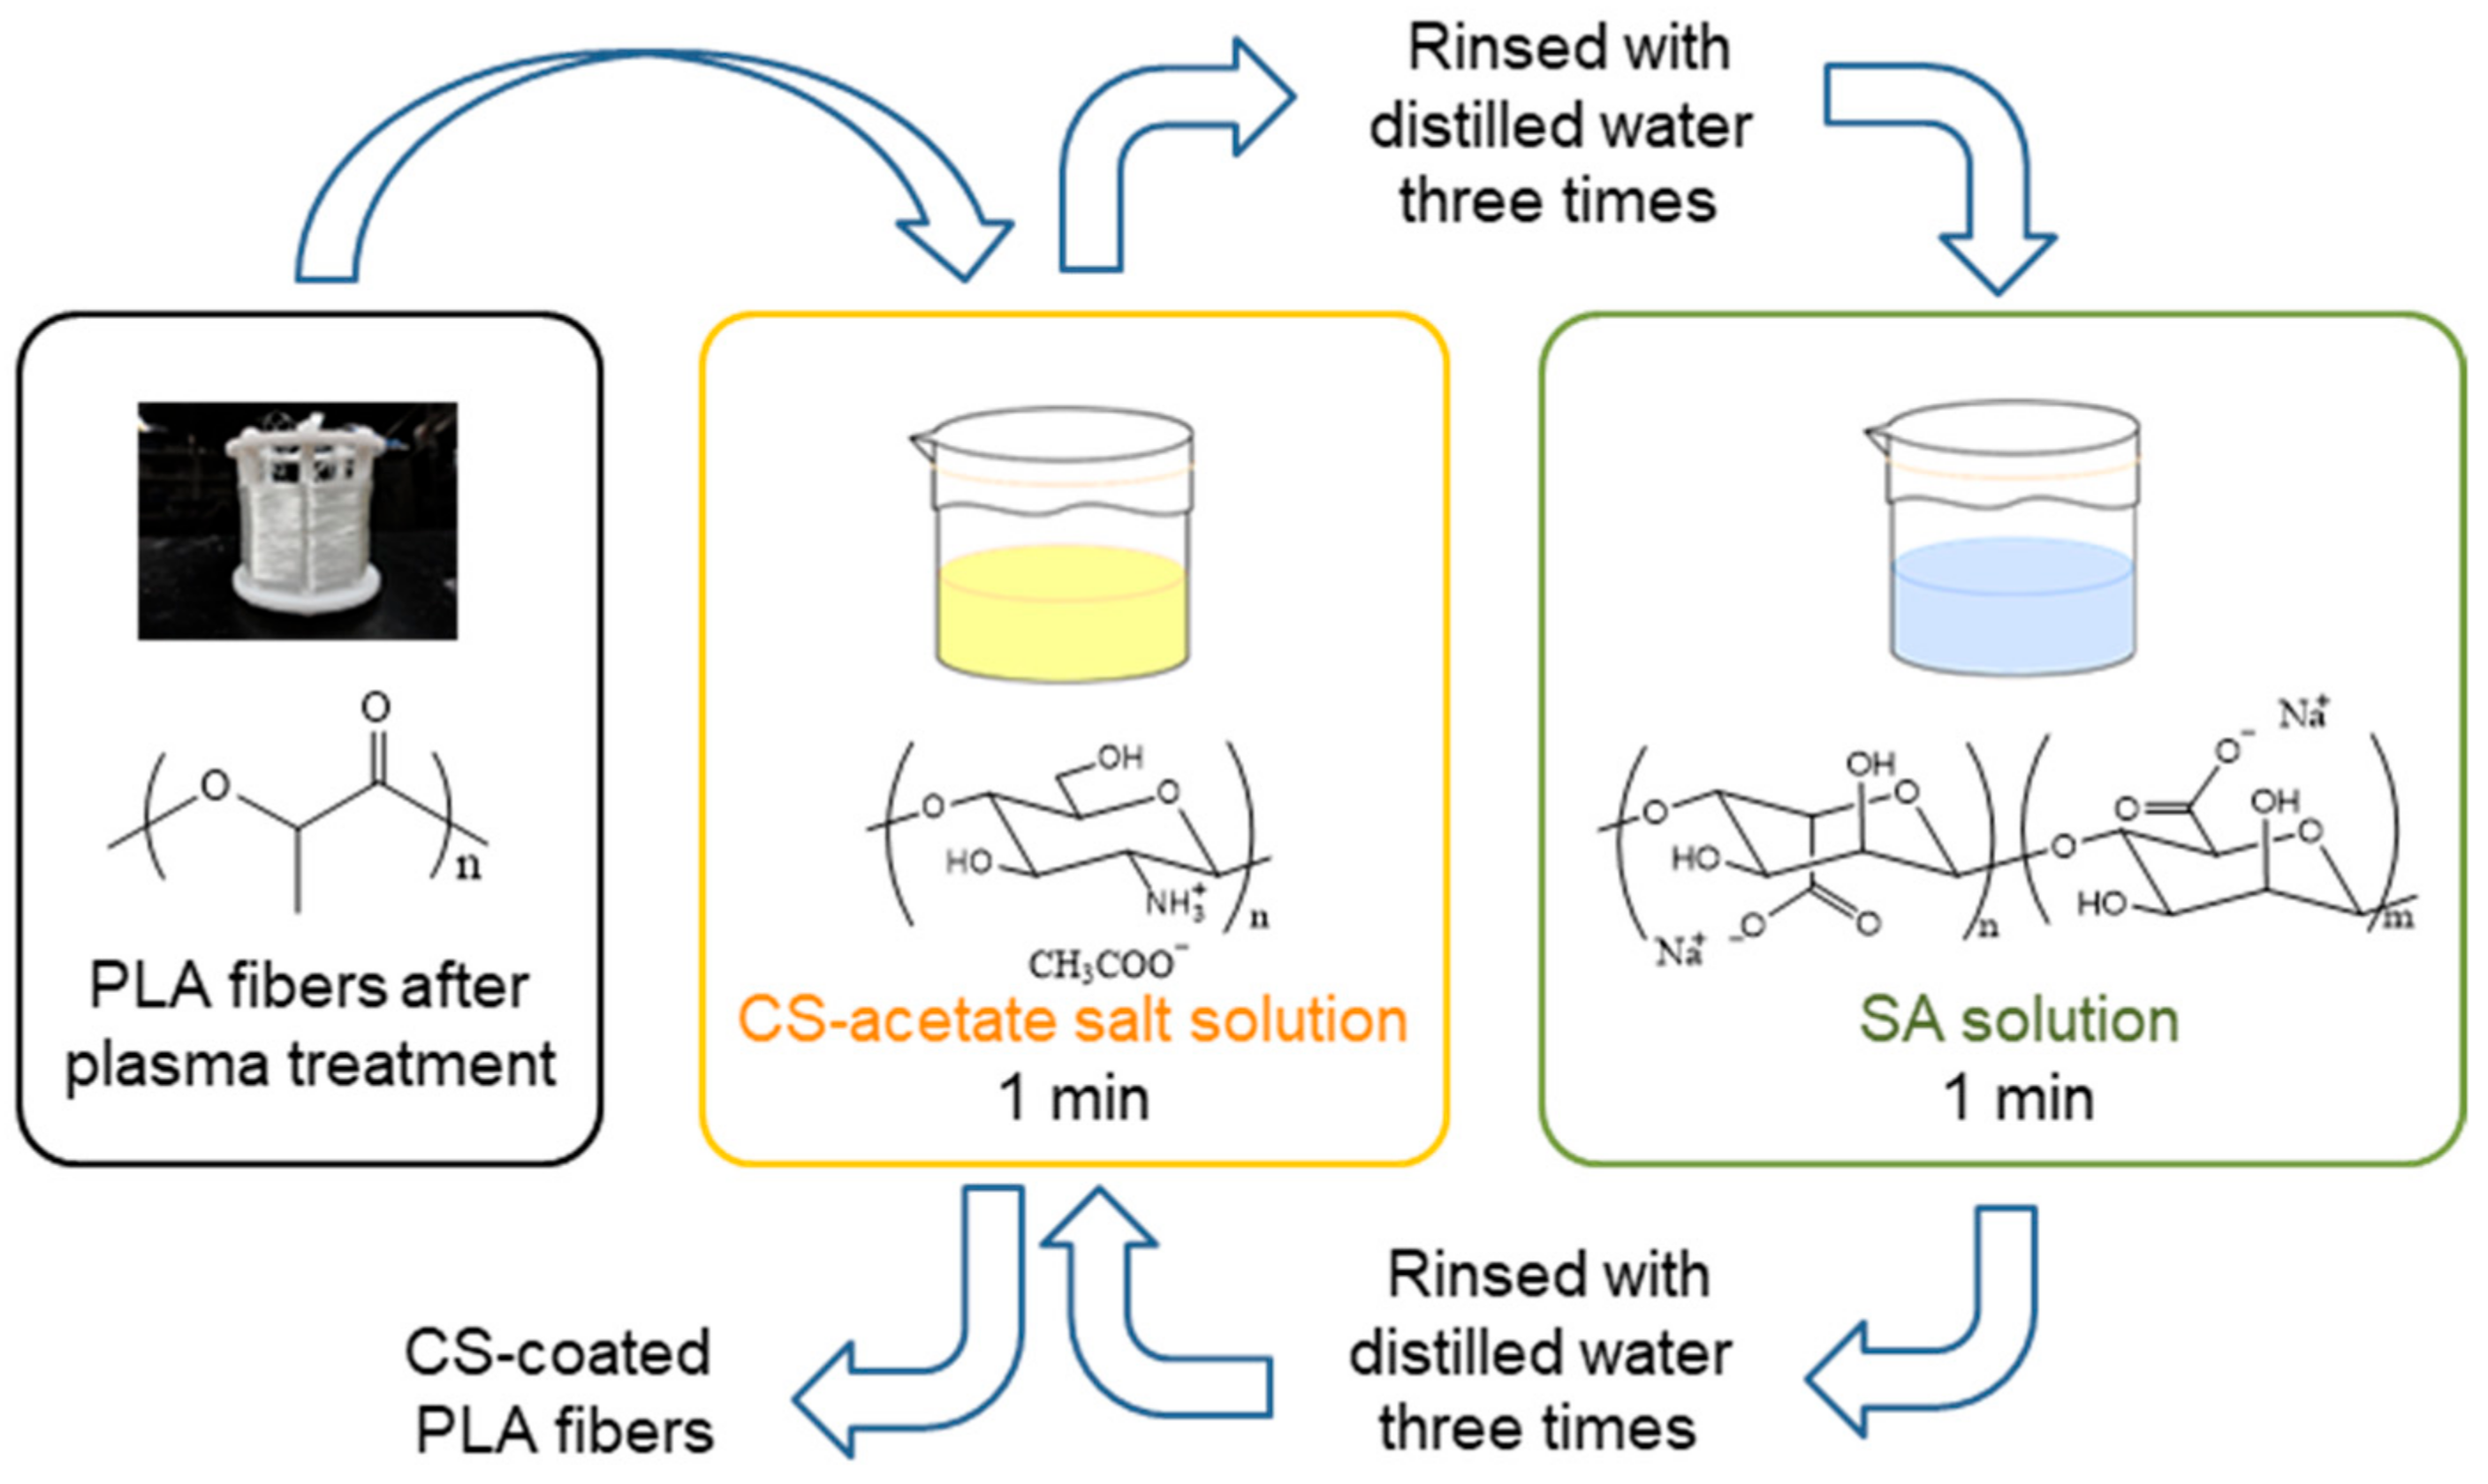
The PLA fiber was coiled on a frame and washed twice with 1% Tween 20 solution. The washed PLA was rinsed three times with distilled water and dried at room temperature. A 1% CS solution was prepared as follows. A 2 g sample of CS was dissolved in 1% aqueous acetic acid and freeze-dried to remove excess acetic acid and water. The obtained CS-acetate salt was then dissolved in 200 mL of water. The PLA fiber was protected against acetic-acid damage through the preparation of the 1% CS solution used in this method. A 1% SA solution was prepared by the overnight stirring of 2 g of SA in 200 mL of water. The coating method involving plasma treatment and the LBL method is described below.
To coat them with CS, the PLA-fiber surfaces were activated by plasma treatment (CUTE–MR/R, FEMTO SCIENCE, Hwaseong, Korea) prior to immersion in the above-mentioned CS solution. Plasma treatment was performed under the following conditions: time, 30–1800 s; power, 100–200 W; and oxygen-gas flow, 70 mL/min (Table 1).
The PLA fibers, plasma-treated under a variety of conditions, were immediately immersed in 1% CS solution and stirred for 1 min at room temperature. The PLA fibers were then rinsed three times with distilled water and dried at room temperature. PLA fibers coated with a single layer of CS were obtained in this manner.
To coat with CS and SA using the LBL method, the CS-coated PLA fibers were first immersed in 1% SA solution and stirred for 1 min at room temperature, after which the PLA fibers were rinsed three times with distilled water. CS-coated PLA fibers coated with SA through electrostatic interactions with CS were produced in this manner.
The PLA fibers formed in this manner were then immersed in 1% CS solution and stirred for 1 min at room temperature, after which the PLA fibers were rinsed three times with distilled water to give CS/SA/CS-coated PLA fibers.
Multilayer-coated PLA fibers were produced by repeating these steps. The sequence was repeated in a manner that ensured that the final coating layer was composed of CS. The coating procedure is schematically displayed in Figure 1, while the numbers of the coating layers on the various samples are summarized in Table 2.
2.3. Tensile Testing
The tensile strengths and strains of the prepared fibers were measured according to the Japanese Industrial Standard (JIS) 1013-8.5 methods using an STA-1150 universal testing machine (Orientec Co., Ltd., Tokyo, Japan). Samples for testing were cut to the appropriate length and attached to paper. The initial sample length was 10 mm, and the stretching rate was 10.0 mm/min. The force at the breaking point was measured as tensile stress, which was converted into tensile strength. Data obtained were the averages of fifteen tests.
2.4. Surface Characterization
The surface morphologies of the samples were investigated by SEM (JSM–6700 microscope, JEOL, Tokyo, Japan). All samples were vacuum-dried overnight and deposited on platinum foil prior to SEM. The CS coatings on the surfaces of the PLA fibers were examined by XPS (ESCA–3400, Kratos Analytical Ltd., Manchester, UK) fitted with a monochromatic Mg–Kα X-ray source, at 10 kV and 20 mA. Spectra in the C 1s (300–276.9 eV), O 1s (524.9–543 eV), and N 1s (410–389.9 eV) binding-energy ranges were acquired. The C 1s peak was separated to three peaks according to the chemical components as follows: hydrocarbon main chain (C–C) at 285.0 eV, ether (C–O) at 286.5 eV, and ester (COO) at 289.2 eV. To compare the amounts of CS in the various samples, the ester (COO/C) and amine (N/C) ratios were calculated using Equations (1) and (2):
2.5. Determining the Amount of CS
The Kjeldahl method for the quantitative analysis of nitrogen was used to determine the CS content on the PLA fiber. The samples were vacuum-dried at room temperature overnight prior to analysis.
The sample was degraded in the first step, as follows. A 0.2 g sample was decomposed in a Kjeldahl flask with 10 mL of concentrated H2SO4 and 3 g of the catalyst (9:1 K2SO4:CuSO4) at 500 °C for 3 h; if colored at this stage, hydrogen peroxide (35 vol%) was added to the solution to decolorize it. The colorless solution obtained in this manner was then heated again at 500 °C for 1 h and then cooled to room temperature, after which 40 mL of deionized water was added.
The degraded sample was steam-distilled and back-titrated in the second step, as follows. The Kjeldahl flask containing the degraded sample was attached to a steam distillation system and 30% w/v aqueous NaOH was added until the solution turned black, which is an indicator of alkalinity. The sample was steam-distilled for 20 min. The free-NH3-trapping solution was prepared by mixing 4 mL of 0.01 M H2SO4, 26 mL of deionized water, and a small amount of ethanolic bromocresol-green/methyl-red indicator solution. Back-titration was performed against a standardized 0.01 M NaOH solution. The CS percentage was calculated using Equations (3) and (4):
where MWCTS is the molecular weight of the CS unit (g/mol), MWGlcN is the molecular weight of the glucosamine unit, MWGlcNAc is the molecular weight of the N-acetyl glucosamine unit, C is the concentration of the H2SO4 or NaOH solution (mol/L), V is the volume of the H2SO4 or NaOH solution (L), and W is the weight of the tested sample (g).
2.6. Degradation Testing in PBS Solution
The PLA fibers were immersed for five months in phosphate-buffered saline (PBS, pH 7.2) solution at 37 °C. At the end of this period, the samples were rinsed three times with distilled water and dried at 35 °C. The degradation rate was calculated from the weight using Equation (5):
where W0 and W1 are the weights of the initial and degraded PLA fibers, respectively.
The degraded PLA fibers were tensile-tested and examined by SEM as described in Section 2.3 and Section 2.4.
3. Results and Discussion
3.1. Tensile Testing
3.1.1. Plasma-Treated PLA Fibers
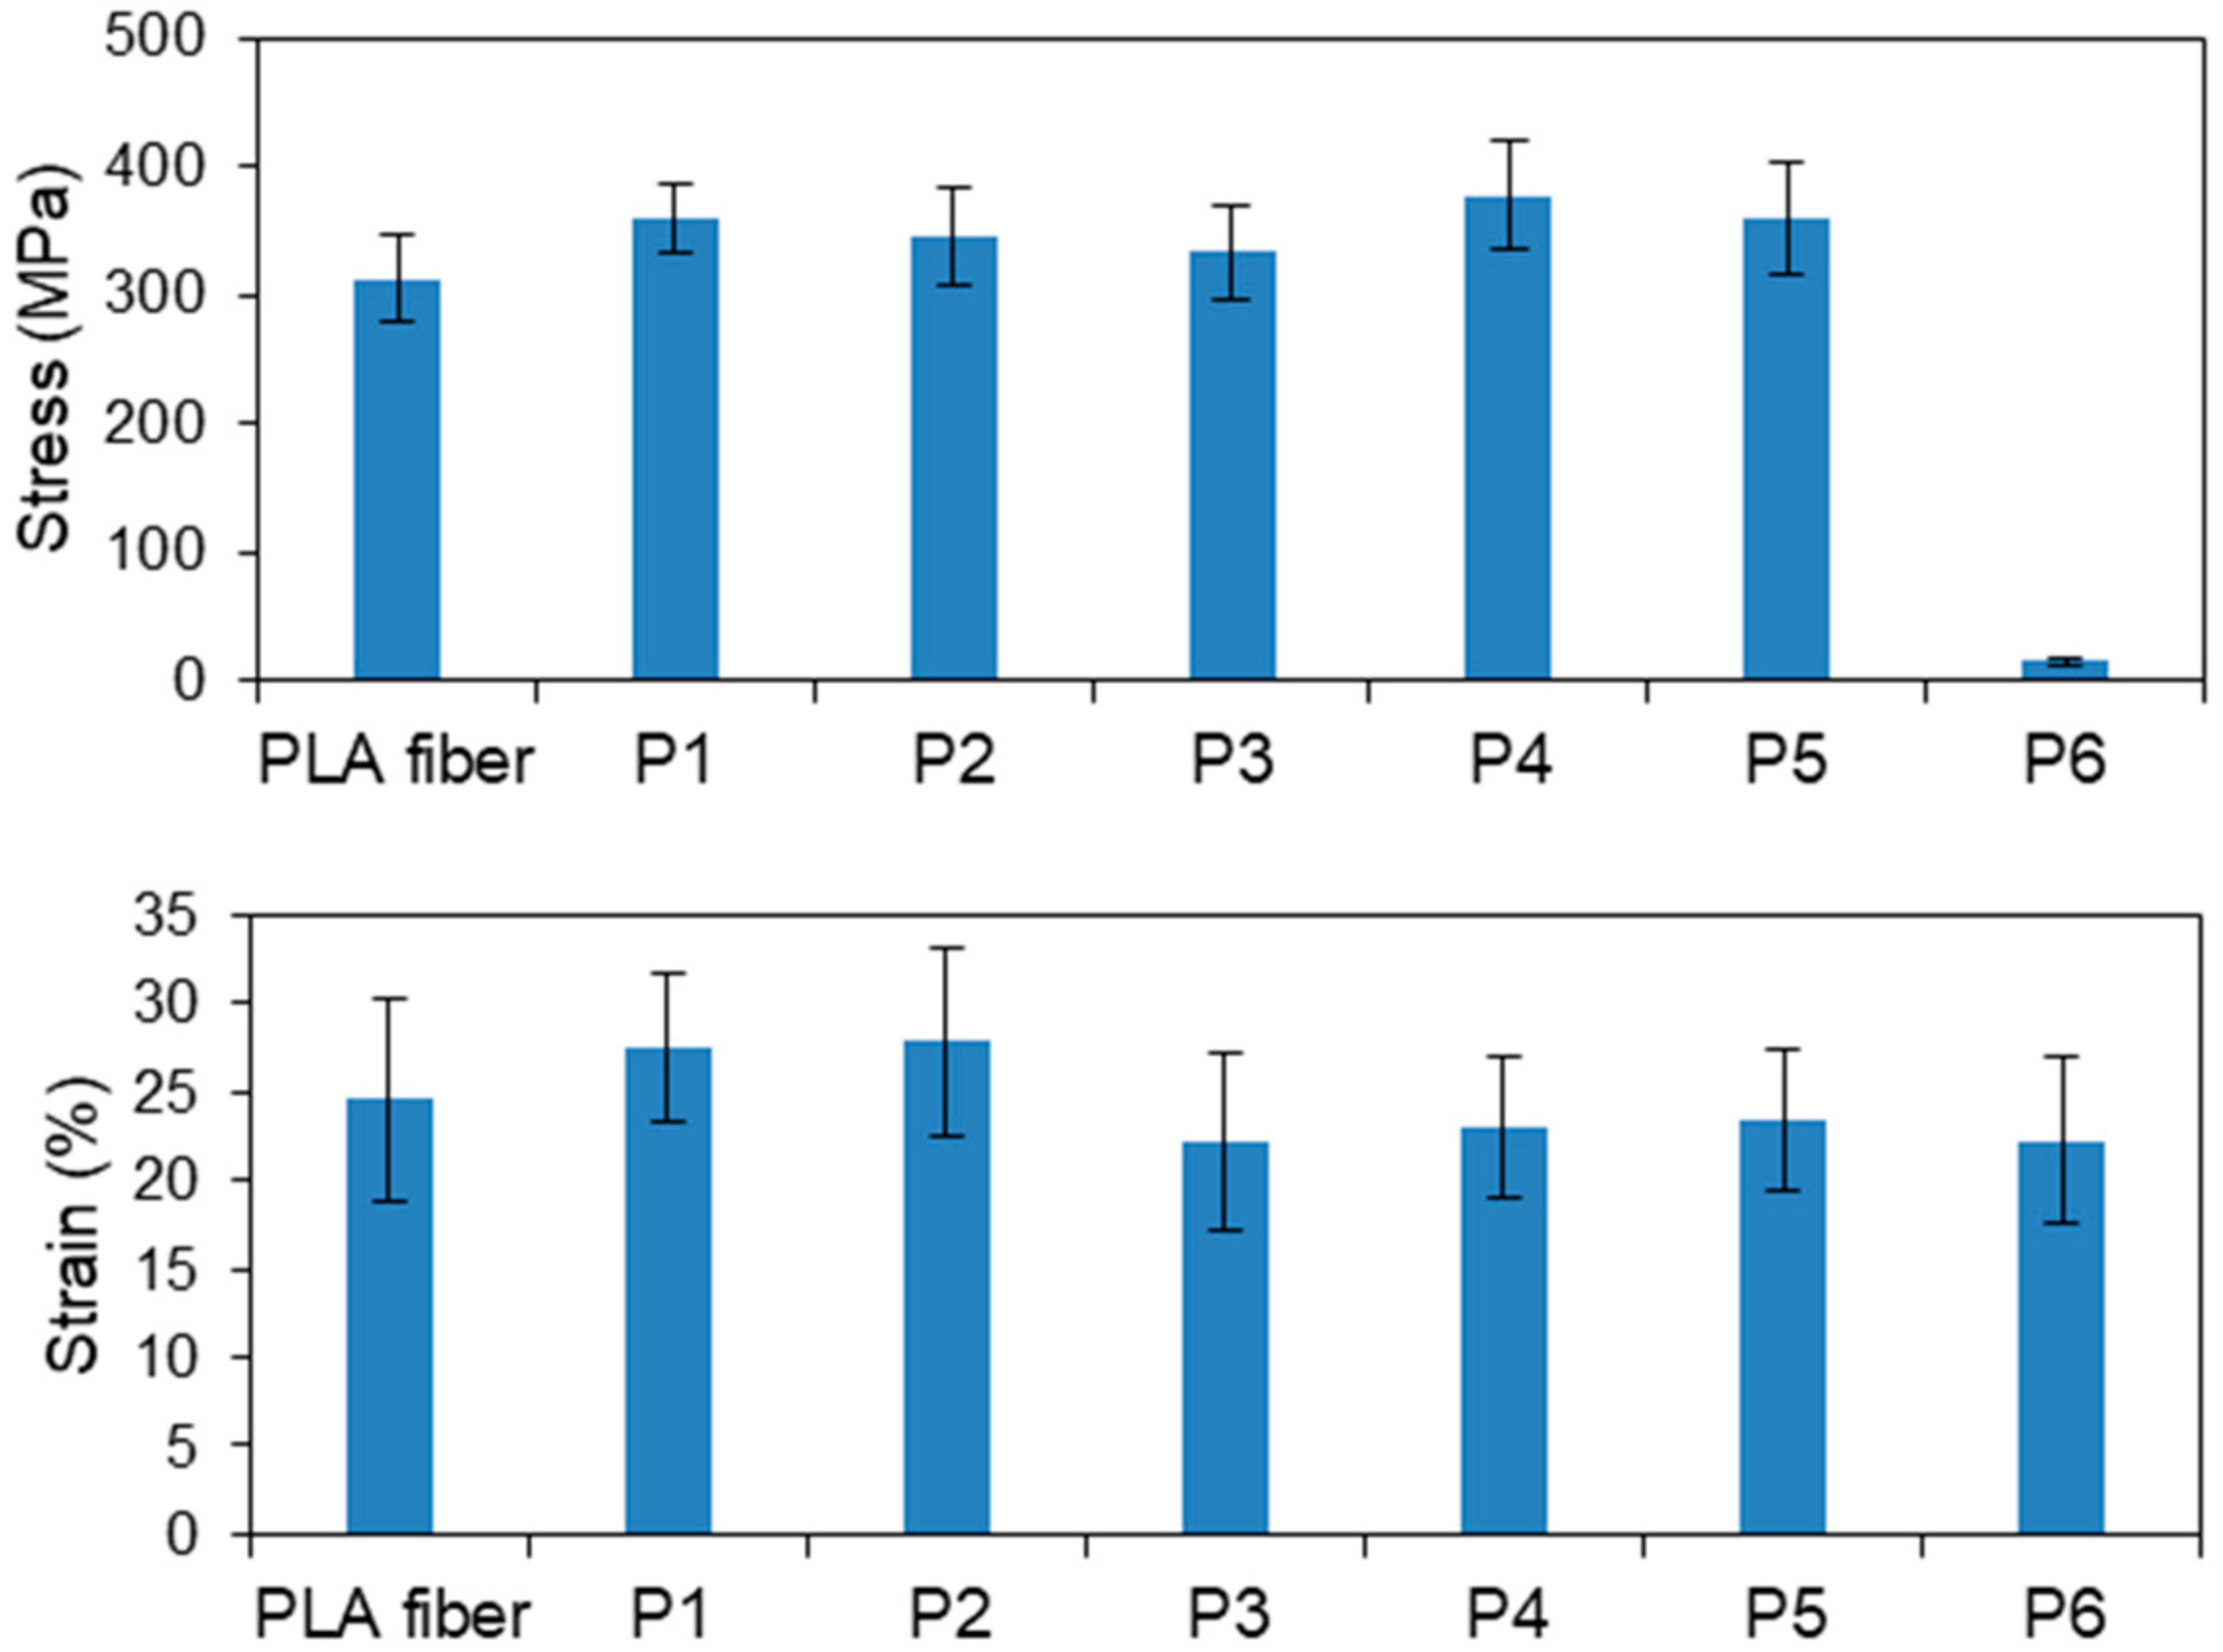
Figure 2 displays the tensile stresses and strains of the various plasma-treated PLA fibers. The average tensile stresses of samples P1–P6 were 359, 345, 334, 378, 359 and 15.7 MPa, respectively. Other than P6, the tensile stresses of the samples were slightly higher than that (312 MPa) of the original PLA fiber; however, the differences were not significant. Fibers treated for longer times exhibited decreased tensile strengths. In particular, the tensile strength of P6 was extremely low, with a stress of about 15.7 MPa, which is ascribable to the observation that P6 melted when exposed to the heat produced during high-power plasma treatment for long times; clearly, PLA is damaged by long plasma treatments. The average strain of each sample was almost identical to that of the original (untreated) fiber. However, P3–P6 showed lower values than P1 and P2, because PLA fibers got damaged under treatment with a high power of 200 W or a long time of 30 min. These results reveal that the strengths and strains of the PLA fibers are not affected by plasma treatment under the appropriate conditions, namely, treatment at low power for short times.
3.1.2. CS-Coated PLA Fibers Prepared by the LBL Method
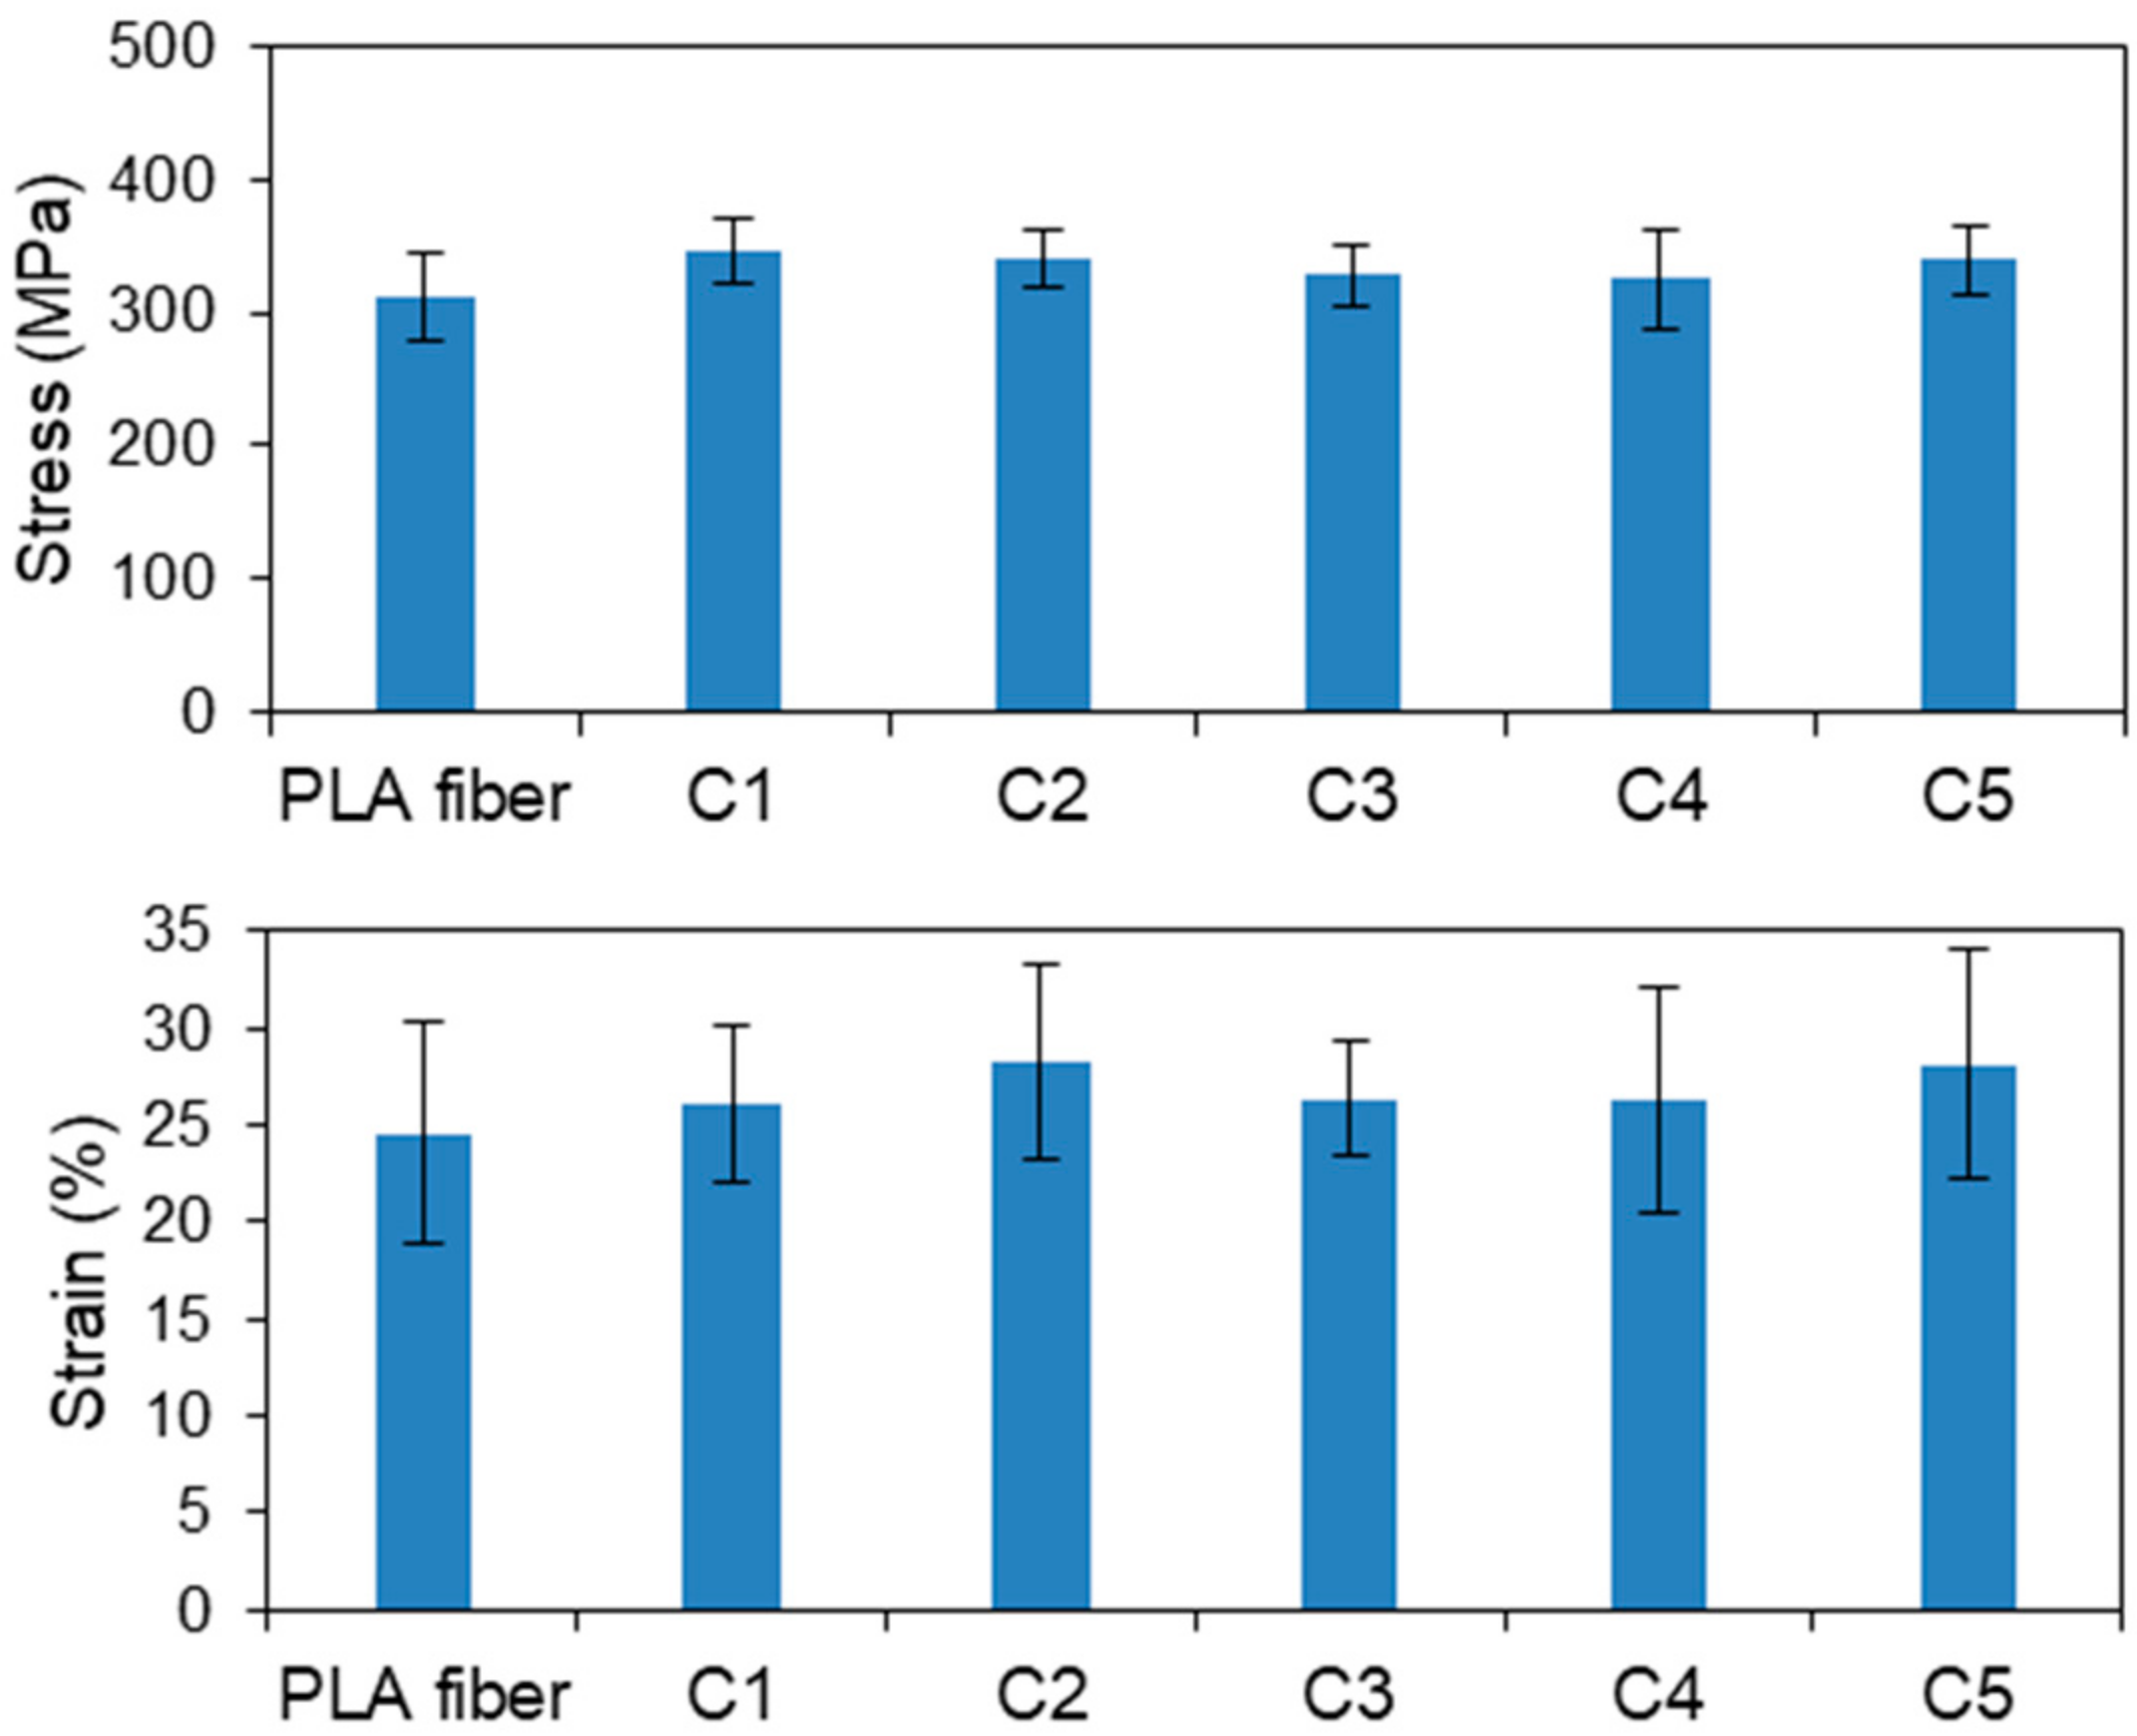
Figure 3 displays the tensile strengths and strains of the CS-coated PLA fibers based on P1, which were chosen based on the results presented in Section 3.1.1 and Section 3.2.1 (see below). The average tensile strengths of samples C1–C5 were 346, 341, 328, 325, and 341 MPa, respectively, with C1 exhibiting the same tensile strength and strain as the original PLA fiber. The tensile strengths and strains of C2–C5 were almost identical to that of the original fiber, despite the different number of coating layers. Therefore, all samples prepared by the LBL method have equivalent flexibility comparable with that of the original PLA fiber, which confirms that the LBL method neither damages the PLA fibers nor does it adversely affect their mechanical properties.
3.2. Surface Characterization
3.2.1. Plasma-Treated PLA Fibers
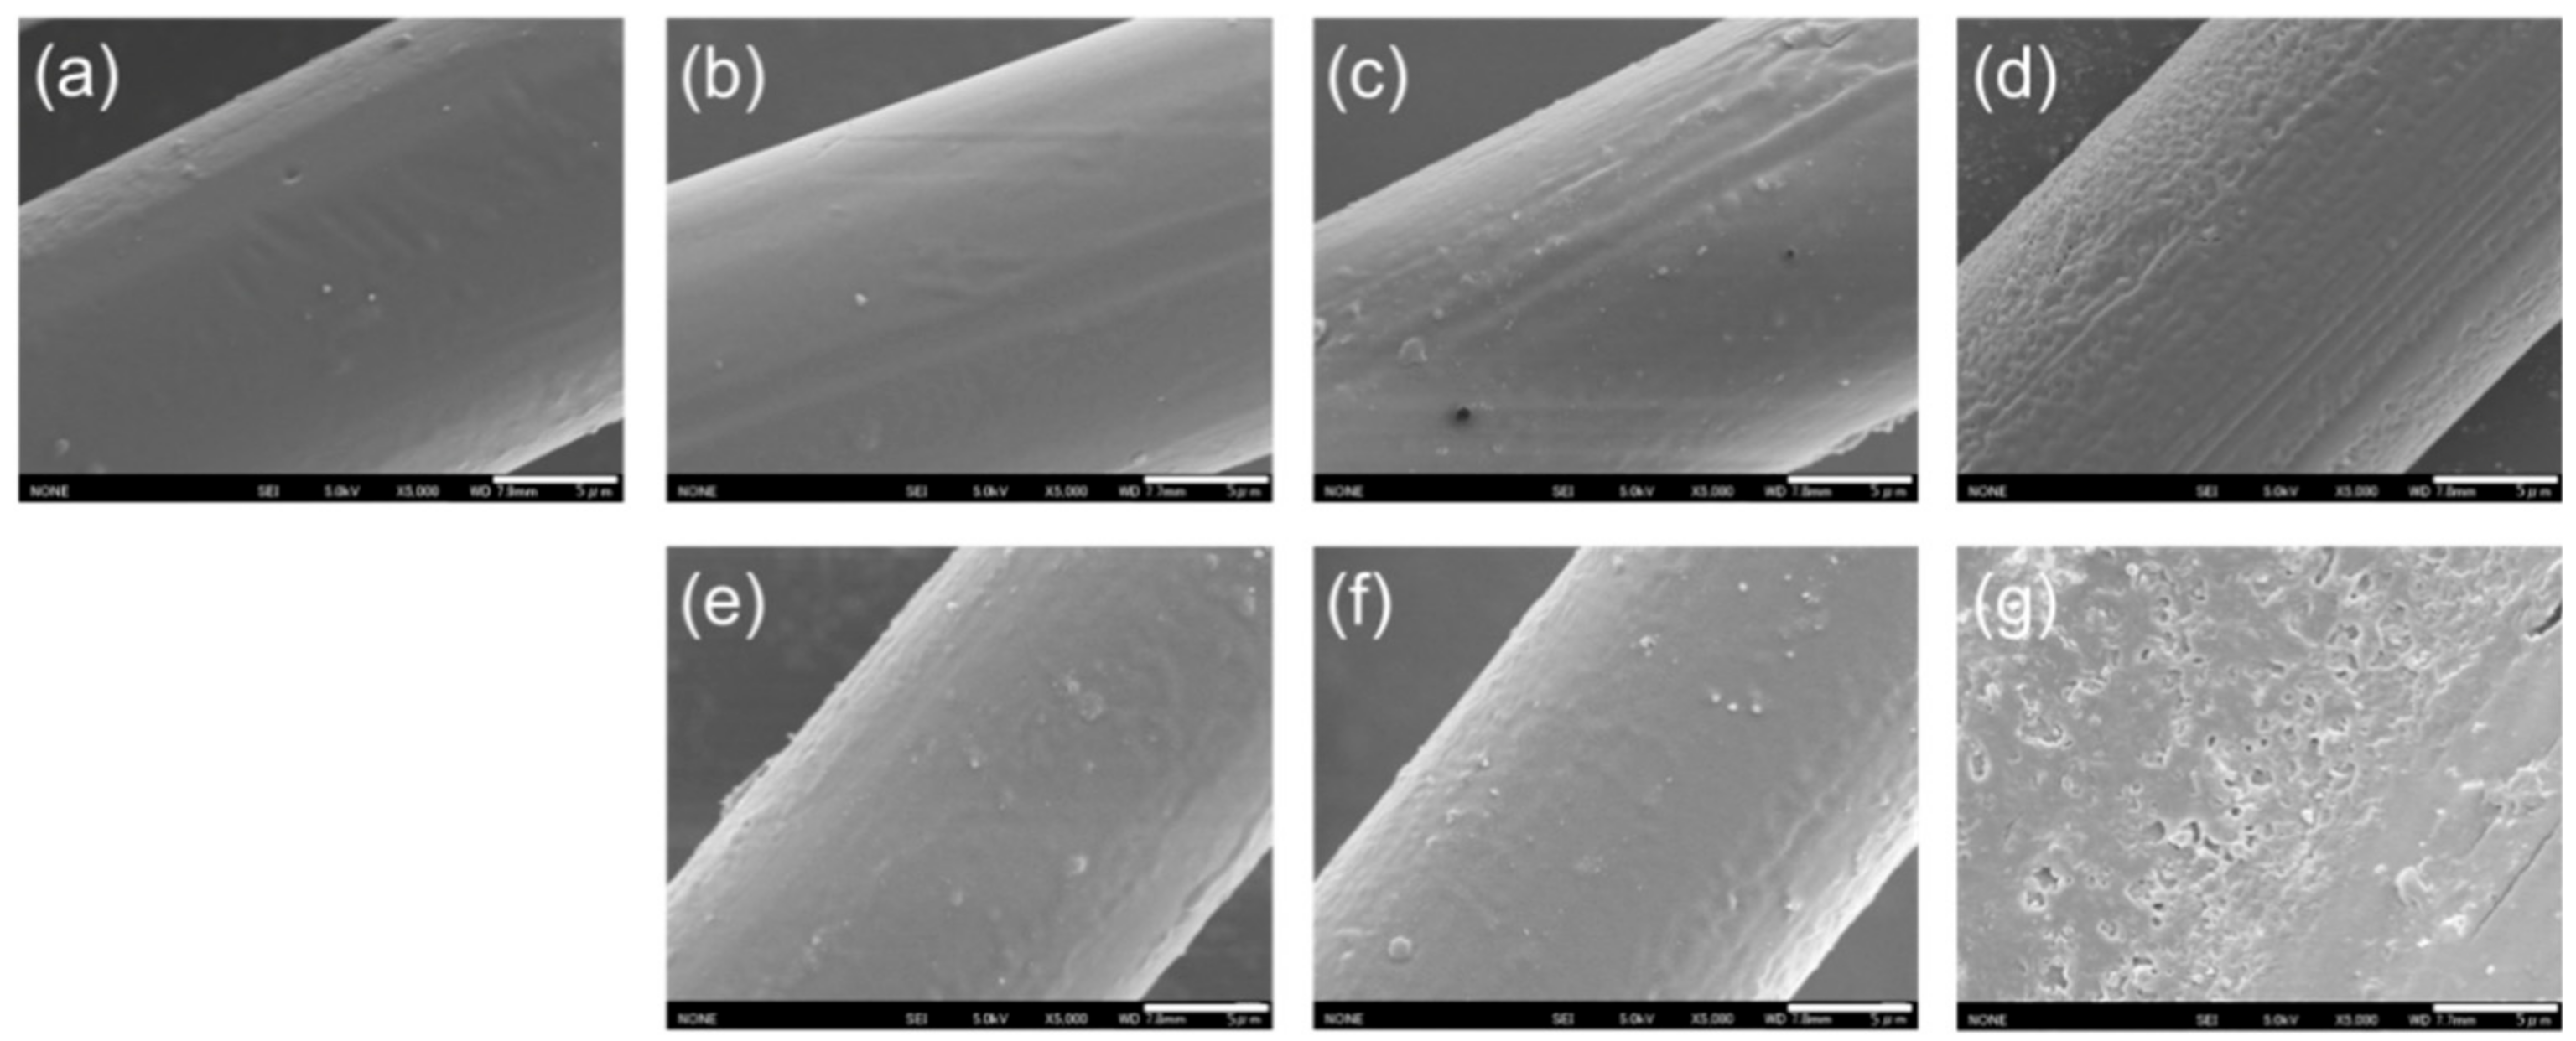
SEM images of the plasma-treated PLA fibers (P1–P6) are displayed in Figure 4. P1 exhibited a smooth surface similar to that of the original PLA fiber. The surfaces of the PLA fibers plasma-treated for longer times were increasingly rough compared with that of P1, especially P6. The fiber diameters of the P1–P5 samples were about 19 µm, while that of P6 was about 74 µm, a result of its partial melting during plasma treatment, as previously discussed; this change in diameter resulted in a decrease in tensile strength. We confirmed that the surfaces of the PLA fibers were damaged by plasma treatment at high power for long times. Wan et al. [31] reported a similar behavior, in that the modifying depth on PLA increased with increasing plasma treatment time. In addition, Ding et al. [12] reported that the amount of coated-CS on PLA by plasma treatment did not change even for treatment durations exceeding 1 min. Consequently, the plasma treatment conditions used to prepare the P1 fibers were determined to be optimum for their further coating with CS; thus, all CS-coated PLA fibers were prepared from P1.
3.2.2. CS-Coated PLA Fibers Prepared by the LBL Method
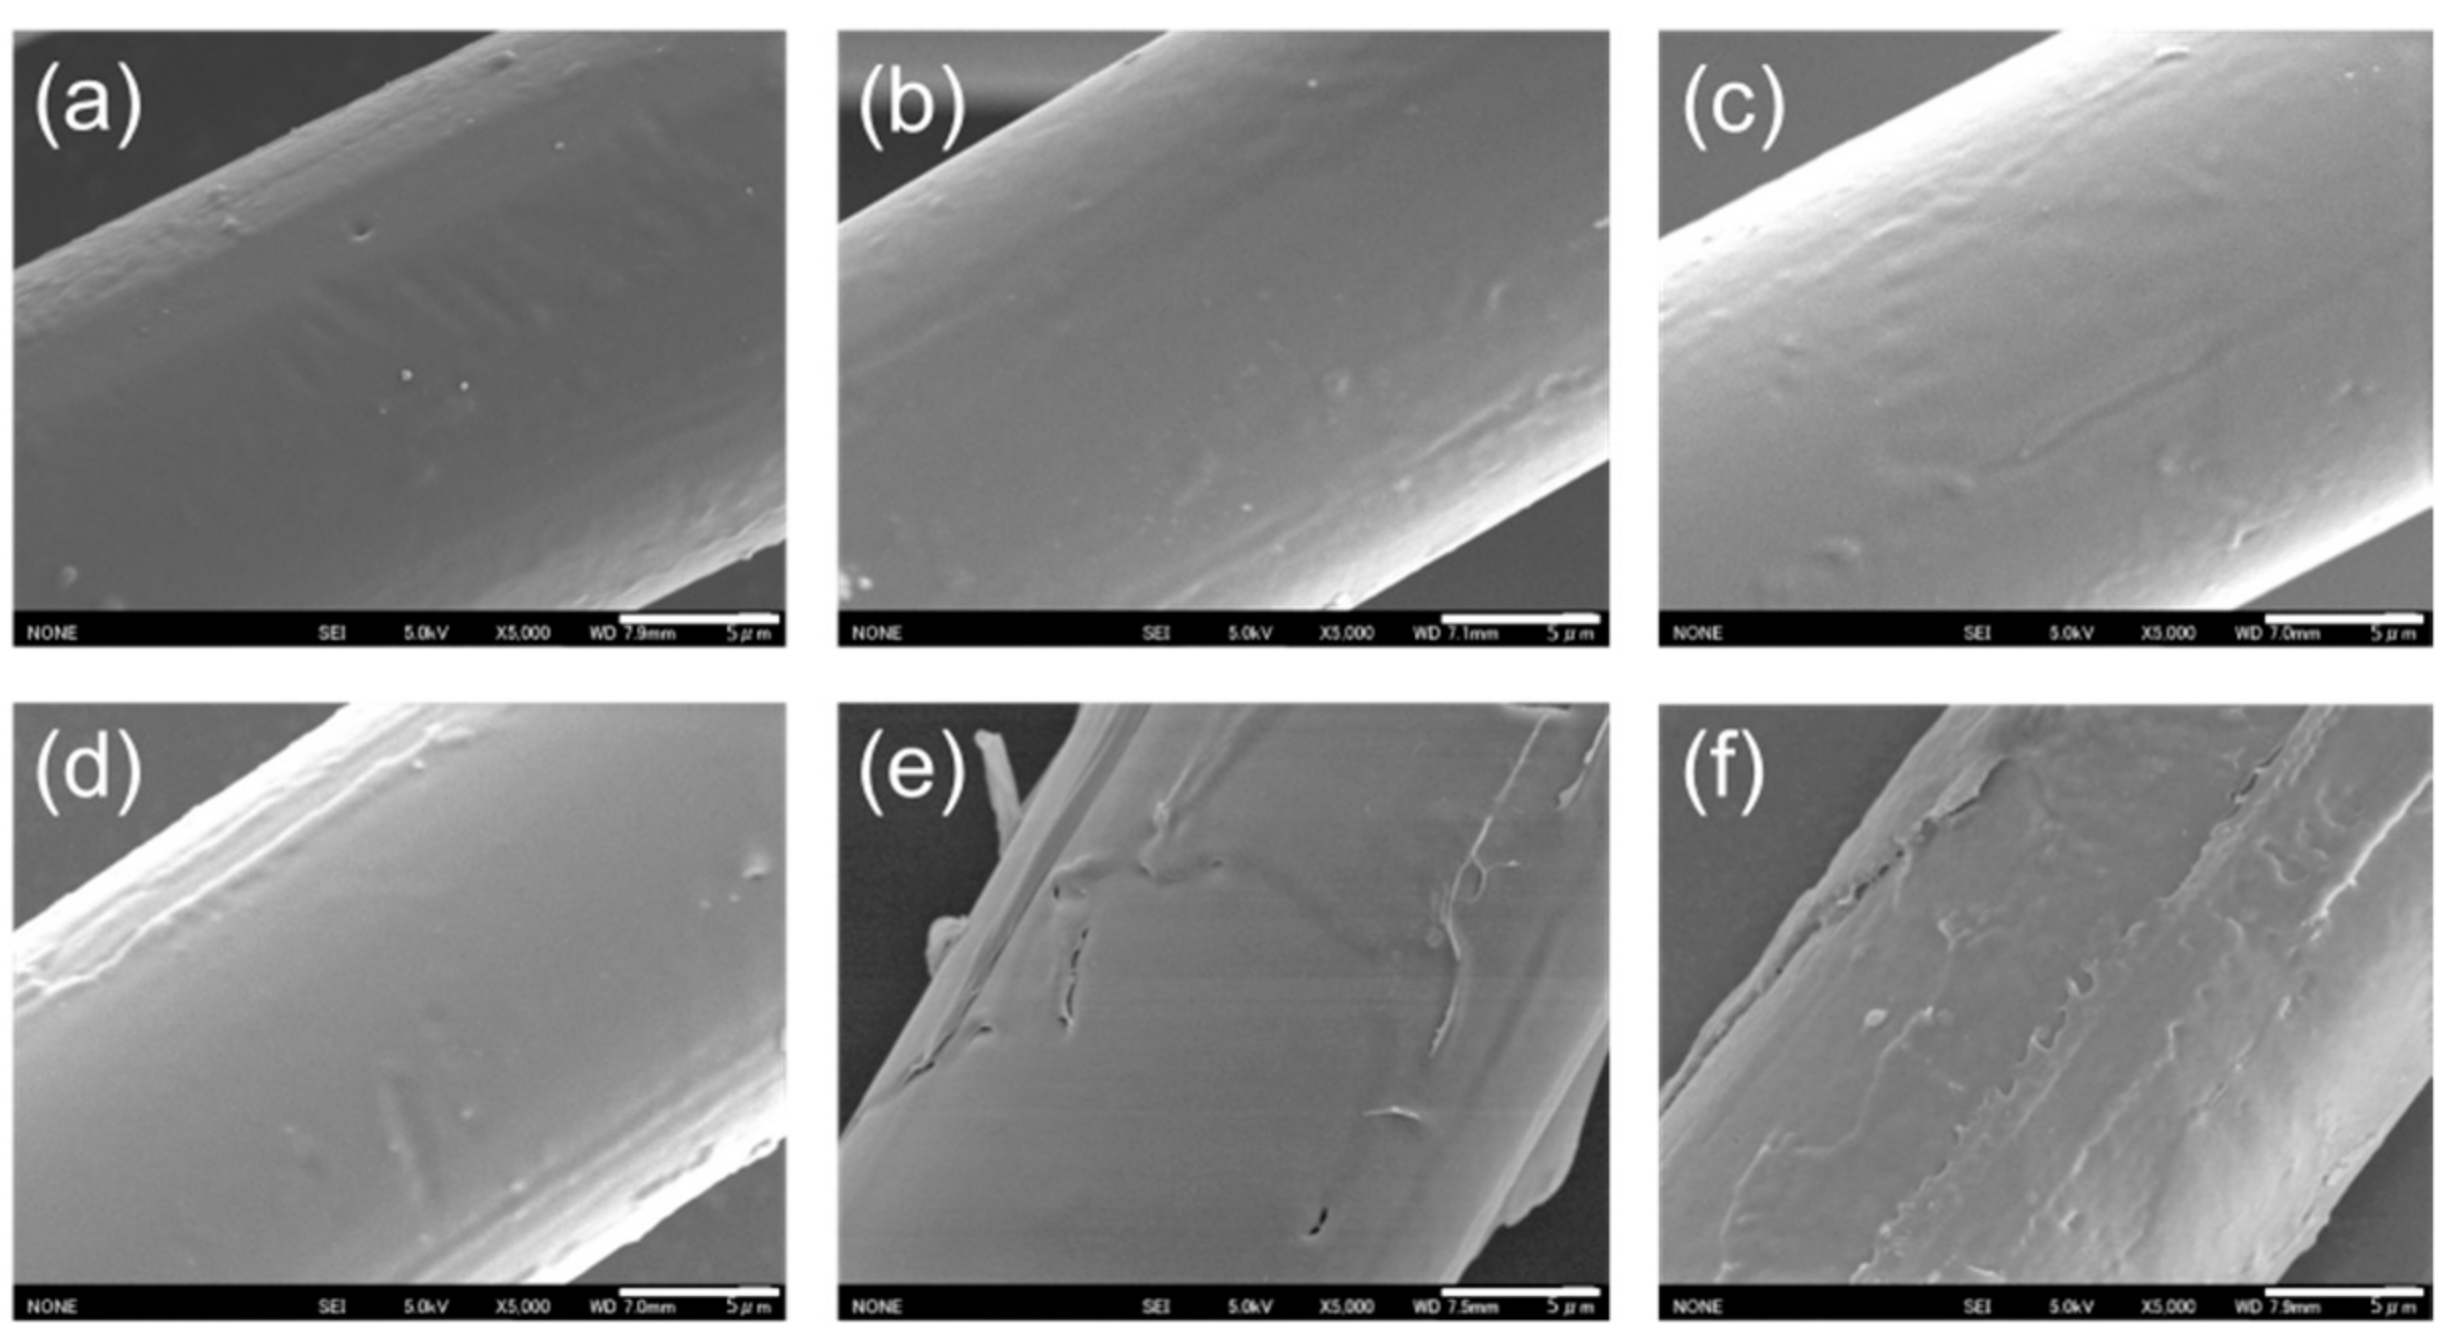
SEM images of the CS-coated PLA fibers are displayed in Figure 5. C1 exhibited a smooth surface similar to that of the original (untreated) PLA fiber. The surfaces of the remaining fibers became increasingly rough with increasing numbers of coating layers, especially C4 and C5. However, the CS-coated fibers were confirmed to be uniformly coated with CS, as determined by the attachment of each fiber, the presence of CS, and partial CS coatings on the PLA surfaces. In addition, the diameters of the fibers were unchanged following CS coating, despite the PLA surfaces being coated with 30 layers of CS and SA in the case of C5, which confirms that the CS and SA layers are very thin and uniform.
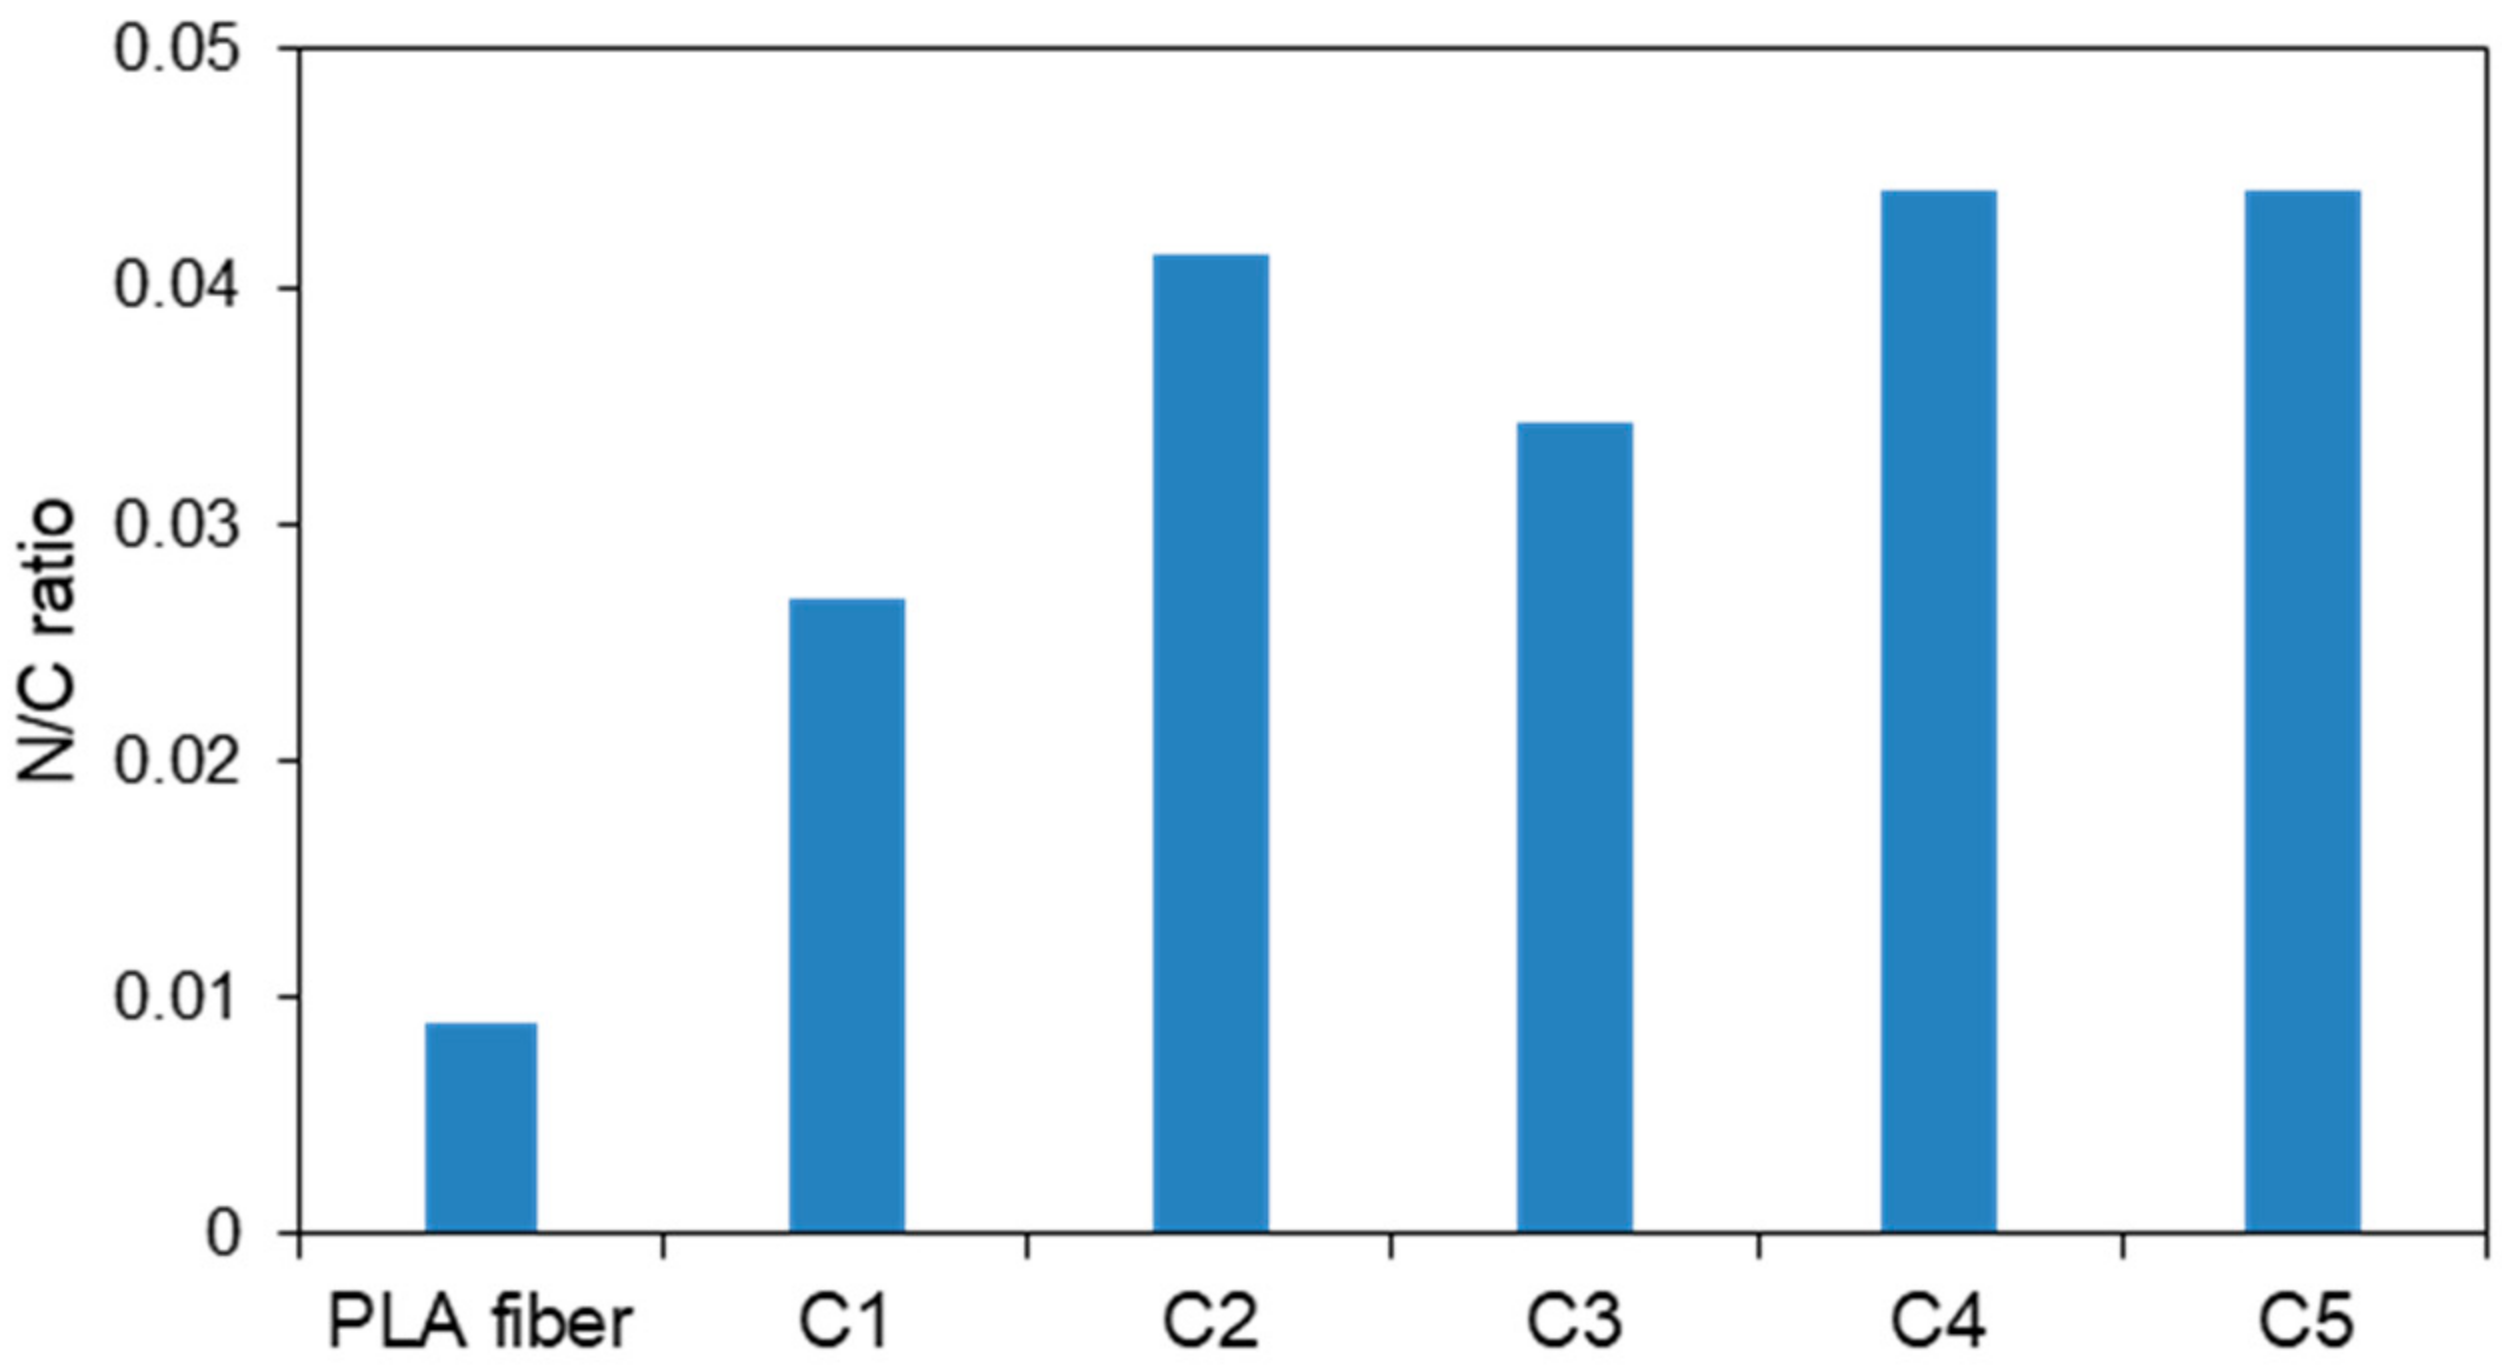
The nitrogen-to-carbon (N/C) ratios of the CS-coated PLA fibers were determined by XPS, the results of which are displayed in Figure 6. The amount of CS coating on the PLA surface was determined by measuring the nitrogen and carbon contents, as amide groups are present only in the structure of CS and not in the PLA. The nitrogen content of the original PLA fiber was also determined because a plasticizer is usually added during the preparation of PLA. However, the plasticizer content does not influence other data because the PLA surface was determined to have an N/C ratio of only 0.005 and is covered by the CS layer. The C1 sample exhibited a higher N/C ratio compared to that of the original PLA fiber. While the N/C ratios were higher in C2–C5 than C1, these samples all exhibited similar N/C ratios. This observation reveals that the LBL method produces homogeneous CS coatings, since XPS examines the top surface and the C2 sample already contains a homogeneous CS layer. These results suggest that plasma treatment and the LBL method effectively coat the PLA fibers with CS.
3.3. Nitrogen Analysis
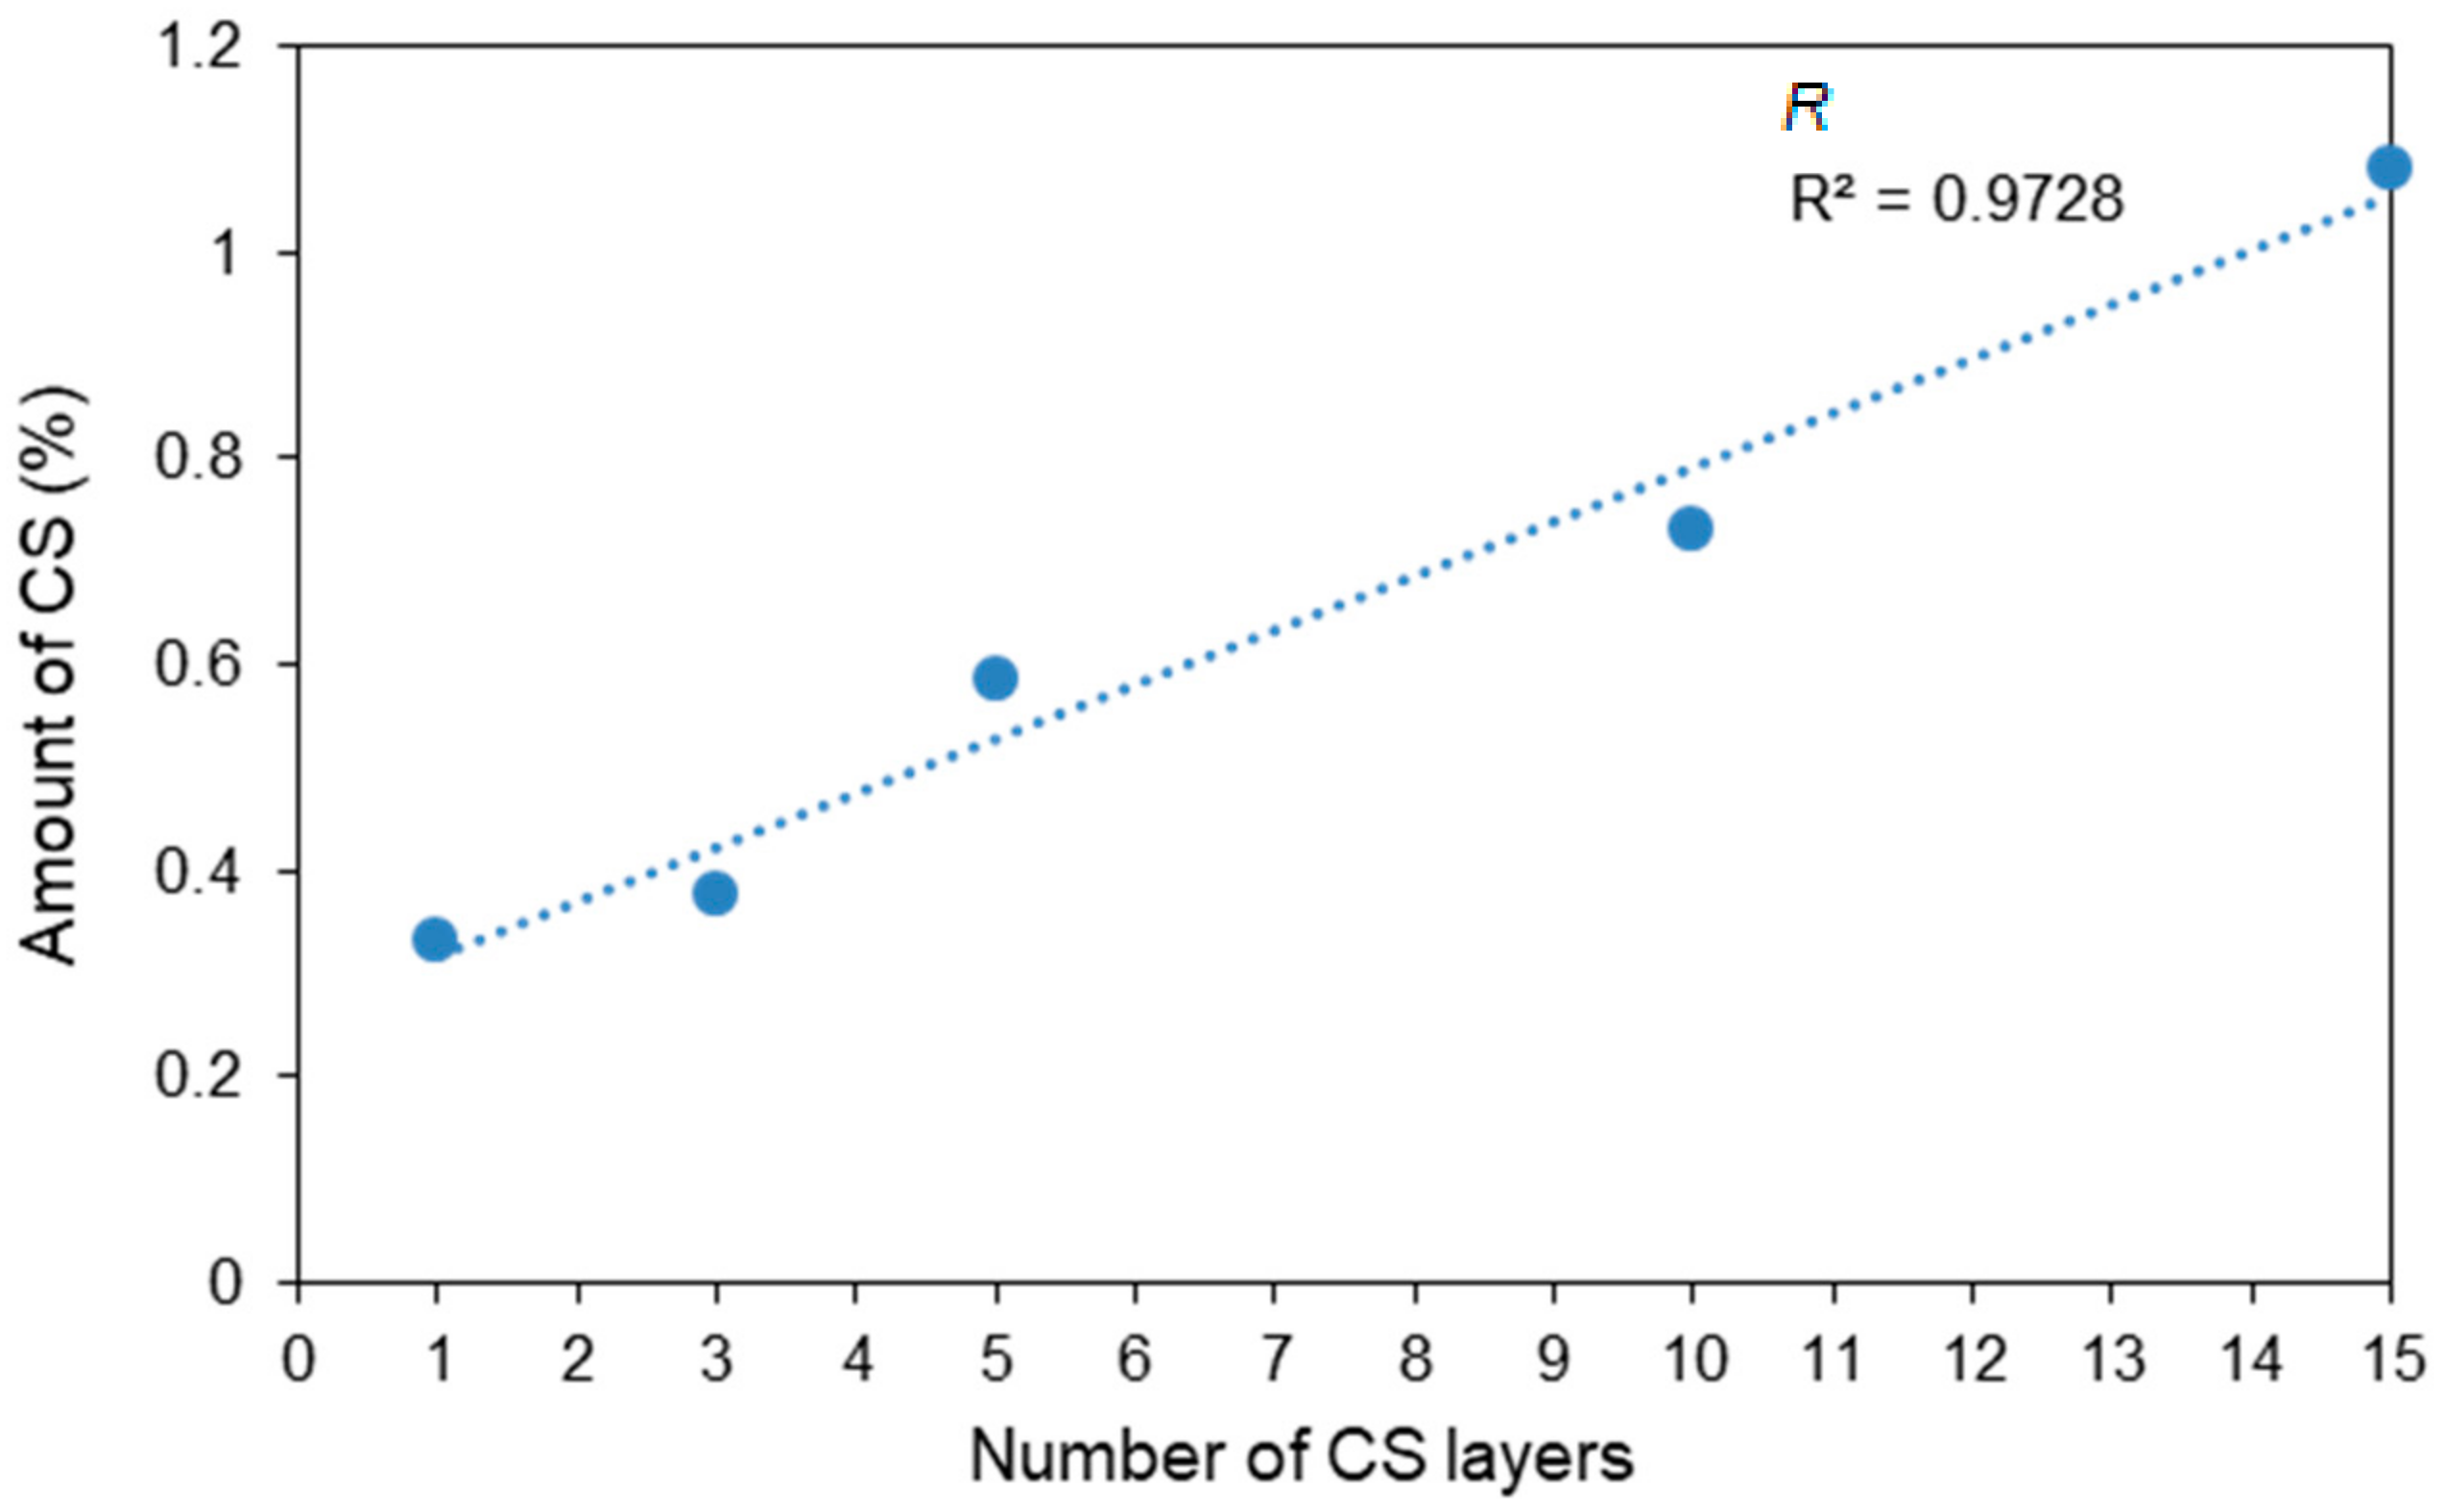
Figure 7 shows the CS percentages calculated from the amount of nitrogen determined by the Kjeldahl method. Since the original PLA fiber contains nitrogen, the CS amounts of the CS-coated PLA fibers were calculated after the subtraction of this nitrogen content, and were determined to be 0.33%, 0.38%, 0.58%, 0.73%, and 1.08% for C1–C5, respectively. C1, with only one CS layer, displayed a larger step in CS content than those of the other samples because C1 was formed by direct CS coating on the plasma-treated PLA surface. These results suggest that plasma treatment facilitates the efficient coating of the PLA surface by CS. The amount of CS was observed to increase proportionately with the number of CS-coating layers; this also agrees with similar results for CS/Alginate multilayer films obtained by Gabriela et al. [32]. In addition, C5 contained over 1.0 wt% CS.
Table 2 lists the thicknesses of the CS layers calculated from the Kjeldahl-determined data. The coating thicknesses of C1–C5 were found to be 31.5, 35.9, 55.8, 69.7 and 103.7 nm, respectively. Clearly, the CS and SA layers are very thin and uniform, and do not affect the tensile properties of the fibers; all samples exhibit similar morphologies by SEM. These results confirm that the LBL method improves the amount of CS on the fibers.
3.4. Degradation Testing
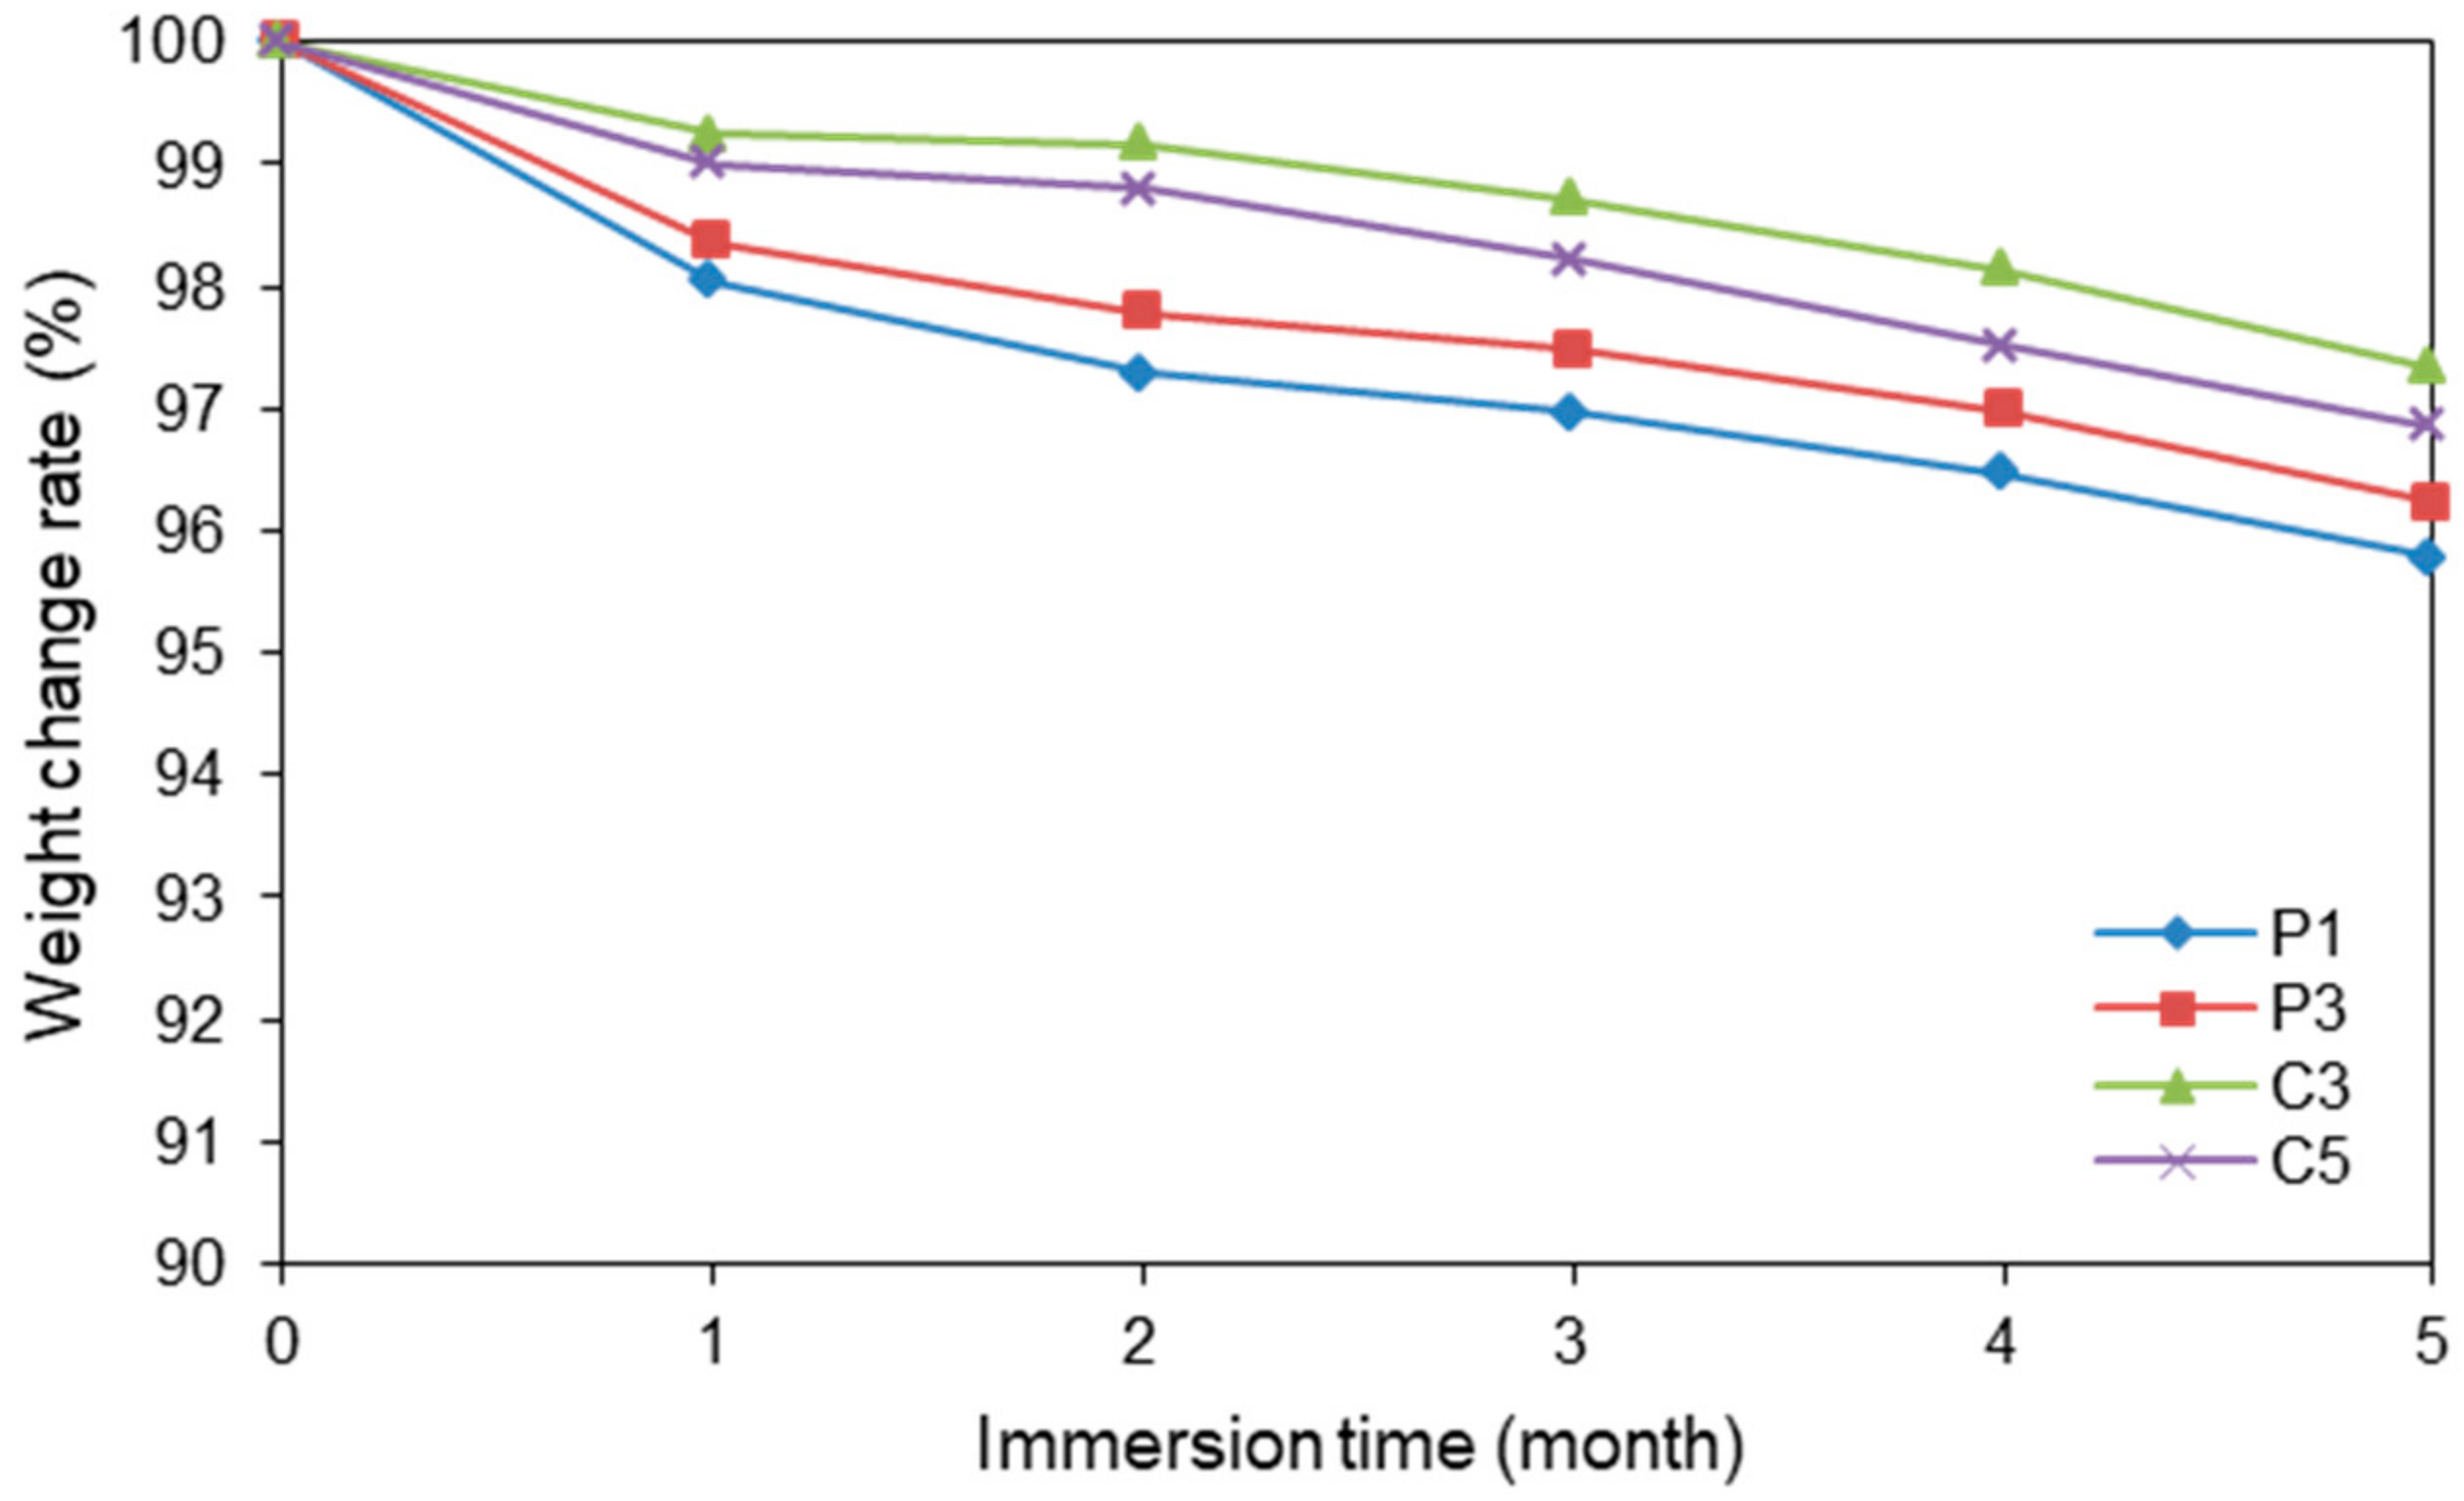
Figure 8, Figure 9 and Figure 10 display the rates of weight change, SEM images, and tensile strengths, respectively, of P1, P3, C3, and C5. Figure 8 and Figure 9 reveal that all degraded samples exhibited at least 95% of their original weights and retained their shapes after five months of immersion in PBS solution. The observed decreases in weight indicate that the PLA samples become hydrolyzed in PBS over time. No samples could be retrieved from the PBS solution when immersed for longer than six months because the PLA fibers had collapsed by hydrolysis. The CS-coated fibers appeared to be slightly more stable than the uncoated plasma-treated fibers, because the polyelectrolyte layers of CS and SA had low solubility. However, the difference in stability was not significant; thus, it was concluded that the degradability of the fiber coated with CS and SA was maintained.
The SEM images reveal that the PLA surfaces, as well as the fiber diameters, changed little after six months of immersion in PBS solution. We suggest that the observed weight losses are due to internal fiber hydrolysis. The tensile strengths of the degraded samples at three and four months were 90% and 80% of those of the original PLA fiber, respectively. The rates of weight change of the samples decreased enormously over five months, and the samples degraded for six months were too weak to subject to tensile testing; however, their surface morphologies did not change as extensively as their tensile properties. We suggest that the PLA molecules reduce their molecular weights by hydrolysis. Moreover, the degradation behavior of all samples was similar. The existence or not of a coating on the PLA fiber did not appear to influence the degradation of the fiber, which is ascribable to the extremely thin coating, as evidenced by nitrogen analysis and SEM. These results confirm that these PLA fibers are resistant to PBS for four months and degrade over long times.
4. Conclusions
Novel CS-coated PLA fibers were prepared by plasma treatment and the LBL method. SEM, tensile testing, and XPS reveal that plasma treatment facilitates the damage-free and effective coating of PLA with CS. In particular, PLA fibers treated with plasma at 100 W for 60 s exhibit almost identical properties to those of the original PLA fibers. Nitrogen analysis revealed that the LBL method effectively increased the amount of coated CS; moreover, the mechanical strengths of the obtained fibers were maintained following coating with CS. These PLA fibers were resistant to PBS for four months during degradation testing. In addition, these samples exhibited similar degradation behavior; PLA hydrolysis was unaffected by the presence or absence of the extremely thin ionic polymer. The presence of CS on PLA fiber is expected to improve the surface property of the fiber, owing to the antibacterial and wound-healing abilities of CS. Therefore, these CS-coated PLA fibers are suitable for use in biomaterials applications as suture threads.
Author Contributions
T.F. and H.T. designed experiments. D.K. and R.I. performed the experiments. D.K. wrote the manuscript.
Acknowledgments
This work was financially supported by Private University Research Branding Project, MEXT, 2016–2020 and in part by the Kansai University Outlay Support for Establishing Research Centers, 2016−2017. “Development and application of biocompatible polymer materials having sol-gel transition”.
Conflicts of Interest
The authors declare no conflict of interest.
References
- Tomita, K.; Kuroki, Y.; Nagai, K. Isolation of thermophiles degrading poly(l-lactic acid). J. Biosci. Bioeng. 1999, 87, 752–755. [Google Scholar] [CrossRef]
- Ikada, Y.; Tsuji, H. Biodegradable polyesters for medical and ecological applications. Macromol. Rapid Commun. 2000, 21, 117–132. [Google Scholar] [CrossRef]
- Tsuji, H.; Ikada, Y. Blends of aliphatic polyesters. II. Hydrolysis of solution-cast blends from poly(l-lactide) and poly(ε-caprolactone) in phosphate-buffered solution. J. Appl. Polym. Sci. 1998, 67, 405–415. [Google Scholar] [CrossRef]
- Lunt, J. Large-scale production, properties and commercial applications of polylactic acid polymers. Polym. Degrad. Stabil. 1998, 59, 145–152. [Google Scholar] [CrossRef]
- Saravanan, M.; Domb, A.J. A contemporary review on—Polymer stereocomplexes and its biomedical application. Eur. J. Nanomed. 2013, 5, 81–96. [Google Scholar] [CrossRef]
- Jain, R.A. The manufacturing techniques of various drug loaded biodegradable poly(lactide-co-glycolide) (PLGA) devices. Biomaterials 2000, 21, 2475–2490. [Google Scholar] [CrossRef]
- Mikos, A.G.; Lyman, M.D.; Freed, L.E.; Langer, R. Wetting of poly(l-lactic acid) and poly(dl-lactic-co-glycolic acid) foams for tissue culture. Biomaterials 1994, 15, 55–58. [Google Scholar] [CrossRef]
- Nagahama, K.; Mori, Y.; Ohya, Y.; Ouchi, T. Biodegradable nanogel formation of polylactide-grafted dextran copolymer in dilute aqueous solution and enhancement of its stability by stereocomplexation. Biomacromolecules 2007, 8, 2135–2141. [Google Scholar] [CrossRef] [PubMed]
- Rasal, R.M.; Janorkar, A.V.; Hirt, D.E. Poly(lactic acid) modifications. Prog. Polym. Sci. 2010, 35, 338–356. [Google Scholar] [CrossRef]
- Furuike, T.; Nagahama, H.; Chaochai, T.; Tamura, H. Preparation and characterization of chitosan-coated poly(l-lactic acid) fibers and their braided rope. Fibers 2015, 3, 380–393. [Google Scholar] [CrossRef]
- Zhu, A.; Zhang, M.; Wu, J.; Shen, J. Covalent immobilization of chitosan/heparin complex with a photosensitive hetero-bifunctional crosslinking reagent on PLA surface. Biomaterials 2002, 23, 4657–4665. [Google Scholar] [CrossRef]
- Ding, Z.; Chen, J.; Gao, S.; Chang, J.; Zhang, J.; Kang, E.T. Immobilization of chitosan onto poly-L-lactic acid film surface by plasma graft polymerization to control the morphology of fibroblast and liver cells. Biomaterials 2004, 25, 1059–1067. [Google Scholar] [CrossRef]
- Tsuji, H.; Ishida, T. Poly(l-lactide). X. Enhanced surface hydrophilicity and chain-scission mechanisms of poly(l-lactide) film in enzymatic, alkali, and phosphate-buffered solutions. J. Appl. Polym. Sci. 2003, 87, 1628–1633. [Google Scholar] [CrossRef]
- Park, G.E.; Pattison, M.A.; Park, K.; Webster, T.J. Accelerated chondrocyte functions on NaOH-treated PLGA scaffolds. Biomaterials 2005, 26, 3075–3082. [Google Scholar] [CrossRef] [PubMed]
- Nagahama, H.; Nwe, N.; Jayakumar, R.; Koiwa, S.; Furuike, T.; Tamura, H. Novel biodegradable chitin membranes for tissue engineering applications. Carbohyd. Polym. 2008, 73, 295–302. [Google Scholar] [CrossRef]
- Tamura, H.; Nagahama, H.; Tokura, S. Preparation of chitin hydrogel under mild conditions. Cellulose 2006, 13, 357–364. [Google Scholar] [CrossRef]
- Jayakumar, R.; Menon, D.; Manzoor, K.; Nair, S.V.; Tamura, H. Biomedical applications of chitin and chitosan based nanomaterials—A short Review. Carbohyd. Polym. 2010, 82, 227–232. [Google Scholar] [CrossRef]
- Anitha, A.; Rani, V.V.D.; Krishna, R.; Sreeja, V.; Selvamurugan, N.; Nair, S.V.; Tamura, H.; Jayakumar, R. Synthesis, characterization, cytotoxicity and antibacterial studies of chitosan, O-carboxymethyl and N,O-carboxymethyl chitosan nanoparticles. Carbohyd. Polym. 2009, 78, 672–677. [Google Scholar] [CrossRef]
- Carvalho, C.R.; López-Cebral, R.; Silva-Correia, J.; Silva, J.M.; Mano, J.F.; Silva, T.H.; Freier, T.; Reis, R.L.; Oliveira, J.M. Investigation of cell adhesion in chitosan membranes for peripheral nerve regeneration. Mater. Sci. Eng. C 2017, 71, 1122–1134. [Google Scholar] [CrossRef] [PubMed]
- Dodane, V.; Vilivalam, V.D. Pharmaceutical applications of chitosan. Pharm. Sci. Technol. Today 1998, 1, 246–253. [Google Scholar] [CrossRef]
- Jayakumar, R.; Prabaharan, M.; Kumar, P.T.S.; Nair, S.V.; Tamura, H. Biomaterials based on chitin and chitosan in wound dressing applications. Biotechnol. Adv. 2011, 29, 322–337. [Google Scholar] [CrossRef] [PubMed]
- Chen, Y.; Javvaji, V.; MacIntire, I.C.; Raghavan, S.R. Gelation of vesicles and nanoparticles using water-soluble hydrophobically modified chitosan. Langmuir 2013, 29, 15302–15308. [Google Scholar] [CrossRef] [PubMed]
- Davis, T.A.; Llanes, F.; Volesky, B.; Diaz-Pulido, G.; McCook, L.; Mucci, A. 1H–NMR study of Na alginates extracted from sargassum spp. in relation to metal biosorption. Appl. Biochem. Biotech. 2003, 110, 75–90. [Google Scholar] [CrossRef]
- Gomez, C.G.; Lambrecht, M.V.P.; Lozano, J.E.; Rinaudo, M.; Villar, M.A. Influence of the extraction-purification conditions on final properties of alginates obtained from brown algae (Macrocystis pyrifera). Int. J. Biol. Macromol. 2009, 44, 365–371. [Google Scholar] [CrossRef] [PubMed]
- Tamura, H.; Tsuruta, Y.; Tokura, S. Preparation of chitosan-coated alginate filament. Mater. Sci. Eng. C 2002, 20, 143–147. [Google Scholar] [CrossRef]
- Lee, K.Y.; Mooney, D.J. Alginate: Properties and biomedical applications. Prog. Polym. Sci. 2012, 37, 106–126. [Google Scholar] [CrossRef] [PubMed] [Green Version]
- Zhang, M.; Lin, H.; Shen, L.; Liao, B.-Q.; Wu, X.; Li, R. Effect of calcium ions on fouling properties of alginate solution and its mechanisms. J. Membr. Sci. 2017, 525, 320–329. [Google Scholar] [CrossRef]
- Ariga, K.; Hill, J.P.; Ji, Q. Layer-by-layer assembly as a versatile bottom-up nanofabrication technique for exploratory research and realistic application. Phys. Chem. Chem. Phys. 2007, 9, 2319–2340. [Google Scholar] [CrossRef] [PubMed]
- Antipov, A.A.; Sukhorukov, G.B.; Donath, E.; Mohwald, H. Sustained release properties of polyelectrolyte multilayer capsules. J. Phys. Chem. B 2001, 105, 2281–2284. [Google Scholar] [CrossRef]
- Kyung, W.K.-H.; Kim, S.-H.; Siratori, S. Preparation and characterization of antithrombogenic chitosan/alginate films with enhanced physical stability by cross-linking using layer-bylayer. MATEC Web Conf. 2013, 4, 05008. [Google Scholar] [CrossRef]
- Wan, Y.; Tu, C.; Yang, J.; Bei, J.; Wang, S. Influences of ammonia plasma treatment on modifying depth and degradation of poly(l-lactide) scaffolds. Biomaterials 2006, 27, 2699–2704. [Google Scholar] [CrossRef] [PubMed]
- Martins, G.V.; Merino, E.G.; Mano, J.F.; Alves, N.M. Crosslink Effect and Albumin Adsorption onto Chitosan/Alginate Multilayered Systems: An in situ QCM-D Study. Macromol. Biosci. 2010, 10, 1444–1455. [Google Scholar] [CrossRef] [PubMed]
Figure 1.
The LBL method used to CS-coat the PLA fibers.

Figure 2.
Tensile stresses and strains of the plasma-treated PLA fibers.

Figure 3.
Tensile stresses and strains of the CS-coated PLA fibers based on P1.

Figure 4.
SEM images of plasma-treated PLA fibers: (a) untreated PLA fiber; (b) P1; (c) P2; (d) P3; (e) P4; (f) P5; and (g) P6 (magnification: 5000×, scale bar: 5 µm).
Figure 4.
SEM images of plasma-treated PLA fibers: (a) untreated PLA fiber; (b) P1; (c) P2; (d) P3; (e) P4; (f) P5; and (g) P6 (magnification: 5000×, scale bar: 5 µm).

Figure 5.
SEM images of CS-coated PLA fibers: (a) untreated PLA fiber; (b) C1; (c) C2; (d) C3; (e) C4; and (f) C5 (magnification: 5000×, scale bar: 5 µm).
Figure 5.
SEM images of CS-coated PLA fibers: (a) untreated PLA fiber; (b) C1; (c) C2; (d) C3; (e) C4; and (f) C5 (magnification: 5000×, scale bar: 5 µm).

Figure 6.
Nitrogen-to-carbon (N/C) ratios of the CS-coated PLA fibers determined by XPS.

Figure 7.
Amount of CS, calculated from the Kjeldahl-determined amount of nitrogen, as a function of the number of CS layers.
Figure 7.
Amount of CS, calculated from the Kjeldahl-determined amount of nitrogen, as a function of the number of CS layers.

Figure 8.
Rates of weight change of various fibers in PBS.

Figure 9.
SEM images of PLA fibers: (a) P1; (b) P3; (c) C3; and (d) C5 before degradation testing; and (e) P1; (f) P3; (g) C3; and (h) C5 after six months in PBS (magnification: 5000×, scale bar: 5 µm).
Figure 9.
SEM images of PLA fibers: (a) P1; (b) P3; (c) C3; and (d) C5 before degradation testing; and (e) P1; (f) P3; (g) C3; and (h) C5 after six months in PBS (magnification: 5000×, scale bar: 5 µm).

Figure 10.
Tensile properties of the degraded samples.


Table 1.
Conditions used for the plasma treatment condition of PLA fibers.
| Sample | Power (W) | Time (s) |
|---|---|---|
| P1 | 100 | 60 |
| P2 | 100 | 300 |
| P3 | 100 | 1800 |
| P4 | 200 | 60 |
| P5 | 200 | 300 |
| P6 | 200 | 1800 |
Table 2.
Conditions (C1–C5) used during the CS coating of the P1 PLA-fiber sample.
| Sample | Number of CS Layers | CS Content (%) | Thickness of the CS Layer (nm) |
|---|---|---|---|
| C1 | 1 | 0.331 | 31.5 |
| C2 | 3 | 0.377 | 35.9 |
| C3 | 5 | 0.585 | 55.8 |
| C4 | 10 | 0.730 | 69.7 |
| C5 | 15 | 1.083 | 103.7 |
© 2018 by the authors. Licensee MDPI, Basel, Switzerland. This article is an open access article distributed under the terms and conditions of the Creative Commons Attribution (CC BY) license (http://creativecommons.org/licenses/by/4.0/).
Share and Cite
MDPI and ACS Style
Komoto, D.; Ikeda, R.; Furuike, T.; Tamura, H. Preparation of Chitosan-Coated Poly(L-Lactic Acid) Fibers for Suture Threads. Fibers 2018, 6, 84. https://0-doi-org.brum.beds.ac.uk/10.3390/fib6040084
AMA Style
Komoto D, Ikeda R, Furuike T, Tamura H. Preparation of Chitosan-Coated Poly(L-Lactic Acid) Fibers for Suture Threads. Fibers. 2018; 6(4):84. https://0-doi-org.brum.beds.ac.uk/10.3390/fib6040084
Chicago/Turabian StyleKomoto, Daiki, Ryoka Ikeda, Tetsuya Furuike, and Hiroshi Tamura. 2018. "Preparation of Chitosan-Coated Poly(L-Lactic Acid) Fibers for Suture Threads" Fibers 6, no. 4: 84. https://0-doi-org.brum.beds.ac.uk/10.3390/fib6040084
Note that from the first issue of 2016, this journal uses article numbers instead of page numbers. See further details here.