Article

Tailoring Acoustic Performances of Resin Reinforced Biomass Fiber-Based Panel with Single and Multiple Tailed Cavity Inclusions for Interior Work

1
Architecture Department, Engineering Faculty, Diponegoro University; Semarang 50275, Indonesia
2
Civil Engineering Department, Engineering Faculty, Diponegoro University; Semarang 50275, Indonesia
*
Author to whom correspondence should be addressed.
Submission received: 30 June 2019 / Revised: 17 September 2019 / Accepted: 23 September 2019 / Published: 5 October 2019

Abstract

:
The aim of this research is to observe the acoustic performance of absorber-based biomass fiber-reinforced polyester resins that were experimentally associated with the design of tailed cavity resonator inclusion, i.e., the cavities are partly in the form of a narrow slit. The model of electro-acoustic resonators and several treatments were developed and became the bases for understanding the changes of acoustic reactance in the new structure. Variations in the inclusion cavity and the addition of a narrow slit were tested experimentally using an impedance tube technique based on ASTM E1050-98 and ASTM E2611-09. The improvements of acoustic performance were conducted by single and multiple cavity tailed inclusions with the addition of a Dacron fibrous layer and back cavity. The experimental results showed that a sample of 15 mm single tailed cavity kenaf fiber had higher sound absorption and wider broadband frequencies than did the hemp fiber, with a peak on 0.31–0.32 between 1.00–2.00 kHz. Meanwhile on multiple tailed cavities, the 30 mm hemp fiber had higher and wider broadband frequencies than did the kenaf, with peaks on 0.45–0.63 at frequencies between 1.75–2.10 kHz. It can be concluded that the tailed cavity inclusions could improve performance. Compared to the coco-husk with resonators in previous studies, the tailed cavity was a little bit lower, but the tailed cavities hemps and kenafs samples showed good sound absorption performance with lower band frequencies capabilities.

1. Introduction

Natural fibers play a significant role as commonly-used materials; the acoustic field has taken advantage of these fibers for various applications. Acoustic material is highly demanded in the architectural sciences due to its applications in buildings in which sound performance criteria are significant factors. The lack of acoustic material in buildings causes acoustic defects, which influences people’s acoustic comfort. Although biomass fibers and other porous materials play important roles in the acoustic sciences, most of them are brittle, flammable, and susceptible to mold and weakening in mechanical strength, factors which preclude their use directly as noise control materials. As a result, scientists used various types of binders and additives to increase the mechanical strength and performance. This method was successfully applied, but it caused another constraint regarding the decrease in acoustic and sound absorption performance. When natural fibers are mixed with any chemical or natural binder and then compacted through heating and or pressing techniques, the materials become stiffer, harder, less porous, and extremely acousticly reflective. This study emphasizes an acoustic performance improvement strategy of resin-reinforced hemp and kenaf fiber as used in acoustic panels related to the use of surface design and modifications, named “tailed cavity inclusion”.
Many researchers have proposed techniques and methods to create acoustic materials and to improve their acoustic behavior [1,2,3]. In our previous research, water hyacinth and coconut husk fiber panels were compared in terms of their acoustic performances [1]. In this research, 25 grams of natural fibers were composed with 200 mL polyester fibers and 20 mL catalyst. The samples were then treated with a number of resonators, an additional fibrous layer, and a spacing air gap. The viscous damping among resonators caused the coconut husk fiber material with 8 quarter wavelength resonators and a fibrous layer to have the best performance in terms of sound absorption, which started to increase from 1.5 kHz at 0.7 to wideband frequencies. At the same time, the cavity caused the same effects in the whole test sample because of the mechanism of Helmholtz resonance. Similar to this research, a comparative study was conducted to observe a low density absorber panel made of coconut husk and wood sawdust composed with methyl ethyl peroxide as a catalyst and epoxy glue as bending without any treatments [4]. The results showed that the coconut husk fiber panel had better performance in lower frequencies than the wood sawdust, which had 0.50–0.95 on its coefficient between 1–2 kHz. The role of additive synthetic polymer as bending in natural fiber composite is significant to achieve better durability and to improve mechanical strength. Even though synthetic polymers such as epoxy resin are rarely worse than natural polymers, studies have shown that synthetic polymers as a bending in composite materials and treatments could be used to significantly improve sound absorption performance. Therefore, many scientists have conducted research of natural fiber acoustics materials composed of synthetic polymers and combined them with many treatment methods in efforts to improve sound absorption coefficients and transmission losses.
Further research regarding biomass fiber composite materials and treatments was carried out by Lim et al., who observed the sound absorption behavior of kenaf fiber composite [5]. The general result when kenaf fiber specimens were studied in normal and spasmodic sound incidence was a significant improvement in absorption coefficient with an increase in the density and thickness of the material. The best performance was that the absorption coefficient reached more than 0.5 from 0.5 kHz, and the average peak at 0.85 at above 1.5 kHz. The research also proposed that the additional air gap could shift the sound absorption to lower band frequencies. The study was conducted by Fouladi et al. using the Delaney-Bazley and Biot-Allard models to compare the sound damping ability between local market coco-husk and industrially-manufactured bindered coco-fiber made [6]. As a result, sound absorption improved, and the frequencies were shifted toward lower-bands from 1.36 to 578 Hz due to the increase of specimen thickness from 0.20 to 0.45 cm. Ramis et al. generated a formulation with which to predict and simulate system models of acoustics with the aim of acoustics divination [7]. This study therefore empirically formulates absorption predictions of coconut husk fiber in previous research, which can be applied to other natural fibers. Although it was noted that there were various types of coconut fibers, the procedure was tested effectively for samples including performing impedance and airflow resistance measurements.

1.1. The Hemp, Kenaf, Coco-Husk and Others as Biomass Fibers in Acoustic Material

Indonesia has an abundance of biomass fiber resources which may be processed and used in manufacturing. Since many studies observed biomass fiber applications and their acoustic characteristics [8,9,10,11,12,13,14,15,16], one of the applications in buildings is biomass fibers which are treated as sound absorbers. As far as these efforts are concerned, a study by Tang et al. investigated corn husk in terms of its sound damping performance [8]. Like Tang’s research, a study conducted by Piegay et al. [9] observed two fibers, i.e., vegetal and polymer, and compared them to both hemp and flax fibers. As a result, they found that the model could be used to predict the damping performance of a polymeric fiber and optimize the sound damping capacity of the biomass fiber [9]. This current research discusses the differences between recent studies on the new method of creating tailed cavity inclusions on material surfaces.
Several studies have investigated materials made of biomass fibers [10,11,17,18]. Three variables: thickness, fiber size, and polymeric content as binder, were observed by Othmani et al. based on sugarcane waste material and its resistivity and sound absorption performance [10]. Like Othmani’s study, research by Ismail et al. also examined waste materials of coir and shredded paper from offices by investigating four samples in a reverberation chamber (refer to the ISO 354-1985 standards) [11]. Janusevicius et al. [17] further discussed waste materials and studied three kinds of wall, i.e., adobe, pressed straws, and reed, on sound reduction indexes by measuring them in an anechoic chamber with simulation methods. The results showed that the adobe with 20 mm thickness, a sound reduction index of 43 dB could be achieved [17]. Subsequently, two biomass fibers, i.e., date palm (DPF) and coconut coir (CCF), were compared in terms of their Acoustic Absorption Coefficient (AAC) by Al Rahman et al. [18]. Although they found that the date fiber was better than the coir, they considered that both may be recommended as absorber materials. The current research is distinguished by the innovation of the surface design of materials with tailed cavity inclusions and the use of a cavity with a shape like tadpole tail, in an effort to absorb sound energy.
Nine biomass fibers were investigated based on their absorption coefficients and flow resistance to predict the acoustic properties using the inverse method proposed by Berardi and Iannace [19]. Absorption coefficients and resistance for samples of different thicknesses have been measured. As far as the Delany-Bazley model is concerned, this study compares the results of impedance tubes. With the least-square fit procedure based on the Nelder-Mead method, coefficient optimization predictions for both acoustic impedance and propagation constant law can be calculated. The determination of different physical parameters and formulas for incorporating natural fibers that are examined using software modeling for interior acoustic applications can be carried out with an inverse approach [19]. Biomass fibers, i.e., kenaf, and pineapple leaf fibers, have been studied by many researchers [5,15,16,20,21,22,23]. Research conducted by Putra et al. [23] observed the absorption coefficient performance of pineapple-leaf fiber (PALF) according to density and thickness variables. The method used was the normal incidence of the impedance tube procedure based on the ISO 10534-2. The results showed that the damping performance of the PALF was average 0.9 at above 1.0 kHz, similar to that of commercial synthetic products such as rock wool and polyurethane foam. This means that the PALF can be used as a sustainable absorber to substitute synthetic absorbers which create a lot of carbon emissions in their fabrication process [23]. Further, research by Khalil et al. studied the use of kenaf fiber in Malaysia [21]. Research conducted by Chin et al. [16] analyzed a kenaf fiber-based, biodegradable, composite, microperforated panel composed (BC-MPP) of polylatic acid (PLA) in terms of its acoustic characteristics, especially its damping performance. The results showed a porosity increase due to the increment in the kenaf fiber percentage, while the increment of the kenaf fiber caused a reduction of the tensile strength. In reference to those studies, the present study is different in terms of its innovation of the tailed cavity inclusion or acoustic improvement of materials for both sound absorption and insulation.

1.2. The Role of Treatments on Improving Damping Performance of the Natural Fiber Material

Various kinds of treatments such as surface modification with resonators, the inclusion of additional air cavities, and fibrous sheet layering have been considered by Lee and Swenson [24], Lee and Chen [25], Setyowati et al. [1] and Zulkifli et al. [26]. Lee and Swenson stated that the methods to create good porous materials with sound absorption abilities were limited, due to the required thickness and the exorbitant cost of fabrication. The researchers then built a solid and efficient absorber panel without a porous layer equipped with a single perforated panel backed by an air gap. The acoustic behavior was modeled by theoretical formulation and validated empirically using new equipment created to predict the performance of materials when exposed to low frequencies. As a result, it was concluded that the vibration panel had a significant effect on the acoustic behavior of the structure [24]. Unlike Lee and Swenson, Lee and Chen conducted research on the structure of a multi-layer panel which was evaluated and rigorously analyzed using ATA (Acoustic Transmission Analysis). With ATA, the acoustic impedance and dumping of the multi-layer structure with several layers, such as perforated layers, fibrous panels, and air cavities, can be successfully calculated [25]. Zulkifli et al. observed the behavior of sound absorption and transmission loss of structures using biomass coconut fiber as a filler of composite with and without a perforated panel. Based on the fact that the structures comparable to industrial products such as rock wool and others, the present research reviews the acoustic performance of biomass fibers with tailed cavity innovations that have rarely been discussed elsewhere.
The use of biomass fiber as an absorber material was recommended in studies conducted by Ersoy and Kucuk, Mohanty et al., and Mueller and Krobjilowski et al. [27,28,29]. Ersoy and Kucuk observed the sound absorption of tea-leaf fiber layered by a single structure of briden textile drapery. Three different kinds of structures of tea-leaf fiber, with and without briden textile drapery layers, were studied. The empirical data showed that the 10 mm thick tea-fiber layered with fabric cloths had a sound absorption capacity which was equal to that of six layers of briden textile fabrics cloth. The 20 mm tea fiber without woven layering was similar with absorption in the range of 0.5–3.2 kHz. Unlike Ersoy and Kucuk, studies by Mohanty et al. and Mueller & Krobjilowski showed similar results. The differences between their research was that Mohanty et al. studied biocomposites with additional chemical substances and analyzed their acoustic performances, while Mueller and Krobjilowski observed biocomposites composed of cellulose acetate and citrate plasticizer, with the of tensile moduli referring to the results obtained using scanning electron microscope (SEM).
The findings of the studies show that there was no new innovation and technique related to the surface modification of acoustic composite materials, except the three traditional methods, i.e., perforated surface, additional air cavity, and additional fibrous layers, as efforts to improve acoustic performance. The present research introduces new treatments to improve acoustic behavior using single and multiple tailed cavity inclusion. Such methods have never been observed by research seeking to improve the performance of acoustic panel materials. This research started by undertaking a comparative study between the acoustic performance of coconut husk fiber panels with previous results and the new treatment results of single and multiple tailed cavity inclusions. As the observations went on, other biomass fibers such as hemp and kenaf fiber were tested with using previous methods and new ones. A further hypothesis is that the new methods would be a better solution for technologies seeking to improve the acoustic behavior of the panel material.

2. Materials and Methods

As an agricultural country, Indonesia has a huge number of biomass fiber plantations, e.g., coconut (Cocos nucifera), hemp (Bohmeria nivea), and kenaf (Hibiscus cannabinus). A study carried out by Narang revealed that lower density fiber boards yield better sound absorption behavior compared to similar high density boards [30]. With regards to the use of cavity inclusion, they argued that the addition of a cavity to the metal frame could improve STL to a limit of 10 dB. Meanwhile, similar results reported by Ko et al. [31] stated that aluminum foam material could have high sound transmission loss if it was treated with the addition of a cavity to the material structure. Furthermore, many researchers have proposed general acoustic tailoring by the use of additional resonators, porous layers and air back cavities. Setyowati et al. developed a unique strategy to improve the acoustic performance of materials by designing tailed cavity inclusion on seashell surface materials [32]. Similar to previous studies, the present research implemented tail cavity inclusion in a resin reinforced biomass fiber for interior applications. Depending on the research by Ko et al., improvements in acoustic performance could be achieved by creating design innovation on either the surface or body of the material samples [31]. The present research aims to create innovations by designing single and multiple tailed cavities in materials to improve sound absorption and insulation.
Finally, based on those theoretical reviews and references, this study also aims to observe the acoustic behavior of biomass fibers and deliver innovations for the application of tailed cavity inclusions. In this study, biomass fibers were first cleaned and dried in natural conditions within three days at 34–35 °C temperature and 80–85% relative humidity. After the drying process, the dried biomass fibers were then ground using a dish-mills machine and filtered to a size 250 microns. The mass of the specimens was measured, and an epoxy resin manufactured by the JUSTUS polyester resin 2522 was added. The biomass fibers reinforced epoxy resin JUSTUS 2522 had the composition of a natural fiber; polyester resin: catalyst as 25 grams; 200 mL and 20 mL respectively. The dough was manually stirred until it was thoroughly blended at a normal temperature and poured into tube-shaped moldings of 30 mm diameter. After 24 hours, the moldings were dismantled and massed for density.
Figure 1 illustrates three kinds of biomass fibers: coco-husk (Cocos nucifera), hemp (Bohmeria nivea), and kenaf (Hibiscus cannabinus), as seen in Figure 1a, and the treated specimens with either single or multiple tailed cavities in an effort to improve the acoustic performances of the biomass fibers (see Figure 1b).
The three kinds of biomass fibers have four samples of two thicknesses, 15 mm and 30 mm in 30 mm diameter. Each thickness was represented by two samples, and the specimens were coded A to F, as listed in Table 1. To observe the acoustic performances of the specimens, they were treated with eight holes of quarter wavelength resonators, hole-tailed cavity inclusions, additional fibrous Dacron layer, and a 10 mm air gap (see Table 1). The 30 mm diameter tube specimens were measured in terms of their mass, volume, and density. The equation for density is:
ρ = m π × r 2 × t
where ρ is the material’s density in grams per cm3, m is the weight in grams, and π, r, and t are pi, radius (cm), and the thickness of specimens (cm) respectively. Table 2 shows the density of specimens:
Table 2 describes the average density of the biomass fibers. The differences of density between similar kinds of specimens occured due to the manual mixing process. The lowest density goes to the kenaf (Hibiscus cannabinus) with 0.7670 g/cm3, while the highest is indicated by the hemp (Bohmeria nivea) at 0.9318 g/cm3. Since previous studies indicated that density influenced the acoustic behavior of materials, including the absorption and the Sound Transmission Loss (STL), further discussion follows to compare one fiber to another in terms of surface material performances.

2.1. Sound Absorption Coefficient

The impedance tube test procedure using two microphones, ASTM E-1050 (DK-2850, Naerum, Denmark), was used to measure the sound absorption of specimens [33]. The sound absorption behavior with frequencies up to 6400 Hz was measured by the 4206 series of B&K impedance tube equipped with a 30 mm diameter tube. The comparative measurement between 8-hole resonators and tailed-cavity inclusion samples on their sound absorption behavior was scrupulously observed. The treatments were conducted by drilling the samples to form both 3 mm diameter quarter wavelength resonators [1] and 6 mm diameter single-multiple tailed cavity inclusions, as indicated in Figure 1b.
A personal computer with a material testing software controlled all the experiments using the tube installed with four LAN-XI Bruel & Kjaer analyzer channels. The tube’s power amplifier propagated the gratuitous sound energy as the sound fount scattered along pipe before hitting the specimen’s surface. Two 1/4-inch 4187 Bruel & Kjaer microphones using transfer function analysis captured both decaying incident and reflection waves. The sound absorption behavior of the samples was represented by the decomposed sound energy and the process of decay. The following equations represent the frequency response function H1,2 and reflection coefficient R:
H 1 , 2 = P 2 P 1 = e j k h + e j k h e j k ( h + s ) + e j k ( h + s )
R = H 1 , 2 e j k s e j k s H 1 , 2 e j 2 k ( h + s )
The two microphones (in position one and two) captured the sound pressure levels, P1 and P2; the wave number is represented by k; R is Reflectance coefficient, while the distance between the sample and the first microphone is expressed by h; finally, the distance between the microphones is represented by s. α, the sound absorption coefficient, can be formulated as:
α = 1 [ R ] 2
where α is the absorption coefficient and R is reflectance coefficient.

2.2. Sound Transmission Loss (STL)

As a number of studies conducted to determine the Sound Transmission Loss [34], the four Bruel & Kjaer 4187 series microphones located in both bottom and upper tubes captured the noise energy scattered by a hard speaker installed on the bottom tube. Random noise was generated by an analyzer of spectrum (3160-A-042 series of B&K, DK-2850, Naerum, Denmark) and power amplifier (the 2716C series of B&K, DK-2850, Naerum, Denmark). After being captured by the microphone, the sound was then analyzed by the module of spectrum analyzer (see Figure 2).
To reach a high frequency test for sound dumping, a shorter tube was used. Specimens of 15 and 30 mm thickness were applied for the anechoic termination in the lower tube. The devising codes of A and B indicated the incidents and components reflected in the lower pipe, while the devising codes of C and D were emitted and reflected in the lower tube (see Figure 2). To simplify the formulation of sound transmission loss, the distance between the two microphones was then considered equal and the calculation of STL was represented in Equation (4):
S T L = 20 log | e j k s H 1 , 2 e j k s H 3 , 4 | 20 log | S d / S u |
As such, the transfer function of sound pressure at positions 1 and 2 is represented by H1,2, while that at positions 3 and 4 is represented by H3,4, and S d / S u is the ratio between the auto spectrum in both the upper and lower tubes [35].

2.3. Surface Morphology

The acoustic performances of natural fiber materials depend on the porosity of the natural fiber contained in the materials. A number of studies used a SEM to obtain the surface morphology of various materials in terms of acoustic performance. In this research, a SEM instrument of JEOL JSM-6510 LA (JEOL Co., Ltd., Tokyo, Japan) was used to observe the porosity and to analyze the different appearance of the morphology of the specimen’s surfaces [36,37,38]. Sambu et al. used the porosity with SEM procedure to observe the Hibiscus cannabinus composed of latex in various compositions in terms of sound absorption capability. Unlike Sambu et al., Nath and Mishra and Sei discussed the performance of the sound absorption of porous materials observed with SEM analyses in macro discussions [39,40]. Meanwhile, Mahzan et al. observed the viability of coconut coir fiber composed using recycled rubber in terms of its sound absorption performance using SEM analyses [37]. Further studies were carried out by Peng et al. [41], Renouard et al. [42], Bonnafous et al. [43], and Cao et al [38]. They evaluated the correlation between the compound of carbon within materials and acoustic behavior based on both the sound absorption and the transmission loss. The absorption coefficient and the sound transmission loss (STL) findings influenced by the surface morphology of biomass fibers are described in the following section.

3. Results and Discussions

The effects of single and multiple tailed cavity inclusion on the sound absorption behavior are described in Figure 3. The sound absorption performance of the six specimens before treatment is presented in continuous lines (A0, C0, and E0 indicate untreated, 15 mm thickness coco-husk, hemp, and kenaf respectively, while B0, D0, and F0 indicate untreated, 30 mm thickness coco-husk, hemp, and kenaf respectively), while the treatments are shown in the dash-dot lines (A1H-Tailed, C1H-Tailed, and E1H-Tailed indicate 15 mm coco-husk, hemp, and kenaf respectively with single tailed cavity treatments, while B2H-Tailed, D2H-Tailed, and F2H-Tailed indicates 30 mm coco-husk, hemp and kenaf respectively with multiple tailed cavities). The hemp and kenaf fibers with thicknesses of 30 mm are indicated as C and E respectively, while the 15 mm hemp and kenaf are represented as D and F respectively. Before treatments, the entire four specimens show similar sound absorption coefficients in middle frequencies (1.5–3.0 kHz), except for the the coco-husk fiber. However, discrepancies occur in low and high frequencies, especially for the 30 mm hemp sample and the 15 mm kenaf sample. The 30 mm hemp showed the best performance at high frequencies, with a peak of 0.95 at 5.4 kHz, while the 15 mm kenaf in low frequencies reaching up to 0.46 at 750 Hz. These findings were in agreement with the results of Cao et al [38] and Lim et al. [5]; nevertheless, the coco-husk fiber showed its superiority, producing the highest sound absorption in middle frequencies for the 15 mm specimens and in the low frequencies for the 30 mm specimens.
There is no significant influence in terms of the additional holes and slits as single and multiple tailed cavity inclusions, except that the phenomenon occurred in the 30 mm-thick hemp specimens. The bare 30 mm hemp sample delineated by the red continuous line shifted its absorption performance towards lower frequencies after the treatments (see Figure 3b). The 30 mm coco-husk specimens showed better performance after it was treated by multiple-tailed cavities, as represented by a black-dash dot line in Figure 3b; it had two peaks of 0.60 and 1.0 at 3.0 kHz and 1.2 kHz respectively. The most promising performance occured when the 30 mm hemp sample was treated by multiple tailed cavity inclusions represented as D2HTailed with the red dash-dot line. Its sound absorption coefficient reached a high point of 0.63 at 2000 Hz and had a wide broadband frequency, which signifies the multiple tailed cavity inclusion creating a substantial effect on sound absorption improvement.
Nevertheless, the negative absorption values reveal that the material tends to be reflective at certain frequencies, but in fact, in reference to the statistical data described in Table 3 and Table 4, the biomass fiber materials have sound transmission loss performances in positive values. Table 3 and Table 4 show that the additional tailed cavity could increase the sound absorption performance.
Comparing Figure 3, Table 3, and Table 4, although there are negative values in absorption performance due to the instrument’s sensitivity, the average sound absorption of all materials are in positive values. To emphasize the findings, Table 3 describes the sound absorption increments as a result of the additional single tailed cavity. Similar to the findings of by Narang [30] and Ko et al. [31], it was indicated that part of sound energy had been successfully trapped in the new structure of the tailed cavity inclusion. For example, when the sound absorption of A0 (15 mm bared coco-husk) was 0.1885, the increment sound absorption increased at 0.2422 when a single tailed cavity was added in materials. Similar conditions occured in other specimens, C (15 mm thick hemp) and E (15 mm thick Kenaf) respecively (see the ‘average’ column of Table 3). Like Table 3, Table 4 reveals that the sound absorption increased when multiple tailed cavities were added. B, D, and F stand for 30 mm Coco-husk, Hemp and Kenaf respectively, while B2HTailed, D2HTailed and F2HTailed indicated the 30 mm, Hemp, and Kenaf with multiple tailed cavities respectively.
The effectiveness of single-multiple tailed cavity inclusion is described in Figure 4. The tailed cavity both reflects and blocks the sound energy, in that it can easily reduce the sound intensity due to the reflecting, blocking and decaying. This findings agree with studies conducted by Narang [30] and Ko et al [31]. The tailed cavity inclusion was designed to trap the sound energy. As illustrated in Figure 4a, the sample was fitted in the B&K impedance tube and strengthened the sound energy released from the speaker. The generic method was applied covering additional resonators, the fibrous layer, and the air gap behind the sample. The sound energy hit the material surface, propagated within the material, and was trapped by the tailed cavity inclusion. As a result of the event of the sound capture in the tailed inclusion structure, the sound became gradually decreased, due not only to trapped sound energy, but also because viscous damping occured in this process.
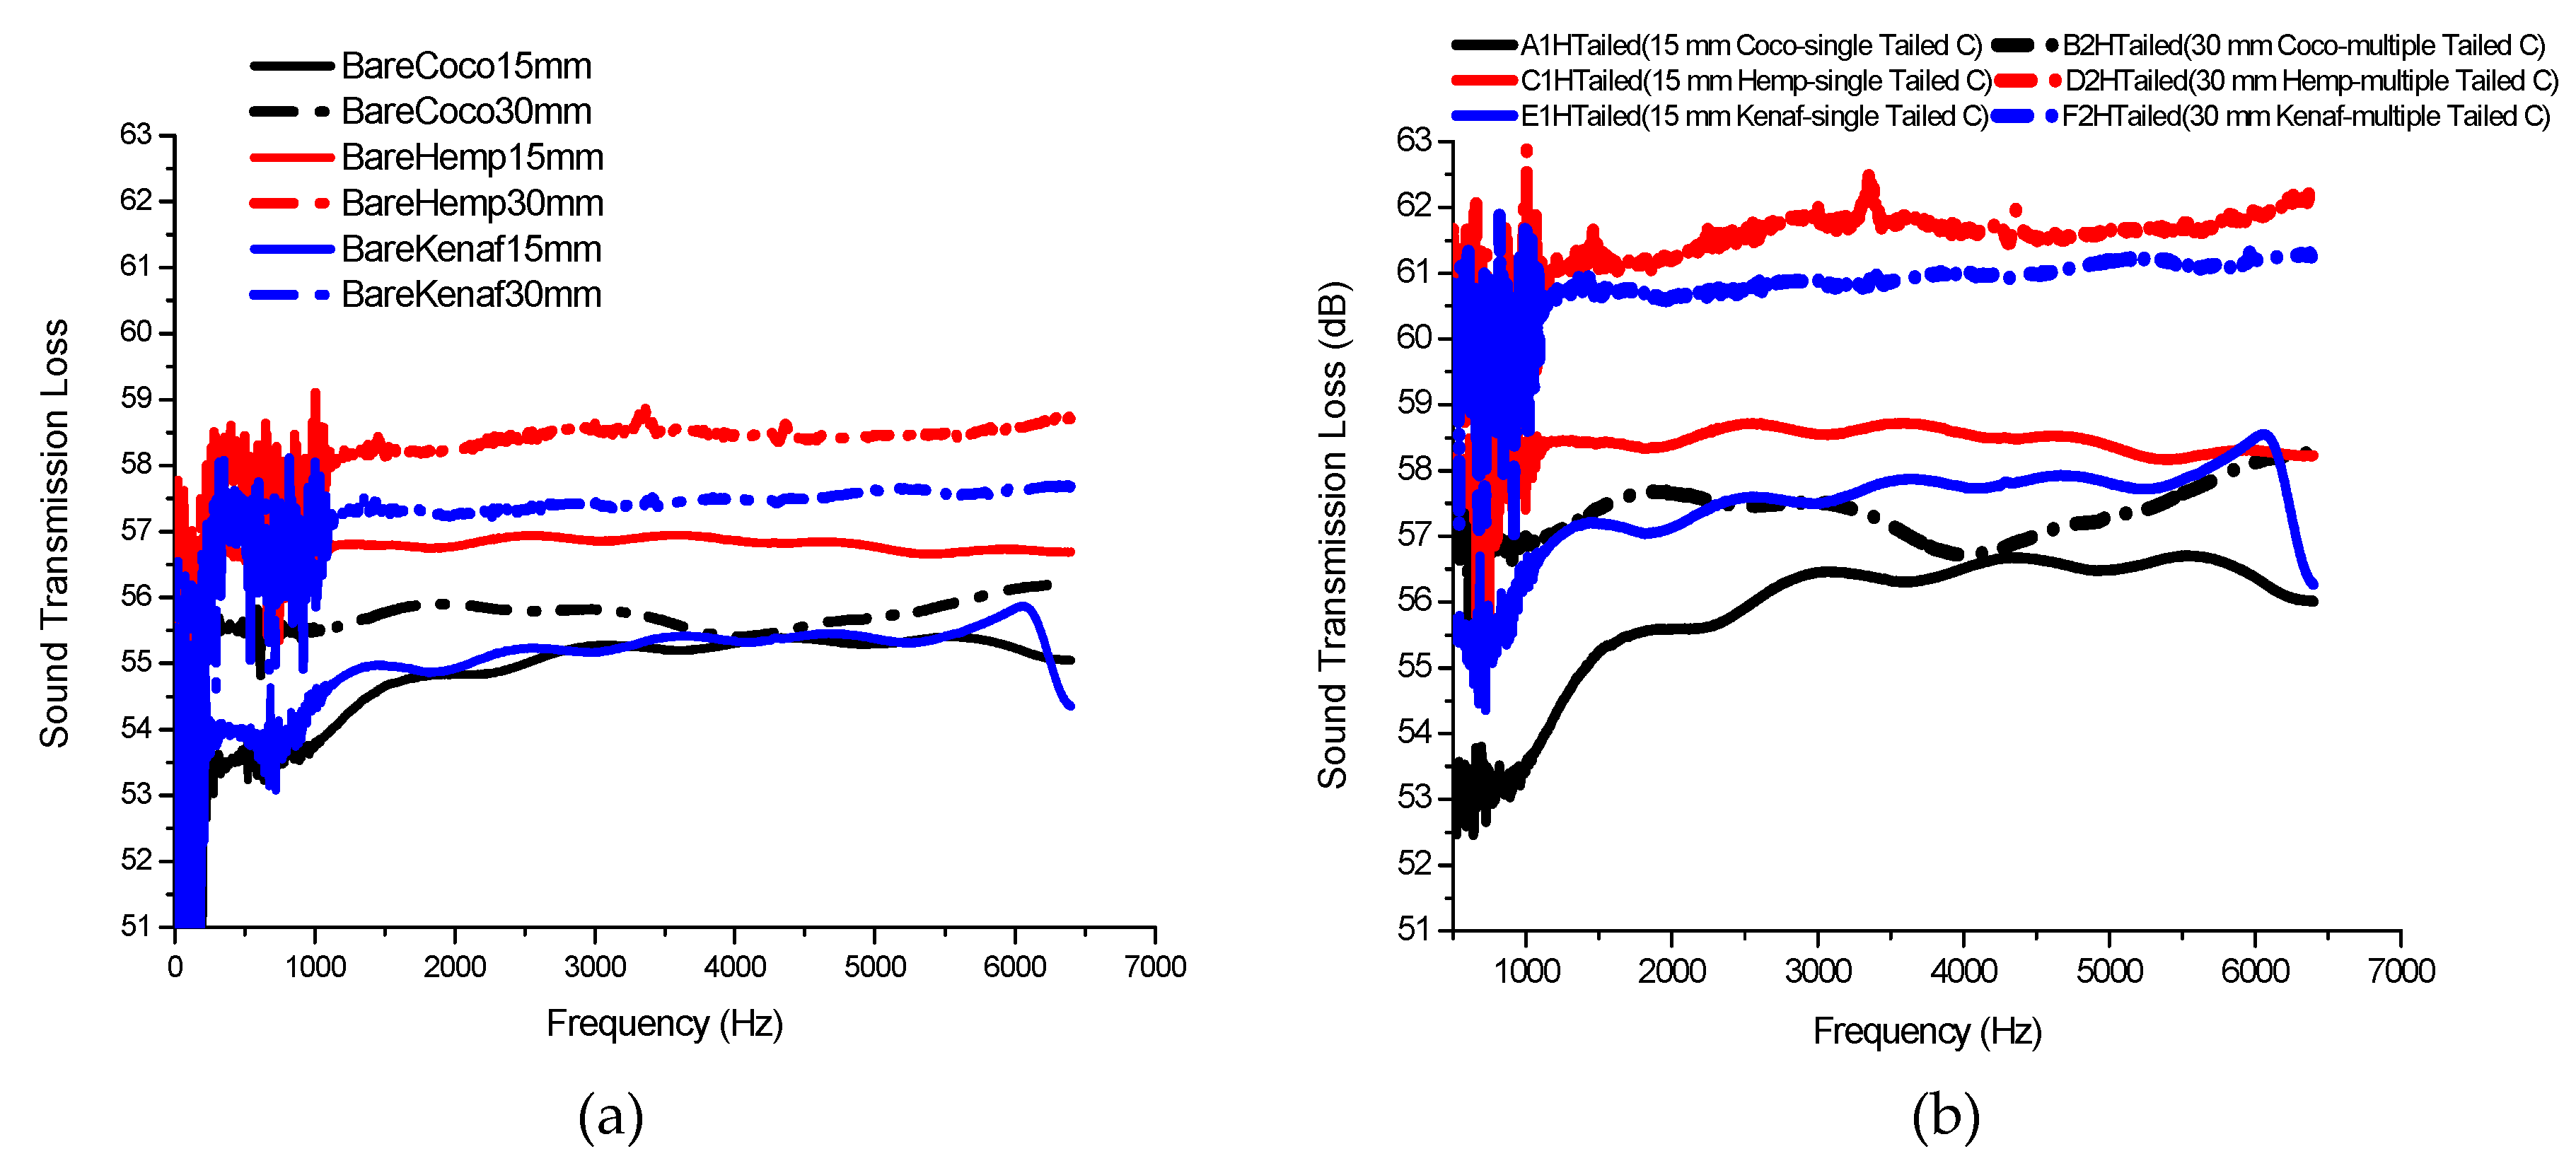
Moreover, it was also found that the sound transmission loss represented the ability of the material to obstruct and remove sound energy. The transmission loss of Coco-Husk, Hemp, and Kenaf fiber reinforced polyester epoxy is described in Figure 5. In Figure 5, A1H-Tailed, C1H-Tailed, and E1H-Tailed denote the 15 mm coco-husk, hemp, and kenaf respectively, with the single tailed cavity treatments, while the B2H-Tailed, D2H-Tailed and F2H-tailed indicate the 30 mm coco-husk, hemp, and kenaf respectively with the multiple tailed cavities treatments. The graph shows that the Sound Transmission Loss of either hemp or kenaf specimen with 30 mm thickness has better performance than that with the thickness of 15 mm (see Figure 5). The best performance is shown by the 30 mm thickness of hemp specimen with the STL increases starting from 61 dB at 1 kHz. Unlike the hemp and kenaf, the STL behavior of coco-husk looks different, due to the distinctive fiber structure and pattern of coco-husk.
Figure 5a illustrates the sound transmission loss of untreated biomass fiber. In Figure 5b, the hemp specimens have at least 61.5 dB at a 30 mm thickness and at least 58.2 dB at 15 mm, while the kenaf specimens have at least 60.8 and 58.0 dB at 30 mm and 15 mm thickness, respectively. Compared to the density data in Table 1, the data show that the STL values agree with the density of the materials. It can be concluded that the thicker the specimens and the higher the densities, the better the sound transmission loss of materials. To make clearer the discussion of the sound transmission loss improvements due to the additional tailed cavity inclusion, Table 3 shows the sound transmission loss differences of the bare biomass fiber specimens, samples with single tailed cavities, and samples with multiple tailed cavities. Table 5 shows that the sound transmission loss performance increases due to both the additional single and multiple cavities. The highest increment percentage is indicated by the 30 mm thickness of the kenaf specimens by as much as 5.8538%, while the lowest increment percentage was indicated by the 15 mm thickness of coco-husk at 1.4468%.
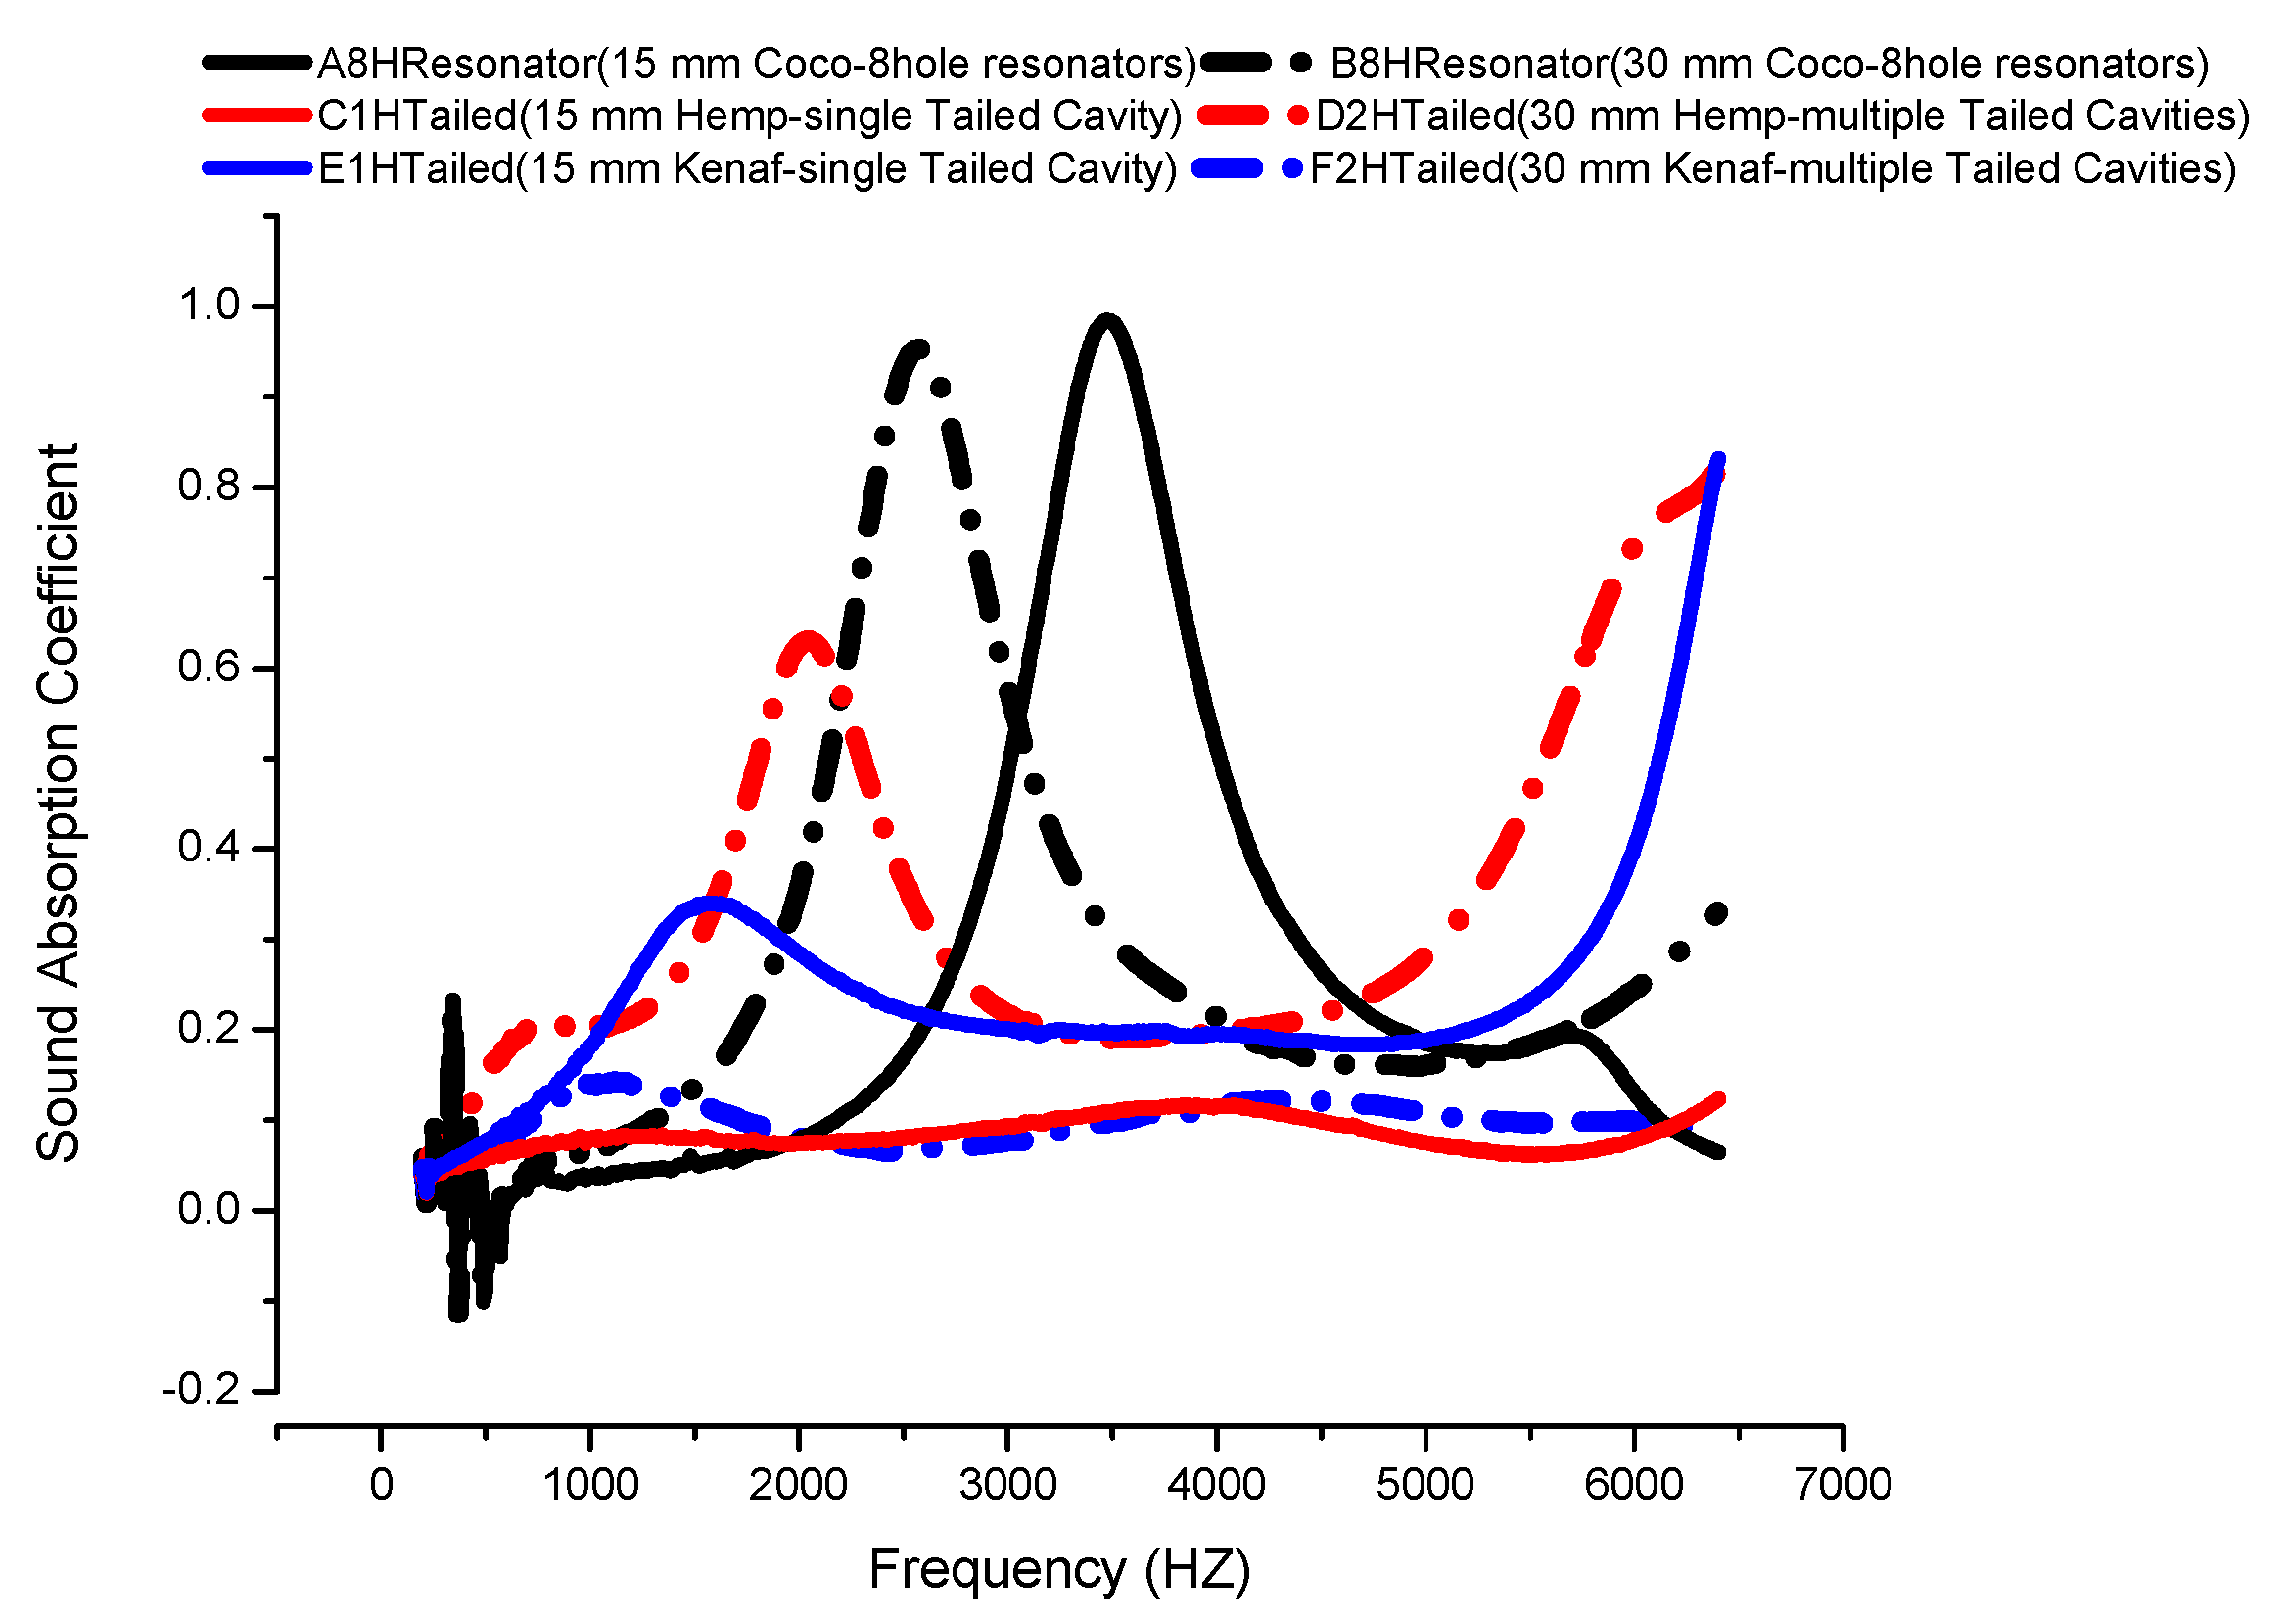
Figure 6 describes how this research compares to previous research conducted by Setyowati et al. [1]. The graph compares sound absorption performance according to the different treatments between the additional quarter wavelength resonators and single-multiple tailed cavity inclusions on three kinds of biomass fibers reinforced with a polyester resin. In Figure 6, the codes of A8Hresonator and B8Hresonator stand for the coco-husk treated with eight holes resonator in 15 mm and 30 mm thicknesses, respectively. The codes of C1HTailed and E1HTailed stand for 15 mm hemp and kenaf specimens, which were respectively treated with single tailed cavity, while the codes of D2HTailed and F2HTailed indicate 30 mm hemps and kenaf specimens with multiple tailed cavity inclusions. The continuous lines show the 30 mm thick specimens, while the dash-dot lines depict the 15 mm thick samples.
Although the quarter wavelength resonators treatment impacts sound absorption to a much greater extent, the single-multiple tailed cavity treatments on the specimen causes lower frequencies in their sound absorption performances. The promising performance in terms of sound absorption of tailed cavity inclusion is delineated by the 30 mm thickness of hemp sample that has a lower frequency at its peak and a wider broadband frequency performance.
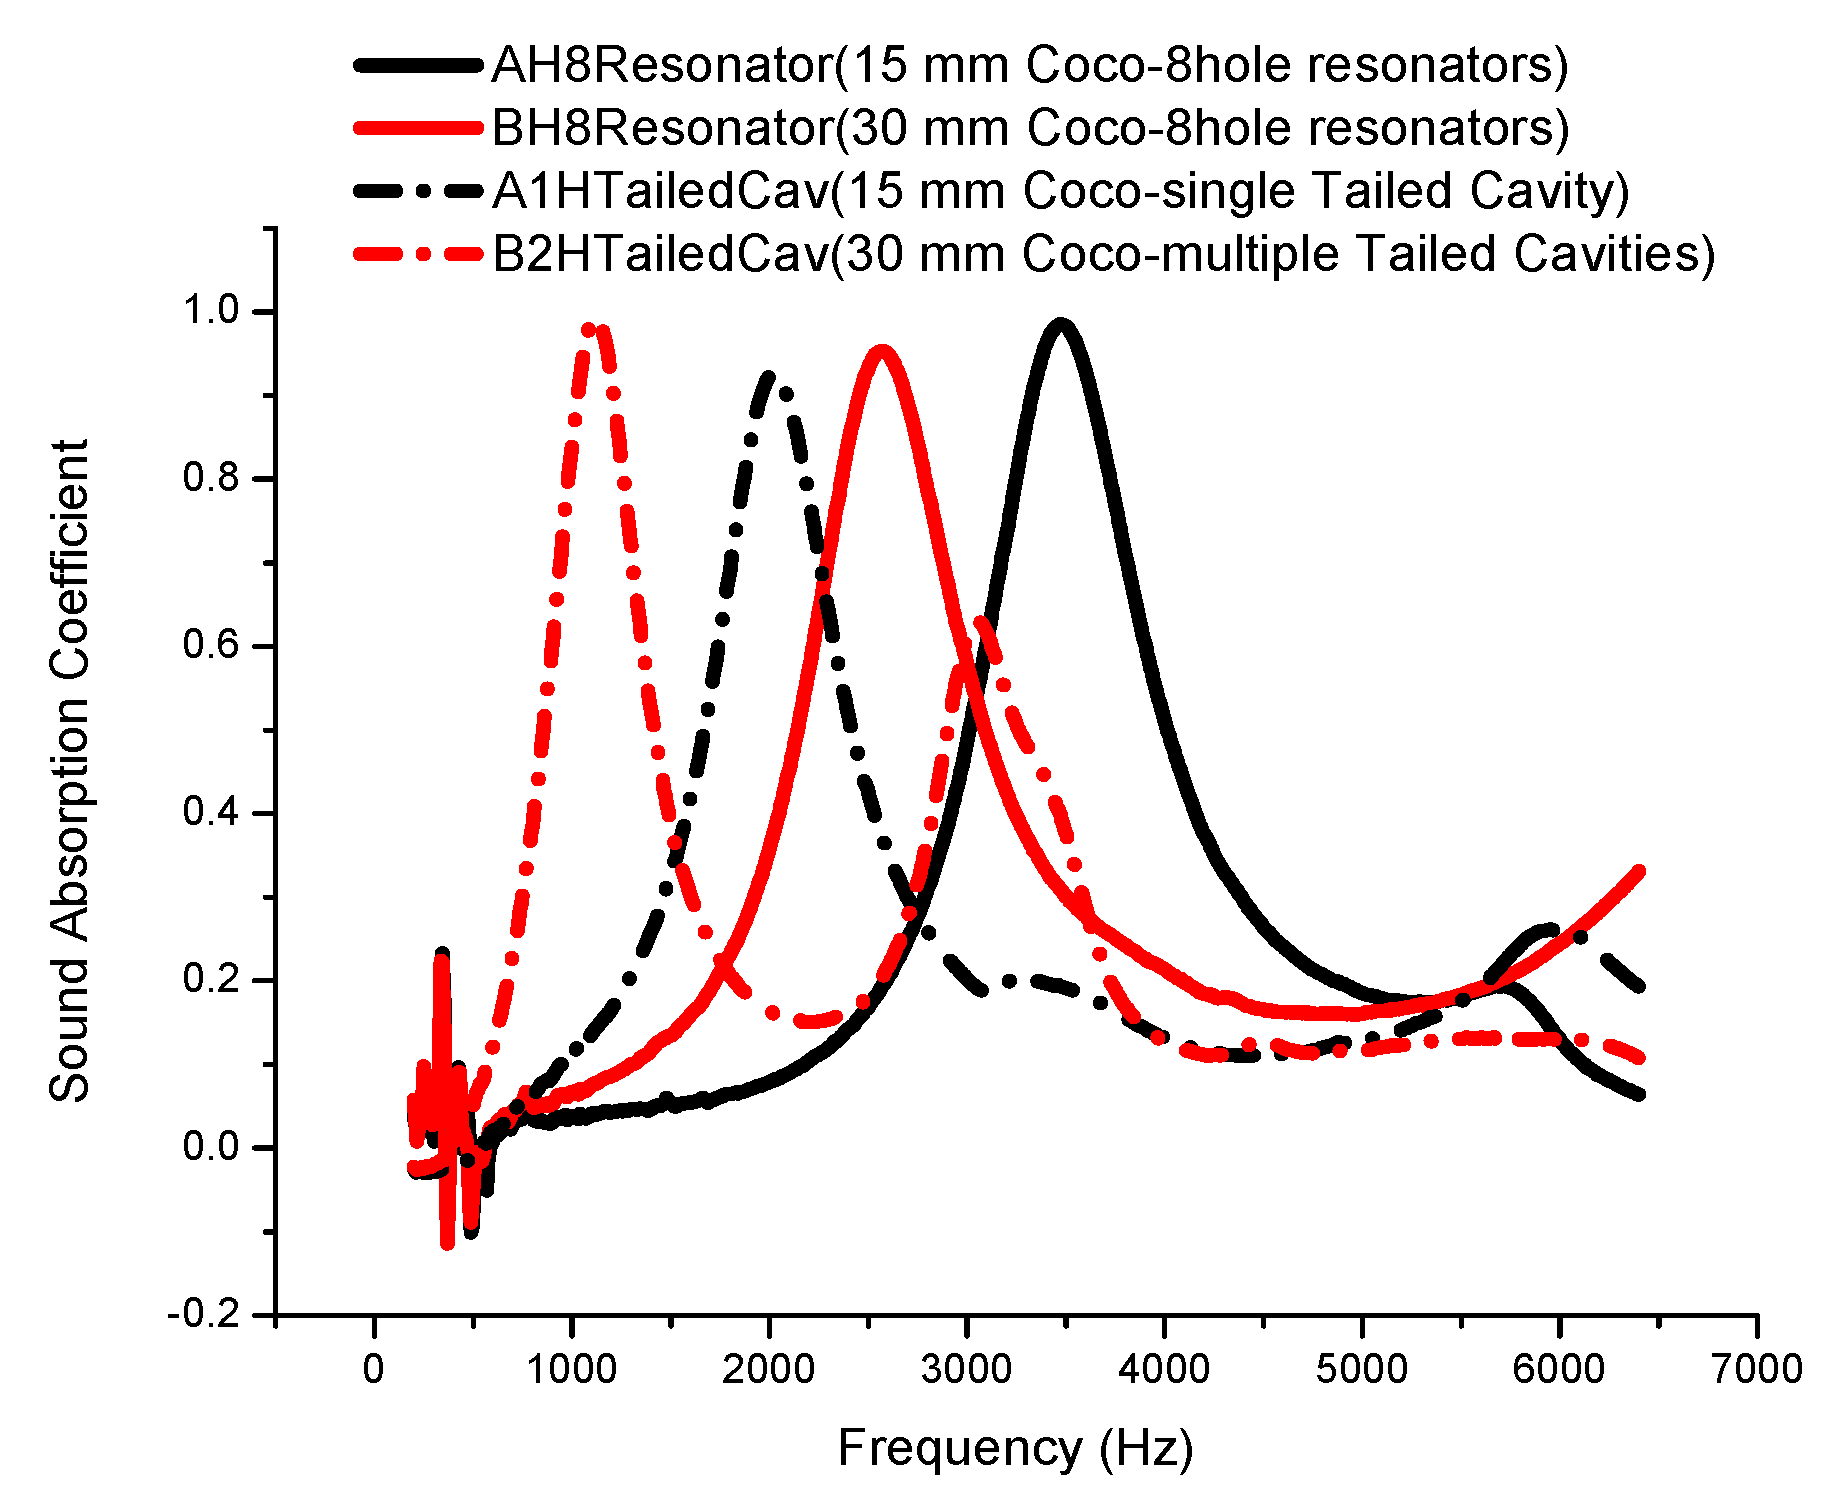
Several methods could be adopted to analyze the effectiveness of the single-multiple tailed cavity method compared to the previous traditional method, such as additional hole resonators. First, we compared the present methods to the previous quarter wavelength resonator methods. Figure 7 shows coconut husk fiber reinforced polyester resin in term of its comparison between a quarter wavelength resonators and single-multiple tailed cavity inclusion method. In Figure 7, the codes of AH8Resonator and BH8Resonator stand for the coco-husk with eight-hole resonator treatment in 15 mm and 30 mm thickness respectively, while the codes of A1H-TailedCav and B2H-TailedCav indicate coco-husk treated with single and multiple tailed cavity inclusions respectively into which the 10 mm air gap was added.
Ultimately, the present methods can shift sound absorption performance toward lower frequencies than the previous ones. For example, the 30 mm thickness coco-husks previously showed 0.95 at 2.6 kHz with the old method, but after treatment with the present method, the material had better performance at lower frequencies, with peaks on 0.99 and 0.60 at 1.0 kHz and 3.0 kHz respectively; this was due to its two-hole tailed cavities. Like the 30 mm thick samples, the 15 mm coco-husk with a single tailed cavity had absorption performance with a peak in 0.85 at 2.0 kHz, lower than the previous method of quarter wavelength resonators. Due to the cavity functioning like a Helmholtz resonator, such a finding is in agreement with previous studies by Setyowati et al., Echeverria et al. and Wang et al. [32,44,45]. Second, as 
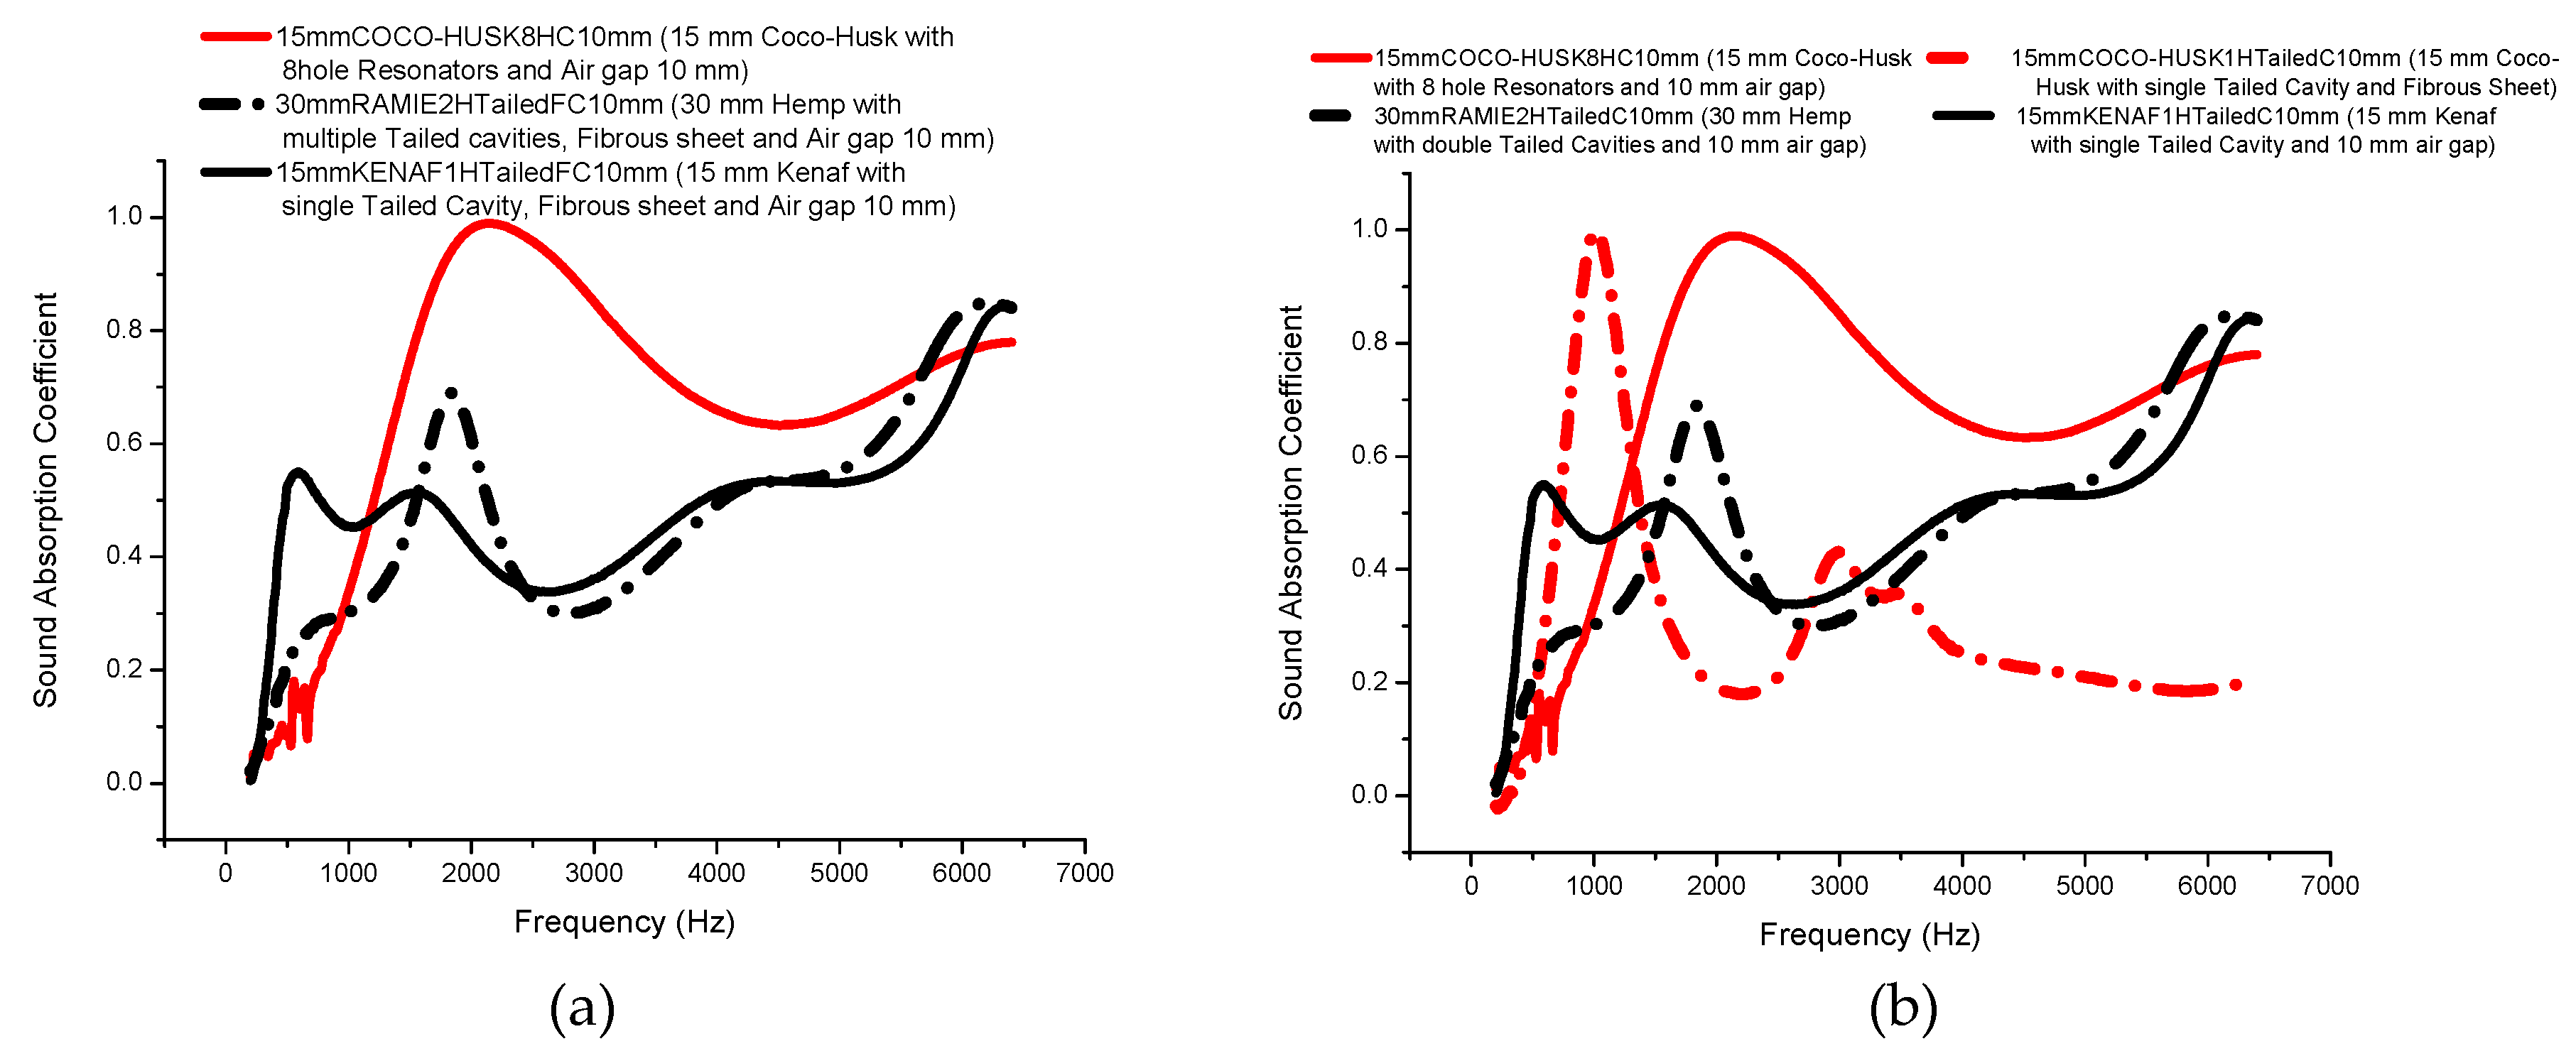
Figure 8 indicates, we compared specimens treated with the present methods to the previous study observing coco-husks treated with quarter wavelength resonators and 10 mm air gaps.
In Figure 8a,b, 15mmCoco-Husk8HC10mm means that the 15 mm coco-husk specimen was treated with eight hole resonators and a 10 mm air gap; 30mmRamie2HtailedFC10mm indicates the 30 mm Hemp specimen treated with multiple tailed cavities inclusions, an additional fibrous layer, and additional 10 mm air gap; finally, 15mmKenaf1HtailedFC10mm indicates the 15 mm kenaf specimen which was treated with multiple tailed cavity inclusions, an additional fibrous layer, and additional 10 mm air gap. Furthermore, on the red line, 15mmCoco-husk1H-TailedC10mm stands for the 15 mm coco-husk specimen that was treated with single tailed cavity and additional 10 mm air gap. The results shown in Figure 8 is that all of treatments reach wide broadband frequencies, although the kenaf and hemp treated with tailed cavity are still much lower than the coco-husk treated with quarter wavelength eight-resonators in previous research. It means that the present improvement methods can be considered as treatments of biomass fiber composites due to their ability in terms of sound absorption in wide broadband frequencies (see Figure 8a). In Figure 8b, unlike the coco-husk with quarter wavelength 8 resonators (the black-dash dot line), the coco-husk with a single tailed cavity inclusion (the red-dash dot line) appeared in lower performance and did not have a wide broadband frequencies, although it has its highest peak at 0.99 at 1.0 kHz. This means that the coco-husk with an eight-hole resonator was still much better than that with a single tailed cavity due to having wideband frequencies.
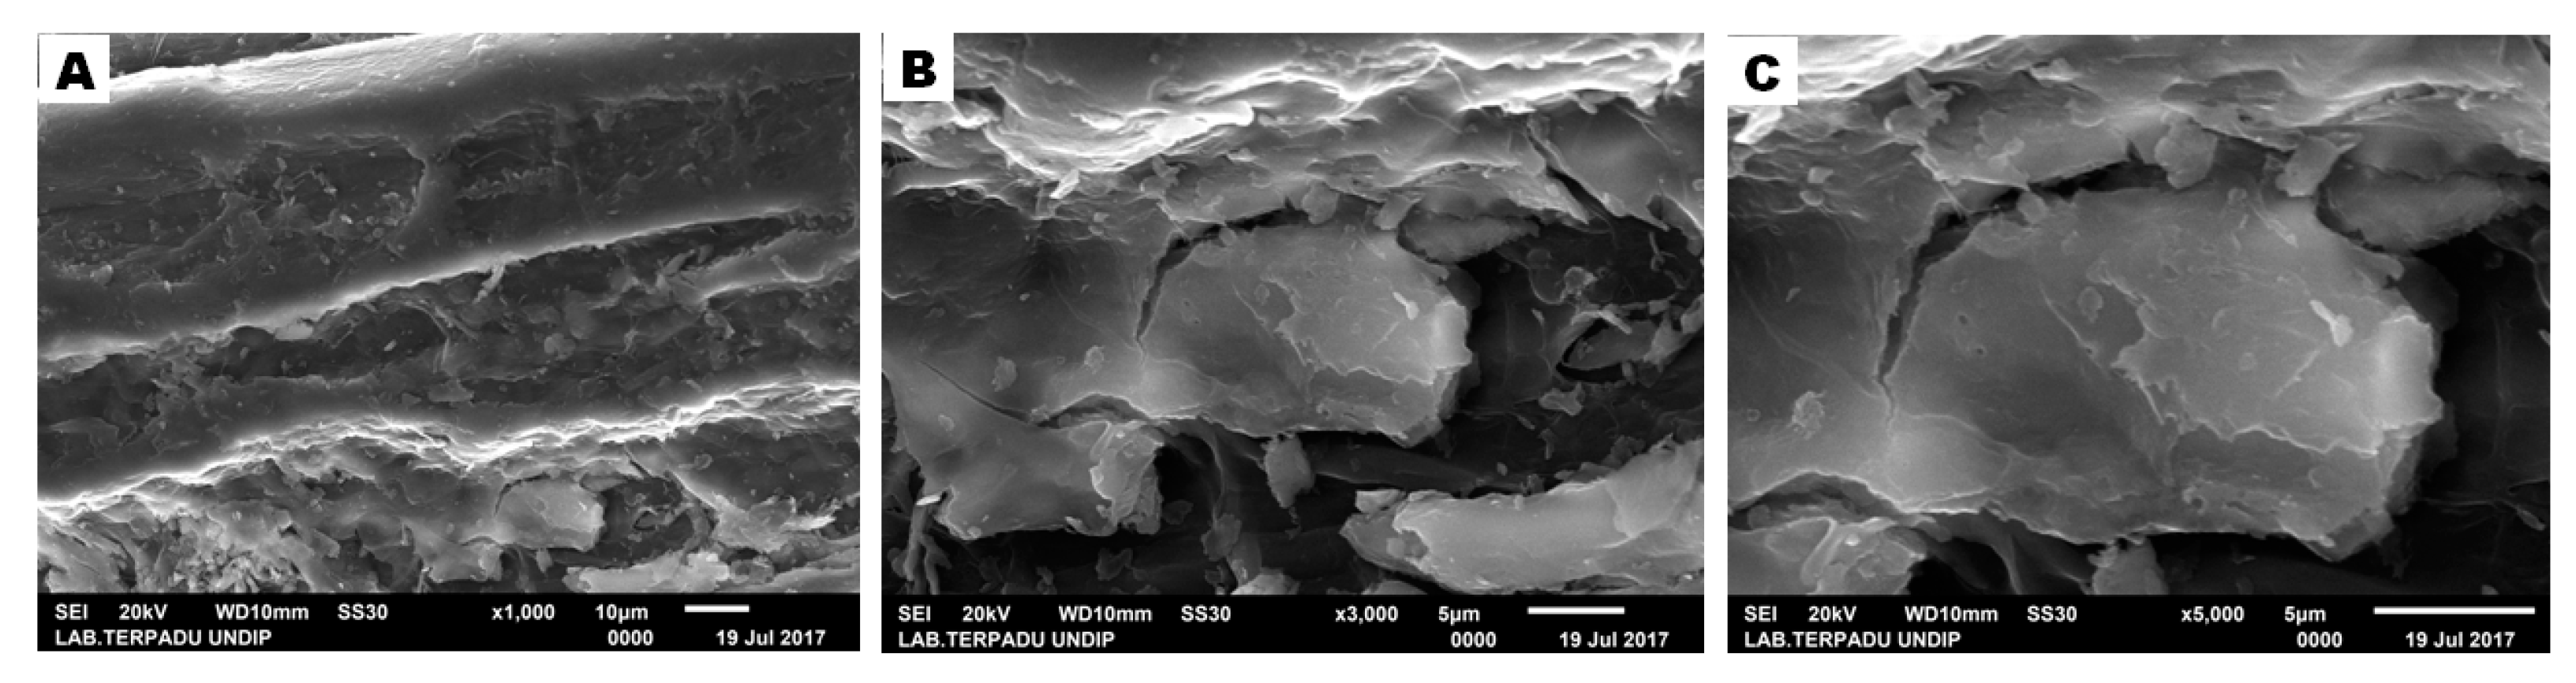
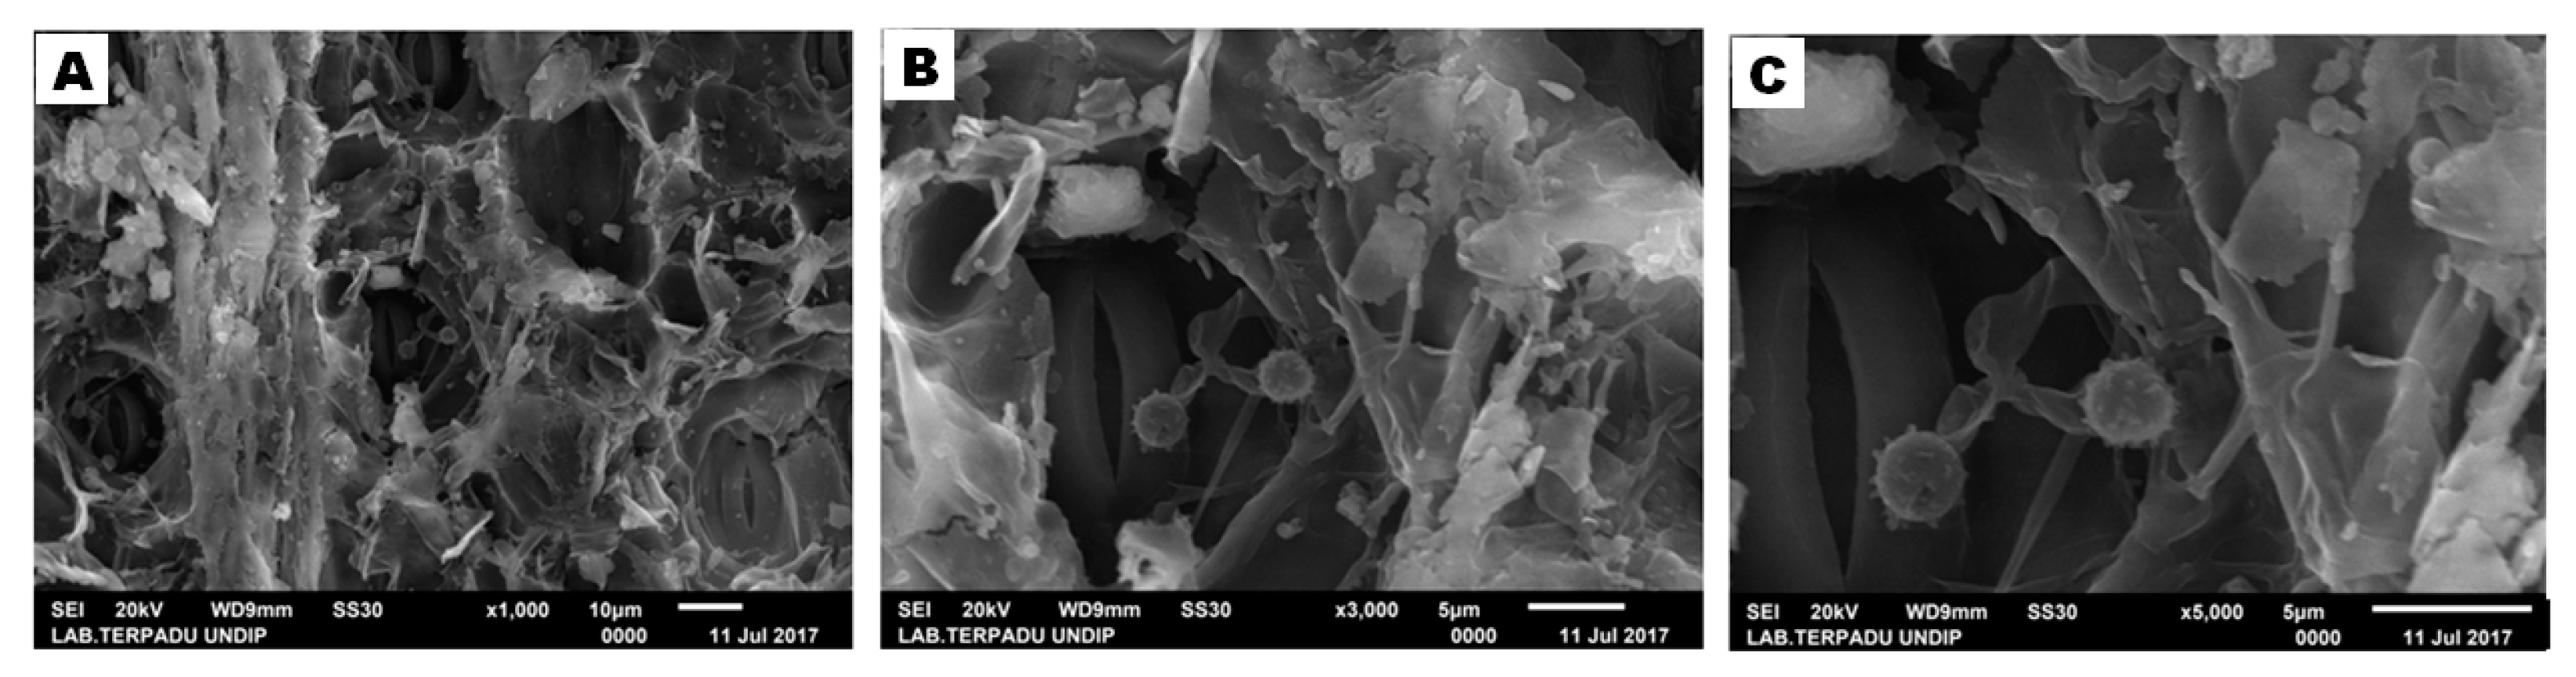
The other result following the absorption and STL is the surface morphology of hemp and kenaf observed by SEM. The observation of surface morphology was needed to obtain the porosity appearance of hemp and kenaf fibers. The differences of SEM results between Hemp and Kenaf fibers are shown in Figure 9 and Figure 10:
SEM is an analytical technique to observe the surface morphology of materials. Figure 9 and Figure 10 show various specimen magnifications, i.e., 1000x, 3000x and 5000x. The figures show that the hemp fiber has few pores and that its channels are largely invisible compared to those in the kenaf fiber. The kenaf fiber tends to have larger pores and channels appearing frequently on its surface (see Figure 9 and Figure 10 above). The results provide the answers to the question of why the Transmission Loss of hemp is much higher than that of kenaf fiber in both the 30 and 15 mm thick samples.
In contrast with the sound transmission loss test, the sound absorption performance of kenaf fiber appears to be significantly higher in frequencies below 1 kHz, while that of of hemp fiber increases starting at 2.7 kHz and reaches a peak at 0.95 at 5.4 kHz. Such a phenomenon occurs because kenaf fiber has big pores and large channels that are clearly visible, giving rise to the ability to absorb and to reflect sound energy much more rapidly than the hemp fiber (see
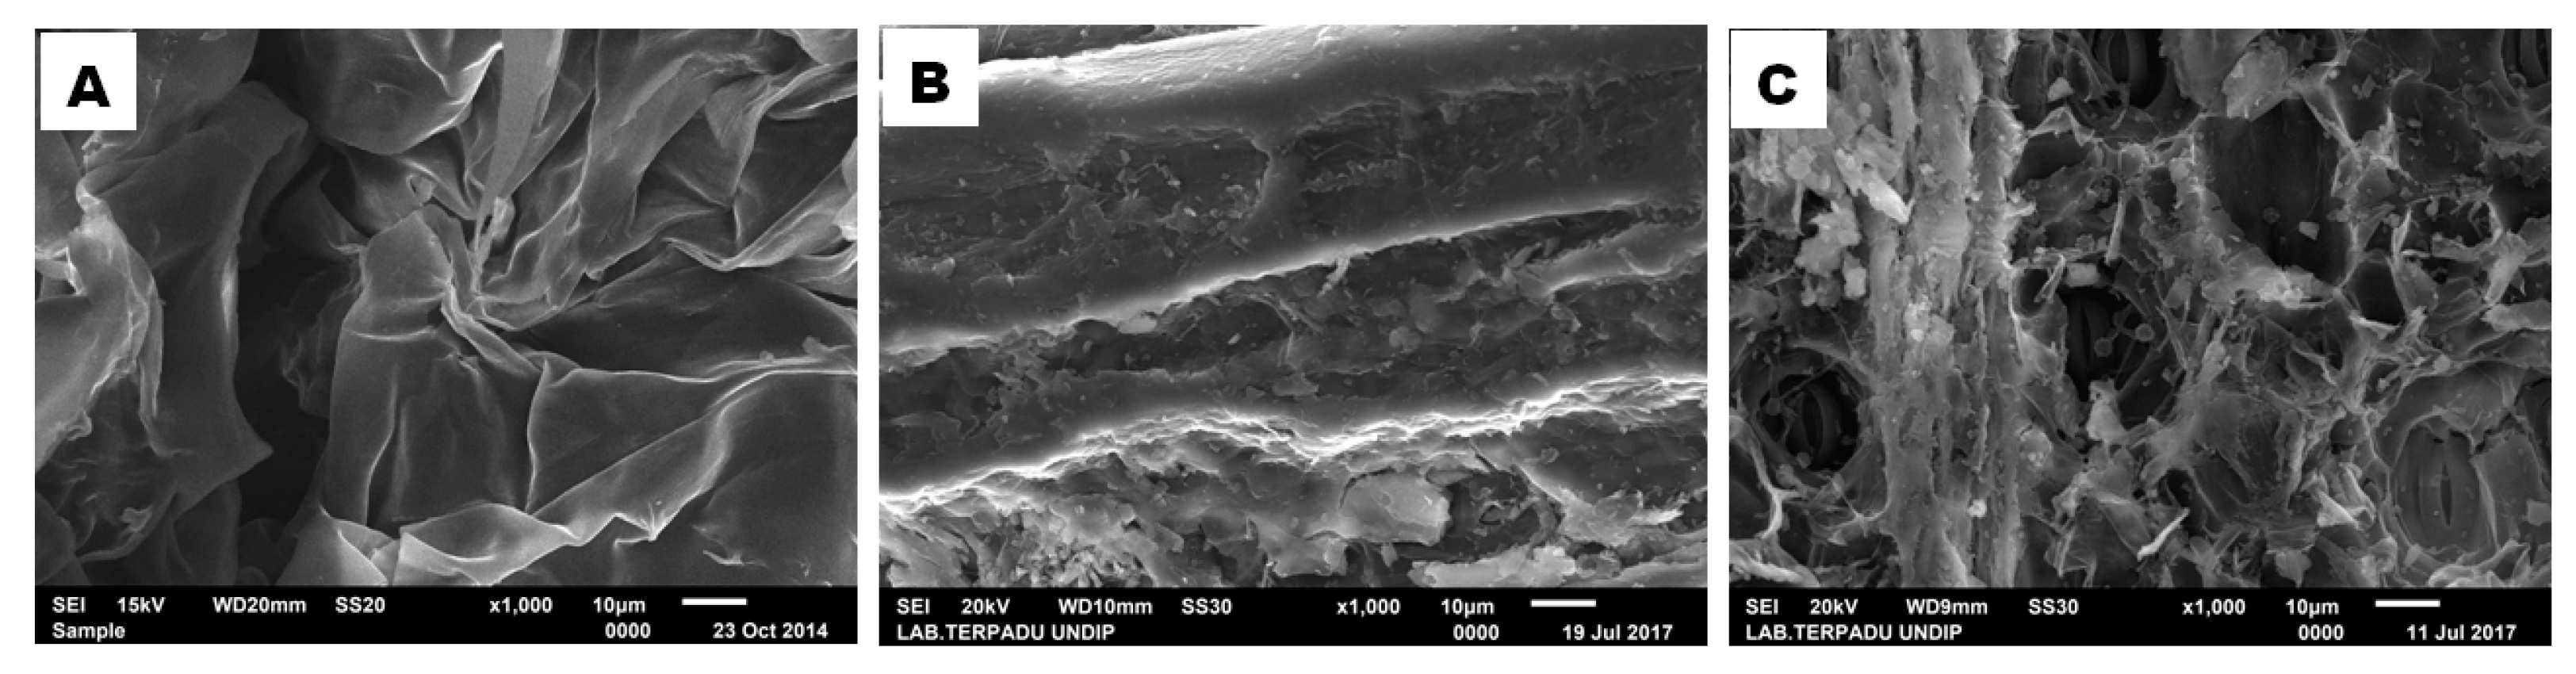
 Figure 9 and Figure 10). SEM images of coco-husk fiber samples look like sheets that curl or overlap each other, which causes the formation of small and long channels with the greatest absorption of sound energy compared to hemp and kenaf fiber samples (see Figure 11). In the SEM images, hemp fibers showed a tight morphology, i.e., large rods stacked so that they appear to have large channels. For the samples of kenaf fiber, the morphology has many pores of various sizes. The sound absorption of hemp fiber shows greater value compared to kenaf fiber, due to the large channels present in the hemp fiber.
The analyses were consistent with other studies [5,36,37,38,39,40,41,42,43]. The SEM analysis is also comparable with the absorption coefficient analysis where the coco-husk sample has the largest absorption coefficient value, followed by hemp fiber and kenaf fiber samples. Each sample has wide broadband with an absorption coefficient above 0.2, which shows the good sound absorption of each test sample. In the STL analysis, hemp fiber samples had the highest sound absorption values compared to coco-husk and kenaf samples. This is due to the fact that hemp fiber has a high density (as seen from SEM images) compared to the other fiber samples. The morphological appearance of this finding can reflect sound absorption more quickly; in contrast, the small and long channels in coco fiber and pores on kenaf fiber have a reflection time from the sound absorbed which is longer, as indicated by their STL value.
Table 6 describes the Oxide content of coco-husk (Cocos nucifera), in which it comprises mostly carbon (C) mass, i.e., about 93.56%. The other contents are 0.42% sodium oxide (Na2O), 0.21% magnesium oxide (MgO), 3.06% potassium oxide (K2O), and 1.34% platinum dioxide (PtO2).
Table 7 reveals that the Bohmeria nivea (Hemp) comprises mostly carbon (C), i.e., as much as 80.45%, with aluminum oxide (Al2O3) at about 0.50%, 0.38% silicon dioxide (SiO2), 1.30% sulfur trioxide (SO3), 10.30% calcium oxide (CaO), 2.11% copper oxide (CuO), 1.32% zinc oxide (ZnO) and 3.64% zirconium oxide (ZrO2).
Table 8 describes the compound of Hibiscus cannabinus (kenaf) as containing mostly carbon, i.e., as much as 87.43% of the entire mass, with 0.61% magnesium oxide (MgO), 2.28% sulfur trioxide (SO3), 1.39% chloride (Cl), 4.64% potassium oxide (K2O), 2.26% copper oxide (CuO) and 1.39% zinc oxide (ZnO).
Table 6, Table 7 and Table 8 describe the compound of coco-husk, hemp, and kenaf respectively. The percentage of carbon in coco-husk is 93.56%, while the carbon compound in hemp and kenaf are 80.45% and 87.43% respectively. If we consider the findings in sound absorption performances of the biomass fiber in Figure 8a, it can be understood that the highest sound absorption performance is the coco-husks, while that of hemp and kenaf tend to be identical. This means that the higher the carbon compound is in biomass fiber, the higher the sound absorption performance. These findings agree with studies carried out by Sambu et al., Mahzan et al., and Cao et al. [36,37,38] as well as studies by Nath and Mishra and Sei [39,40]. However, based on Figure 8a, all of the biomass fibers show good sound absorption behavior due to their wide broadband frequencies. Based on the biomass fiber composites made in this present study, 
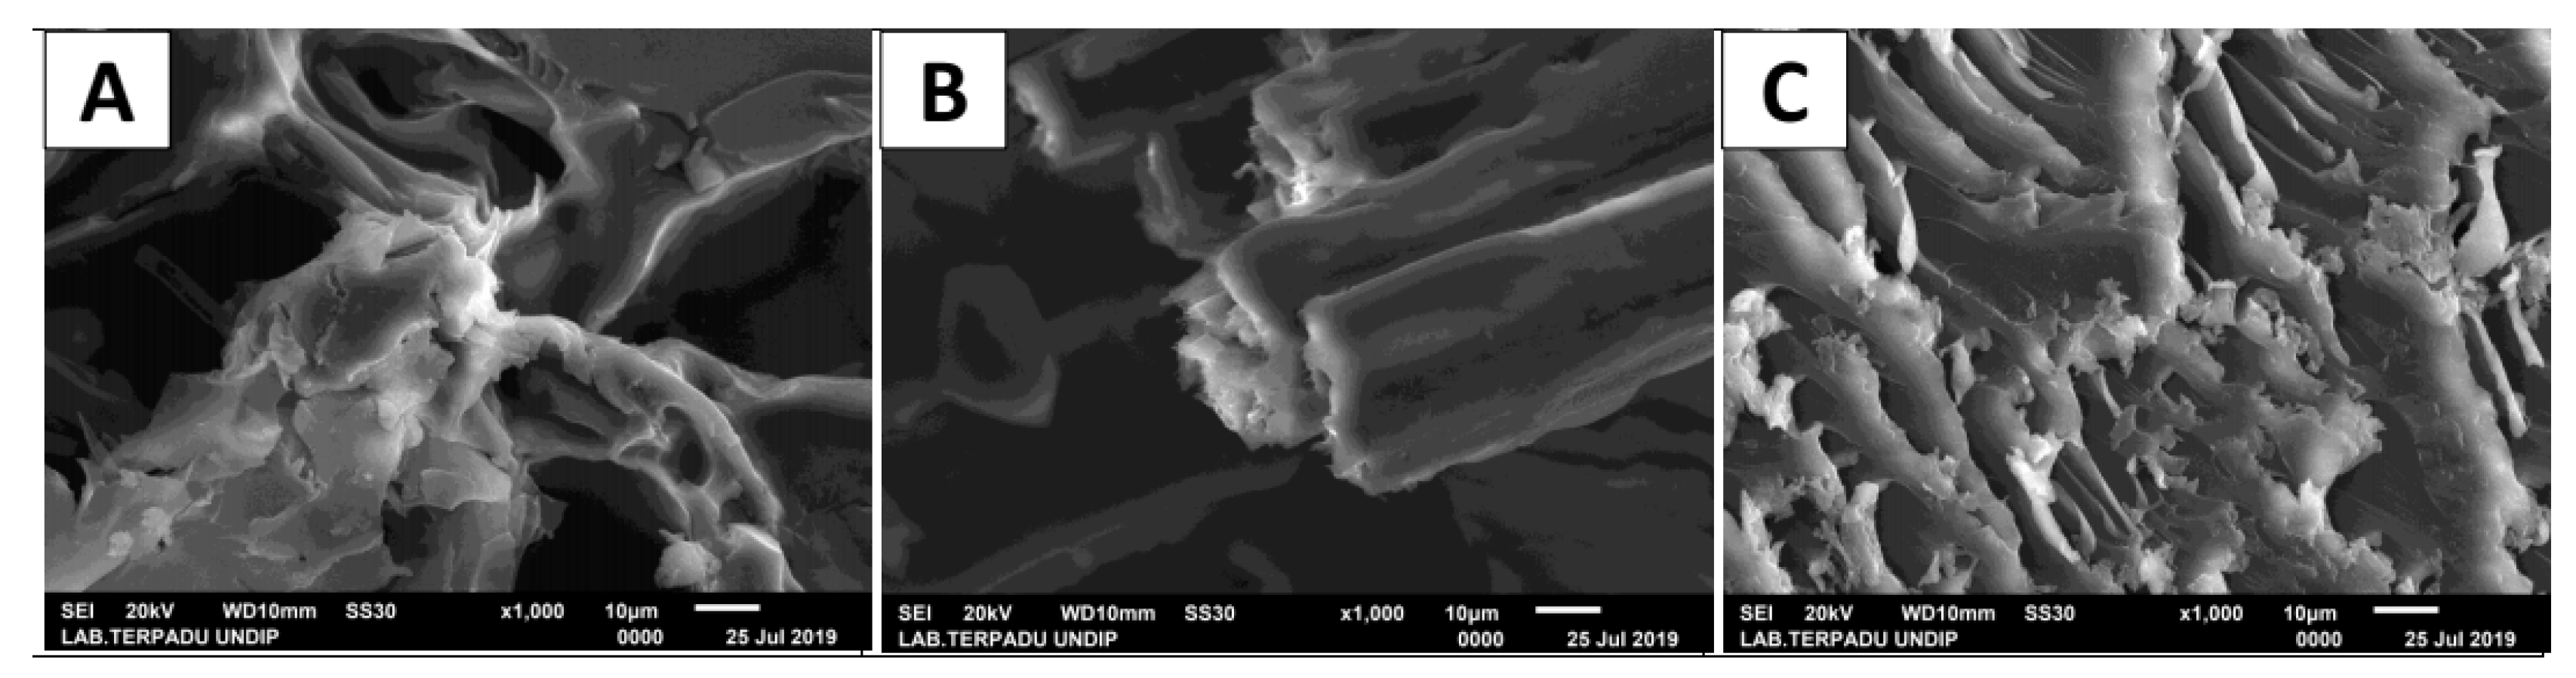
Figure 12 illustrates the SEM of the specimens in which the polymeric resin was reinforced with the biomass fibers consisting of coco-husk, hemp, and kenaf respectively (see Figure 12A–C).
The SEM analysis on the three composites shows that each composite has a porous surface morphology. In Figure 12A (coco), it can be seen that the pore of the coco-husk composite is very large; in the hemp composite, the pore morphology looks small but has a long canal structure, whereas in kenaf, the composite morphology looks almost uniform/regular. The SEM results of the three composites show that the natural fibers of coco and hemp are not homogeneously mixed with polyester resins, as indicated by the results of both SEMs that still appear to have pore morphology. On the other hand, in kenaf composites the morphological structure looks irregular; this shows that the kenaf biomass from the preparation has a smooth material structure in that when mixed with resin to form a composite, the resulting composite will have a high density or little or almost no pores. The SEM analysis on the three composites supports analysis of absorption coefficient and STL, on coco composites where the coco husk filler/biomass pores still have a sound absorption role, apart from the role of cavity which is manually created. The same property is also present in hemp composites, in which pores in the filler/biomass hemp have the role of sound adsorption, apart from the role of cavity which is made manually. On the other hand, in kenaf composites, the acoustical value is in the lowest order compared to the two composite samples, which is caused by the density in morphology (SEM analysis results) looking very tight or having a high density. Accordingly, the ability of absorption and transmission of loss to sound is only influenced by cavity that is created manually.
Table 9, Table 10 and Table 11 describe the EDX analysis of the three composites that show other contents in the Coco and Hemp composites that cover over the presence of K2O in the Coco and Al2O3 composites and CaO in the Hemp composites in addition to the carbon content in each composite. The results show that the Coco and Hemp biomass are not homogeneously mixed with the polyester resin so that the contents of both composites are still detected in the EDX analyses. The identification of the contents was due to the inhomogeneous composing between the polyester resin and either of the Coco fiber or the Hemp fiber (see Table 9 and Table 10). As a result, there are pores in the Coco-husk and Hemp biomass composites; in contrast, in the Kenaf composite, the EDX analysis result showed 100% carbon content without other compounds. It occurred because the polyester resin and the Kenaf fiber were mixed homogeneously indicated by such high carbon compound. It can be concluded that there are no gaps and pores in the Kenaf biomass composite. The analyses support the performance of absorption coefficient and STL, where the Coco and the Hemp composites have higher absorption and STL coefficient values than that of the Kenaf composites.
The materials demonstrated incremental performances on both in sound absorption and sound insulation; therefore, the materials can be considered as acoustic elements in buildings. The tailed cavity inclusion design in the specimen was tested as a sound damper, as stated in the results and discussion session. Hence, the application of these findings can be implemented in building interiors. The rough surface design of the diffuser-absorber proposed in the current research consists of either tubular or cubical elements in an acoustic panel comprising the proposed tailed cavity inclusions. This emphasizes how the panel structure can be made by ordering the tubular or cubical elements having tailed cavities inclusion and how the surface design of the panel can support the diffusivity (see Figure 13, Figure 14 and Figure 15). Figure 13 shows the diffusivity of the surface design of the panel consisting of either tubular or cubical types of panel element having the proposed single and multiple cavities.
To emphasize the term of diffusivity and reflection, Figure 14 and Table 12 describe the reflection performances of the biomass fibers in this current research. Figure 14 illustrates that by the addition of either single and multiple tailed cavities in the specimens, the reflection performance decreased gradually. For example, the 30 mm thick of untreated hemp had a reflection of 0.7778, after the multiple tailed cavities were added, the reflection decreased to be 0.7653. Like hemp, the reflection capability of the 30 mm thick kenaf also decreased from 0.9669 to 0.9271 after multiple tailed cavities were added (see the ‘average’ column of Table 12).
The graph in Figure 14 shows the reflection coefficient of hemp and kenaf representing the biomass fibers, while Table 12 shows the average reflection coefficient of the biomass fibers. The most reflective biomass fiber are 30 mm untreated kenaf followed by 15 mm untreated hemp. The additional tailed cavities in materials cause the reflection performance decrease as seen in average column in the table. This means that the tailed cavity caught a part of the sound energy and insulated it. Due to this phenomenon, it can be concluded that the tailed cavities helped the materials to reduce part of the sound; therefore, the role of the tailed cavity can be considered for materials as a sound damper in many applications.
The findings agree with the previous research [32] and should be considered in interior design in buildings where acoustic performance is a priority. The biomass fibers studied in this research, i.e., coco-husk, hemp, and kenaf, are acceptable as acoustic materials. Figure 15 shows the structural application of the materials as diffuser-absorbers in interior purposes with aluminum frame fitted in the wall. Figure 15 in detail illustrates the details of tubular shaped diffuser absorber. Due to its good acoustic performance in previous research, biomass fibers could be considered as wall treatments in buildings. Combined with a tailed cavity diffuser above it, the panel structure could be an effective wall treatment design to address acoustic failures in building interiors.

4. Conclusions

The treatment of multiple tailed cavities on 30 mm thick hemp fiber specimen can shift the sound absorption performance from high frequencies toward lower frequencies. This phenomenon is ideal for biomass fiber composite materials because the lower the frequencies in terms of the materials and their absorption performances, the wider the broadband frequencies they can absorb. Unlike hemp fibers, the 15 mm thick kenaf fiber has a wider broadband frequency on its sound absorption performance after treatment with a single tailed cavity inclusion. Although the sound absorption peaks of kenaf fiber are not as high as those of hemp fiber, kenaf can nonetheless be considered an acoustic material, especially for interior purposes. The findings are in agreement with other studies by Wang et al., Echeveria et al., and Setyowati et al [32] which concluded that the tailed cavity has function as a Helmholtz resonator and is very effective at absorbing sound energy in wide broadband frequencies [32,44,45].
Unlike sound absorption performances, sound transmission loss behavior tests were influenced by discrepancies in fiber density. Moreover, compared to our previous research on biomass fiber-based panels treated by quarter wavelength resonators, the single-multiple tailed cavity inclusion treatments may become good alternatives to improve the acoustic behavior of materials. The benefits of this study are to increase knowledge about biomass fibers when applied to interior design. Because this study devised its own method for the use of synthetic polymers to reinforce biomass composites, it is recommended that different ways to use biomass fiber composites which are reinforced with natural polymeric contents should be explored.

Author Contributions

Conceptualization, E.S.; Introduction and Methodology, G.H. and E.S.; Visualization map and graphs, P.P.; Analyzing Data and Interpretation, E.S. and P.P.; Documentation and photography, G.H and P.P.; Conclusion, E.S and P.P.

Funding

This research has been funded by the Indonesian Ministry of Research, Technology and Higher Education through the PTUPT Research grant number 257-125/UN7.P4.3/PP/2019 and MP3EI Research grant number 149-06/UN7.5.1/PG/2015.

Acknowledgments

The authors would like to express gratitude and dedicate the work to the Ministry of Research, Technology and Diponegoro University for the opportunity on receiving the research grant. For supporting acoustic data, special gratitude would be given to The Iwany Acoustics Research Group (iARG), colleagues and students of Sebelas Maret University for useful collaborative idea and design of specimens.

Conflicts of Interest

We declare that the grantors did not have any intervention in any part of this research.

Nomenclatures

ASTMAmerican Standard Testing and Material
DPFDate Palm Fiber
CCFCoconut Coir Fiber
AACAcoustic Absorption Coefficient
PALFpineapple-leaf fiber
BC-MPPbiodegradable composite microperforated panel composed
PLApolylatic acid
ISOInternational Organization of Standardization
ATAAcoustic Transmission Analysis
A,BCoco-husk (Cocos nucifera)
C,DHemp (Bohmeria nivea)
E,FKenaf (Hibiscus cannabinus)
8H8 holes of quarter wavelength resonators
H-TailedNumber of hole-tailed cavity inclusions
FRAdditional Fibrous (Dacron) layer
C10mmCavity or air gap (10 mm)
αSound absorption coefficient
STLSound Transmission Loss
B & KBruer & Kjaer, manufacture name of the Impedance Tube to measure and observe the acoustic behavior of material
EDXEnergy Dispersive Spectroscopy (EDS) oxide
ZAFMatrix effect in EDS oxide

References

  1. Setyowati, E.; Yahya, I.; Supriyo, E.; Romadhona, I.C.; Minardi, A. On the Sound Absorption Improvement of Water Hyacinth and Coconut Husk based Fiber Reinforced Polymer Panel. In Proceedings of the 2nd International Joint Conference on Advanced Engineering and Technology (IJCAET 2017) and International Symposium on Advanced Mechanical and Power Engineering (ISAMPE 2017), Bali, Indonesia, 24–26 August 2017; Volume 159, p. 01004. [Google Scholar]
  2. Setyowati, E.; Pandelaki, E.E.; Supriyo, E. The Comparison of treated coco-husk composite and its applications in architectural interior. In Proceedings of the 3rd International Conference on Energy, Environmental and Information System (ICENIS 2018), Semarang, Indonesia, 14–15 August 2018; Volume 73, pp. 7–11. [Google Scholar]
  3. Kim, B.; Park, J. Absorption improvement Double resonant porous structure backed by air cavity for low frequency sound absorption improvement. Compos. Struct. 2017, 183, 545–549. [Google Scholar] [CrossRef]
  4. Setyowati, E.; Satyapratama, A.; Atmadja, S.T.; Hardiman, G. Manufacture of Acoustical One Side-Waffle Panel Made of Natural Resources with Hydraulic Hot Press Machine. J. Teknol. 2014, 78, 289–293. [Google Scholar] [CrossRef]
  5. Lim, Z.; Putra, A.; Nor, M.; Yaakob, M. Sound absorption performance of natural kenaf fibres. Appl. Acoust. 2018, 130, 107–114. [Google Scholar] [CrossRef]
  6. Fouladi, M.H.; Ayub, M.; Nor, M.J.M. Analysis of coir fiber acoustical characteristics. Appl. Acoust. 2011, 72, 35–42. [Google Scholar] [CrossRef]
  7. Ramis, J.; Rey, R.; Alba, J.; Godinho, L.; Carbajo, J. A model for acoustic absorbent materials derived from coconut fiber. Mater. Construcc. 2014, 64, 1–7. [Google Scholar] [CrossRef]
  8. Tang, X.; Zhang, X.; Zhang, H.; Zhuang, X.; Yan, X. Corn husk for noise reduction: Robust acoustic absorption and reduced thickness. Appl. Acoust. 2018, 134, 60–68. [Google Scholar] [CrossRef]
  9. Piégay, C.; Glé, P.; Gourdon, E.; Gourlay, E.; Marceau, S. Acoustical model of vegetal wools including two types of fibers. Appl. Acoust. 2018, 129, 36–46. [Google Scholar] [CrossRef]
  10. Othmani, C.; Taktak, M.; Zein, A.; Hentati, T.; Elnady, T.; Fakhfakh, T.; Haddar, M. Experimental and theoretical investigation of the acoustic performance of sugarcane wastes based material. Appl. Acoust. 2016, 109, 90–96. [Google Scholar] [CrossRef]
  11. Ismail, F.; Rahmat, M.; Ishak, N. Sustainable Absorption Panels from Agricultural Wastes. In Proceedings of the Building Surveying, Facilities Management and Engineering Conference (BSFMEC 2014), Perak, Malaysia, 27 August 2014; Volume 15, p. 1035. [Google Scholar]
  12. Jayamani, E.; Hamdan, S. Sound Absorption Coefficients Natural Fibre Reinforced Composites. Adv. Mater. Res. 2013, 701, 53–58. [Google Scholar] [CrossRef]
  13. Fatima, S.; Mohanty, A.; Mohanty, A. Acoustical and fire-retardant properties of jute composite materials. Appl. Acoust. 2011, 72, 108–114. [Google Scholar] [CrossRef]
  14. Duc, F.; Bourban, P.E.; Plummer, C.J.G.; Månson, J.A.E. Damping of thermoset and thermoplastic flax fibre composites, Compos. Part A Appl. Sci. Manuf. 2014, 64, 115–123. [Google Scholar] [CrossRef]
  15. Asdrubali, F.; Schiavoni, S.; Horoshenkov, K.V. A Review of Sustainable Materials for Acoustic Applications. Build. Acoust. 2012, 19, 283–311. [Google Scholar] [CrossRef]
  16. Chin, D.D.V.S.; Yahya, M.N.B.; Din, N.B.C.; Ong, P. Acoustic properties of biodegradable composite micro-perforated panel (BC-MPP) made from kenaf fibre and polylactic acid (PLA). Appl. Acoust. 2018, 138, 179–187. [Google Scholar] [CrossRef]
  17. Januševičius, T.; Mažuolis, J.; Butkus, D. Sound reduction in samples of environmentally friendly building materials and their compositions. Appl. Acoust. 2016, 113, 132–136. [Google Scholar] [CrossRef]
  18. ALRahman, L.A.; Raja, R.I.; Rahman, R.A. Experimental study on natural fibers for green acoustic absorption materials. Am. J. Appl. Sci. 2013, 10, 1307–1314. [Google Scholar] [CrossRef]
  19. Berardi, U.; Iannace, G. Predicting the sound absorption of natural materials: Best-fit inverse laws for the acoustic impedance and the propagation constant. Appl. Acoust. 2017, 115, 131–138. [Google Scholar] [CrossRef]
  20. Alexopoulou, E.; Christou, M.; Mardikis, M.; Chatziathanassiou, A. Growth and yields of kenaf varieties in central Greece. Ind. Crops Prod. 2000, 11, 163–172. [Google Scholar] [CrossRef]
  21. Khalil, H.A.; Yusra, A.I.; Bhat, A.H.; Jawaid, M. Cell wall ultrastructure, anatomy, lignin distribution, and chemical composition of Malaysian cultivated kenaf fiber. Ind. Crops Prod. 2010, 31, 113–121. [Google Scholar] [CrossRef]
  22. Ramesh, M. Kenaf (Hibiscus cannabinus L.) fibre based bio-materials: A review on processing and properties. Prog. Mater. Sci. 2016, 78, 1–92. [Google Scholar] [CrossRef]
  23. Putra, A.; Or, K.H.; Selamat, M.Z.; Nor, M.J.M.; Hassan, M.H.; Prasetiyo, I. Sound absorption of extracted pineapple-leaf fibres. Appl. Acoust. 2018, 136, 9–15. [Google Scholar] [CrossRef]
  24. Lee, J.; Swenson, G.W. Compact Sound Absorbers for Low Frequencies. Noise Control. Eng. J. 1992, 38, 109. [Google Scholar] [CrossRef]
  25. Lee, F.-C.; Chen, W.-H. Acoustic transmission analysis of multi-layer absorbers. J. Sound Vib. 2001, 248, 621–634. [Google Scholar] [CrossRef]
  26. Zulkifli, R.; Nor, M.M.; Tahir, M.M.; Ismail, A.; Nuawi, M.; Nor, M.J.M. Acoustic Properties of Multi-Layer Coir Fibres Sound Absorption Panel. J. Appl. Sci. 2008, 8, 3709–3714. [Google Scholar] [CrossRef]
  27. Ersoy, S.; Kucuk, H. Investigation of industrial tea-leaf-fibre waste material for its sound absorption properties for its sound absorption properties. Appl. Acoust. 2009, 70, 215–220. [Google Scholar] [CrossRef]
  28. Mohanty, A.K.; Wibowo, A.; Misra, M.; Drzal, L.T. Effect of process engineering on the performance of natural fiber reinforced cellulose acetate biocomposites. Compos. Part A Appl. Sci. Manuf. 2006, 35, 363–370. [Google Scholar] [CrossRef]
  29. Mueller, D.H.; Krobjilowski, A. New Discovery in the Properties of Composites Reinforced with Natural Fibers. J. Ind. Text. 2003, 33, 111–130. [Google Scholar] [CrossRef]
  30. Narang, P.P. Effect of Fiberglass Density and Flow Resistance on Sound Transmission Loss of Cavity Plasterboard Walls. Noise Control. Eng. J. 1993, 40, 215. [Google Scholar] [CrossRef]
  31. Ko, Y.H.; Son, H.T.; Cho, J.I.; Kang, C.S.; Oh, I.H.; Lee, J.S.; Kim, H.M.; Kim, J. Investigation on the Sound Absorption and Transmission for Aluminum Foam and its Composite. Solid State Phenom. 2007, 124, 1825–1828. [Google Scholar] [CrossRef]
  32. Setyowati, E.; Hardiman, G.; Budihardjo, M.A. On the Role of Acoustical Improvement and Surface Morphology of Seashell Composite Panel for Interior Applications in Buildings. Buildings 2019, 9, 71. [Google Scholar] [CrossRef]
  33. ASTM International. American Standard Testing and Material E 1050-98, Standard Test Method for Impedance and Absorption of Acoustical Materials Using Tube Two Microphones and Digital Frequency Analysis System; ASTM International: West Conshohocken, PA, USA, 1998. [Google Scholar]
  34. Tenenbaum, R.A.; Magalhaes, M.B.S.; Zindeluk, M. A new time domain approach to evaluate transmission loss in layered partitions. Int. J. Acoust. Vib. 1998, 3, 68503. [Google Scholar] [CrossRef]
  35. STM International. American Standard Testing and Material E 2611-09 Standard Test Method for Measurement of Normal Incidence Sound Transmission of Acoustical Materials Based on the Transfer Matrix Method; STM International: West Conshohocken, PA, USA, 2009. [Google Scholar]
  36. Sambu, M.; Yahya, M.N.; Latif, H.A.; Hatta, M.N.M.; Bin Ghazali, M.I. Preliminary study on acoustical and physical charachteristics of kenaf (Hibiscus cannabinus) using natural rubber as binder. J. Eng. Appl. Sci. 2016, 11, 2467–2474. [Google Scholar]
  37. Mahzan, S.; Zaidi, A.M.A.; Arsat, N.; Hatta, M.N.M.; Ghazali, M.I.; Mohideen, S.R. Study on Sound Absorption Properties of Coconut Coir Fibre Reinforced Composite with Added Recycled Rubber. Int. J. Integr. Eng. 2009, 2, 29–34. [Google Scholar]
  38. Cao, L.; Fu, Q.; Si, Y.; Ding, B.; Yu, J. Porous materials for sound absorption. Compos. Commun. 2018, 10, 25–35. [Google Scholar] [CrossRef]
  39. Nath, G.; Mishra, S.P. Study of physical and sound absorbing property of epoxy blended coir dust biocomposite. IOP Conf. Ser. Mater. Sci. Eng. 2016, 149, 1–7. [Google Scholar] [CrossRef]
  40. Sei, L.R. Development and Acoustical Analysis Using Kenaf and Coconut Fibres at Different Fibre Loading. Bachelor’s Thesis, Universiti Teknikal Malaysia Melaka, Melaka, Malaysia, 2016. [Google Scholar]
  41. Peng, L.; Song, B.; Wang, J.; Wang, D. Mechanic and acoustic properties of the sound-absorbing material made from natural fiber and polyester. Adv. Mater. Sci. Eng. 2015, 4, 1–5. [Google Scholar] [CrossRef]
  42. Renouard, S.; Hano, C.; Doussot, J.; Blondeau, J.-P.; Lainé, E. Characterization of ultrasonic impact on coir, flax and hemp fibers. Mater. Lett. 2014, 129, 137–141. [Google Scholar] [CrossRef]
  43. Bonnafous, C.; Touchard, F.; Chocinski-Arnault, L. Multi scale analysis by acoustic emission of damage mechanisms in natural fibre woven fabrics/epoxy composites. In Proceedings of the ICEM 14—14th International Conference on Experimental Mechanics, Poitiers, France, 4–9 July 2010; Volume 6, p. 20009. [Google Scholar]
  44. Echeverria, C.A.; Pahlevani, F.; Handoko, W.; Jiang, C.; Doolan, C. Resources, Conservation & Recycling Engineered hybrid fibre reinforced composites for sound absorption building applications. Resour. Conserv. Recycl. 2019, 143, 1–14. [Google Scholar]
  45. Wang, Z.B.; Choy, Y.S. Tunable parallel barriers using Helmholtz resonator. J. Sound Vib. 2018, 443, 109–123. [Google Scholar] [CrossRef]
Figure 1. (a) The biomass: coco-husk, hemp, and kenaf respectively; (b) specimens with tailed cavity treatment.
Fibers 07 00085 g001
Figure 2. A section of the impedance tube with four microphones, as used in the sound transmission loss test.
Fibers 07 00085 g002
Figure 3. Biomass fiber with: (a) single; (b) multiple tailed cavity inclusion.
Fibers 07 00085 g003
Figure 4. (a) The position of sample in the B&K impedance tube; (b) Sound trapping phenomenon in tailed cavity inclusion.
Fibers 07 00085 g004
Figure 5. (a) STL of untreated Biomass Fiber specimens; (b) Comparison of STL of Biomass fiber reinforced polyester with single and multiple tailed cavity inclusion.
Fibers 07 00085 g005
Figure 6. Absorption Comparison of coco-husk fiber with wavelength resonator and Hemp-Kenaf with Tailed Cavity inclusion.
Fibers 07 00085 g006
Figure 7. Absorption Comparison of coco-husk fiber reinforced polyester between previous research and present study.
Fibers 07 00085 g007
Figure 8. Absorption comparison of coco-husk fibers in previous research and biomass materials with tailed cavity inclusion.
Fibers 07 00085 g008
Figure 9. Result of SEM EDX of hemp fiber with magnification of: (A). 1000x; (B). 3000x, and (C) 5000x.
Fibers 07 00085 g009
Figure 10. Result of SEM EDX of kenaf fiber with magnification of: (A). 1000x; (B). 3000x, and (C) 5000x.
Fibers 07 00085 g010
Figure 11. Comparison of 1000X SEM EDX of: (A). Coco-husk; (B). Hemp; (C) Kenaf.
Fibers 07 00085 g011
Figure 12. Comparison of 1000X SEM EDX of resin reinforced biomass: (A). Coco-husk; (B). Hemp; (C). Kenaf.
Fibers 07 00085 g012
Figure 13. The diffusivity on the surface design of the panel due to reflection.
Fibers 07 00085 g013
Figure 14. The reflection performances of Hemp and Kenaf.
Fibers 07 00085 g014
Figure 15. The application of hemp and kenaf on the interior purposes in buildings.as wall panel.
Fibers 07 00085 g015
Table 1. The three kinds of biomass fiber specimens under observation.
Biomass FibersDiameterThicknessCode
Coco-husk (Cocos nucifera)30 mm15 mmA
30 mmB
Hemp (Bohmeria nivea)15 mmC
30 mmD
Kenaf (Hibiscus cannabinus)15 mmE
30 mmF
The Code of Treatments
8H8 holes of quarter wavelength resonators
H-TailedNumber of hole-tailed cavity inclusions
FRAdditional fibrous Dacron layer
C10mmCavity or air gap (10 mm)
Table 2. The epoxy resin-reinforced biomass fiber-based specimens.
Biomass Fiber SpecimenThickness (cm)Volume (cm3)Mass (grams)Density (g/cm3)Average Density (g/cm3)
Cocos nucifera (coco-husk)1.500010.598010.00000.94400.9910
1.500010.598011.00001.0380
3.000021.195018.00000.84900.8725
3.000021.195019.00000.8960
Bohmeria nivea (Hemp)1.500010.598013.00001.22701.2740
1.500010.598014.00001.3210
3.000021.195018.00000.84900.8490
3.000021.195018.00000.8490
Hibiscus cannabinus (Kenaf)1.500010.59807.00000.66100.7080
1.500010.59808.00000.7550
3.000021.195017.00000.80200.8255
3.000021.195018.00000.8490
Table 3. Average Sound Absorption of Biomass Fiber Materials with Single Tailed Cavity.
Biomass FibersN TotalAverageStandard DeviationMinimumMedianMaximum
A07760.18850.1990−0.14800.11190.8503
A1HTailed7760.24220.2133−0.03000.18720.9258
C07760.06810.0364−0.01710.07900.1088
C1HTailed7760.08440.01810.01980.08090.1234
E07760.16810.15590.03200.10960.9083
E1HTailed7760.23870.12060.02080.20130.8319
Table 4. Average Sound Absorption of Biomass Fiber Materials with Multiple Tailed Cavities.
Biomass FibersN TotalAverageStandard DeviationMinimumMedianMaximum
B07760.16550.0938−0.18270.14900.4226
B2HTailed7760.25620.2213−0.02630.15240.9935
D07760.27970.2764−0.30020.15900.8841
D2HTailed7760.33570.19070.03770.24420.8200
F07760.03090.0405−0.05900.03740.0866
F2HTailed7760.09830.02230.01850.09890.1434
Table 5. The comparison of average sound transmission loss of biomass fiber materials.
Biomass FibersAverage STL of 15 mm Thick SpecimensIncrement Percentage (%)Average STL of 30 mm Thick SpecimensIncrement Percentage (%)
UntreatedSingle Tailed Cav.UntreatedMultiple Tailed Cav.
Coco-husk54.871955.66581.446855.676557.23732.8033
Hemp56.680458.20762.694458.207861.16225.0756
Kenaf54.959457.18394.047557.200960.54935.8538
Table 6. Oxide of Coco-husk (Cococs nucifera).
ZAF Method Standardless Quantitative Analysis(Oxide)
Fitting Coefficient: 0.0444
Total Oxide: 24.0
Element(keV)Mass%SigmaMol%CompoundMass%CationK
C K0.27793.560.2998.86C93.560.0092.3207
O 0.90
Na K1.0410.310.030.09Na2O0.425.740.3604
Mg K1.2530.130.030.07MgO0.212.230.1271
Cl K2.6211.400.030.50Cl1.400.002.2266
K K3.3122.540.060.41K2O3.0627.723.5238
Pt K2.0481.150.070.08PtO21.342.521.4414
Total 100.00 100.00 100.0038.21
Table 7. Oxide of Hemp (Bohmeria nivea).
ZAF Method Standardless Quantitative Analysis (Oxide)
Fitting Coefficient: 0.0401
Total Oxide: 24.0
Element(keV)Mass%SigmaMol%CompoundMass%CationK
C K0.27780.450.0695.94C80.450.0076.9865
O 5.79
Al K1.4860.270.030.07Al2O30.500.660.3554
Si K1.7390.180.040.09SiO20.380.420.2783
S2.3070.520.040.23SO31.301.080.8855
Ca K3.6907.360.072.63CaO10.3012.1913.1196
Cu K8.0401.690.090.38CuO2.111.762.5160
Zn K8.6301.060.100.23ZnO1.321.071.5721
Zr K2.0422.700.090.42ZrO23.641.964.2866
Total 100.00 100.00 100.0019.14
Table 8. Oxide of Kenaf (Hibiscus cannabinus).
ZAF Method Standardless Quantitative Analysis (Oxide)
Fitting Coefficient: 0.0588
Total Oxide: 24.0
Element(keV)Mass%SigmaMol%CompoundMass%CationK
C K0.27787.430.3697.62C87.430.0084.3452
O 3.12
Mg K1.2530.370.040.20MgO0.611.850.4216
S K2.3070.910.080.38SO32.283.501.6140
Cl K2.6211.390.040.52Cl1.390.002.7164
K K3.3123.850.090.66K2O4.6412.106.6288
Cu K8.0401.810.140.38CuO2.263.502.6469
Zn K8.6301.120.140.23ZnO1.392.101.6272
Total 100.00 100.00 100.0023.05
Table 9. The Oxide of resin reinforced Coco-husk (Cococs nucifera).
ZAF Method Standardless Quantitative Analysis(Oxide)
Fitting Coefficient: 0.0351
Total Oxide: 24.0
Element(keV)Mass%SigmaMol%CompoundMass%CationK
C K0.27799.390.0499.92C99.390.0099.4888
O 0.10
K K3.3120.510.020.08K2O0.6148.000.5112
Total 100.00 100.00 100.0048.00
Table 10. The Oxide of resin reinforced Hemp (Bohmeria nivea).
ZAF Method Standardless Quantitative Analysis(Oxide)
Fitting Coefficient: 0.0378
Total Oxide: 24.0
Element(keV)Mass%SigmaMol%CompoundMass%CationK
C K0.27799.210.0599.88C99.210.0099.5494
O 0.32
Al K1.4860.260.040.06Al2O30.5011.760.2275
Ca K3.6900.210.030.06CaO0.306.360.2232
Total 100.00 100.00 100.0018.12
Table 11. The Oxide of resin reinforced Kenaf (Hibiscus cannabinus).
ZAF Method Standardless Quantitative Analysis(Oxide)
Fitting Coefficient: 0.0258
Total Oxide: 24.0
Element(keV)Mass%SigmaMol%CompoundMass%CationK
C K0.277100.000.24100.00C100.000.00100.00
O 0.00
Total 100.00 100.00 100.000.00
Table 12. Average of reflection coefficients of Hemp and Kenaf.
Biomass FiberN TotalAverageStandard DeviationMinimumMedianMaximum
30mm Untreated Hemp7760.77780.20810.32830.86061.1164
30mm Hemp 2 TC7760.76530.13890.38450.85650.9002
15mm Untreated Hemp7760.95940.02120.81910.95621.0026
15mm Hemp 1 TC7760.95130.01390.82900.95520.9663
30mm Untreated Kenaf7760.96690.02410.81330.97251.0026
30mm Kenaf 2 TC7760.92710.02040.81060.92360.9610
15mm Untreated Kenaf7760.69530.2613−0.13240.77400.9315
15mm Kenaf 1 TC7760.68250.2084−0.11750.82510.9197

