Hollow-Core Fiber Technology: The Rising of “Gas Photonics”


1
GPPMM Group, XLIM Research Institute, CNRS UMR 7252, University of Limoges, 87060 Limoges, France
2
Department of Engineering “Enzo Ferrari”, University of Modena and Reggio Emilia, I-41125 Modena, Italy
*
Author to whom correspondence should be addressed.
Fibers 2019, 7(2), 16; https://0-doi-org.brum.beds.ac.uk/10.3390/fib7020016
Submission received: 19 November 2018
/
Revised: 16 January 2019
/
Accepted: 18 January 2019
/
Published: 18 February 2019
(This article belongs to the Special Issue Hollow Core Optical Fibers)
Abstract
:Since their inception, about 20 years ago, hollow-core photonic crystal fiber and its gas-filled form are now establishing themselves both as a platform in advancing our knowledge on how light is confined and guided in microstructured dielectric optical waveguides, and a remarkable enabler in a large and diverse range of fields. The latter spans from nonlinear and coherent optics, atom optics and laser metrology, quantum information to high optical field physics and plasma physics. Here, we give a historical account of the major seminal works, we review the physics principles underlying the different optical guidance mechanisms that have emerged and how they have been used as design tools to set the current state-of-the-art in the transmission performance of such fibers. In a second part of this review, we give a nonexhaustive, yet representative, list of the different applications where gas-filled hollow-core photonic crystal fiber played a transformative role, and how the achieved results are leading to the emergence of a new field, which could be coined “Gas photonics”. We particularly stress on the synergetic interplay between glass, gas, and light in founding this new fiber science and technology.
1. Introduction
In the last twenty years, photonics has witnessed the advent of a new type of optical fibers named hollow-core photonic crystal fibers (HCPCF) [1], and has led to a huge progress in understanding the underlying physics of the guidance mechanisms, in its technology and in their applications. Indeed, HCPCF has been a unique platform for the demonstration of photonic bandgap guidance, the development of new conceptual tools such as “photonic tight binding” model to explain how these photonic bandgaps are formed in microstructured optical fibers [2], or the inception of “Inhibited Coupling” guidance, which is the fiber–photonic analog of bound state in continuum [3,4]. Furthermore, the motivation of fabricating HCPCF with exquisite control of its nanometric glass features has led to new fabrication techniques [5]. Finally, the ability to functionalize these fibers by introducing a fluid in its hollow-core to form photonic microcells (PMC) [6] proved to be a transformative and differentiating force in various fields [7].
In the course of the HCPCF continuing development process, a new landscape of research and technology, whose scope lies at the frontier of several fields, emerged, and is continuing to develop. These fields stand out by their variety and large range as they span from photonics, nonlinear and ultrafast optics, plasma physics, high optical field physics, atom and molecular optics, cold atom, lasers, telecommunications, and frequency metrology to micromachining and surgery. Despite this diversity and complexity, the landscape can be broken down into two main poles, which underpin all the aforementioned fields. The first one entails the research activities on the science and technology of HCPCF. It comprises the design and the fabrication processes of HCPCF and their derivative components, and which has witnessed not only a huge improvement in the fiber fabrication technology, but the development of novel concepts in the optical guidance mechanisms that is reshaping the field of guided optics. The second pole entails the HCPCF-based applications. Here, it was shown in a number of demonstrations that the combination of a HCPCF, a filling gas phase medium, and a judiciously chosen electromagnetic excitation are sufficient to provide a versatile and powerful tool to make various photonic components. These range from frequency convertors [8,9,10,11], supercontinuum generators [12,13], frequency standard cells [6,14], pulse compressors [15,16,17], high-power and high energy laser beam delivery cables [17], lasers [18,19,20] to quantum sensors, sources and memories [21,22,23], and even Raman gas spectroscopy for chemistry [24].
Remarkably, despite the variety of the aforementioned demonstrations, this landscape is chiefly built upon only three elements, which are gas, glass, and light. In a unique synergetic relationship, each one of these three elements plays a central role in controlling and structuring one of the two other elements. Figure 1a illustrates this synergetic “interfeeding” cycle between gas, glass, and light. Three representative examples on how to structure either of them are as follows. (i) Structuring glass with gas—In the process of HCPCF fabrication, one can shape the cladding glass structure by simply revisiting the glass blowing technique [5]. Here, the fiber cladding and core holes are pressurized with an inert gas (see Figure 1a) to achieve the desired fiber geometry whose features include glass web with nanometer scaled thickness and shapes as complex as the hypocycloidal core-contour (also called negative curvature), which strongly impacted the transmission performance in inhibited coupling guiding HCPCF (IC-HCPCF) [25,26]. (ii) Structuring light with glass—In turn, the HCPCF cladding nanostructured glass results in structuring the modal spectrum of the cladding modes so as to exhibit in the effective index and frequency space (i.e., space) specific regions with no propagating modes (i.e., photonic bandgap) or with a continuum of modes whose transverse profile and spatial localization render their coupling to some core guided modes close-to-forbidden (i.e., inhibited coupling) (see Figure 1b). This structured modal spectrum allows ultralow loss optical guidance in hollow-core defects, and where the spatial optical profile of the guided mode can reach in IC-HCPCF an extremely low overlap with the cladding that led to the demonstration of ultrashort pulse (USP) energy handling up to millijoule energy level, and with a potential to withstand up to a joule level USP. It is noteworthy that this level of energy handling by the HCPCF implies the ability of engraving glass, which is the constitutive material of the fiber (see Figure 1e). (iii) Structuring gas with light—Finally, demonstrations have shown that light can also be used to structure the gas inside HCPCF. Among these, we count the generation of ionized gas plasma column generation in a HCPCF with microwave nonintrusive excitation [27] (see Figure 1d), or the nanostructuring of Raman gas [28] (see Figure 1c) or ultracold atoms [29] with particular optical excitation.
What is noteworthy in some of these applications mentioned above is the ability of HCPCF to microconfine light and gases in extreme regimes. For example, laser intensity levels of PW/cm2 and laser fluence that is several orders of magnitude larger than the silica laser damage threshold [17] are now generated and guided in HCPCF. The largest fiber transmission window is demonstrated via the generation of an optical Raman comb as wide as more than five octaves in hydrogen-filled HCPCF [10] (see Figure 1f), whilst the generation and guidance of high energy single-cycle compression was achieved thanks to HCPCF specific dispersion profile [16]. Conversely, HCPCF has proved to harbor gas media well beyond their common gas phase state such as the generation and microconfinement of ionized gas exhibiting high-power and electron densities combined with temperatures as high as 1000 K without damage to the structural integrity of the fiber [27], or the microconfinement of ultracold atoms with no collision with the micrometric core inner-wall. Finally, structuring molecular gas into an array of nanolayers has recently been demonstrated with hydrogen-filled HCPCF to create a new Lamb-Dicke-stimulated Raman scattering [28].
In this review, we present the major events that led to the development of HCPCF such as the key and seminal results and concepts. By highlighting the synergetic interplay between gas, glass, and light, we describe the contour of a research field landscape, which could be coined as “Gas Photonics”, that is currently emerging thanks to the enabling power of HCPCF technology. We start by quickly reviewing the PCF fabrication process and the different microstructured fibers made in this way, and underlining the role of gas in successfully achieving intricate glass microstructures. Secondly, we show how the resulted cladding geometrical structure is exploited to engineer cladding modal spectrum, and thus to achieve the desired fiber guidance properties. In a subsequent section, we present the modal properties of the cladding defect (i.e., fiber core), by highlighting the salient features of the core fundamental mode such as its dispersion, its overlap with the silica, and how these properties differ between PBG-guiding HCPCF and IC-guiding HCPCF. The following sections of the review are dedicated to the applications, where we provide a nonexhaustive but illustrative list of the different applications that have been demonstrated in the last two decades.
2. Historical Overview of HCPCF
Photonic crystal fibers (PCF) [1]—optical fibers whose cladding is microstructured—were first reported in late 90s and are fabricated using an original process called “stack-and-draw” technique [32]. The versatility of this process and its ability to tailor the cladding modal spectrum by judiciously designing the cladding structure offered a platform to develop optical fibers with various core and claddings designs, and enabled novel optical guidance mechanisms and fibers with unprecedented linear and nonlinear properties. In turn, PCF has proved to be an excellent photonic component for multiple applications in varied fields such as supercontinuum generation in nonlinear optics, gas-based optics, and nonlinear optics [7].
Figure 2 illustrates, in a tree diagram, the PCF family and its diversity from the standpoint of the fiber structural designs, constitutive materials or the physics underlying their guidance mechanisms. If we had to classify these fibers by their structural architecture, we can identify two main families—solid-core and hollow-core fibers—each of them can be divided in several ways. For example, they can be classified by one of the three guidance mechanisms, which are (i) Modified Step Index (MSI), (ii) Photonic Bandgap (PBG), and (iii) Inhibited Coupling (IC). The fibers can also be categorized via their cladding geometry. The latter outstands with the impressive variety that can be found in each guidance mechanism, and the optical properties that can address. Among these, we can highlight the endlessly single-mode (ESM) fiber [33], which enables optical guidance in a single mode fashion regardless of the wavelength. This in turn led to the large mode area (LMA) single mode fibers [34], and subsequently to high-power fiber lasers [35]. The PCF tree diagram also shows other designs that were developed such as enhanced birefringence (Hi-Bi) fibers [36], dispersion compensation PCF (Disp-Comp) [37], all-solid PBG-guiding PCF [38], solid-core IC-guiding PCF [39], and hybrid guidance PCF [40] to mention a few. Finally, we can record PCF via their constitutive materials. Here, whilst silica remains the dominant material used, a lot of effort is currently undertaken to use alternative materials such as soft glass or chalcogenides [41,42] mainly driven by either further enhancing optical nonlinearities in PCF or extending their transmission well beyond the silica transparency window.
Within this family, PCFs with a hollow-core defect [1] stand out from the rest of the PCFs because their optical guidance cannot rely on the conventional total internal reflection (TIR). As such, HCPCF was the fiber design of choice to explore novel guidance mechanisms such as PBG or IC, and whose main principles stem no longer from guided optics but from quantum mechanics or solid-state physics. The notion of PBG was first proposed by John [43] and Yablonovitch in 1987 [44,45]. This work represents a paradigm shift in optics, which led to a powerful conceptual transfer from quantum mechanics and solid-state physics to optics. Particularly, light propagation, confinement, and generation in dielectric microstructures, coined photonic crystals, is now casted as an eigenvector problem in a similar manner to solving Schrodinger equation and reconstructing the electronic energy diagram of a crystal.
In 1995, Philip St. J. Russell and coworkers extended this approach to optical fiber [32]. Here, the authors show for the first time the possibility for a fiber cladding structure made of silica and air holes to exhibit regions of the -space that are void of any propagating modes (i.e., PBG) and that extend below the air-line. This means that air guidance is possible within the PBG region because of the absence of cladding modes to which a core-guided mode could couple to.
The proof of principle of fabricating a HCPCF was first reported by Cregan et al. in 1999 [1]. HCPCFs with sufficiently low loss were reported in 2002 [46,47]. The first one consisted of Kagome lattice HCPCF with ~1 dB/m, reported by Benabid et al. [46]. The second one, consisted with unambiguously PBG-guiding HCPCF by Corning, reported only few months later than reference [46] in a post-deadline paper in ECOC [47]. The fiber exhibited a transmission loss figure of 13 dB/km at 1500 nm and a cladding structure with then the largest air-filling fraction. This was a strong evidence of the concept of out-plane PBG proposed by P. St. J. Russell [48]. To date, the lowest transmission loss recorded for HCPCF is set at 1.2 dB/km at 1620 nm reported by Roberts et al. [49]. It is noteworthy that the Kagome lattice HCPCF, which outstands with a broadband guidance from Ultraviolet (UV) to Infrared (IR), does not guide via PBG despite exhibiting the lowest loss when it was first reported. Also, this loss figure was lower than predicted by Fresnel reflection in a capillary [50] or by antiresonant reflecting optical waveguide (ARROW) [51] to explain how light is guided in such a fiber. It was shown later that the fiber guides thanks to the strong coupling inhibition between core and cladding modes, leading to the term of IC guidance mechanism. Such a cohabitation between a core-guided mode (even though leaky) and cladding mode continuum, which has raised a lot of questions within the fiber optics community, stem from quantum mechanics. In 1929, Von Neumann and Wigner theoretically demonstrated that electronic bound states with positive energy can exist for a particular potential profile [3], thus leading to the notion of bound state in a continuum (BIC) [52]. Consequently, IC guidance mechanism, proposed by Benabid and coworkers in 2007 [4], is the fiber photonics analog of Von Neumann and Wigner BIC. Though it is important to stress that in Kagome HCPCF, the core-guided modes are not strictly “bound”; consequently, the guided modes of IC-HCPCF are referred as quasi-BIC (QBIC). In a following section below, we detail the nature of interaction between a core and cladding modes using the IC model. The latter proved to be a very powerful design tool, as it led to the advent of IC-HCPCF with hypocycloidal core-contour [25,26], also renamed negative curvature fiber [53,54]. This in turn, led to a renewed interest in HCPCF fabrication and design, which is illustrated by the proposal of cladding structures having hypocycloid core-contour, such as the tubular lattice cladding [53,55] and their modified versions [56,57,58,59,60]. This renewal in IC-HCPCF is also illustrated by the continuous and dramatically rapid decrease in their transmission loss. The progress is such that the loss reduction in IC-HCPCF has been decreasing at an average rate per year of 20 dB/km since 2011, and that today IC-guiding HCPCF, which previous typical loss figure was in the range of 0.5 to 1 dB/m, outperforms PBG-guiding HCPCF in wavelengths shorter than 1500 nm. Indeed, the loss figure has dropped from ~180 dB/km in the first negative curvature HCPCF reported in 2010 and 2011 [25,26], to 40 dB/km at 1550 nm in 2012 [61], 70 dB/km at ~780 nm [62], and 17 dB/km at ~1 µm [63] in 2013, and 70 dB/km in a 500 to 600 nm wavelength range [64] in 2014. Today’s state of the art sets the loss figures in IC-HCPCF at below the 10 dB/km limit. For example, a reported hypocycloid core-contour Kagome HCPCF has been shown to have a loss as low as 8.5 dB/km at approximately 1 μm recently [65], and a tubular HCPCF to exhibit 7.7 dB/km at around 750 nm [30], and more recently, a modified tubular HCPCF is reported to show 2 dB/km transmission loss at the vicinity of 1500 nm [58]. Furthermore, the work in References [30,65] shows that the short wavelength (<1 μm) attenuation in these IC-HCPCF is limited by surface scattering loss (SSL) due to the capillary wave induced surface roughness, while for longer wavelength, improving the transmission will be determined by the cladding design. The details of this will be given in the next section.
In parallel with this continuous progress in the design and fabrication of HCPCF, this type of fiber has been the building block in a number of gas-laser related applications [7]. Among the salient features of these demonstrations is the generation of optical nonlinear effects with ultralow light level or the excitation with high signal-to-noise ratio of extremely weak spectroscopic signatures thanks to the fiber long interaction length and the small modal areas. Conversely, IC-HCPCF proved to handle unprecedentedly high level of laser pulse energy [31]. A relatively detailed account of these applications is given in a following section below.
3. HCPCF Fabrication Process: Using Gas to Nano- and Microstructure Glass
Fabricating microstructured optical fiber can be traced back to 1974 when Corning proposed an extrusion method to develop thin honeycomb structure thanks to extrudable material pushed through specific dies [66]. This extrusion technique was initially used during the very first attempts in making PCF. However, its impact on the PCF development was very weak because of the difficulty of the process, especially with hard materials such as silica and the surface roughness that it imprints on the extruded material. On the other hand, the explosive development of PCF was driven by then a new fabrication process coined “stack-and-draw” [67]. This technique has very quickly become widespread and most commonly used in the fabrication of microstructured optical fibers. It consists of a sequence of drawing rods or capillaries with typically a millimeter diameter and a meter in length and stacking them together by hand to form a “stack”. The latter can be constructed into several forms depending on the final fiber design. Once the stack is built, it is drawn into preform canes, which are subsequently drawn into fibers. Figure 3a illustrates this sequence of stack and draw. One can readily notice the versatility and simplicity of this technique, which were the enabling factors in the development of the myriad of PCF designs that the scientific community gets to distinguish. Indeed, by simply judiciously stacking tubes or rods one can form different fiber microstructured architecture, and this hold for any material.
Similarly, HCPCF, which is the topic of this review, are fabricated using stack-and-draw technique. However, because of the small thickness of the glass web that forms either the stack, the preform or the fiber, the stress on the material, which is induced via surface tension and the viscoelastic effect is too strong to keep the physical integrity of the microstructure during the draw. In order to prevent the fiber structure from collapsing via surface tension or to give some of its section a desired shape, gas pressurization in the different transversal segments of the cane is introduced. Typically, three gas control channels are used to independently pressurize the core, the cladding holes, and the cane–jacket gap, as shown in Figure 3b. This pressurization technique was first introduced during the original fabrication of Kagome HCPCF [5], and becomes since very common in HCPCF fabrication. With a careful pressure control, fiber-cladding lattice made with tens of nanometer glass struts are now readily fabricated. An example of the power of this technique is the successful draw of HCPCF with a hypocycloidal core-contour shape that led to the advent of ultralow loss IC-HCPCF. In conclusion, we can see how gas is used to nano- and microstructure the fiber glass, which in turn is crucial in how to confine and guide light as described below.
4. HCPCF Guidance Mechanisms: Micro-Structuring the Glass to Structure the Light
4.1. Introduction
4.1.1. Historical Account
HCPCF proved to be an excellent platform to investigate “exotic” guidance mechanisms and explore the predictive power of the “photonic crystal” approach that stemmed from the seminal works of John [43] and Yablonovitch [44]. This approach treats the problem of guiding, trapping, and generating light in dielectric microstructures—also called photonic bandgap materials—photonic bandgap structures, or photonic crystals, in exactly the same manner as that used in solid-state physics to derive the electronic energy band structure in a solid [68]. In solid-state physics, this is achieved by casting the time-independent Schrodinger equation as an eigenvalue equation. The resolved states of the equation map the energy–momentum space to give the range of energies that an electron within the solid may have (i.e., allowed bands) or may not have (i.e., band gaps). Similarly, in photonics, and following John and Yablonovitch, the frequency–wavevector space is mapped to identify the photonic states of a photonic crystal by casting Maxwell equation as an eigenvalue problem. Consequently, notions that were so far limited to quantum mechanics and condensed matter such as bandgap, Bloch states, density of state become critical conceptual components in designing and investigating dielectric microstructures.
Within this context, the manner on how to design PCF (especially HCPCF) departs from the conventional approach in fiber optics [69]. Akin to semiconductor and doped crystals, a PCF is treated under the framework of photonic crystal physics as a waveguiding 2D “crystal” whose order or symmetry is broken by introducing an optical guiding defect within its extended spatial structure. In other words, a PCF is a cladding photonic crystal structure to which a core defect with different geometrical shape or index than the unit cell of the cladding is introduced. The pertinence of the index and geometry profiles of the cladding and core is better assessed through the examination of the cladding modal spectrum. When the cladding is considered to be infinite and periodic, which is often done for calculation convenience so as to apply the Bloch theorem, the modal spectrum is simply the density of photonic states (DOPS) in the frequency–wavevector space . Furthermore, in PCF, this modal spectrum involves only the propagating modes along the uniform direction of the 2D photonic structure (i.e., the fiber axis, which we refer as z-direction), which means the modes whose electric field amplitude is of the form . Alternatively, the mapped frequency–wavevector space to derive the cladding modal spectrum is a subspace of Hilbert space, namely , where is the z-direction component of , termed propagation constant. The modal spectrum takes the form of a diagram showing the density of the cladding modes in or space. Here, , called effective index of the mode, is given by β = neff.k. Similar to solid band-structure, the resulted DOPS of the cladding exhibits regions that are populated with photonic states, or propagating modes, and other regions that are void from any mode (i.e., PBG). The possibility of optical guidance in an introduced core defect within the cladding implies requirements on the core index and shape dictated by the type of guidance mechanism one is aiming for.
There are two strategies to guide light in the core. The first one relies on choosing a core index and geometry so at least some of its supported mode lie in the cladding PBG range. Consequently, the core-mode cannot leak out because there is no cladding mode to couple to. This is the design strategy for PBG-guiding HCPCF. The second one relies on engineering a core and a cladding so the cladding modal spectrum is populated with modes which have very little spatial overlap and/or symmetry matching. Here, the core mode remains in the core because its coupling to the cladding modes is suppressed.
We conclude this section by adding the following comments on the terminology of “crystal” in the PCF field. First, it is noteworthy that the modal spectrum structure of a dielectric microstructure, meaning the existence of allowed and forbidden bands in the space does not necessarily require a periodic material. In fact, the periodicity of a photonic structure is neither a necessary condition nor a defining feature for the existence of PBG [30,68]. The periodicity requirement is a mere mathematical convenience for applying the Bloch theorem [7]. This point draws its parallel from solid-state physics and crystallography, where amorphous materials can exhibit electronic bandgap, and a diffraction pattern can be produced from a solid with no crystallographic symmetry [70]. The latter surprising feature was discovered by D. Shechtmann and earned him the Nobel Prize in Chemistry in 2011 [70]. Consequently, and in addition to historical reasons, we apply the term of photonic crystal fiber (PCF) to any optical fiber whose cladding is microstructured and exhibits at least a short-range order.
4.1.2. Total Internal Reflection, Photonic Band Gap, and Inhibited Coupling
Before detailing, in the sections below, how PCF cladding modal spectra could be structured, we first give a simple and pictorial account on how the cladding modal structure affects optical guidance in fibers using the approach described above, and which is summarized in Figure 4. The figure shows schematically, and for a fixed frequency, the modal content of the cladding and of the core defect of the three types of optical fiber we can distinguish today. These fibers are (i) the well-known Total Internal Reflection (TIR), (ii) Photonic Band Gap (PBG), and (iii) Inhibited Coupling (IC). Using the solid-state physics approach, we consider the cladding to be infinite, or at least with a size much larger than any operating wavelength, whilst the core is considered to have micrometer scale size. The modal content is illustrated by colored regions on the -axis. The cladding modes are presented as the orange-color-filled rectangle on lhs of the -axis; the core modes are schematically shown by the intensity profiles on the rhs of the -axis. Finally, the material indices that are involved in the fiber structure are represented with dashed horizontal lines.
In the case of TIR (Figure 4a), where the cladding is a dielectric with uniform index , the modal content is represented by a continuum of modes whose effective indices are necessarily . Hence, the cladding is void from any propagating modes for (region labeled “gap” in the figure). In parallel, the introduction of a core defect with higher material index , shows discrete guided core-modes in the effective index range of . These TIR guided modes are thus confined within the core because the cladding is void from any possible modes at their effective indices. Consequently, from this new standpoint, TIR guidance is simply one form of a PBG guidance, which is achieved by having a defect material with higher index than that of the cladding.
The requirement of higher index for the core material to have PBG can be lifted with microstructured cladding. Figure 4b illustrates this for the case of a PBG-HCPCF. Unlike with a uniform index cladding, the cladding modal content now shows a more structured pattern with bands corresponding to cladding mode bands (orange-color-filled rectangles) and gaps corresponding to effective index band with no possible cladding modes (white-color-filled rectangles). The latter can range even for , allowing thus optical guidance in core defects that are hollow or filled with gases. The physical principles on how to engineer these “low index” gaps is detailed in a section below.
Finally, Figure 4c illustrates another type of guidance where neither a higher index core material nor cladding PBG is required. Indeed, core modes and cladding continuum can coexist with the same without strongly hybridizing. Such a situation of having two modes with the same effective index does not violate the exclusion principle. In this case, indeed modes of heterogeneous structure with the same does not necessary mean having the same wavevector. The guidance mechanism, akin to BIC or QBIC, is called IC and was introduced in 2007 [4] to explain the Kagome HCPCF optical properties. According to this model the field of the core mode and the cladding mode is strongly reduced (i.e., , with being a transverse index profile function). This can be done by either having little spatial intersection between the fields of and photonic states or by having a strong mismatch in their respective transverse spatial-phase. The details on how is reduced, is given below.
The above pictorial explanation highlights the crucial importance of the cladding modal spectrum in dictating the nature of a fiber guidance and its performance. Figure 5 shows three representative and most reported HCPCF cladding lattices and their associated modal spectra, or DOPS. The DOPS diagram is achieved by numerically solving Maxwell equations for infinite, periodic, and defect-free cladding, and displays the DOPS in the effective index and frequency space. The frequency is often represented by some normalized frequency such as , with k being the amplitude of the wave vector, and is the pitch of the dielectric photonic structure. The structure is defined by its unit cell shown in the inset of each of the three DOPS diagrams. Also, the effective index range was mapped near the air-line (i.e., ) as we are interested in fibers that guide in air or diluted materials.
The first DOPS diagram (Figure 5a) is that of a triangular and packed arrangement of nearly hexagonally-shaped air holes with an air-filling fraction of ~93% [7]. This cladding lattice cladding is that of the most common PBG-guiding HCPCF. The PBG region corresponding to DOPS = 0, is shown in white. We note that for slightly below 1, the PBG spans from to , which gives a transmission window of 330 nm centered at 1550 nm. In the section below, using the photonic analog of tight binding model [2], we review how PBG and cladding bands are formed in PBG-guiding HCPCF, and how they are related to the glass geometrical features. We particularly stress the role of the enlarged glass apices in the existence of PBG, and how their relative size can be optimized to increase the PBG bandwidth or to open-up higher order PBG. We then finish the section on PBG-guiding fibers by presenting properties of cladding lattice modes for high-normalized frequency range that relevant to IC-guiding HCPCF.
Figure 5b,c shows the DOPS diagrams for Kagome and tubular cladding lattice, respectively. The Kagome lattice can be represented as an array of tessellated David’s stars, and the tubular lattice as an array of isolated glass tubes. Several salient features can be drawn when compared to the previous one. First, in both modal spectra the DOPS does not reach the zero value. In other word, both photonic structures do not exhibit a PBG. Second, the normalized frequency range is much high than the case of the PBG HCPCF, that is why it is sometimes coined a large pitch regime [71]. In fact, we will see that in this regime, the pitch has secondary impact on the lattice modal spectrum. This is why the normalized frequency in Figure 5c, is represented by the “pitch-free” quantity rather than the most common . In the section below, and similarly with the PBG-guiding HCPCF, we will be using notions from solid-state physics to describe the IC guidance. This time, the driving concept in explaining IC optical guidance is BIC. We chiefly use it to draw physical rules to achieve a situation where modes with the same can “coexist without interaction” in a microstructured fiber. In turn, we use these rules to design cladding lattice geometry and defect core-contour in such a way the interaction between the cladding mode and the hollow-core mode is strongly suppressed despite having the same or comparable effective index. We particularly emphasize on the importance of the absence of enlarged glass nodes, which is in opposite requirement compared to the PBG HCPCF, and the benefit of having a cladding with a thin, “smooth” elongated glass membranes. Finally, we will see the advantage of working in the large pitch regime to an enhance the IC guidance.
4.2. Photonic Bandgap HCPCF: How to Engineer Photonic-Bandgaps below the Cladding Material Lowest Index
4.2.1. Photonic Tight Binding Model
The modal spectrum of the fiber cladding can be rigorously derived using solid-state physics concepts such as Bloch theorem and solving numerically the Maxwell equation. This, however, requires heavy numerical calculation and does not necessarily provide a direct physical insight on how this modal spectrum is formed or evolves. In parallel, the more intuitive and highly predicting model of the tight binding model (TBM) have been successfully applied to HCPCF by Benabid and coworkers in 2007 [2], and coined Photonic Tight Binding model (P-TBM), to explain how the cladding allowed bands and band gaps are formed within a PBG-guiding HCPCF. They found that the cladding bands in the modal spectrum of the PBG-HCPCF (shown in Figure 5a) are comprised with Bloch modes supported by the glass apices and struts that form the hexagonal shape of the unit cell, along with the modes which are supported by the air holes. Below, we review the basics of the tight binding model and how this is applied to microstructured fibers.
In solid-state physics, according to TBM the bands in the energy diagram of a crystal or solid result from the superposition of electronic state wavefunctions of the isolated atoms that form the solid. In this description the relationship between the solid physical structure in the real space and its energy structure in the Hilbert space is straightforward and is illustrated schematically in Figure 6a,b for the case of 1D crystal of identical atoms. We see that for a large number of atoms N, if the pitch of the lattice is sufficiently large, the energy states of the crystal is reduced to discrete states of the isolated constitutive atom, , each state being N-degenerate. As decreases, the atoms get closer and the wavefunctions of their energy states start to overlap. Consequently, the N-degenerate energy state splits by virtue of the exclusion principle, and creates a band of N-distinct extended states (i.e., Bloch states). The width of the band increases with decreasing . Furthermore, the start of band formation and its width strongly depend on the state wavefunction of an individual atom of the set. The stronger the wavefunctions are confined (or bound), the closer the atoms must be to each other for sufficient overlap. The net result is an energy structure exhibiting allowed band separated by gap, i.e., bandgap. It is noteworthy that bandgaps result not only from the intrinsic separation between two allowed bands, but they can result from anticrossing between overlapping bands. This occur when the wavefunctions of the two bands exhibit strong symmetry matching. Hence they cannot occur in the presently considered monoatomic 1D crystal, because the atom states are orthogonal, and thus the bands here overlap without anticrossing (Figure 6b). However, for the case of a crystal molecule with different atoms, it is possible to observe anticrossing of overlapping band if the later results from two different atoms and exhibiting strong symmetry matching. This picture can be applied to guided photonics where the electronic state in an atomic site is replaced by the guided mode in a photonic site. The latter represented by a dielectric with higher refractive index, i.e., the waveguiding component of the structure. The electronic state energy is replaced by the effective index of the guided mode. Finally, the energy diagram to map the Hilbert space of the crystal is replaced by the dispersion diagram of the different modes supported by the photonic structure in the space. Figure 6c,d reproduces the schematic picture shown in Figure 6a,b for the case of an array of N glass rods. The evolution of the dispersion with the pitch, plotted in function of normalized frequency , follows the same trend as for the energy state of a crystal, evolving from a N-degenerate dispersion line of a single rod into a band of propagating modes.
Figure 7 shows the above picture by considering an approximate and analytical model of the dispersion of a silica rod array suspended in air [7]. For the case of a single rod (see Figure 7a), we can retrieve the dispersion of the commonly known fiber modes (in the figure we limit to only LP01 and LP11 for demonstration purpose). When a much larger number of equally spaced rods is considered, the dispersion curve shows a band structure for the case of low or sufficiently closed rods (small pitch regime). The width of these allowed bands narrow down with increasing to the extent of forming a single dispersion line when is above a certain critical value (large pitch regime). The formation of these bands in an extended physical photonic structure, such the considered rod array, implies the possibility of light PBG guidance in a defect within the structure if its index and geometry is judiciously chosen. Whilst this P-TBM toy model does not consider the modes below the lowest material index (i.e., n = 1), we can still draw several points from the formed modal spectrum of the 1D rod array, and whose importance becomes apparent in the following sections. First, for small values, which we call the small pitch regime, the allowed bands strongly vary with the pitch. Hence, the resulted PBG transmission window edges of a guiding defect will depend on the pitch. This property is used to tune the transmission window spectral range of PBG-HCPCF by simply scaling accordingly the pitch. On the other hand, for sufficiently large values, the bands are very narrow, and even reduced to a single dispersion lines. Under this large pitch regime, because the bands vary little with , a guiding defect will exhibit PBG transmission windows whose edge spectral location depends little with the pitch. Secondly, in the small pitch regime, the bands are formed by extended and spatially overlapping Bloch modes, whilst in the high pitch regime, the fields of theses Bloch modes exhibit very weak to no-overlap. Similarly with the high tight-binding regime in solid-state physics, these field wavefunctions are better presented by maximally localized Wannier functions than Bloch functions [72]. Below, we will be recalling these properties as we describe some PCF results or features.
Figure 8 illustrates the aforementioned properties through a realistic PCF cladding structure. The latter consists of an array of high-index and isolated inclusions (typically doped silica) embedded in a silica matrix arranged in a triangular lattice. This type of all-solid PCF was first proposed by Birks and coworkers as a demonstration of PBG guidance with very low index contrast between the high-index and the low-index materials [73]. Figure 8a shows the cladding structure DOPS over a large normalized frequency range, from to , spanning over the small pitch regime and large pitch regime. The index of the high inclusion is and that of the silica matrix is . The band-structure of the modal spectrum is readily noticeable, especially for low . The bands (Figure 8a gray-colored areas), consist of propagating Bloch modes, which are spatially extending over the whole structure. In corroboration with the above toy model, the bands narrow down to a single line when is sufficiently large. Figure 8b shows the intensity profile of the cladding unit cell modes for . At this high-normalized frequency, all the bands corresponding to are reduced to a single line. This means that the Bloch modes of these photonic states exhibit a field that is highly localized at the high-index inclusions and weakly-to-no overlapping field between the high-index inclusions. Alternatively, and drawing the concept from solid-state physics, the photonic state modes at the large pitch regime are better represented by maximally localized Wannier functions [72]. This is shown by inspecting the mode intensity profile of the cladding modes at within the Wigner–Seitz unit cell. Each ultra-narrow band clearly shows the well-known profile of guided modes of conventional optical fiber, and labeled using the linear polarization (LP) approximation terminology.
Using the lexicon of tight binding model, the highest effective index and the lowest effective index modes of each band correspond to the symmetrical mode (“bound photonic-state”) and antisymmetrical mode (“antibound”), respectively. Conversely, using fiber optics formalism, we can recognize the highest effective index mode of the fundamental band, i.e., the band with the highest , to be the fundamental space-filling mode (FSM), introduced by Birks et al. in their seminal work on endlessly single mode PCF [33].
Moreover, when a core defect is introduced into this high inclusion PCF, an inspection of the PBG regions in the DOPS (Figure 8a black areas) reveals several points on its optical guidance properties. First, and after recalling that within the “photonic-crystal physics” approach TIR is only a particular regime of PBG guidance corresponding to a defect with higher index than that of its cladding, this fiber can guide via TIR if the index of the core defect fits inside region A. This means the core index is larger than the FSM (the superposed yellow curve on DOPS of Figure 8a), which can be considered as the cladding photonic structure “effective” material index. Second, the fiber can guide via PBG over a large range (black regions). Particularly, PBG guidance includes core materials with indices lower than the lowest cladding material index (white dashed horizontal line). Also, the expected fiber transmission spectrum presents multiple windows, and whose cut-offs are determined by the allowed band edges. Third, we can draw two important general properties from the inspection of this fiber DOPS in the large-pitch regime. Because the bands narrow down to the dispersion curves of the single high-index inclusion, the cladding modal spectrum depends little on the pitch. In turn, in the large-pitch regime a core defect exhibits a transmission spectrum whose cut-offs do not vary strongly when the pitch is changed. Instead, they only depend on the high-index inclusion index and size. This property led to refer to this particular regime of PBG guidance as antiresonant reflecting optical waveguide (ARROW) introduced in the 1980s [51]. In a section below, we detail the distinctions between ARROW, PBG, and IC. The second general property of note is that the large-pitch regime is an example demonstrating that photonic structure periodicity is not necessary to exhibit PBG. Indeed, because of the weak impact of the pitch on the DOPS, the initial triangular arrangement of the cladding lattice can be changed to an amorphous one without significantly change the modal spectrum for .
4.2.2. Engineering PBG in HCPCF
Historically, the P-TBM was first demonstrated with PBG-HCPCF [2]; the results of which are summarized in Figure 9. Unlike the high-index inclusion PCF, the PBG-HCPCF (Figure 9(Ia)) cladding lattice has more complex cladding lattice. Consequently, it is difficult in identifying the constituent waveguiding components in the unit cell (Figure 9(Ib)). Before reviewing the results of Reference [2], we recall that the guided optics analog of an atomic site is a photonic site consisting of high index material surrounded by a lower index material and guides light via TIR. Furthermore, two waveguide components differ (i.e., have different modal spectrum) via the difference in their index or via the difference in their geometrical shape. Consequently, the first task in Reference [2] was to identify the unit cell waveguiding features whose modes form the bands in the DOPS diagram. Finally, a lower index material surrounded by higher index materials can support photonic states via reflection/interference at the interference between two different index materials. Consequently, the PBG-HCPCF unit cell considered here has the form of a set of glass sheet forming a hexagon with prominent apices surrounding an air hole.
In a similar fashion with a crystal made with a heteronuclear molecule, the results show that the PBG-HCPCF cladding unit cell is comprised with six enlarged glass nodes positioned at the apices of the hexagon and six thin glass struts forming the sides of the hexagon. This was achieved by visualizing numerically and experimentally the cladding Bloch modes of the bands that surround the PBG below the air-line. Figure 9(IIa) shows the DOPS at the effective index and frequency range close to this PBG. The latter is bordered at low by the low-index edge of band 1 (red curve), which represents the low-frequency band edge of the hollow core transmission spectrum, and at the high by the blue curve, which represents the high-frequency edge of hollow core transmission window. Furthermore, the PBG closes at the low effective index by the dashed green curve. The Bloch mode intensity profiles associated with these three dispersion lines have been calculated at the points of the DOPS diagram labeled by (b), (c), and (d) for the red, blue, and dashed-green curves, respectively (Figure 9(IIa)). The Bloch mode clearly shows an intensity profile dominantly confined in the apices at the point B (Figure 9(IIb)), and dominantly confined in the struts at the point C (Figure 9(IIc)). The Bloch mode at the point D shows an intensity profile dominantly in the air hole of the unit cell. However, a non-negligible power fraction resides in the struts. This is due to hybridization between the mode-band associated with the strut and the associated with air hole mode-band, which we detail below. These modes were experimentally observed using both scanning near-field optical microscope (SNOM) to image their near field and by imaging their profile during their propagation in the Fresnel zone [2].
Figure 9(IIe) shows the DOPS over a large range of normalized frequency and effective index spanning up to 45, and up to 1.25. Figure 10 reproduces this DOPS diagram supplemented with the Bloch mode intensity profile for several points of the DOPS (lfh of Figure 10a) so to (i) identify the modes of the different bands and (ii) show their dynamics and evolution with . In consistency with P-TBM and the features observed with the high-index inclusion PCF, it is easy to distinguish the structure of the bands and their narrowing to a single line when increases.
Figure 10a (lhs) shows six Bloch mode profiles for different bands and at normalized frequencies higher than 35. The profile labeled 1 shows a spatially extended mode whose intensity is localized with the glass apices, as expected from the high pitch regime. In particular, we can identify from this the HE11-like fundamental associated to an individual apex. Figure 10b shows the evolution of the intensity profile of this mode when the normalized frequency is increased from 12 to 30. The results show the enhancement in confinement of the light within the apex with increasing . At , the intensity of the transverse field extends outside the apex with a relatively large space-filling (top of Figure 10b), whilst at , the mode shows an intensity profile that is strongly confined with the apex with little spatial overlap with the silica strut or air. This is a fiber–photonics illustration on how photonic lattice modes evolve from a spatially delocalized state, which is suitably presented by Bloch functions, to a highly localized lattice mode, which is conveniently represented by Wannier functions. This feature of the cladding modes in the high pitch regime has been one of the driving principles in the development of IC-HCPCF (see below). A further substantiation of the P-TBM is shown in the mode profile labeled 2. This corresponds to a linear combination of the fundamental mode of an individual silica strut. Conversely, all the profiles of Figure 10a (lfh) shows mode profiles that are associated with either propagating modes of the individual apex or strut, or with supermodes from the coupling between the two glass features. Consequently, one can deduce that the high-index waveguiding components that make the PBG-HCPCF cladding lattice comprise a glass apex and glass strut. To this structural feature, we note the existence of photonic band related to modes localized in the air holes of the dielectric structure. The formation of these bands cannot be described by TBM approach, instead they are formed akin to modes formed between to potential wells via reflection off the low-high index interface.
A final remark on the structure of this DOPS relates to the dynamics at work when the photonic bands cross each other. For this purpose, we consider the high inclusion cladding lattice, which unit cell is formed by one single step-index waveguiding component (see Figure 8). Here, the DOPS shows bands that cross with no splitting or anticrossing. This is because the bands are mutually orthogonal because they stem from the same waveguide, and hence will not interact when they cross in the space. In the case of the PBG-HCPCF cladding lattice, we have seen that the unit cell is formed by two glass waveguiding components, and the bands stem from either apex, strut modes or air hole modes. This means that the modes of an “apex band” are not necessarily orthogonal with those from a “strut band”. Consequently, when the mode crosses the same they can anticross. The DOPS of Figure 10 shows several of these anticrossings, such as the one near and . Below, we show how these features are exploited by Light et al. [74] to design and fabricate a HCPCF with two bandgap transmission windows.
Figure 11 summarizes some of the results reported in Reference [74]. Figure 11a shows the near air-line DOPS of the above PBG-HCPCF cladding lattice but with different relative size between the apices and struts and with much higher air-filling fraction. This DOPS was achieved by optimizing the apex and strut size and shape, and using the P-TBM to control the position of the bands within the -space. Another outcome from this work is the fact that the fundamental PBG results from a strong anticrossing between the “fundamental apex band” and the “fundamental strut band”. This was illustrated in Figure 11b, which shows the DOPS of a lattice made with apices only (red band) and that of a lattice made with struts only (blue band). We clearly see that in the absence of apices, the strut fundamental band never fully crosses the air line around the -range of 20 to 27. Thus indicating that the shift of the band towards an effective index-range lower than one results from strong anticrossing with the fundamental apex band.
Figure 11c,d shows the physical characteristics of the fabricated double-PBG HCPCF tailored to guide at approximately 1.5 µm and 1 μm.
4.3. Inhibited Coupling HCPCF: How to Prevent Interaction between Longitudinally Phase-Matched Modes
4.3.1. Historical Account
This section deals with an optical guidance configuration where both the requirement of higher index core material and cladding photonic bandgap is no longer, as is schematically shown in Figure 4c. This configuration was first experimentally observed with the introduction of Kagome lattice HCPCF [46], and outstands with the peculiar situation in which a core mode is guided with relatively low loss at the same effective indices of cladding “continuum” of modes. The historical development of our understanding on how such a fiber guides followed the following sequence. The first fabricated Kagome HCPCF exhibited a very broad transmission spectrum, which ruled out the photonic bandgap scenario. This was then corroborated numerically by inspecting the DOPS of the Kagome lattice, which shows no PBG [75]. The fiber had a core diameter of only 15 μm, and showed attenuation loss of ~1 dB/m with relatively low bend sensitivity. This loss figure at such a core-diameter ruled out Fresnel reflection based optical guidance in dielectric capillary studied by Marcatili and Schmeltzer in the sixties [50]. Following this work, the predicted loss of the fundamental core-mode (i.e., HE11) of a glass dielectric (refractive index: ng) capillary of radius Rc, given by the expression
results in a loss range of 360 to 5000 dB/m at 400–1500 nm spectral range, which is over two orders of magnitude higher than the experimentally observed with Kagome HCPCF. Also, the results in [46] ruled out the possibility of guiding via antiresonant reflecting waveguidance (ARROW), introduced by Duguay et al. [51]. ARROW guidance principle relies on the reflection enhancement off the interface between the air-core and the dielectric cladding when the dielectric-thickness is strongly reduced. This work aroused a number of effort in the eighties (see below on the difference between ARROW, PBG, and IC), among which is the work from Archambault et al. [76] who derived the confinement loss of a hollow-core fiber based on concentric antiresonant dielectric rings. The expression of the HE11 mode minimum loss of a single antiresonant hollow fiber for the case of , was found to be given by
Similarly with the Fresnel reflection in the glass capillary, the ARROW model predicts a loss at 400–1500 nm in the range from 7 to 365 dB/m, which is higher than the measured loss of the Kagome HCPCF. Subsequently, these findings raised the question on how cladding modes and a core mode could have the same effective index without interacting. This interrogation was justified because the findings go against the conventional wisdom in fiber optics, which states that guided-modes with the same effective index strongly hybridize. However, this is not necessarily valid in heterostructures such as HCPCF. Firstly, two modes with the same do not necessarily imply that the two modes have the same wave vector, and subsequently, that modes with the same are not rigorously phase-matched, and thus can avoid interacting. One can envisage, for example two modes in a dielectric heterostructure, which are localized in different materials. Secondly, as is known in coupled-mode theory [77], the coupling-strength between two modes is ruled not only by the effective index matching, but also by the optical overlap between the modes. This means that if the optical overlap between two modes is nil or strongly suppressed, they will not strongly interact.
The explanation to the optical guidance in Kagome-like HCPCF was given by using once again concepts from quantum mechanics and solid-state physics. In 1929, Von Neumann and Wigner reported on the existence of a bound electronic state with positive energy in an artificial potential designed to extend to infinity in oscillatory fashion [3]. Such a counterintuitive situation describes localized waves coexisting with a continuous spectrum of radiating waves that can carry energy away. These localized waves were then later coined Bound States in the Continuum (BIC), also referred to as embedded eigenvalues or embedded trapped-modes. The occurrence of BIC happens because of symmetry incompatibility between localized waves and the radiation continuum, thus forbidding the former to couple to the latter. We can also picture BICs as resonances with infinite lifetimes, and quasi-BIC (QBIC) as resonances with high quality factor but finite. BICs and QBICs can be found not only in quantum mechanics but in electromagnetic, acoustic, and water waves (see the dedicated review to BIC by Hsu et al. [52]).
In 2007, Benabid and coworkers [4] introduced the BIC and QBIC concept to the field of fiber–photonics by showing that the guided core-modes in Kagome HCPCF are longitudinally phase-matched with a cladding mode-continuum. Analysis of the modal spectrum of the cladding structure (see Figure 12a) showed that the intuitively expected coupling between the core-mode and the cladding modes is inhibited by a strong transverse phase mismatch (i.e., symmetry incompatibility) between the modes and the highly localization of the cladding mode in the cladding glass web (i.e., spatial separation between the core air-mode and the cladding glass-modes). These results are summarized in Figure 12b,c. The top of Figure 12b shows the DOPS of an infinite cladding of a Kagome lattice. The bottom of Figure 12b shows the effective index and confinement loss coefficient for a Kagome lattice with 1-cell core defect (i.e., 1-cell Kagome HCPCF). The DOPS clearly shows no photonic bandgap (i.e., DOPS = 0) in the mapped effective-index and frequency space. On the other hand, the 1-cell Kagome HCPCF shows a core-guidance with loss figures of 1 to 0.5 dB/km in a hexagon-shaped core with a size of 20 μm and with a large pitch of 12 μm [4]. The nature of interaction between the core mode and the cladding is illustrated in Figure 12c. The top of the figure shows representative mode profiles within the unit cell of infinite Kagome cladding near and below the air-line. We distinguish three kinds of modes. Proceeding by analogy with fibers with cylindrical symmetry, we associate the transverse phase of the silica-guided field with an effective azimuthal index number “m” which governs the azimuthal field oscillations (i.e., along the strut length axis), and a radial number “l”, which governs the field variation along the strut thickness [78] (see below for a detailed account on m and l mode index numbers).
The first kind are highly oscillatory and highly localized photonic states (modes labeled A and C), presented in the DOPS by steep blue-colored dispersion curves. The field of these silica modes are associated with a very large m number. However, the mode labeled A shows no radial variation (l = 1, see below), whilst mode C exhibits one oscillation (l = 2). The second kind of modes is represented by lattice air modes, localized in the hexagon hole of the Kagome lattice (modes labeled B and D), and stand out with a weak interaction with the silica modes, illustrated by the relatively flat brown-colored dispersion. The third kind of modes are hybrid of silica and air modes (mode labeled E), and are localized within specific frequencies. The latter occur at normalized frequencies given by the identity (j = 1, 2, 3, …), and for the glass strut thickness considered in this work (t = 0.044 ), the resonance condition for the hybridization corresponds to k = 68, 136, etc. This resonance condition is often found in the literature in the following form , where is integer related to the radial number as we will see below [30]. At this wavelength, the air HE11-like cladding lattice mode is transversely phase-matched with the silica lattice modes having the same propagation constant, leading to mode hybridization. When an air core is introduced within the photonic crystalline cladding, its HE11-like mode experiences the same transverse matching with these cladding modes, thus leading to the enhanced leakage from the fiber core around the same wavelength values. This is clearly exposed in the bottom of Figure 12c, which shows cladding and core mode of 1-cell core Kagome HCPCF. At normalized frequencies away from the air–silica mode resonance (see the mode profiles at k = 50 and k = 100 in Figure 12c), the HE11 core mode coexists with silica cladding mode with no strong interaction. On the other hand, at k = 68 the mode profile shows that of a hybrid mode between air and silica modes. Consequently, the resonant wavelength can be used to separate the Kagome DOPS near the air-line into multiple bands, which differ by the radial-number of their silica modes. A property that is also seen in the transmission of the Kagome HCPCF, and which further study when we consider below the tubular lattice.
It is worth mentioning that the Kagome lattice HCPCF core mode is leaky, and thus is a QBIC instead of proper BIC. To explore the possibility of a truly BIC-guided mode in HCPCF, Birks et al. [79] considered a cladding structure shown in Figure 13. This idealized Kagome-like structure consists of orthogonally superimposing two infinite 1D periodic arrays of thin glass membranes (index n2) in air (index n1) and having an intersection with the refractive index given by (see Figure 13A). The results show that the fiber supports a strictly localized core mode and has no leakage loss (Figure 13B) even though the mode has an effective index that lies within the continuum of radiation modes filling the infinite cladding (Figure 13C). Furthermore, IC optical guidance was also observed in solid-core PCF [39]. Finally, the results reported in Reference [4] provide the physical principles and the design tools for fabricating lower confinement loss fibers, coined as inhibited-coupling guiding fibers, which are detailed in the following section.
4.3.2. Design Tools for Low-Loss IC-HCPCF
The work in Reference [4] shows that QBIC and BIC in optical fibers is an interesting and novel path in fiber photonics. The principles underlying the performance of IC-HCPCF are (1) a strong transverse phase mismatch and (2) a weak spatial overlap between the core mode and the cladding modes. This implies reduction in the overlap integral between the fields of the different modes that we want to suppress their mutual interaction. This overlap integral takes the form of the inner product between the core and cladding mode transverse-fields. Denoting the latter by their scalar wave function, we can write the wave function of the two effective index matched modes as and . Here, the and are real functions representing the field envelops of the core and cladding modes, and hence their spatial localization. The quantities and represent their transverse phase, or how the field oscillates under the envelop formed by or . The term is associated with the common propagation constant of the two modes.
Based on this premise, without the need to perform numerical calculation, even if the real function and the transverse phase terms are not necessarily separable we can state that inhibiting the interaction between the modes can be achieved by reducing the spatial overlap between the mode fields, i.e., by ensuring that .
In the previous section, we have seen that operating in the large pitch regime (i.e., ), the high-index material modes (i.e., glass mode in the HCPCF cladding) are highly localized with very little optical power overlapping with low index material (i.e., air is in the considered HCPCF cladding), and that are better presented as maximally localized Wannier functions than Bloch modes. Consequently, the “large pitch regime” is the first cladding design criterion [80].
The second means to reduce the overlap integral is to have the integral containing the transverse phase term, vanishes. This infers having a strong symmetry incompatibility between the two modes. Expanding the transverse phase term in a similar manner as in Reference [30] (i.e., , with m being the azimuthal index number, Am a constant, and a radial complex function), the integral can be written in the form . Consequently, the reduction of the overlap integral through “phase-mismatch engineering” implies a strong mismatch in the azimuthal-like index number between the cladding and core modes (i.e., ). Taking a core mode with no azimuthal number, such as HE11, means that the coupling inhibition is achieved with a cladding mode with .
This transverse phase mismatch-induced IC is summarized in a “toy model” shown in Figure 14. The figure considers the coupling between a glass rod HE11 mode and a semi-infinite glass membrane effective-index matched modes using a semivectorial and perturbative approach. Here we compare the coupling coefficients when the membrane mode transverse index number is increased. The transverse field profile calculations show that both overlap integrals and drop by four orders of magnitude when the slab mode transverse phase period (i.e., the equivalent to the azimuthal number) is increased from 4 to 19.
In conclusion, IC optical guidance relies on a strong transverse phase mismatch between the core and cladding modes and on a very weak spatial overlap between them. These two criteria on the optical modes transform into the following geometrical criteria. IC fibers rely on a cladding with elongated and thin glass membranes with minimum corners and connecting nodes. It is noteworthy that the driving principles in designing IC fibers stem from structuring the modal spectrum of the cladding using chiefly quantum mechanics and condensed matter physics notions rather than those from guided optics. For example, tracing the path of the field and its reflection and/or interference is no longer required. Instead, we use the Hilbert space as the working space to identify the modal and spectral structure of the cladding lattice. We then use the P-TBM approach to pinpoint the waveguiding components of the lattice. Finally, we use the broad properties that underlie the dispersion, mode structure and symmetry of individual waveguiding lattice component to infer the most optimal cladding and core physical geometry.
These principles in designing low-loss IC-HCPCF were experimentally implemented by exploring large pitch Kagome lattice, but also square and honeycomb lattices HCPCF [71,81,82]. Here the confinement loss (CL) remained above 300 dB/km because of the unavoidable strut connections or nodes. A much more significant CL reduction in IC-HCPCF was achieved with the introduction of optimized core-contour. This contour took the form of a hypocycloid core-shape (also coined negative curvature core-contour), which consists of a set of alternating negative curvature cups with an inner radius and an outer radius and was presented by Benabid and coworkers in 2010 in a post-deadline paper of the CLEO conference [25], reported later in Reference [26]. This work was then quickly followed by several reports on negative curvature core-contour HCPCF [53,54]. The rationale behind the choice of such a core-contour profile is schematically illustrated in Figure 15, reproduced from [63]. Using the aforementioned design principles, the figure shows how the overlap integral between the core-mode and the highly oscillating (i.e., high azimuthal-like number m) silica core-surround mode (cladding-mode) is strongly reduced in an IC-HCPCF with a hypocycloid core-contour compared to a circular-like contour (see Figure 15a). The reduction in coupling between the HE11 core-mode and the cladding modes is reached via three avenues. Firstly, the spatial overlap of the core HE11 mode with the silica core-surround is reduced from one that spans over the whole circle perimeter in the case of the circular core shape to contour sections that are tangent with the six most inner cups in the case of hypocycloid core shape. Secondly, the HE11 mode-field diameter is related to the inner-core radius Rin of the hypocycloid contour. As such, because of the larger perimeter, L, of the hypocycloid compared to that of a circle of a radius Rin, the silica core-surround modes exhibit higher m, which is related to L by [26] (see Figure 15g). Hence, by virtue of a stronger transverse phase-mismatch when m is increased, we have stronger IC between the core mode and the cladding mode. Finally, the IC is enhanced by reducing the overlap between the core-mode with the connecting nodes, which support low azimuthal number modes. Here, the distance between connecting nodes and the circle associated with HE11 Mode Field Diameter (MFD) is increased when the contour is changed from a circular shape to a hypocycloid one.
The above principles were used in the recent development of low-loss IC-HCPCF, which we account below for both Kagome lattice and tubular-lattice cladding structure.
4.3.3. Hypocycloidal Core-Contour Kagome Lattice HCPCF
Following, the first demonstration of hypocycloidal Kagome IC-HCPCF, a comprehensive experimental and theoretical account was reported in References [63,83], showing the impact of the negative curvature and the cladding ring number on the CL. In particular, how strong CL reduction is achieved by optimizing the negative curvature. Figure 15 summarizes some of these findings by comparing Kagome IC-HCPCF with different core contours. Figure 15a defines the negative curvature by the parameter , and Figure 15b shows the different fibers explored. Here, the silica strut thickness and the core inner-diameter were taken to be 350 nm and 60 µm, respectively.
Figure 15e shows respectively the evolution of the CL and the fundamental core mode HE11 optical overlap with the silica core contour, η, defined as , with being the z-component of the mode field Poynting vector, and Ssi and S∞ are the cross section area for the silica and the full fiber, respectively. The confinement loss spectrum evolution with b clearly shows a drastic reduction when the core-contour evolves from a circular (i.e., b equal to 0) to elliptical cup-shape (i.e., b > 1). For a circular core-contour, which is representative of the initial Kagome HCPCF, the CL remains larger than 0.1 dB/m for the wavelength range of 400 to 2000 nm, in corroboration with the measured transmission loss of the previously fabricated Kagome fibers. For b larger than 0.5 the loss drops down to ~1 dB/km for the fundamental transmission band and down to ~0.01 dB/km for the 1st higher order band. These CL figures are comparable to those of PBG-HCPCF with finite cladding size. This is a seemingly remarkable situation when we recall the coexistence of the core mode with a cladding mode continuum. Conversely, the optical overlap η follows the same reduction trend with increasing b. The optical overlap drops by more than one order of magnitude from ~3 × 10⁻⁵ to down to ~10−6. In addition of being correlated with the CL, the optical overlap with silica is a determinant factor in the application of IC-HCPCF in high-field optics (see the section on applications). Figure 15e,f shows the evolution of CL, η with b at a wavelength fixed at 1030 nm for HE11 and one of the lowest loss higher order mode. The curves clearly display the effect of increasing b on the reduction of the spatial overlap between the core mode and the cladding via the decrease of η. Similarly, Figure 15g,h shows the evolution of CL and m with b, which clearly shows the correlation between the increase of m (i.e., increase of the transverse phase mismatch) and the reduction in CL on one hand and between the increase of m and the increase in b, in consistency with the IC model predictions. We note that for b > 0.5, η saturates, whilst the CL continues to decrease with increasing b. Particularly, increasing b above 0.5 is associated with both CL further decrease, and further increase in m. Thus indicating the CL reduction is dominated by the transverse-mismatch when b increases from 0.5 to 2. This work in designing IC-HCPCF showed that CL scales with t, b, and λ as , and the minimum loss for higher order bands to at wavelength , with l being the order of the transmission windows (i.e., the radial number of the silica lattice modes) [65].
Today, state-of-the-art Kagome IC-HCPCF is represented in Figure 16. The first fiber (Figure 16a) has a b = 0.95, and exhibits a minimum loss of ~8 dB/km at its 1st order transmission band, tailored to operate near 1 μm. The second fiber, designed to have a broadband fundamental band, exhibits a single window spanning down to 700 nm with a loss below 100 dB/km over one octave. Here, the CL is set by the limited achievable b at a thickness of 300 nm, which was found to be ~0.45. Such a state-of-the-art was one part of a series of transmission loss records at different wavelength ranges, which occurred since the first experimental demonstration of negative curvature HCPCF in 2010. Within eight years the loss figure dropped from ~100 dB/km to 8 dB/km, which represents a “drop rate” of more than 10 dB/km per year. This trend is bound to continue following two emerging trends. The first trend impacts the loss in longer wavelengths (>1000 nm), and is a continuation of last decade effort, which consists of reducing the CL by exploring alternative fiber cladding and core designs with lower confinement [56,57,58,59,60]. The second one consists of lowering the loss in the short wavelength range (<800–1000 nm), and which solution requires reducing the surface-scattering loss (SSL), which is now, like with the PBG HCPCF, the limiting factor in IC-HCPCF.
Indeed, in addition to the CL, the modal propagation is attenuated by two additional sources: the bend loss and the scattering loss.
The bend loss is affected by both core-size and the cladding structure as illustrated in Figure 17. Figure 17a are results reported by Maurel et al. [65], which show experimentally measured and numerically calculated HE11 core-mode confinement loss evolution with bend radius at λ = 1064 nm for a hypocycloid-core Kagome with b = 0.95, core inner radius of 25.5 μm, and silica strut thickness of 800 nm. The numerical values give a bend loss of below 5 dB/km for , of ~47 dB/km for , and almost 400 dB/km for . These results show excellent agreement with a fit, in consistency with the findings of Marcatili and Schmeltzer for the dielectric capillary tubes [50].
Figure 17b shows loss spectrum evolution of the fiber HE11 core mode 1st high-order transmission window for the different . In addition to the confinement loss increase with the decreasing , the spectrum shows bend induced resonant loss at several wavelengths, in agreement with the findings by Couny et al. (see Figure S3 and its associated text [4]). These loss resonances occur when the bend-induced effective index-variation induces transverse phase matching between the core mode and the cladding modes. As pointed out in Reference [4], because the Kagome silica lattice modes are associated with a very high effective azimuthal number m, a perturbation which may induce coupling between the core mode and such cladding modes necessarily requires a large Δm. On the other hand, a fiber bend is primarily associated with a change in m of just 1. Consequently, the observed bend-induced resonant coupling is caused by either cladding air modes or by cladding silica modes with low azimuthal number. The latter are spectrally localized near the red edge of the transmission window. Indeed, the red edge of each of the higher-order transmission windows in an IC-HCPCF corresponds to a unity-increment in the radial number of the cladding silica modes. In turn, over a frequency range close to the band red edge, these additional modes exhibit low azimuthal number modes. They manifest in Figure 17b as several narrow absorption peaks over the wavelength range of 1350 nm and 1500 nm.
The wider peak shown in the red curve of Figure 17b relates to a coupling with an air cladding-mode. This was previously shown by Alharbi et al. [83] in their experimental and numerical study of the cladding effect on confinement loss. Figure 17c,e shows, both experimentally and theoretically, the sensitivity to bend for a Kagome HCPCF with different cladding ring number. Figure 17c,d shows the evolution of loss with bends at 1500 and 1550 nm wavelengths, respectively. The latter are representative wavelengths of the fundamental transmission window that are further from those corresponding low azimuthal cladding modes. At both wavelengths, the loss evolution with the radius shows a peak at approximately Rb = 1.1 cm. Figure 17d shows the intensity profile of the fiber mode at this bend value and shows a coupling between the core mode and a mode residing in one the cladding holes. Outside this resonant bend radius range, the bend loss decreases with following . Finally, Figure 17c,d shows the effect of cladding ring number on the CL for different bends. The results show strong dependence on the wavelength. For 1500 nm, a second ring drops the CL by more than one order of magnitude. This can be explained by the reduction in the leakage through tunneling to outside the cladding. However, this argument is not necessarily true for all IC-HCPCF and strongly depends on the cladding/core structure and wavelength. This is illustrated by the impact of adding 3rd or 4th ring on the CL. Here, we observe that the latter additional rings have little effect. Furthermore, at 1550 nm, the effect of adding additional rings is marginal and sometimes disadvantageous as the CL is increased for a given bend radii. This illustrates the key difference of IC guidance mechanism when compared to PBG guidance (including TIR guidance), where the reduction of the core more leakage cannot simply be achieved by increasing the cladding thickness. Instead, both the tunneling to the outside the fiber and coupling to cladding modes must be taken into account. Within this framework, we argue that adding an extra cladding ring IC-HCPCF increases the cladding mode number, and hence the residual coupling between the core and the cladding modes. In the case of Kagome lattice, adding more than two rings implies increasing the connecting struts to a level that weakens the IC compared to the 2-ring cladding design.
Finally, the third source of propagation loss is the surface roughness scattering (SSL). This is caused by the surface roughness of the glass web of the HCPCF, and has first been reported by Roberts et al. in the case of PBG fibers [49,84]. Indeed, SSL was identified as the limiting factor in PBG-HCPCF because of the large optical overlap between the core mode and the core silica surround. The surface roughness results from the frozen capillary waves that are present during drawing process. This type of propagation loss is expressed as
where ς is a constant related to the surface roughness root-mean-square height, and is the core mode overlap with the core-contour [49,56]. The typical value of is ~1% for 7-cell PBG HCPCF and ~0.1% for a 19-cell PBG HCPCF.
For IC HCPCFs, the SSL was often ignored because of the very small values of , which are typical in the range of 10−4 and 10−6 (see, e.g., Figure 15d), and because of the higher CL loss that characterized IC-HCPCF before the introduction of hypocycloid core-contour. However, recently measured propagation loss of less than 10 dB/km are common with IC-HCPCF. For example, one the fibers shown in Figure 16 shows a transmission loss of ~8.5 dB/km at a wavelength range near 1030 nm [65]. In this work, it was shown that the CL is no longer the limiting factor for IC-HCPCF at wavelength shorter than 1 μm, in consistency with the results reported in Reference [30] for tubular amorphous lattice IC-HCPCF (see following section). In fact, for wavelengths shorter than 1 μm, all the measured loss spectra of the different reported Kagome IC-HCPCF show increase with decreasing wavelength, which is contrary to the predicted CL. These results indicate that the surface roughness induced scattering loss is the dominant factor. Hence, any future improvement in IC-HCPCF transmission performance in these short wavelength ranges implies either a reduction in the surface roughness or further reduction in the optical overlap .
4.3.4. Hypocycloid Core-Contour and Nodeless Tubular Lattice IC HCPCF
One of the cladding structures that followed the seminal introduction of hypocycloid core-contour in 2010 is a tubular cladding, which has shown a lot of promise and interest. The fiber form of this dielectric structure exhibits a hypocycloid core-contour, and consists of an amorphous lattice of isolated tubes arranged to form a circular layer around a hollow-core. An example of this single-ring tubular lattice HCPCF (SR-TL-HCPCF) is shown in Figure 18a, where the fiber cladding consists of a single ring made with eight nontouching tubes. What is particularly significant with such a fiber is the absence of connecting nodes at the cladding region surrounding the hollow-core, which are the primary source of coupling between the core mode and cladding modes in IC-HCPCF because their cladding low azimuthal number modes.
As we have seen in a previous section, when we operate in the large pitch region, the modal spectrum is not very sensitive to the pitch. Consequently, as shown in Reference [30], the arrangement of the tubes has little impact on the modal spectrum of the resulting lattice. Figure 18b shows the resulting DOPS of an infinite cladding of a triangular arrangement of tubes (see middle of Figure 18a for the lattice and the rhs of Figure 18a for the lattice unit cell). Here, the normalized frequency is set to be , and spanning from 0.5 to 1.5. The DOPS (see Figure 18b) and the lattice unit cell mode profiles (see Figure 18c) show the same essential features of the Kagome lattice. The tubular-lattice DOPS shows no bandgap and is populated with a continuum of photonic states. Near the air-line, the modal spectrum is formed by lattice modes consisting of silica ring modes, air modes, and silica–air hybrid modes (see top of Figure 18c). For the frequency range away from the anticrossing region near F = 1, we note the high azimuthal oscillations of the silica tube modes observed with the Kagome lattice (see Figure 18c mode profiles (A) and (D)). Figure 18c shows also the lattice air-modes (unit cell mode profiles (C) and (B)), and lattice hybrid-modes that populate the DOPS region near F = 1 and near neff = 1 (unit cell mode profiles in the box (E)).
Figure 18d shows the effective-index and loss spectra of the fundamental mode when a hollow-core defect is introduced into the tubular lattice. Similarly to Kagome HCPCF, the SR-TL-HCPCF shows low loss transmission bands separated by high loss bands. The high loss band corresponds to the spectral location of the hybrid modes, highlighted in Figure 18b DOPS by the red-colored shaded box, and occurs at the vicinity of , which is simply the air–silica mode resonance condition (j = 1, 2, 3, …), mentioned above. A close-up view of the modal spectrum of the eight tubes SR-TL-HCPCF near , and is shown in Figure 18e. Here, the plots contain both the defect core air-mode (horizontal curves in the effective range between 0.9998 and 0.99985), and the cladding modes. The rhs is a further zoom-in of the modal spectrum over the normalized frequency range of 0.97 to 1.06. The plot shows a large number of anticrossings and dispersion branches corresponding to resonant interaction of the tube air HE11 mode with different silica modes. The intricate modal structure of this high loss region clearly indicates that the resonance, , which is extensively used in ARROW model (see section below), does not fully capture the dynamics of such hybridization between the air modes and the silica modes.
Below, we explore the fact that unlike with the Kagome unit cell, the isolated silica tubes modes have identifiable profiles and even analytical expressions [85] to use it as an educational platform for IC guidance mechanism and to draw its salient properties, which were cumbersome to draw with the Kagome lattice. In particular, we can extract a transverse phase relationship between the silica mode and the air mode when they are longitudinally phase-matched (i.e., having the same ), and thus identify the modes behind the high loss band.
The silica tube modes are classified as HEml (i.e., electric field direction is azimuthal) or EHml (i.e., electric field direction is radial) [85]. In the work of Debord et al. [30], it was shown that their effective index was given by approximating the tube to a slab. Within this approximation, the propagation constant of the silica tube modes can be written as
with
Here, is the transverse component of the silica mode wavevector. In cylindrical coordinates, the transverse wavevector can be composed of an azimuthal component and a radial component . Thus, m and l are the index number of the azimuthal and radial variation of the glass mode, respectively.
On the other hand, the air mode of the tube can be approximated to that of a capillary given by Marcatili and Schmeltzer [50]. Within this approximation, a HE/EH air mode has a propagation constant given by
Here, is the th zero of the Bessel function . Under the condition of longitudinal-phase matching (i.e., ), the tubular-lattice glass mode azimuthal and radial indices (i.e., m and l), the air mode azimuthal and radial indices (i.e., and ), , are related through the following identity, which provides the spectral location of the intersection between the dispersion curves of glass modes and the air modes:
Furthermore, in this case, the condition of longitudinal phase-matching between the HE/EH air modes and the silica tube HEml/EHml modes’ full phase-matching condition (i.e., the modes have also the same ) is impossible because of the difference in index of the respective mode media. However, coupling between the air mode and the silica mode can occur through directional coupling whose strength is set by the couple waveguide parameter [86]. Where is the longitudinal mismatch and is the power coupling coefficient between the two modes.
According to IC, we have seen that such a coupling can be reduced or strengthen depending on the mismatch in the azimuthal number of the modes. If we limit the case of the air mode HE11 on one hand, and consider silica modes with no azimuthal variation or very low one (i.e., , Equation (6) can be written for the case of tube radius much larger than the wavelength as [30]
The above expression can be written by setting in a form that is commonly used in ARROW literature (see following section), such as
According to the above, the IC approach shows that the ARROW formula from Duguay et al. [51] is an asymptotic limit when the azimuthal variation of the cladding mode is ignored, and the integer n is related to the radial number of the cladding silica modes. That being said, it is worthwhile that in ARROW approach, the cladding modal spectrum is not considered at all.
Below, we further examine the modal spectrum of the tubular lattice near , as it represents the spectral range where we can find both air and silica modes with inhibited coupling, and those with a strong hybridization.
Figure 19 summarizes the modal interaction dynamics near . Figure 19a shows the close-up of the DOPS and representative cladding lattice modes for on the lfh panel and for on the rhs panel. In similar fashion as with Figure 12 and Figure 18, we retrieve the silica and air modes along with their hybrid forms. However, in this DOPS diagram, we color-coded the dispersion of the silica modes’ radial number.
The lattice silica modes with radial number l = 1 (i.e., the EH/HEm,1) are represented by orange dotted steep lines, and we distinguish them from the EH/HEm,2 silica modes with radial number l = 2, which are represented by dark-blue colored thick steep lines. As it has been seen with the Kagome lattice [4], EH/HEm,2 lattice silica modes populate transmission bands with , whilst EH/HEm,1 lattice silica modes populate all the transmission bands. On the lhs of the DOPS diagram, we show the mode intensity profiles of the EH35,1 lattice silica modes at three different points of its dispersion curve (blue line crossed by blue filled circles). We can see that this mode interacts little with the air modes, illustrated by both its highly silica-localized intensity, and its dispersion curve intersecting the HE11 air mode dispersion curve with no observable anticrossing (within the plot and F resolution). Based on the above and previous works [4,30], it is obvious to correlate this coupling inhibition between the air mode and the silica mode to the fast azimuthal oscillations.
On the other hand, the first lattice silica mode with radial number 2, HE1,2, strongly interacts with the HE11 air mode. This is shown by the light-pink curve and the yellow square symbols; which are superimposed on the upper branch of the strong anticrossing between the two modes. The rhs of the DOPS diagram shows representative mode profiles along this curve. We can readily see the modal evolution from a HE1,2, silica-dominated lattice mode for to HE11 air-dominated lattice mode when . Additional anticrossings are also observed between low m number silica-EH/HEm,2, and air-HE11 (see DOPS diagram).
Within this spectral range, the strength of these anticrossings decreases with increasing frequency. Figure 19b highlights the overall picture of the anticrossing between the lattice silica modes with the lattice air mode HE11 (Figure 19(bi)) and a close-up view of a DOPS region located on the lower branch of the anticrossing (Figure 19(bii)–(bv)). Within a small range of the normalized frequency F~1.15–1.158, Figure 19(bii) displays the different anticrossing between the air-HE11 lattice mode and the low azimuthal number lattice silica modes EH/HEm,2 (blue lines) and the high azimuthal number lattice silica modes EH/HEm,2 (brown lines). An example of such low azimuthal variation the EH/HEm,2 mode is shown in Figure 19(biii). This mode exhibits an azimuthal number of m = 5, and is associated with relatively large anticrossing at F~1.159. On the other hand, at the vicinity of this frequency, the figure shows a much smaller anticrossing (indicating a strong coupling inhibition), which is zoomed in in Figure 19(biv), with its corresponding mode profile (Figure 19(bv)). The latter corresponds to the HE47,1 silica lattice mode, and as expected it has a radial number l = 1, and a large azimuthal variation, with m = 47.
We conclude this analysis by noting that all the aforementioned features and the modal coupling dynamics are also valid when we consider a hollow core defect to form a tubular amorphous lattice HCPCF. In Equations (6) and (7) we only need to replace the lattice tube radius Rt with the inner radius Rc of the HCPCF core. This is illustrated in Figure 18e, which shows the modal spectrum for a SR-TL HCPCF.
Following the introduction of negative curvature in 2010 [25], the first fabricated fiber of the above described SR-TL HCPCF was reported in 2011 by Pryamikov et al. [53]. Here, the fiber was made with touching tubes whose thickness was larger than 1 µm. The fiber operated at 3.5 µm wavelength and longer, with transmission loss figure of 34 dB/km. Also, SR-TL HCPCF was analyzed theoretically for THz-wave guidance [55]. Since then, this type of fiber has been explored in various designs by many groups by changing the tube number and thickness, the core size, and even the jacket tube shape for fabrication convenience [87,88,89].
Figure 20 summarizes the current state-of-the-art (SOA) of SR-TL HCPCF in terms of loss and bandwidth of the fundamental transmission band. The left panel shows the electronic micrographs and the loss spectra of the two SR-TL HCPCF representing this SOA. Using the IC model described above as a design tool, the two fabricated fibers resulted from an optimization study in its architecture design (i.e., tube number, radius, and thickness and intertube gap) and its fabrication limit (i.e., minimum thickness and cladding structure shape) [30]. One particular finding of this work is the azimuthal distribution of the power leakage of SR-TL HCPCF and its evolution with the intertube gap δ (Figure 20e). The Figure 20e shows the evolution with δ of the Poynting vector radial component at minimum-loss wavelengths of the fundamental and 1st order transmission bands. The results showed that there is an optimum value of δ to achieve a low CL. Also, it was shown that when δ is smaller than a critical value (here ~2 µm), the power leakage “channel” is the connecting nodes between the tubes and the outer silica jacket. Conversely, when the gap size is larger than 6 µm, the loss channel changes to that of the intertubes gaps (see Figure 20e).
The fibers have eight tubes and an intertube gap of 2.7 µm. The first one demonstrated record transmission loss for an IC HCPCF with a figure of 7.7 dB/km at 750 nm (see Figure 20a for the SEM picture of the fabricated fiber and Figure 20b for the measured loss spectrum). Guidance in the UV spectral range down to 200 nm has also been demonstrated. The second fiber presents a thinner struts structure, and hence a broader transmission fundamental window with low loss guidance over one octave between 600 to 1200 nm. The losses in this band are in the range of 10 to 20 dB/km (see Figure 20c for the SEM picture of the fabricated fiber and Figure 20d for the measured loss spectrum). These fibers have shown close to single-mode propagation with an extinction ratio between the fundamental core mode and the first high order modes of ~20 dB. Finally, and similarly to Kagome HCPCF, the results show that the loss is limited by SSL for the short wavelength range and by CL for wavelength longer than 1 μm. Figure 20b,d shows the contribution to the measured fiber loss of the CL (dotted blue curves) and SSL (dashed red curves) based on a fitted peak-to-peak fluctuation height of 1.5 nm. For both fibers, we can observe that for wavelength >1 μm, the CL dominates the propagation loss, whilst for shorter wavelength, the SSL is the principal source of the transmission loss.
It is noteworthy that SR-TL HCPCF is still the subject of ongoing and active research, with progress being reported continuously. Among these recent results, we have the report on a 9-tube-based SR-TL HCPCF operating in the “green” spectral range [90]. The fiber demonstrated an impressive loss value of 13.8 dB/km at 539 nm [90], which is comparable to the Rayleigh scattering limited silica transmission loss of 10 dB/km at this wavelength. Also, this fiber is the first reported IC HCPCF to be drawn over a distance longer than 1 km with a variation of the outer diameter less than ±0.2%. Also, more recently, guidance in the UV with this fiber design has been targeted by scaling down the strut thickness of the tubes and the core size. Loss figure of 130 dB/km at 300 nm has been reported [91]. Finally, the modified tubular lattice IC-HCPCF, optimized for the telecom wavelength, range was reported to have a transmission loss as low as 2 dB/km at ~1500 nm [58].
4.4. Difference between ARROW, PBG and IC
The above sections showed how the optical fiber guidance mechanism is governed by the cladding structure and its modal spectrum. Here, we conclude this topic by touching on the guidance by antiresonance (i.e., ARROW). This is motivated by the recent surge of the ARROW terminology, which was used invariably to describe PBG-guiding [73,92] and IC-guiding fibers, thus creating confusion within the readership on how light is guided within microstructured optical fibers and on how to differentiate between them. Here, we give the reader some distinctive properties that could be useful in distinguishing between PBG, IC and ARROW.
The idea of antiresonant reflection was originally used in interferometry to distinguish the working conditions where a Fabry–Perot reflectivity is at its maximum [76]. In 1986, Duguay et al. extended this notion to optical waveguide by proposing a planar waveguide with a low-index core surrounded by higher index dielectric thin layers, and by studying light propagation in the core at glancing angles [51]. Here, the optical confinement is ensured by the reflectivity enhancement due to the high-index layer thickness reduction to the micrometer scale. Following Duguay et al., dielectric ring waveguide with micrometric thickness layers was studied [76,93,94]. The ARROW induced transmission improvement of these dielectric ring waveguides over a thick dielectric tubes [50] was found to be proportional to the ratio of the ring radius over the wavelength (see Equation (2)).
Figure 21 captures the main differences and similarities between a glass capillary, a glass ring and two negative curvature contour IC-HCPCFs by plotting the dispersion and CL spectra. On one hand, Figure 21a compares the glass ring to a glass capillary and, on the other hand, Figure 21b compares the glass ring to a Kagome and Tubular IC-HCPCF.
Figure 21a compares the dispersion and the loss between the glass capillary and the ring for different parameters and using different expressions. The left panel of Figure 21a shows the spectrum of the capillary and the ring for two diameters (black curves). The ring dispersion was taken from Zeisberger et al. [95] and reproduced below.
Here, is the effective index of a dielectric capillary (see Equation (5)) and t and Rin are the silica ring thickness and radius, respectively. The results show that for wavelengths which are away from the resonant wavelength (see above), the dispersion of the ring is very close to that of the capillary. Also, the approximation of the ring dispersion to that of the capillary improves with larger core diameters. On the other hand, at the vicinity of the resonant wavelengths, the ring dispersion curve shows an anticrossing which strength (i.e., spectral width) increases with smaller core diameter, as illustrated in the difference between waveguides of 22.5 µm radius ring (curve red) and 10 µm radius ring.
The right panel of Figure 21a shows the transmission loss of the HE11 core mode in 45 µm diameter glass capillary using the expression given by Marcatili et al. [50] (black dash-dotted curve) and by Archambault et al. [76] (black dashed curve) over a spectrum spanning from 400 to 2000 nm. The loss figures are in the range of 50 to 100 dB/m for wavelengths near 800 nm. The graph also shows the loss spectrum of a ring with the same inner diameter (i.e., 45 µm) and a thickness of 600 nm using the expression by Archambault et al. [76]. The results show a decrease in the loss figures by over a factor of 10, reaching ~2 dB/m near 800 nm. Very recently, and following the interest in IC-HCPCF, the dielectric ring optical waveguiding properties were reexamined by D. Bird [96] and Zeisberger et al. [95]. The red curve in Figure 21a shows the loss spectrum of the same dielectric ring using the expression from [95]. The spectrum corroborates the results reported in Reference [76], though a discrepancy of nearly a factor of 2 is observed. In any case, the found loss values are in the range of 1 to 2 dB/m at ~800 nm regardless of the expression used.
Comparing the CL results of the above antiresonant ring with those found with hypocycloid core-contour IC-HCPCF with the same core radius and the same silica thickness as the one used for the ring give values that are ~4 orders of magnitude larger. This is illustrated in the right graph of Figure 21b, which show the CL spectra for a ring, hypocycloid core-contour Kagome HCPCF and 8-tube tubular HCPCF, respectively. This discrepancy in CL clearly indicates that the ARROW is not appropriate as a guidance model for IC-HCPCF. In parallel, inspection of the effective index of the HE11 for the ring using ARROW and the two IC-HPCFs (see lhs of Figure 21b) shows that comparable dispersion trend for the three fibers. The main difference lies at the resonant wavelengths. Here, in contrast with the ARROW calculated HE11 effective index, the two IC-HPCF show broader and multiple resonant wavelengths on the blue-side of the ARROW resonant wavelength. This difference is also shown in the loss spectra (rhs of Figure 21b), which show broader high loss band and shifted to the blue. Using the discussion above, this can be explained by the fact that at the blue-side of the resonant wavelength, the cladding lattice supports silica lattice modes with low azimuthal number associated with the unity-increase in the radial number, and hence broader and blue-shifted high loss region compared to the ARROW based spectrum [4].
Conversely, ARROW model was also used to describe large-pitch PBG-guiding PCF because of their weak dependence on the cladding lattice pitch. As mentioned above, we have seen that PBG guidance can occur without the requirement of periodicity. This is exemplified with large pitch regime PCF, such as the one with the high-index isolated inclusion cladding, whereby the cladding-lattice Bloch modes are represented by Wannier modes. The latter are highly localized in the high index guiding constituents of the cladding dielectric microstructure. Consequently, and by virtue of the photonic analog of the tight binding model, the modal spectrum band-structure of the cladding-lattice is reduced to discrete dispersion curves associated with the individual waveguiding features making the cladding lattice.
We thus argue that the ARROW picture cannot be considered as a guidance model for microstructured fiber as it does not give an account of the cladding modal spectrum. The latter is necessary to identify the coupling dynamics between a fiber core mode and the cladding. We have seen that in the case of a PBG fiber, the cladding is engineered to support no mode at the frequency and effective-index of interest, and thus the core mode is bound to be guided by virtue of absence of any leakage channel. On the other hand, for IC fibers, the cladding is engineered in such that its modal spectrum is populated within the region of interest by modes that are highly localized in the high index material and have a strong transverse symmetry incompatibility with the fiber core mode of interest. Such approach stems from the paradigm shift triggered by the work of John and Yablonovitch [43,44], whereby light dynamics in photonic devices, such as PCF, is explained no longer by tracing the electromagnetic field path, but by considering the reciprocal space (i.e., Hilbert space of the relevant photonic states) of its dielectric structure to solve the modal spectrum. Then, a simple use of well-established rules from condensed matter physics, such as tight binding model or spatial symmetry of the eigenmodes, confer the necessary conceptual tools for PCF design.
4.5. Core Modal Properties of HCPCF
In the above sections, emphasis was put on the modal spectrum structure and properties of the HCPCF cladding lattice. In this section, we give a short review on the main modal properties of the guided core modes in HCPCFs.
The fundamental properties of core modes in HCPCF don’t strongly deviate from those obtained in fiber optics [69] or hollow dielectric waveguides [50]. As a matter of fact the HCPCF core modes show comparable propagation constants and transverses profile as those described by Marcatili et al. for hollow dielectric capillary [50]. Figure 22 summarizes the modes content and transverse profile for a Kagome IC-HCPCF. Using the linear polarization approximation, we can recognize the fundamental core mode LP01 (i.e., the linear polarization form of HE11) with its largest effective index, and then the higher order modes following similar order in effective index as with a hollow capillary.
The principal difference in the modal structure of HCPCF when compared to conventional optical fibers resides in the modal and polarization control. For example, in PBG-HCPCF, the mode number is set by the cladding PBG lowest effective index edge at a given frequency or wavelength. As seen above, this edge can be controlled to a certain level by adjusting the cladding structure to obtain single mode fiber. Another strategy to achieve single mode guidance in PBG-HCPCF is to introduce additional defects in the cladding that are phase-matched with the lowest loss higher order modes. When judiciously designed, the fiber can exhibit single-mode and polarization-maintaining operation [97].
For IC-HCPCF, the modal and polarization control requires different strategies than PBG fibers. Because of the intrinsic nature of the light guidance in IC-HCPCF, the notion of cut-off wavelength below which the fiber core does not support guided modes no longer holds because core modes co-propagate at the same with cladding modes (see lhs of Figure 22a). Consequently, the IC-guiding fiber can support an infinite number of core modes. However, an IC fiber can effectively operate in a single mode fashion at its lowest loss mode (typically the core fundamental mode) if the other modes are sufficiently leaky. Usually, in IC-HCPCF the lowest loss modes are those of LP01, LP11, and LP02. The latter can exhibit lower loss than LP11 because its field has no azimuthal variation and thus lower coupling to cladding modes. Figure 22b shows experimental S2 measurements [98] illustrating the above mentioned properties for a hypocycloid core-contour Kagome HCPCF. Here, the S2 trace shows a fiber modal content dominated by LP01, LP11, and LP02 like modes. Furthermore, within this set of dominant modes, the light is chiefly in the fundamental core mode with an extinction ratio of ~13 dB for LP02 and ~26 dB for LP11.
Another salient feature of IC HCPCF HE11 core mode is its extremely low overlap with the silica core-surround. The top of Figure 23 shows the profile of HE11 core mode and how its compares to that of a glass capillary [63]. Figure 23a shows the evolution of HE11 radial profile along two axes when the negative curvature b is increased whilst keeping the inner radius constant. The result shows that the mode MFD remains constant and its transverse profile is that of HE11, regardless of the negative curvature value. Furthermore, the mode profile is related to the inner radius of the fiber, and the Kagome IC-HCPF mode profile and propagation constant can be approximated to that of a glass capillary with a radius equal to the inner radius of the hypocycloid core contour. Figure 23c shows the relative error of this approximation for different values of b. The results show that the relative discrepancy is less than 7% (which was found for a b = 1.5).
Figure 23d,e shows the bend loss for the case of 7-cell and 19-cell Kagome IC-HCPCF, respectively. The first fiber has an inner diameter of 57 μm, a silica strut thickness of 840 nm, and b-parameter of 0.75. The 19-cell fiber exhibits an inner core diameter of 119 μm, a silica thickness of 900 nm, and has b = 0.88. The bend loss was measured at 1 μm (black curve) and at 2 μm (red curve) at the fundamental and the 1st higher transmission bands, respectively.
4.6. HCPCF Prospects and Future Trends
Despite the field of HCPCF remains a nascent field and timely topic in research and technology, it is quickly developing in a mature subject both in guided photonics, in the design and fabrication of this type of fibers, and in its applications in various fields (see below). The performances achieved in the last 20 years with both PBG-HCPCF and IC-HCPCF were as exciting and insightful as counterintuitive and changing. Both HCPCFs morphed from an academic curiosity to a transformative and powerful technology platform in nonlinear optics, lasers, sensing, communications, and higher-power pulse delivery.
This being said, HCPCFs have not been adopted as extensively as expected. This is very much so in telecommunications, where HCPCF is yet to represent an alternative to the single mode fiber (SMF). Indeed, the lowest loss reported for HCPCF is ~1 dB/km, and was achieved with PBG-HCPCF. This is ~1 order magnitude higher than the SMF state-of-the-art loss figures, and seems to be a hard limit for PBG-HCPCF, especially when single-mode and polarization-maintaining are required. Indeed, achieving lower loss implies succeeding the difficult challenge of reducing the frozen thermal surface fluctuations induced surface roughness.
Within this context, a renewal in the hope of envisioning HCPCF as a future alternative to SMF is triggered with the progressed made in IC-HCPCF. Today, IC-HCPCF shows comparable loss to PBG-HCPCF, with losses below 10 dB/km being demonstrated over a large spectral range of the visible and NIR. Debord et al. [30] identified two possible future trends to further improve on the performance of IC HCPCF. These trends result from two limiting sources. Today, IC-HCPCF are surface roughness-limited for short wavelengths (typically shorter than 1 μm), and design-limited for longer wavelengths. Consequently, improving on the surface roughness-limited fibers implies lower SSL, and requires a reduction either in the surface roughness or in the optical overlap with the silica core-surround. Conversely, reducing the transmission loss of the design-limited HCPCF implies exploring alternative cladding and/or core-contour designs to those of Kagome HCPCF or SR-TL HCPCF. Among the proposed cladding designs we count nested tubular HCPCF designs [56,57,60] or double layer tubular cladding [58], which very recently demonstrated a loss figure of as low as 2 dB/km at 1500 nm.
5. HCPCF Applications
The advent of HCPCF has transformed laser–gas-based applications and is continuing to do so. The driving properties of such a transformative power are summarized in part in Figure 24. These are the laser–gas interaction ultra-enhancement, the laser power and/or energy handling (Figure 24), and specific and engineerable dispersion profiles.
The micrometer scale core and the long propagation length offered between the guided light and a gas phase medium that can be confined in its core permit to reach a very efficient gas–light interaction. This means that nonlinear phenomena and spectral contrast can be excited with extremely low light levels. This statement is quantified by the figure of merit , which is proportional to the ratio between the effective interaction length, Lint, and the modal area, Aeff. Figure 24a shows that the FOM to be enhanced larger in HCPCF by a factor between 1000 and 1 million relative to the usual capillaries. The colored regions in Figure 24a show the FOM magnitudes for the different and typical reported HCPCF. We note that for the same propagation loss, the PBG-HCPCF exhibit higher FOM because of a smaller fiber-core size than those of IC-HCPCF.
Figure 24b shows the laser energy damage threshold (LIDT), with laser pulse duration for different silica-based fibers. The results show that for HCPCF with an optical overlap coefficient of η = 10−6 and a core radius of 60 μm, which are fulfilled with current IC-HCPCF, the energy damage threshold is theoretically found to be 1 J for laser pulses of 100 fs and 100 J for pulses of 10 ns. The exceptionally low optical overlap in IC-HCPCF makes this type of fiber as an outstanding candidate for laser power/energy handling and for high field optics and photonics. The star symbols are the laser energies reported to be guided by IC-HCPCF. PBG-HCPCFs are represented by the configuration of η = 10−2 and core radius of 5 μm. Here, the LIDT is around 10 μJ for sub-picosecond laser pulses. An example of an experimental demonstration using PBG-HCPCF is shown as a square symbol in the figure. This lower PBG-HCPCF’s LIDT relative to IC-HCPCF is due first to the high optical overlap with silica in PBG-HCPCF and secondly to the smaller core size. Having said that both types of HCPCF show higher energy damage threshold than 5 μm core radius silica-core optical fiber with USP laser energy damage threshold of 1 μJ.
Below, we review a nonexhaustive list of experimental results in different fields, where the above properties, along with the dispersion, played driving roles in harnessing gases and light under surprisingly extreme regimes.
5.1. Non Linear Optics
In the field of nonlinear optics, gas-filled HCPCF proved to be an outstanding platform in transporting extremely energetic pulses, in pulse compression, and in generating extremely broad spectra with both very low light levels and with high laser pulse powers and energies.
5.1.1. High-Power Laser Beam Delivery
The HCPCF technology was a timely innovation for laser beam delivery, particularly for ultrashort pulse (USP) lasers. Indeed, the advent of the USP laser technology demonstrating high peak power and intensities of up to PW/cm2, combined with pulse durations down to 200 fs calls for a fiber beam delivery that can handle this power and/or energy without distortion to the pulse spectral and temporal integrity. This need is becoming pressing with the growing and varied applications that are adopting USP lasers as a tool, and which span from laser surgery to surface marking and micromachining to mention a few.
Within this context, the PBG-HCPCF rapidly showed its inability to sustain such an intense pulse laser. The strong optical power overlap with the silica cladding (1–0.1%) implies a too low LIDT (see Figure 24b), and hence disqualifies this fiber family as an efficient mean for the intense USP delivery. Among the reported work on PBG-HCPCF-based laser beam delivery, we count the report in 2007 of the delivery of 0.5 mJ energy and 65 ns duration pulses from of Nd:YAG laser through a 2m long 7cell fiber with 8 μm diameter [102]. Two years later, transportation of 1 mJ energy and 10 ns duration pulses has been demonstrated with a transmission coefficient of 82% in a 8 mm long 19-cell PBG-HCPCF with a core diameter of 15 μm [103].
Conversely, the very low optical power overlap with silica offered by IC-PCFs (10−4–10−6, see Figure 15d) and their larger core diameters allowed a breakthrough in USP beam delivery applications. Moreover, due to its broadband guidance, different spectral wavelengths have been targeted going from UV to mid-IR range. The conventional hexagonal core contour of Kagome HCPCF demonstrated guidance of fs laser beam of tens of µJ [11], and 1064 nm pulses up to 10 mJ for 9 ns pulse duration [100] leading to demonstration of gas ignition at the output of the HC fiber. An important milestone has been achieved in 2013 through the use of the hypocycloidal design that permits to drop further the optical overlap with the silica down to ppm level. The exceptional power of IC-HCPCF for ultra-energetic USP laser beam delivery was first shown with the demonstration of the transport of 600 femtosecond pulses at millijoule energy level of a 1030 nm emitting Yb-laser in robustly single-mode fashion using a 10 m-long piece of a IC Kagome HCPCF [31]. The energy record in term of launched energy for fs-lasers in a HCPCF is to date 2.6 mJ in a Kagome lattice HCPCF that has been designed to get a large core size of 100 µm [99]. One can notice that these fibers can be the host for transport of very high average powers of CW lasers. In fact, the delivery of 1 kW has been demonstrated with an impressive transmission coefficient of 90% with an excellent output beam quality defined by a M2 of 1.1 [104]. Subsequently, much effort has been made to develop efficient fibers for covering most of the industrial lasers. For example, delivery of thulium-doped fiber laser technology at 2 µm (important wavelength range for spectroscopic applications, material processing of for High harmonic generation) has been addressed with transmission of 40–50 W of average power in a nanosecond [105] or femtosecond regime [106]. The green spectral range has been covered with a Kagome HCPCF, demonstrating delivery of 532 nm 10 W average power frequency-doubled Yb-fiber picosecond laser [64], and a with a tubular amorphous lattice HCPCF demonstrating delivery of 0.57 mJ and 55 ns pulses and 30 µJ and 6 ps pulses [107]. For shorter wavelengths, UV guidance has been reported with the launching of 15 mW of 280 nm CW laser with a hexagonal-core Kagome fiber with a transmission coefficient of 50% without appearance of UV induced damage over 14 h [108]. Recently, the SR-TL HCPCFs shows its capabilities with the delivering at 355 nm of 20 ps 160 µJ pulses thanks to a fiber exhibiting 130 dB/km loss level [91].
5.1.2. Pulse Compression
A large number of nonlinear optical applications require laser pulse widths that are much shorter than what is possible with today’s high-power USP such as those of Yb-based materials [113]. An example of these applications is High Harmonic Generation (HHG) where few-cycle intense pulses are desired to reach high conversion efficiency and high photon energy cut-off. In the previous section, we have seen that the successful laser beam delivery of high energy ultrashort pulses in different spectral ranges using IC-HCPCF relies chiefly on the small optical overlap of the guided mode with silica. The pulse compression, on the other hand, relies on the gas-filled IC-HCPCF specific and controllable dispersion spectral profile. Thanks to a dispersion spectrum exhibiting both normal and anomalous regimes, dispersion values that are relatively low, and ultralow propagation loss, IC-HCPFS are particularly efficient in spectral broadening and pulse compression of such intense pulses. The many reported results demonstrated the stronger impact of this fiber-technology compared to the well-established technique gas filled capillaries to compress several millijoule USP. The latter technique presents the drawback of being limited to high energy pulses because of the high propagation loss of capillary, and of being physically cumbersome as the capillary is not bendable and must be stretched to avoid higher transmission loss. On the other hand, IC-HCPCF offers the best of two worlds: pulse compression over a large energy dynamic range and ease of use and integration.
One can distinguish mainly two types of compression schemes employed with the HCPCF technology. The first one exploiting the normal dispersion regime of the gas filled system is based on Self Phase Modulation (SPM) effect of the spectrum leading to spectral broadening. Pulse compression is then achieved by postcompression with dispersion compensation thanks to chirped optics. The second technique takes advantage of the IC-HCPCF low and anomalous dispersion to excite solitonic dynamics whereby pulse self-compression can take place.
Table 1 summarizes the most notable and representative intense pulse compression results obtained with both techniques, for various wavelengths and temporal domains. Among these compression results, one can notice the subcycle pulse generation by compression of 1.8 µm 80 fs pulses down to 4.5 fs in a Xenon filled 82 µm core HCPCF (20 cm long) with a self-compression dynamic [16]. To date, it represents the strongest compression ratio in self-compression regime with a value of 17 that has been achieved using HCPCF technology.
In the above, most of the reported pulse compressions were achieved using gas-filled HCPCF. This technique necessitates the cumbersome use of gas cells and gas pressure control. An ideal set-up scheme is the use the HCPCF in its simplest form, meaning the fiber core is filled with air at atmospheric pressure. In this context, compression of 330 fs/70 µJ pulses at 1030 nm down to 34 fs has then been demonstrated by Guichard et al. with a transmission efficiency of 70% in a 1.2-m-long piece of air-filled Kagome fiber [115]. This compression has been achieved by postcompression of a spectrum that has been broadened over 90 nm (at −10 dB). Self-compression of more intense 600 fs has been reported with a minimum pulse duration of 49 fs at the output of a 3 m-long piece of a 19 cell Kagome HCPCF exposed to ambient air for an input energy of 450 µJ [31].
5.1.3. Raman Comb Generation
The first demonstration of nonlinear optics in HCPCF was achieved in 2002 by Benabid et al. [46], via the generation of Stimulated Raman Scattering (SRS) in hydrogen-filled Kagome HCPCF pumped by 532 nm nanosecond pulses with conversion efficiency of ~30% on vibrational Stokes and anti-Stokes. Two years later, the same phenomenon was demonstrated with pure rotational resonance using hydrogen-filled PBG-HCPF excited at 1064 nm with an impressive higher conversion efficiency of 92% from the pump to the first rotational Stokes [119]. These results have been seminal to several demonstration based on SRS in HCPCF. For example, the first multi-octave Raman comb demonstrated in HCPCF has been reported in 2007 where nanosecond pulse-pumped hydrogen-generated Raman lines from 325 to 2300 nm by virtue of the broadband guidance offered by IC-HCPCF [4]. Also, in the same year, the same group reported on the observation of continuous-wave rotational SRS with a conversion efficiency of 99.99% to the first rotational Stokes [9]. Finally, in Wang et al. [120], the same team experimentally and theoretically demonstrated that within the single pump pulse and the spectral components of the comb reported in Reference [4] are phase coherent. This coherence results from the transient nature of the SRS, and is stronger when the pump pulse is narrower and the fiber is closer to single mode.
Multi-octave coherent comb generation are of great interest for optical waveform synthesis via Fourier synthesis and attosecond pulse generation for attoscience applications. Also, the generation of this large comb in the CW regime represents a very promising milestone for the advent of the optical analog of the electronic function generator.
Among the follow up results in the generation of several octave Raman comb, we can list the generation via transient SRS of over five octaves wide Raman combs in hydrogen-filled IC HCPCF pumped with a 27 picosecond laser at 22.7 W [10]. The Raman lines span from 321 nm to 12.5 µm (24–933 THz) with an output average power of 10 W (Figure 26). The use of a narrower pump pulse than the nanosecond pulses previously used enables stronger temporal filtering of the excited spatio-temporal modes duration the Raman generation, and thus ensuring a single wavepacket to be Raman-amplified from the quantum noise, and thus to generate more intrapulse coherent comb. Figure 26 shows the two output generated Raman combs optimized for vibrational emission (through linear polarization) and for rotational lines emission (with circular excitation polarization).
In parallel, the generation of dense Raman comb has been demonstrated by exciting with a 532 nm nanosecond laser a HCPCF filled with a gas mixture of H2, D2, and Xe [121]. With an input beam of 5 µJ of energy, 135 rovibrational Raman lines spaced by 2.2 THz have been measured from 280 nm to 1 µm. Finally, the generation of Raman comb in hydrogen-filled HCPCF has been for the first time used experimentally for a periodic train pulse waveform synthesis of 26 fs pulses duration with a frequency of 17.6 THz thanks to phase-locked Raman sidebands [122].
5.1.4. Supercontinuum Generation
Similarly to solid-core PCFs, many results have been carried out to generate supercontinuum in gas-filled HCPCF [123]. Thanks to the combination of high peak power and energy levels offered by the new generation of USP lasers and to the large FOM, one can even generate, with a low nonlinear medium such as ambient air with a nonlinear coefficient of ~5 × 10⁻¹⁹ cm2/W, strong optical nonlinearities. This has been exemplified by the demonstration of nonlinear optical effects in air-filled IC HCPCF [13]. In fact, Debord et al. reported on the experimental demonstration of a very high energetic Raman comb based on excitation of N2 of the ambient air in the fiber [13]. This has been obtained in a 3 m-long piece of Kagome HCPCF excited by 300 ps pulses with energy up to 1.3 mJ and an output efficiency of 75%. The generated N2 Raman lines covers a large spectrum range of 300 THz between 600 and 1375 nm with five vibrational resonances spaced by 70 THz. By switching to shorter pulses of 600 fs, the dynamics have been completely modified to end up with the generation of a broad supercontinuum that spreads from 375 to 1500 nm with a transmission coefficient of 30%. It corresponds to a record energy spectral density of 150 nJ/nm.
Figure 27 summarizes the evolution of the input energy of the two spectra recorded at the output for the different temporal excitation regimes. The theory shows that this generation involves four-wave mixing, third harmonic generation, and soliton formation.
5.2. Plasma Photonics
5.2.1. Wave-Induced Plasma
In 2013, plasma-core PCF was reported [27], extending the gas phase materials that have been successfully loaded into HCPCF to ionized gases. The interest of confining the fourth state of matter is strong and represents a unique material for photonics because it is the only state of matter that can emit directly in the UV spectral domain. The confinement of such a phase in the HCPCF technology can be useful in building new generation of UV-DUV fiber gas laser.
Different attempts have been carried out to ignite gas discharges in hollow-core waveguides. The primary technique used was based on high-voltage DC discharge using two electrodes at both ends of the gas discharge tube [124]. Several limits are inherent to this ignition technique if one wants to target excitation in small core tubes with a limit around 150 µm of core diameter. In fact, important high voltage values are required to reach the ignition threshold due to important charge accumulations close to the core walls and on the electrodes implying instability of the plasma discharge. In fact, no successful discharges based on the CW excitation technique have been reported in a proper waveguide such as HCPCF. In order to mitigate this charge accumulation, the RF field is combined with DC excitation. In 1975, a new plasma ignition technique emerged based on the resonant microwave cavity using a specific coupler, named “Surfatron” [125]. It consists of a cylindrical microwave resonant cavity exhibiting a gap, where the field is strong enough so the coupled energy to the gas filling the hollow-core creates a discharge. This technique exhibits the advantage of being nonintrusive as the microwave excitation is applied on side of the fiber.
The Surfatron excitation scheme was successfully applied to the HCPCF in 2013 (see Figure 28a). For the first time, a stable 6 mbar argon plasma column sustained in a 100 µm core diameter IC HCPCF-based on Kagome lattice has been reported, with no damage to the fiber structural integrity. The plasma column length reached 4 cm for an incident microwave power of 30 W at 2.45 GHz. Figure 28b shows a transverse picture of the plasma column. The originality of this excitation relies on the fact that the plasma is created and maintained by a surface wave that propagates at the interface between the plasma core and the glass core contour in a self-consistent configuration where the surface wave creates the plasma, and in turn the formed plasma acts as a guiding medium for the surface wave itself. This surface wave transfers its power to neutral particles during propagation, and at a certain distance when the power becomes (or electronic density) too low the plasma column is stopped. The relatively low gas pressure used allows a stronger emission of the Ar atoms in the UV domain thanks to Ar+ ions excitation.
An efficient guidance of the generated Ar lines has been demonstrated at the output of a 20 cm long piece of the HCPCF, and the guided spectrum shows strong emission in the 350–550 nm spectral range (see Figure 28c). The experimental study reveals that the gas temperature was around 1300 K at the coupling zone. The achieved ionization rate reached the impressive levels of ~10−2, corresponding to an electron density level of ~5 × 1014 cm−3 at ~1 mbar pressures and microwave power density of ~0.1 MW cm−3. A theoretical study has been undertaken to give a clear explanation on the plasma processes involved that can explain this unusual plasma column excitation and confinement [126]. Particularly, the theoretical model enabled us to understand the counterintuitive situation of high-power densities and electron densities combined with the relatively moderate gas temperature (but strong enough to potentially starts softening the silica). The HCPCF confined plasma dynamic shows a strong ion acceleration, and thus an ionic mean free path which is larger than the core size of the fiber explaining the combination of the moderate increase of the gas temperature, and the large ionization rate.
Later, a more compact microwave excitation scheme was reported [127]. It is based on the similar surface wave generation but a microstrip split-ring resonator (MSRR) was used as an alternative to the much large surfatron. Figure 28d shows the excitation of a plasma column of 2 cm with the use of a fabricated MSRR.
In order to enhance the emission of the plasma in the UV domain and to reach the DUV, gas mixtures have been more recently employed by using particularly the ternary mixture Ar-N2-O2 [128]. This has led to the demonstration of a tunable DUV source with the emission of fluorescence and several guided lines in the 200–450 nm wavelength range.
5.2.2. Photo-Induced Plasma
It is common today to have USP lasers emitting peak power of several GW. This corresponds to intensities in the range of several PW/cm2 when the laser beam is coupled into HCPCF. Such an intensity level well surpasses the ionization threshold of most gases. Therefore, in HCPCF this phenomenon appears for lower laser average power values than the one required in simple capillaries in high field domain. This ionization process is intrinsically linked to a loss decrease [129,130].
The effect of this ionization regime has been both theoretically and experimentally studied in gas-filled HCPCF. One can distinguish two different induced effects. The first one is an induced blue-shift effect in the spectrum. The second is an impact on the emission of a resonant dispersive wave [129] in the deep-UV or mid-IR spectral ranges [131,132].
The free electrons directly impact the refractive index and induce a decrease of its value in the time domain and thus a self-steepening of the pulse. Spectrally, one can observe blue-shifting contrary to the Raman self-shifting in conventional fibers. Due to a longer time in the recombination of the electrons, the change in refractive index is still maintained for ultrafast pulses. The loss drop due to the photo-ionization implies a decrease of the pulse intensity and thus limiting progress of the blue-shift. Hölzer et al. illustrated this phenomenon experimentally with the propagation in a Kagome fiber of 800 nm pulses of 9 µJ and 65 fs [133]. Good agreement has been obtained between experiments and numerical simulations when an ionization term is taken into account in the model in term of spectral evolution and also in the energy losses. Further, the theoretical explanations of this blue-shift effect have been deeply developed in References [130,134].
Phase matching conditions can be obtained between a soliton pulse with a wavelength in the anomalous dispersion regime close to the zero-dispersion wavelength and a resonant dispersive wave in the normal dispersion regime. Various experiments results reported on the generation of UV radiation with the use of this resonance effect [129,135] and on the build of a tunable UV ultrashort pulse source in Ar-filled HCPCF for example [136,137]. The ionization phenomenon both experimentally and theoretically has revealed a role in the enhancement of the generation of the UV resonant emission.
5.3. Atom and Molecular Optics
5.3.1. Atom Optics
Atom optics in confined nano- and microstructured devices are becoming a timely topic. The pursuit of miniaturizing atom based functionalities such as frequency references, atomic clocks and quantum sensors is motivated by transferring the outstanding performances in frequency control and coherent optics achieved in laboratory environments to a broader community of users through the development of compact, friendly-user, and stand-alone atom devices. Among the atom devices that have been or are being developed, we cite HCPCF and its gas-filled form the photonic microcell (PMC). The latter outstands with its long interaction length and small modal area, making it thus an efficient platform to enhance gas–laser nonlinear interaction and/or absorption contrast by several orders of magnitude relative to free-space configurations. In this context, in 2006, vapor confined HCPCFs were first reported using Rubidium (Rb) [20,138]. In these seminal works, electromagnetically induced transparency (EIT) generation was demonstrated with a light-level as low as nanowatt power, which represents more than a 1000-fold reduction from the power required in bulk cell. The postprocessing of HCPCF by coating the inner core with specific materials to assess the atom surface dynamics and to reduce the physiochemical adsorption effects is one of the current challenges to improve the alkali vapor PMC performances and to anticipate the avenue of quantum devices based on it [139].
With respect to cold atom manipulation inside HCPCF, rapid progress was made in the last few years despite the experimental difficulties that loading cold atoms inside a micrometer scaled hollow-core entails. The first work on loading cold atoms inside a HCPCF was reported in 2009 by Bajcsy et al. where they demonstrated an optical switch [140,141]. A second work [142] concluded that the long-distance transportation of atoms is feasible which would be a route to guided matter wave interferometry, large-area Sagnac-type interferometers. Other works have recently involved loading Rydberg cold trapped atoms into the core of PBG fibers [21,143]. Finally, another seminal demonstration was motivated to explore quantum metrology and optical atomic clocks, and was reported in Reference [29]. Here, by designing an IC Kagome HCPCF with a sufficiently large core diameter (34 µm) and low residual birefringence, cold 88 Sr atoms from Magneto-optical trap (MOT) (see Figure 29) were successfully loaded into fiber by using optical lattice whose potential depth was 30 μK, whilst keeping the atoms trapped within the wells of an optical lattice. The main result of this work is the demonstration of an absorption line whose linewidth is set by the lifetime of the excited state instead of atom-wall collisional dephasing as one would expect given the microconfinement of the atoms.
5.3.2. Novel Stimulated Raman Scattering Configuration
Recently, an exotic configuration of SRS in H2-filled PBG HCPCF was reported [28], which has the potential of offering both an alternative means for light control and trapping of molecules and for developing high-power and narrow linewidth exotic light sources. This configuration relies on a powerful CW excitation of hydrogen-filled PBG-HCPCF and the generation of forward and backward Stokes radiation. Here, molecular hydrogen is optically self-nanostructured into a periodic lattice whereby the Raman-active molecules are trapped within an array of potential wells with a nanometric width and a depth as high as 55 THz. Such a nanolocalization of the Raman-active molecules created a new Lamb–Dicke regime of SRS. The results and the theoretical model show an unconventional Stokes radiation with sub-recoil linewidth of ~3 kHz (four orders of magnitude lower than Doppler linewidth) (see Figure 30), and a rich spectral structure, which includes Rabi splitting sidebands, molecular motional sidebands, and inter-sideband four wave mixing. Finally, the results show a novel molecular acceleration.
5.4. Quantum Information
One of the main driving subjects in the field of quantum information is the generation of single photon and/or entangled photon multiple sources. Among the recent avenues to generate such nonclassical photon sources are those based on spectrally-entangled photon generation. Here, promising progress in developing photonic devices that enable tuning photon pair phase-matched frequencies was demonstrated using photonic chip [144]. Within this context, recent results exploiting the gas-filled IC-HCPCF’s dispersion spectral profile and its strong nonlinearity show that IC-HCPCF is an excellent platform to both generate and engineer spectrally-entangled photon pairs [145,146,147].
In order explain how the IC-HCPCF properties are relevant to spectrally-correlated photon-pair generation, we recall that the frequency correlation between signal and idler photon pair is described by the joint spectral amplitude function (JSA), which can be approximated as the product of the energy conservation function α(ωs, ωi) and the phase matching function φ(ωs, ωi):F (ωs, ωi) ≈ α(ωs, ωi) φ(ωs, ωi). The profile of the JSA is a direct signature of the correlation nature between the photons of the photon pair; from separable pairs, which can be used for heralded single photon source, to entangle for quantum cryptography. The JSA profile can be engineered by either shaping the spectral/temporal form of the pump or by tuning the phase-matching of the generated single and idler.
In the work reported in Reference [148], the JSA was adjusted by chirp tuning of pump pulses and change of gas nature and pressure. Conversely, Cordier et al. [146] exploited the multidispersion band host to tune photon pair time-frequency correlations. Here, thanks to the IC HCPCFs dispersion profile made of different dispersion band with several zero dispersion wavelengths and S-shape curves, the authors demonstrated theoretically and experimentally the generation of photon pair with controllable joint spectral intensity (JSI = |JSA|2), corresponding to different photon correlation. The photon pair was generated via FWM in different phase matching conditions using gas-filled IC-HCPCF with controllable dispersion and optical nonlinearity. The possibility is offered in such IC gas-filled fibers to position the pump, signal and idler photons in different transmission bands (as shown in Figure 31b). Several JSIs have been produced with different degrees of photons entanglement, and with an active control on the JSI by playing on gas pressure change [147]. In the results presented in Figure 31, the fiber exhibits strut thickness of 600 nm, core radius of 20 µm. The pump wavelength is fixed at 1030 nm and the seed laser is tunable around 1550 nm.
6. Conclusions and Future Trends
To conclude, we reviewed the recent advances in the design, fabrication, and application of hollow-core photonic crystal fibers by bringing to light a unique synergetic relationship between the fundamental ingredients in the rise of HCPCF-based “gas-photonics”, which are glass, gas, and light.
Using notions from solid-state physics, we have given the underlying physical principles of the fiber’s optical guidance mechanisms of the Photonic BandGap and the Inhibited Coupling. We emphasized the role of the modal spectrum of the fiber cladding structure in defining the HCPCF guidance properties. We have shown how an appropriate geometric glass structure of a fiber can structure the fiber modal spectrum. We gave a historical account to show how concepts of atomic physics and solid-state physics, such as tight-binding model or bound-state in a continuum, have been exploited in fiber–photonics to develop double photonic-bandgap HCPCF or hypocycloid core-contour (i.e., negative curvature core-contour) fibers. We listed the evolution of the dramatic drop of the attenuation in HCPCF that followed the introduction of the hypocycloid core-contour, along with the future prospect in fiber photonics that can be achieved with IC-HCPCF.
We finished the review by giving some examples of the results obtained in varied fields using HCPCF and its gas-filled form PMC. These include high energy ultrafast beam delivery, pulse compression with values down to the single-cycle regime, multi-octave fiber-based light sources based on stimulated Raman scattering, supercontinuum generation gases, UV-DUV radiation sources via by plasma generation, gas phase nanostructuring and molecular trapping, and finally, nonclassical light generation.
Author Contributions
Conceptualization, F.B.; Methodology, F.B.; Validation, F.B. and B.D.; Formal Analysis, F.B and B.D..; Investigation, F.B., B.D., F.G., F.A., L.V.; Resources, B.D., F.A., F.G., L.V., F.B.; Data Curation, B.D., F.A., F.G., L.V., F.B.; Writing-Original Draft Preparation, F.B., B.D.; Writing-Review & Editing, B.D., F.A., F.G., L.V., F.B.; Supervision, F.B.; Project Administration, F.B.
Funding
This research received no external funding.
Conflicts of Interest
The authors declare no conflict of interest.
References
- Cregan, R.F.; Mangan, B.J.; Knight, J.C.; Birks, T.A.; Russell, P.S.J.; Roberts, P.J.; Allan, D.C. Single-Mode Photonic Band Gap Guidance of Light in Air. Science 1999, 285, 1537–1539. [Google Scholar] [CrossRef] [PubMed]
- Couny, F.; Benabid, F.; Roberts, P.J.; Burnett, M.T.; Maier, S.A. Identification of Bloch-modes in hollow-core photonic crystal fiber cladding. Opt. Express 2007, 15, 325–338. [Google Scholar] [CrossRef] [PubMed]
- Von Neumann, J.; Wigner, E. Über merkwürdige diskrete Eigenwerte. Phys. Z. 1929, 30, 465–467. [Google Scholar]
- Couny, F.; Benabid, F.; Roberts, P.J.; Light, P.S.; Raymer, M.G. Generation and photonic guidance of multi-octave optical-frequency combs. Science 2007, 318, 1118–1121. [Google Scholar] [CrossRef]
- Benabid, F. Hollow-core photonic bandgap fibre: New light guidance for new science and technology. Philos. Trans. A Math. Phys. Eng. Sci. 2006, 364, 3439–3462. [Google Scholar] [CrossRef]
- Benabid, F.; Couny, F.; Knight, J.C.; Birks, T.A.; Russell, P.S.J. Compact, stable and efficient all-fibre gas cells using hollow-core photonic crystal fibres. Nature 2005, 434, 488. [Google Scholar] [CrossRef]
- Benabid, F.; Roberts, P.J. Linear and nonlinear optical properties of hollow core photonic crystal fiber. J. Mod. Opt. 2011, 58, 87–124. [Google Scholar] [CrossRef]
- Couny, F.; Benabid, F.; Roberts, P.J.; Light, P.S. Fresnel zone imaging of Bloch-modes from a Hollow-Core Photonic Crystal Fiber Cladding. In Proceedings of the 2007 Conference on Lasers and Electro-Optics (CLEO), Baltimore, MD, USA, 6–11 May 2007; pp. 1–2. [Google Scholar]
- Couny, F.; Benabid, F.; Light, P.S. Subwatt threshold cw Raman fiber-gas laser based on H2-filled hollow-core photonic crystal fiber. Phys. Rev. Lett. 2007, 99, 143903. [Google Scholar] [CrossRef]
- Benoît, A.; Beaudou, B.; Alharbi, M.; Debord, B.; Gérôme, F.; Salin, F.; Benabid, F. Over-five octaves wide Raman combs in high-power picosecond-laser pumped H2-filled inhibited coupling Kagome fiber. Opt. Express 2015, 23, 14002–14009. [Google Scholar] [CrossRef]
- Heckl, O.H.; Baer, C.R.E.; Kränkel, C.; Marchese, S.V.; Schapper, F.; Holler, M.; Südmeyer, T.; Robinson, J.S.; Tisch, J.W.G.; Couny, F.; et al. High harmonic generation in a gas-filled hollow-core photonic crystal fiber. Appl. Phys. B 2009, 97, 369. [Google Scholar] [CrossRef]
- Belli, F.; Abdolvand, A.; Chang, W.; Travers, J.C.; Russell, P.S.J. Vacuum-ultraviolet to infrared supercontinuum in hydrogen-filled photonic crystal fiber. Optica 2015, 2, 292–300. [Google Scholar] [CrossRef]
- Debord, B.; Gérôme, F.; Honninger, C.; Mottay, E.; Husakou, A.; Benabid, F. Milli-Joule energy-level comb and supercontinuum generation in atmospheric air-filled inhibited coupling Kagome fiber. In Proceedings of the 2015 Conference on Lasers and Electro-Optics (CLEO), San Jose, CA, USA, 10–15 May 2015; pp. 1–2. [Google Scholar]
- Light, P.S.; Couny, F.; Benabid, F. Low optical insertion-loss and vacuum-pressure all-fiber acetylene cell based on hollow-core photonic crystal fiber. Opt. Lett. 2006, 31, 2538–2540. [Google Scholar] [CrossRef] [PubMed]
- Heckl, O.H.; Saraceno, C.J.; Baer, C.R.E.; Südmeyer, T.; Wang, Y.Y.; Cheng, Y.; Benabid, F.; Keller, U. Temporal pulse compression in a xenon-filled Kagome-type hollow-core photonic crystal fiber at high average power. Opt. Express 2011, 19, 19142–19149. [Google Scholar] [CrossRef] [PubMed]
- Balciunas, T.; Fourcade-Dutin, C.; Fan, G.; Witting, T.; Voronin, A.A.; Zheltikov, A.M.; Gerome, F.; Paulus, G.G.; Baltuska, A.; Benabid, F. A strong-field driver in the single-cycle regime based on self-compression in a kagome fibre. Nat. Commun. 2015, 6, 6117. [Google Scholar] [CrossRef] [Green Version]
- Debord, B.; Dontabactouny, M.; Alharbi, M.; Fourcade-Dutin, C.; Honninger, C.; Mottay, E.; Vincetti, L.; Gerome, F.; Benabid, F. Multi-meter fiber-delivery and compression of milli-Joule femtosecond laser and fiber-aided micromachining. In Proceedings of the Advanced Solid-State Lasers Congress, Paris, France, 27 October–1 November 2013. [Google Scholar]
- Jones, A.M.; Nampoothiri, A.V.V.; Ratanavis, A.; Fiedler, T.; Wheeler, N.V.; Couny, F.; Kadel, R.; Benabid, F.; Washburn, B.R.; Corwin, K.L.; et al. Mid-infrared gas filled photonic crystal fiber laser based on population inversion. Opt. Express 2011, 19, 2309–2316. [Google Scholar] [CrossRef] [PubMed]
- Nampoothiri, A.V.V.; Jones, A.M.; Fourcade-Dutin, C.; Mao, C.; Dadashzadeh, N.; Baumgart, B.; Wang, Y.Y.; Alharbi, M.; Bradley, T.; Campbell, N.; et al. Hollow-core Optical Fiber Gas Lasers (HOFGLAS): A review [Invited]. Opt. Mater. Express 2012, 2, 948–961. [Google Scholar] [CrossRef]
- Ghosh, S.; Bhagwat, A.R.; Renshaw, C.K.; Goh, S.; Gaeta, A.L.; Kirby, B.J. Low-Light-Level Optical Interactions with Rubidium Vapor in a Photonic Band-Gap Fiber. Phys. Rev. Lett. 2006, 97, 23603. [Google Scholar] [CrossRef]
- Epple, G.G.; Kleinbach, K.S.; Euser, T.G.; Joly, N.Y.; Pfau, T.; Russell, P.S.J.; Löw, R. Rydberg atoms in hollow-core photonic crystal fibres. Nat. Commun. 2014, 5, 4132. [Google Scholar] [CrossRef]
- Perrella, C.; Light, P.S.; Anstie, J.D.; Benabid, F.; Stace, T.M.; White, A.G.; Luiten, A.N. High-efficiency cross-phase modulation in a gas-filled waveguide. Phys. Rev. A 2013, 88, 13819. [Google Scholar] [CrossRef]
- Light, P.S.; Benabid, F.; Maric, M.; Luiten, A.N.; Couny, F. Electromagnetically induced transparency in rubidium-filled kagome HC-PCF. In Proceedings of the 2008 Conference on Lasers and Electro-Optics and 2008 Conference on Quantum Electronics and Laser Science, San Jose, CA, USA, 4–9 May 2008; pp. 1–2. [Google Scholar]
- Knebl, A.; Yan, D.; Popp, J.; Frosch, T. Fiber enhanced Raman gas spectroscopy. TrAC Trends Anal. Chem. 2018, 103, 230–238. [Google Scholar] [CrossRef]
- Wang, Y.Y.; Couny, F.; Roberts, P.J.; Benabid, F. Low loss broadband transmission in optimized core-shape Kagome hollow-core PCF. In Proceedings of the CLEO/QELS: 2010 Laser Science to Photonic Applications, San Jose, CA, USA, 16–21 May 2010; pp. 1–2. [Google Scholar]
- Wang, Y.Y.; Wheeler, N.V.; Couny, F.; Roberts, P.J.; Benabid, F. Low loss broadband transmission in hypocycloid-core Kagome hollow-core photonic crystal fiber. Opt. Lett. 2011, 36, 669–671. [Google Scholar] [CrossRef] [PubMed]
- Debord, B.; Jamier, R.; Gérôme, F.; Leroy, O.; Boisse-Laporte, C.; Leprince, P.; Alves, L.L.; Benabid, F. Generation and confinement of microwave gas-plasma in photonic dielectric microstructure. Opt. Express 2013, 21, 25509–25516. [Google Scholar] [CrossRef] [PubMed]
- Alharbi, M.; Husakou, A.; Chafer, M.; Debord, B.; Gérôme, F.; Benabid, F. Raman gas self-organizing into deep nano-trap lattice. Nat. Commun. 2016, 7, 12779. [Google Scholar] [CrossRef] [PubMed] [Green Version]
- Okaba, S.; Takano, T.; Benabid, F.; Bradley, T.; Vincetti, L.; Maizelis, Z.; Yampol’skii, V.; Nori, F.; Katori, H. Lamb-Dicke spectroscopy of atoms in a hollow-core photonic crystal fibre. Nat. Commun. 2014, 5, 4096. [Google Scholar] [CrossRef] [PubMed]
- Debord, B.; Amsanpally, A.; Chafer, M.; Baz, A.; Maurel, M.; Blondy, J.M.; Hugonnot, E.; Scol, F.; Vincetti, L.; Gérôme, F.; Benabid, F. Ultralow transmission loss in inhibited-coupling guiding hollow fibers. Optica 2017, 4, 209–217. [Google Scholar] [CrossRef]
- Debord, B.; Alharbi, M.; Vincetti, L.; Husakou, A.; Fourcade-Dutin, C.; Hoenninger, C.; Mottay, E.; Gérôme, F.; Benabid, F. Multi-meter fiber-delivery and pulse selfcompression of milli-Joule femtosecond laser and fiber-aided laser-micromachining. Opt. Express 2014, 22, 10735–10746. [Google Scholar] [CrossRef]
- Birks, T.A.; Roberts, P.J.; Russell, P.S.J.; Atkin, D.M.; Shepherd, T.J. Full 2-D photonic bandgaps in silica/air structures. Electron. Lett. 1995, 31, 1941–1943. [Google Scholar] [CrossRef]
- Birks, T.A.; Knight, J.C.; Russell, P.S.J. Endlessly single-mode photonic crystal fiber. Opt. Lett. 1997, 22, 961–963. [Google Scholar] [CrossRef]
- Knight, J.C.; Birks, T.A.; Cregan, R.F.; Russell, P.S.J.; de Sandro, P.D. Large mode area photonic crystal fibre. Electron. Lett. 1998, 34, 1347–1348. [Google Scholar] [CrossRef]
- Limpert, J.; Liem, A.; Reich, M.; Schreiber, T.; Nolte, S.; Zellmer, H.; Tünnermann, A.; Broeng, J.; Petersson, A.; Jakobsen, C. Low-nonlinearity single-transverse-mode ytterbium-doped photonic crystal fiber amplifier. Opt. Express 2004, 12, 1313–1319. [Google Scholar] [CrossRef]
- Ortigosa-Blanch, A.; Knight, J.C.; Wadsworth, W.J.; Arriaga, J.; Mangan, B.J.; Birks, T.A.; Russell, P.S.J. Highly birefringent photonic crystal fibers. Opt. Lett. 2000, 25, 1325–1327. [Google Scholar] [CrossRef] [PubMed]
- Mangan, B.J.; Couny, F.; Farr, L.; Langford, A.; Roberts, P.J.; Williams, D.P.; Banham, M.; Mason, M.W.; Murphy, D.F.; Brown, E.A.M.; et al. Slope-matched dispersion-compensating photonic crystal fibre. In Proceedings of the Conference on Lasers and Electro-Optics/International Quantum Electronics Conference and Photonic Applications Systems Technologies, San Francisco, CA, USA, 16–21 May 2014. [Google Scholar]
- Argyros, A.; Birks, T.A.; Leon-Saval, S.G.; Cordeiro, C.M.B.; Russell, P.S.J. Guidance properties of low-contrast photonic bandgap fibres. Opt. Express 2005, 13, 2503–2511. [Google Scholar] [CrossRef] [PubMed]
- Grujic, T.; Kuhlmey, B.T.; Argyros, A.; Coen, S.; de Sterke, C.M. Solid-core fiber with ultra-wide bandwidth transmission window due to inhibited coupling. Opt. Express 2010, 18, 25556–25566. [Google Scholar] [CrossRef]
- Cerqueira, S.A.; Luan, F.; Cordeiro, C.M.B.; George, A.K.; Knight, J.C. Hybrid photonic crystal fiber. Opt. Express 2006, 14, 926–931. [Google Scholar] [CrossRef]
- Monro, T.M.; West, Y.D.; Hewak, D.W.; Broderick, N.G.R.; Richardson, D.J. Chalcogenide holey fibres. Electron. Lett. 2000, 36, 1998–2000. [Google Scholar] [CrossRef]
- Sanghera, J.S.; Shaw, L.B.; Pureza, P.; Nguyen, V.Q.; Gibson, D.; Busse, L.; Aggarwal, I.D.; Florea, C.M.; Kung, F.H. Nonlinear Properties of Chalcogenide Glass Fibers. Int. J. Appl. Glas. Sci. 2010, 1, 296–308. [Google Scholar] [CrossRef] [Green Version]
- John, S. Strong localization of photons in certain disordered dielectric superlattices. Phys. Rev. Lett. 1987, 58, 2486–2489. [Google Scholar] [CrossRef]
- Yablonovitch, E. Inhibited Spontaneous Emission in Solid-State Physics and Electronics. Phys. Rev. Lett. 1987, 58, 2059–2062. [Google Scholar] [CrossRef]
- Yablonovitch, E. Photonic band-gap structures. J. Opt. Soc. Am. B 1993, 10, 283. [Google Scholar] [CrossRef]
- Benabid, F.; Knight, J.C.; Antonopoulos, G.; Russell, P.S.J. Stimulated Raman scattering in hydrogen-filled hollow-core photonic crystal fiber. Science 2002, 298, 399–402. [Google Scholar] [CrossRef]
- Venkataraman, N.; Gallagher, M.T.; Smith, C.M.; Muller, D.; West, J.A.; Koch, K.W.; Fajardo, J.C. Low Loss (13 dB/km) Air Core Photonic Band-Gap Fibre. In Proceedings of the 2002 28th European Conference on Optical Communication, Copenhagen, Denmark, 8–12 September 2002; Volume 5, pp. 1–2. [Google Scholar]
- Russell, P. Photonic Crystal Fibers. Science 2003, 299, 358–362. [Google Scholar] [CrossRef]
- Roberts, P.; Couny, F.; Sabert, H.; Mangan, B.J.; Williams, D.P.; Farr, L.; Mason, M.W.; Tomlinson, A.; Birks, T.A.; Knight, J.C.; et al. Ultimate low loss of hollow-core photonic crystal fibres. Opt. Express 2005, 13, 236–244. [Google Scholar] [CrossRef] [PubMed]
- Marcatili, E.A.J.; Schmeltzer, R.A. Hollow metallic and dielectric waveguides for long distance optical transmission and lasers. Bell Syst. Tech. J. 1964, 43, 1783–1809. [Google Scholar] [CrossRef]
- Duguay, M.A.; Kokubun, Y.; Koch, T.L.; Pfeiffer, L. Antiresonant reflecting optical waveguides in SiO2-Si multilayer structures. Appl. Phys. Lett. 1986, 49, 13–15. [Google Scholar] [CrossRef]
- Hsu, C.W.; Zhen, B.; Stone, A.D.; Joannopoulos, J.D.; Soljačić, M. Bound states in the continuum. Nat. Rev. Mater. 2016, 1, 16048. [Google Scholar] [CrossRef] [Green Version]
- Pryamikov, A.D.; Biriukov, A.S.; Kosolapov, A.F.; Plotnichenko, V.G.; Semjonov, S.L.; Dianov, E.M. Demonstration of a waveguide regime for a silica hollow—Core microstructured optical fiber with a negative curvature of the core boundary in the spectral region > 3.5 μm. Opt. Express 2011, 19, 1441. [Google Scholar] [CrossRef] [PubMed]
- Yu, F.; Wadsworth, W.J.; Knight, J.C. Low loss silica hollow core fibers for 3–4 μm spectral region. Opt. Express 2012, 20, 11153–11158. [Google Scholar] [CrossRef]
- Vincetti, L.; Setti, V. Waveguiding mechanism in tube lattice fibers. Opt. Express 2010, 18, 23133. [Google Scholar] [CrossRef]
- Poletti, F. Nested antiresonant nodeless hollow core fiber. Opt. Express 2014, 22, 23807. [Google Scholar] [CrossRef]
- Habib, M.S.; Bang, O.; Bache, M. Low-loss hollow-core silica fibers with adjacent nested anti-resonant tubes. Opt. Express 2015, 23, 17394–17406. [Google Scholar] [CrossRef]
- Gao, S.; Wang, Y.; Ding, W.; Jiang, D.; Gu, S.; Zhang, X.; Wang, P. Hollow-core conjoined-tube negative-curvature fibre with ultralow loss. Nat. Commun. 2018, 9, 2828. [Google Scholar] [CrossRef] [PubMed]
- Belardi, W.; Knight, J.C. Hollow antiresonant fibers with reduced attenuation. Opt. Lett. 2014, 39, 1853. [Google Scholar] [CrossRef] [PubMed] [Green Version]
- Belardi, W. Design and Properties of Hollow Antiresonant Fibers for the Visible and Near Infrared Spectral Range. J. Light. Technol. 2015, 33, 4497–4503. [Google Scholar] [CrossRef] [Green Version]
- Wang, Y.Y.; Peng, X.; Alharbi, M.; Dutin, C.F.; Bradley, T.D.; Gérôme, F.; Mielke, M.; Booth, T.; Benabid, F. Design and fabrication of hollow-core photonic crystal fibers for high-power ultrashort pulse transportation and pulse compression. Opt. Lett. 2012, 37, 3111–3113. [Google Scholar] [CrossRef] [PubMed]
- Bradley, T.D.; Wang, Y.; Alharbi, M.; Debord, B.; Fourcade-Dutin, C.; Beaudou, B.; Gerome, F.; Benabid, F. Optical properties of low loss (70 dB/km) hypocycloid-core kagome hollow core photonic crystal fiber for Rb and Cs based optical applications. J. Light. Technol. 2013, 31, 2752–2755. [Google Scholar] [CrossRef]
- Debord, B.; Alharbi, M.; Bradley, T.; Fourcade-Dutin, C.; Wang, Y.Y.; Vincetti, L.; Gérôme, F.; Benabid, F. Hypocycloid-shaped hollow-core photonic crystal fiber Part I: Arc curvature effect on confinement loss. Opt. Express 2013, 21, 28597–28608. [Google Scholar] [CrossRef] [PubMed]
- Debord, B.; Alharbi, M.; Benoît, A.; Ghosh, D.; Dontabactouny, M.; Vincetti, L.; Blondy, J.-M.; Gérôme, F.; Benabid, F. Ultra low-loss hypocycloid-core Kagome hollow-core photonic crystal fiber for green spectral-range applications. Opt. Lett. 2014, 39, 6245–6248. [Google Scholar] [CrossRef] [PubMed]
- Maurel, M.; Chafer, M.; Amsanpally, A.; Adnan, M.; Amrani, F.; Debord, B.; Vincetti, L.; Gérôme, F.; Benabid, F. Optimized inhibited-coupling Kagome fibers at Yb-Nd:Yag (8.5 dB/km) and Ti:Sa (30 dB/km) ranges. Opt. Lett. 2018, 43, 1598–1601. [Google Scholar] [CrossRef] [PubMed]
- Bagley, R.D. Extrusion Method for Forming thin-Walled Honeycomb Structures. U.S. Patent US3790654A, 5 February 1974. [Google Scholar]
- Knight, J.C.; Birks, T.A.; Russell, P.S.J.; Atkin, D.M. All-silica single-mode optical fiber with photonic crystal cladding. Opt. Lett. 1996, 21, 1547. [Google Scholar] [CrossRef] [PubMed]
- Edagawa, K. Photonic crystals, amorphous materials, and quasicrystals. Sci. Technol. Adv. Mater. 2014, 15, 34805. [Google Scholar] [CrossRef] [PubMed] [Green Version]
- Snyder, A.W.; Love, J.D. Optical Waveguide Theory; Chapman & Hall: London, UK; New York, NY, USA, 1983. [Google Scholar]
- Shechtman, D.; Blech, I.; Gratias, D.; Cahn, J.W. Metallic Phase with Long-Range Orientational Order and No Translational Symmetry. Phys. Rev. Lett. 1984, 53, 1951–1953. [Google Scholar] [CrossRef]
- Couny, F.; Benabid, F.; Light, P.S. Large-pitch kagome-structured hollow-core photonic crystal fiber. Opt. Lett. 2006, 31, 3574–3576. [Google Scholar] [CrossRef] [PubMed]
- Marzari, N.; Mostofi, A.A.; Yates, J.R.; Souza, I.; Vanderbilt, D. Maximally localized Wannier functions: Theory and applications. Rev. Mod. Phys. 2012, 84, 1419–1475. [Google Scholar] [CrossRef] [Green Version]
- Argyros, A.; Birks, T.A.; Leon-Saval, S.G.; Cordeiro, C.M.B.; Luan, F.; Russell, P.S.J. Photonic bandgap with an index step of one percent. Opt. Express 2005, 13, 309–314. [Google Scholar] [CrossRef] [PubMed]
- Light, P.S.; Couny, F.; Wang, Y.Y.; Wheeler, N.V.; Roberts, P.J.; Benabid, F. Double photonic bandgap hollow-core photonic crystal fiber. Opt. Express 2009, 17, 16238–16243. [Google Scholar] [CrossRef] [PubMed]
- Hedley, T.D.; Bird, D.M.; Benabid, F.; Knight, J.C.; Russell, P.S.J. Modelling of a novel hollow-core photonic crystal fibre. In Proceedings of the Conference on Quantum Electronics and Laser Science (QELS), Baltimore, MD, USA, 6 June 2003. [Google Scholar]
- Archambault, J.L.; Black, R.J.; Lacroix, S.; Bures, J. Loss calculations for antiresonant waveguides. J. Light. Technol. 1993, 11, 416–423. [Google Scholar] [CrossRef]
- Tamir, T. Integrated Optics. In Topics in Applied Physics; Springer: Berlin, Germany, 1975; Volume 7. [Google Scholar]
- Benabid, F.; Roberts, P.J. Photonic Crystal Hollow Waveguides. In Handbook Of Optofluidics; Hawkins, A.R., Schmidt, H., Eds.; Taylor & Francis Group: Abingdon, UK, 2010. [Google Scholar]
- Birks, T.A.; Bird, D.M.; Benabid, F.; Roberts, P.J. Strictly-bound modes of an idealised hollow-core fibre without a photonic bandgap. In Proceedings of the European Conference on Optical Communication, ECOC, Torino, Italy, 19–23 September 2010; pp. 1–2. [Google Scholar]
- Couny, F.; Benabid, F.; Light, P.S. Large Pitch Kagome-Structured Hollow-Core PCF. In Proceedings of the 2007 Conference on Lasers and Electro-Optics (CLEO), Baltimore, MD, USA, 6–11 May 2007; pp. 1–2. [Google Scholar]
- Couny, F.; Roberts, P.J.; Birks, T.A.; Benabid, F. Square-lattice large-pitch hollow-core photonic crystal fiber. Opt. Express 2008, 16, 20626–20636. [Google Scholar] [CrossRef] [PubMed]
- Beaudou, B.; Couny, F.; Benabid, F.; Roberts, P.J. Large Pitch Hollow Core Honeycomb Fiber. In Proceedings of the Conference on Lasers and Electro-Optics/Quantum Electronics and Laser Science Conference and Photonic Applications Systems Technologies, San Jose, CA, USA, 4–9 May 2008. [Google Scholar]
- Alharbi, M.; Bradley, T.; Debord, B.; Fourcade-Dutin, C.; Ghosh, D.; Vincetti, L.; Gérôme, F.; Benabid, F. Hypocycloid-shaped hollow-core photonic crystal fiber Part II: Cladding effect on confinement and bend loss. Opt. Express 2013, 21, 28609–28616. [Google Scholar] [CrossRef]
- Fokoua, E.N.; Poletti, F.; Richardson, D.J. Analysis of light scattering from surface roughness in hollow-core photonic bandgap fibers. Opt. Express 2012, 20, 20980. [Google Scholar] [CrossRef]
- Kharadly, M.M.Z.; Lewis, J.E. Properties of dielectric-tube waveguides. Proc. Inst. Electr. Eng. 1969, 116, 214–224. [Google Scholar] [CrossRef]
- Burns, W.K. Normal mode analysis of waveguide devices. I. Theory. J. Light. Technol. 1988, 6, 1051–1057. [Google Scholar] [CrossRef]
- Uebel, P.; Günendi, M.C.; Frosz, M.H.; Ahmed, G.; Edavalath, N.N.; Ménard, J.; Russell, P.S.J. Broadband robustly single-mode hollow-core PCF by resonant filtering of higher-order modes. Opt. Lett. 2016, 41, 1961. [Google Scholar] [CrossRef] [PubMed] [Green Version]
- Michieletto, M.; Lyngsø, J.K.; Jakobsen, C.; Lægsgaard, J.; Bang, O.; Alkeskjold, T.T. Hollow-core fibers for high power pulse delivery. Opt. Express 2016, 24, 7103. [Google Scholar] [CrossRef] [PubMed] [Green Version]
- Hayes, J.R.; Sandoghchi, S.R.; Bradley, T.D.; Liu, Z.; Slavík, R.; Gouveia, M.A.; Wheeler, N.V.; Jasion, G.; Chen, Y.; Fokoua, E.N.; et al. Antiresonant Hollow Core Fiber With an Octave Spanning Bandwidth for Short Haul Data Communications. J. Light. Technol. 2017, 35, 437–442. [Google Scholar] [CrossRef] [Green Version]
- Chafer, M.; Delahaye, F.; Amrani, F.; Debord, B.; Gérôme, F.; Benabid, F. 1 km long HC-PCF with losses at the fundamental Rayleigh scattering limit in the green wavelength range. In Proceedings of the Conference on Lasers and Electro-Optics, San Jose, CA, USA, 13–18 May 2018. [Google Scholar]
- Gao, S.-F.; Wang, Y.-Y.; Ding, W.; Wang, P. Hollow-core negative-curvature fiber for UV guidance. Opt. Lett. 2018, 43, 1347. [Google Scholar] [CrossRef] [PubMed]
- Litchinitser, N.M.; Abeeluck, A.K.; Headley, C.; Eggleton, B.J. Antiresonant reflecting photonic crystal optical waveguides. Opt. Lett. 2002, 27, 1592–1594. [Google Scholar] [CrossRef] [PubMed]
- Miyagi, M.; Nishida, S. A Proposal of Low-Loss Leaky Waveguide for Submillimeter Waves Transmission. IEEE Trans. Microw. Theory Tech. 1980, 28, 398–401. [Google Scholar] [CrossRef]
- Bornstein, A.; Croitoru, N. Experimental evaluation of a hollow glass fiber. Appl. Opt. 1986, 25, 355–358. [Google Scholar] [CrossRef]
- Zeisberger, M.; Schmidt, M.A. Analytic model for the complex effective index of the leaky modes of tube-type anti-resonant hollow core fibers. Sci. Rep. 2017, 7, 11761. [Google Scholar] [CrossRef]
- Bird, D. Attenuation of model hollow-core, anti-resonant fibres. Opt. Express 2017, 25, 23215–23237. [Google Scholar] [CrossRef] [PubMed]
- Fini, J.M.; Nicholson, J.W.; Mangan, B.; Meng, L.; Windeler, R.S.; Monberg, E.M.; DeSantolo, A.; DiMarcello, F.V.; Mukasa, K. Polarization maintaining single-mode low-loss hollow-core fibres. Nat. Commun. 2014, 5, 5085. [Google Scholar] [CrossRef] [PubMed] [Green Version]
- Nicholson, J.W.; Yablon, A.D.; Ramachandran, S.; Ghalmi, S. Spatially and spectrally resolved imaging of modal content in large-mode-area fibers. Opt. Express 2008, 16, 7233–7243. [Google Scholar] [CrossRef] [PubMed]
- Debord, B.; Gérôme, F.; Paul, P.-M.; Husakou, A.; Benabid, F. 2.6 mJ energy and 81 GW peak power femtosecond laser-pulse delivery and spectral broadening in inhibited coupling Kagome fiber. In Proceedings of the CLEO: 2015, San Jose, CA, USA, 10–15 May 2015. [Google Scholar]
- Beaudou, B.; Gerôme, F.; Wang, Y.Y.; Alharbi, M.; Bradley, T.D.; Humbert, G.; Auguste, J.-L.; Blondy, J.-M.; Benabid, F. Millijoule laser pulse delivery for spark ignition through kagome hollow-core fiber. Opt. Lett. 2012, 37, 1430. [Google Scholar] [CrossRef] [PubMed] [Green Version]
- Peng, X.; Mielke, M.; Booth, T. High average power, high energy 155 μm ultra-short pulse laser beam delivery using large mode area hollow core photonic band-gap fiber. Opt. Express 2011, 19, 923. [Google Scholar] [CrossRef] [PubMed]
- Shephard, J.D.; Couny, F.; Russell, P.S.J.; Jones, J.D.C.; Knight, J.C.; Hand, D.P. Improved hollow-core photonic crystal fiber design for delivery of nanosecond pulses in laser micromachining applications. Appl. Opt. 2005, 44, 4582. [Google Scholar] [CrossRef]
- Tauer, J.; Orban, F.; Kofler, H.; Fedotov, A.B.; Fedotov, I.V.; Mitrokhin, V.P.; Zheltikov, A.M.; Wintner, E. High-throughput of single high-power laser pulses by hollow photonic band gap fibers. Laser Phys. Lett. 2007, 4, 444–448. [Google Scholar] [CrossRef]
- Hädrich, S.; Rothhardt, J.; Demmler, S.; Tschernajew, M.; Hoffmann, A.; Krebs, M.; Liem, A.; de Vries, O.; Plötner, M.; Fabian, S.; et al. Scalability of components for kW-level average power few-cycle lasers. Appl. Opt. 2016, 55, 1636. [Google Scholar] [CrossRef]
- Lee, E.; Luo, J.; Sun, B.; Ramalingam, V.L.; Yu, X.; Wang, Q.; Yu, F.; Knight, J.C. 45W 2 µm Nanosecond Pulse Delivery Using Antiresonant Hollow-Core Fiber. In Proceedings of the Conference on Lasers and Electro-Optics, San Jose, CA, USA, 13–18 May 2018. [Google Scholar]
- Hädrich, S.; Krebs, M.; Hoffmann, A.; Klenke, A.; Rothhardt, J.; Limpert, J.; Tünnermann, A. Exploring new avenues in high repetition rate table-top coherent extreme ultraviolet sources. Light Sci. Appl. 2015, 4, e320. [Google Scholar] [CrossRef]
- Jaworski, P.; Yu, F.; Carter, R.M.; Knight, J.C.; Shephard, J.D.; Hand, D.P. High energy green nanosecond and picosecond pulse delivery through a negative curvature fiber for precision micro-machining. Opt. Express 2015, 23, 8498. [Google Scholar] [CrossRef] [Green Version]
- Gebert, F.; Frosz, M.H.; Weiss, T.; Wan, Y.; Ermolov, A.; Joly, N.Y.; Schmidt, P.O.; Russell, P.S.J. Damage-free single-mode transmission of deep-UV light in hollow-core PCF. Opt. Express 2014, 22, 15388–15396. [Google Scholar] [CrossRef] [PubMed] [Green Version]
- Pricking, S.; Gebs, R.; Fleischhaker, R.; Kleinbauer, J.; Budnicki, A.; Sutter, D.H.; Killi, A.; Weiler, S.; Mielke, M.; Beaudou, B.; et al. Hollow core fiber delivery of sub-ps pulses from a TruMicro 5000 Femto edition thin disk amplifier. Proc. SPIE 2015, 9356, 935602. [Google Scholar]
- Yalin, A.P. High power fiber delivery for laser ignition applications. Opt. Express 2013, 21, A1102. [Google Scholar] [CrossRef]
- Subramanian, K.; Gabay, I.; Ferhanoğlu, O.; Shadfan, A.; Pawlowski, M.; Wang, Y.; Tkaczyk, T.; Ben-Yakar, A. Kagome fiber based ultrafast laser microsurgery probe delivering micro-Joule pulse energies. Biomed. Opt. Express 2016, 7, 4639. [Google Scholar] [CrossRef] [PubMed]
- Ferhanoglu, O.; Yildirim, M.; Subramanian, K.; Ben-Yakar, A. A 5-mm piezo-scanning fiber device for high speed ultrafast laser microsurgery. Biomed. Opt. Express 2014, 5, 2023. [Google Scholar] [CrossRef] [PubMed] [Green Version]
- Keller, U. Recent developments in compact ultrafast lasers. Nature 2003, 424, 831. [Google Scholar] [CrossRef] [PubMed]
- Mak, K.F.; Travers, J.C.; Joly, N.Y.; Abdolvand, A.; Russell, P.S.J. Two techniques for temporal pulse compression in gas-filled hollow-core kagomé photonic crystal fiber. Opt. Lett. 2013, 38, 3592–3595. [Google Scholar] [CrossRef]
- Guichard, F.; Giree, A.; Zaouter, Y.; Hanna, M.; Machinet, G.; Debord, B.; Gérôme, F.; Dupriez, P.; Druon, F.; Hönninger, C.; et al. Nonlinear compression of high energy fiber amplifier pulses in air-filled hypocycloid-core Kagome fiber. Opt. Express 2015, 23, 7416–7423. [Google Scholar] [CrossRef]
- Emaury, F.; Dutin, C.F.; Saraceno, C.J.; Trant, M.; Heckl, O.H.; Wang, Y.Y.; Schriber, C.; Gerome, F.; Südmeyer, T.; Benabid, F.; Keller, U. Beam delivery and pulse compression to sub-50 fs of a modelocked thin-disk laser in a gas-filled Kagome-type HC-PCF fiber. Opt. Express 2013, 21, 4986. [Google Scholar] [CrossRef] [Green Version]
- Gebhardt, M.; Gaida, C.; Heuermann, T.; Stutzki, F.; Jauregui, C.; Antonio-Lopez, J.; Schulzgen, A.; Amezcua-Correa, R.; Limpert, J.; Tünnermann, A. Nonlinear pulse compression to 43 W GW-class few-cycle pulses at 2 μm wavelength. Opt. Lett. 2017, 42, 4179–4182. [Google Scholar] [CrossRef]
- Murari, K.; Stein, G.J.; Cankaya, H.; Debord, B.; Gérôme, F.; Cirmi, G.; Mücke, O.D.; Li, P.; Ruehl, A.; Hartl, I.; et al. Kagome-fiber-based pulse compression of mid-infrared picosecond pulses from a Ho:YLF amplifier. Optica 2016, 3, 816–822. [Google Scholar] [CrossRef]
- Benabid, F.; Bouwmans, G.; Knight, J.C.; Russell, P.S.J.; Couny, F. Ultrahigh Efficiency Laser Wavelength Conversion in a Gas-Filled Hollow Core Photonic Crystal Fiber by Pure Stimulated Rotational Raman Scattering in Molecular Hydrogen. Phys. Rev. Lett. 2004, 93, 123903. [Google Scholar] [CrossRef] [PubMed]
- Wang, Y.Y.; Wu, C.; Couny, F.; Raymer, M.G.; Benabid, F. Quantum-Fluctuation-Initiated Coherence in Multioctave Raman Optical Frequency Combs. Phys. Rev. Lett. 2010, 105, 123603. [Google Scholar] [CrossRef] [PubMed]
- Hosseini, P.; Abdolvand, A.; Russell, P.S.J. Generation of spectral clusters in a mixture of noble and Raman-active gases. Opt. Lett. 2016, 41, 5543. [Google Scholar] [CrossRef] [PubMed] [Green Version]
- Alharbi, M.; Debord, B.; Dontabactouny, M.; Gérôme, F.; Benabid, F. 17.6 THz waveform synthesis by phase-locked Raman sidebands generation in HC-PCF. In Proceedings of the CLEO: 2014, San Jose, CA, USA, 8–13 June 2014. [Google Scholar]
- Cassataro, M.; Novoa, D.; Günendi, M.C.; Edavalath, N.N.; Frosz, M.H.; Travers, J.C.; Russell, P.S.J. Generation of broadband mid-IR and UV light in gas-filled single-ring hollow-core PCF. Opt. Express 2017, 25, 7637–7644. [Google Scholar] [CrossRef] [PubMed]
- Raizer, Y.P. Gas Discharge Physics; Springer: Berlin, Ggrmany, 1991. [Google Scholar]
- Moisan, M.; Beaudry, C.; Leprince, P. A Small Microwave Plasma Source for Long Column Production without Magnetic Field. IEEE Trans. Plasma Sci. 1975, 3, 55–59. [Google Scholar] [CrossRef]
- Debord, B.; Alves, L.L.; Gérôme, F.; Jamier, R.; Leroy, O.; Boisse-Laporte, C.; Leprince, P.; Benabid, F. Microwave-driven plasmas in hollow-core photonic crystal fibres. Plasma Sources Sci. Technol. 2014, 23, 015022. [Google Scholar] [CrossRef]
- Vial, F.; Gadonna, K.; Debord, B.; Delahaye, F.; Amrani, F.; Leroy, O.; Gérôme, F.; Benabid, F. Generation of surface-wave microwave microplasmas in hollow-core photonic crystal fiber based on a split-ring resonator. Opt. Lett. 2016, 41, 2286–2289. [Google Scholar] [CrossRef]
- Amrani, F.; Delahaye, F.; Debord, B.; Alves, L.L.; Gerome, F.; Benabid, F. Gas mixture for deep-UV plasma emission in a hollow-core photonic crystal fiber. Opt. Lett. 2017, 42, 3363–3366. [Google Scholar] [CrossRef]
- Chang, W.; Nazarkin, A.; Travers, J.C.; Nold, J.; Hölzer, P.; Joly, N.Y.; Russell, P.S.J. Influence of ionization on ultrafast gas-based nonlinear fiber optics. Opt. Express 2011, 19, 4856–4863. [Google Scholar] [CrossRef]
- Saleh, M.F.; Biancalana, F. Understanding the dynamics of photoionization-induced nonlinear effects and solitons in gas-filled hollow-core photonic crystal fibers. Phys. Rev. A 2011, 84, 063838. [Google Scholar] [CrossRef]
- Köttig, F.; Novoa, D.; Tani, F.; Günendi, M.C.; Cassataro, M.; Travers, J.C.; Russell, P.S.J. Mid-infrared dispersive wave generation in gas-filled photonic crystal fibre by transient ionization-driven changes in dispersion. Nat. Commun. 2017, 8, 813. [Google Scholar] [CrossRef] [PubMed] [Green Version]
- Novoa, D.; Cassataro, M.; Travers, J.C.; Russell, P.S.J. Photoionization-Induced Emission of Tunable Few-Cycle Midinfrared Dispersive Waves in Gas-Filled Hollow-Core Photonic Crystal Fibers. Phys. Rev. Lett. 2015, 115, 033901. [Google Scholar] [CrossRef] [PubMed] [Green Version]
- Hölzer, P.; Chang, W.; Travers, J.C.; Nazarkin, A.; Nold, J.; Joly, N.Y.; Saleh, M.F.; Biancalana, F.; Russell, P.S.J. Femtosecond Nonlinear Fiber Optics in the Ionization Regime. Phys. Rev. Lett. 2011, 107, 203901. [Google Scholar] [CrossRef] [PubMed]
- Saleh, M.F.; Chang, W.; Hölzer, P.; Nazarkin, A.; Travers, J.C.; Joly, N.Y.; Russell, P.S.J.; Biancalana, F. Theory of Photoionization-Induced Blueshift of Ultrashort Solitons in Gas-Filled Hollow-Core Photonic Crystal Fibers. Phys. Rev. Lett. 2011, 107, 203902. [Google Scholar] [CrossRef]
- Meng, F.; Liu, B.; Wang, S.; Liu, J.; Li, Y.; Wang, C.; Zheltikov, A.M.; Hu, M. Controllable two-color dispersive wave generation in argon-filled hypocycloid-core kagome fiber. Opt. Express 2017, 25, 32972. [Google Scholar] [CrossRef]
- Joly, N.Y.; Nold, J.; Chang, W.; Hölzer, P.; Nazarkin, A.; Wong, G.K.L.; Biancalana, F.; Russell, P.S. Bright Spatially Coherent Wavelength-Tunable Deep-UV Laser Source Using an Ar-Filled Photonic Crystal Fiber. Phys. Rev. Lett. 2011, 106, 203901. [Google Scholar] [CrossRef] [PubMed]
- Mak, K.F.; Travers, J.C.; Hölzer, P.; Joly, N.Y.; Russell, P.S.J. Tunable vacuum-UV to visible ultrafast pulse source based on gas-filled Kagome-PCF. Opt. Express 2013, 21, 10942. [Google Scholar] [CrossRef]
- Light, P.S.; Benabid, F.; Couny, F.; Maric, M.; Luiten, A.N. Electromagnetically induced transparency in Rb-filled coated hollow-core photonic crystal fiber. Opt. Lett. 2007, 32, 1323–1325. [Google Scholar] [CrossRef]
- Bradley, T.D.; Jouin, J.; McFerran, J.J.; Thomas, P.; Gerome, F.; Benabid, F. Extended duration of rubidium vapor in aluminosilicate ceramic coated hypocycloidal core Kagome HC-PCF. J. Light. Technol. 2014, 32, 2486–2491. [Google Scholar]
- Bajcsy, M.; Hofferberth, S.; Balic, V.; Peyronel, T.; Hafezi, M.; Zibrov, A.S.; Vuletic, V.; Lukin, M.D. Efficient All-Optical Switching Using Slow Light within a Hollow Fiber. Phys. Rev. Lett. 2009, 102, 203902. [Google Scholar] [CrossRef] [PubMed]
- Bajcsy, M.; Hofferberth, S.; Peyronel, T.; Balic, V.; Liang, Q.; Zibrov, A.S.; Vuletic, V.; Lukin, M.D. Laser-cooled atoms inside a hollow-core photonic-crystal fiber. Phys. Rev. A 2011, 83, 63830. [Google Scholar] [CrossRef] [Green Version]
- Vorrath, S.; Möller, S.A.; Windpassinger, P.; Bongs, K.; Sengstock, K. Efficient guiding of cold atoms through a photonic band gap fiber. New J. Phys. 2010, 12, 123015. [Google Scholar] [CrossRef] [Green Version]
- Langbecker, M.; Noaman, M.; Kjaergaard, N.; Benabid, F.; Windpassinger, P. Rydberg excitation of cold atoms inside a hollow-core fiber. Phys. Rev. A 2017, 96, 41402. [Google Scholar] [CrossRef]
- Kumar, R.; Ong, J.R.; Savanier, M.; Mookherjea, S. Controlling the spectrum of photons generated on a silicon nanophotonic chip. Nat. Commun. 2014, 5, 5489. [Google Scholar] [CrossRef] [Green Version]
- Ortiz-Ricardo, E.; Bertoni-Ocampo, C.; Ibarra-Borja, Z.; Ramirez-Alarcon, R.; Cruz-Delgado, D.; Cruz-Ramirez, H.; Garay-Palmett, K.; U’Ren, A.B. Spectral tunability of two-photon states generated by spontaneous four-wave mixing: Fibre tapering, temperature variation and longitudinal stress. Quantum Sci. Technol. 2017, 2, 034015. [Google Scholar] [CrossRef]
- Cordier, M.; Orieux, A.; Debord, B.; Gérome, F.; Gorse, A.; Chafer, M.; Diamanti, E.; Delaye, P.; Benabid, F.; Zaquine, I. Shaping photon-pairs time-frequency correlations in inhibited-coupling hollow-core fibers. In Proceedings of the Conference on Lasers and Electro-Optics, San Jose, CA, USA, 13–18 May 2018. [Google Scholar]
- Cordier, M.; Orieux, A.; Debord, B.; Gérome, F.; Gorse, A.; Chafer, M.; Diamanti, E.; Delaye, P.; Benabid, F.; Zaquine, I. Active engineering of four-wave mixing spectral entanglement in hollow-core fibers. ArXiv, 2018; arXiv:1807.11402. [Google Scholar]
- Finger, M.A.; Joly, N.Y.; Russell, P.S.J.; Chekhova, M.V. Characterization and shaping of the time-frequency Schmidt mode spectrum of bright twin beams generated in gas-filled hollow-core photonic crystal fibers. Phys. Rev. A 2017, 95, 053814. [Google Scholar] [CrossRef] [Green Version]
Figure 1.
Synergetic cycle between gas, glass, and light in HCPCF science and technology and HCPCF-based applications. Representative examples of HCPCF related research activities. (a) Schematic of gas pressurization and evacuation during HCPCF drawing process. (b) Modal spectrum of an infinite cladding made with tubular lattice. Inset: unit cell of a tubular lattice (reprinted with permission from Reference [30], OSA, 2017). (c) Illustration of nanolayer of hydrogen molecules (Raman-active gas) formed by special stimulated Raman scattering configuration [28]. (d) Fluorescence from a plasma core photonic crystal fiber (reprinted with permission from Reference [27], OSA, 2013). (e) Engraving of glass sheet with HCPCF output laser (reprinted with permission from Reference [31], OSA, 2014). (f) Over five octave Raman comb generated and transmitted through hydrogen-filled-HCPCF (reprinted with permission from Reference [10], OSA, 2015).

Figure 2.
Photonic crystal fibers family tree diagram (top). Micrographs of HCPCF-based on PBG guidance and IC guidance.
Figure 2.
Photonic crystal fibers family tree diagram (top). Micrographs of HCPCF-based on PBG guidance and IC guidance.

Figure 3.
(a) Schematic of the HCPCF fabrication process highlighting; (b) the structuration of glass with gas.
Figure 3.
(a) Schematic of the HCPCF fabrication process highlighting; (b) the structuration of glass with gas.

Figure 4.
Modal content representation of the three different optical guiding fibers: (a) Total Internal Reflection (TIR); (b) Photonic Band Gap (PBG); and (c) Inhibited Coupling (IC) guiding fibers.
Figure 4.
Modal content representation of the three different optical guiding fibers: (a) Total Internal Reflection (TIR); (b) Photonic Band Gap (PBG); and (c) Inhibited Coupling (IC) guiding fibers.

Figure 5.
Representative DOPS of (a) PBG (reprinted with permission from Reference [7], Francis & Taylor, 2011), (b) IC Kagome (reprinted with permission from Reference [7], Francis & Taylor, 2011), and (c) IC Single Ring Tubular Lattice HCPCF (reprinted with permission from Reference [30], OSA, 2017).

Figure 6.
Analogy illustration between the Tight Binding model in an atomic structure and the Photonic Tight Binding model in an optical waveguide structure.
Figure 6.
Analogy illustration between the Tight Binding model in an atomic structure and the Photonic Tight Binding model in an optical waveguide structure.

Figure 7.
Curves of the dispersion of first modes for (a) an isolated rod and for (b) an array of similar rods (reprinted with permission from Reference [7], Francis &Taylor, 2011).
Figure 7.
Curves of the dispersion of first modes for (a) an isolated rod and for (b) an array of similar rods (reprinted with permission from Reference [7], Francis &Taylor, 2011).

Figure 8.
(a) Density of photonic state of high inclusion PCF. The PCF structure consists of a glass material with a uniform index (dashed horizontal line) and high index cylindrical-shaped inclusions with diameter and index of 1.5; (b) The intensity profile of representative cladding modes shown within the Wigner-Seitz unit cell.

Figure 9.
(I) HCPCF designed for 1064 nm guidance: (a) SEM of the fiber and (b) zoom in of its cladding structure. The red lines indicate the interstitial apex, the silica strut, and the air hole regions. (II) Numerical modeling: (a) Propagation diagram for the HCPCF cladding lattice; near field of (b) the interstitial apex mode, (c) the silica strut mode, and (d) the air hole mode, (e) Zoom out of (a), (f) Brillouin zone symmetry point nomenclature.

Figure 10.
(a) Propagation diagram for the HCPCF cladding lattice with a gallery of the different guided modes. (b) Evolution of the interstitial apex mode for different k.
Figure 10.
(a) Propagation diagram for the HCPCF cladding lattice with a gallery of the different guided modes. (b) Evolution of the interstitial apex mode for different k.

Figure 11.
(a) Density of photonic states for the cladding structure illustrated inset top-left with a strut thickness of t = 0.01 Λ and apex meniscus curvature of r = 0.15 Λ. The colored lines trace the cladding modes that form the edges of the two bandgaps. The wavelength in the upper x-axis is deduced for a pitch of 6.7 µm. (b) Evolution of the cladding modes of apexes alone (red) and struts alone (blue). (c) SEMs showing the fiber cross-section and the cladding structure. (d) Transmission spectra of 5 m lengths of the fabricated HCPCF with varying pitch, offset vertically for clarity (Reprinted with permission from Reference [74], OSA, 2009).

Figure 12.
(a) Illustrations of Kagome lattice cladding HCPCF. (b) Calculated normalized DOPS diagram as a function of the real part of the effective index and normalized wavenumber. The two low DOPS intervals (blue colored regions) near the air light line neff = 1 (white dashed line) correspond to band (I-noted A) and band (III-noted C). Band (II-noted E) corresponds to a strong anticrossing between a lattice-hole mode (relatively flat red curve) and a particular type of mode associated with the network of connected silica struts. (c) Nature of the Kagome lattice cladding modes. The first two columns show the core mode and a cladding mode, respectively, for a frequency k = 50 in band I (top) and k = 100 in band III (bottom). The third column shows the mode of an infinite Kagomé lattice (Reprinted with permission from Reference [4], Science, 2007).

Figure 13.
(A) Zoomed in crossing of glass webs separated by air of idealized Kagome structure. Index of the air, webs, and intersections are n1, n2, and n3, respectively. (B) Density plots of a strictly-localized core mode (C). Continuum of radiation modes filling the infinite cladding (Reprinted with permission from Reference [79], IEEE, 2010).

Figure 14.
Top: Schematics of an optical coupling between a cylindrical dielectric rod and a semi-infinite dielectric slab. The rod has a diameter of 0.5 μm and a refractive index nrod = 1.45, the slab thickness is set to 0.5 μm, and the distance between the rod and the slab to 4 μm. The operating wavelength λ = 1.55 µm for two cases. Case 1: the slab index is nslab = 1.1. Case 2: nslab = 1.45. Bottom: Calculated electric transverse field profile and the overlap integrals for the two cases.

Figure 15.
(a,b) Representation of the core contour curvature and Kagome IC HCPCF with different b. Spectra of calculated CL (c) and optical overlap with silica coefficient η (d) of Kagome HCPCF with the different b parameter (reprinted with permission from Reference [63], OSA, 2013). Evolution with b parameter of the CL and the optical overlap with silica coefficient η at 1030 nm for HE11 fundamental core mode (e) and for the lowest-loss higher order mode (f). Evolution with b parameter of the CL and m evolution at 1030 nm for HE11 fundamental core mode (g) and for the lowest-loss higher order mode (h).

Figure 16.
(a,b) Experimental loss spectrum of the loss record Kagome IC-HCPCF at an approximately 1030 nm spectral range and broadband-guiding Kagome IC-HCPCF (reprinted with permission from Reference [65], OSA, 2018).
Figure 16.
(a,b) Experimental loss spectrum of the loss record Kagome IC-HCPCF at an approximately 1030 nm spectral range and broadband-guiding Kagome IC-HCPCF (reprinted with permission from Reference [65], OSA, 2018).

Figure 17.
Calculated and measured bend loss evolution at λ = 1064 nm with bend radius (a), and (b) loss spectra for different bend radii of HE11 core mode of a hypocycloid-core Kagome HCPCF (reprinted with permission from Reference [83], OSA, 2013). Calculated and measured loss evolution with bend radius for a hypocycloid-core Kagome HCPCF with b = 0.3, t ≈ 440 nm, and Rin between 23.5 and 29 µm, and having different cladding ring number at 1500 nm (c) and 1550 nm (d). (e) The calculated intensity profile of the mode when the fiber is under a bend of a radius of 1.1 cm for Kagome IC HCPCF with different cladding ring number (reprinted with permission from Reference [83], OSA, 2013).

Figure 18.
(a) Schematic of HCPCF with a single-ring tubular amorphous lattice (i), tubular lattice in a triangular arrangement (ii), and the details of its unit cell (iii). δ is the intertube gap distance, Rt is the tube radius, and t is the tube ring thickness (reprinted with permission from Reference [30], OSA, 2017). (b) DOPS of an infinite cladding of a triangular arrangement of tubes (reprinted with permission from Reference [30], OSA, 2017). (c) Modal spectrum near the air-line formed by silica ring modes ((A) and (D)), air modes (B), and silica–air hybrid modes (C–E). (d) Effective index and loss spectra of fundamental mode of a tubular lattice hollow-core defect. (e) Eight tubes SR-TL-HCPCF modal spectrum. Zoom in of the modal spectrum over the normalized frequency range of 0.97 to 1.06 (rhs).

Figure 19.
(a) Modal spectrum and lattice mode profiles near F = 1. Intensity profiles of a representative silica mode with high azimuthal number and radial number l = 1 (EH35,1) and its evolution when the mode approaches HE11 air mode (lhs). DOPS diagram (middle). Intensity profiles of a representative silica–air hybrid mode (HE11 air mode and HE12 silica mode) and its evolution when the mode approaches HE11 air mode (rhs). The blue filled circles and the yellow filled squares in the DOPS diagram represent the locations of the silica mode on the left and the hybrid mode on the right respectively. (b) Zoom out view of the DOPS diagram near F = 1 (i), Close-up near an anticrossing between the HE11 air mode and l = 2 silica mode (EH5,2) (ii) and the intensity profile of the associated mode (iii). Close-up near an ultraweak anticrossing crossing between the HE11 air mode and l = 1 high azimuthal number silica mode (HE47,1) (iv), and the intensity profile of the associated mode (v).

Figure 20.
(a,c) SEM pictures of the fabricated 7.7 dB/km loss and broadband-guiding SR-TL HCPCFs, respectively. (b,d) Measured loss spectra of the two fibers (black curve) compared to theoretical SSL and CL evolutions. (e) Theoretical transverse distribution of radial component of Poynting vector for SR-TL fiber with different δ values from 2 to 8 µm (Reprinted with permission from Reference [30], OSA, 2017).

Figure 21.
(a) lhs: Effective index spectrum glass capillary (black curves) and 600 nm thick ring (red curves) for the case of a radius of 22.5 µm (solid lines) and 10 µm (solid lines). rhs: Loss spectrum of 22.5 µm radius glass capillary calculated using the expression of Reference [50] (black dashed-dotted curve). Loss spectrum of 22.5 µm radius and 600 nm thick glass ring using the expression from Reference [76]. (b) Effective index (lhs) and loss spectra (rhs) of ring, SR-TL, and Kagome fiber with similar core diameter of 22.5 µm and struts thickness of 600 nm.

Figure 22.
(a) lhs: Typical core mode profiles of a Kagome IC-HCPCF and their location in the neff-space. (b) A Kagome HCPCF S2 measured trace and the intensity profiles of the retrieved modes around 1 µm.
Figure 22.
(a) lhs: Typical core mode profiles of a Kagome IC-HCPCF and their location in the neff-space. (b) A Kagome HCPCF S2 measured trace and the intensity profiles of the retrieved modes around 1 µm.

Figure 23.
(a,b) Evolution of the mode field diameter of IC HCPCF HE11 core mode profile with negative curvature b. (c) Relative error on MFD when Kagome IC-HCPF is approximated to a glass capillary with a radius equal to the inner radius of the hypocycloid core contour. (Reprinted with permission from Reference [63], OSA, 2013.) Experimental bend loss evolution versus bend radius Rb for (d) 7-cell and (e) 19-cell Kagome HCPCF at 1 µm (black curves) and 2 µm (red curves) (reprinted with permission from Reference [65], OSA, 2018).

Figure 24.
(a) Laser–gas interaction figure of merit evolution with the hollow core diameter for glass capillary and different HCPCF transmission loss figures. (b) HCPCF-guided laser energy damage threshold for different types of HCPCF. The star and square symbols are the experimental demonstrated energy with IC-HCPCF-guided lasers [31,99,100] and PBG-HCPCF [101], respectively.

Figure 25.
Illustrations of different applications of HCPCF fiber laser beam delivery, with (a) glass engraving ((reprinted with permission from Reference [17], OSA, 2013), (b) titanium micromachining (reprinted with permission from Reference [107], OSA, 2015), and (c) tissue surface ablation (reprinted with permission from Reference [111], OSA, 2016).

Figure 26.
(a,b) Optical spectrum (a) and its associated diffracted output beam picture (b) generated with pump linear polarization. (c,d) same as (a,b) for pump circular polarization of a large optical Raman comb in H2 IC HCPCF (reprinted with permission from Reference [10], OSA, 2015).
Figure 26.
(a,b) Optical spectrum (a) and its associated diffracted output beam picture (b) generated with pump linear polarization. (c,d) same as (a,b) for pump circular polarization of a large optical Raman comb in H2 IC HCPCF (reprinted with permission from Reference [10], OSA, 2015).

Figure 27.
(a) Raman comb and (b) supercontinuum spectrum measured at the output of IC ambient air-filled IC HCPCF excited with millijoule 300 ps and 600 fs, respectively. (c) Dispersed-fiber output spectrum (reprinted with permission from Reference [13], OSA, 2015).
Figure 27.
(a) Raman comb and (b) supercontinuum spectrum measured at the output of IC ambient air-filled IC HCPCF excited with millijoule 300 ps and 600 fs, respectively. (c) Dispersed-fiber output spectrum (reprinted with permission from Reference [13], OSA, 2015).

Figure 28.
(a) Schematic representation of plasma column generation in HCPCF with a surfatron. (b) Side view picture of the generated 4-cm-long plasma column. (c) Measured spectrum lines at fiber output (reprinted with permission from Reference [27], OSA, 2013). (d) New microstrip split-ring resonator (MSRR) plasma column excitatory (reprinted with permission from Reference [127], OSA, 2016).

Figure 29.
(a) Atoms in the HCPCF radially- and axially-confined by the optical lattice, preventing atoms from interacting with the fiber-wall (top). Microscope image of the Kagome fiber and Far-field pattern of the laser intensity passed through a 32-mm-long HCPCF (bottom). (b) Absorption spectra with and without atomic expansion over lattice sites, as illustrated in the inset, are displayed by blue and red symbols, respectively, corresponding to a mean atom occupation of m = 0.45 and m = 1.7 (Reprinted and adapted with permission from Reference [29], Nature, 2014).

Figure 30.
(a) Illustration of the molecular trapping experiment. (b) Stokes spectrum. (c) Moving scatter along the set fiber snapshot (reprinted with permission from Reference [28], Nature, 2016).
Figure 30.
(a) Illustration of the molecular trapping experiment. (b) Stokes spectrum. (c) Moving scatter along the set fiber snapshot (reprinted with permission from Reference [28], Nature, 2016).

Figure 31.
(a) SEM image of the 8 tubes IC fiber cross-section used for JSI experiments. (b) Calculated fundamental mode effective index and inverse group velocity in an 8 tubes IC fiber filled with 3-bar Xenon. Two specific four-wave-mixing configurations are identified with respectively the fulfillment of β1(ωp) = β1(ωs) and 2β1(ωp) = β1(ωs) + β1(ωi). (a–d) Simulated and (e) experimental JSI for different lengths, gas pressures, and pump wavelengths (reprinted with permission from Reference [146], OSA, 2018).


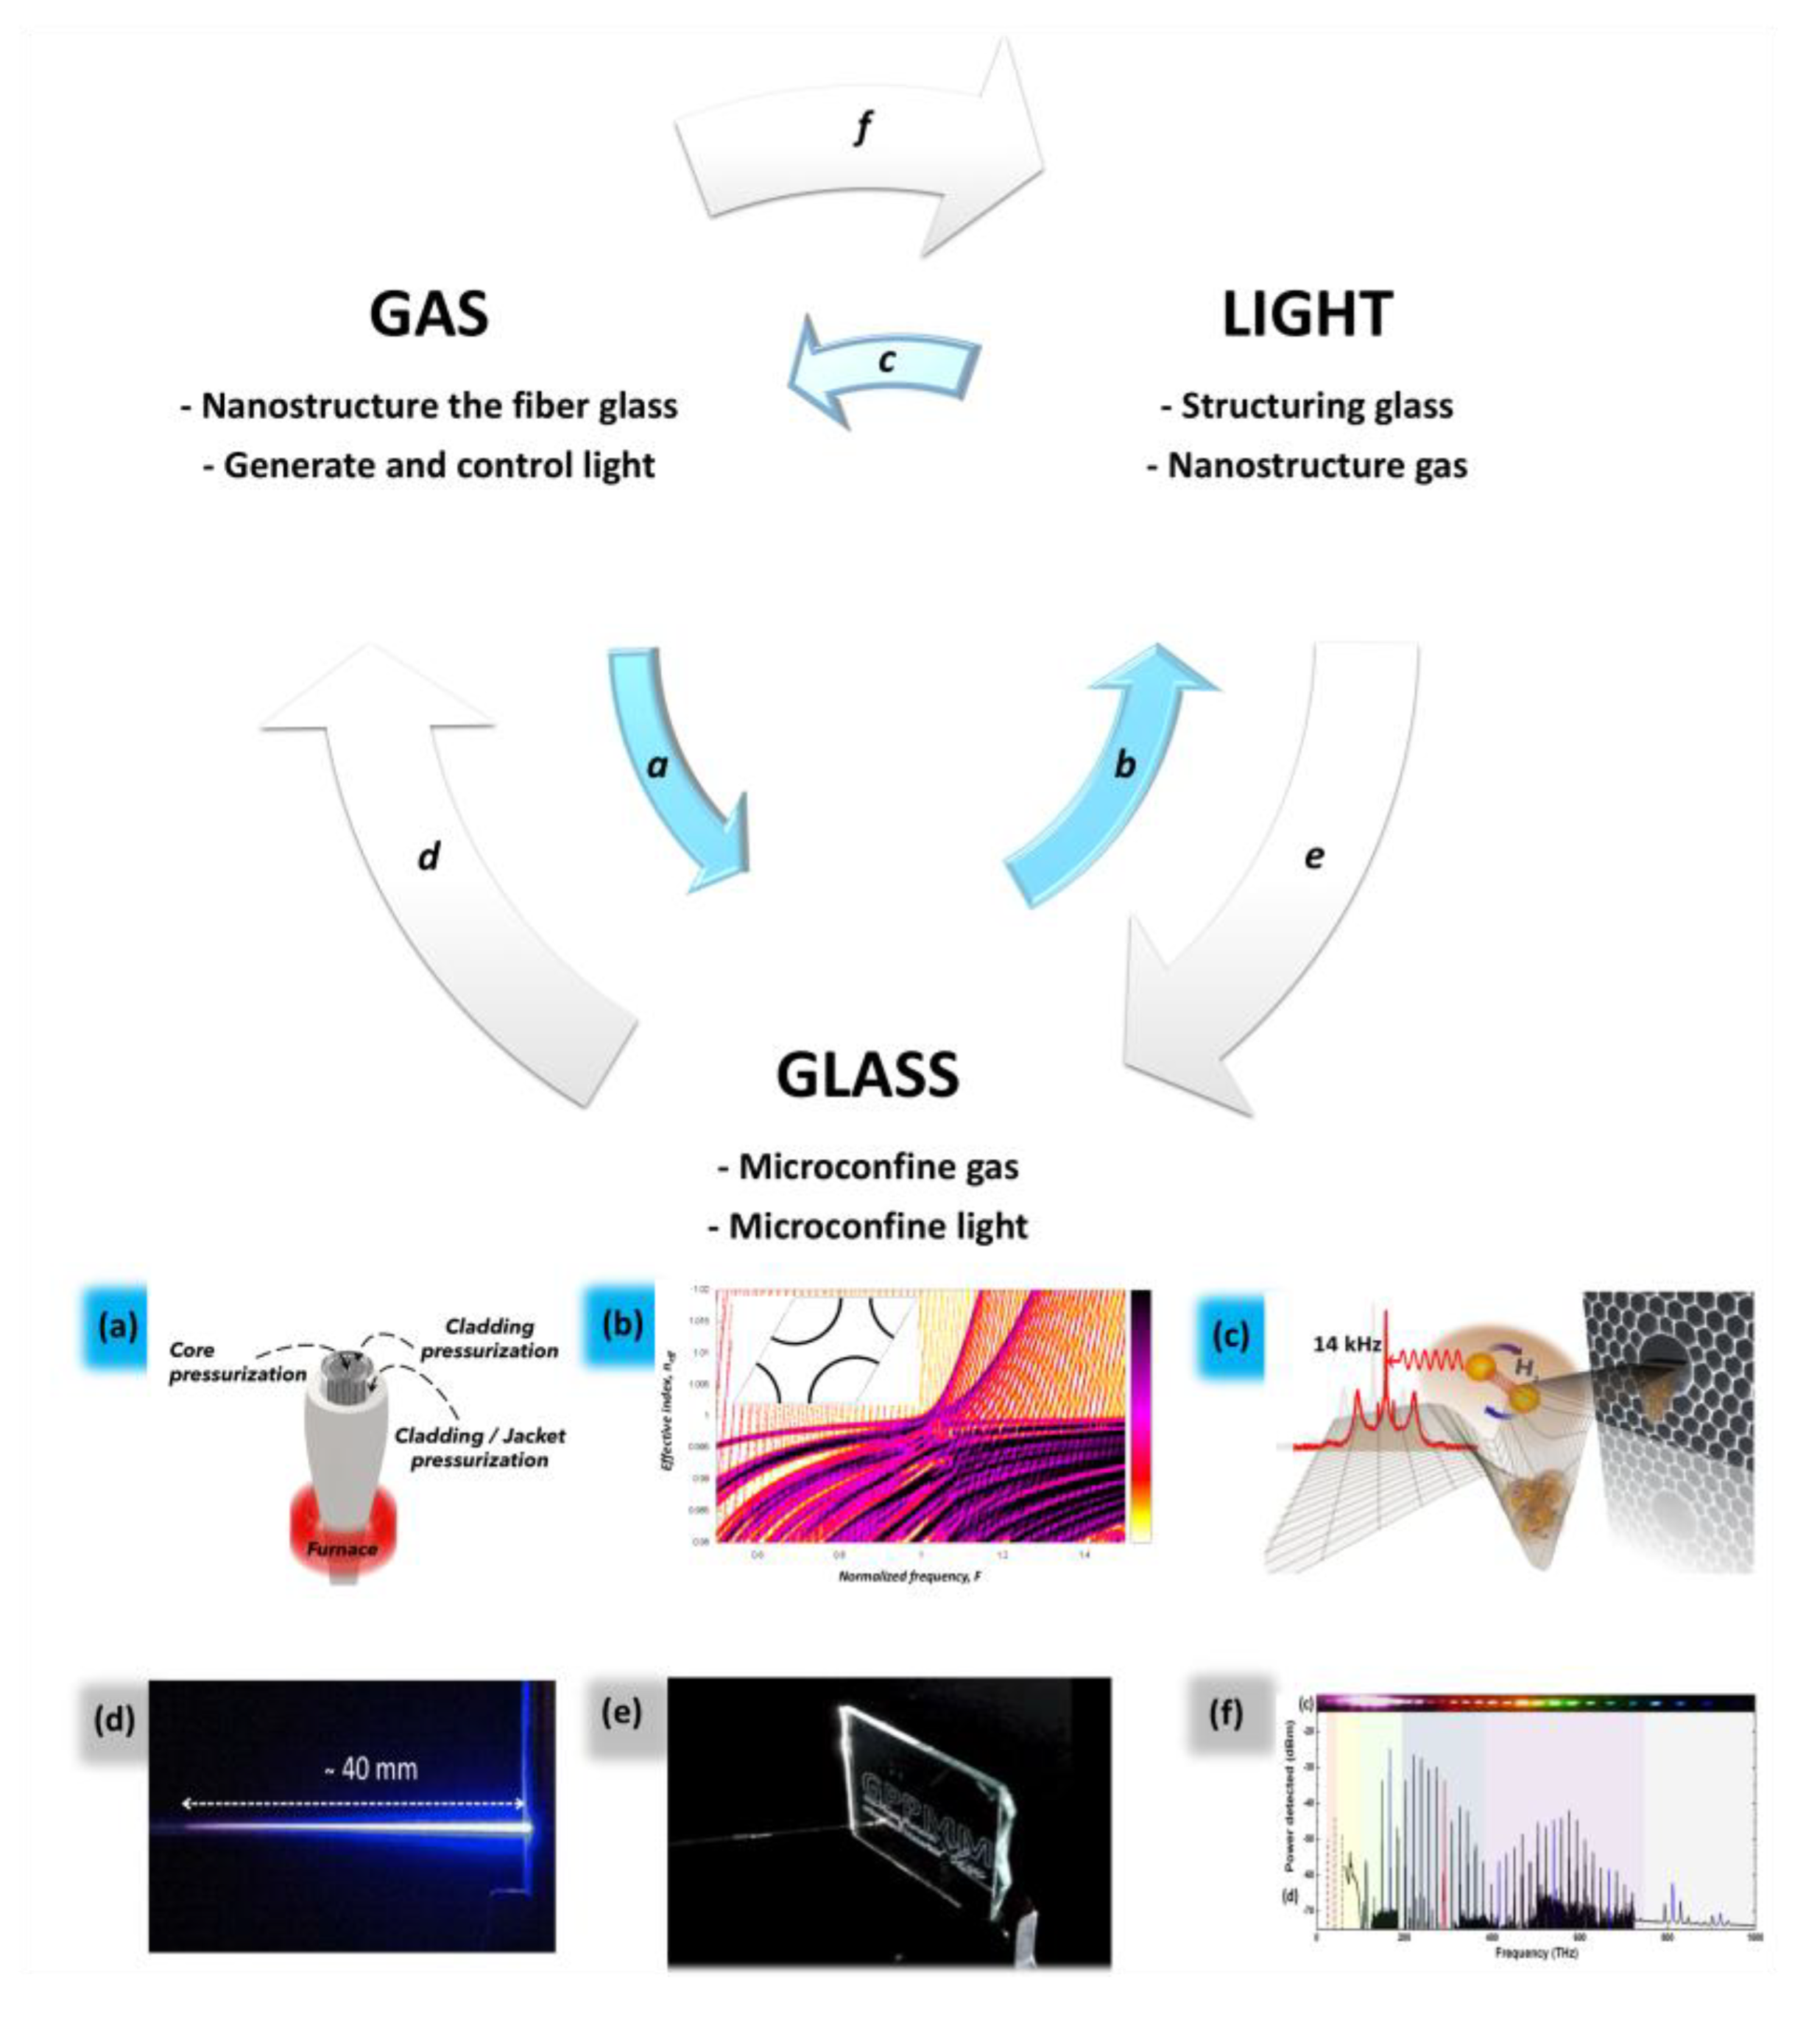
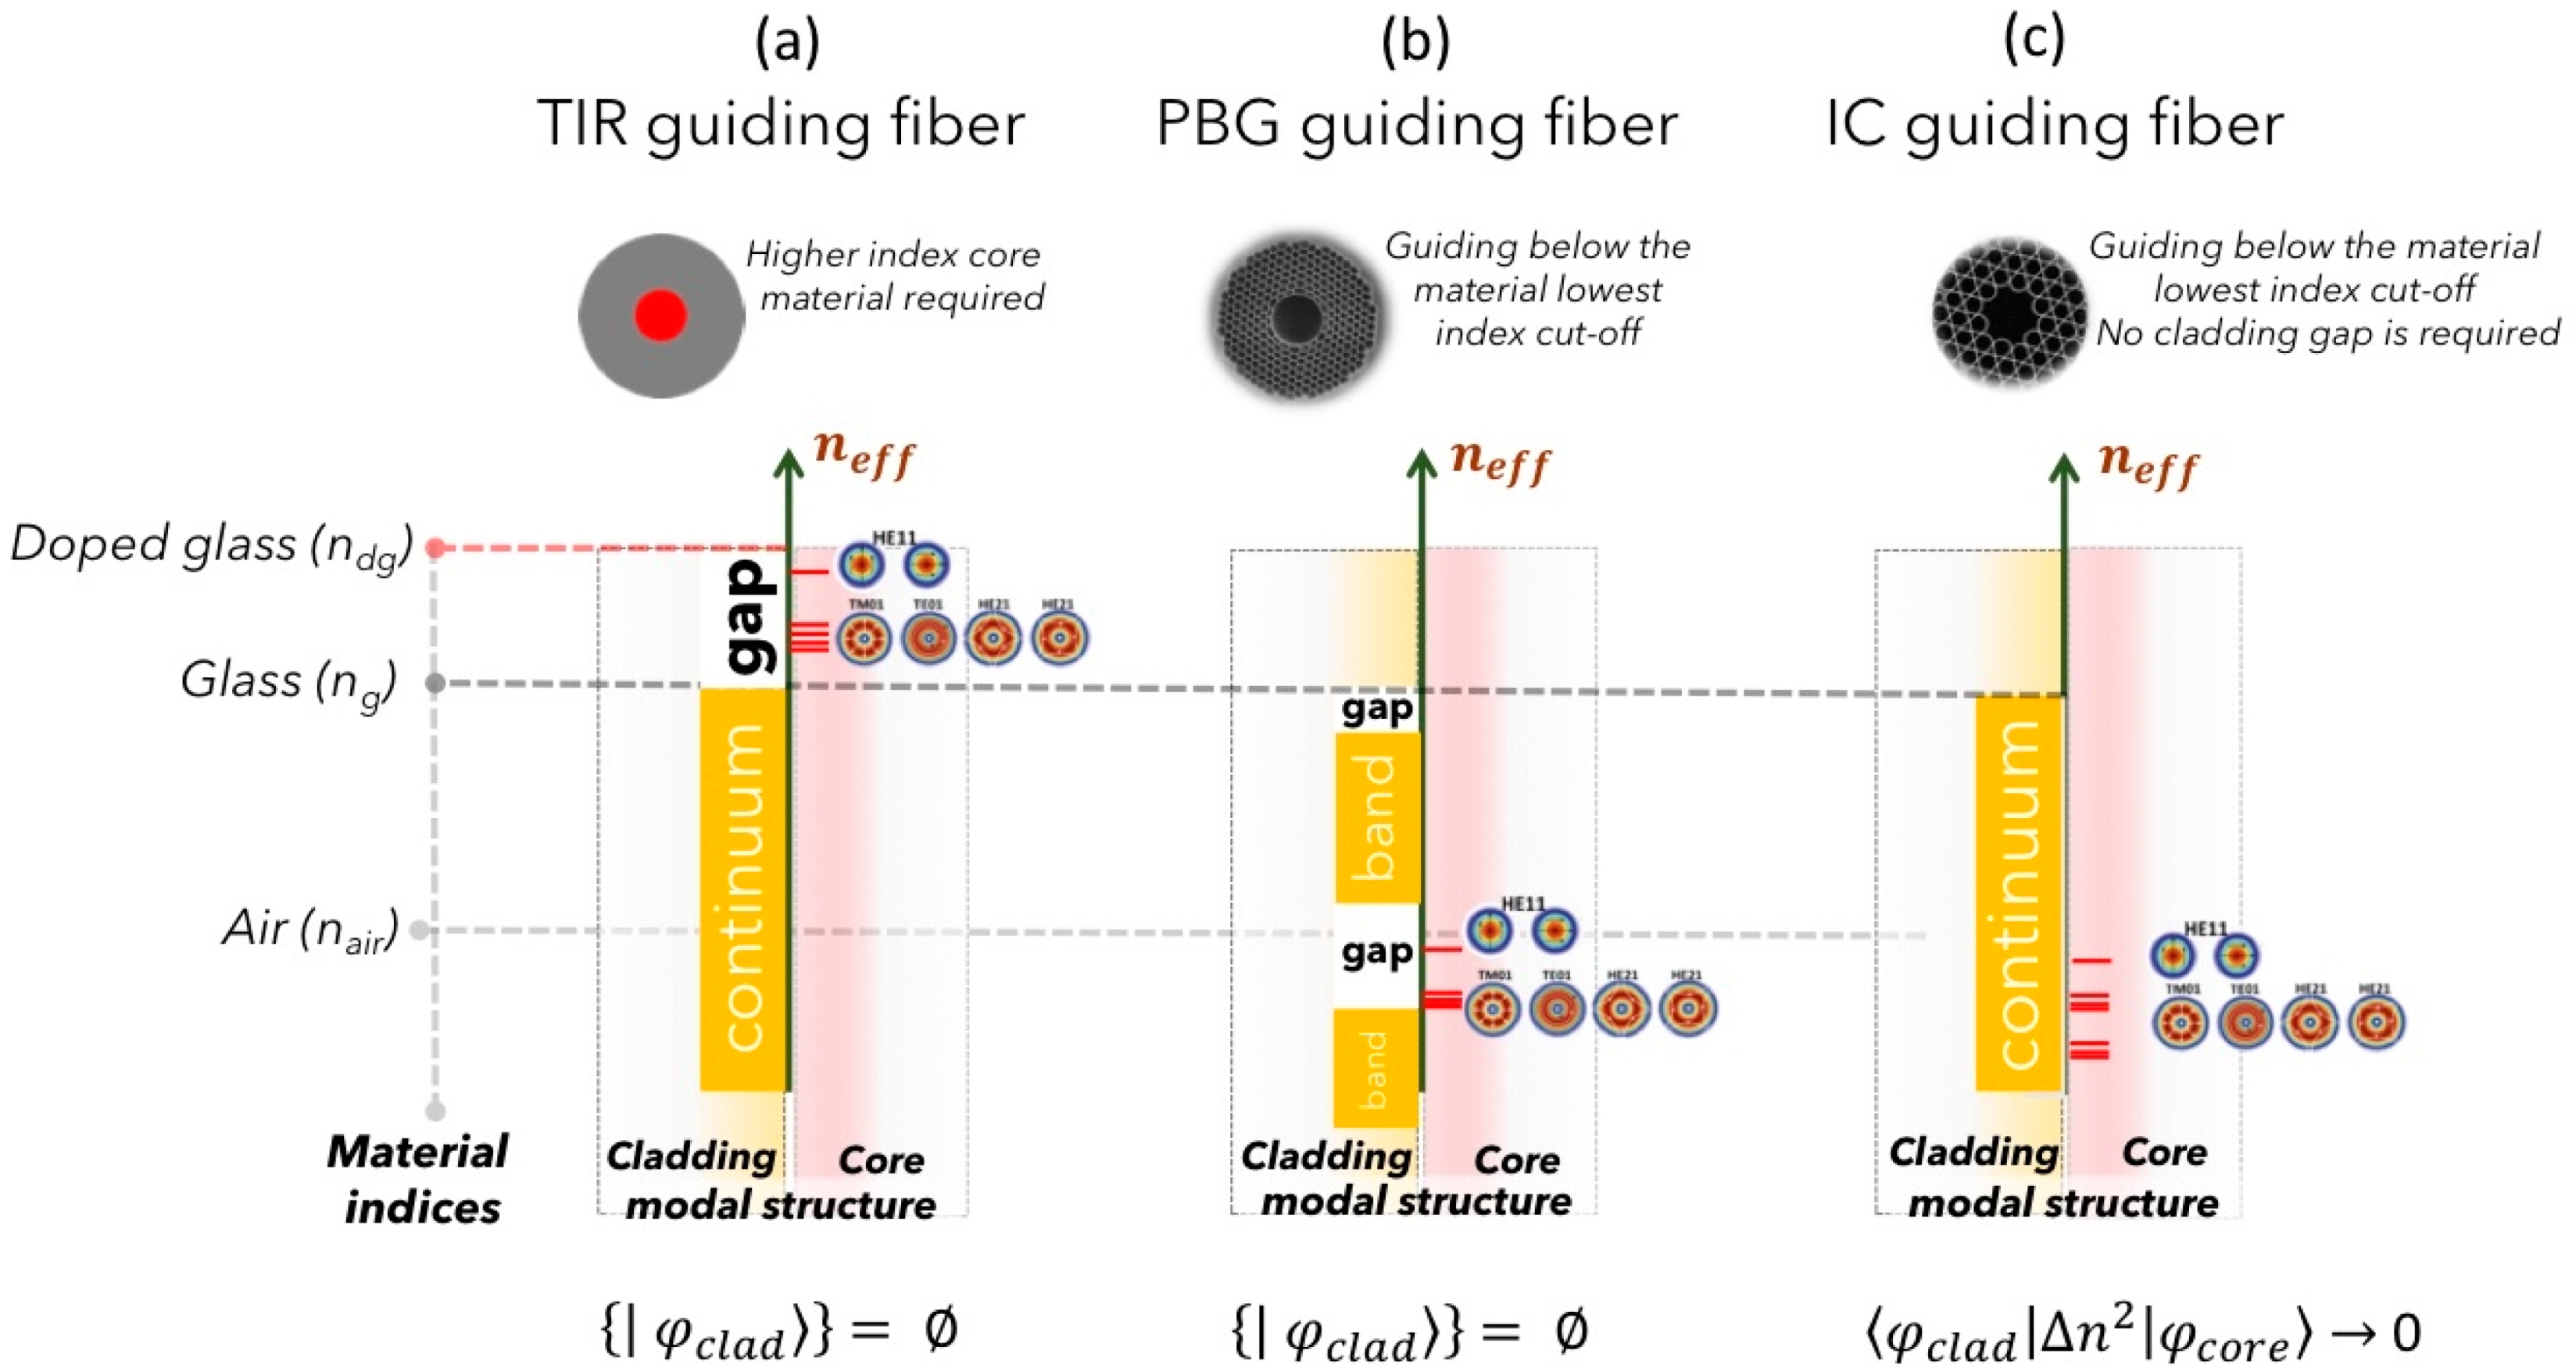
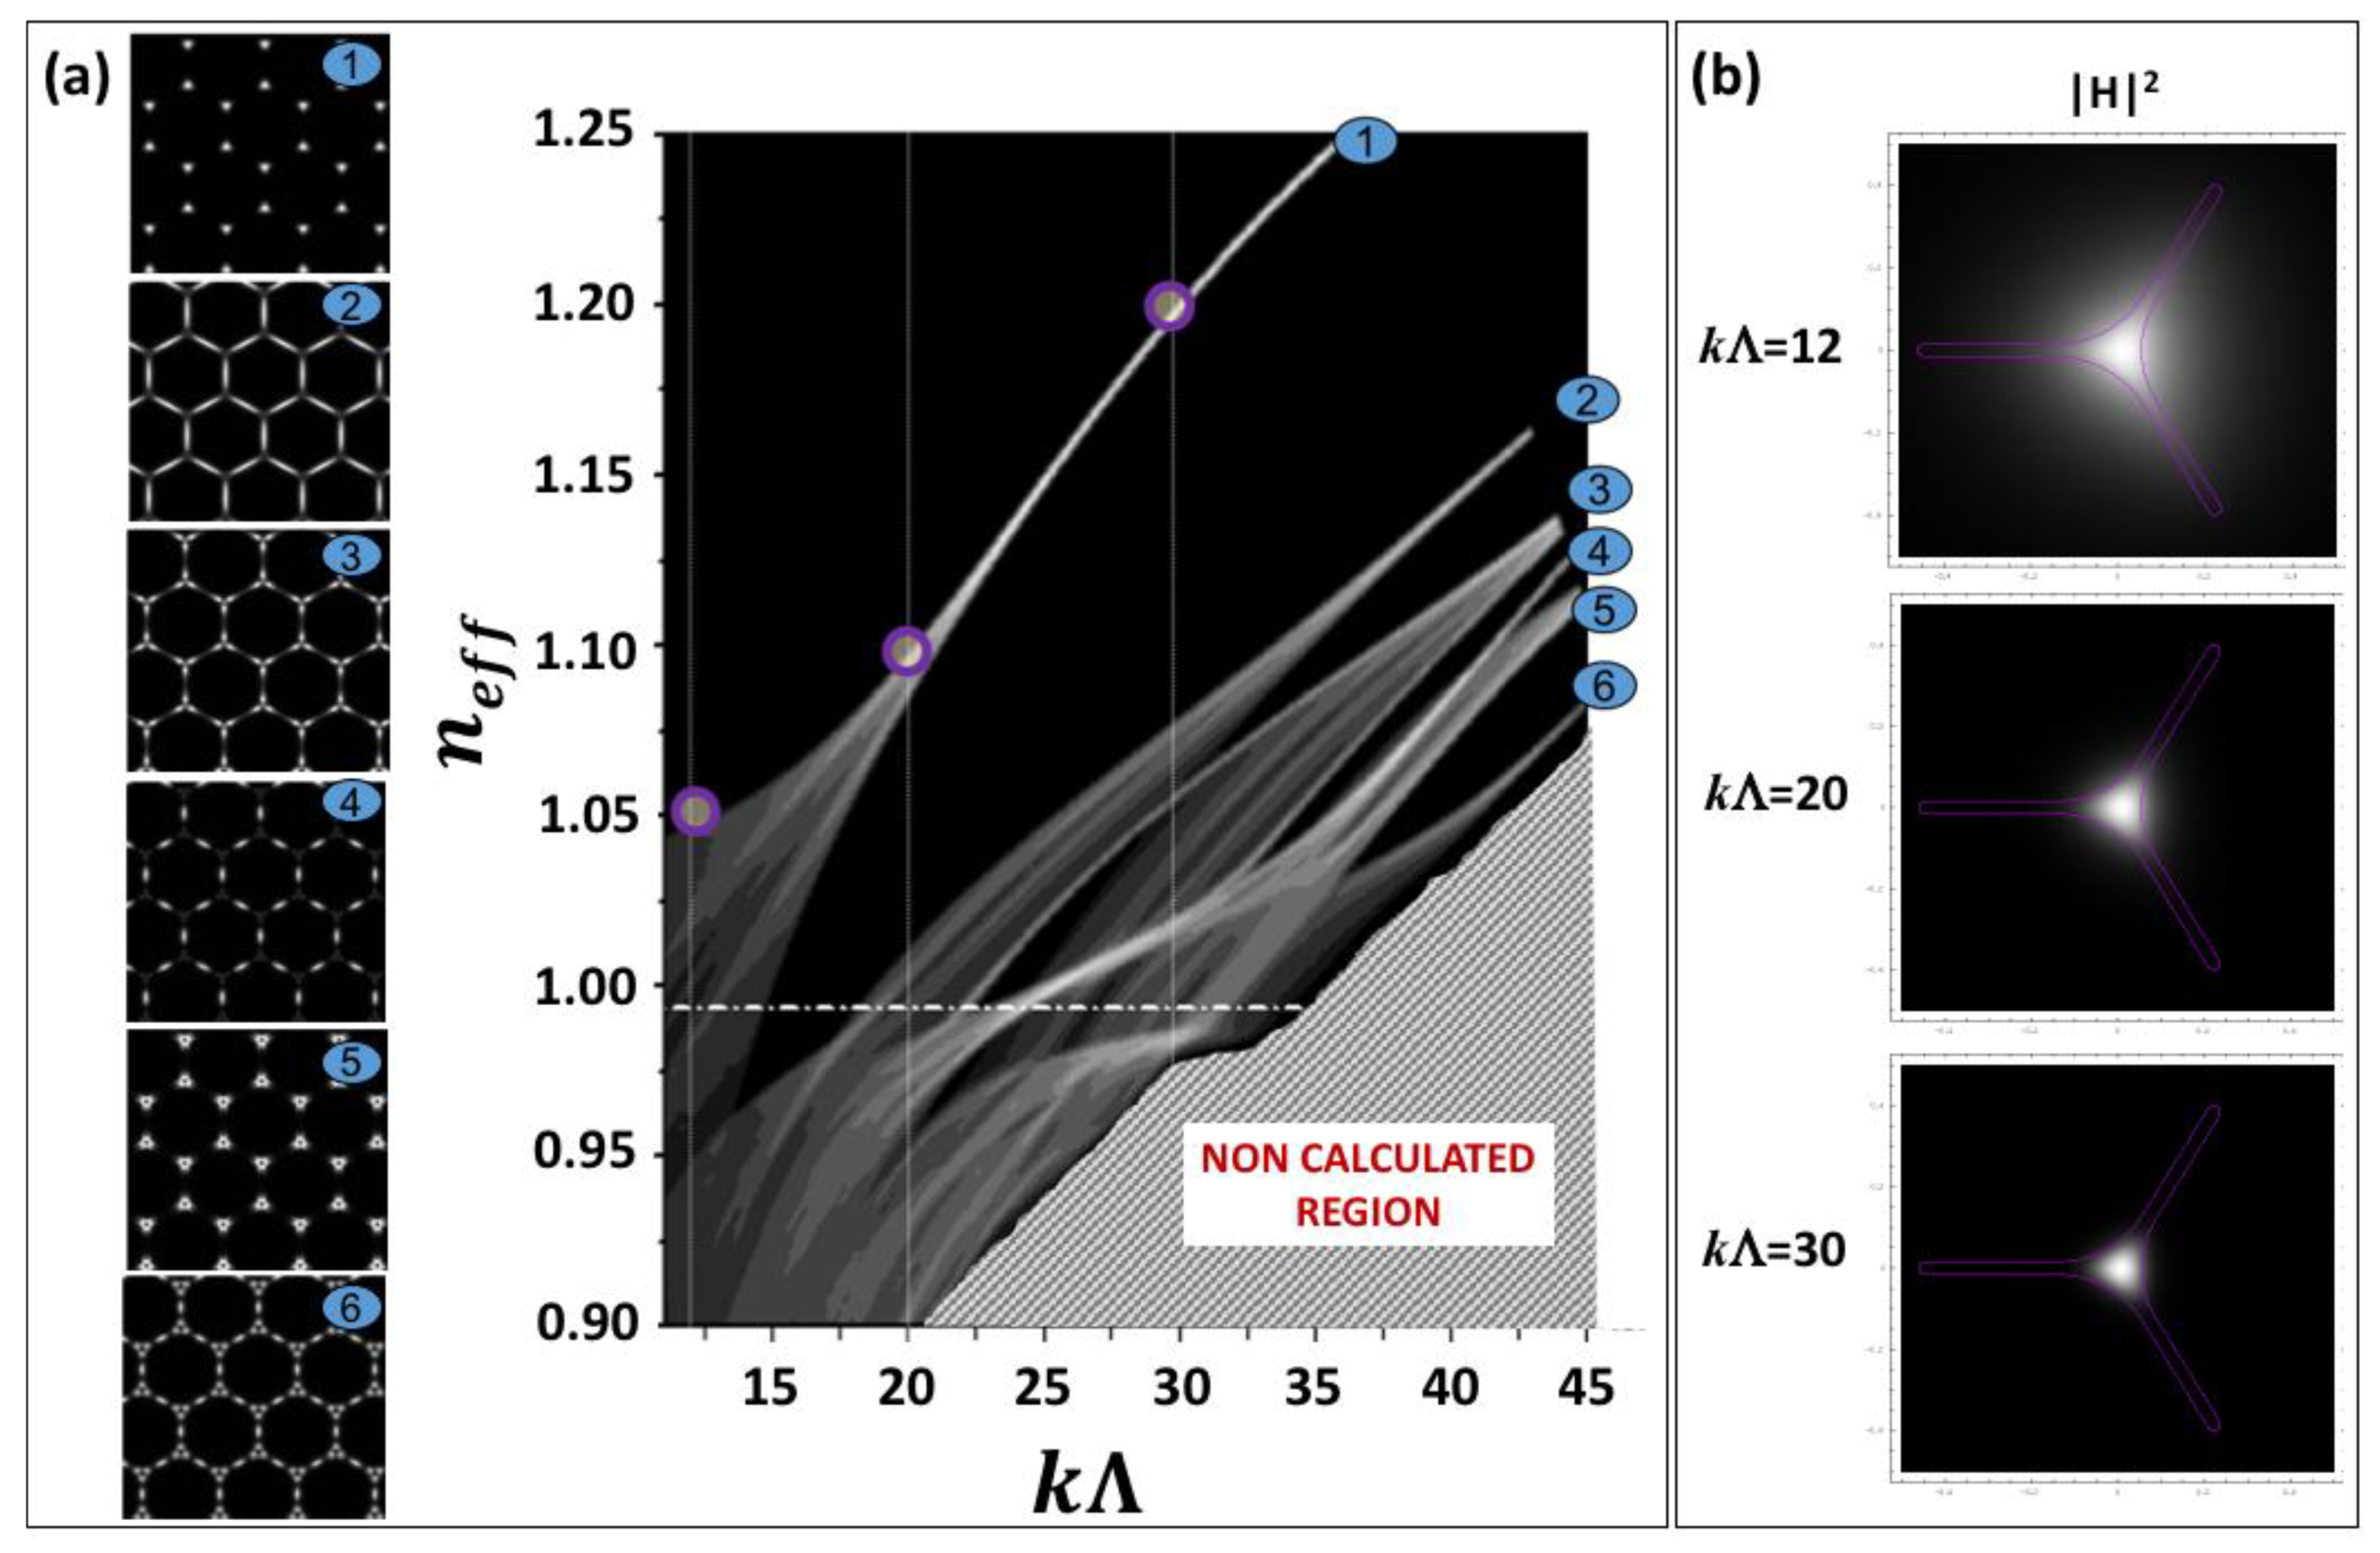
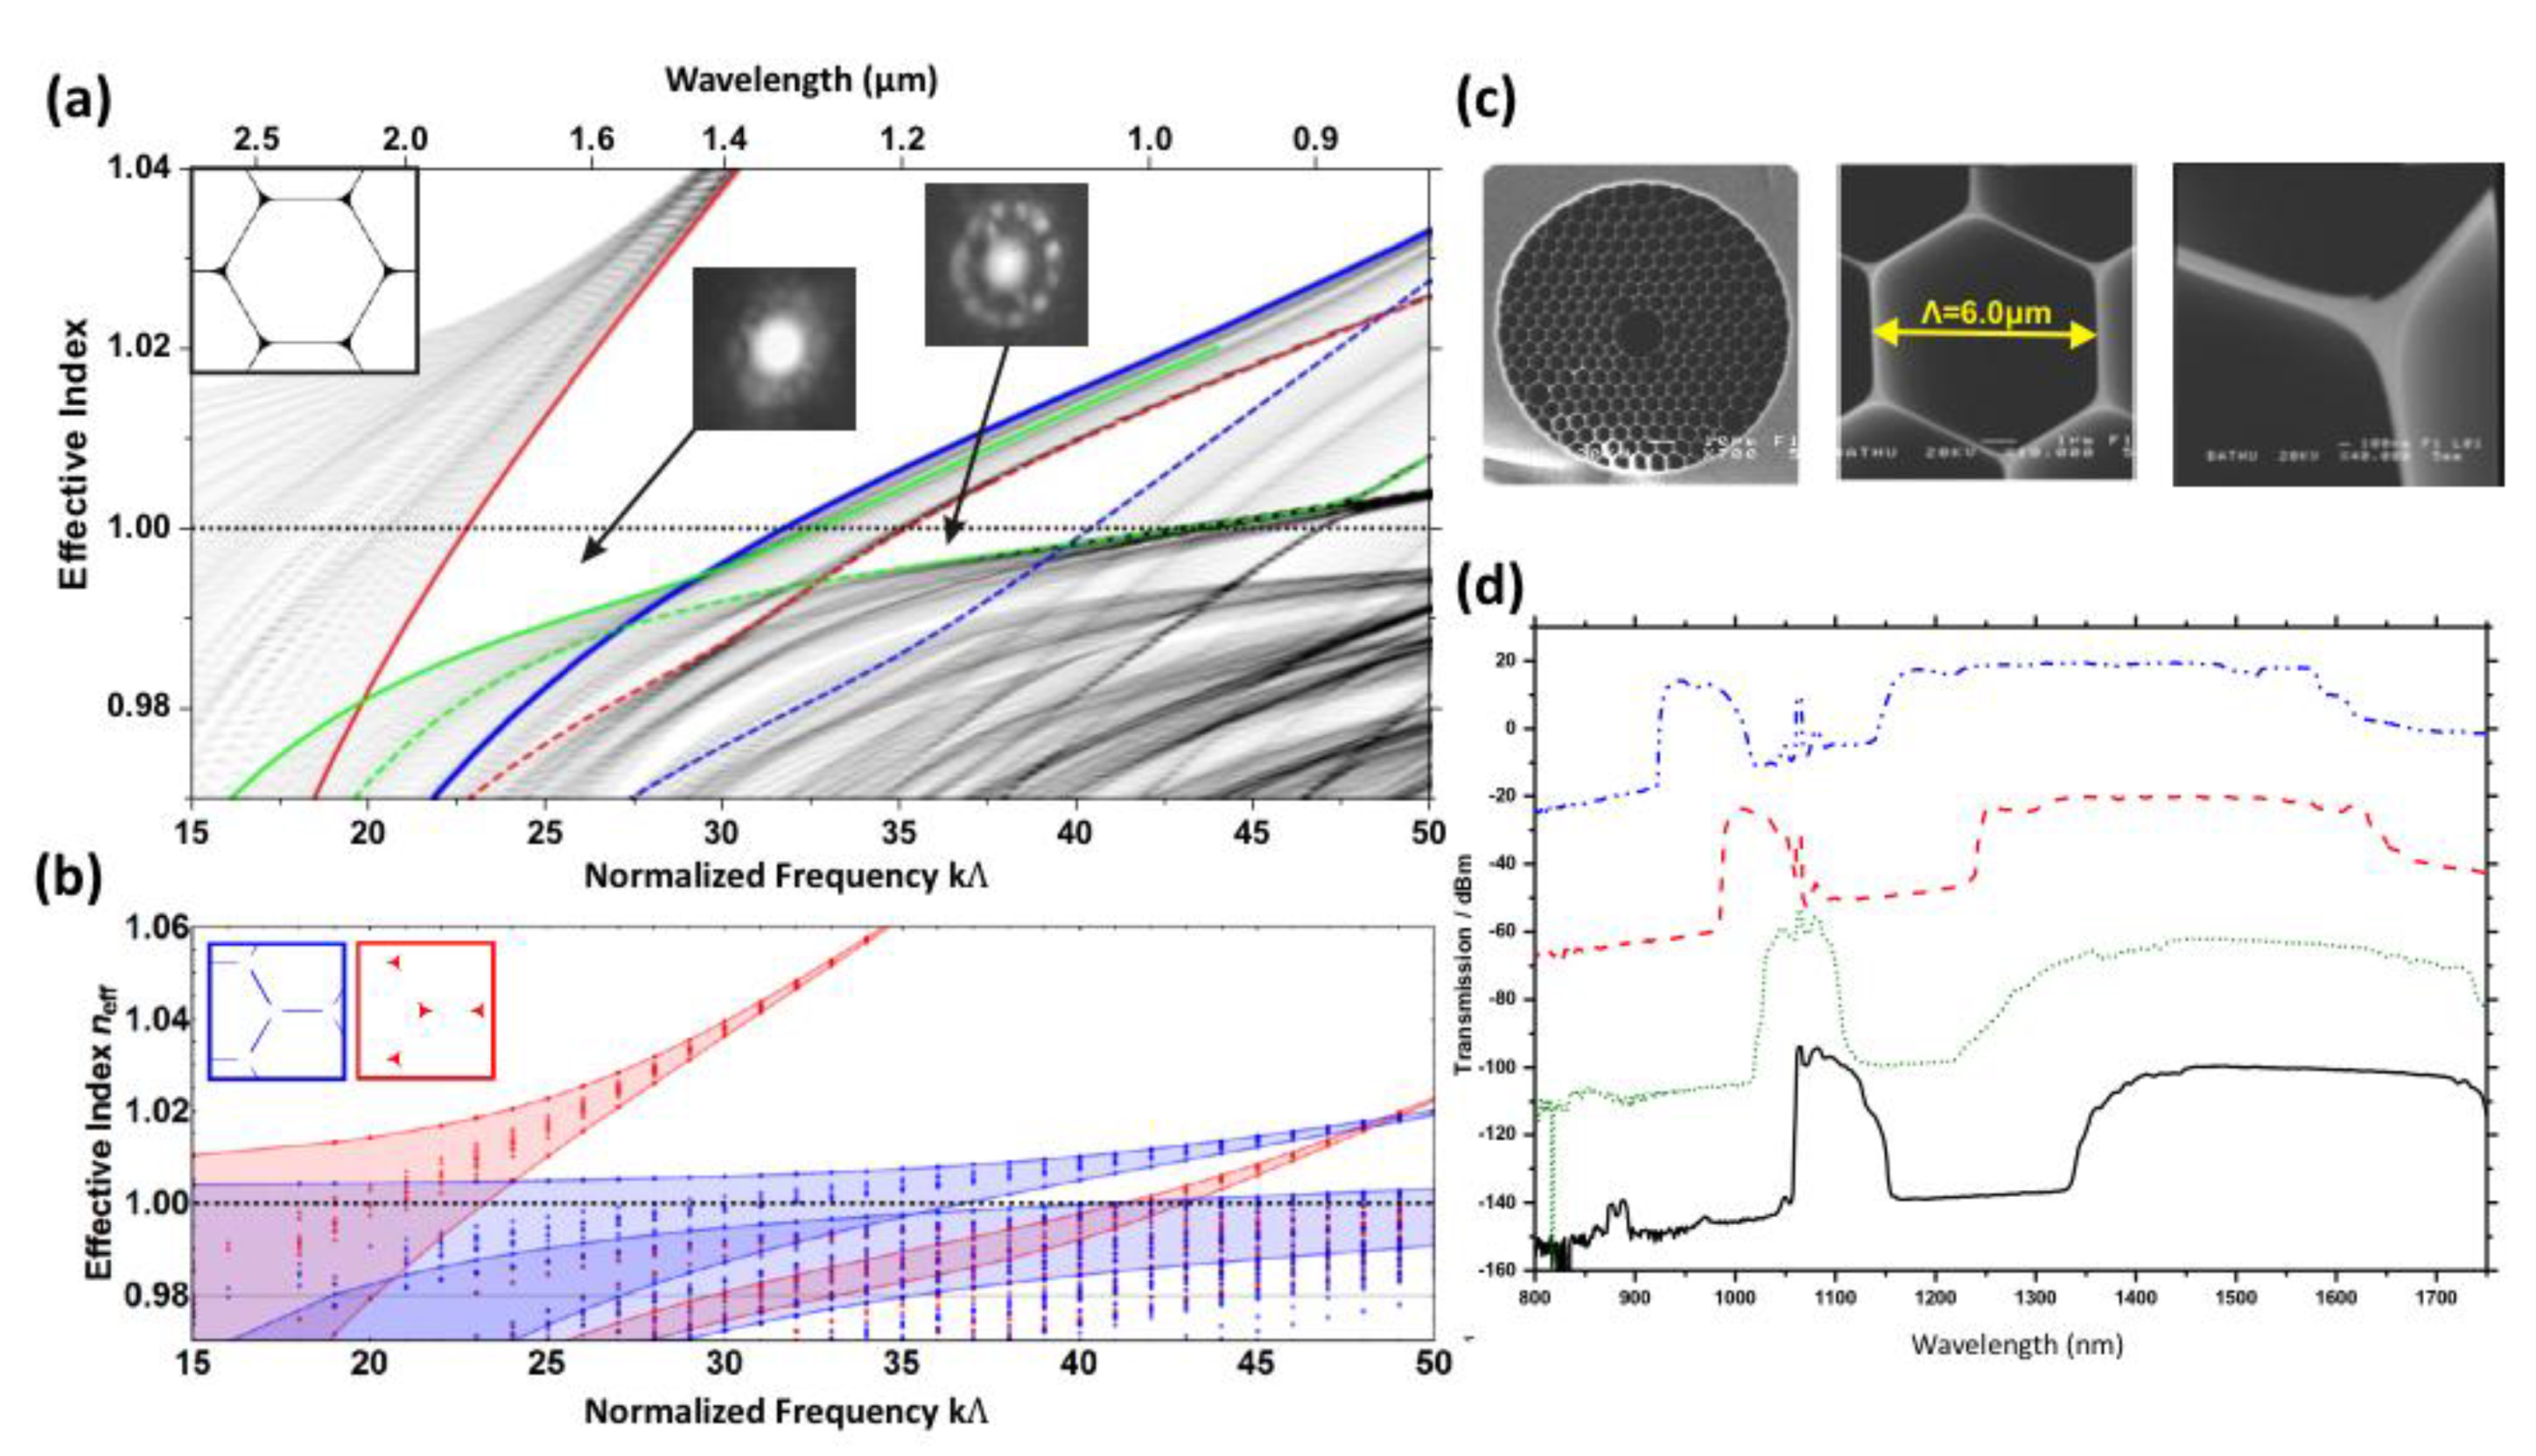
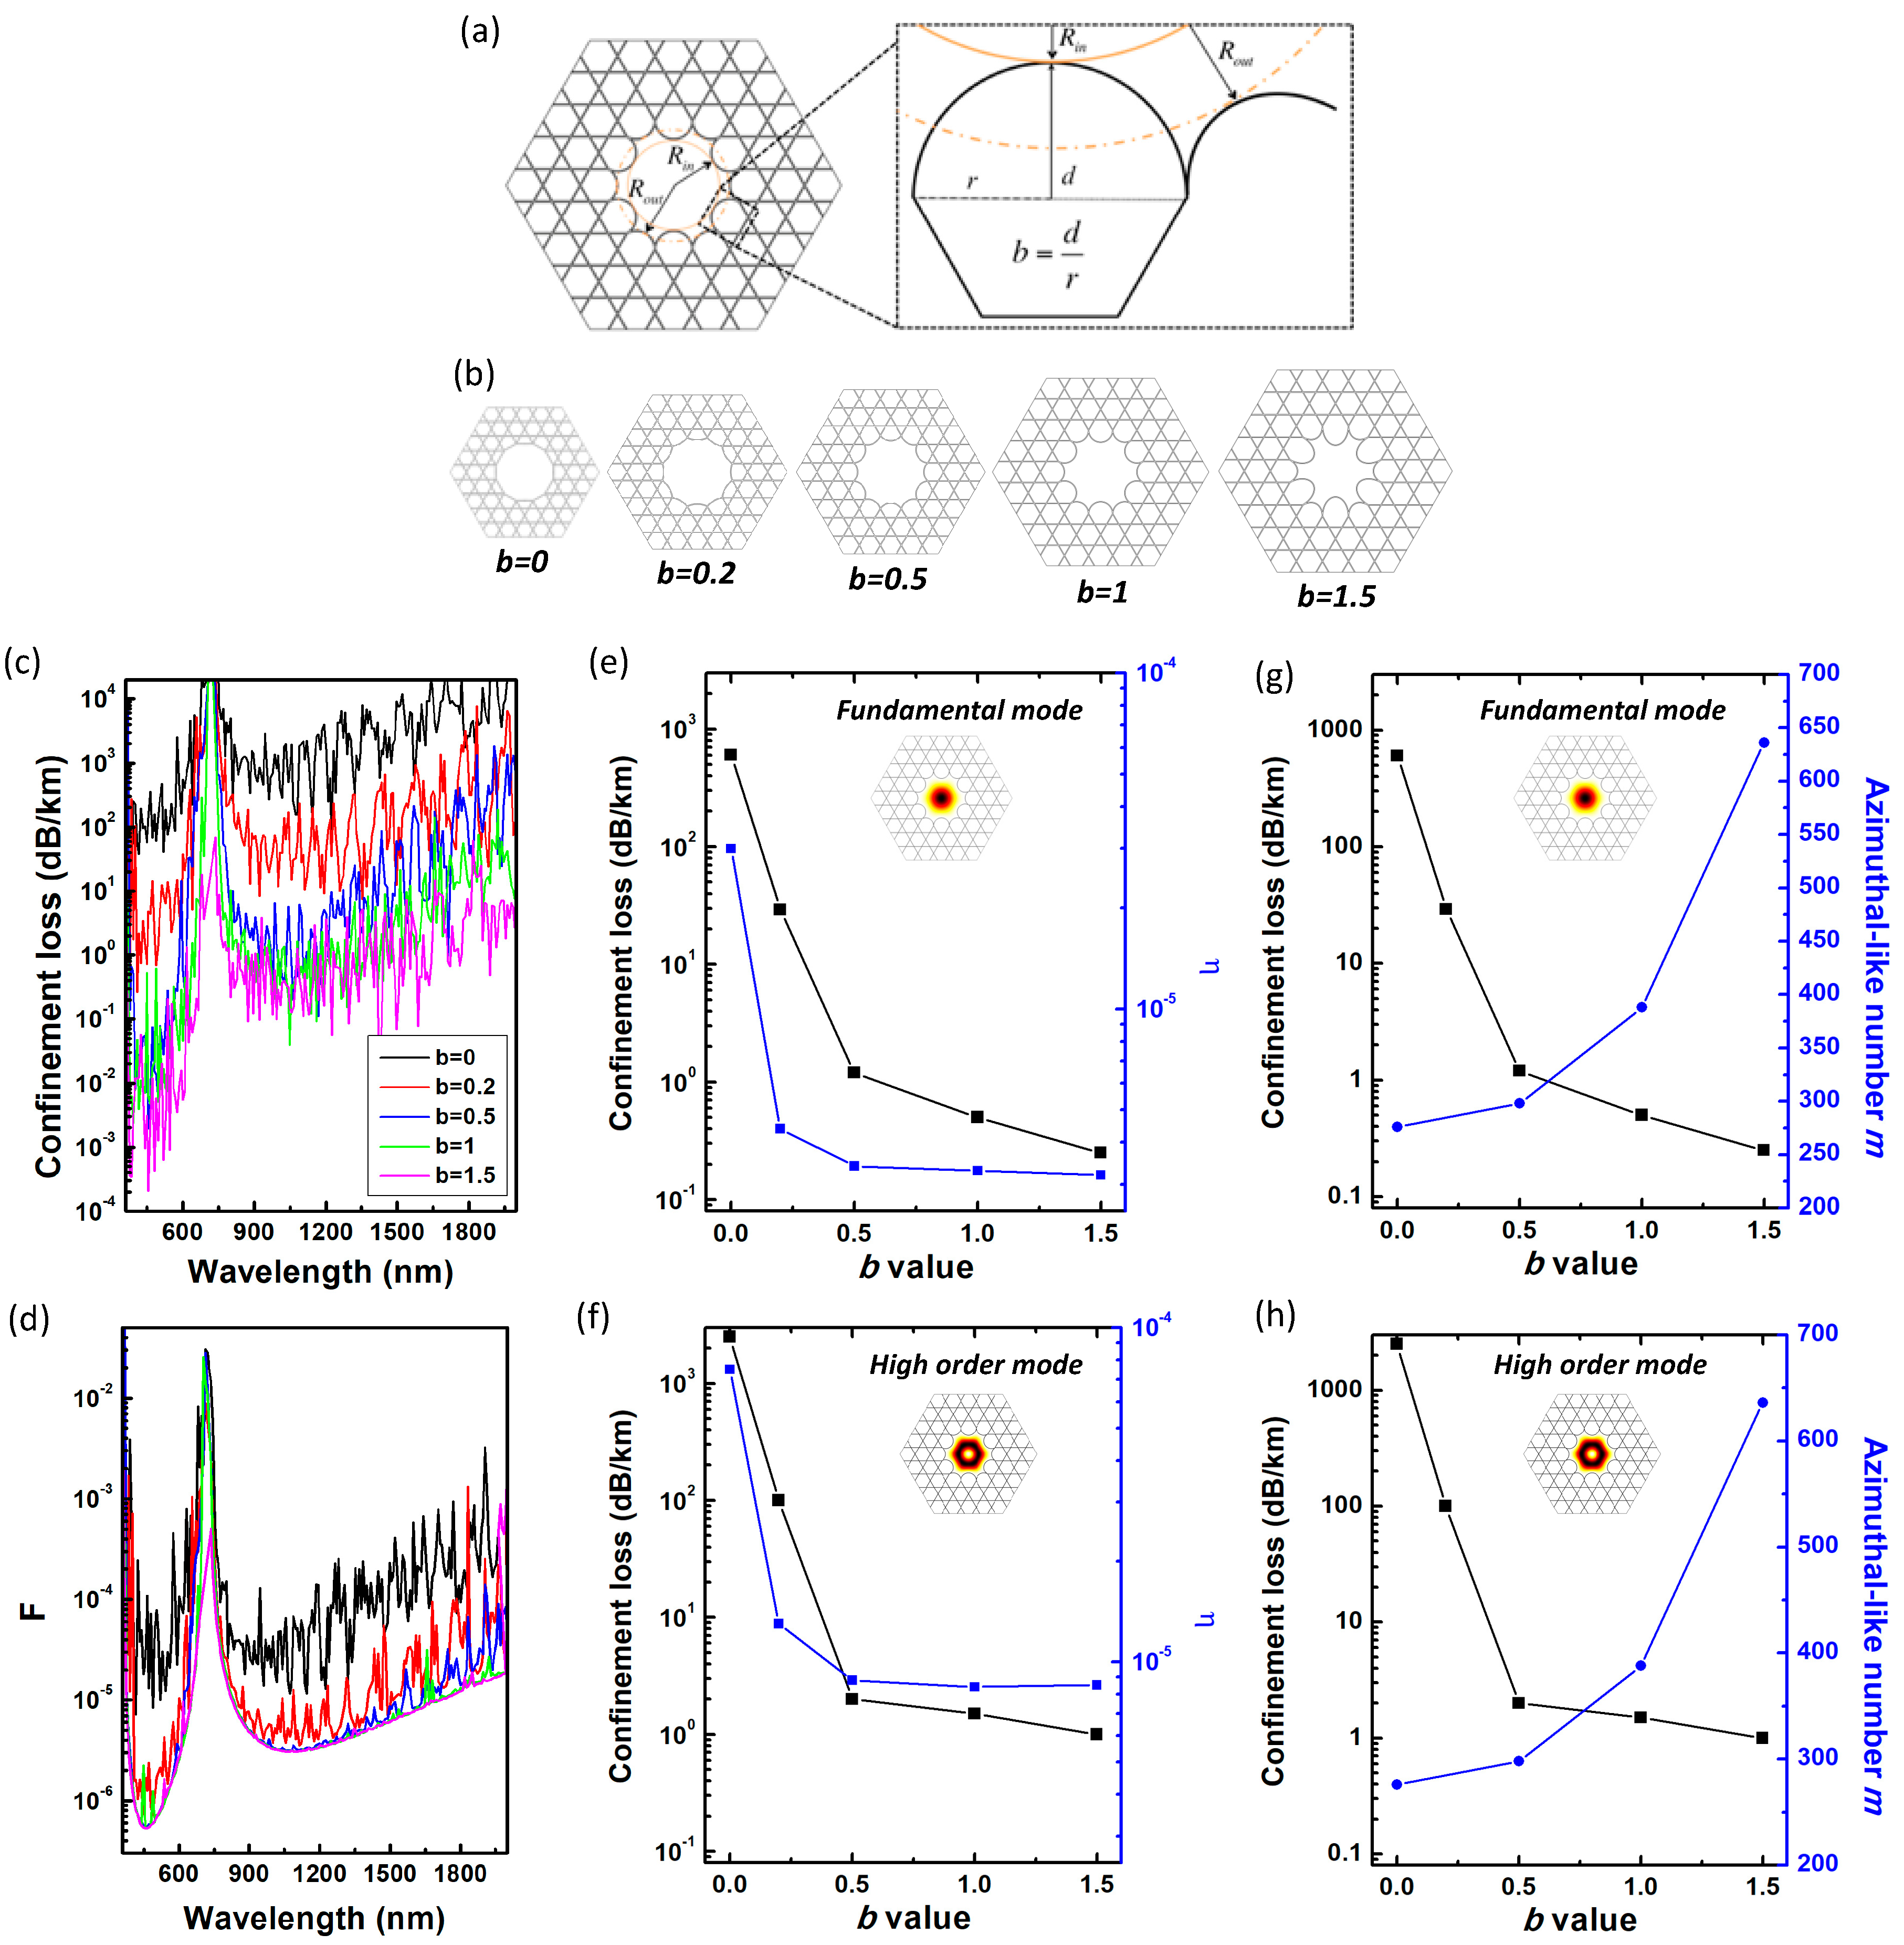
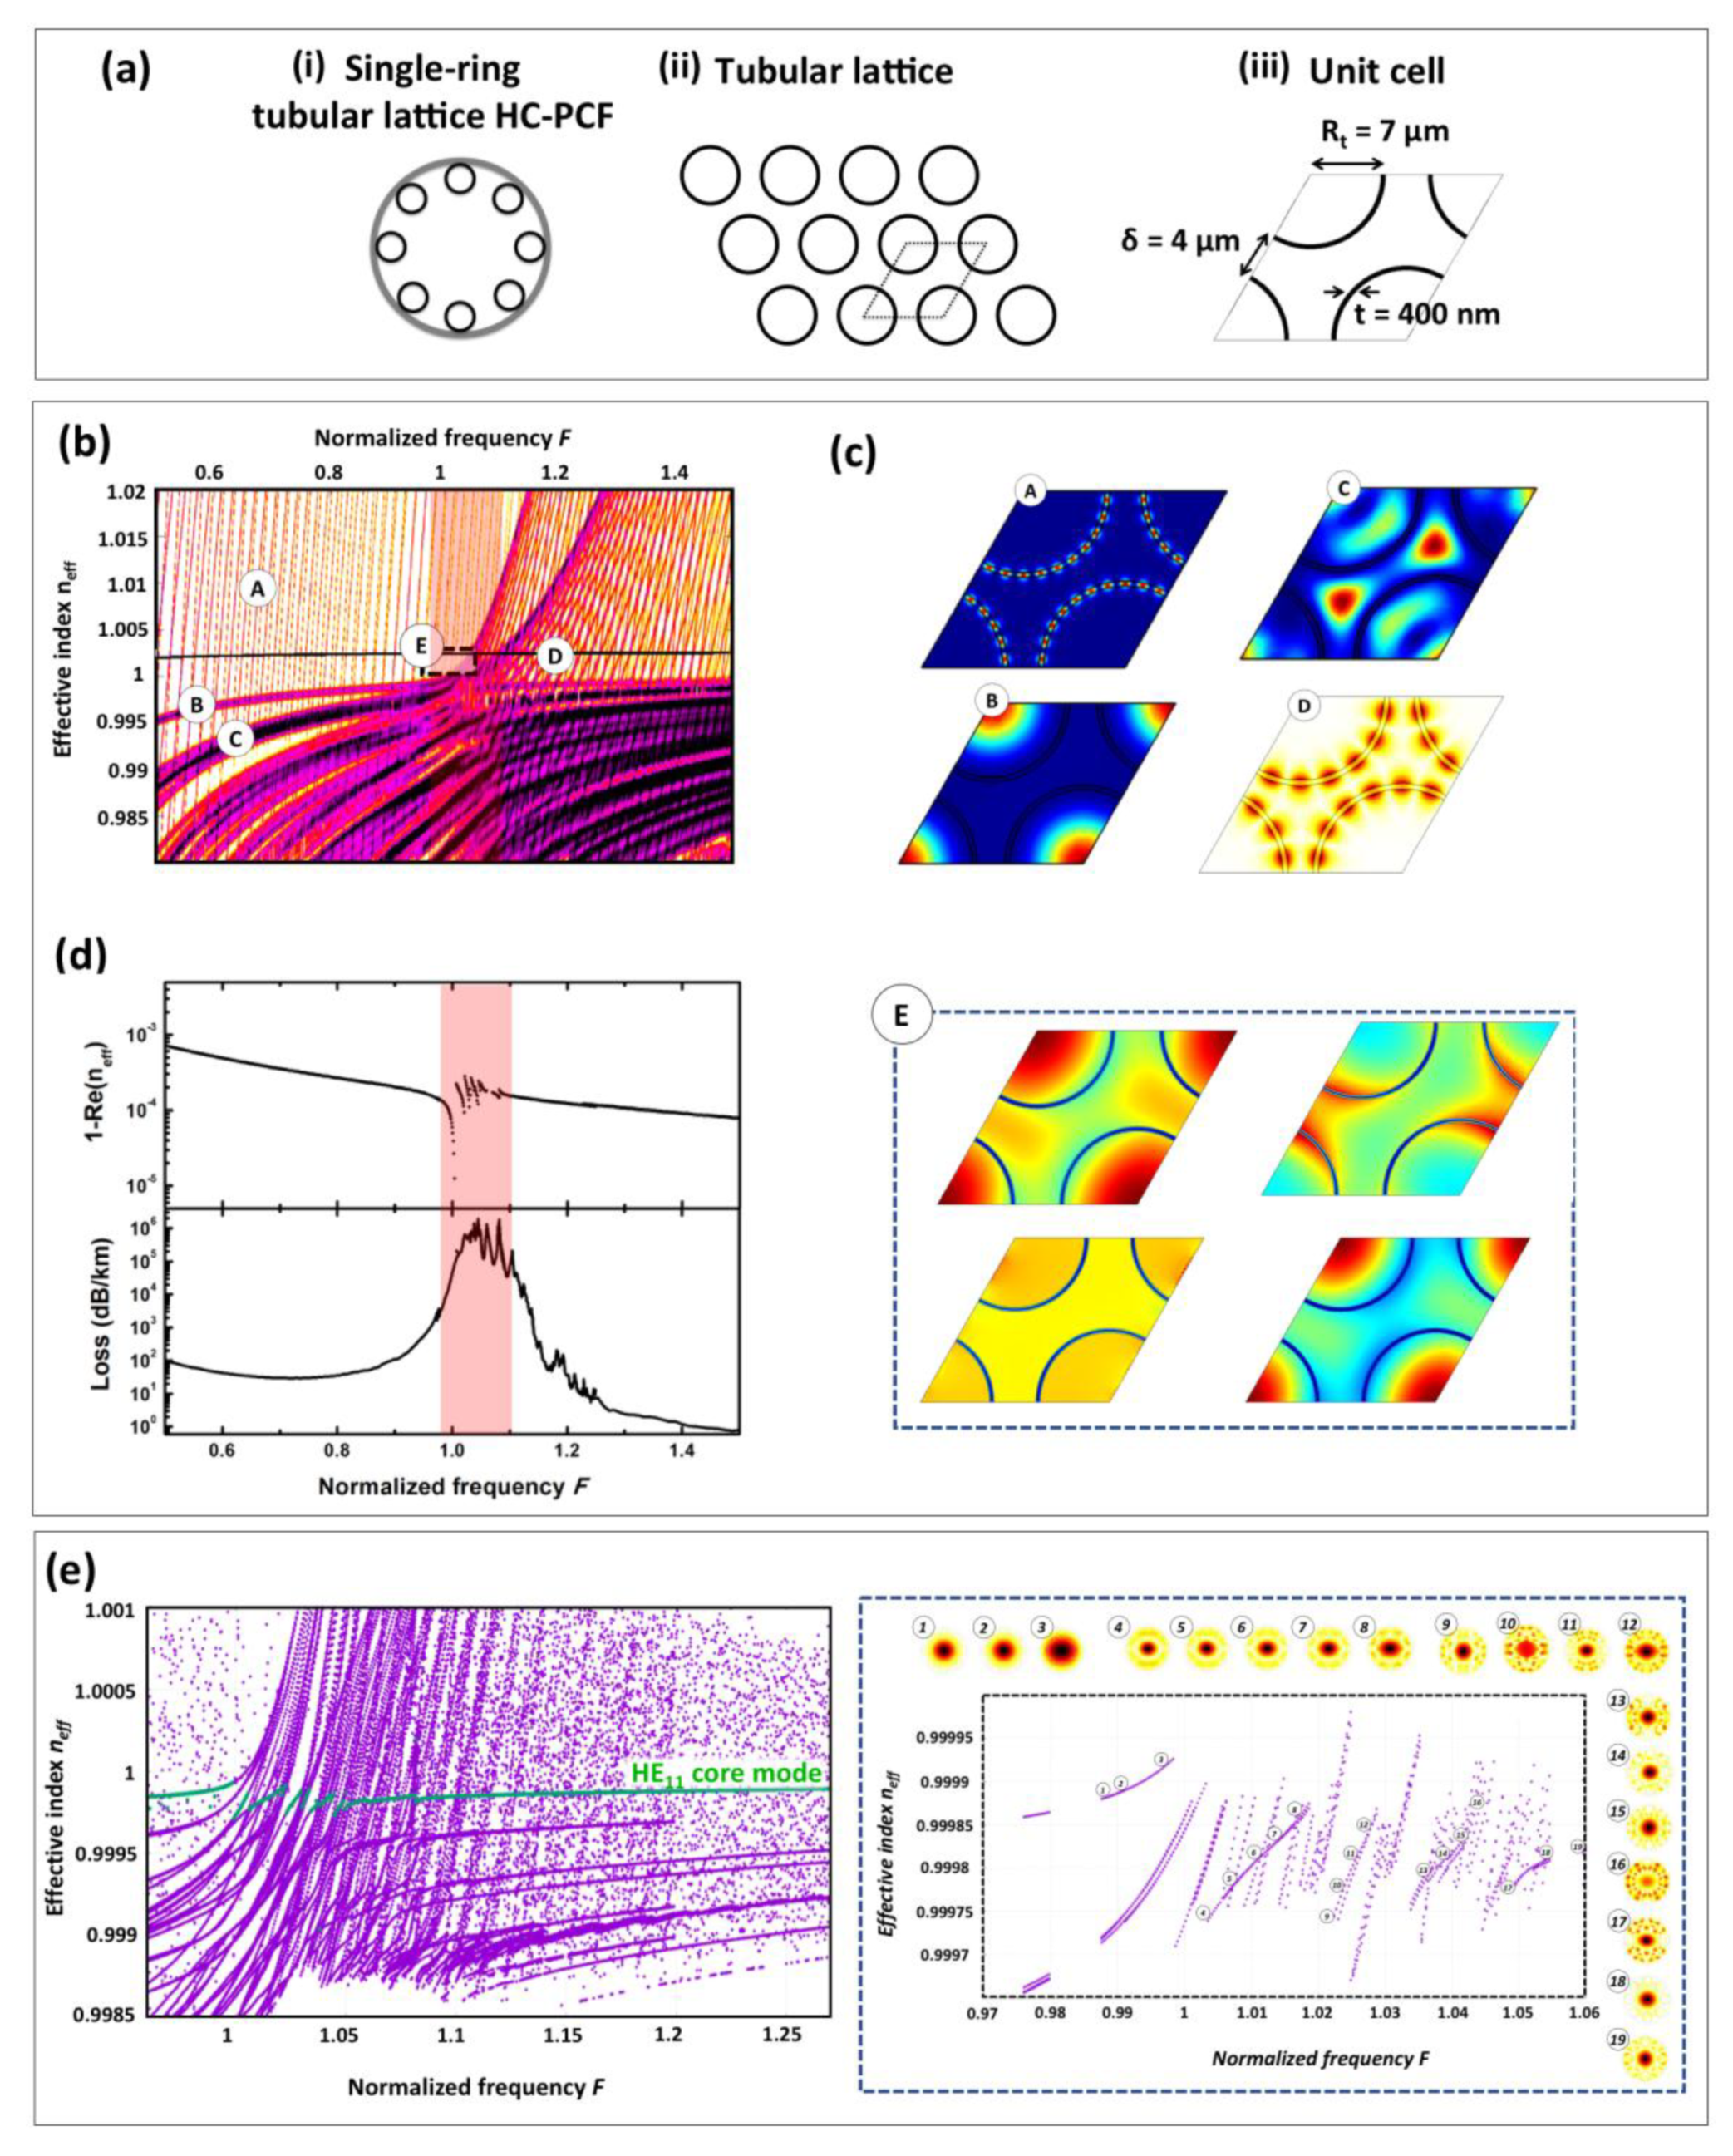
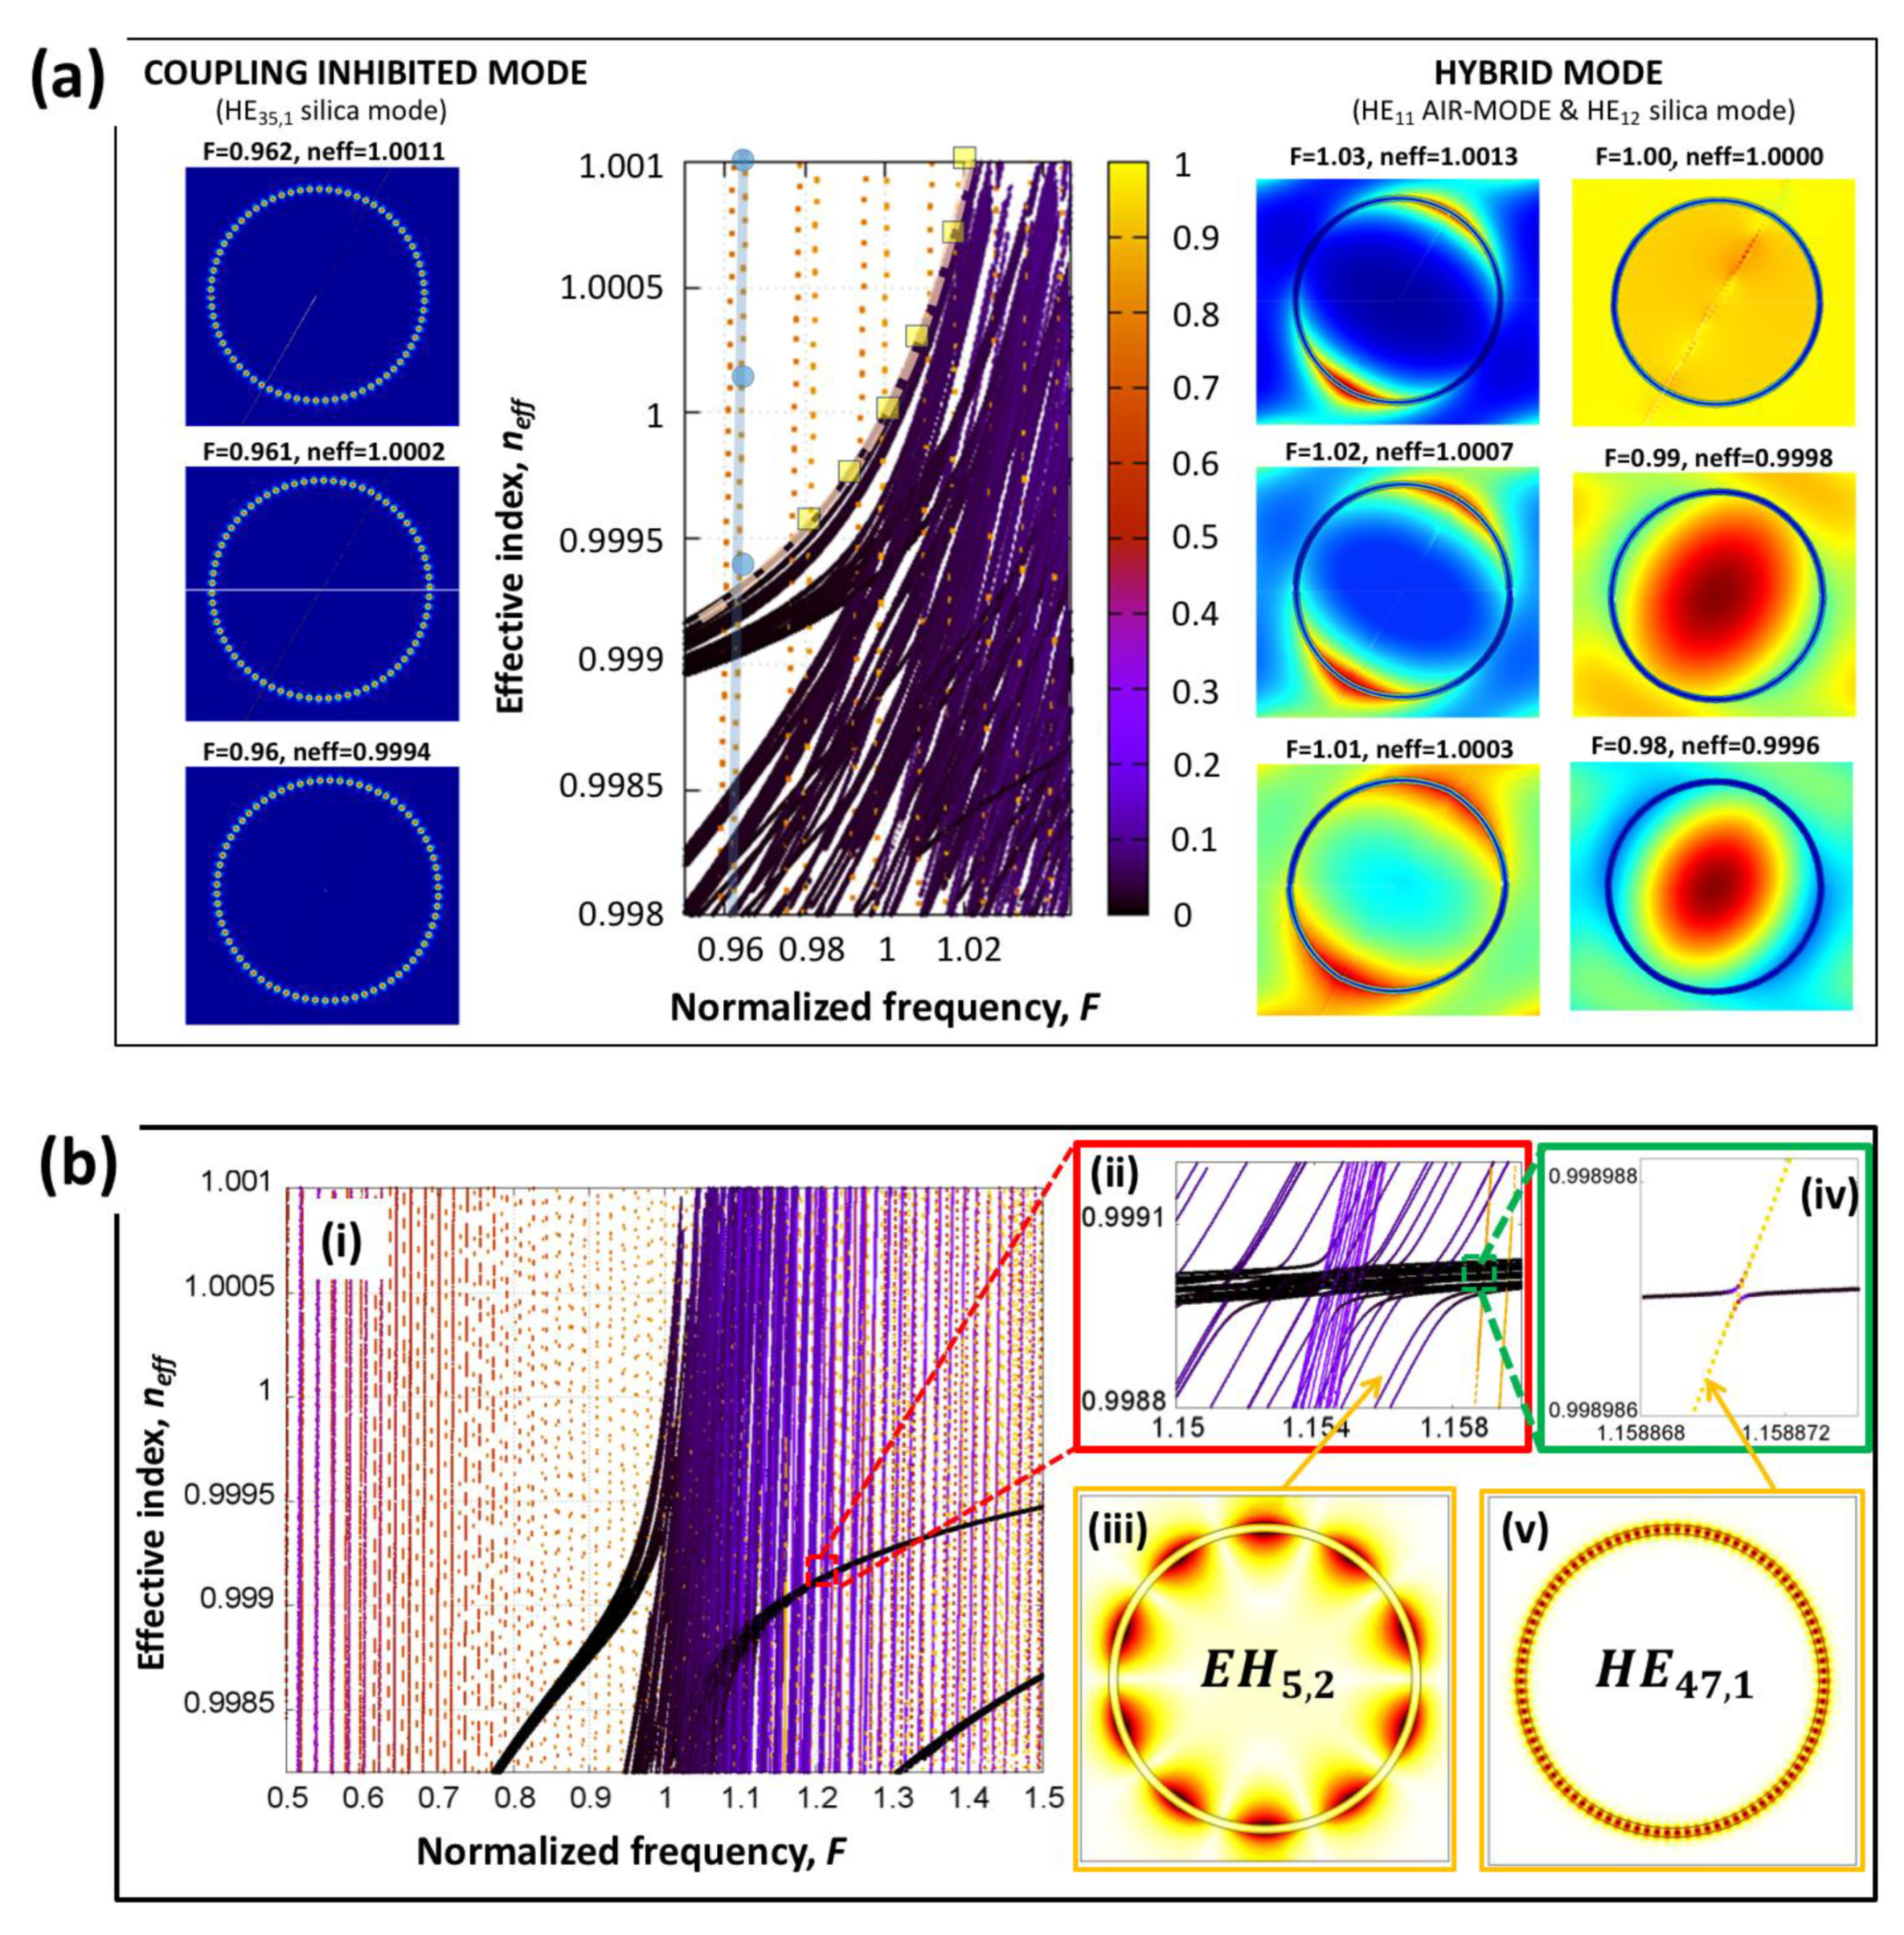
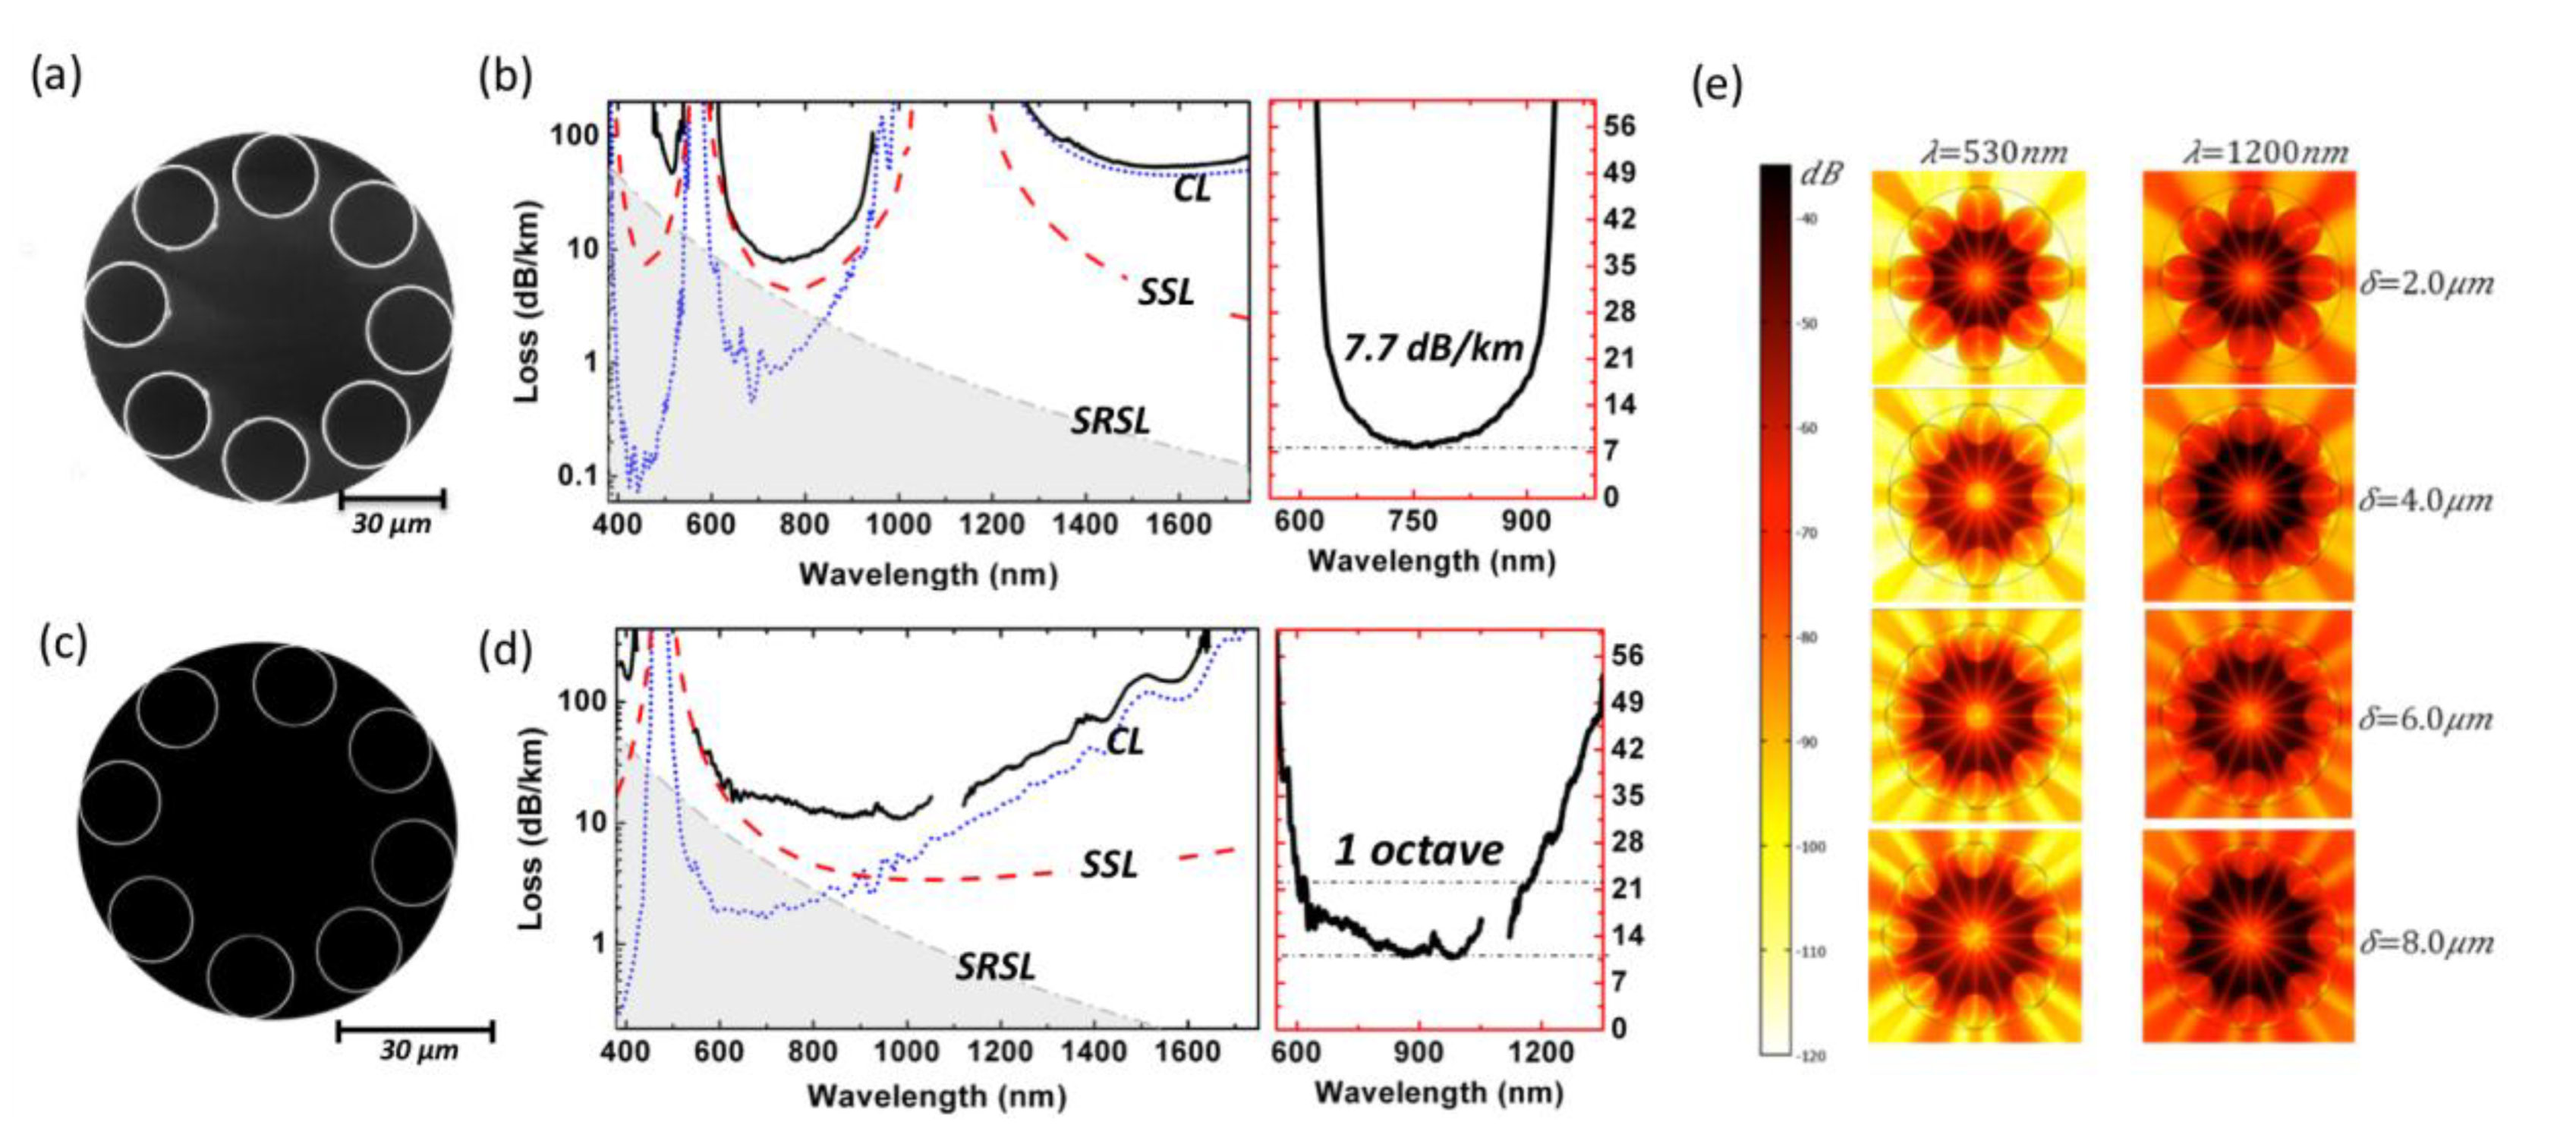
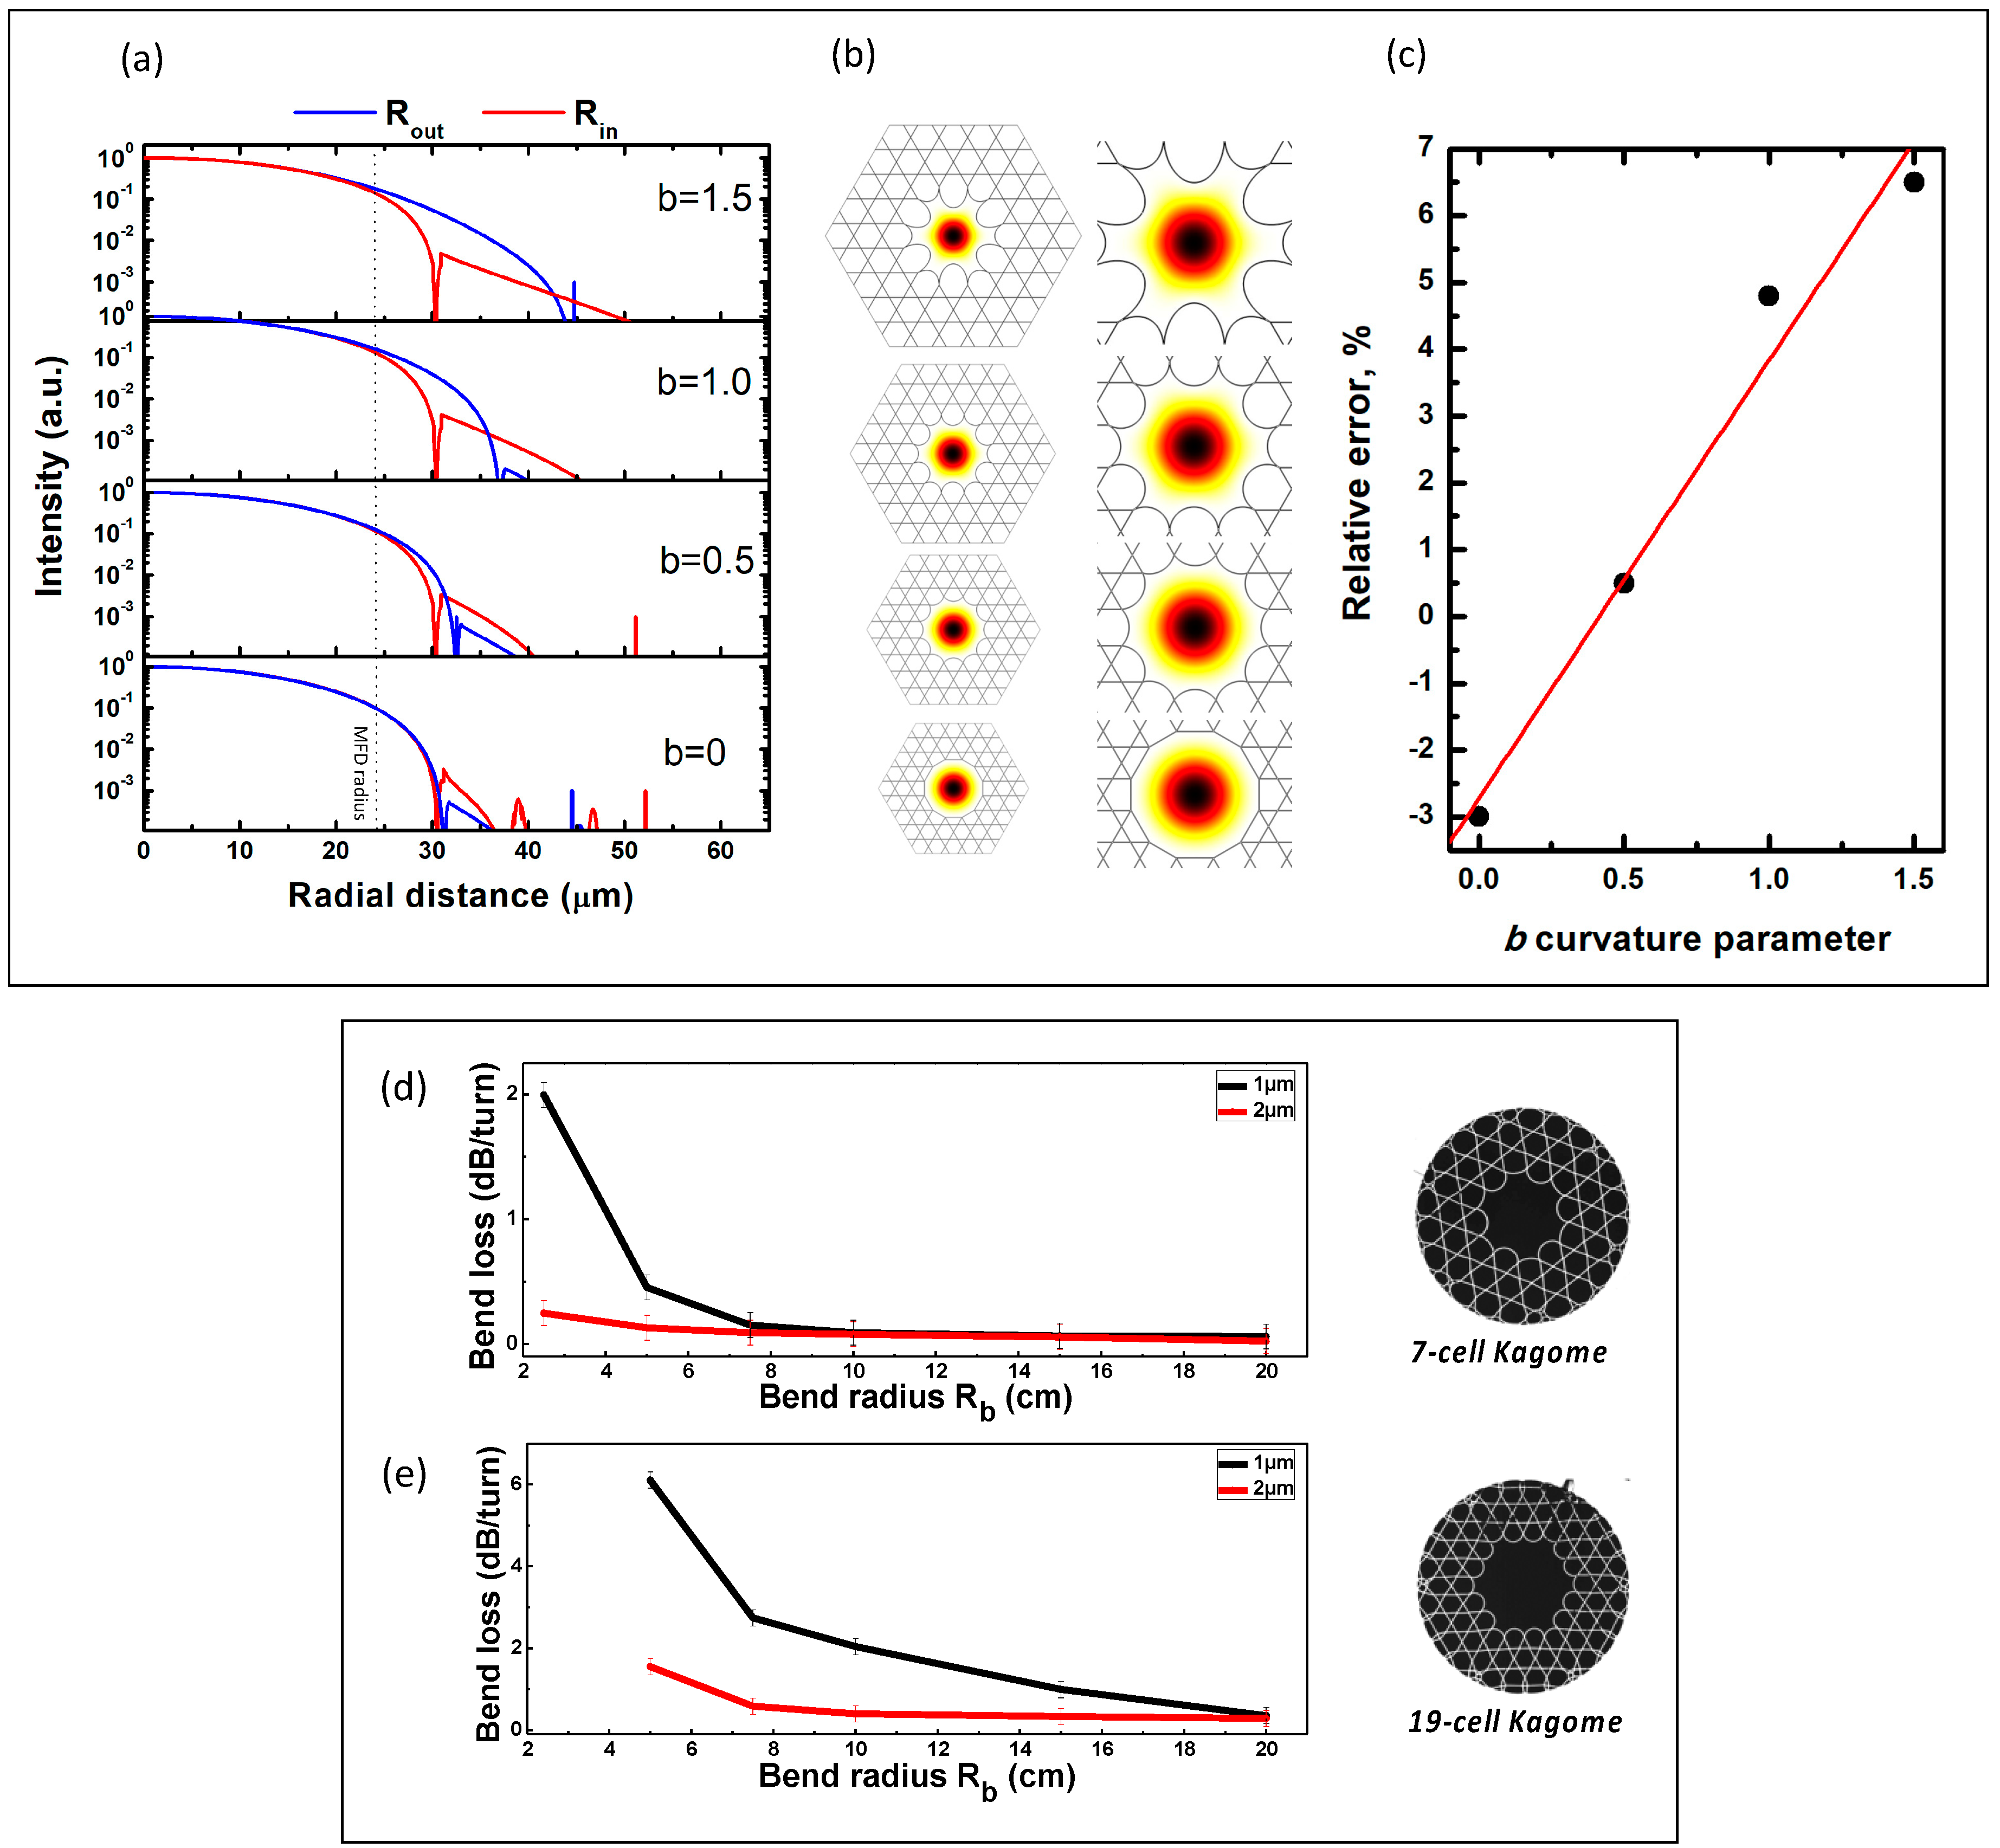
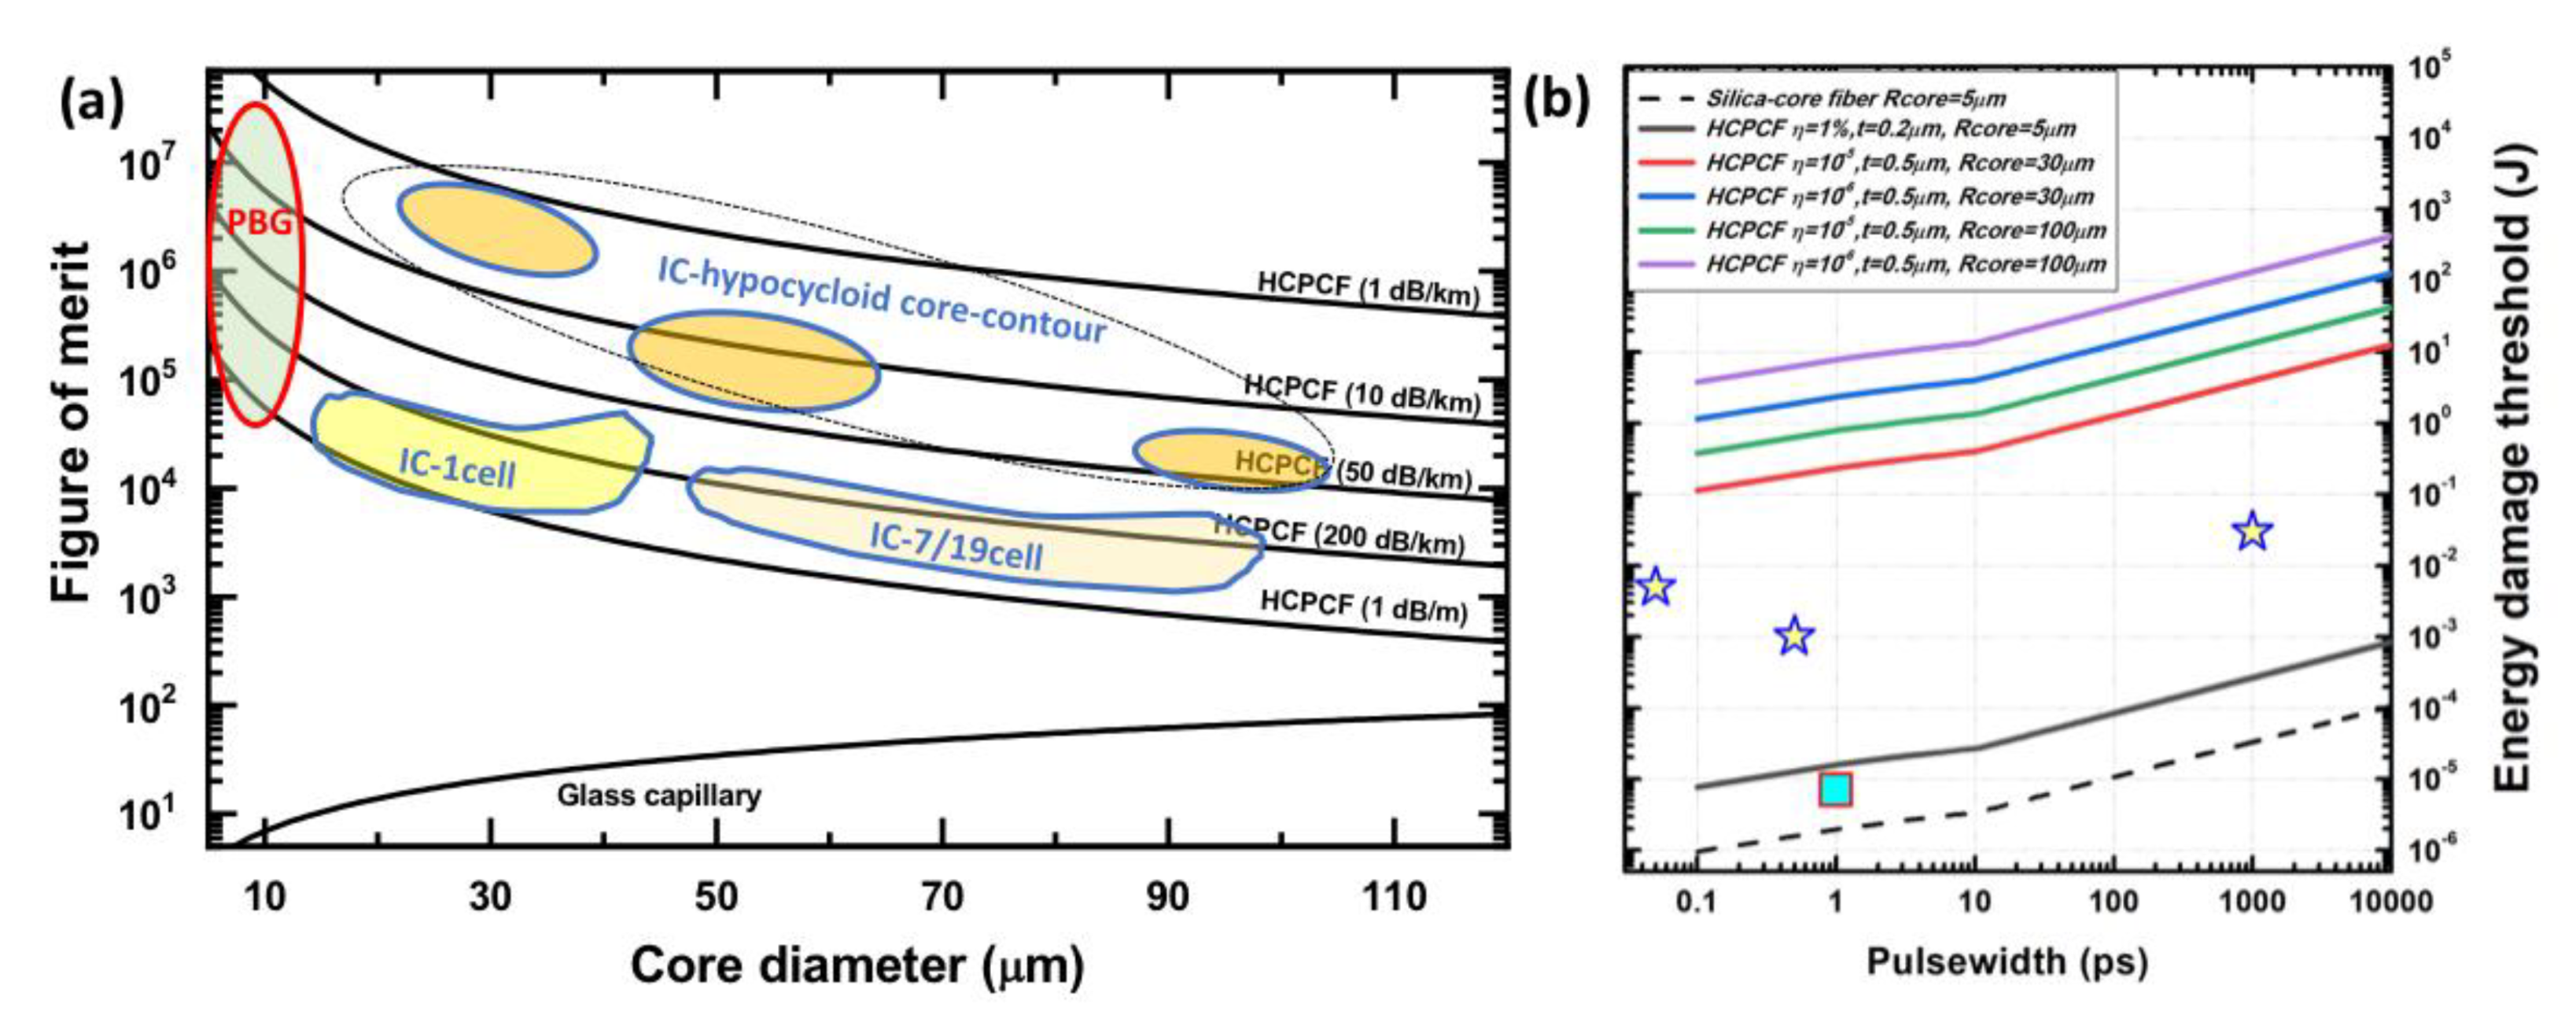
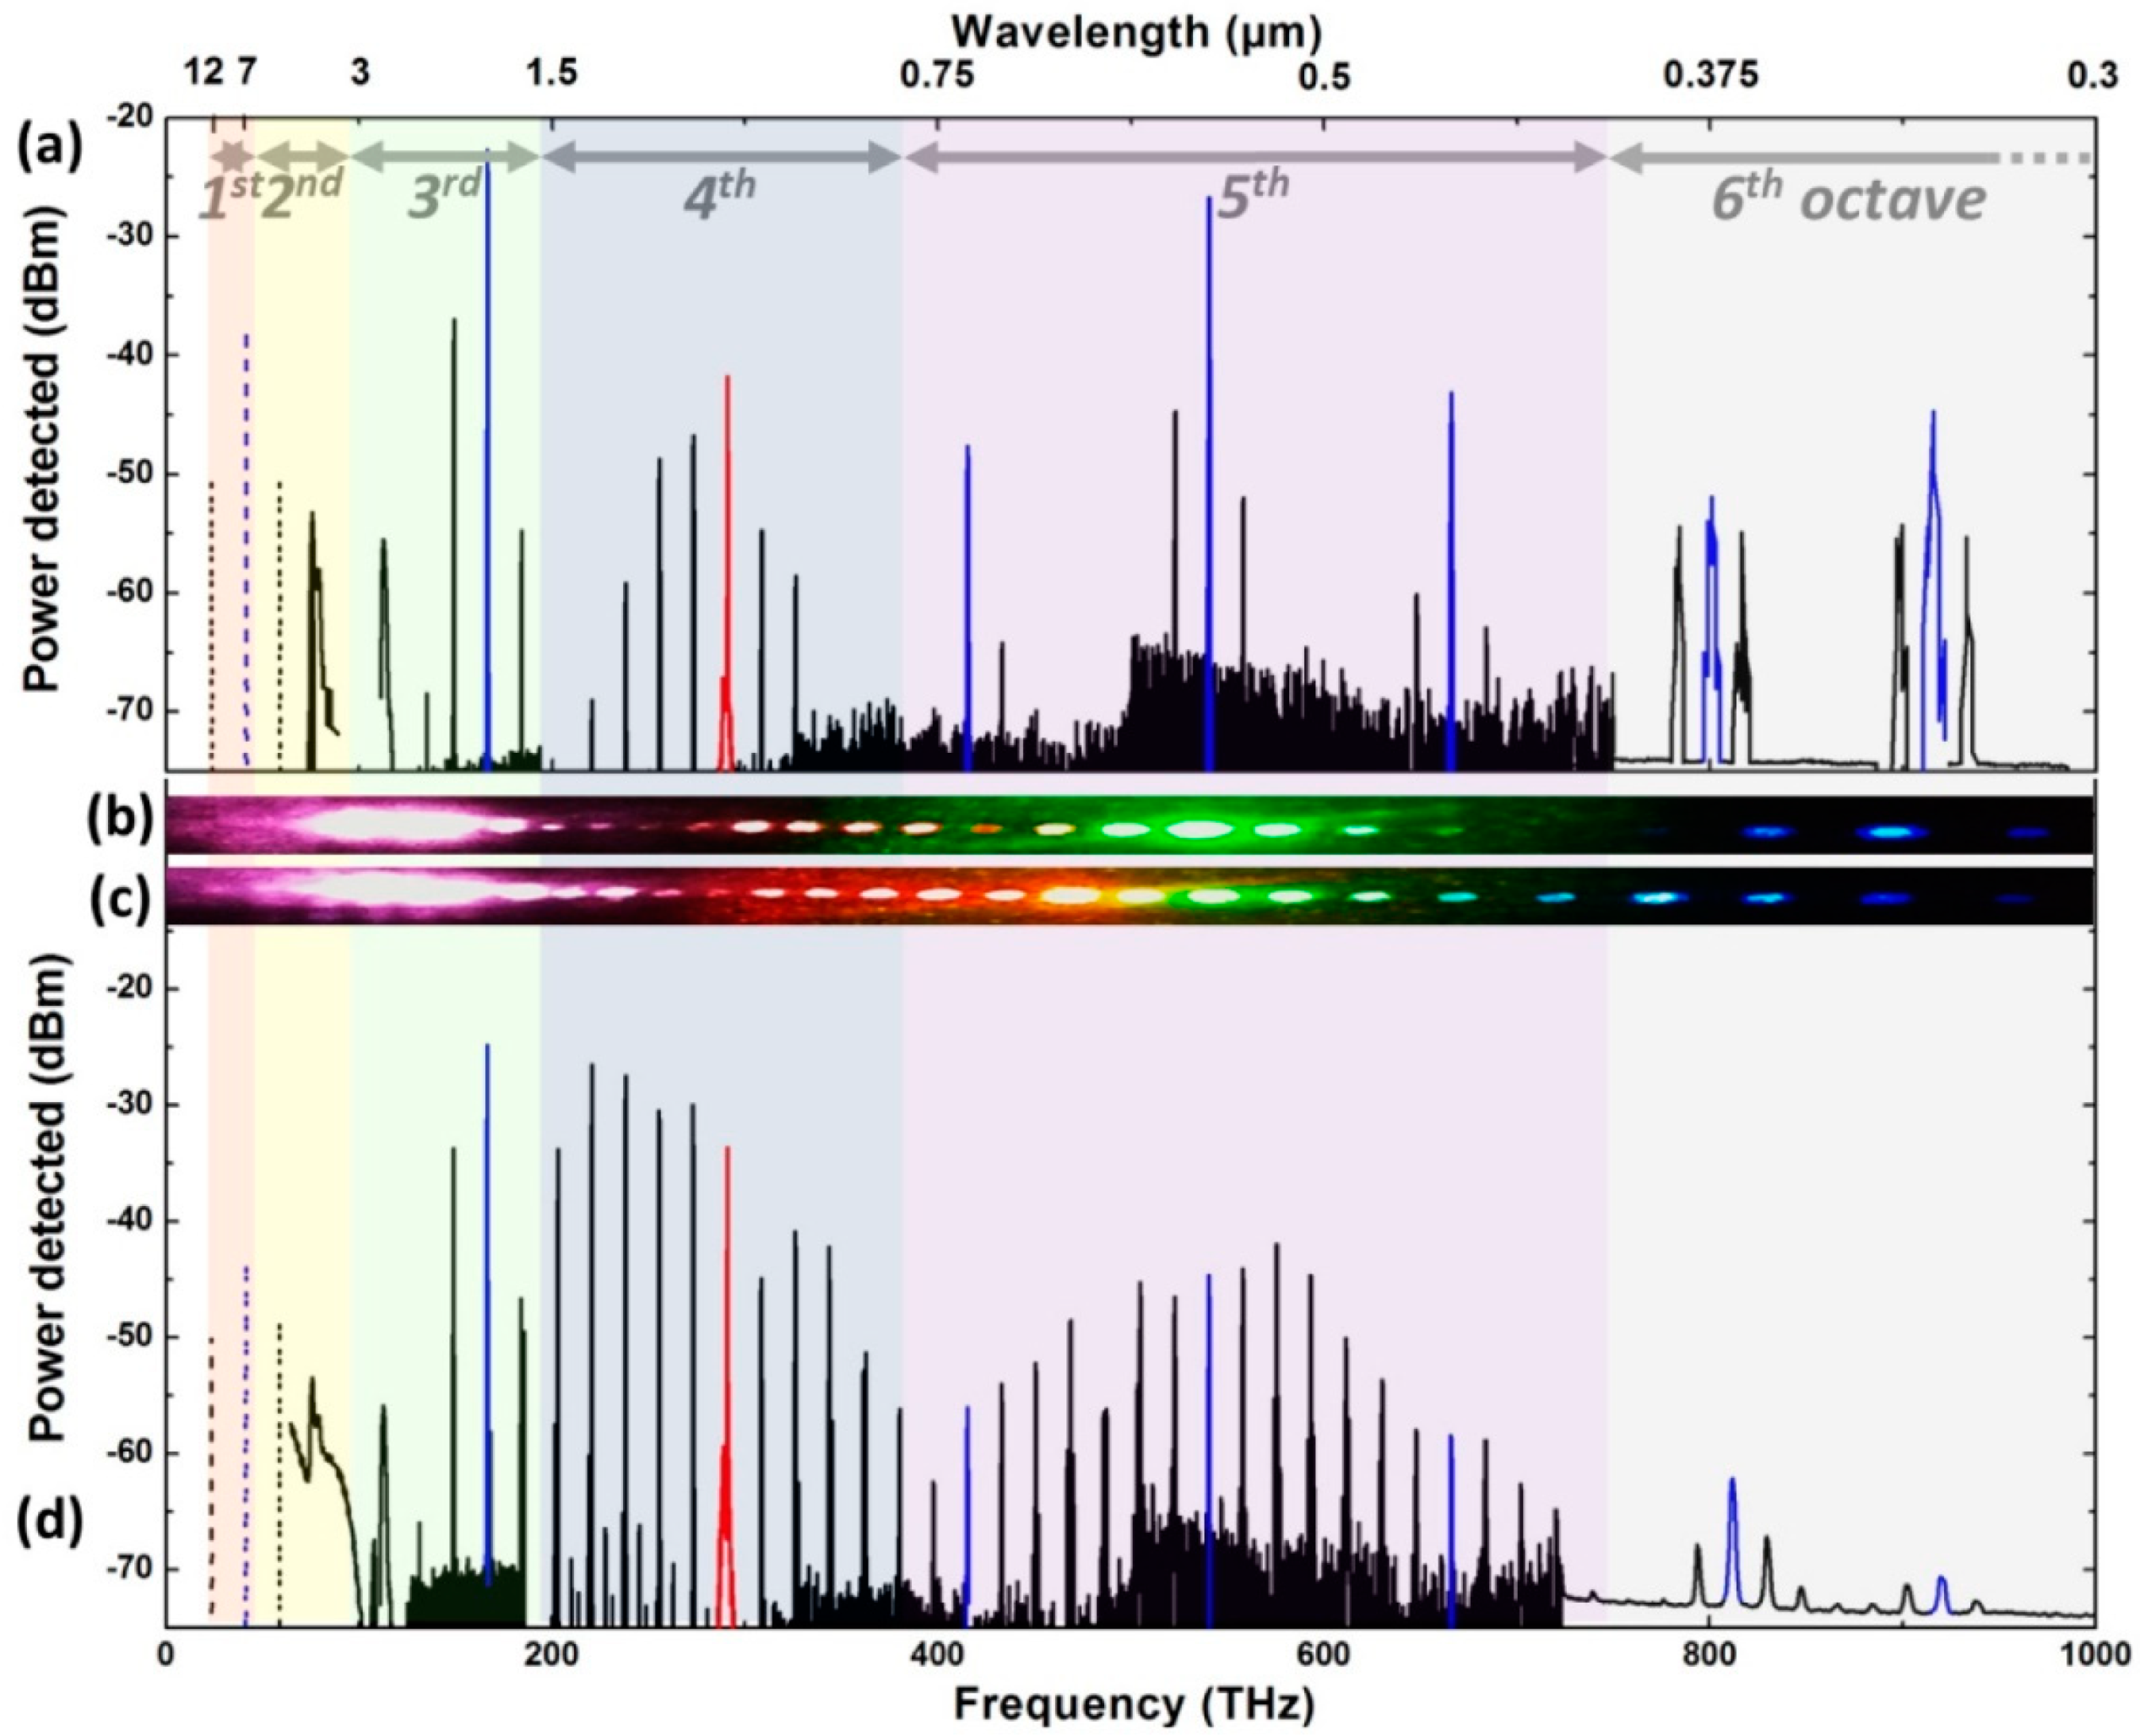
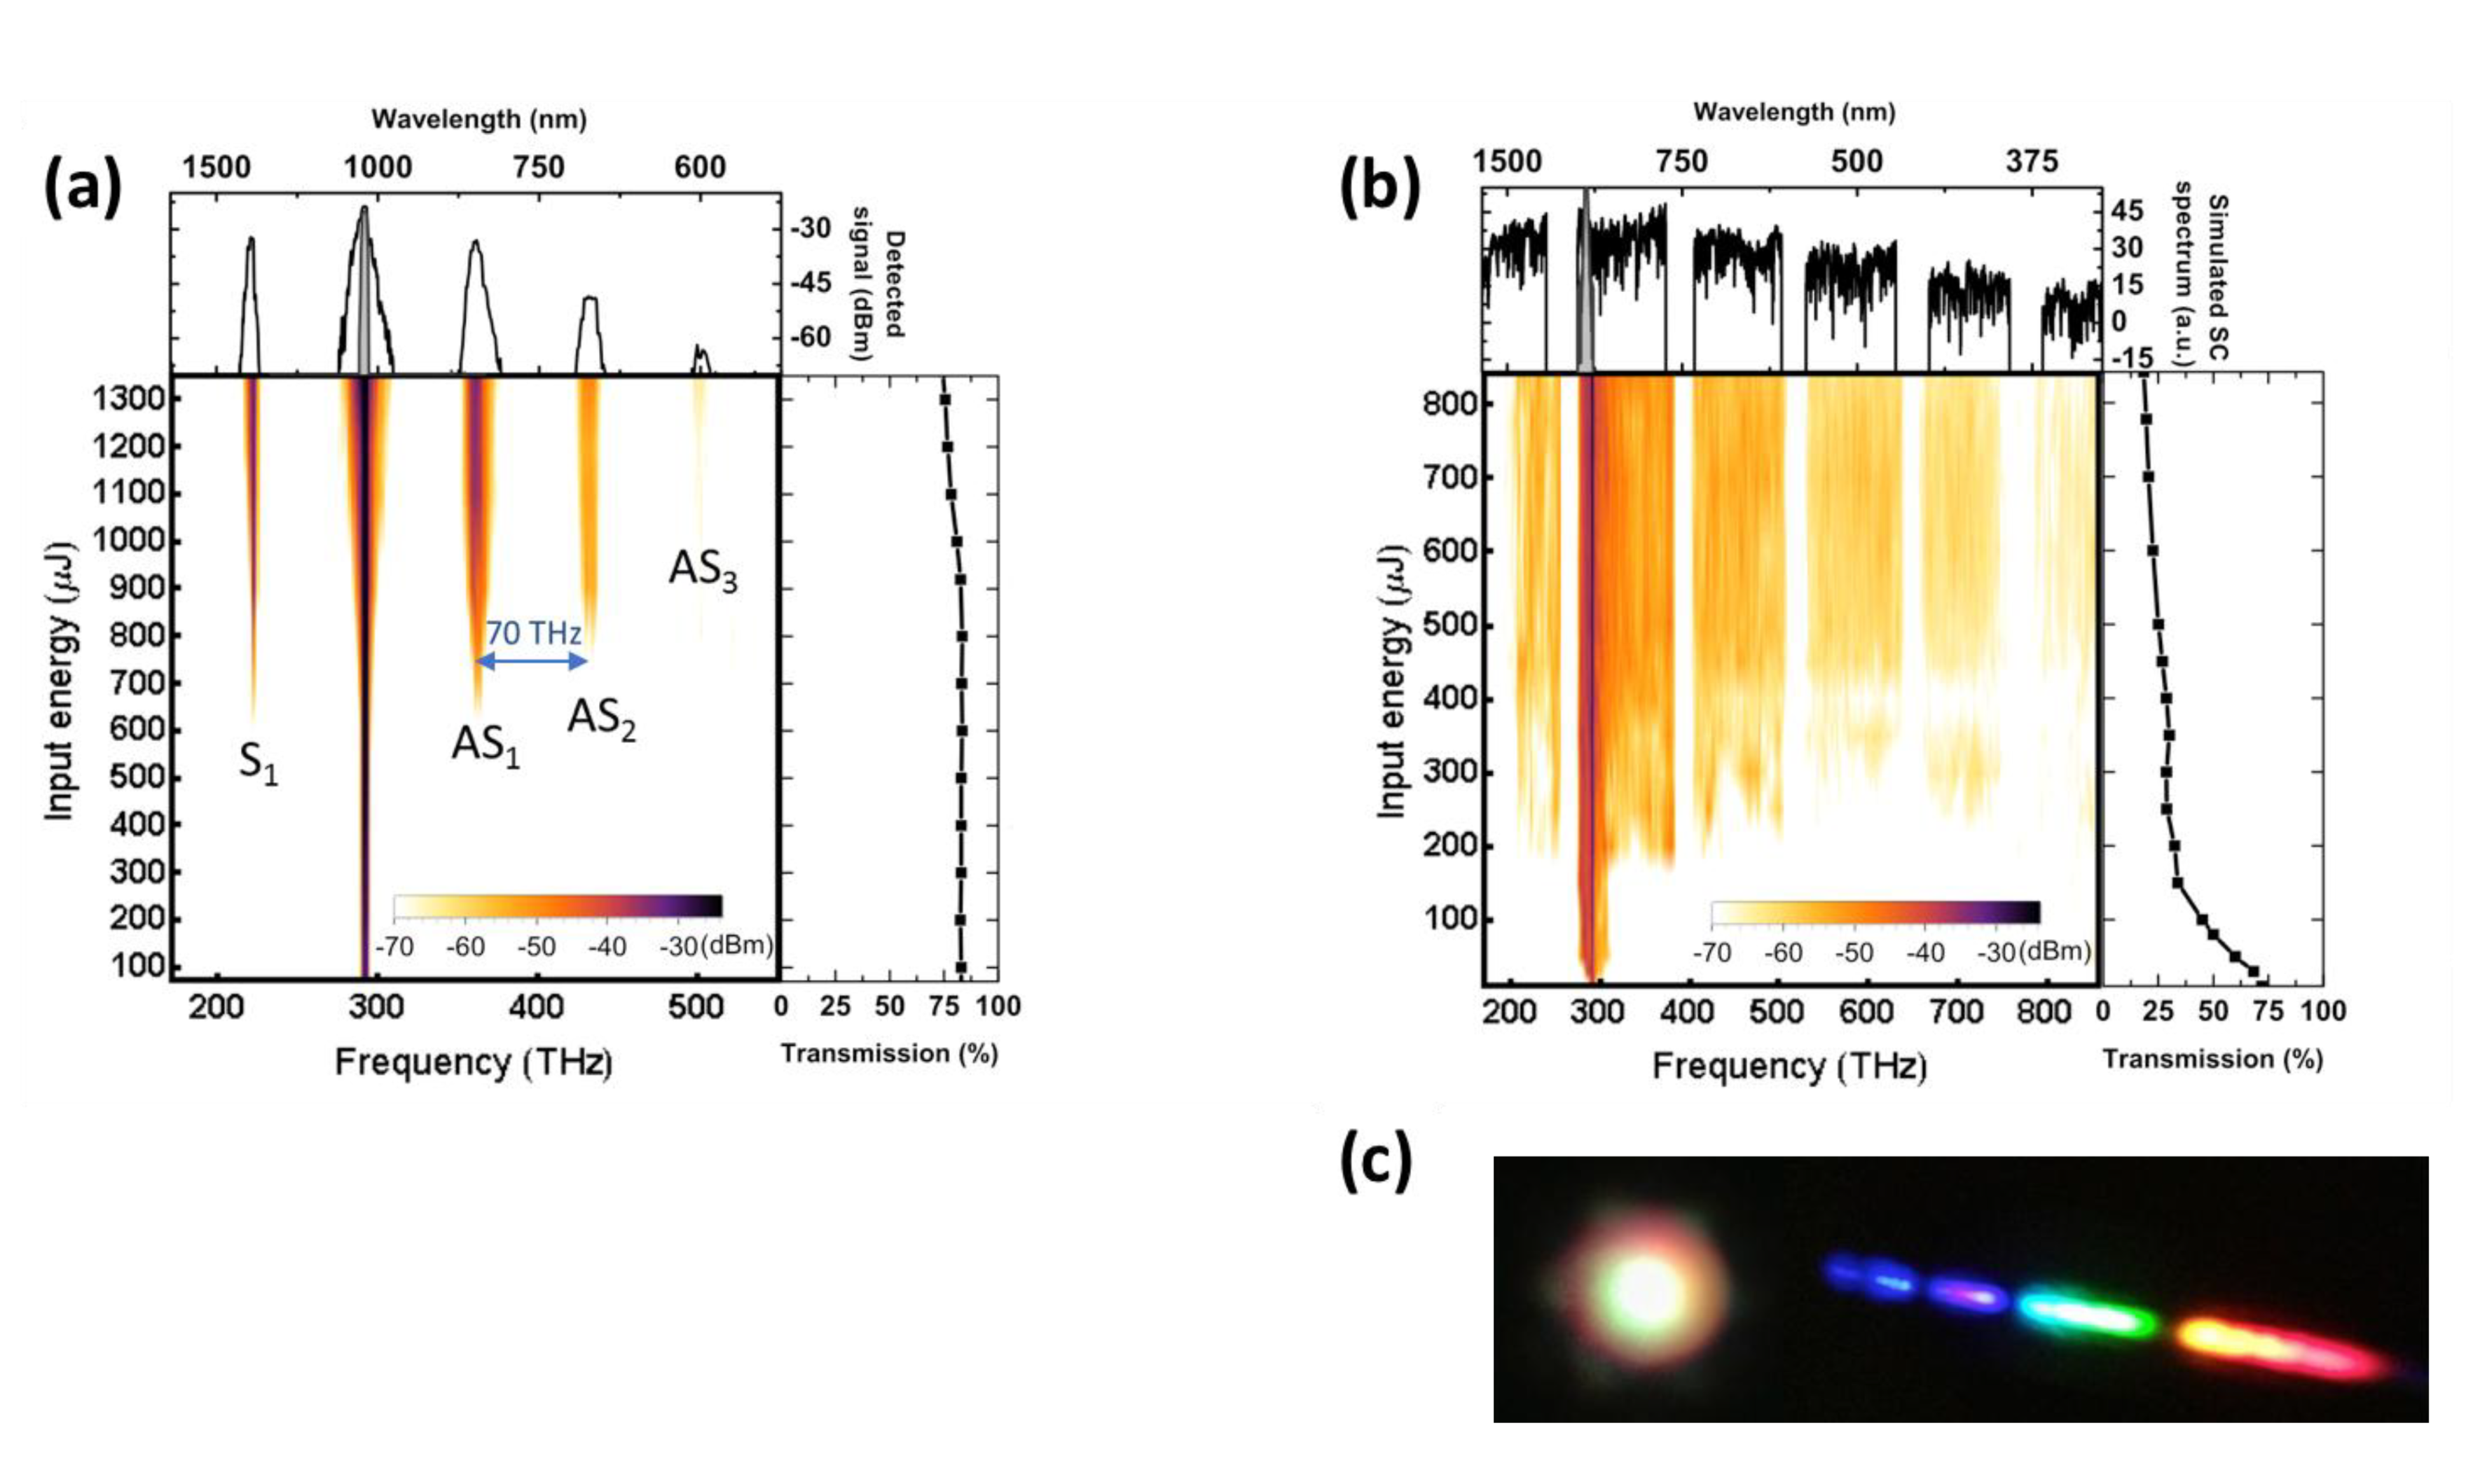
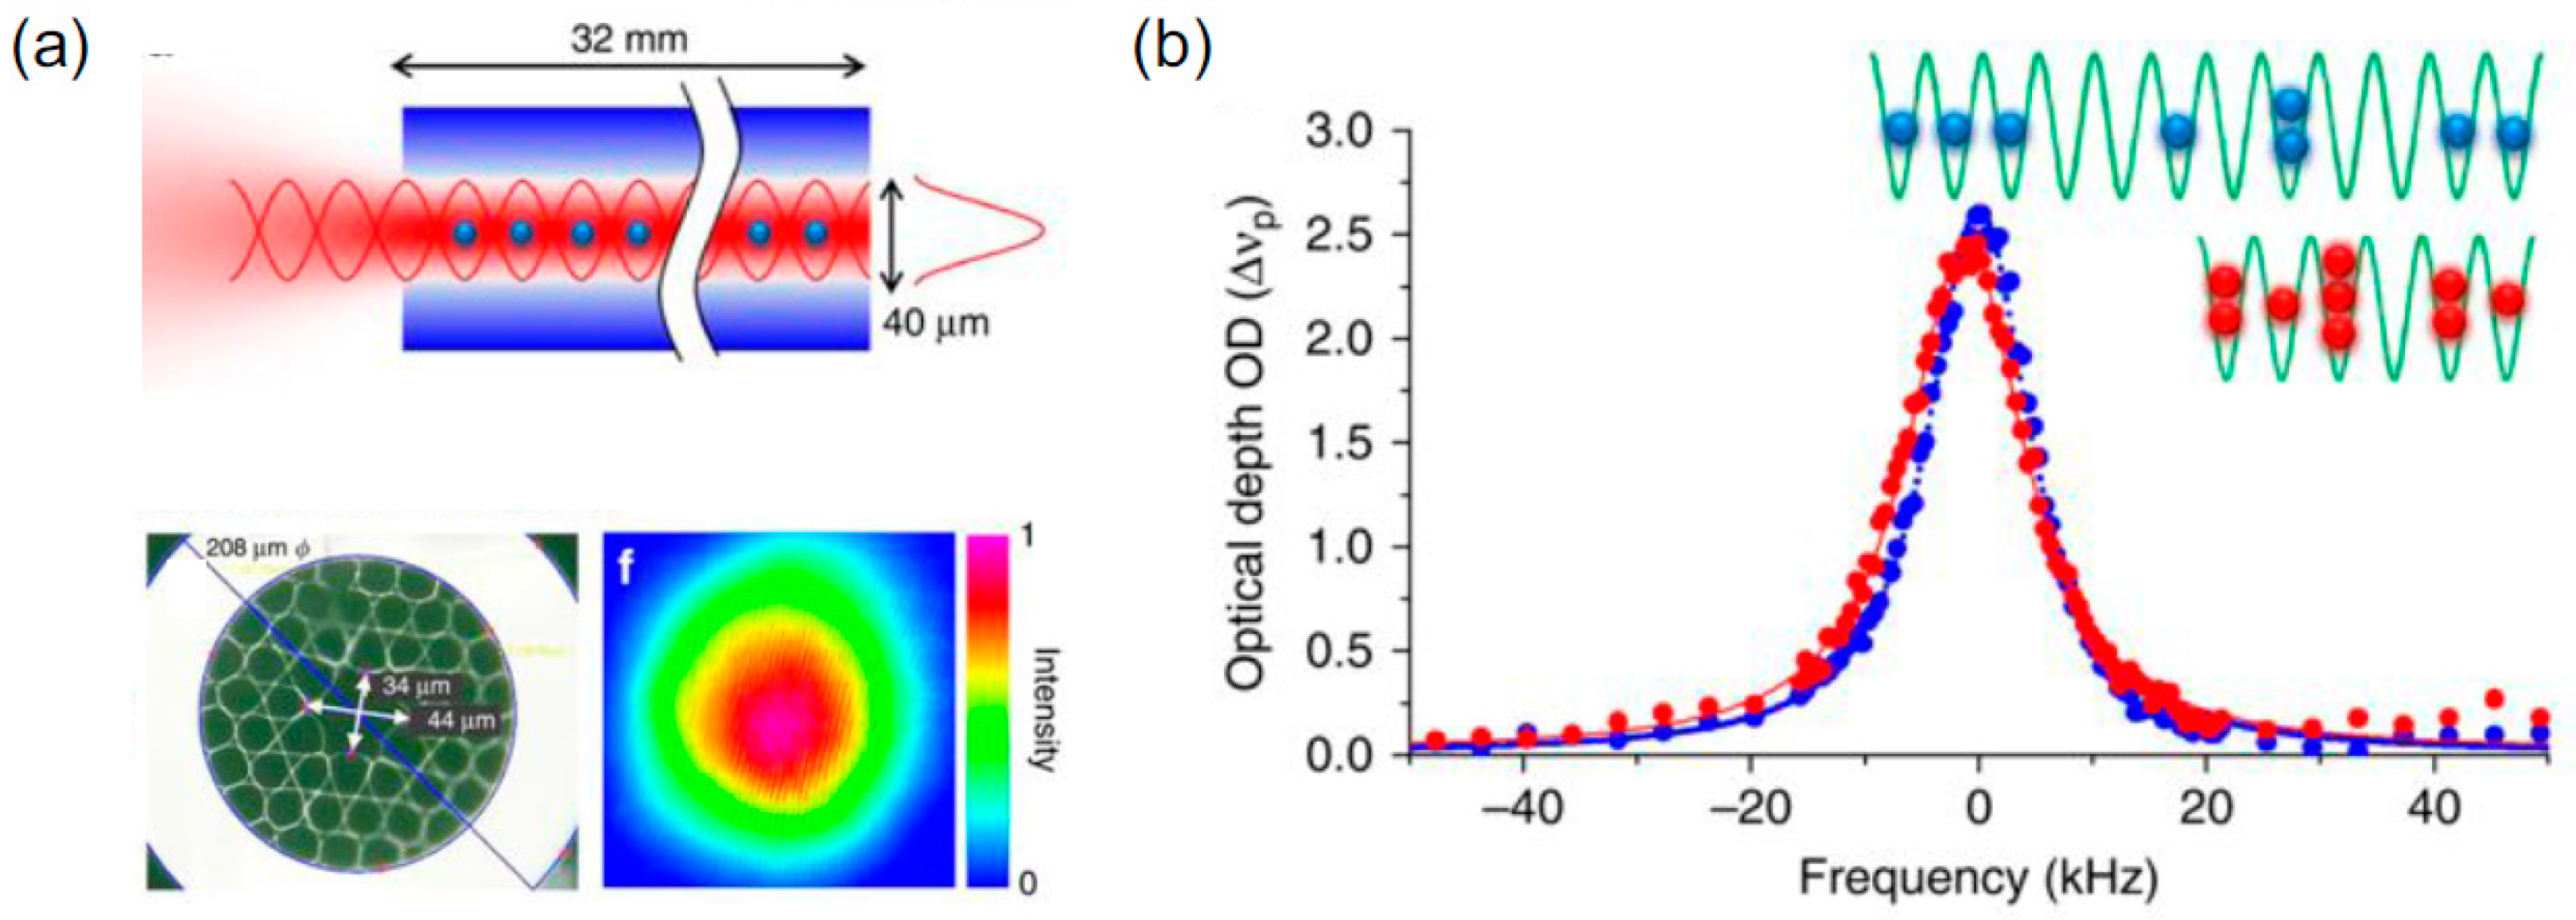
Table 1.
Representative pulse compression performances in HCPCF technology.
| Reference | Wavelength | Compression Scheme | Input/Output Energy | Input Pulse Duration | Output Pulse Duration | Compression Factor | Filling Gas |
|---|---|---|---|---|---|---|---|
| Mak et al. [114] | 790 nm | Postcompression | 10.3 µJ | 103 fs | 12.6 fs | ~8 | Krypton |
| Mak et al. [114] | 790 nm | Self-compression | 6.6 µJ | 24 fs | 6.8 fs | ~3.5 | Krypton |
| Hädrich et al. [106] | 1030 nm | Postcompression | 9 µJ | 250 fs | 30 fs | ~8.3 | Krypton |
| Guichard et al. [115] | 1030 nm | Postcompression | 70 µJ | 330 fs | 34 fs | ~9.7 | Ambiant air |
| Debord et al. [31] | 1030 nm | Self-compression | 450 µJ | 600 fs | 49 fs | ~12 | Ambiant air |
| Emaury et al. [116] | 1030 nm | Postcompression | 1.95 µJ | 860 fs | 48 fs | ~17.9 | Xenon |
| Balciunas et al. [16] | 1080 nm | Self-compression | 35 µJ | 80 fs | 4.5 fs | ~17 | Xenon |
| Wang et al. [61] | 1500 nm | Self-compression | 105 µJ | 850 fs | 300 fs | ~2.8 | Ambiant air |
| Gebhardt et al. [117] | 1820 nm | Self-compression | 41 µJ/34.4 µJ | 110 fs | 14 fs | ~7.8 | Argon |
| Murari et al. [118] | 2050 nm | Postcompression | 227 µJ | 1.8 ps | 285 fs | ~6.3 | Argon |
© 2019 by the authors. Licensee MDPI, Basel, Switzerland. This article is an open access article distributed under the terms and conditions of the Creative Commons Attribution (CC BY) license (http://creativecommons.org/licenses/by/4.0/).
Share and Cite
MDPI and ACS Style
Debord, B.; Amrani, F.; Vincetti, L.; Gérôme, F.; Benabid, F. Hollow-Core Fiber Technology: The Rising of “Gas Photonics”. Fibers 2019, 7, 16. https://0-doi-org.brum.beds.ac.uk/10.3390/fib7020016
AMA Style
Debord B, Amrani F, Vincetti L, Gérôme F, Benabid F. Hollow-Core Fiber Technology: The Rising of “Gas Photonics”. Fibers. 2019; 7(2):16. https://0-doi-org.brum.beds.ac.uk/10.3390/fib7020016
Chicago/Turabian StyleDebord, Benoît, Foued Amrani, Luca Vincetti, Frédéric Gérôme, and Fetah Benabid. 2019. "Hollow-Core Fiber Technology: The Rising of “Gas Photonics”" Fibers 7, no. 2: 16. https://0-doi-org.brum.beds.ac.uk/10.3390/fib7020016
Note that from the first issue of 2016, this journal uses article numbers instead of page numbers. See further details here.