Dissolution Kinetics of R-Glass Fibres: Influence of Water Acidity, Temperature, and Stress Corrosion

 ,
,  and
and
Abstract
:
1. Introduction
2. Materials and Methods
2.1. Materials
2.2. Methods
Glass Dissolution Experiments:
3. Dissolving Cylinder Zero-Order Kinetic (DCZOK) Model
3.1. The Model and Its Assumptions
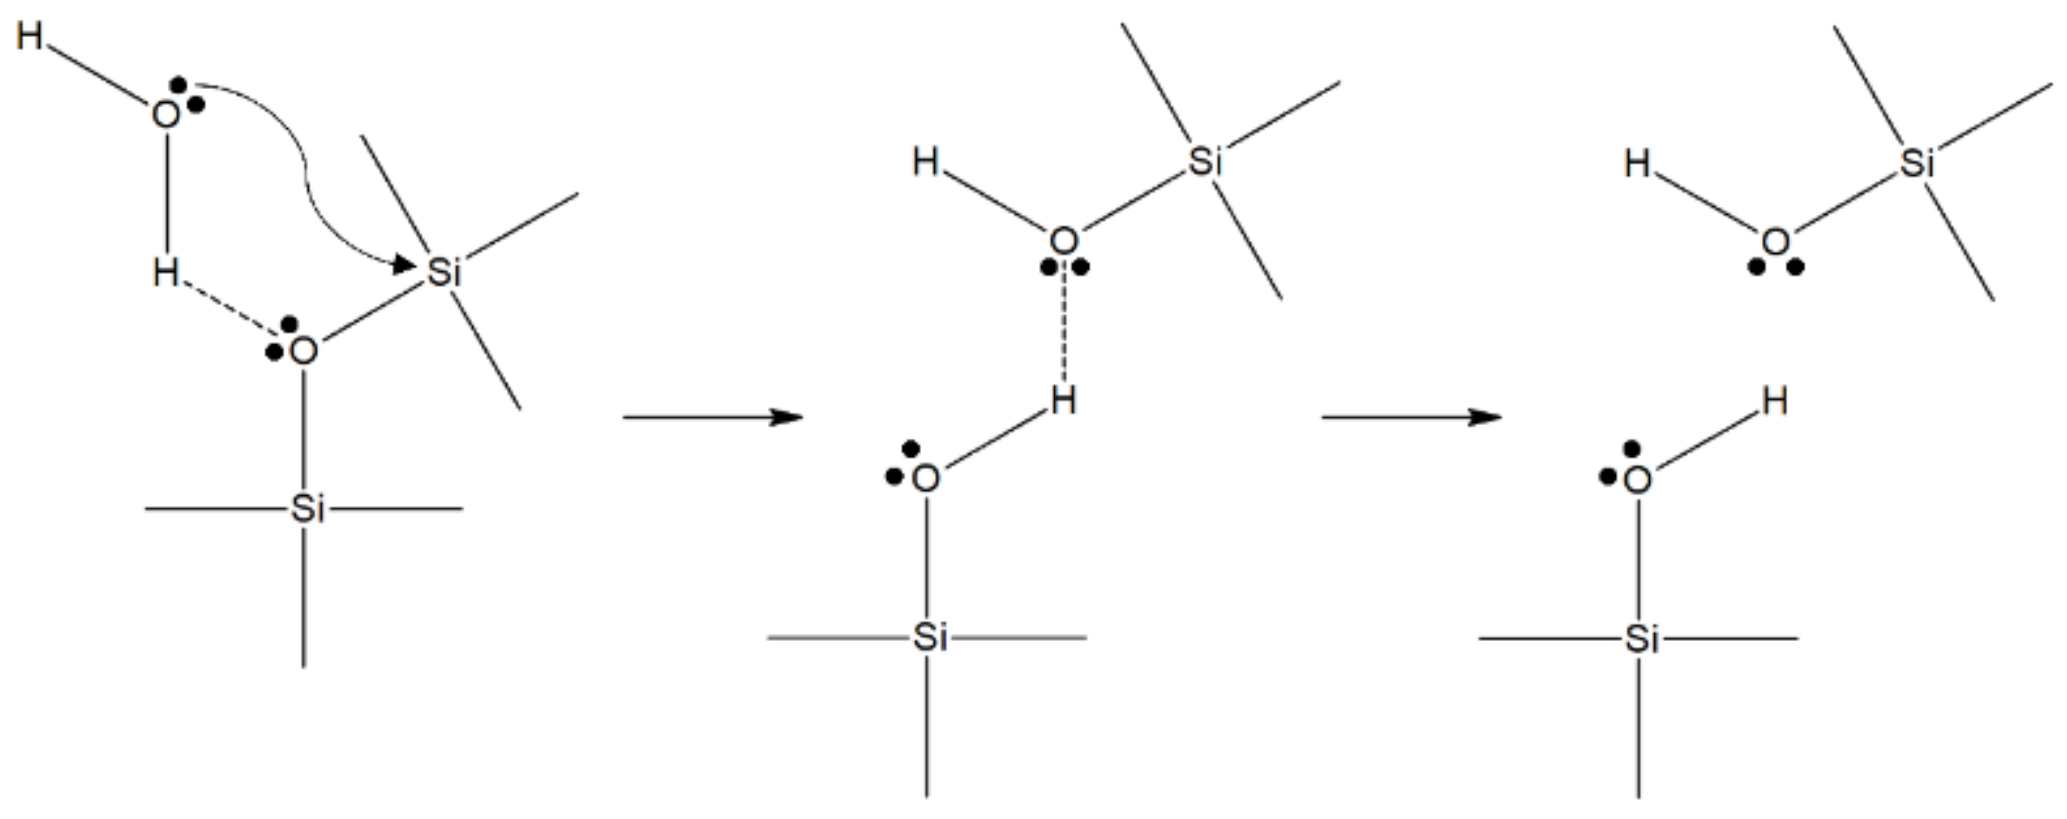
3.2. The Effect of the Environment on the Dissolution Rate Constant
3.3. Modelling of the Two Distinct Stages of Glass Degradation
4. Results
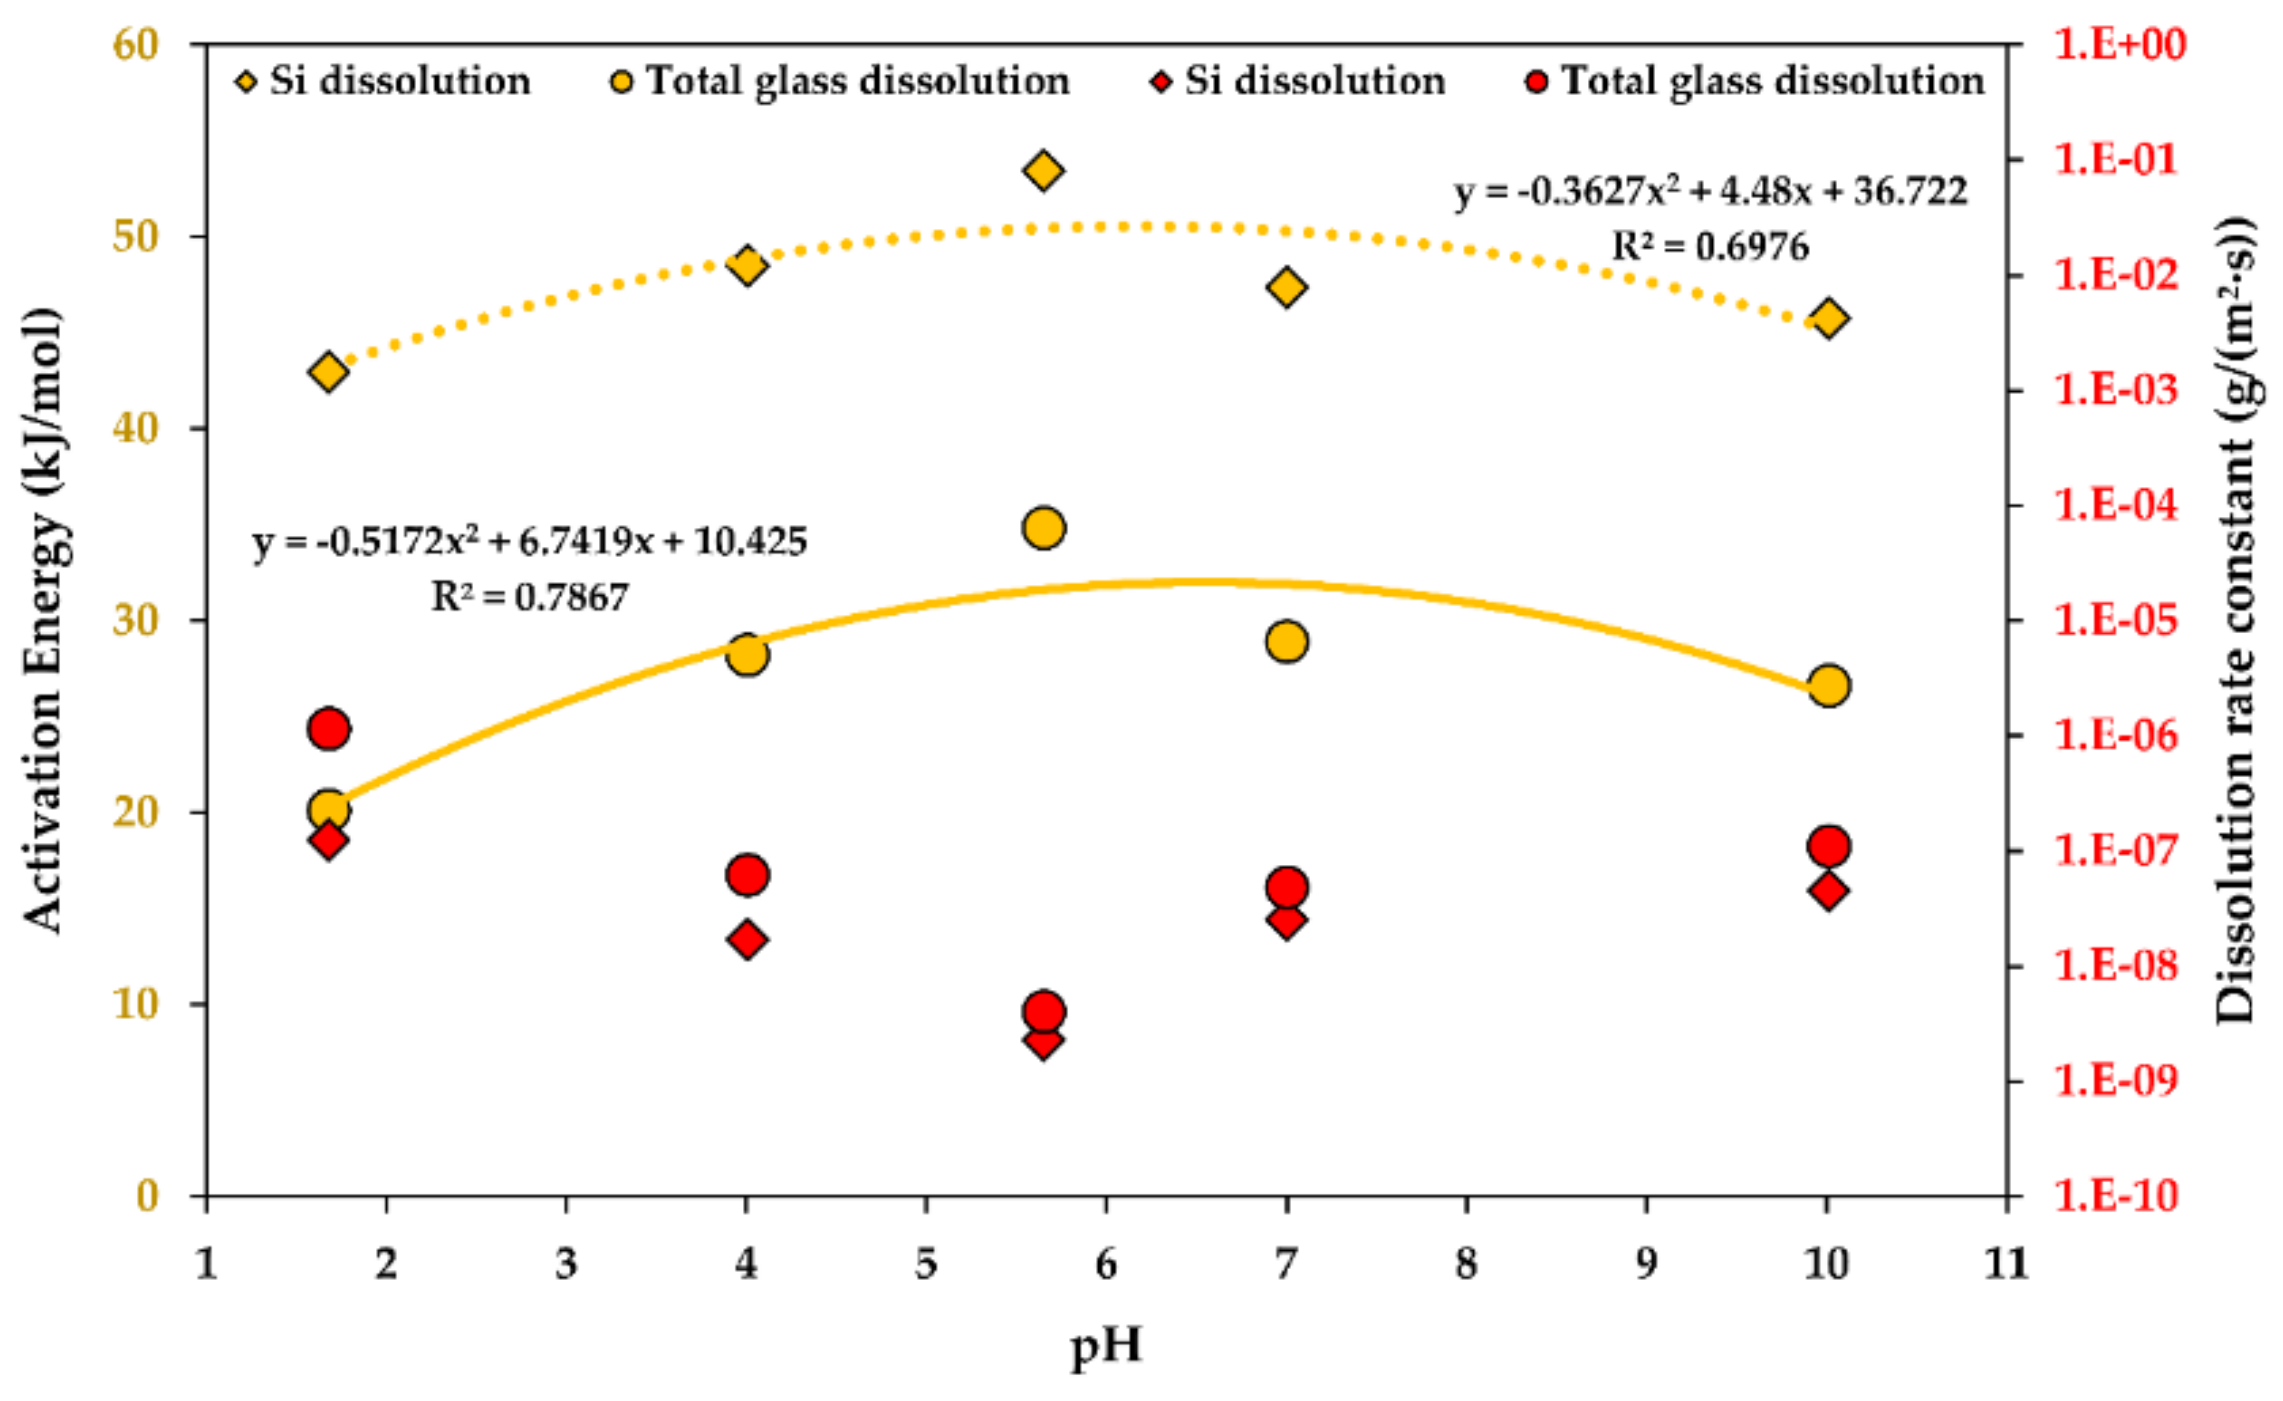
4.1. Effect of on the Glass Dissolution Kinetics
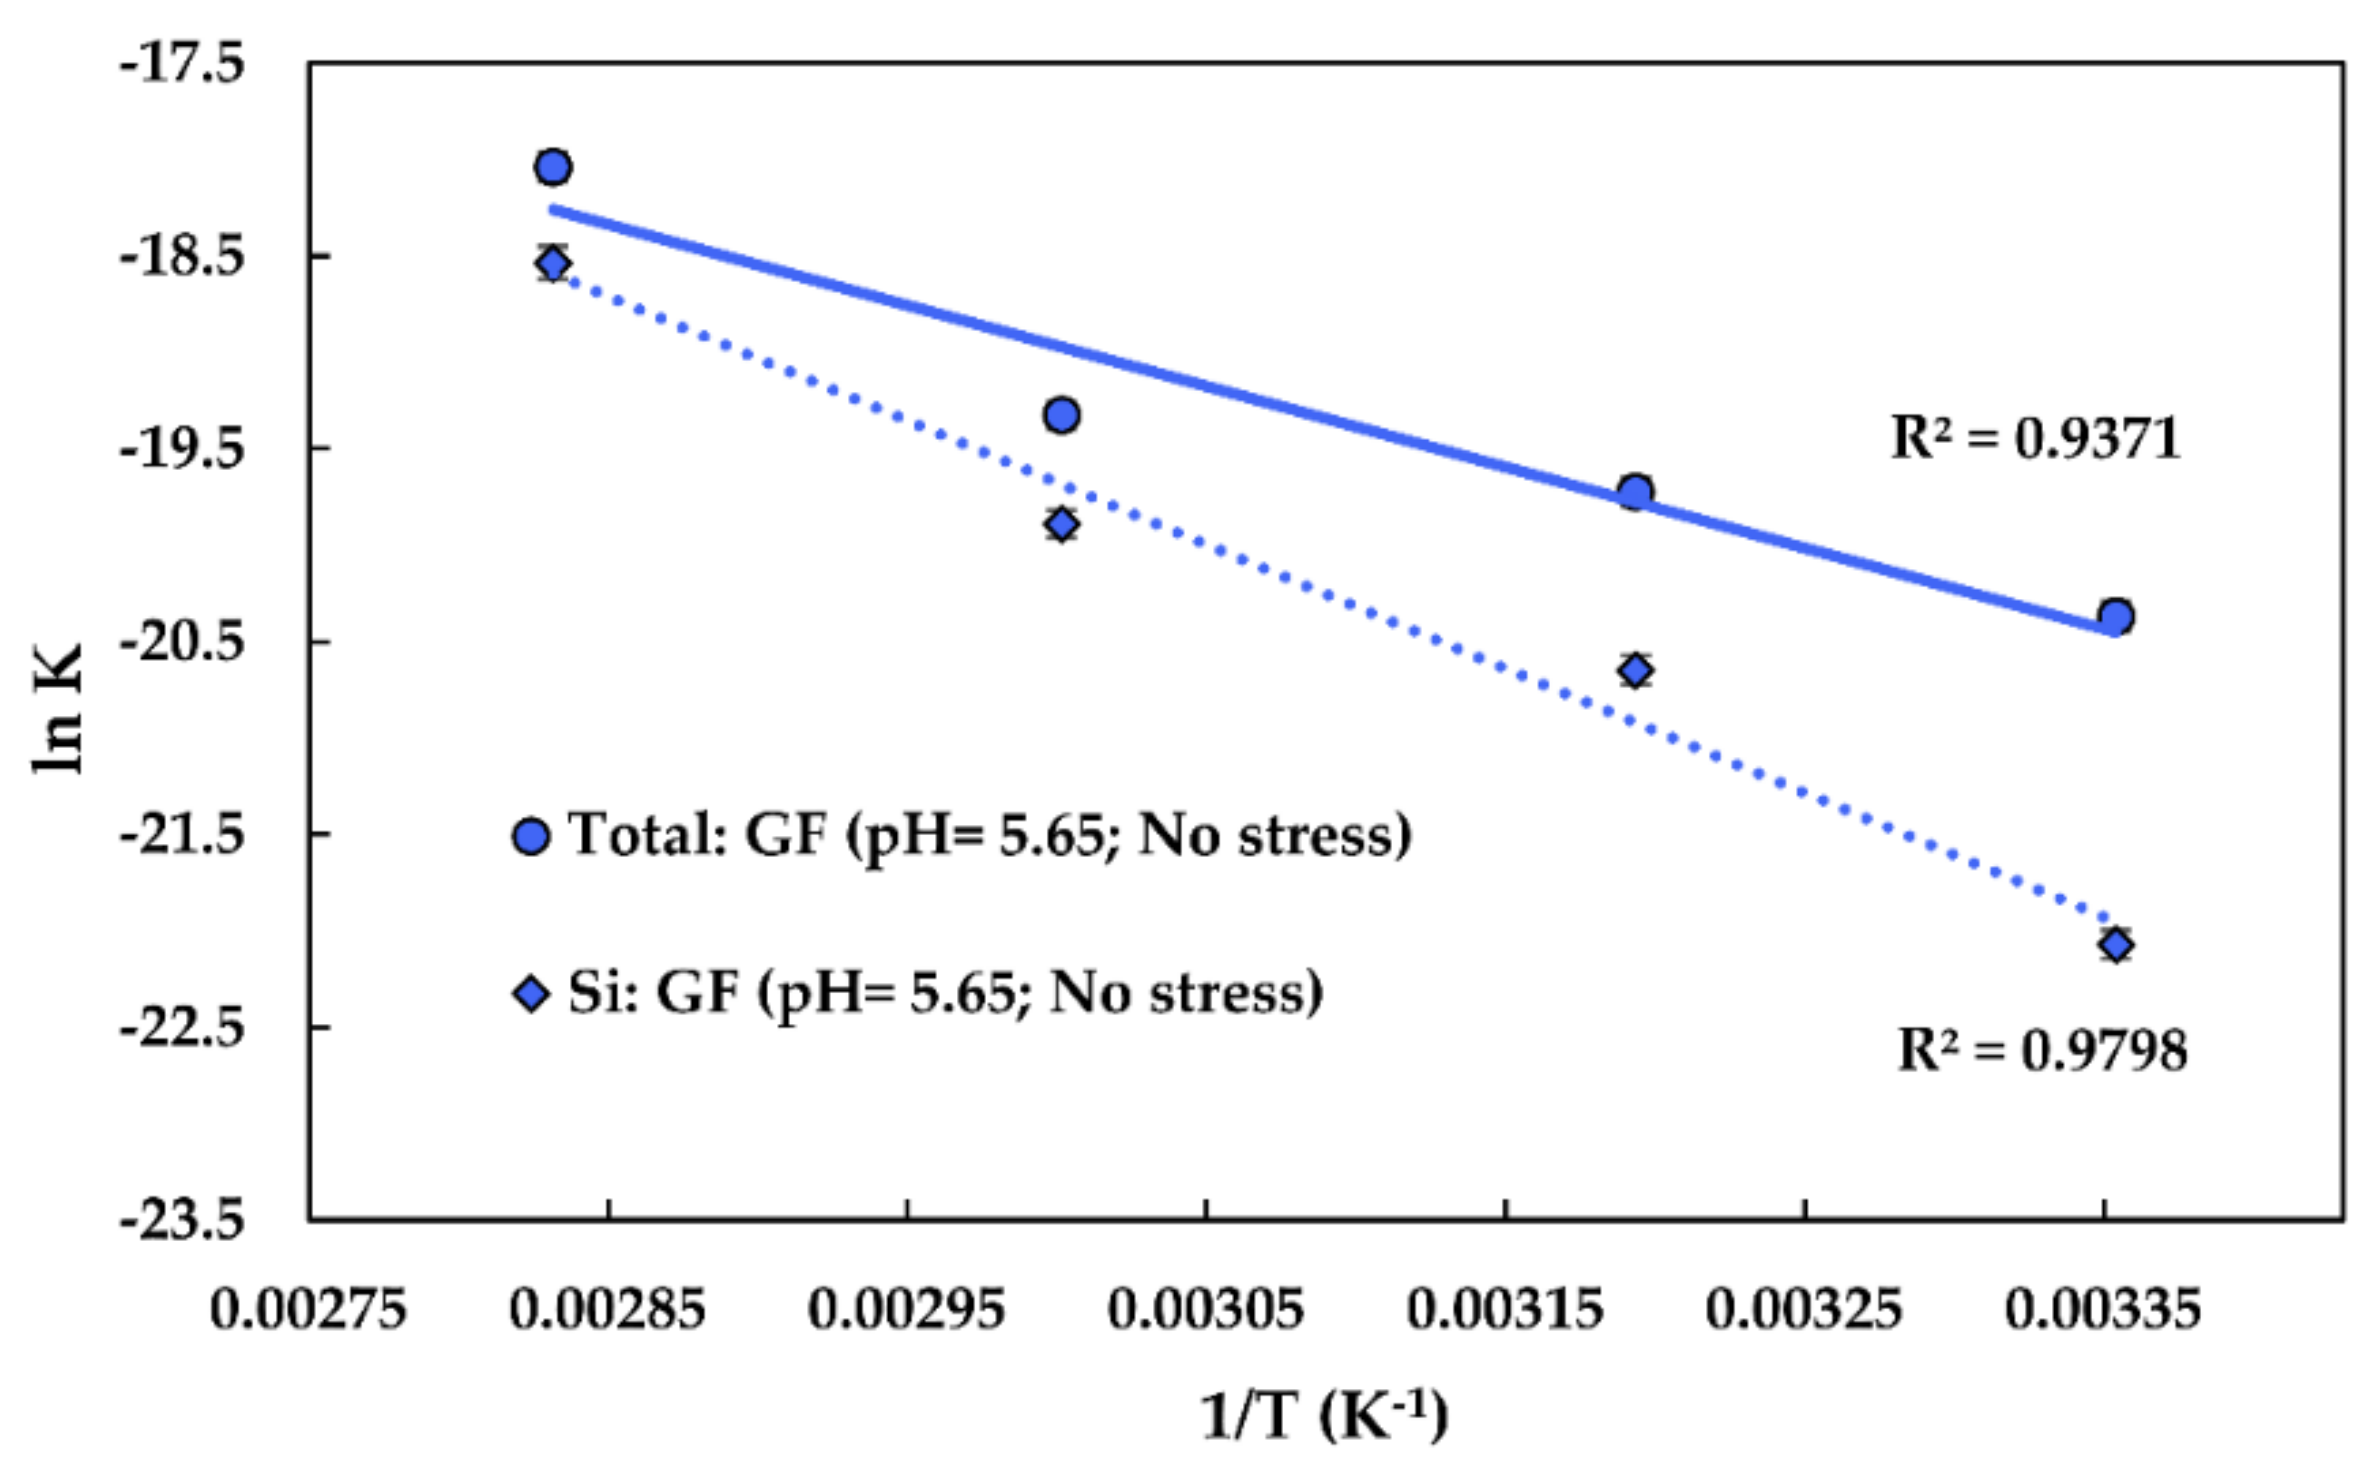
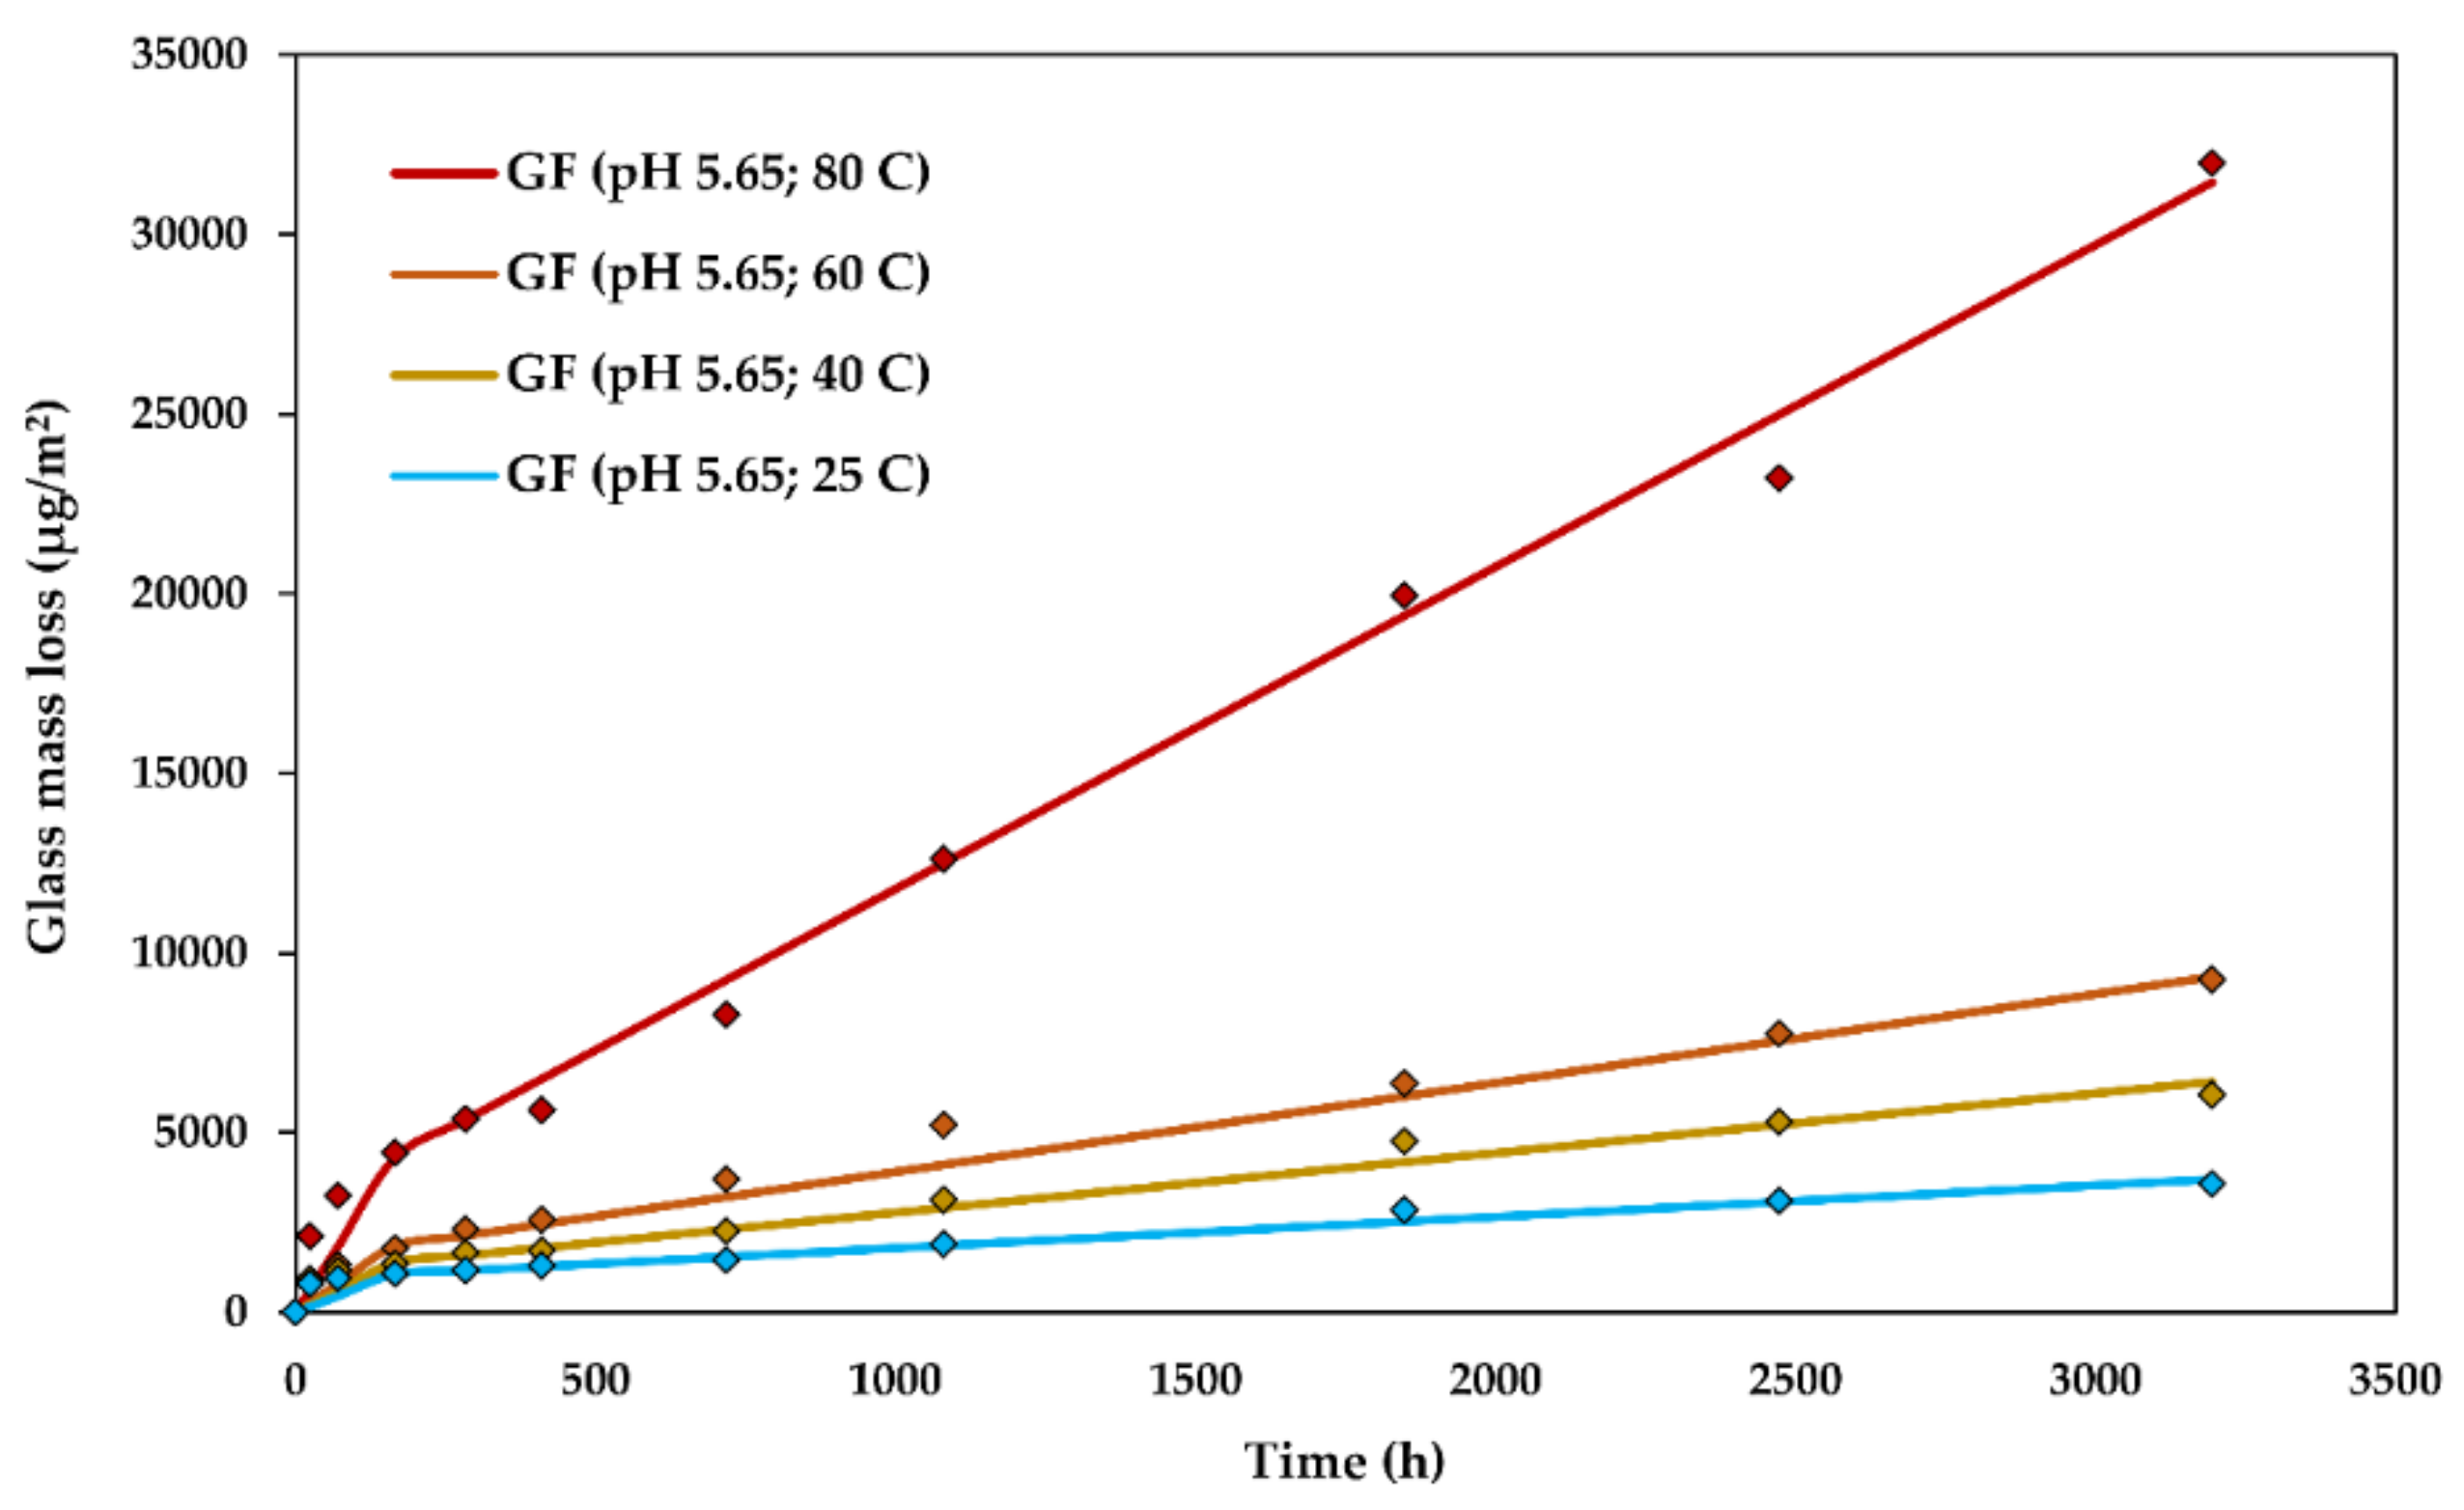
4.2. The Effect of Temperature on Glass Dissolution Kinetics
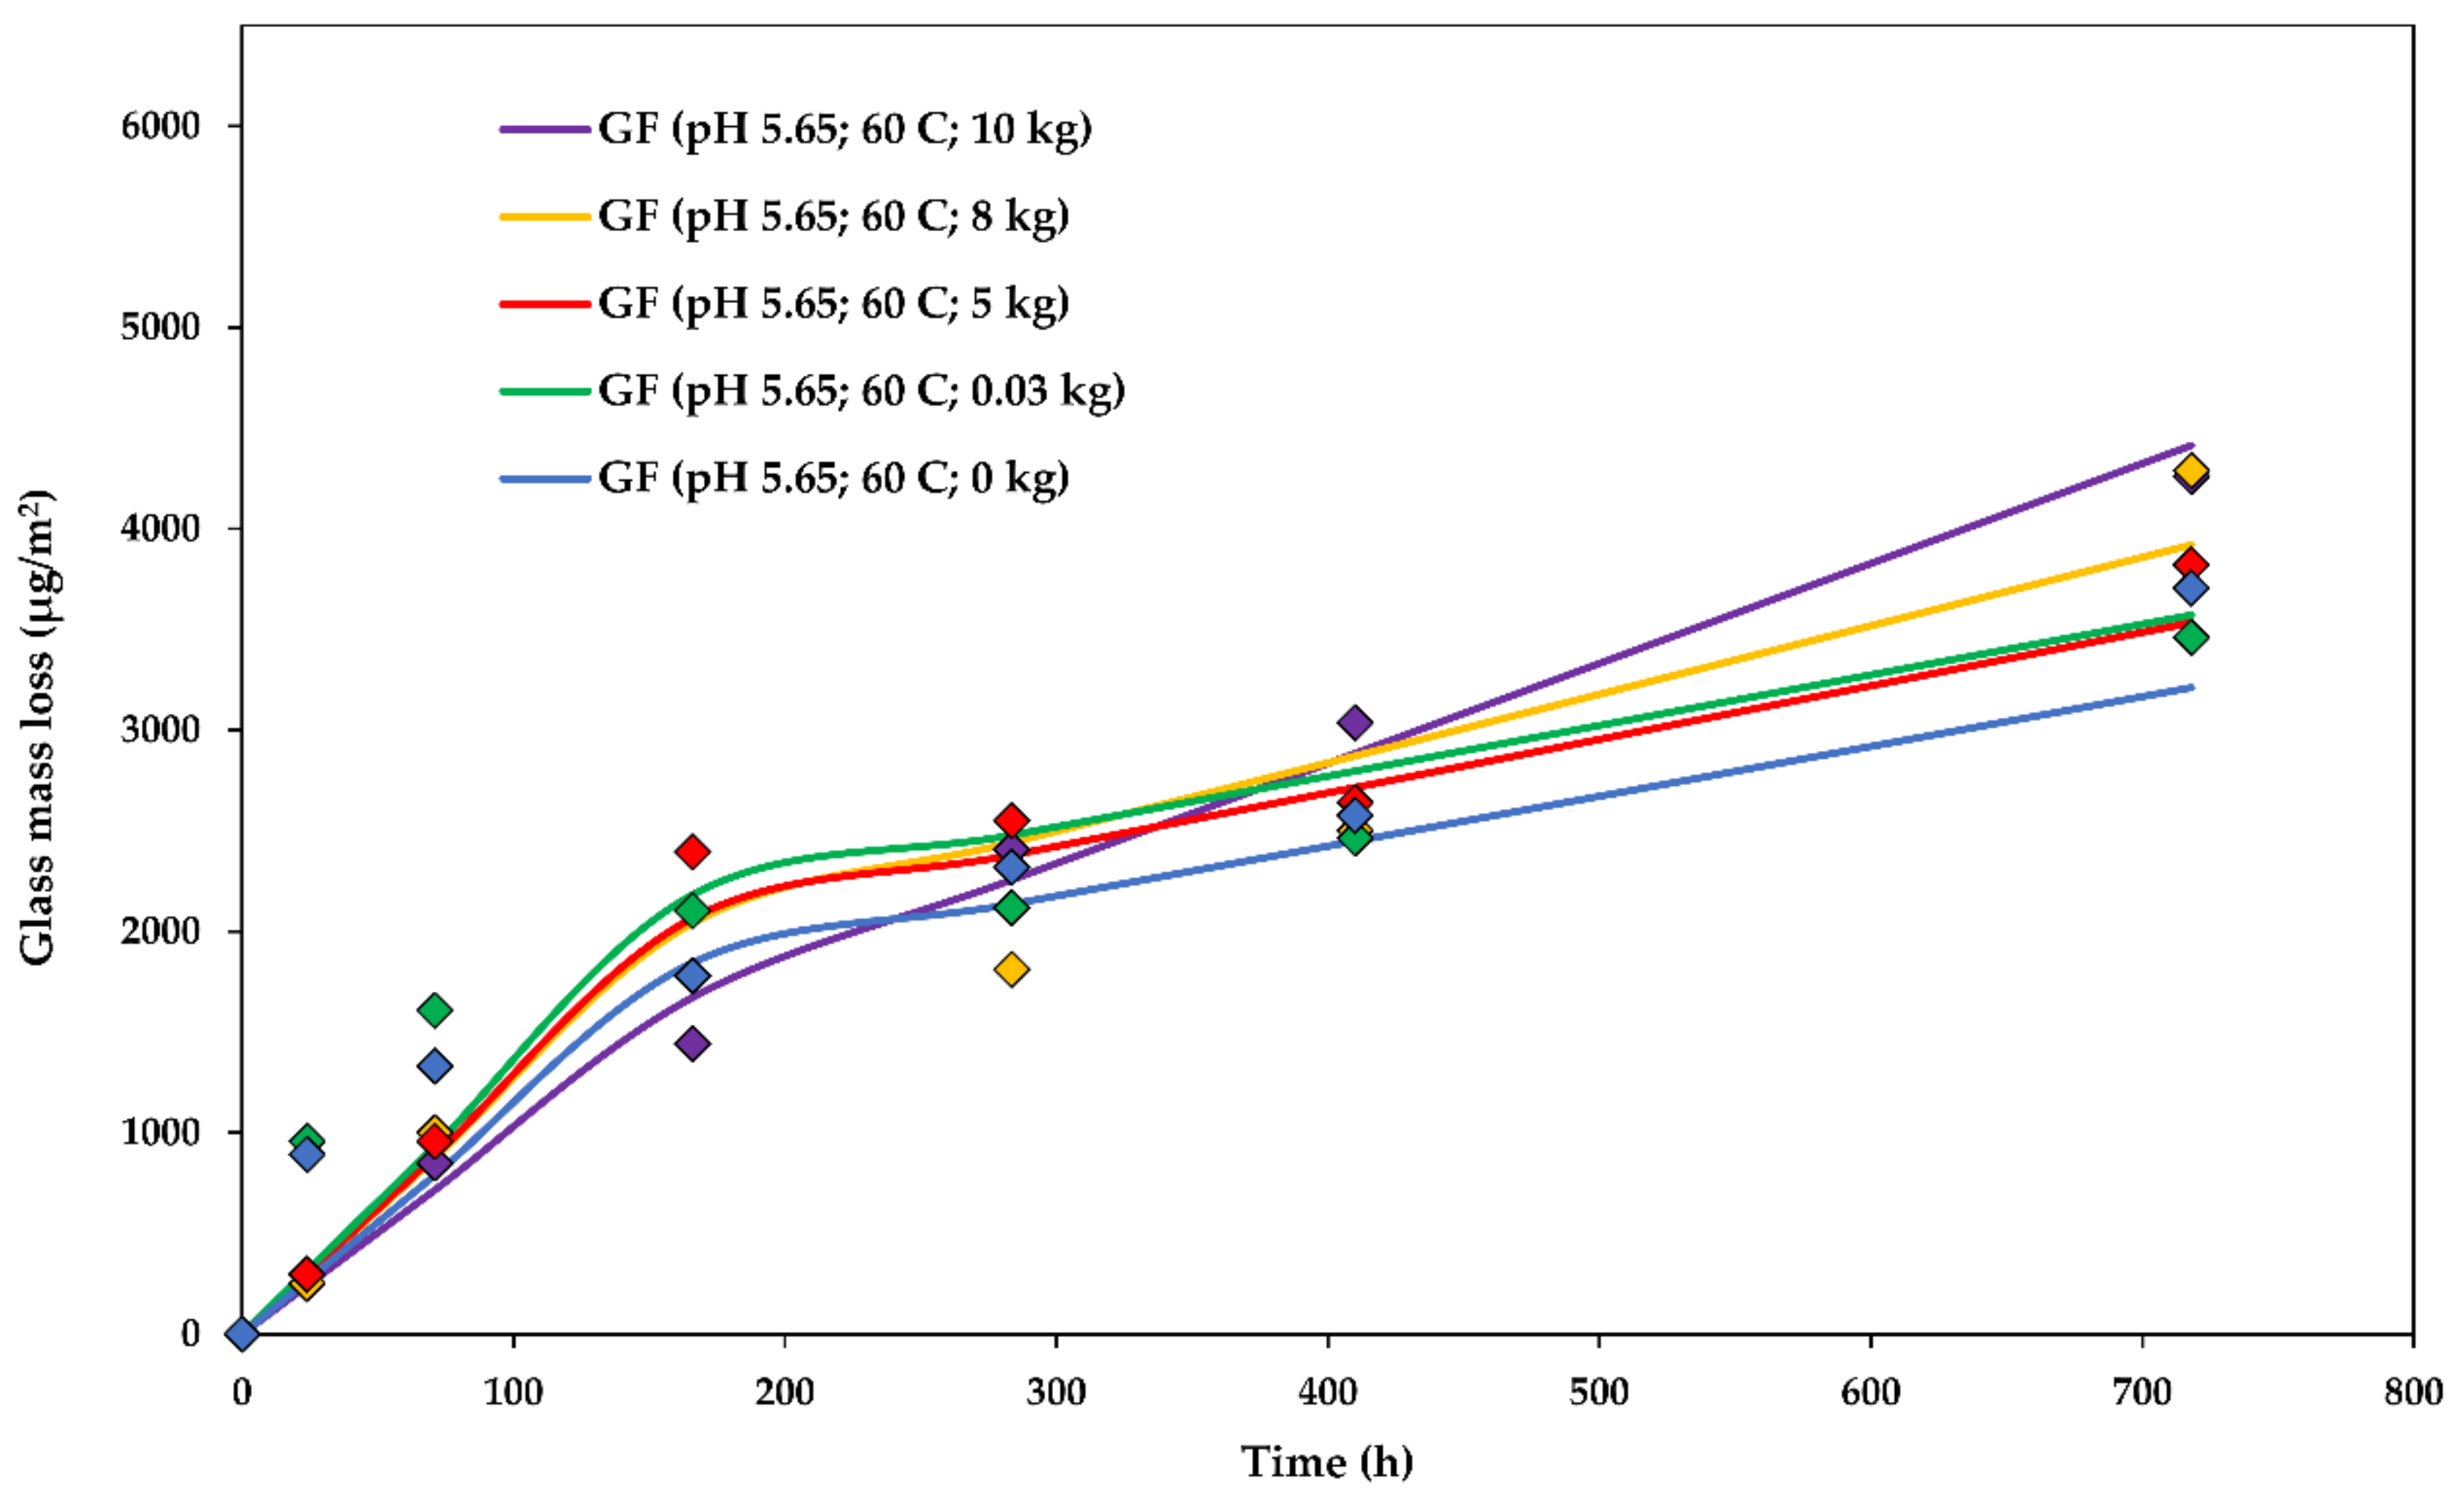
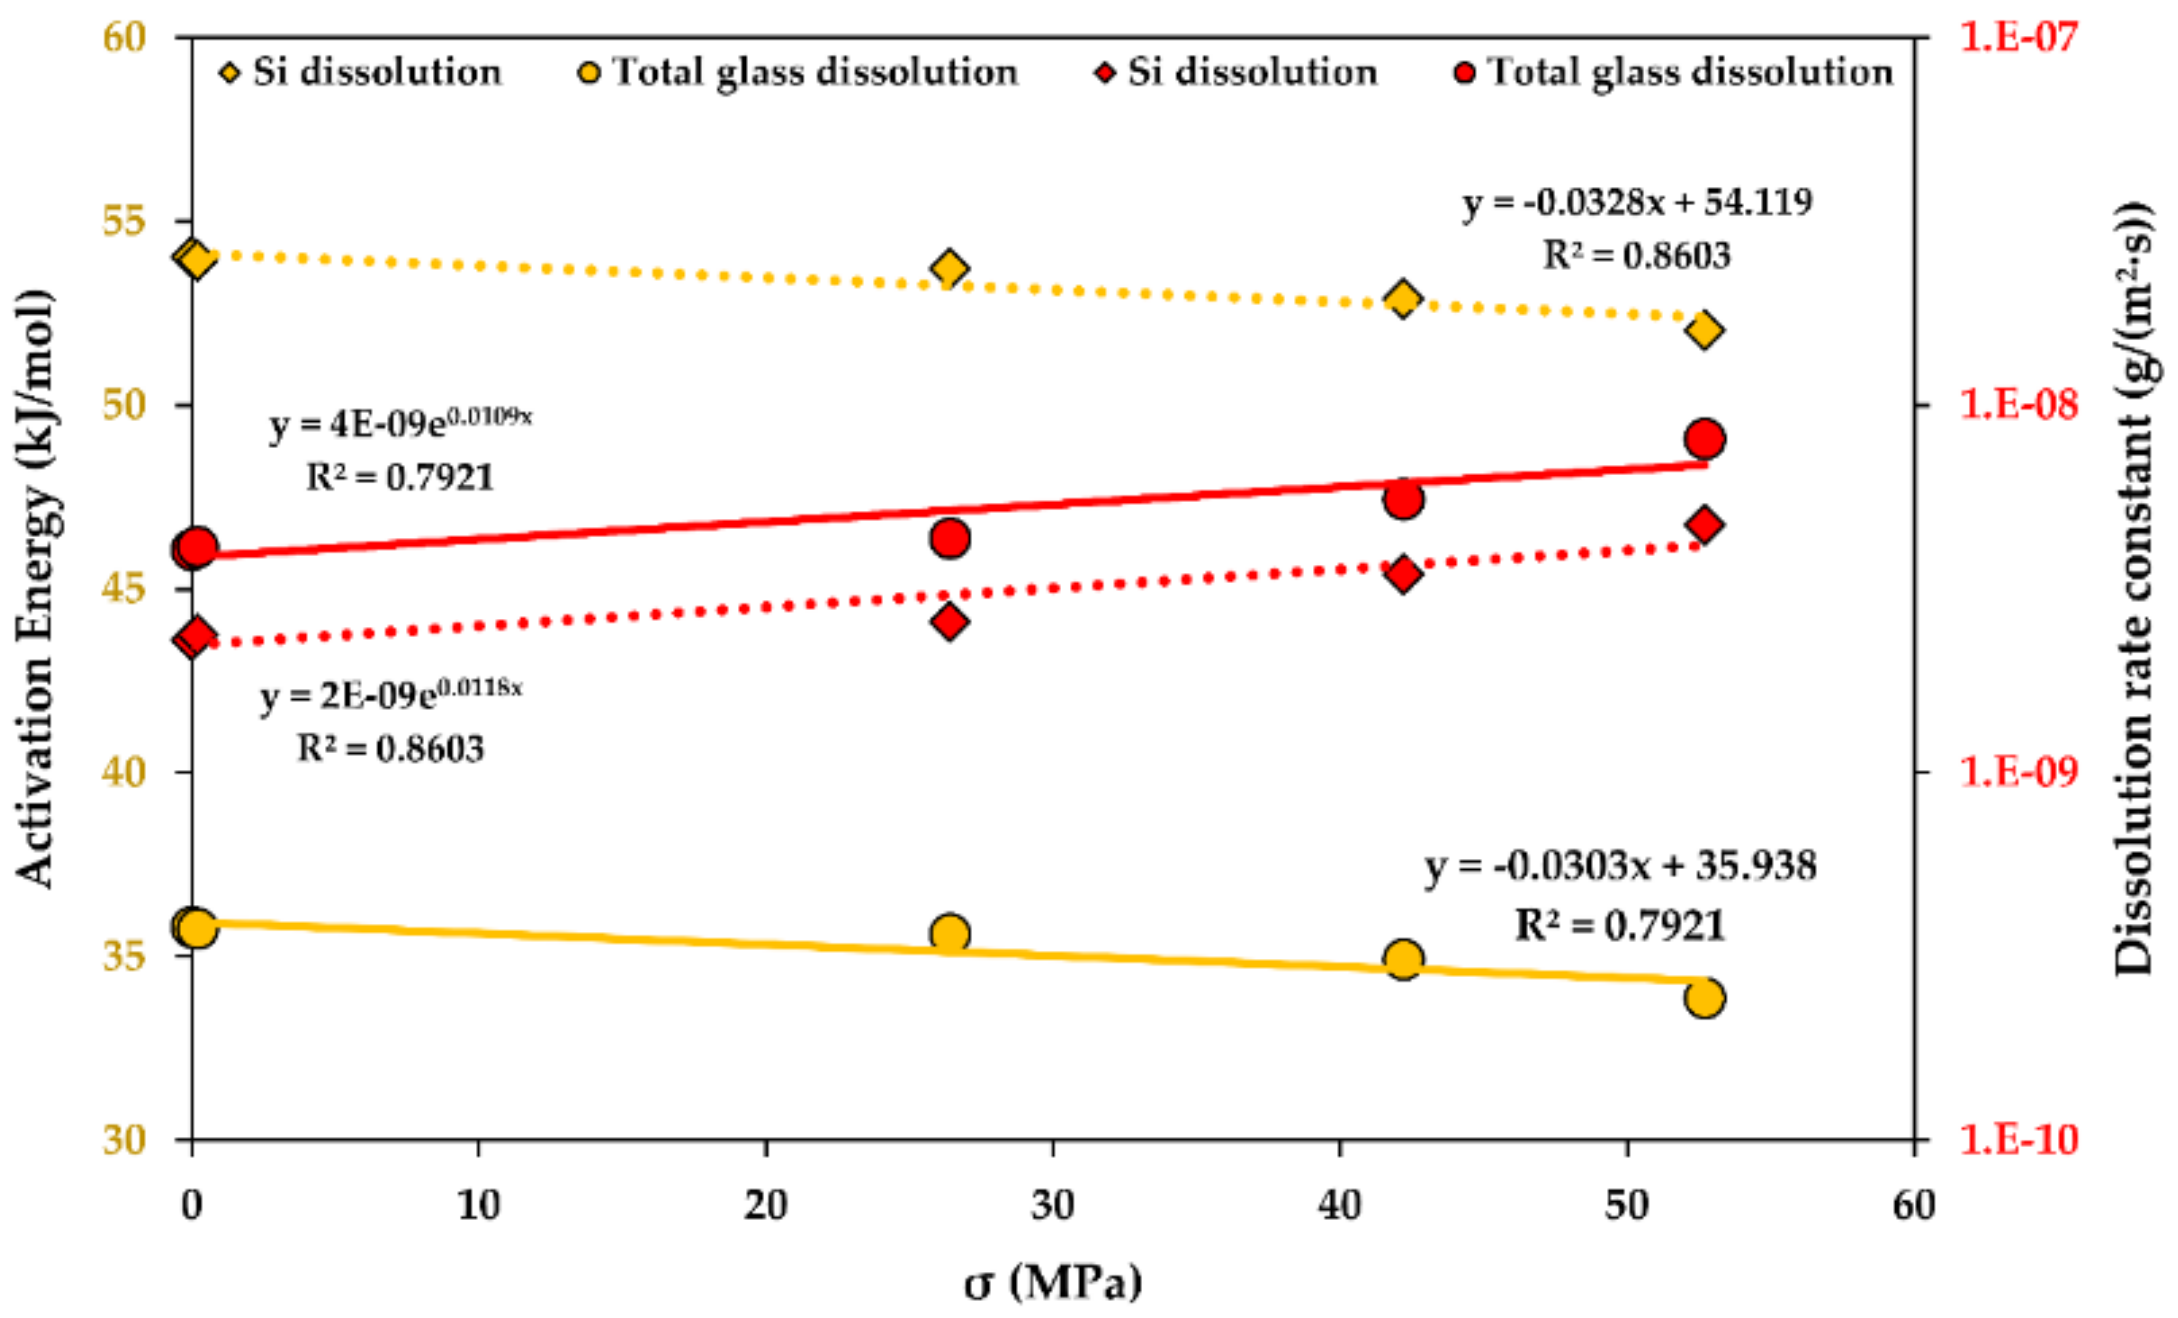
4.3. The Effect of Stress Corrosion on Glass Dissolution Kinetics
5. Discussion
6. Conclusions
Author Contributions
Funding
Acknowledgments
Conflicts of Interest
Abbreviations
| Fibre radius (m) | |
| Initial fibre radius (m) | |
| Dissolution rate constant (g/(m2∙s)) | |
| Dissolution rate constant for Si only (non-steady-state) (g/(m2∙s)) | |
| Dissolution rate constant for Si only (steady-state) (g/(m2∙s)) | |
| Dissolution rate constant for glass (non-steady state) (g/(m2∙s)) | |
| Dissolution rate constant for glass (steady-state) (g/(m2∙s)) | |
| Time when long-term steady state is reached (s) | |
| Number of fibres (-) | |
| Length of fibres (m) | |
| Glass fibre surface area (m2) | |
| Initial glass fibre surface area (m2) | |
| Acidity of the environment (-) | |
| Pre-exponential factor (g/(m2∙s)) | |
| Universal gas constant (8.314 J/(mol∙K)) | |
| Absolute temperature (K) | |
| Dissolution activation energy (J/mol) | |
| Density of the glass (g/m3) | |
| Time (s) | |
| Stress (MPa) | |
| ; | Total mass loss due to dissolution (g) |
| Si mass loss due to dissolution (g) | |
| Protective effect of sizing against glass dissolution (-) | |
| Non-cumulative ion mass concentration measured with HR-ICP-MS (g/L) | |
| Volume of a water sample used for the HR-ICP-MS (L) | |
| Glass Fibre | |
| Glass Fibre-Reinforced Polymer; same as Glass Fibre-Reinforced Composite | |
| Dissolving Cylinder Zero-Order Kinetic (model) | |
| “Electrical” glass | |
| “Electrical/Chemical Resistance” glass | |
| “Reinforcement” glass | |
| “Strength” glass | |
| FRP | Fibre-Reinforced Polymer, same as fibre-reinforced composite |
| HR-ICP-MS | High Resolution Inductively Coupled Plasma Mass Spectrometry |
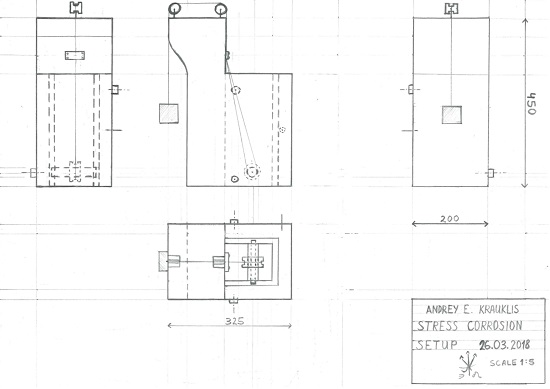
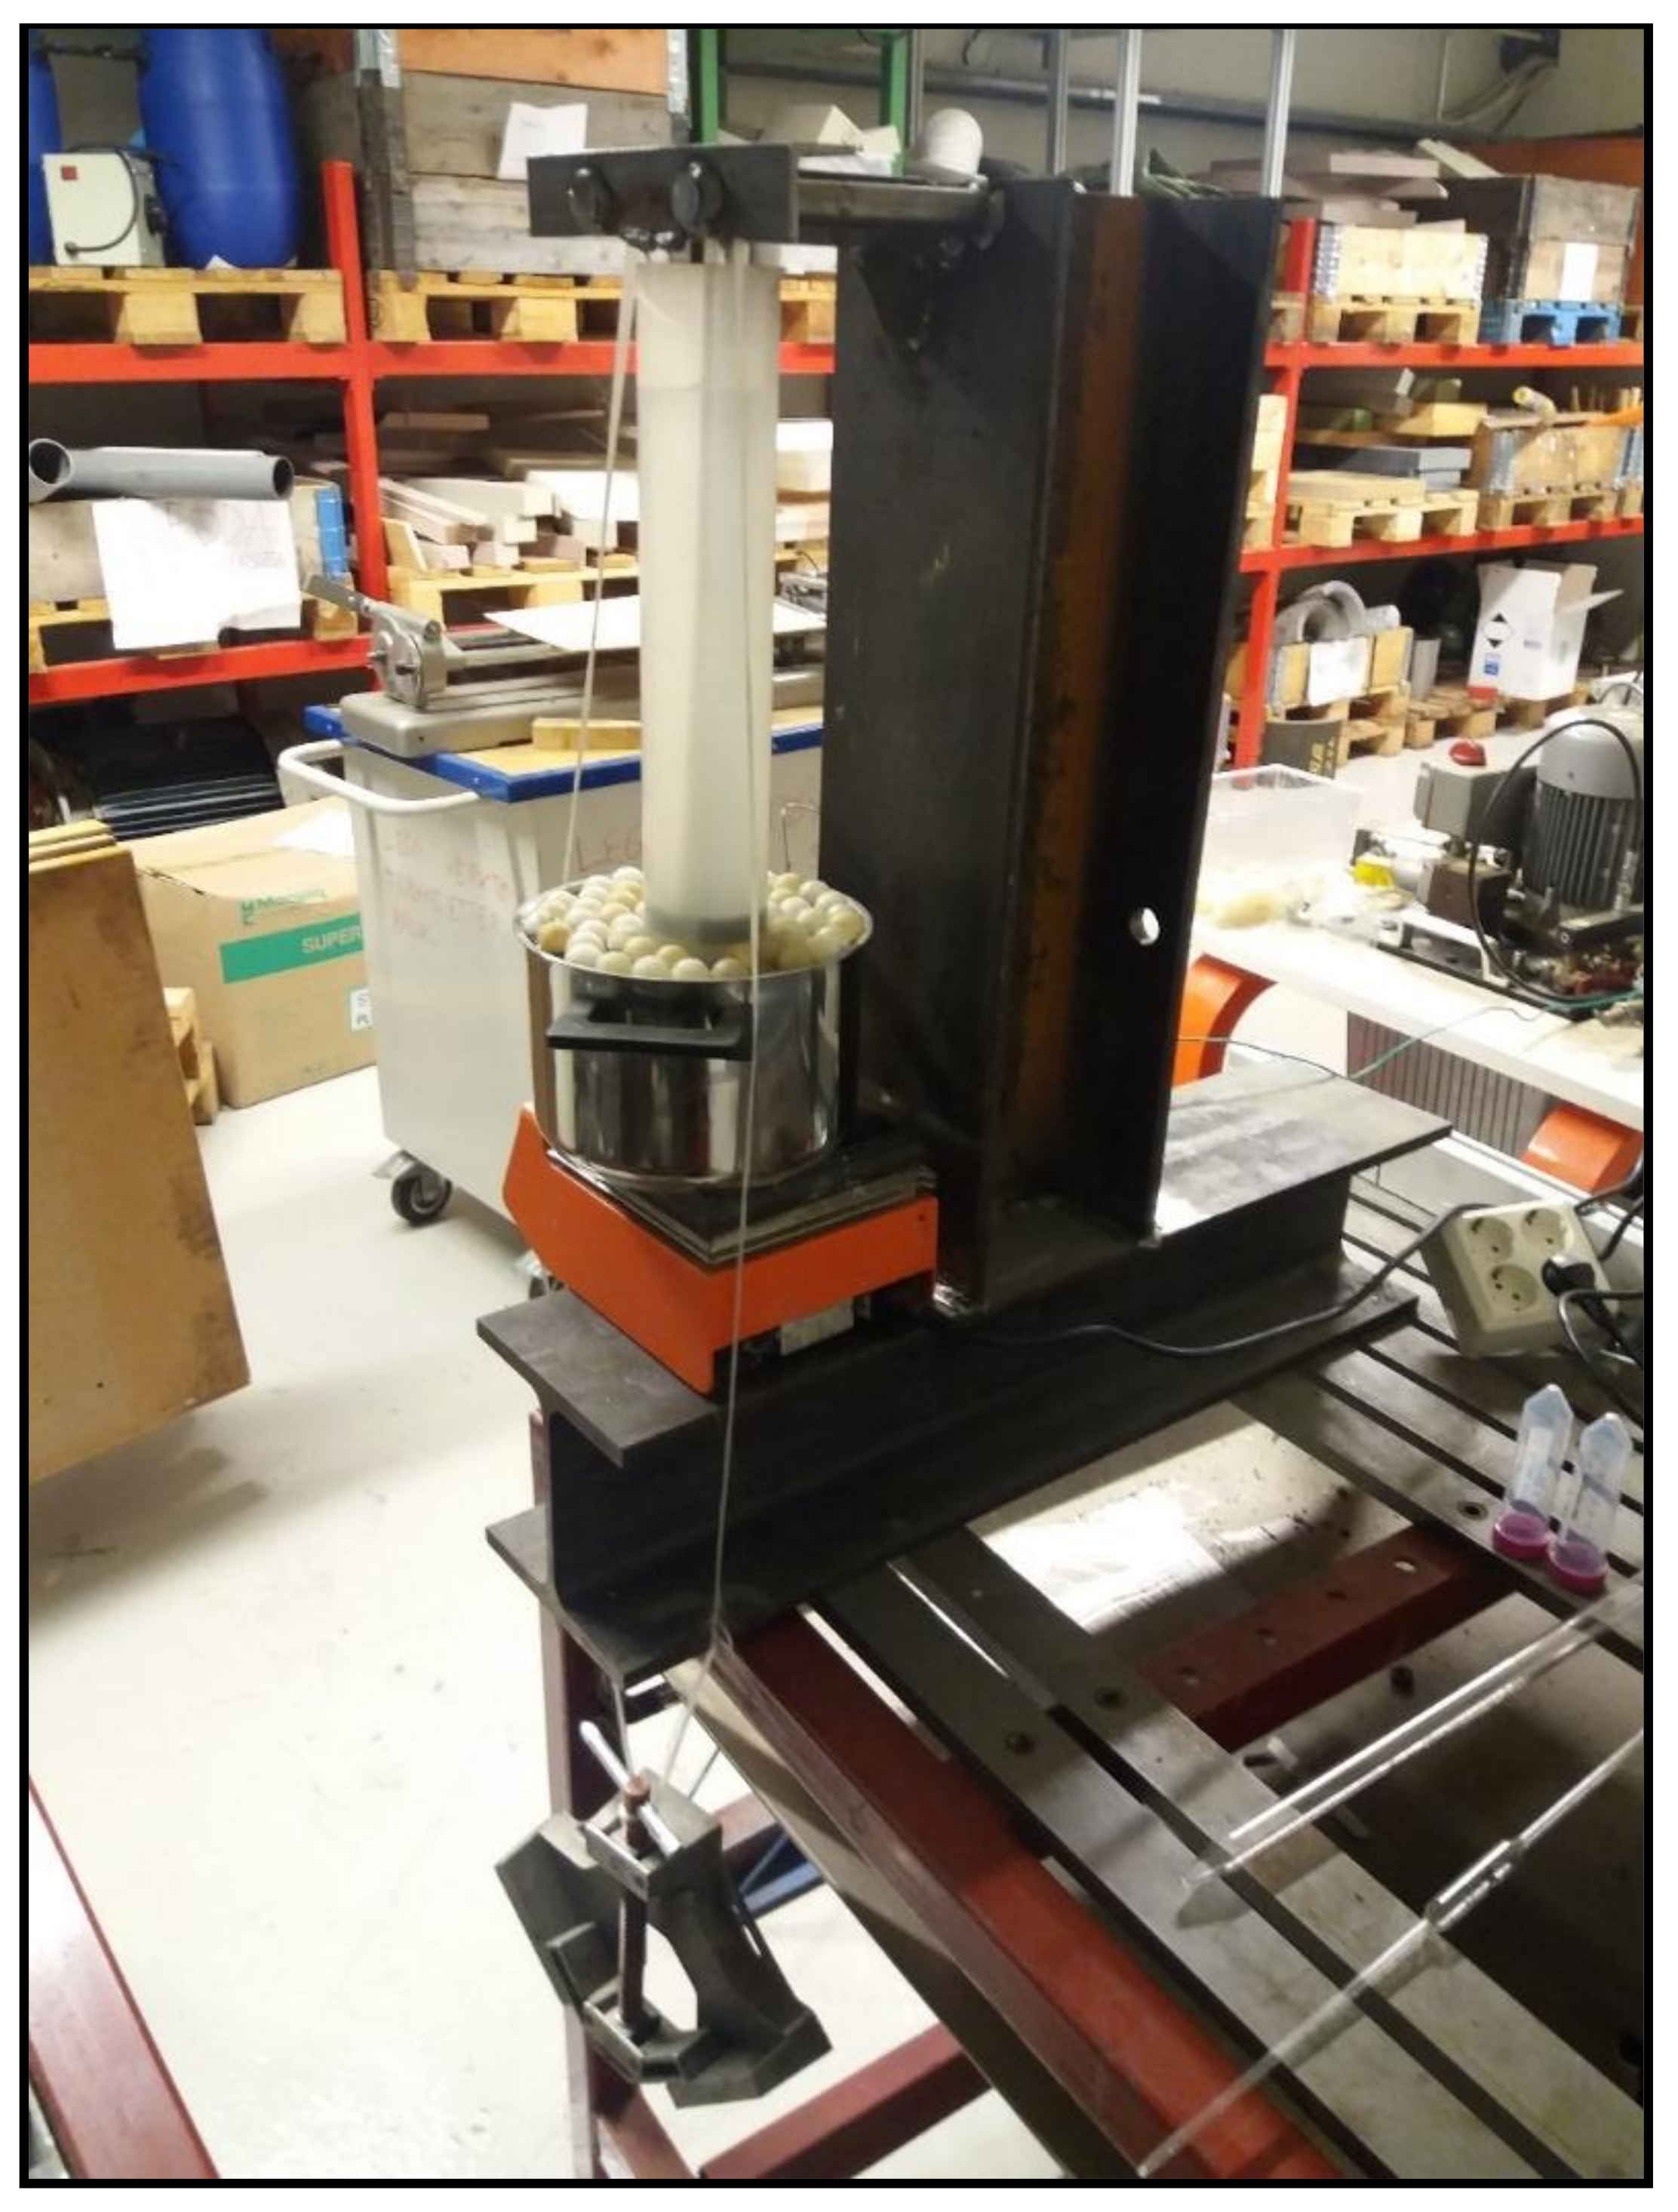
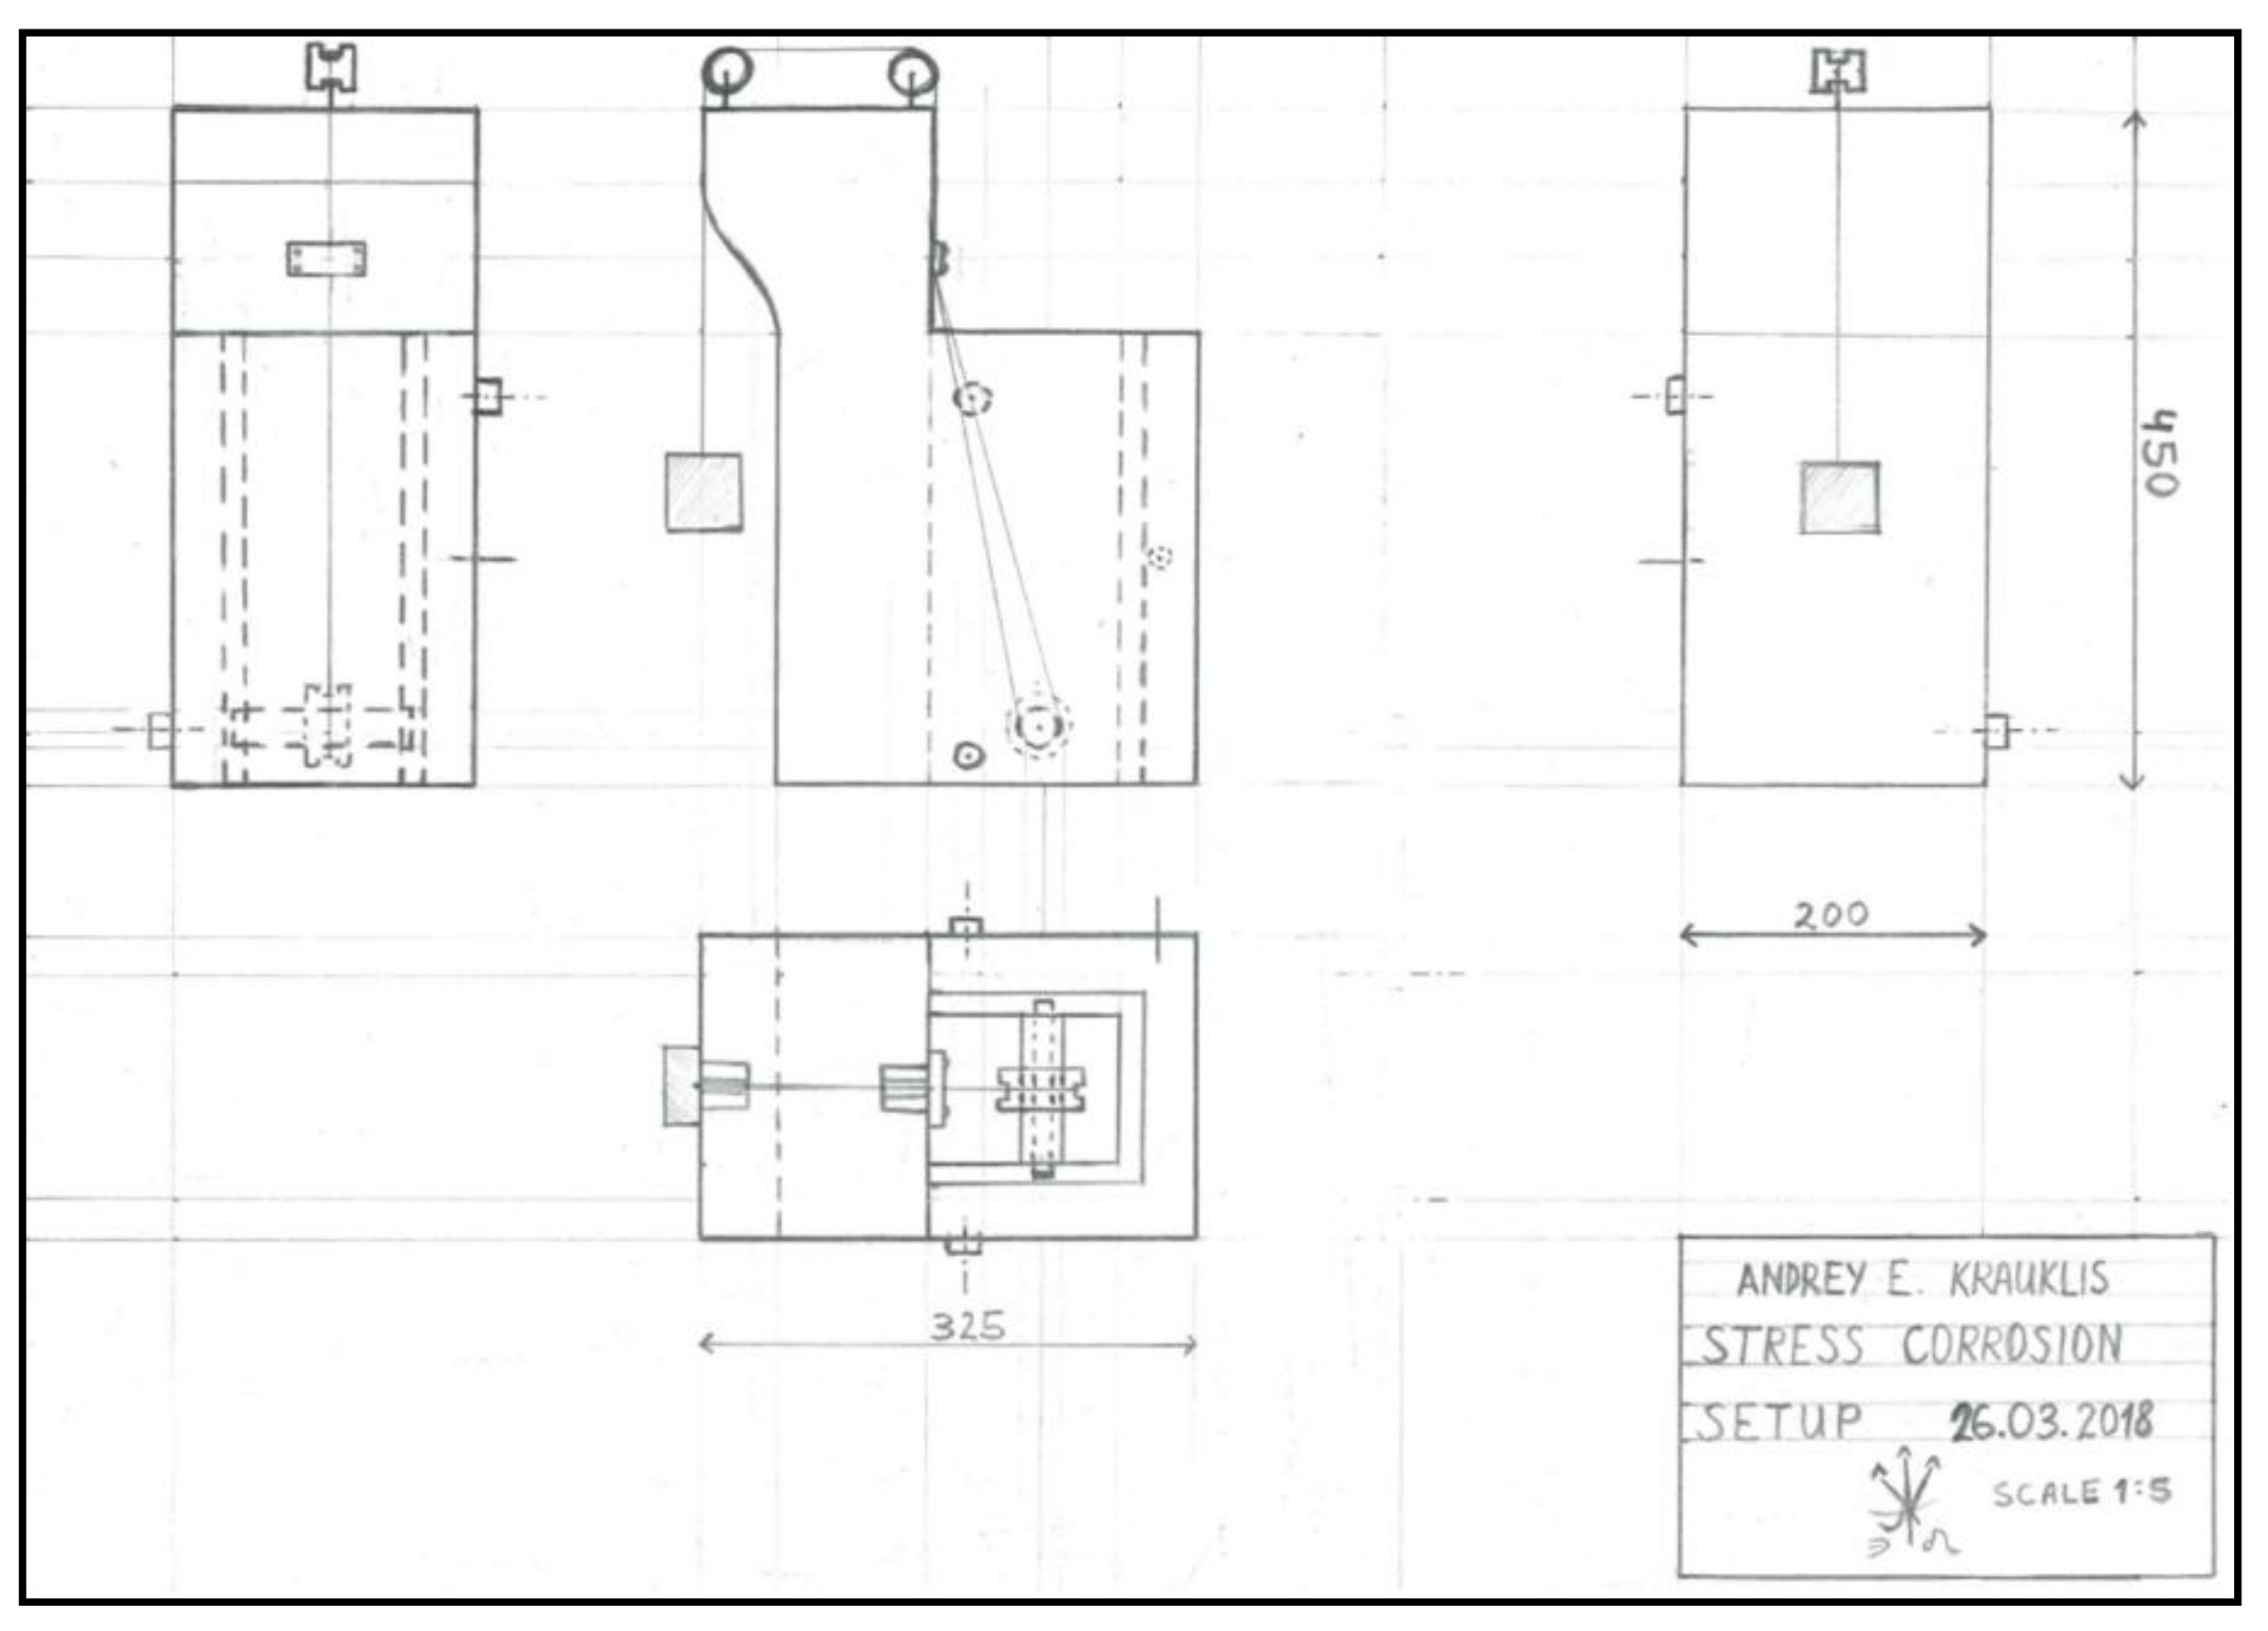
Appendix A. The Schematics of the Stress Corrosion Rig.

References
- Agarwal, B.D.; Broutman, L.J. Analysis and Performance of Fibre Composites, 2nd ed.; John Wiley and Sons, Inc.: Hoboken, NJ, USA, 1990; pp. 339–359. ISBN 978-0-471-51152-6. [Google Scholar]
- Wallenberger, F.T. Commercial and Experimental Glass Fibres. In Fibreglass and Glass Technology; Wallenberger, F.T., Bingham, P.A., Eds.; Springer: New York, NY, USA, 2010; ISBN 978-1-4419-0735-6. [Google Scholar]
- Steinmann, W.; Saelhoff, A.-K. Essential Properties of Fibres for Composite Applications. In Fibrous and Textile Materials for Composite Applications, Textile Science and Clothing Technology; Rana, S., Fangueiro, R., Eds.; Springer: Singapore, 2016; ISBN 978-981-10-0232-8. [Google Scholar]
- Krauklis, A.E.; Echtermeyer, A.T. Mechanism of Yellowing: Carbonyl Formation during Hygrothermal Aging in a Common Amine Epoxy. Polymers 2018, 10, 1017. [Google Scholar] [CrossRef]
- Xiao, G.Z.; Shanahan, M.E.R. Swelling of DGEBA/DDA epoxy resin during hygrothermal ageing. Polymer 1998, 39, 3253–3260. [Google Scholar] [CrossRef]
- Toscano, A.; Pitarresi, G.; Scafidi, M.; Di Filippo, M.; Spadaro, G.; Alessi, S. Water diffusion and swelling stresses in highly crosslinked epoxy matrices. Polym. Degrad. Stab. 2016, 133, 255–263. [Google Scholar] [CrossRef]
- Grabovac, I.; Whittaker, D. Application of bonded composites in the repair of ships structures—A 15-year service experience. Compos. Part A 2009, 40, 1381–1398. [Google Scholar] [CrossRef]
- McGeorge, D.; Echtermeyer, A.T.; Leong, K.H.; Melve, B.; Robinson, M.; Fischer, K.P. Repair of floating offshore units using bonded fibre composite materials. Compos. Part A 2009, 40, 1364–1380. [Google Scholar] [CrossRef]
- Gustafson, C.-G.; Echtermeyer, A. Long-term properties of carbon fibre composite tethers. Int. J. Fatigue 2006, 28, 1353–1362. [Google Scholar] [CrossRef]
- Salama, M.M.; Stjern, G.; Storhaug, T.; Spencer, B.; Echtermeyer, A. The First Offshore Field Installation for a Composite Riser Joint; OTC-14018-MS; Offshore Technology Conference: Houston, TX, USA, 2002. [Google Scholar]
- Echtermeyer, A.T.; Gagani, A.I.; Krauklis, A.E.; Mazan, T. Multiscale Modelling of Environmental Degradation—First Steps. In Durability of Composites in a Marine Environment 2. Solid Mechanics and Its Applications; Davies, P., Rajapakse, Y.D.S., Eds.; Springer: Cham, Switzerland, 2018; Volume 245, pp. 135–149. ISBN 978-3-319-65145-3. [Google Scholar]
- Krauklis, A.E.; Echtermeyer, A.T. Long-Term Dissolution of Glass Fibres in Water Described by Dissolving Cylinder Zero-Order Kinetic Model: Mass Loss and Radius Reduction. Open Chem. 2018, 16, 1189–1199. [Google Scholar] [CrossRef]
- Tournié, A.; Ricciardi, P.; Colomban, Ph. Glass Corrosion Mechanisms: A Multiscale Analysis. Solid State Ionics 2008, 179, 2142–2154. [Google Scholar] [CrossRef]
- Brown, E.N.; Davis, A.K.; Jonnalagadda, K.D.; Sottos, N.R. Effect of surface treatment on the hydrolytic stability of E-glass fibre bundle tensile strength. Compos. Sci. Technol. 2005, 65, 129–136. [Google Scholar] [CrossRef]
- Bledzki, A.; Spaude, R.; Ehrenstein, G.W. Corrosion Phenomena in Glass Fibres and Glass Fibre Reinforced Thermosetting Resins. Compos. Sci. Technol. 1985, 23, 263–285. [Google Scholar] [CrossRef]
- Krauklis, A.E.; Echtermeyer, A.T. Dissolving Cylinder Zero-Order Kinetic Model for Predicting Hygrothermal Aging of Glass Fibre Bundles and Fibre-Reinforced Composites. In 4th International Glass Fibre Symposium; Gries, Th., Pico, D., Lüking, A., Becker, Th., Eds.; Mainz, G (Verlag): Aachen, Germany, 2018; pp. 66–72. ISBN 978-3-95886-249-4. [Google Scholar]
- Grambow, B.; Müller, R. First-order dissolution rate law and the role of surface layers in glass performance assessment. J. Nucl. Mater. 2001, 298, 112–124. [Google Scholar] [CrossRef]
- Grambow, B. A General Rate Equation for Nuclear Waste Glass Corrosion. MRS Symp. Proc. Libr. Arch. 1985, 44, 15–27. [Google Scholar] [CrossRef]
- Krauklis, A.E.; Gagani, A.I.; Echtermeyer, A.T. Near-Infrared Spectroscopic Method for Monitoring Water Content in Epoxy Resins and Fibre-Reinforced Composites. Materials 2018, 11, 586. [Google Scholar] [CrossRef]
- Stamenović, M.R.; Putić, S.S.; Rakin, M.B.; Medjo, B.; Čikara, D. Effect of alkaline and acidic solutions on the tensile properties of glass–polyester pipes. Mater. Des. 2011, 32, 2456–2461. [Google Scholar] [CrossRef]
- Amaro, A.M.; Reis, P.N.B.; Neto, M.A.; Louro, C. Effects of alkaline and acid solutions on glass/epoxy composites. Polym. Degrad. Stab. 2013, 98, 853–862. [Google Scholar] [CrossRef]
- Mišíková, L.; Liška, M.; Galusková, D. Corrosion of e-glass fibres in distilled water. Ceram. Silik. 2007, 51, 131–135. [Google Scholar]
- Bashir, S.T.; Yang, L.; Liggat, J.J.; Thomason, J.L. Kinetics of dissolution of glass fibre in hot alkaline solution. J. Mater. Sci. 2018, 53, 1710–1722. [Google Scholar] [CrossRef]
- Hunter, F.M.I.; Hoch, A.R.; Heath, T.G.; Baston, G.M.N. Report RWM005105, AMEC/103498/02 Issue 2: Review of Glass Dissolution Models and Application to UK Glasses; AMEC: Didcot, Oxfordshire, UK, 2015. [Google Scholar]
- Li, H.; Gu, P.; Watson, J.; Meng, J. Acid corrosion resistance and mechanism of E-glass fibres: Boron factor. J. Mater. Sci. 2013, 48, 3075–3087. [Google Scholar] [CrossRef]
- Icenhower, J.; Steefel, C.I. Dissolution Rate of Borosilicate Glass SON68: A Method of Quantification Based upon Interferometry and Implications for Experimental and Natural Weathering Rates of Glass. Geochim. Cosmochim. Acta 2015, 157, 147–163. [Google Scholar] [CrossRef]
- Gy, R. Stress corrosion of silicate glass: A review. J. Non-Cryst. Solids 2003, 316, 1–11. [Google Scholar] [CrossRef]
- Ciccotti, M. Stress-corrosion mechanisms in silicate glasses. J. Phys. D Appl. Phys. 2009, 42, 214006–214039. [Google Scholar] [CrossRef]
- Michalske, T.A.; Freiman, S.W. A Molecular Mechanism for Stress Corrosion in Vitreous Silica. J. Am. Ceram. Soc. 1983, 66, 284–288. [Google Scholar] [CrossRef]
- Michalske, T.A.; Bunker, B.C. Steric Effects in Stress Corrosion Fracture of Glass. J. Am. Ceram. Soc. 1987, 70, 780–784. [Google Scholar] [CrossRef]
- Michalske, T.A.; Bunker, B.C. A Chemical Kinetics Model for Glass Fracture. J. Am. Ceram. Soc. 1993, 76, 2613–2618. [Google Scholar] [CrossRef]
- Michalske, T.A.; Bunker, B.C. Slow fracture model based on strained silicate structures. J. Appl. Phys. 1984, 56, 2686–2693. [Google Scholar] [CrossRef]
- Schmitz, G.K.; Metcalfe, A.G. Stress Corrosion of E-Glass Fibres. Ind. Eng. Chem. Prod. Res. Dev. 1966, 5, 1–8. [Google Scholar] [CrossRef]
- Delage, F.; Ghaleb, D.; Dussossoy, J.L.; Chevallier, O.; Vernaz, E. A mechanistic model for understanding nuclear waste glass dissolution. J. Nucl. Mater. 1992, 190, 191–197. [Google Scholar] [CrossRef]
- Ma, T.; Jivkov, A.P.; Li, W.; Liang, W.; Wang, Y.; Xu, H.; Han, X. A mechanistic model for long-term nuclear waste glass dissolution integrating chemical affinity and interfacial diffusion barrier. J. Nucl. Mater. 2017, 486, 70–85. [Google Scholar] [CrossRef]
- Khawam, A.; Flanagan, D.R. Solid-State Kinetic Models: Basics and Mathematical Fundamentals. J. Phys. Chem. B 2006, 110, 17315–17328. [Google Scholar] [CrossRef]
- International Standard ISO 2078:1993 (revised in 2014), Textile Glass—Yarns—Designation. 2014. Available online: https://www.iso.org/standard/6865.html (accessed on 11 February 2019).
- 3B Fibreglass technical data sheet. HiPer-tex W2020 rovings, Belgium. 2012. Available online: https://www.3b-fibreglass.com/ (accessed on 24 July 2018).
- Thomason, J.L. Glass Fiber Sizings: A Review of the Scientific Literature; J.L. Thomason: Middletown, DE, USA, 2012; p. 127. ISBN 978-0-9573814-1-4. [Google Scholar]
- Shiue, Y.S.; Matthewson, M.J. Stress dependent activation entropy for dynamic fatigue of pristine silica optical fibres. J. Appl. Phys. 2001, 89, 4787–4793. [Google Scholar] [CrossRef]
- Eastes, W.; Potter, R.M.; Hadley, J.G. Estimating in-vitro glass fibre dissolution rate from composition. Inhal. Toxicol. 2000, 12, 269–280. [Google Scholar] [CrossRef] [PubMed]
- Papadimitriou, S.; Kennedy, H.; Kennedy, P.; Thomas, D.N. Kinetics of ikaite precipitation and dissolution in seawater-derived brines at sub-zero temperatures to 265 K. Geochim. Cosmochim. Acta 2014, 140, 199–211. [Google Scholar] [CrossRef]
- Ozola, R.; Krauklis, A.E.; Leitietis, M.; Burlakovs, J.; Vircava, I.; Ansone-Bertina, L.; Bhatnagar, A.; Klavins, M. FeOOH-modified clay sorbents for arsenic removal from aqueous solutions. Environ. Technol. Innov. 2016. [Google Scholar] [CrossRef]
- Krauklis, A.E.; Ozola, R.; Burlakovs, J.; Rugele, K.; Kirillov, K.; Trubaca-Boginska, A.; Rubenis, K.; Stepanova, V.; Klavins, M. FeOOH and Mn8O10Cl3 Modified Zeolites for As(V) Removal in Aqueous Medium. J. Chem. Technol. Biotechnol. 2017, 92, 1948–1960. [Google Scholar] [CrossRef]
- Anxolabéhère-Mallart, E.; Costentin, C.; Policar, C.; Robert, M.; Savéant, J.M.; Teillout, A.L. Proton-coupled electron transfers in biomimetic water bound metal complexes. The electrochemical approach. Faraday Discuss. 2011, 148, 83–95. [Google Scholar] [CrossRef]
- Secula, M.S.; Creţescu, I.; Petrescu, S. An experimental study of indigo carmine removal from aqueous solution by electrocoagulation. Desalination 2011, 277, 227–235. [Google Scholar] [CrossRef]
- Criscenti, L.J.; Kubicki, J.D.; Brantley, S.L. Silicate Glass and Mineral Dissolution: Calculated Reaction Paths and Activation Energies for Hydrolysis of a Q3 Si by H3O+ Using Ab Initio Methods. J. Phys. Chem. A 2006, 110, 198–206. [Google Scholar] [CrossRef]
- Fournier, R.O.; Rowe, J.J. The solubility of amorphous silica in water at high temperatures and high pressures. Am. Miner. 1977, 62, 1052–1056. [Google Scholar]
- Crundwell, F.K. On the Mechanism of the Dissolution of Quartz and Silica in Aqueous Solutions. ACS Omega 2017, 2, 1116–1127. [Google Scholar] [CrossRef]
- Von Damm, K.L.; Edmond, J.M.; Grant, B.; Measures, C.I.; Walden, B.; Weiss, R.F. Chemistry of submarine hydrothermal solutions at 21°N, East Pacific Rise. Geochim. Cosmochim. Acta 1985, 49, 2197–2220. [Google Scholar] [CrossRef]
- Holland, H.D. The Chemistry of the Atmosphere and Oceans; Wiley: New York, NY, USA, 1978; p. 351. ISBN 978-0471035091. [Google Scholar]
- Scheffler, C.; Förster, T.; Mäder, E.; Heinrich, G.; Hempel, S.; Mechtcherine, V. Aging of alkali-resistant glass and basalt fibers in alkaline solutions: Evaluation of the failure stress by Weibull distribution function. J. Non-Cryst. Solids 2009, 355, 2588–2595. [Google Scholar] [CrossRef]


| pH | Reference | ||||
|---|---|---|---|---|---|
| 1.679 ± 0.010 | (3.10 ± 0.44)∙10−7 | (1.25 ± 0.09)∙10−7 | (1.70 ± 0.19)∙10−6 | (1.16 ± 0.08)∙10−6 | This work |
| 4.005 ± 0.010 | (2.59 ± 0.33)∙10−8 | (1.70 ± 0.11)∙10−8 | (8.48 ± 1.21)∙10−8 | (6.24 ± 0.36)∙10−8 | This work |
| 5.650 ± 0.010 | (6.67 ± 1.03)∙10−9 | (2.30 ± 0.16)∙10−9 | (1.82 ± 0.29)∙10−8 | (4.05 ± 0.29)∙10−9 | This work, [12,16] |
| 7.000 ± 0.010 | (3.64 ± 0.53)∙10−8 | (2.55 ± 0.19)∙10−8 | (5.46 ± 0.82)∙10−8 | (4.85 ± 0.38)∙10−8 | This work |
| 10.012 ± 0.010 | (8.97 ± 1.27)∙10−8 | (4.56 ± 0.32)∙10−8 | (1.39 ± 0.16)∙10−7 | (1.11 ± 0.07)∙10−7 | This work |
| Temperature (°C) | Reference | ||||
|---|---|---|---|---|---|
| 25 ± 1 | (1.46 ± 0.23)∙10−9 | (2.60 ± 0.18)∙10−10 | (1.04 ± 0.12)∙10−8 | (1.42 ± 0.11)∙10−9 | This work |
| 40 ± 1 | (2.62 ± 0.37)∙10−9 | (1.08 ± 0.08)∙10−9 | (1.37 ± 0.19)∙10−8 | (2.72 ± 0.19)∙10−9 | This work |
| 60 ± 1 | (6.67 ± 1.03)∙10−9 | (2.30 ± 0.16)∙10−9 | (1.82 ± 0.29)∙10−8 | (4.05 ± 0.29)∙10−9 | This work, [12,16] |
| 80 ± 1 | (2.19 ± 0.31)∙10−8 | (8.91 ± 0.73)∙10−9 | (4.24 ± 0.59)∙10−8 | (1.47 ± 0.11)∙10−8 | This work |
| Weight (kg) | Reference | |||||
|---|---|---|---|---|---|---|
| 0 | 0.0 | (6.67 ± 1.03)∙10-9 | (2.30 ± 0.16)∙10−9 | (1.82 ± 0.29)∙10−8 | (4.05 ± 0.29)∙10−9 | This work, [12] |
| 0.03 | 0.2 | (7.27 ± 1.15)∙10−9 | (2.38 ± 0.21)∙10−9 | (2.08 ± 0.42)∙10−8 | (4.12 ± 0.33)∙10−9 | This work |
| 5 | 26.4 | (7.45 ± 1.03)∙10−9 | (2.58 ± 0.19)∙10−9 | (2.04 ± 0.33)∙10−8 | (4.35 ± 0.35)∙10−9 | This work |
| 8 | 42.2 | (8.30 ± 1.33)∙10−9 | (3.47 ± 0.25)∙10−9 | (2.01 ± 0.41)∙10−8 | (5.56 ± 0.44)∙10−9 | This work |
| 10 | 52.7 | (9.21 ± 1.33)∙10−9 | (4.73 ± 0.33)∙10−9 | (1.65 ± 0.44)∙10−8 | (8.12 ± 0.67)∙10−9 | This work |
© 2019 by the authors. Licensee MDPI, Basel, Switzerland. This article is an open access article distributed under the terms and conditions of the Creative Commons Attribution (CC BY) license (http://creativecommons.org/licenses/by/4.0/).
Share and Cite
Krauklis, A.E.; Gagani, A.I.; Vegere, K.; Kalnina, I.; Klavins, M.; Echtermeyer, A.T. Dissolution Kinetics of R-Glass Fibres: Influence of Water Acidity, Temperature, and Stress Corrosion. Fibers 2019, 7, 22. https://0-doi-org.brum.beds.ac.uk/10.3390/fib7030022
Krauklis AE, Gagani AI, Vegere K, Kalnina I, Klavins M, Echtermeyer AT. Dissolution Kinetics of R-Glass Fibres: Influence of Water Acidity, Temperature, and Stress Corrosion. Fibers. 2019; 7(3):22. https://0-doi-org.brum.beds.ac.uk/10.3390/fib7030022
Chicago/Turabian StyleKrauklis, Andrey E., Abedin I. Gagani, Kristine Vegere, Ilze Kalnina, Maris Klavins, and Andreas T. Echtermeyer. 2019. "Dissolution Kinetics of R-Glass Fibres: Influence of Water Acidity, Temperature, and Stress Corrosion" Fibers 7, no. 3: 22. https://0-doi-org.brum.beds.ac.uk/10.3390/fib7030022