Article

Effect of Cold Plasma Treatment of Polymer Fibers on the Mechanical Behavior of Fiber-Reinforced Cementitious Composites

1
Department of Civil and Environmental Engineering, New Jersey Institute of Technology, Newark, NJ 07103, USA
2
Department of Physics, Laboratory of Electrophysics and Atmospheric Plasmas (LEAP), Seton Hall University, South Orange, NJ 07079, USA
*
Author to whom correspondence should be addressed.
Submission received: 28 June 2021 / Revised: 20 September 2021 / Accepted: 10 October 2021 / Published: 18 October 2021
(This article belongs to the Topic Fiber-Reinforced Cementitious Composites)

Abstract

:
Fiber-reinforced cementitious composites (FRCC) are a class of materials made by adding randomly distributed fibers to a cementitious matrix, providing better material toughness through the crack bridging behavior of the fibers. One of the primary concerns with FRCCs is the behavior of the fiber when a crack is formed. The fibers provide a stress-bridging mechanism, which is largely determined by the bond that exists between the concrete and the fiber’s outer surface. While many studies have determined the properties of FRCCs and potential benefits of using specific fiber types, the effects of low temperature or cold plasma treatment of polymer fibers on the mechanical behavior of the composite material are limited. Polymer fibers are notable for their low density, ductility, ease of manufacture, and cost-effectiveness. Despite these advantages, the surface properties of polymers do not enable the bonding potential given by steel or glass fibers when used in untreated FRCC, resulting in pull-out failures before the full displacement capacity of the fiber is utilized. For this reason, modification of the surface characteristics of polymer fibers can aid in higher bonding potential. Plasma treatment is a process wherein surfaces are modified through the kinetics of electrically charged and reactive species in a gaseous discharge environment. This paper is a preliminary study on the use of atmospheric pressure plasma generated at approximately room temperature. This atmospheric, cold plasma treatment is a method for improving the mechanical properties of FRCC using polymeric fibers. In this study, polypropylene and polyvinyl-alcohol fibers were cold plasma treated for 0, 30, 60, and 120 s before being used in cementitious mortar mixtures. Compression and flexure tests were performed using a displacement-based loading protocol to examine the impact of plasma treatment time on the corresponding mechanical performance of the fiber-reinforced cementitious composite. The experimental results obtained from this study indicate that there is a positive correlation between fiber treatment time and post-peak load-carrying capacity, especially for specimens subjected to flexural loading.

1. Introduction

Additions of fibers to concrete systems have long been known to improve concrete durability, increase ductility, and improve overall cracking resistance of concrete [1,2,3]. Several types of fibers exist that can improve concrete performance, including steel, polymeric, and glass fibers. While steel fibers tend to offer the best performance in terms of mechanical properties improvement, polymeric fibers can also increase performance at a significantly lower cost [4]. Therefore, finding ways to improve the performance of concrete made with polymeric fibers, without significantly increasing cost, may provide significant economic benefits as well as performance improvements.

1.1. Fiber-Reinforced Concrete Composites

Fiber-reinforced concrete composites (FRCCs), which refer to concrete mixtures containing randomly dispersed fibers within a concrete matrix, have been researched and developed over the past 50 years. Due to the low tensile strength characteristics of conventional concrete, the inclusion of fibers with a high tensile strength enhances the ductility and cracking characteristics of the composite. These enhancements are achieved by restraining crack openings when mechanical loading or environment cause stresses that exceed the cracking stress of the cementitious materials. Fibers engage with the concrete matrix once it is cracked by arresting crack propagation, thereby greatly improving the strength and ductility of the concrete [5]. The inclusion of fibers can also mitigate damage resulting from shrinkage effects [6]. FRCC also offers the benefit of improved durability to deterioration mechanisms such as carbonation [7]. The use of synthetic fibers manufactured from naturally occurring macromolecules and synthetic polymers as reinforcement for cementitious materials has been adopted as an alternative to steel and glass fibers due to their effectiveness and relatively low cost [8].

1.2. Polymer Fibers

Polymer fibers offer advantages over glass, steel, and other fiber types due to their low density, flexibility, ease of production, and relatively low cost [9]. Due to the nature of their long-chain chemical structure, their surface properties can make their bonding potential in a concrete matrix incompatible with engineered concrete systems [9,10,11], especially when compared to more expensive steel fibers. For this reason, polymer fiber surfaces are often tailored to allow them to perform better with a composite fiber-reinforced concrete system. Two of the most common fiber types are polypropylene (PP) fibers and polyvinyl alcohol (PV) fibers. These two fiber types impart different mechanical and durability characteristics to a concrete matrix. PP fibers are effective in controlling general cracking due to various types of shrinkage, whereas PV fibers are more effective in structural applications where a high fiber modulus is required [4].
Concrete reinforced with PP fibers at conservative volume fractions (1–2% by volume) has demonstrated increases in flexural and impact strengths, respectively, of up to 21% and 17% compared to unreinforced concrete [6,12,13]. Naaman et al. researched PP fibers in concrete and demonstrated that PP fiber concrete specimens compared very well to steel fiber-reinforced concrete in terms of impact resistance, which is measured in the number of blows required to create cracking [14]. Many researchers have noticed only small changes in compressive strength at fiber volume fractions of 0.1–0.5% [6,15,16,17]. PP fibers have also been effective at controlling plastic shrinkage cracking in concrete through reductions in total crack area, maximum crack width, and the total number of cracks [18,19,20]. It has been demonstrated that smaller fiber volume fractions ranging from 0.1 to 0.3% are effective in reducing plastic shrinkage cracking [18].
PV fibers have shown effectiveness in enhancing the ductility and toughness of concrete as well as preventing sudden brittle failure [21]. It has been observed that the compressive strength of concrete can be improved depending on fiber geometry and content [22]. PV fibers exhibit a higher strength and elastic modulus than that of PP fibers [11]. The high ductility and toughness exhibited by PV fibers make them adequate for use in high-performance composites such as Engineered Cementitious Composites (ECC) [11]. PV-ECC offers many of the strength and performance advantages of steel fibers, but typically at a much lower cost when compared to the use of steel or PE fibers [11,23,24,25]. PV fibers exhibit a high interfacial chemical bond, frictional stress, and slip-hardening characteristics in a cementitious matrix [24]. The high chemical bonding of PV fibers in a cement matrix is due to the presence of hydroxyl groups found in their molecular chains [23]. Since PV fibers are hydrophilic, the affinity of the hydroxyl groups to the water in the surrounding cement hydrates creates a strong and continuous bond around the fiber [26]. The bonding capability of untreated PV fibers is such that interface tailoring is required to make PV fibers feasible for applications where high ductility is desired [11,23,24,27]. Interface tailoring can be achieved through methods such as oiling and fly ash addition [11,26,27]. Interface tailoring of fibers serves to alter the hydrophilicity or hydrophobicity of the fiber, therefore changing the fibers bond to the cement matrix as hydrates form after the addition of mixing water [11,23,24].
While the addition of different types of fibers can result in improved mechanical performance and durability characteristics, the surface characteristics of the fibers can limit these improvements. For this reason, different surface treatment measures have been explored to maximize the benefits of fiber inclusion, depending on fiber type [23,28,29,30]. A study on cement paste specimens reinforced with carbon fibers treated by silane, dichromate, or ozone demonstrated that these three different treatment methods all improved the tensile strength, modulus, and ductility of the specimens [30]. The effectiveness of treating carbon fibers with silane was attributed to the hydrophilicity imparted by silane [30]. Another study on the effectiveness of ozone treatment of carbon fibers also found that the surface modification imparted by ozone treatment improved the bond of the fibers to the cement matrix due to improved wettability of the fibers [29]. Some fibers require treatment to inhibit their bonding potential, rather than enhance it. PV fibers, for example, tend to rupture instead of pulling out due to high chemical bond to the cement matrix, eliminating the ductility benefits of fiber inclusion [11,23]. Fiber oiling has been shown to improve the tensile strain capacity by inhibiting the hydrophilicity of the fiber surface [23]. While many different surface improvement and modification techniques have been attempted with fibers, the authors are not aware of any studies, to date, that look at how cold plasma treatment of polymeric fibers used in FRCC systems may impact performance compared to standard polymeric fibers.

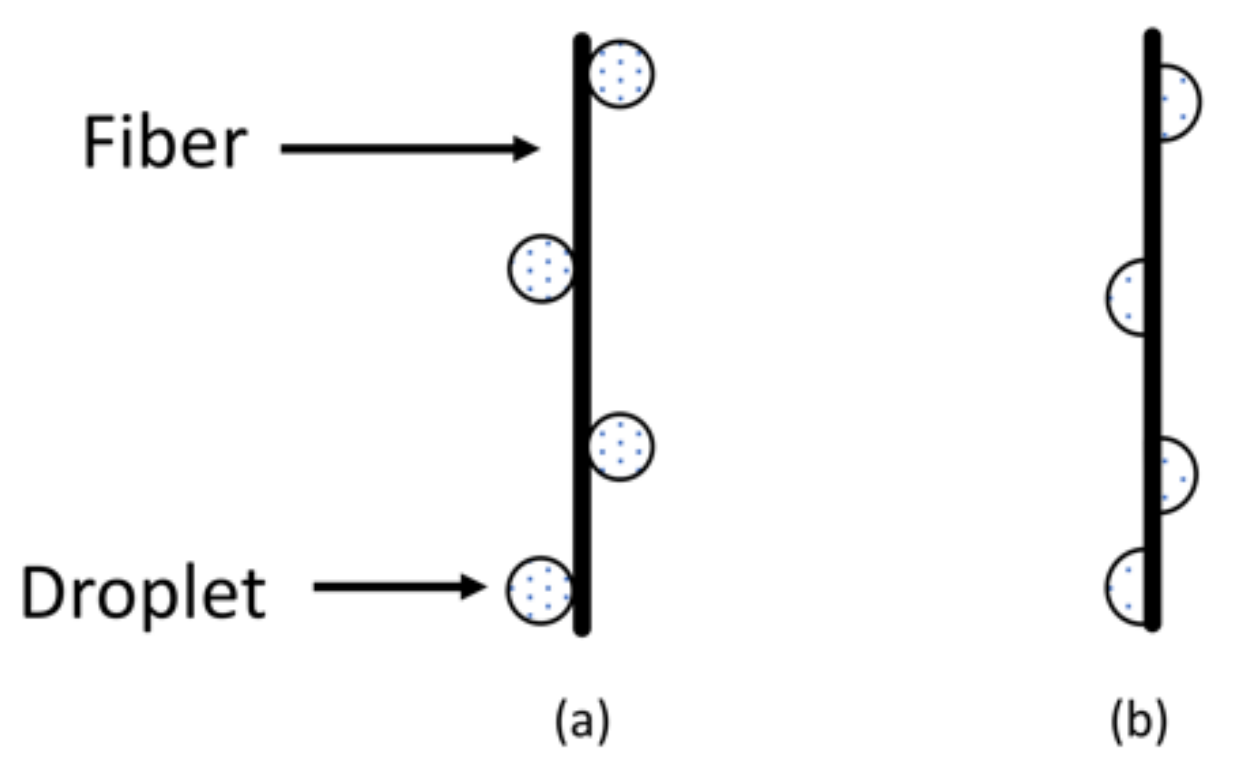
1.3. Plasma Treatment of Polymers

This study explores the use of cold plasma treatment on PP and PV fibers. A plasma exhibits various interaction mechanisms with surfaces based on the strength of the plasma generating and sustaining electric field applied, the active charged plasma species such as electrons and ions, the created reactive atoms and molecules such as reactive oxygen and nitrogen (RONs) species, emission photons such as ultraviolet light, and the time span at which the surface is subjected to the plasma. Polymer surfaces exposed to extreme plasma conditions will continuously degrade due to the combined effects of chemical and physical etching [9]. Cold plasma surface treatment has been shown to modify the adhesion and wettability of metallic and polymeric materials, while minimizing negative impacts on the bulk properties that can result from high temperatures [31,32]. Additionally, the use of cold plasma in the activation of polymer aids in increasing mechanical strength by increasing the bonding potential of the fibers to the surrounding matrix [31]. The effects of plasma treatment on a polymer are determined by variables such as gas composition, plasma conditions, ions, electrons, fast neutrals, radicals and VUV radiation, which contribute to etching, chemical activation and/or cross-linking [9]. The full extent to which cold plasma impacts different types of polymers is not well understood, though it is known that cold plasma can impact, in particular, how water behaves on the surface of the polymer.
A study on the surface modification of polyethylene terephthalate fibers (PET) induced by the action of radio frequency (RF) low pressure (0.2 bar) plasma treatment in some standard gases of either helium (He), argon (Ar), or molecular nitrogen (N2) showed an increase in hydrophilicity, accompanied by discernable etching and the implantation of oxygen and nitrogen-containing polar groups as a function of treatment [10]. Hydrophilicity refers to the affinity a surface has to water. Figure 1 shows the difference between a hydrophobic and a hydrophilic fiber. Hydrophilic fibers can adsorb mixing water and potentially allow cement hydrates to create a better bond with the fiber, causing less ductile behavior if bond-slip is not permitted before fiber failure. Hydrophobic fibers will not adsorb water and will interact mainly by means of mechanical bonding rather than chemical bonding. Polymer surface modification can impact the bonding mechanisms of fibers by altering the wettability characteristics [32]. Not only can this have an effect on local w/cm, but it can also change the interaction of hydration products with the fiber surface.
In the present work, the effects of an atmospheric air cold plasma treatment on two polymer fiber types are investigated. This study aims to examine the differences in mechanical behavior in fibers treated with different lengths of cold plasma treatment times. The primary goal is to examine the effects of plasma treatment on the post-peak load-carrying capacity of PP and PV fiber-reinforced mortar specimens in compression and flexure. As described, PV and PP fibers are generally effective in different applications: PP fibers are generally effective in shrinkage crack restraint, while PV fibers are effective where superior mechanical strength is desired. This study aims to assess both polymer fiber types using the same cold plasma treatment and testing scheme by studying not just the peak stress, but also the post-peak capacity of the system. The post-peak capacity of a mortar specimen reinforced only with fibers is related to the bond of the fiber to the matrix, so these mechanical strength tests will provide insight into how both types of fibers behave in both untreated and treated forms. Both fiber types experienced the same treatment regimens, from 0 to 120 s of treatment in 30 s increments. This work provides a preliminary understanding on the viability and usefulness of cold plasma treatment of PP and PV fibers. The novelty of the presented work is evident by the paucity of existing literature describing (1) the impact of cold plasma treatment on polymeric fibers and (2) how cold plasma treated polymeric fibers impact properties of FRCC systems. While several different fiber treatment regimes have been studied, cold plasma treatment is a novel method for modifying polymer fibers. Studying this is important because cold plasma treatment is a low cost, easily scalable process that can be implemented during the manufacture of polymeric fibers.

2. Materials and Methods

2.1. Fibers and Plasma Treatment of Fibers

In this investigation, the surfaces of the fibers were treated with a non-equilibrium atmospheric pressure, low temperature (cold) plasma jet as demonstrated in Figure 2. The cold plasma was created using UHP helium (He) feed gas to initiate and sustain in standard pressure and temperature (STP) air [33]. The He input flow was at a rate of 5.00 standard liters per minute (SLPM). As shown schematically in Figure 2a, the applied oscillating electric field was generated with a specialized high voltage (HV) alternating current (AC) power supply set at the voltage of 10.8 kVpk-pk at a frequency of 27.4 kHz, continuously measured with an oscilloscope. The total effective average input electrical power ranged from 15 to 20 Watts. As seen in Figure 2b, the plasma jet effluent extended out approximately 8 cm allowing for direct interfacing of the cold plasma with the polymer fibers. Similar cold plasma jets to the one used in this investigation have been used to treat various materials ranging from organic material surfaces such as bacteria to botanicals as well as inorganic material surfaces [34,35,36]. These sorts of cold plasmas over the last decade have demonstrated a wide versatility for technological applications leading to various new plasma-enabled products and plasma-assisted technologies [37,38,39,40]. This work contributes to this growing body of knowledge by investigating a potential new plasma-enhanced material of polymer fibers used in fiber-reinforced cementitious composites.
Two fiber types were used in this study: PP and PV. The PP and PV fibers measured 2.5 and 1 cm in length, respectively. Both fiber types were plasma treated at different time intervals. The fibers were placed on a 22.5 cm diameter cardboard disk in a single layer. The disk was then moved around in a random fashion under the action of a stationary atmospheric air room temperature cold plasma jet for a measured time interval. Fibers were held approximately 5 cm from the plasma jet effluent during treatment. The treatment process is shown in Figure 3. Fibers were subjected to the cold plasma jet treatment for 4 different time intervals: 0 s, 30 s, 60 s, and 120 s.

2.2. Cement Materials

A type I/II Portland cement, as defined by ASTM C 150/C150M [41], was used for the prisms and cubes cast in this study. An oxide analysis of the cement is presented in Table 1.

2.3. Aggregates

A granitic sand was used as the aggregate in mortar prisms and cubes cast in this study. The sand used in the present study was sourced from New Jersey, USA. The aggregate had a relative density of 2.62 and an absorption capacity of 0.57, when tested according to ASTM C128 [42], and its gradation complied with requirements of ASTM C33 [43].

2.4. Mixture Design and Casting

Mixtures were cast using a water to cement ratio (w/cm) of 0.45 to ensure adequate workability with fiber addition. Both PP and PV mixtures used the same w/cm to ensure comparable results. The ratio of cement to fine aggregate ratio was chosen to be 1:2.75 by mass following guidance making and testing mortar specimens in ASTM C109 [44]. The mixture designations used in this study are described in Table 2, along with the type and amount of fiber used, cold plasma treatment time, and w/cm.
Mortar was mixed in a countertop planetary mixer fitted with a 5 L bowl following the procedure outlined in ASTM C305 [45]. A modification of the standard was made to ensure a homogenous distribution of fibers in the mix. The fibers were introduced in small portions during the 30 s mixing period prescribed by the standard, followed by an additional 30 s of mixing to ensure dispersion of the fibers in the mix.
After mixing, mortar cubes measuring 50 × 50 × 50 mm were cast for compression in stainless steel molds, which was carried out in accordance with ASTM C109 [44]. Prisms measuring 40 × 40 × 160 mm were cast in wood molds lined with plastic to create specimens for flexure testing, which was carried out in accordance with ASTM C348 [46]. Prisms and cubes were removed from their molds 24 h after curing and were placed into a saturated lime solution. Prisms and cubes were cured for 35 days in a saturated lime solution at 23 ± 4 °C prior to testing.

2.5. Mechanical Testing

In this study, compression and flexure tests were performed on fiber-reinforced mortar specimens using the same testing machine. Cubes were tested in compression, while prisms were tested in 3-point flexure. An Instron 5980 Universal Testing System outfitted with a 100 kN load cell was used to test all specimens giving outputs of load response as well as stress, according to the geometry input of the specimens. All testing was performed using displacement-based loading protocols, which are described in greater detail in the following sections. Failure conditions were specified in the data acquisition software based on dummy specimen testing, which showed no appreciable load-carrying capacity changes beyond 2 and 3 mm of crosshead displacement for compressive and flexural tests, respectively.

2.5.1. Relevant Equations and Testing Parameters

In order to ensure the repeatability of the present study, ASTM standards for compression and flexure were followed as part of the testing scheme [44,46]. The post-peak load response was analyzed at the same displacements across the test matrix in order to capture the effects of varied fiber treatment times on the load response of the specimens.
ASTM C109 prescribes the procedures for testing mortar cubes in compression [44]. The test method provides a limit on the loading rate of 900–1800 N/s. The displacement rate prescribed resulted in a load rate well below this limit. According to ASTM C109, mortar cubes undergoing compression undergo stress according to the formula:
f m = P / A
where:
fm = compressive strength in psi or [MPa];
P = total maximum load;
A = cross sectional area.
ASTM C348 prescribes the procedures for testing prisms in flexure. According to this standard, prisms undergoing flexure in three-point bending undergo stress according to the Euler–Bernoulli beam bending formulation given by:
σ = M y / I  
where:
M = applied moment in N-m;
y = perpendicular distance to the neutral axis;
I = moment of inertia of cross section about neutral axis.
Since,
M = Pl/4;
y = d/2;
I = bd3/12.
It follows that the stress in a nonreinforced rectangular mortar section undergoes stress according to:
σ = P l 4 d 2 12 b d 3 = 3 P l 2 b d 2
ASTM C348 gives a simplified formula based on the prescribed geometry of the specimens (40 × 40 × 160 mm) used in the test in MPa.
S f = 0.0028 P
where:
Sf = flexural strength, MPa;
P = total maximum load, N.
The displacement rate prescribed in all tests resulted in a loading rate that was well below the 2640 ± 110 N/min limit given in the standard.

2.5.2. Compressive Specimens

Compressive strength testing was carried out according to ASTM C109 [44] using a displacement-based loading protocol. For the mortar cubes without fiber reinforcement, a displacement rate of 0.25 mm/min was applied until failure, when the capacity dropped to 25% of the peak load capacity. For the fiber-reinforced specimens, a displacement rate of 0.25 mm/min was applied up until post-peak displacement, when the load response dropped to 40% of the established peak load. Once the load response dropped to 40% of the peak load, an increased displacement rate of 0.75 mm/min was applied until failure, which was determined as when the residual load capacity was approximately 10% of the peak load and continually decreasing.

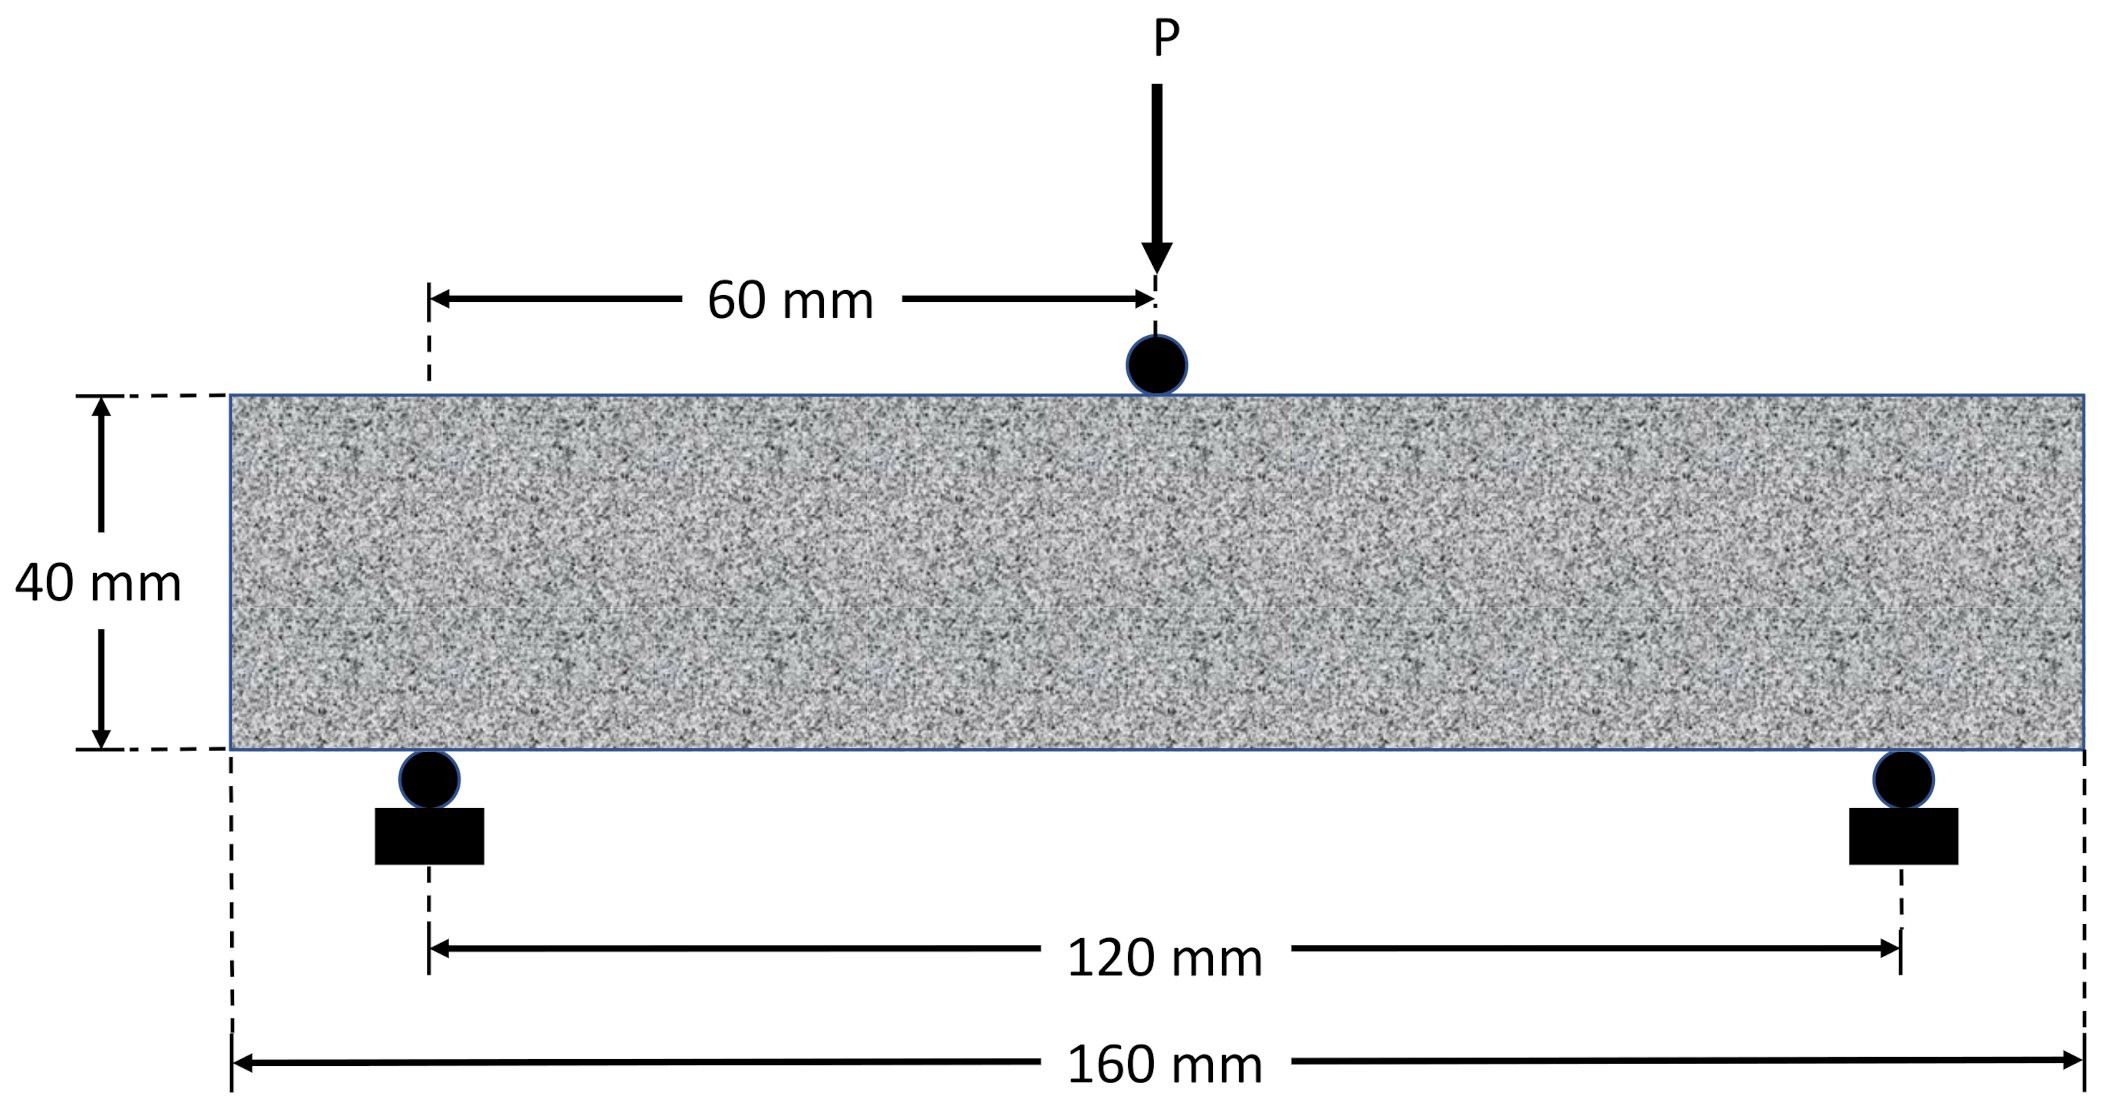
2.5.3. Flexural Specimens

Flexural strength testing was carried out according to ASTM C348 [46] using a displacement-controlled protocol in 3-point flexure. The span between the bottom roller supports was 120 mm. The point load in the middle was kept perpendicular to the prism by allowing free rotation of the roller. The distance between each support and the point load was measured on each side using a digital caliper to ensure that the point load was acting at the midpoint of the clear span. A schematic and image of the loading scheme is shown in Figure 4. For the prisms without fiber reinforcement, a constant displacement rate of 0.125 mm/min was applied until failure. For all fiber-reinforced mortar specimens, a load rate of 0.125 mm/min was applied up until post-peak, when the load response was 40% of the established peak load. Once the load response dropped to 40% of the peak load, an increased displacement rate of 0.4 mm/min was applied until failure. Failure was defined as the point where the specimen was visibly split and any additional capacity was from residual fiber bonding to the mortar matrix.

3. Results

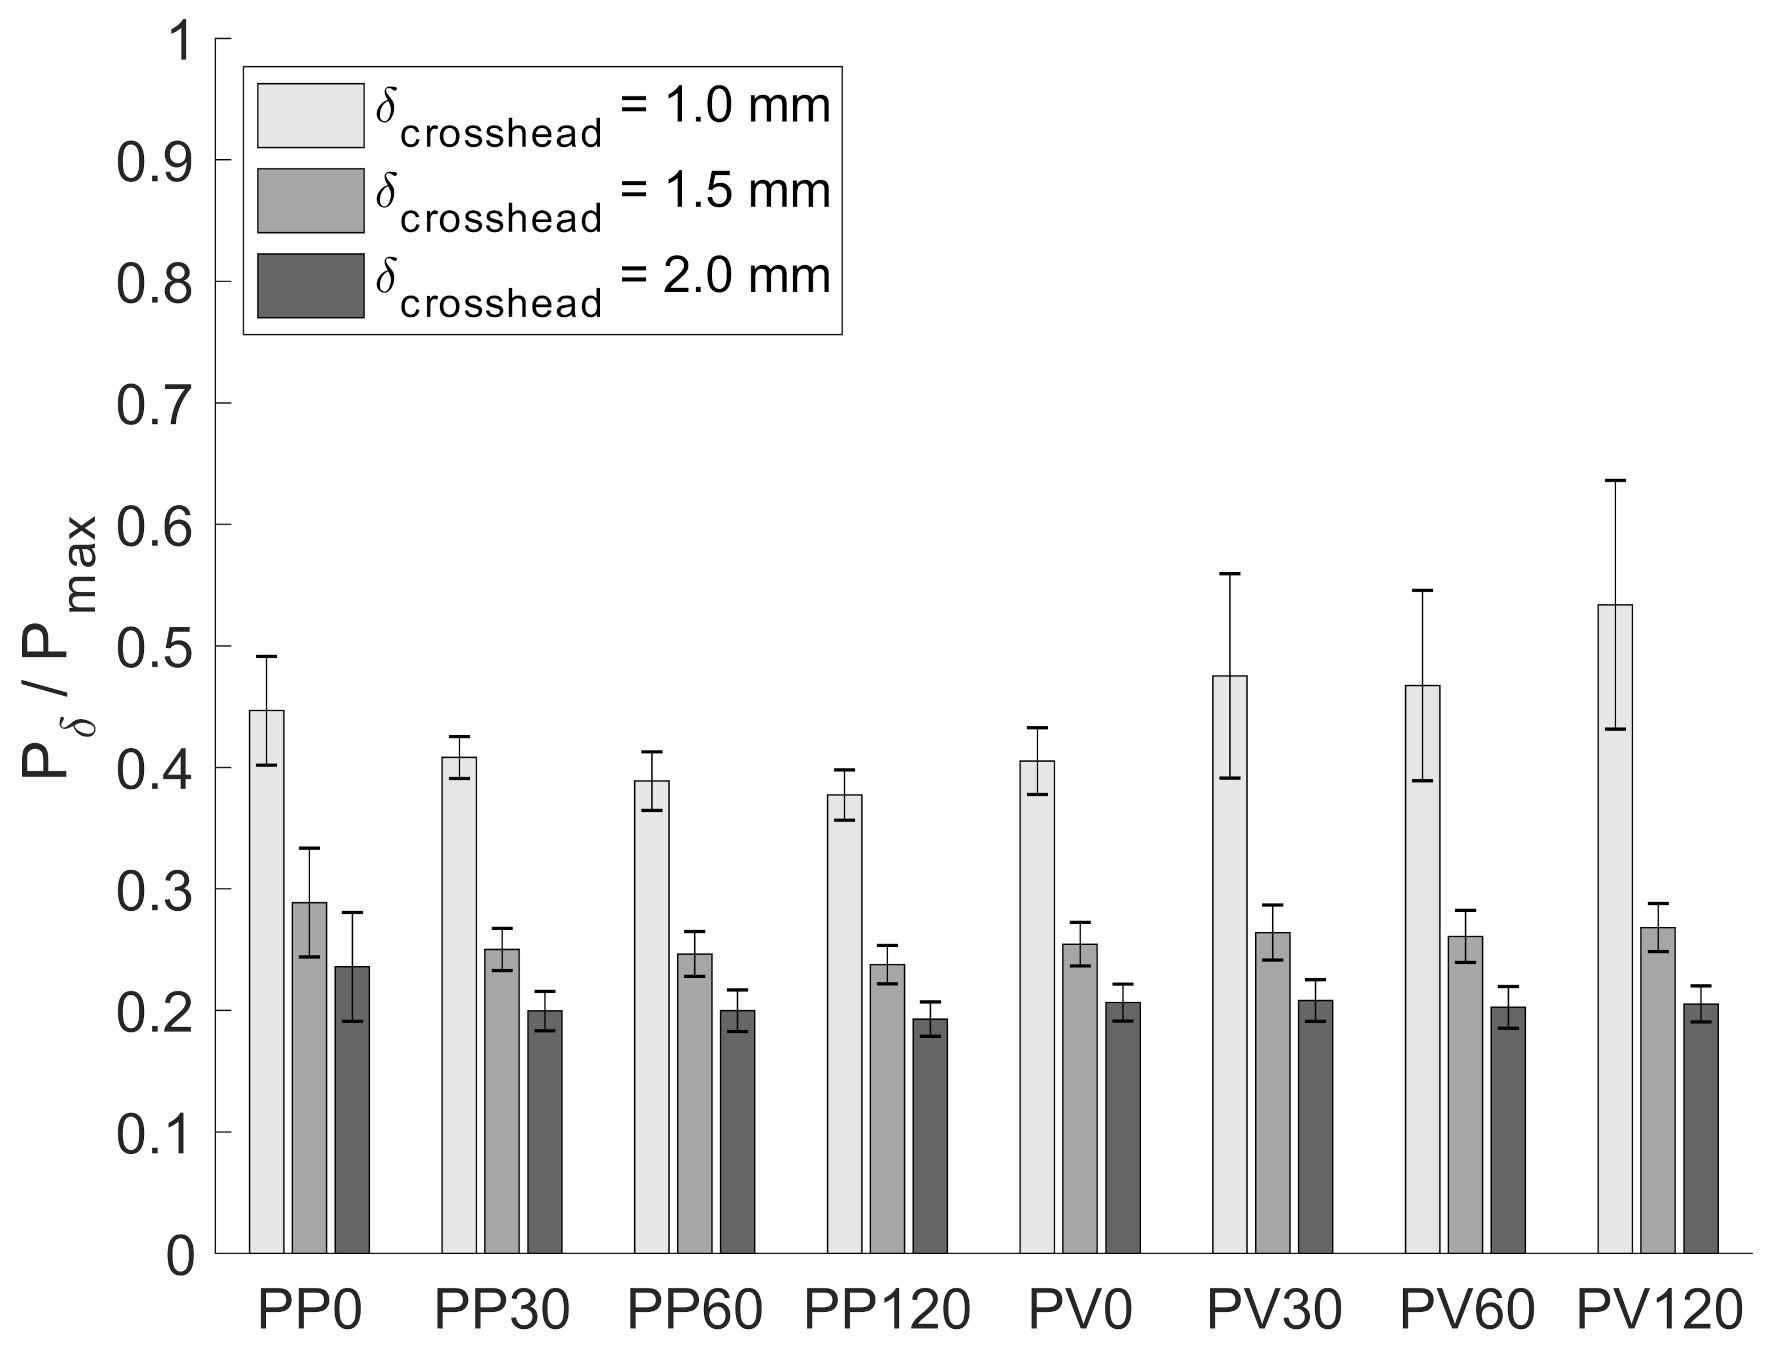
3.1. Compression Response of Specimens

The compression testing results are presented in Figure 5 as stress vs. crosshead displacement. Due to the nature of the force–displacement curves generated in this study, representative force–displacement curves from the dataset were selected to aid in improving comparison of results. Six specimens were produced from each mixture type; a representative curve from each mixture type was chosen for presentation in Figure 5. Force–displacement curves for all specimens are presented in the Appendix A. Figure 5a shows the results for all PP specimens, while Figure 5b shows the results for all PV specimens. Both PP and PV fiber specimens were plotted with the control shown (no fiber addition). The effects of fiber treatment times can be observed by comparing stress response at the same levels of displacement. Figure 5c,d show a comparison between PP and PV specimens with the same treatment times. This enables a visual comparison between the load response of PP and PV fiber specimens as well as a comparison of the loading curves between two different treatment times.
When analyzing the results obtained from this experiment, it was noted that none of the fiber-reinforced compressive specimens reached the peak load obtained from the non-fiber-reinforced (control) specimens. This effect is observed because the addition of fibers, while improving the energy absorption capacity and imparting post-peak strength, introduces voids into the concrete matrix that decrease the peak load capacity. The PV fiber specimens exhibited a higher post-peak load response compared to that observed for the PP fiber specimens, which can be seen in Figure 5c,d. Furthermore, while the PP specimens showed little variability in post-peak load and displacement at peak load, the PV specimens showed contrasting behavior, especially at lower displacements. Lastly, post-peak responses for both PP and PVA specimens were higher at 120 s of treatment, for selected specimens. Lower treatment times did not vary significantly from specimens that were untreated.
The maximum compressive stress, 𝜎max, for all specimens is presented in Table 3. This demonstrates that the inclusion of fibers, while adding residual post-peak load-carrying capacity, decreases the maximum load. This is due to the fact that fibers create discontinuities in the mortar matrix. While some mixes approached the same peak stress, the inclusion of fibers decreased 𝜎max in all cases.
Figure 6 shows the load capacity of all compressive specimens at selected displacements of 1, 1.5, and 2 mm relative to the peak load (Pδ/Pmax). It was observed that, at 1.0 and 1.5 mm of crosshead displacement, the untreated PP fiber specimens had an increased post-peak load-carrying capacity when compared to the treated fiber specimens. For the PV specimens, the PV120 exhibited the highest post-peak load-carrying capacity when compared to the other sets. However, the difference in post-peak behavior becomes less pronounced at crosshead displacements greater than 1.0 mm, with all systems having similar Pδ/Pmax. The PV compression tests exhibited variable displacements at the established peak load, so the post-peak behavior was not subject to the same degree of comparison as the PP fiber specimen sets. The effects of plasma treatment on compressive specimens are more difficult to evaluate in terms of load response due to the various stress states experienced by a fiber within a compressive specimen. Because the failure is not dominated primarily by the progression of tensile failure as is the case in most flexural specimens, the effect of plasma treatment is not as pronounced as in flexural specimens discussed in the next section. Therefore, these preliminary results do not indicate that cold plasma treatment of fibers will provide a benefit to the compression performance of fiber-reinforced composites.

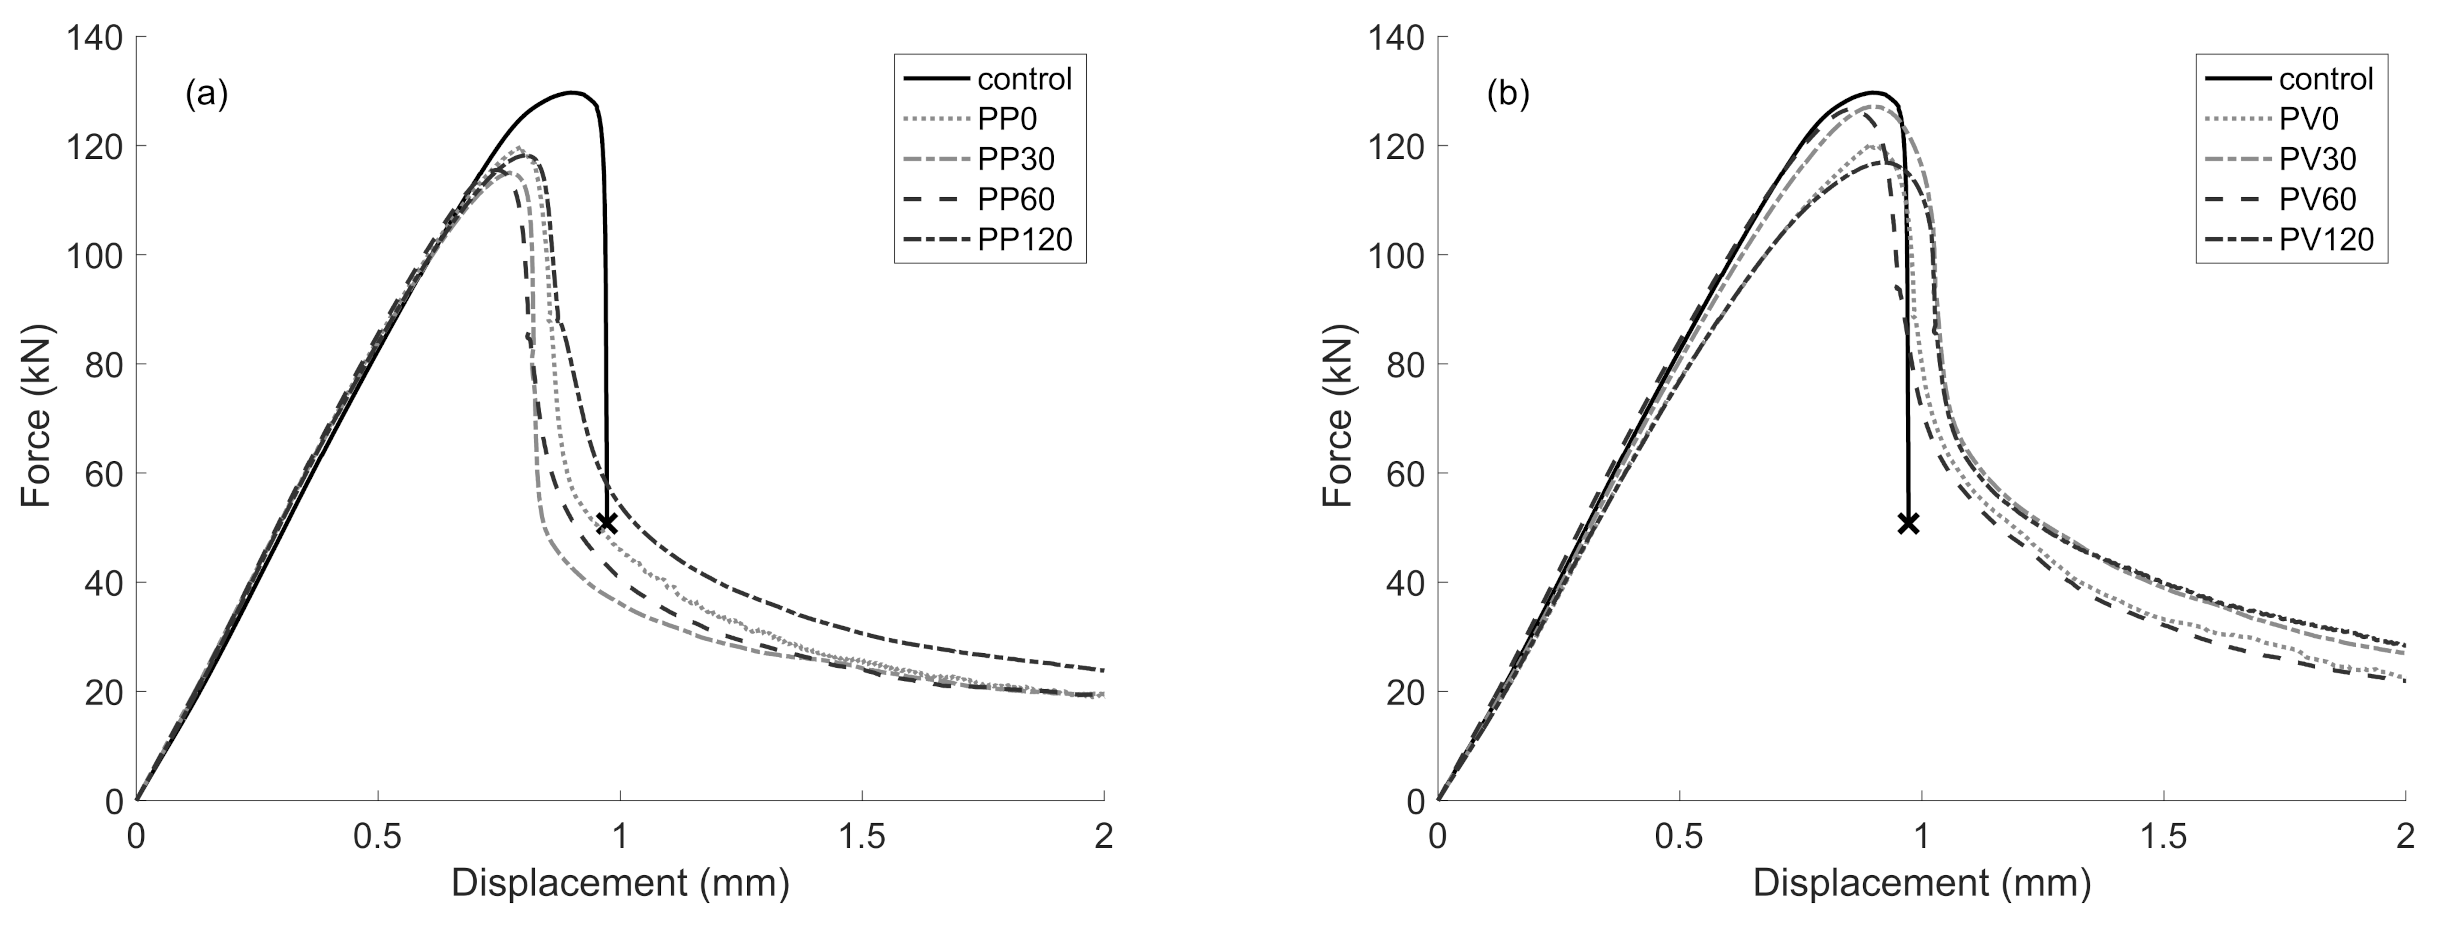
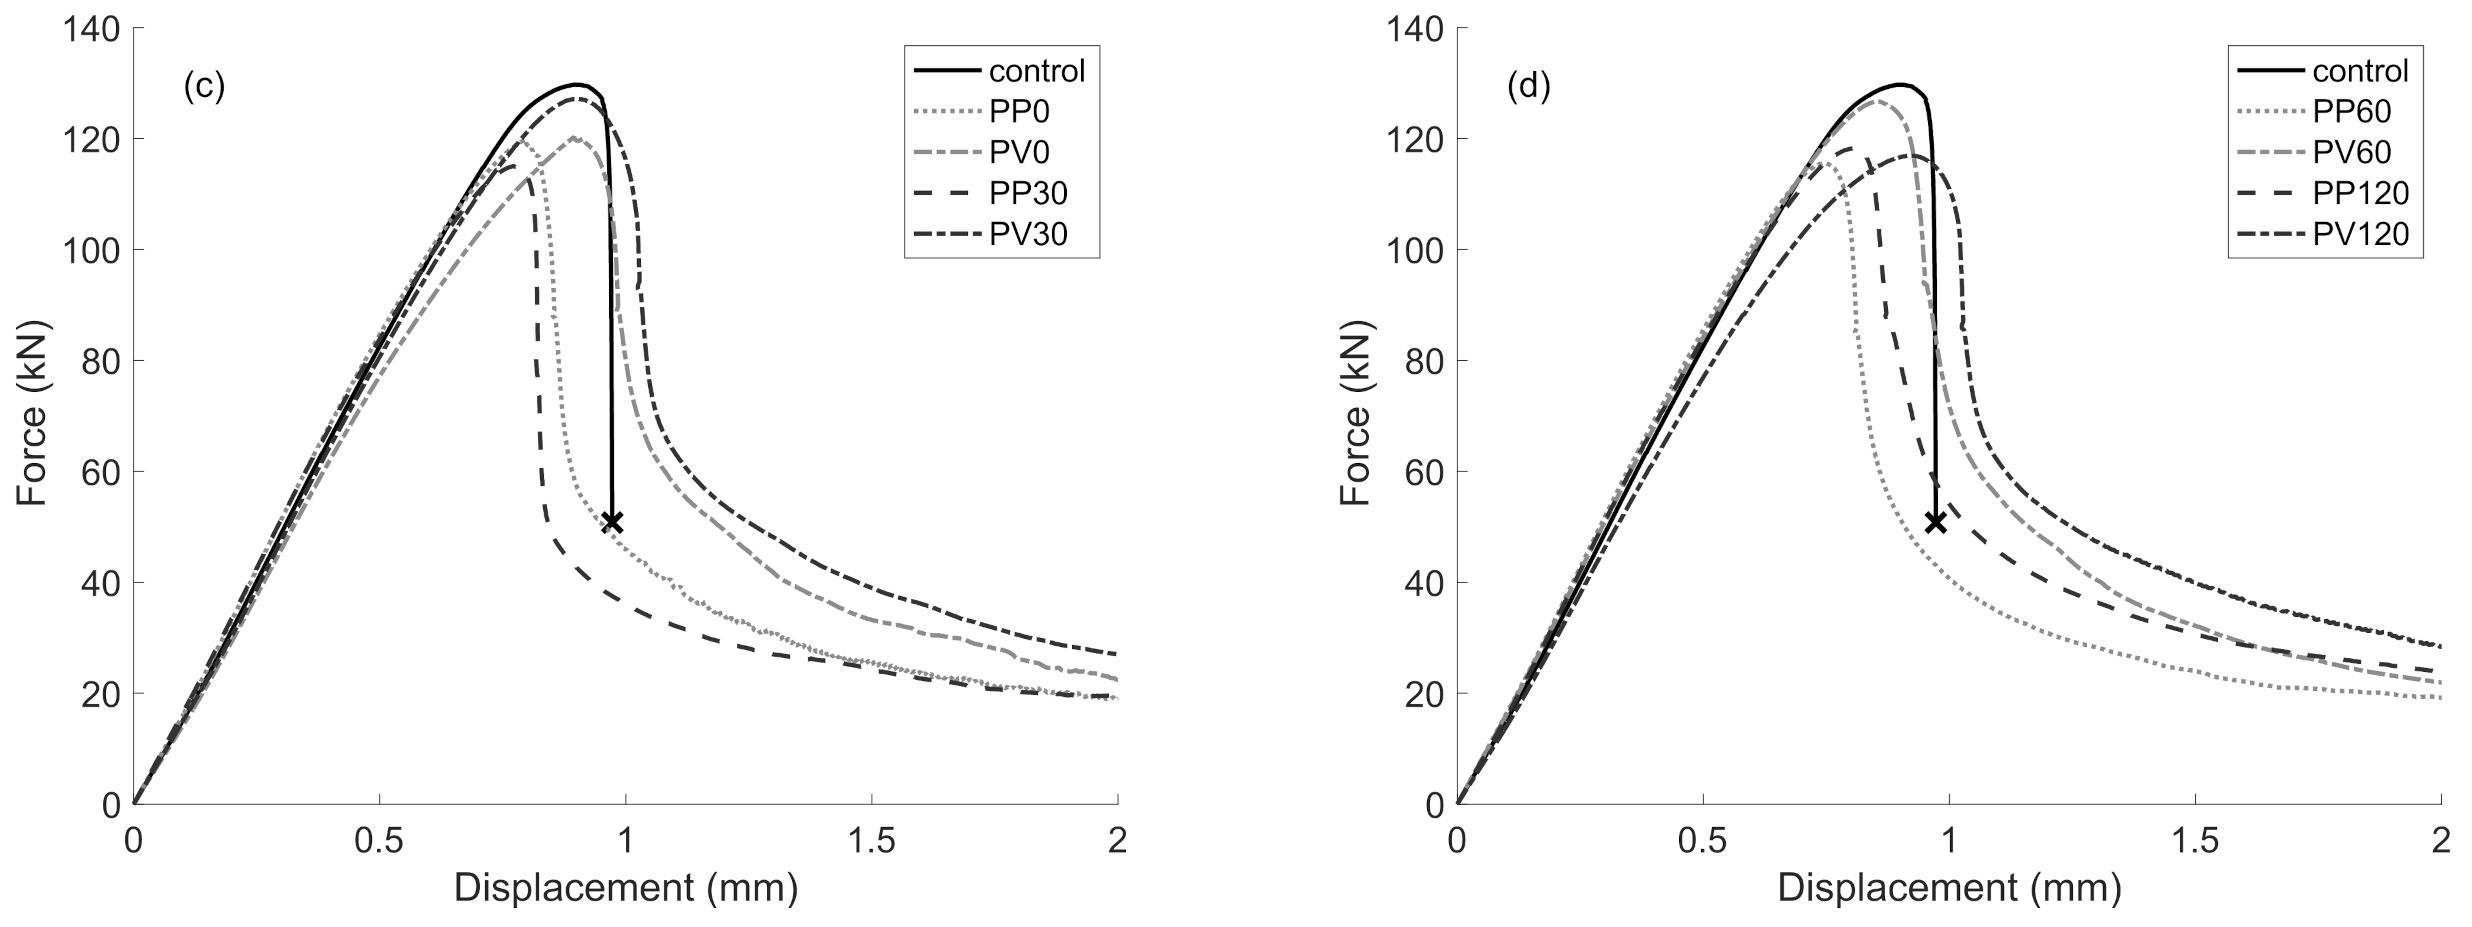
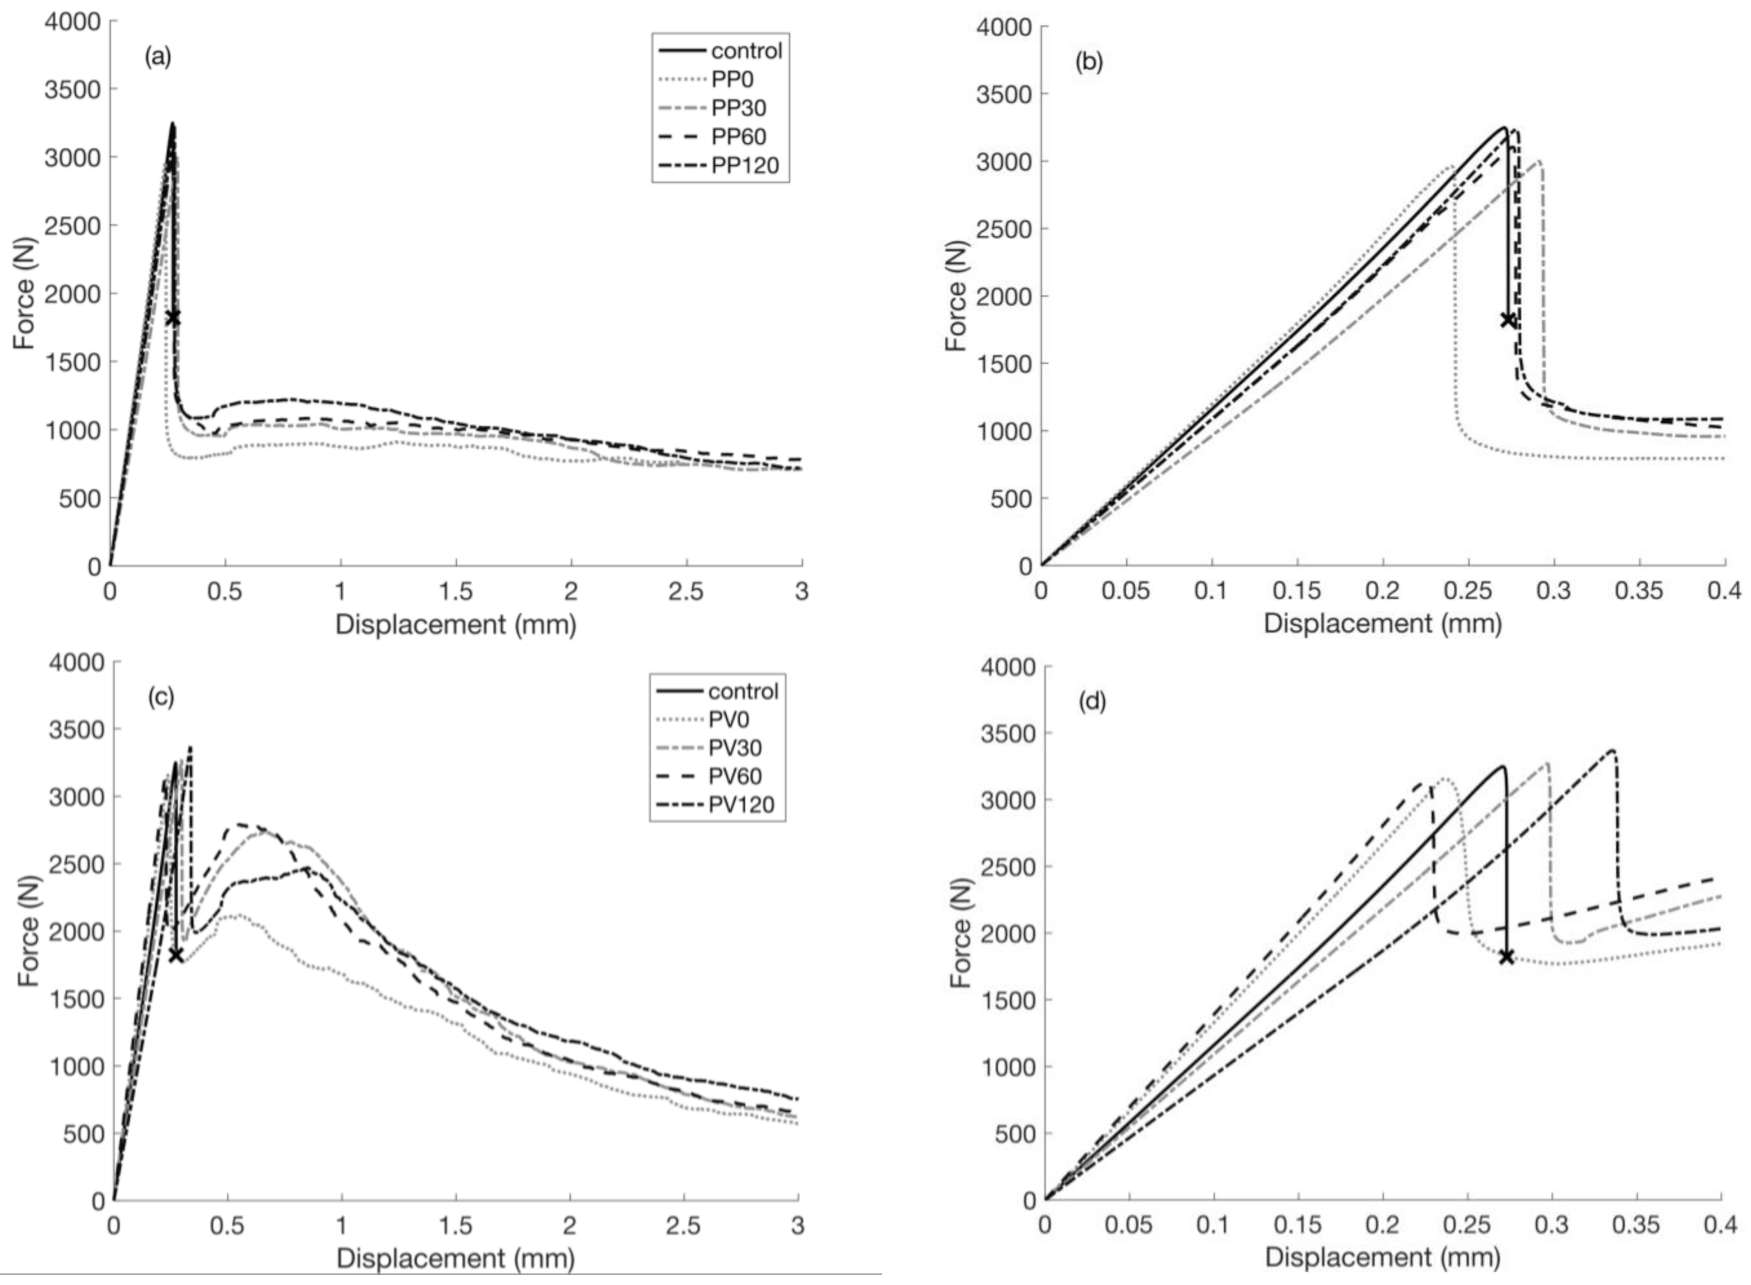
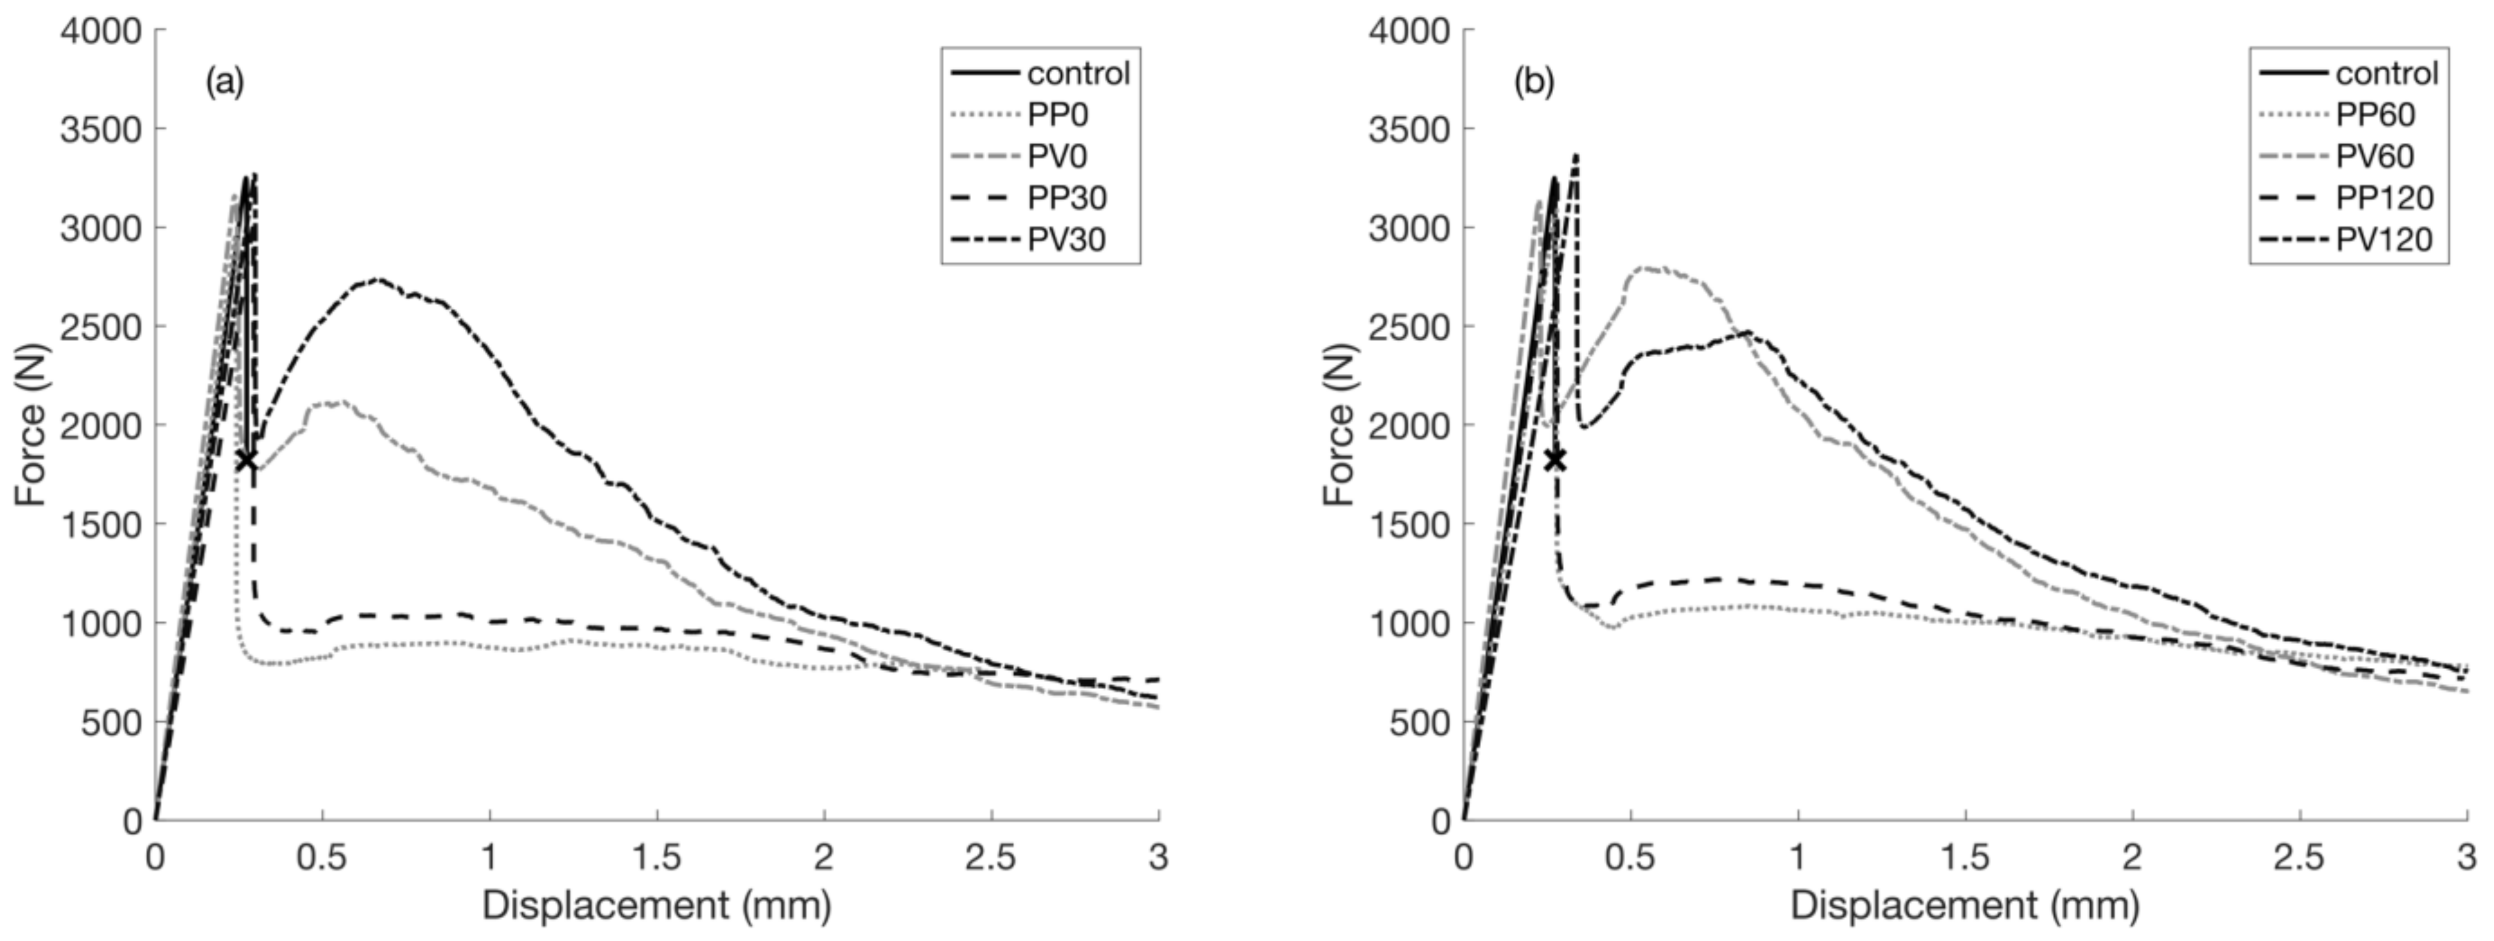
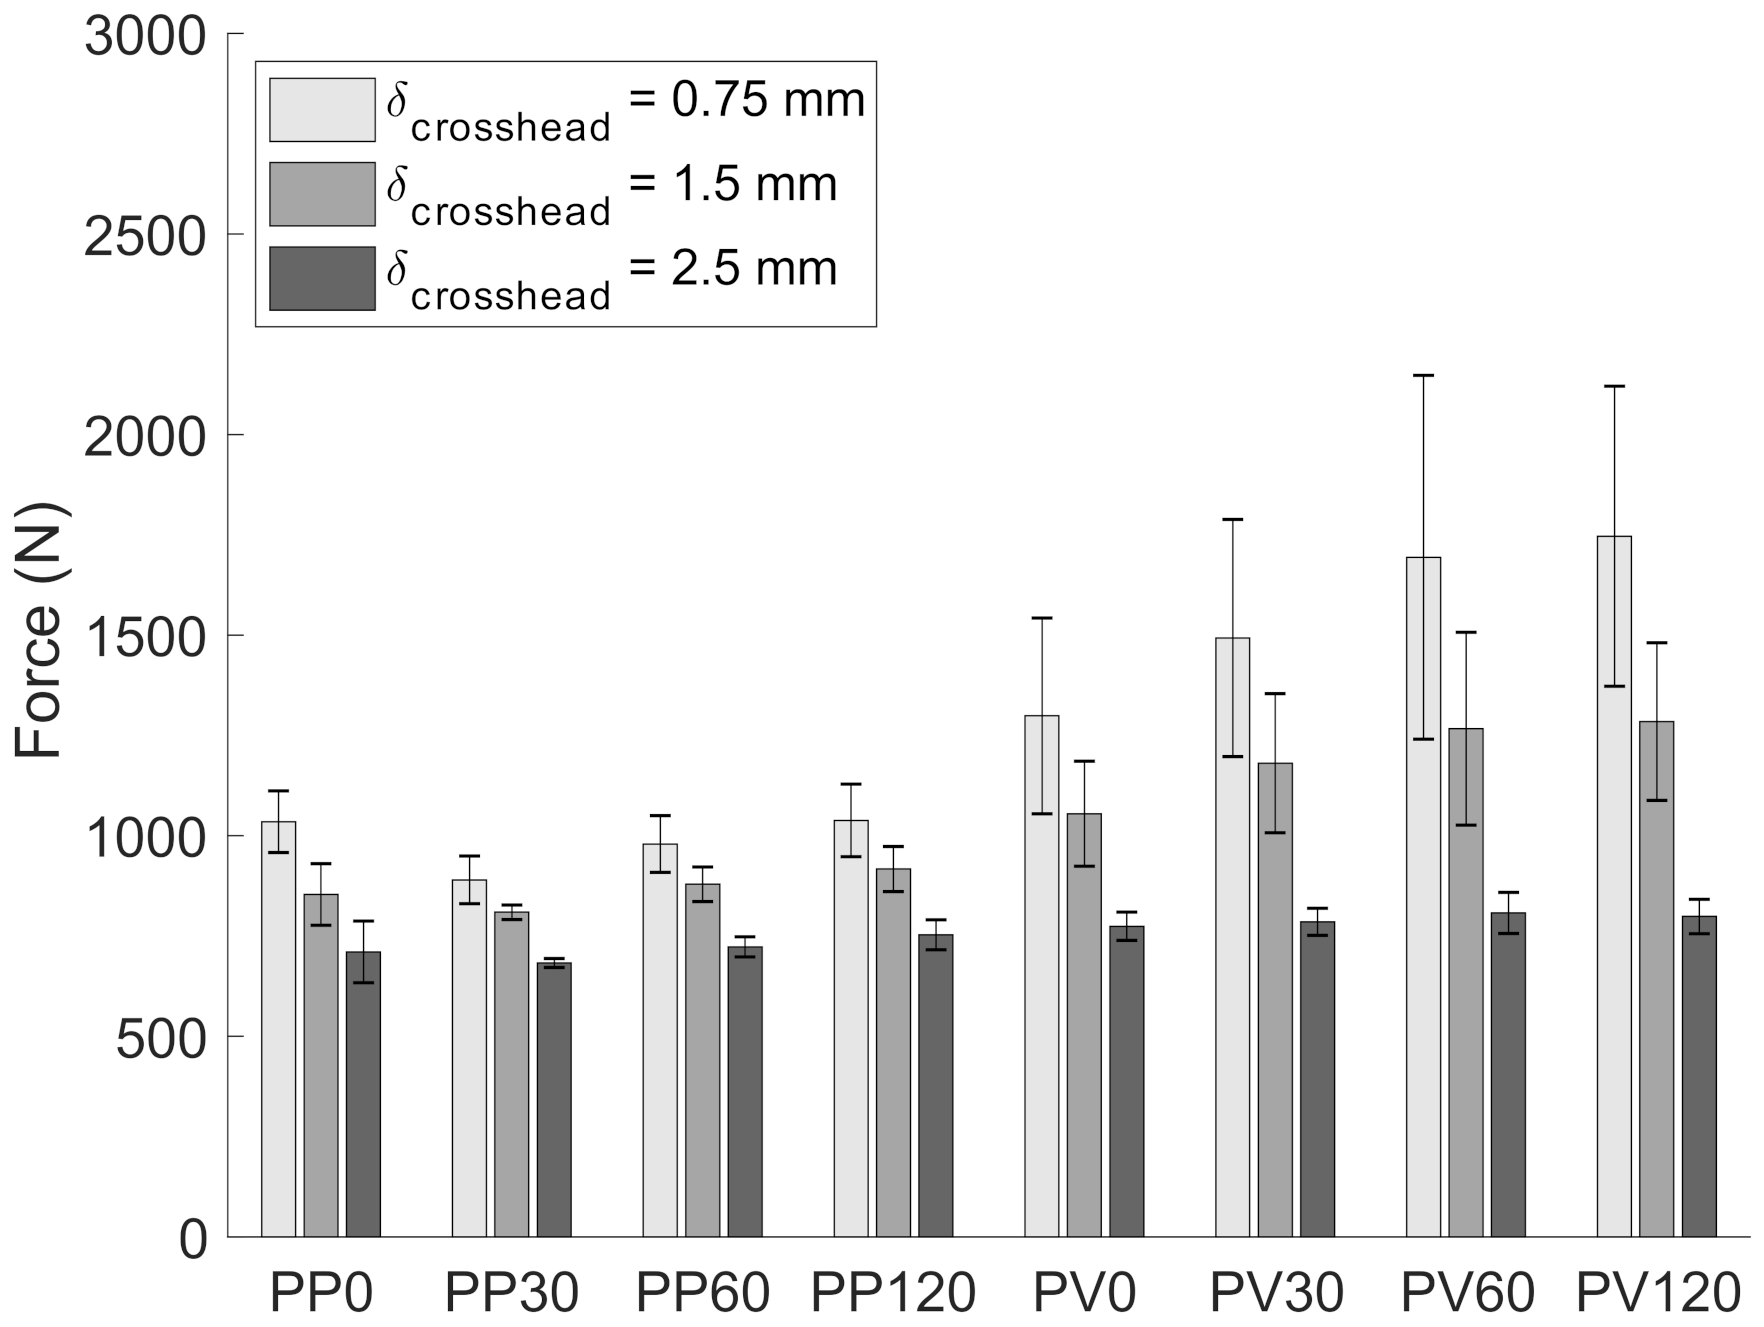
3.2. Flexural Response of Specimens

The flexural results are reported as force vs. displacement in Figure 7. Due to the nature of the force–displacement curves generated in this study, representative f–d curves from the dataset were selected to aid in better comparison of results. Six specimens were produced from each mixture type; a representative curve from each mixture type was chosen for presentation in Figure 7. Force–displacement curves for all specimens can be seen in the Appendix A. Figure 7a,c show the flexural force–displacement behavior of all PP and PV fiber specimens plotted against the control out to the final recorded displacement of 3 mm. While some tests were performed to greater displacements, the results were tapered to capture the effects of treatment across the test matrix. Figure 7b,d show load–displacement curves to a displacement of 0.4 mm to provide a better visual distinction between the initial loading curves. The PV fiber specimens exhibited a higher overall post-peak load capacity compared to the PP fiber specimens across the test matrix. The results indicate that at displacements of 0.75 and 1.0 mm, PP fibers exhibited increased residual load capacity as a function of treatment time, with the untreated specimens having higher load responses. This observed effect could have resulted from less pull-out due to improved adhesion to the mortar matrix when subjected to cold plasma treatment. Following the results of a study on plasma treatment of polypropylene surfaces, the action of a cold plasma can alter the adhesion and wettability properties based on the interactions between input voltage, treatment time, and flowrate [29]. Each increase in treatment time was associated with a higher residual load capacity at the analyzed displacements of 0.75 and 1.0 mm, for PP specimens. At greater displacements, the differences in the results were not notably different, and the variability between post-peak displacements was small, indicating that regardless of treatment, higher post-peak displacements are consistent.
The treated PV fiber specimens all exhibited a marked increase in residual load capacity when compared against the load response for the untreated specimens. In the case of the PV fibers, the PV30 and PV60 show the highest increases in residual load response, with a decreased residual capacity occurring for the PV120 specimen. The results indicate that both PP and PV fibers respond in some way to treatment, exhibiting differences in residual load-carrying capacity.
Figure 8a,b show the results from both fiber types to provide a visual distinction between the mechanical response of the PP and PV fibers. Due to the nature of the force–displacement curves generated in this study, representative force–displacement curves from the dataset were selected to aid in better comparison of results. Six specimens were produced from each mixture type; a representative curve from each mixture type was chosen for presentation in Figure 8. Force–displacement curves for all specimens can be seen in Appendix A. Two treatment times are shown in each graph, providing a visual comparison of load response between two treatment times. The results clearly indicate that PV specimens are superior to PP specimens in adding strength. The PP fiber specimens do not exhibit a pronounced reloading curve like the PV specimens, but rather, maintain a steadily decreasing residual load branch after dropping to roughly one-third of the peak load capacity.
Figure 9 shows a summary of results for the residual load capacity (N) at the selected displacements of 0.75, 1.5 and 2.5 mm. This bar graph shows data for all flexure specimens examined and provides visual distinction between the residual load capacities of each specimen. A positive relationship between treatment and load response can be clearly seen in the PP specimens for treatment times of 0.75 and 1.5 mm of crosshead displacement. At each increase in treatment time, the load response at 0.75 and 1.5 mm increases. As the crosshead displacement reaches higher values, the relationship is less distinguished for PP specimens. For the PV specimens, at 0.75 and 1.5 mm of crosshead displacement, all specimens exhibited an increase in post-peak load capacity when compared to untreated fibers. At greater displacements, the differences in the results were not as significant.
These results indicate that the post-peak behavior under flexural loading of fibers can be improved through the use of cold-plasma treatment of fibers. Initial results show that this impact may be more pronounced for PV fibers compared to PP fibers. It is recommended that future work study the performance of cold plasma-treated PP fibers in shrinkage applications to understand if there is a more significant impact in that type of damage condition. Despite this, some performance enhancement of post-peak behavior was observed with treated fibers.
Based off of what is currently understood about how plasma treatment affects fibers, the impact of the treatment on the performance of the fibers was most likely due to a change in the hydrophilicity of the surface of the fiber. Treatment may have created a better bond structure around the fiber providing better post-peak performance under flexural loading. It was not in the scope of the current study to examine these changes, however. Future work is recommended, based off of these preliminary results, to study the mechanism through which cold plasma-treated fibers enhance performance. This should be carried out through a study of the surface properties of the fibers before and after various treatment lengths. Additional studies on the local microstructure around the fibers in cementitious composite systems will show the impact that the treatment may have had on microstructural development of the cement matrix around the fibers.

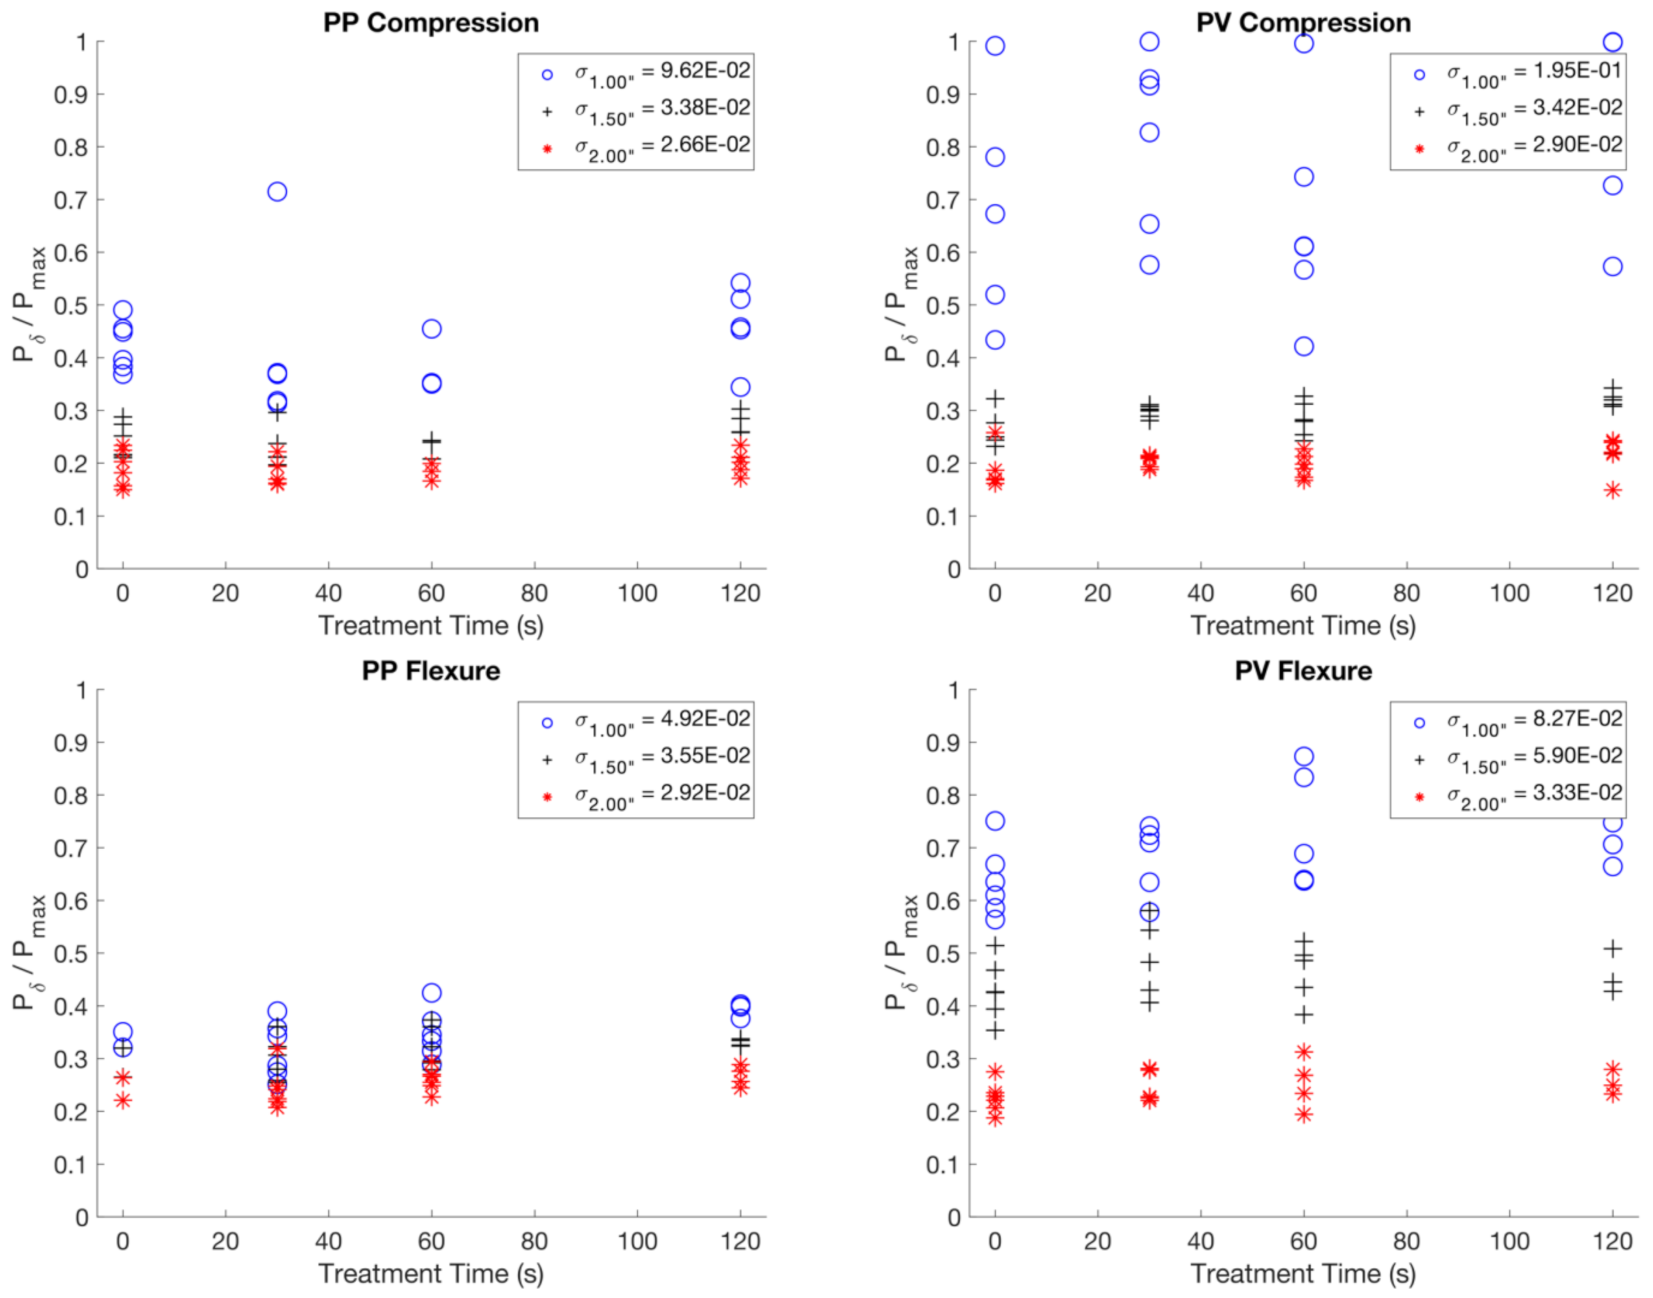
3.3. Influence of Treatment Time on Variability in Strength

Figure 10 shows scatter plots of Pδ/Pmax vs. treatment time for each specimen type. The standard deviation of Pδ/Pmax values at various displacement increments, σ P δ P max is presented for all specimens considered in the dataset. Loading curves were considered outliers by means of graphical data selection if the loading curves exhibited poor specimen seating or non-uniformity with the rest of the data.
Two observations can be seen when examining the results shown in Figure 10. First, variability in Pδ/Pmax was high at low displacement levels, regardless of treatment time. This can be seen through the high amount of scatter of the blue circles in Figure 10. Variability was high at these low displacements because the strength at these displacements was more highly controlled by the matrix strength rather than the fiber’s contribution to the flexural response.
As displacement increased, the variability of Pδ/Pmax decreased, regardless of treatment time. The decrease in standard deviation of Pδ/Pmax  σ P δ P max at higher displacements was likely due to fibers taking on more stress during the softening branch of the loading curves for both compression and flexure. As the fibers engage with the mortar matrix, the capacities of mortar specimens at increasing displacements are controlled by the tensile properties of the fibers, as well as the pull-out characteristics of the fibers when the surrounding matrix cracks. Assuming a homogeneous fiber mix was achieved, the variability of the load response post-peak was more consistent than in early stages of cracking, which is confirmed by the decreasing standard deviation with increasing displacement measurements.

4. Discussion

Based on the load–displacement behavior of the test matrix, it is evident that the crack-bridging action of the fibers contained in the mortar matrix changes as a function of treatment time. Further study is needed to assess the statistical significance of fiber treatment times on load displacement response. This results from higher bonding potential imparted by cold plasma treatment. Short plasma treatment times of polymers have been observed to modify surface properties and cause mainly outer chain scissions, while longer times or more intense treatment can result in inner chain scissions [6]. A scission is a break in an otherwise long-chain molecule. Due to the relatively low intensity of plasma treatment used in this study, it is only considered that surface effects imparted by treatment change the mechanical response of the specimen set. The results from this study were consolidated in order to provide analysis on specimens that exhibited the average response overall.
Polypropylene and Polyvinyl Alcohol Fibers both enhanced the mechanical behavior of mortar specimens when compared to unreinforced specimens. Due to the relatively high fiber volume content, the peak load for all fiber types was observed to be lower than that of the unreinforced specimens due to the defects introduced by fiber addition. For the flexural tests, both fiber types exhibited post-peak strain-hardening behavior, with the PV fibers having a much more pronounced strain-hardening branch once the fibers were engaged when compared to PP fibers. Overall, the observed response of the specimens in this study suggests that cold plasma treatment positively alters the bonding potential and interaction between the fiber surface and the mortar as a function of treatment time. Further study is needed to assess the specific bonding mechanisms that result from treatment, and whether or not treatment permanently alters the bonding potential of polymer fibers.

5. Conclusions

Compressive PP specimens and PV specimens did not exhibit a strong relationship between treatment time and post-peak capacity; however, it was observed that the longest treatment time was associated with a higher residual load capacity during strain softening. Compressive PV specimens exhibited higher peak strength as well as superior post-peak response on the strain-softening branch of the load–displacement curve. Flexural PP specimens exhibited a strong correlation between treatment time and post-peak load capacity, exhibiting mild post-peak strain-hardening behavior. Flexural PV specimens showed a mild correlation between fiber treatment time and post-peak load capacity, exhibiting a strong post-peak strain-hardening branch. Overall, cold plasma treatment imparts some change in polymer fibers, possibly resulting from etched surfaces, causing varying bond potentials within a cementitious system.
Further work is necessary to understand how the cold plasma treatment changed the polymeric fibers and how that may have impacted the bond of the cementitious matrix to the polymeric fibers. Future studies should focus on microstructural and chemical analysis of the polymeric fibers and the microstructure of the concrete around the fibers. Understanding how cold plasma changes the surface characteristics of the polymer fibers will support future work on how the treatment process can be improved or modified to achieve a better product. Additionally, a larger set of testing variables and specimen numbers to confirm the trends observed in this manuscript are necessary.

Author Contributions

N.T.: Prepared mortar specimens, conceptualized and performed the testing protocol, and wrote the main portions of the supporting document. M.J.B.: Prepared the mortar mix design and provided revisions to the main document. M.P.A.: Contributed to the development of the treatment methodology and provided revisions to the main document. D.E.G.: Prepared the fibers with plasma treatment. J.L.L.: Conceptualized the cold plasma jet that was used to treat the fibers. All authors have read and agreed to the published version of the manuscript.

Funding

This research was funded by the John A. Reif Department of Civil and Environmental Engineering at New Jersey Institute of Technology and the Department of Physics at Seton Hall University.

Data Availability Statement

All data is available for review and will be provided upon request via e-mail to M.P.A. at [email protected].

Acknowledgments

The authors would like to acknowledge Tyler McVeigh for his initial contribution to the development of the protocol for the plasma treatment of the polymer fibers. The authors also acknowledge the partial financial support of the Department of Physics at Seton Hall University for the needed lab supplies for the plasma experiments.

Conflicts of Interest

The authors declare no conflict of interest.

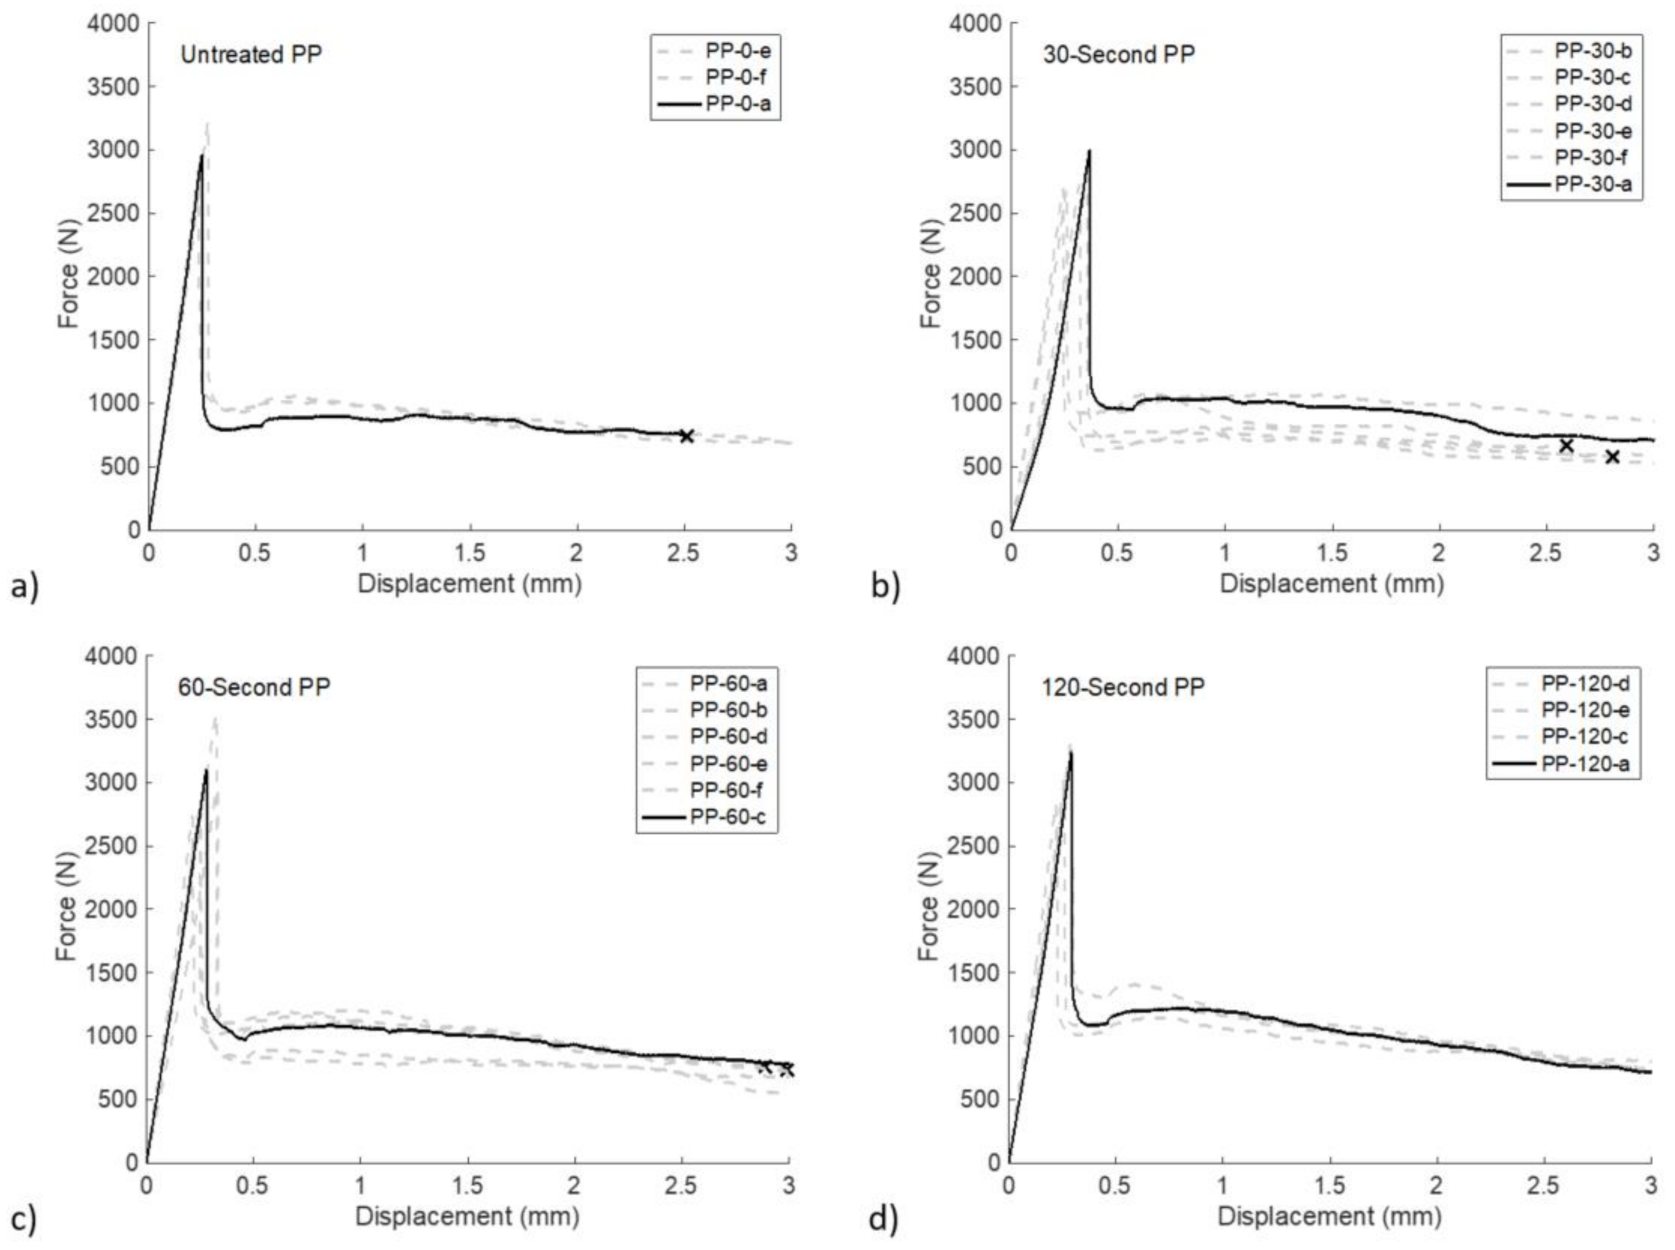
Appendix A. Force-Displacement Plots for All Specimens

Figure A1. Force-displacement curves for all PP specimens tested in compression (a) 0 s of treatment time, (b) 30 s of treatment time, (c) 60 s of treatment time, and (d) 120 s of treatment time.
Fibers 09 00062 g0a1
Figure A2. Force-displacement curves for all PV specimens tested in compression at (a) 0 s of treatment time, (b) 30 s of treatment time, (c) 60 s of treatment time, and (d) 120 s of treatment time.
Fibers 09 00062 g0a2
Figure A3. Force-displacement curves for all PP specimens tested in flexure at (a) 0 s of treatment time, (b) 30 s of treatment time, (c) 60 s of treatment time, and (d) 120 s of treatment time.
Fibers 09 00062 g0a3
Figure A4. Force-displacement curves for all PV specimens tested in flexure at (a) 0 s of treatment time, (b) 30 s of treatment time, (c) 60 s of treatment time, and (d) 120 s of treatment time.
Fibers 09 00062 g0a4

References

  1. Mobasher, B.; Stang, H.; Shah, S.P. Microcracking in fiber reinforced concrete. Cem. Concr. Res. 1990, 20, 665–676. [Google Scholar] [CrossRef]
  2. Li, V. On Engineered Cementitious Composites (ECC): A Review of the Material and Its Applications. J. Adv. Concr. Technol. 2003, 1, 215–230. [Google Scholar] [CrossRef] [Green Version]
  3. Naaman, A.E.; Reinhardt, H.W. Proposed classification of HPFRC composites based on their tensile response. Mater. Struct. Constr. 2006, 39, 547–555. [Google Scholar] [CrossRef]
  4. Zhang, D.; Yu, J.; Wu, H.; Jaworska, B.; Ellis, B.R.; Li, V.C. Discontinuous micro-fibers as intrinsic reinforcement for ductile Engineered Cementitious Composites (ECC). Compos. Part B Eng. 2020, 184, 107741. [Google Scholar] [CrossRef]
  5. Song, P.; Hwang, S. Mechanical properties of high-strength steel fiber-reinforced concrete. Constr. Build. Mater. 2004, 18, 669–673. [Google Scholar] [CrossRef]
  6. Song, P.S.; Hwang, S.; Sheu, B.C. Strength properties of nylon-and polypropylene-fiber-reinforced concretes. Cem. Concr. Res. 2005, 35, 1546–1550. [Google Scholar] [CrossRef]
  7. Zhang, J.; Cheng, J.; Dou, Y.; Xin, Q. Mechanical properties and durability of fiber-reinforced concrete. J. Eng. Sci. Technol. Rev. 2017, 10, 68–75. [Google Scholar] [CrossRef]
  8. Zheng, Z.; Feldman, D. Synthetic fibre-reinforced concrete. Prog. Polym. Sci. 1995, 20, 185–210. [Google Scholar] [CrossRef]
  9. Hegemann, D.; Brunner, H.; Oehr, C. Plasma treatment of polymers for surface and adhesion improvement. Nucl. Instrum. Methods Phys. Res. Sect. B Beam Interact. Mater. Atoms 2003, 208, 281–286. [Google Scholar] [CrossRef]
  10. Riccardi, C.; Barni, R.; Selli, E.; Mazzone, G.; Massafra, M.R.; Marcandalli, B.; Poletti, G. Surface modification of poly(ethylene terephthalate) fibers induced by radio frequency air plasma treatment. Appl. Surf. Sci. 2003, 211, 386–397. [Google Scholar] [CrossRef]
  11. Pan, Z.; Wu, C.; Liu, J.; Wang, W.; Liu, J. Study on mechanical properties of cost-effective polyvinyl alcohol engineered cementitious composites (PVA-ECC). Constr. Build. Mater. 2015, 78, 397–404. [Google Scholar] [CrossRef]
  12. Soroushian, A.K.P.; Hsu, J. Mechanical Properties of Concrete Materials Reinforced With Polypropylene or Polyethylene Fibers. ACI Mater. J. 1992, 89, 535–540. [Google Scholar] [CrossRef]
  13. Manolis, G.D.; Gareis, P.J.; Tsonos, A.D.; Neal, J.A. Dynamic properties of polypropylene fiber-reinforced concrete slabs. Cem. Concr. Compos. 1997, 19, 341–349. [Google Scholar] [CrossRef]
  14. Naaman, S.P.S.A.E.; Throne, J.L. Some Developments in Polypropylene Fibers for Concrete. ACI Symp. Public 1984, 81, 375–396. [Google Scholar] [CrossRef]
  15. Alhozaimy, A.M.; Soroushian, P.; Mirza, F. Mechanical properties of polypropylene fiber reinforced concrete and the effects of pozzolanic materials. Cem. Concr. Compos. 1996, 18, 85–92. [Google Scholar] [CrossRef]
  16. Allan, M.L.; Kukacka, L.E. Strength and durability of polypropylene fibre reinforced grouts. Cem. Concr. Res. 1995, 25, 511–521. [Google Scholar] [CrossRef]
  17. Bayasi, Z.; Zeng, J. Properties of Polypropylene Fiber Reinforced Concrete. ACI Mater. J. 1993, 90, 605–610. [Google Scholar] [CrossRef]
  18. Banthia, N.; Gupta, R. Influence of polypropylene fiber geometry on plastic shrinkage cracking in concrete. Cem. Concr. Res. 2006, 36, 1263–1267. [Google Scholar] [CrossRef]
  19. Bayasi, Z.; McIntyre, M. Application of Fibrillated Polypropylene Fibers for Restraint of Plastic Shrinkage Cracking in Silica Fume Concrete. ACI Mater. J. 2002, 99, 337–344. [Google Scholar] [CrossRef]
  20. Soroushian, P.; Mirza, F.; Alhozajiny, A. Plastic Shrinkage Cracking of Polypropylene Fiber Reinforced Concrete. ACI Mater. J. 1993, 92, 553–560. [Google Scholar] [CrossRef]
  21. Hamoush, S.; Abu-Lebdeh, T.; Cummins, T. Deflection behavior of concrete beams reinforced with PVA micro-fibers. Constr. Build. Mater. 2010, 24, 2285–2293. [Google Scholar] [CrossRef]
  22. Noushini, A.; Samali, B.; Vessalas, K. Effect of polyvinyl alcohol (PVA) fibre on dynamic and material properties of fibre reinforced concrete. Constr. Build. Mater. 2013, 49, 374–383. [Google Scholar] [CrossRef]
  23. Li, V.C.; Wu, C.; Wang, S.; Ogawa, A.; Saito, T. Interface tailoring for strain-hardening polyvinyl alcohol-engineered cementitious composite (PVA-ECC). ACI Mater. J. 2002, 99, 463–472. [Google Scholar] [CrossRef]
  24. Li, S.W.V.C.; Wu, C. Tensile Strain-Hardening Behavior of Polyvinyl Alcohol Engineered Cementitious Composite (PVA-ECC). ACI Mater. J. 2001, 98, 483–492. [Google Scholar] [CrossRef]
  25. Meng, D.; Huang, T.; Zhang, Y.X.; Lee, C.K. Mechanical behaviour of a polyvinyl alcohol fibre reinforced engineered cementitious composite (PVA-ECC) using local ingredients. Constr. Build. Mater. 2017, 141, 259–270. [Google Scholar] [CrossRef]
  26. Wu, C. Micromechanical Tailoring of PVA-ECC for Structural Applications; University of Michigan: Ann Arbor, MI, USA, 2001. [Google Scholar]
  27. Li, V.C.; Wang, S. Polyvinyl Alcohol Fiber Reinforced Engineered Cementitious Composites: Material Design and Performances. In Proceedings of the Int’l Workshop on HPFRCC Structural Applications; RILEM: Paris, France, 2006; pp. 65–73. [Google Scholar]
  28. López-Buendía, A.M.; Romero-Sánchez, M.D.; Climent, V.; Guillem, C. Surface treated polypropylene (PP) fibres for reinforced concrete. Cem. Concr. Res. 2013, 54, 29–35. [Google Scholar] [CrossRef]
  29. Fu, X.; Lu, W.; Chung, D.D.L. Ozone treatment of carbon fiber for reinforcing cement. Carbon N. Y. 1998, 36, 1337–1345. [Google Scholar] [CrossRef]
  30. Xu, Y.; Chung, D.D. Carbon fiber reinforced cement improved by using silane-treated carbon fibers. Cem. Concr. Res. 1999, 29, 773–776. [Google Scholar] [CrossRef]
  31. Carrino, L.; Moroni, G.; Polini, W. Cold plasma treatment of polypropylene surface: A study on wettability and adhesion. J. Mater. Process. Technol. 2002, 121, 373–382. [Google Scholar] [CrossRef]
  32. Iqbal, M.; Dinh, D.K.; Abbas, Q.; Imran, M.; Sattar, H.; Ahmad, A.U. Controlled Surface Wettability by Plasma Polymer Surface Modification. Surfaces 2019, 2, 26. [Google Scholar] [CrossRef] [Green Version]
  33. Johnson, V.S.; Zhu, W.; Wang, R.; Re, J.L.; Sivaram, S.; Mahoney, J.; Lopez, J.L. A Cold Atmospheric-Pressure Helium Plasma Generated in Flexible Tubing. IEEE 2011, 39, 2360–2361. [Google Scholar] [CrossRef]
  34. Buonopane, G.J.; Antonacci, C.; Lopez, J.L. Effect of cold plasma processing on botanicals and their essential oils. Plasma Med. 2016, 6, 315–324. [Google Scholar] [CrossRef]
  35. Homa, K.; Barney, W.P.; Davis, W.P.; Guerrero, D.; Berger, M.J.; Lopez, J.L.; Wyenandt, C.A.; Simon, J.E. Cold plasma treatment strategies for the control of fusarium oxysporum f. sp. basilici in sweet basil. HortScience 2021, 56, 42–51. [Google Scholar] [CrossRef]
  36. Zhu, W.; Lopez, J.L. A dc non-thermal atmospheric-pressure plasma microjet. Plasma Sources Sci. Technol. 2012, 21, 34018. [Google Scholar] [CrossRef]
  37. Becker, K.H.; Kersten, H.; Hopwood, J.; Lopez, J.L. Microplasmas: Scientific challenges & technological opportunities. Eur. Phys. J. D 2010, 60, 437–439. [Google Scholar] [CrossRef] [Green Version]
  38. Matveev, I.; Lopez, J.L. Guest Editorial Special Issue on Plasma-Assisted Technologies February 2020. IEEE Trans. Plasma Sci. 2020, 48, 329–331. [Google Scholar] [CrossRef]
  39. Matveev, I.; Lopez, J.L. Guest Editorial Special Issue on Plasma Assisted Technologies January 2019. IEEE Trans. Plasma Sci. 2019, 47, 41–43. [Google Scholar] [CrossRef]
  40. Matveev, I.; Lopez, J.L. Guest Editorial Special Issue on Plasma-Assisted Technologies March 2021. IEEE Trans. Plasma Sci. 2021, 49, 970–972. [Google Scholar] [CrossRef]
  41. ASTM C150/C150M-20. Standard Specification for Portland Cement; ASTM: West Conshohocken, PA, USA, 2020. [Google Scholar] [CrossRef]
  42. ASTM C 128-15. Standard Test. Method for Density, Relative Density (Specific Gravity), and Absorption of Fine Aggregate; ASTM Int.: West Conshohocken, PA, USA, 2015. [Google Scholar] [CrossRef]
  43. ASTM C33/C33M−18. Standard Specification for Concrete Aggregates; ASTM Int.: West Conshohocken, PA, USA, 2018. [Google Scholar] [CrossRef]
  44. ASTM C109M-20a. Standard Test. Method for Compressive Strength of Hydraulic Cement Mortars; ASTM: West Conshohocken, PA, USA, 2020. [Google Scholar]
  45. ASTM C305-14. Standard Practice for Mechanical Mixing of Hydraulic Cement Pastes and Mortars; ASTM: West Conshohocken, PA, USA, 2020. [Google Scholar]
  46. ASTM C348-20. Standard Test. Method for Flexural Strength of Hydraulic-Cement Mortars; ASTM: West Conshohocken, PA, USA, 2020. [Google Scholar]
Figure 1. Water droplet adhesion on hydrophobic (a) and hydrophilic (b) fiber.
Fibers 09 00062 g001
Figure 2. (a) Schematic of the experimental setup used to generate and monitor the continuous operation of the cold plasma jet in atmospheric air. (b) Measurement picture of side-by-side comparison of a centimeter (cm) ruler to the cold plasma jet effluent used to treat the polymer fibers.
Fibers 09 00062 g002
Figure 3. Cold plasma treatment process.
Fibers 09 00062 g003
Figure 4. Loading Schematic for Flexural Specimens.
Fibers 09 00062 g004
Figure 5. Force–displacement curves for PP and PV fiber specimens with different fiber treatment times tested in compression (a,b) and comparison between PP and PV s with different fiber treatment times tested in compression (c,d).
Fibers 09 00062 g005aFibers 09 00062 g005b
Figure 6. Ratio of force at various displacements vs. peak force.
Fibers 09 00062 g006
Figure 7. Force–displacement plots for PP (a,b) and PV fiber specimens (c,d) with different fiber treatment times tested in flexure.
Fibers 09 00062 g007
Figure 8. Force–displacement plots comparing flexural PP and PV fiber specimens at 0 and 30 s (a) and 60 and 120 s (seconds) (b).
Fibers 09 00062 g008
Figure 9. Residual load capacity at various displacements for flexural fiber specimens.
Fibers 09 00062 g009
Figure 10. Scatter plots showing Treatment Time vs. Pδ/Pmax.
Fibers 09 00062 g010
Table 1. Cement oxide analysis.
OxideWeight (%)
Na2O0.21
MgO2.75
Al2O33.73
SiO220.50
P2O50.22
SO32.90
Cl0.05
K2O0.77
CaO62.43
TiO20.19
Cr2O30.06
MnO0.23
Fe2O33.34
CuO*
ZnO0.14
SrO0.22
ZrO2*
LOI **
Total100.00
* Oxide amount was below detection limits.
Table 2. Mixture Design.
Mix ReferenceFiber TypeFiber Volume (%)Treatment Time (s)w/cm
ControlNoneNoneN/A0.45
PP0Polyproylene200.45
PP30Polyproylene2300.45
PP60Polyproylene2600.45
PP120Polyproylene21200.45
PV0Polyvinyl Alcohol200.45
PV30Polyvinyl Alcohol2300.45
PV60Polyvinyl Alcohol2600.45
PV120Polyvinyl Alcohol21200.45
Table 3. Peak compressive strength (𝜎max).
Mixture Reference𝜎max (kN)
Control135.36
PP0117.54
PP30111.33
PP60112.17
PP120114.90
PV0121.43
PV30123.93
PV60124.44
PV120117.23
Publisher’s Note: MDPI stays neutral with regard to jurisdictional claims in published maps and institutional affiliations.

