
Angle-Resolved Hollow-Core Fiber-Based Curvature Sensing Approach
by
 ,
,
William M. Guimarães
1, 
Cristiano M. B. Cordeiro
2,*,
Marcos A. R. Franco
1 and
Jonas H. Osório
2 1
Institute for Advanced Studies (IEAv), São José dos Campos 12228-001, Brazil
2
Institute of Physics “Gleb Wataghin”, University of Campinas (UNICAMP), Campinas 13083-859, Brazil
*
Author to whom correspondence should be addressed.
Fibers 2021, 9(11), 72; https://0-doi-org.brum.beds.ac.uk/10.3390/fib9110072
Submission received: 9 October 2021
/
Revised: 28 October 2021
/
Accepted: 2 November 2021
/
Published: 4 November 2021
Abstract
:We propose and theoretically study a new hollow-core fiber-based curvature sensing approach with the capability of detecting both curvature radius and angle. The new sensing method relies on a tubular-lattice fiber that encompasses, in its microstructure, tubes with three different thicknesses. By adequately choosing the placement of the tubes within the fiber cross-section, and by exploring the spectral shifts of the fiber transmitted spectrum due to the curvature-induced mode field distributions’ displacements, we demonstrate a multi-axis curvature sensing method. In the proposed platform, curvature radii and angles are retrieved via a suitable calibration routine, which is based on conveniently adjusting empirical functions to the fiber response. Evaluation of the sensing method performance for selected cases allowed the curvature radii and angles to be determined with percentual errors of less than 7%. The approach proposed herein provides a promising path for the accomplishment of new curvature sensors able to resolve both the curvature radius and angle.
1. Introduction
The great and growing interest in hollow-core photonic crystal fiber (HCPCF) technology motivates intense research efforts by the photonics community. The prospects of HCPCFs’ applications in both fundamental and applied fields allow them to be identified as a truly enabling technology that will provide a new landscape for next-generation optical devices [1]. Indeed, such a new framework for the development of the next-generation HCPCF-based devices has been provided by the recent endeavors on the optimization of both the HCPCF designs and fabrication methods which, in turn, have entailed an expressive reduction of the attenuation values in the infrared [2,3,4], visible, and ultraviolet ranges [5,6,7].
Among the application opportunities, which encompass, for example, the development of novel optical sources and atom optics experiments [8,9,10], the field of optical sensors acquires a prominent position within HCPCF technology due to the broad set of parameters that can be potentially monitored [11]. HCPCFs have been demonstrated, for example, to be a promising platform for probing concentrations of chemical species in gaseous and liquid samples [12,13,14,15,16,17,18]. Additionally, they have been employed in gyroscopes [19,20] and in strain and curvature sensing experiments [21,22].
Very recently, we proposed a new single-ring tubular-lattice (SR-TL) HCPCF whose microstructure comprises a ring of tubes with five different thicknesses and demonstrated that its transmission characteristics are dependent on the applied curvature and its direction [23]. While the fiber sensing community dedicates important efforts to the development of curvature sensors (via the utilization, e.g., of long-period and Bragg gratings, multimode interference, and Mach–Zehnder and Sagnac interferometers [24,25,26,27,28,29,30]), this new fiber structure, together with other technologies such as off-centered core fibers [31] and multicore fibers [32], represents a promising opportunity for the realization of directional curvature sensing. Moreover, this novel structure identifies a new avenue for the utilization of HCPCF with structural asymmetries, formerly employed to explore birefringent and polarizing HCPCFs [33,34], as well as to alter the transmission loss hierarchy of the modes guided through the fiber core [35].
In this context, we here simplify our recently reported SR-TL HCPCF by proposing and theoretically studying a new fiber structure that encompasses a ring of tubes with three different thicknesses. Having three different thicknesses within the fiber structure (instead of five, as previously proposed in [23]), identifies a significant simplification path considering the fabrication viability of the fiber and, therefore, represents an important advancement concerning its future experimental realization.
In the fiber proposed herein, by judiciously choosing the position of the tubes with different thicknesses within the fiber microstructure, we obtain an azimuthally asymmetric HCPCF endowed with a curvature-sensitive and angle-resolved (direction-resolved) transmission response. Indeed, the dependence of the fiber transmission characteristics on the curvature radii and angles is attributed to the curvature-induced displacements of guided-mode field distribution within the fiber core [23]. Additionally, as the core of the fiber reported here sits at the fiber geometrical center, its integration with standard optical fibers could be potentially simplified compared to multicore and surface-core fiber-based directional curvature sensors [31,32]. Indeed, as recently reported in the literature, current HCPCF technology allows for the realization of high-quality interconnections between HCPCFs and standard solid-core optical fibers either by splicing [36] or gluing [37]. More specifically, the splicing of HCPCFs and standard optical fibers can be performed by following a reverse tapering technique [38], which allows the guided modes between the interconnected fibers to be adiabatically transferred by achieving suitable mode-matching conditions.
To study the sensing capabilities of the proposed fiber, we report on a calibration routine based on conveniently fitting the spectral shifts of the transmission spectra for different curvature radii and angles. By employing our methods, we demonstrate a multi-axis HCPCF-based curvature sensing approach, able to retrieve both the curvature radius and angle. We understand that the new and simplified fiber structure reported herein, together with the proposition and demonstration of the calibration methods for retrieving the curvature radius and angle, provides a further step to the assessment of the curvature-dependent response of azimuthally asymmetric HCPCFs and a promising path for the accomplishment of novel angle-resolved curvature sensors.
The manuscript is organized as follows. We start by exposing the proposed fiber structure and its design rationale. Next, we provide details on the simulation setup and the conventions which have been adopted to study the sensing method characteristics. Finally, we investigate the fiber’s curvature-dependent response, describe the calibration routine, and perform tests to demonstrate the sensing approach’s operation and effectiveness.
2. Materials and Methods
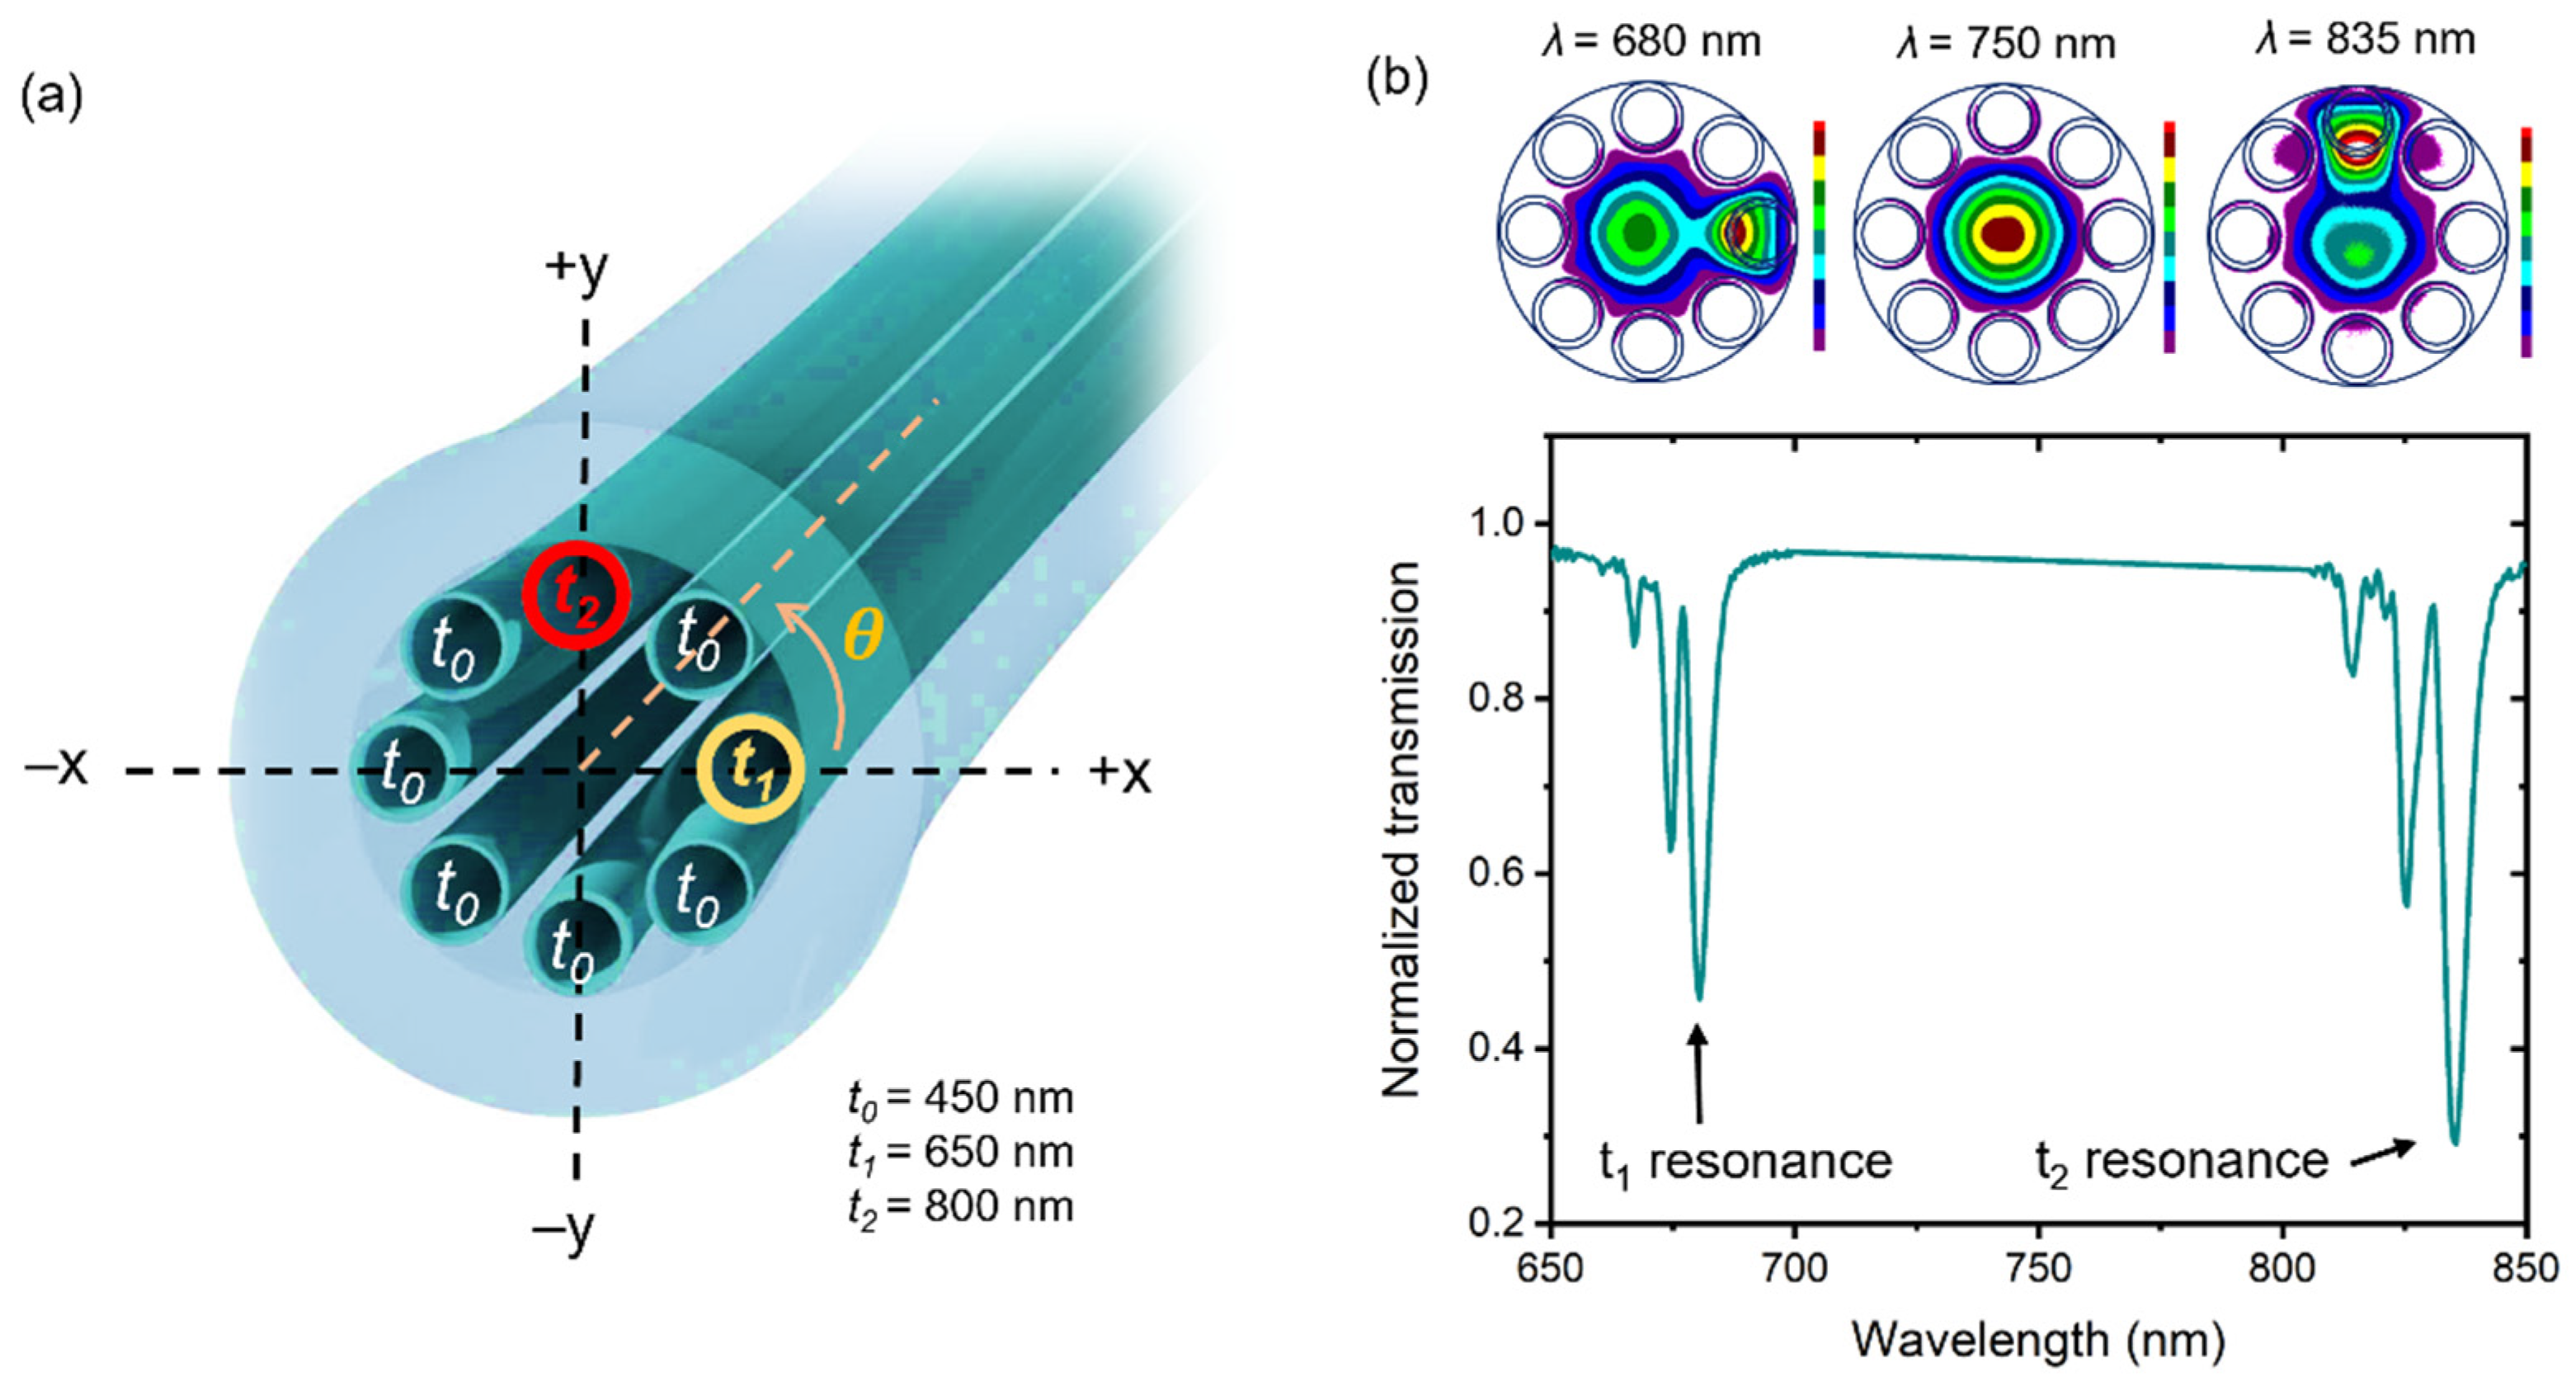
Figure 1a presents a diagram of the fiber structure we propose herein. It consists of an SR-TL HCPCF whose cladding displays tubes with three different thicknesses: t0, t1, and t2. The tubes with thicknesses t1 and t2 are placed in orthogonal directions within the fiber microstructure (tubes represented in yellow and red in Figure 1a). Such a configuration of cladding tubes allows for a curvature-dependent fiber transmission spectrum to be obtained and for an angle-resolved curvature sensing approach to be attained, as will be detailed in the following. The curvature radius is defined as R and the curvature angle (i.e., the direction of the curvature with respect to the fiber cross-section) is represented by θ (as illustrated in Figure 1a). In the simulations to be described in the following, the core diameter (DC) was set as 20 μm (which entails a mode field diameter, MFD, of approximately 15.7 μm, [39]). The diameter of the cladding tubes, Dt, was chosen to be 9 μm. Under our convention, θ = 0° refers to the situation in which the center of the curvature is located in the +x direction, and θ = 90° stands for a curvature whose center lies in the +y direction. Analogously, θ = 180° refers to a curvature which has its center in the −x direction and θ = 270° means a curvature with center in the −y direction.
The guidance of light in SR-TL HCPCFs relies on the minimization of the coupling between the core and cladding modes [40,41]. At specific wavelengths, strong coupling between the core mode and the cladding tubes’ modes occurs, and high-loss spectral intervals are observed in the fiber transmission spectrum. Such high-loss wavelengths (resonances), , are described by , where t is the thickness of the cladding tubes, n1 is the refractive index of the core, n2 is the refractive index of the cladding material, and m is the resonance order. Here, we consider n1 = 1 (for air) and n2 = 1.45 (for silica). The value of n2 = 1.45 was used in the simulations for simplicity as, within the wavelength range considered in the simulations (from 650 nm to 850 nm), the refractive index of silica varies from 1.4565 to 1.4525 [42]. The thickness of the cladding tubes determines the resonant wavelengths and, hence, the spectral positions of the high-loss regions in the fiber transmission spectrum. For the fiber proposed herein, as the tubes in the fiber structure display three different thicknesses, several resonances are expected to appear in the fiber transmission spectrum.
Figure 1b presents a typical transmission spectrum of the fiber structure represented in Figure 1a when t0 = 450 nm, t1 = 650 nm, and t2 = 800 nm (for a straight fiber). Here, it is worth observing that the choice of the thicknesses of the cladding tubes is constrained to two aspects. The first one considers that the thicknesses of the tubes must provide sufficiently separated resonances in the fiber transmission spectrum (so it does not hinder the identification of the resonances’ shifts when performing the sensing studies). The second aspect considers the fabrication tolerances in state-of-the-art HCPCF (~1% cross-sectional tube thickness variation [43]). The thicknesses t0, t1, and t2 used in the simulations reported herein meet these two constraints.
The simulation was carried out by using the beam propagation method (BPM) and by considering a fiber length of 1 mm. This fiber length, to be maintained in all the simulations in this manuscript, was chosen as a good compromise between the computational cost for the simulations while still being reasonably large to allow for adequate observation of the high loss regions in the fiber transmission spectrum and suitable characterization of the optical response of the fiber. In this context, a plausible path towards a practical realization of the sensor would be to splice a millimeter-long HCPCF section in between standard solid-core optical fibers, as this method would allow for the high loss transmission spectral regions to be suitably assessed and for the curvature conditions to be applied to the fiber. Indeed, the routines for splicing short fiber lengths are well established in multimode interference devices technology [44,45] and could be customized for HCPCF. Additionally, the recent results on high-quality HCPCF interconnections [36,37] demonstrate that the fiber proposed in this manuscript can be adequately integrated with standard solid-core optical fibers.
Insets in Figure 1b display the simulated intensity distributions at the fiber output at selected wavelengths. Around λ = 680 nm, coupling between the core mode and the modes in the tube with thickness t1 occurs (tube at +x direction). Analogously, around λ = 835 nm, coupling between the core mode and the modes in the tube with thickness t2 takes place (tube at +y direction). Around λ = 750 nm, the guided mode is highly confined into the fiber core, as, at this wavelength, robust inhibition of the coupling between the core and cladding modes is achieved.
3. Results
3.1. The Fiber’s Bend-Dependent Response
As demonstrated in our previous work [23], when the fiber is bent, the curvature-induced mode field displacements entail blueshifts or redshifts in the resonances’ spectral positions. Indeed, the shifting of the resonances’ wavelengths is determined by the displacement trend of the mode field distribution inside the fiber core due to the curvature. Here, we recall that, as studied in [23], bending the fiber causes the intensity distribution of the core-guided modes to shift towards the outer side of the curvature, as typically observed in SR-TL HCPCF [46,47].
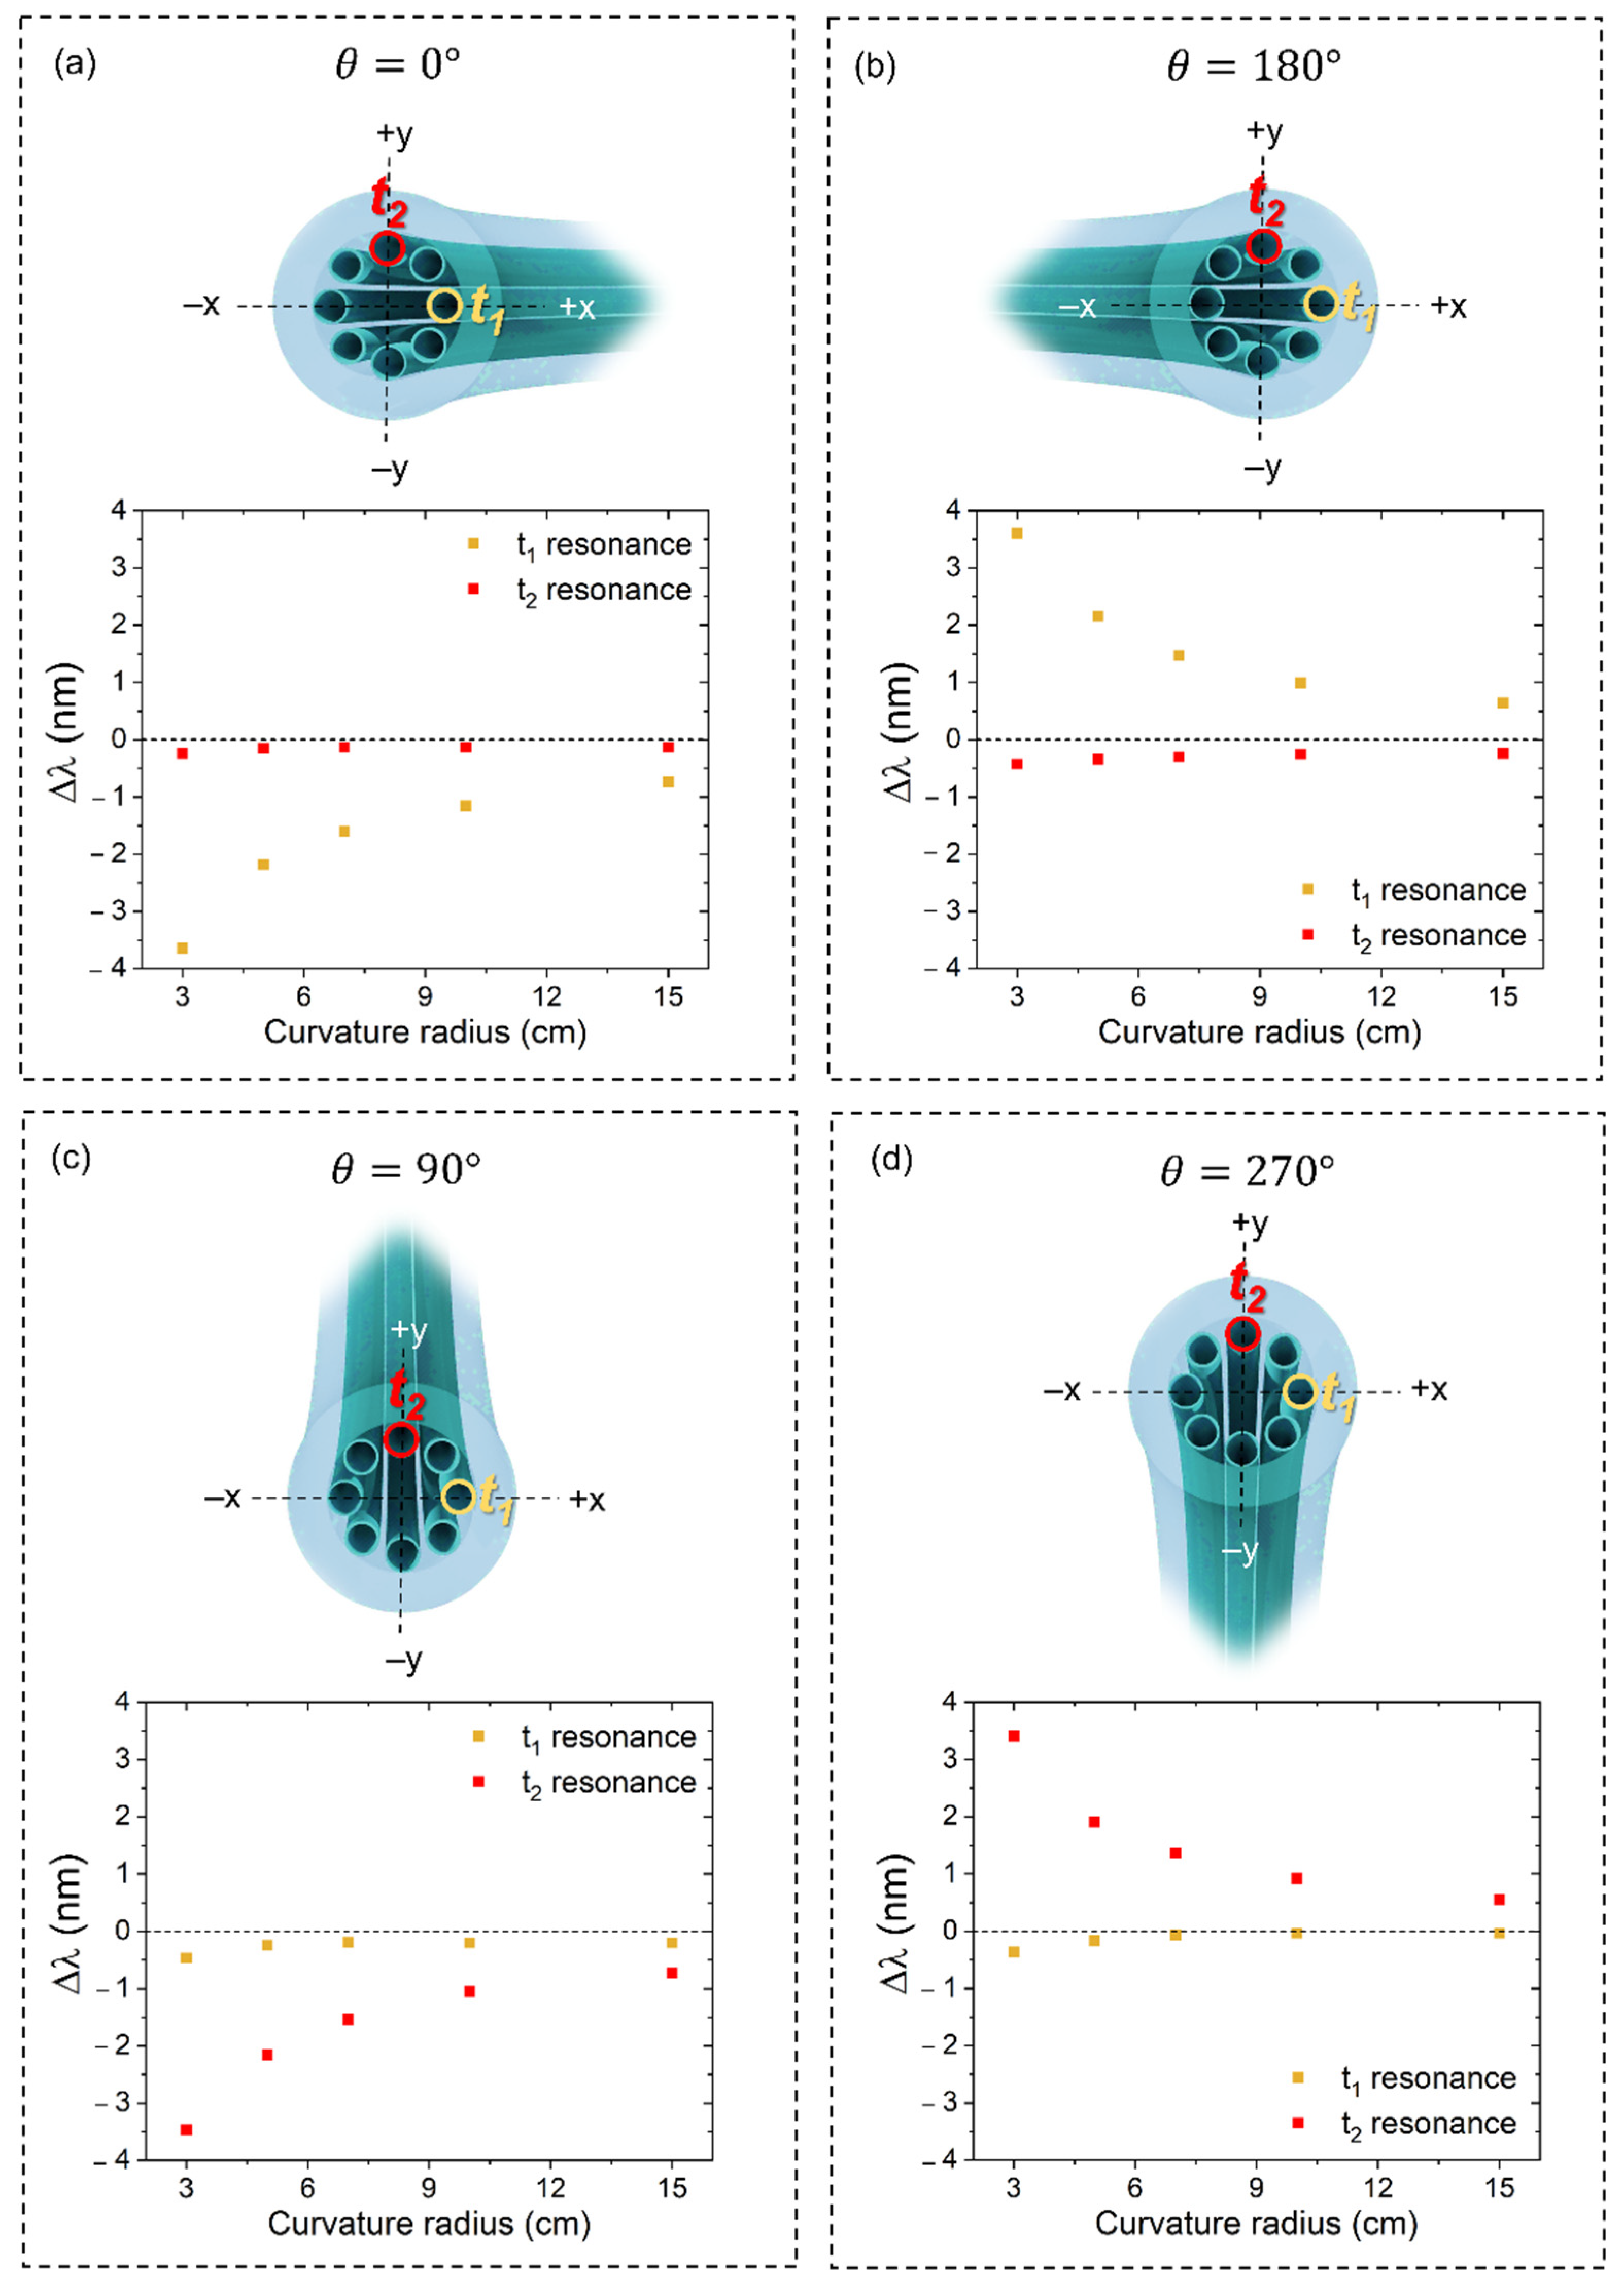
Figure 2 presents the simulated wavelength shifts (Δλ) associated with t1 and t2 resonances (around λ = 680 nm and λ = 835 nm, respectively) for different curvature radii and representative curvature angles θ. The spectral shifts presented in Figure 2 are defined as , where is stands for the resonant wavelength for a fiber bent at a curvature radius R and angle θ, and denotes the resonant wavelength for the straight fiber. In a hypothetical experimental realization of the sensor, Δλ could be determined by coupling broadband light into the fiber core and by following the resonances’ wavelength shifts in the fiber transmission spectrum.
In Figure 2, we observe that, depending on the curvature angle and radius, the resonance spectral positions can be shifted towards shorter (Δλ < 0) or longer wavelengths (Δλ > 0) in comparison with the resonance spectral position when the fiber is straight (Δλ = 0). For example, when the center of curvature lies on the +x direction (θ = 0°), the guided mode intensity distribution is displaced away from the tube with thickness t1 and the resonance around 680 nm (t1 resonance) blueshifts for smaller R (Figure 2a). Otherwise, when the center of the curvature rests in the –x direction (θ = 180°), the guided mode intensity distribution is displaced towards the tube with thickness t1, and the resonance associated with the tube with thickness t1 redshifts for smaller R (Figure 2b).
An analog behavior is observed for the spectral shifts associated with the resonances of the tube with thickness t2. When the center of curvature lies in the +y direction (θ = 90°), the guided mode intensity distribution is displaced away from the tube with thickness t2 and its correspondent resonance blueshifts when R decreases (Figure 2c). Otherwise, when the center of curvature rests in the −y direction (θ = 270°), the guided mode intensity distribution is displaced towards the tube with thickness t2 and the resonance associated with the tube with thickness t2 redshifts for reduced R (Figure 2d). Remarkably, one observes a weak impact on the spectral positions of the resonances when the curvature direction is orthogonal to the tubes’ location within the fiber microstructure (i.e., t1 resonance mildly shifts for θ = 90° and θ = 270°, and t2 resonance slightly shifts for θ = 0° and θ = 180°).
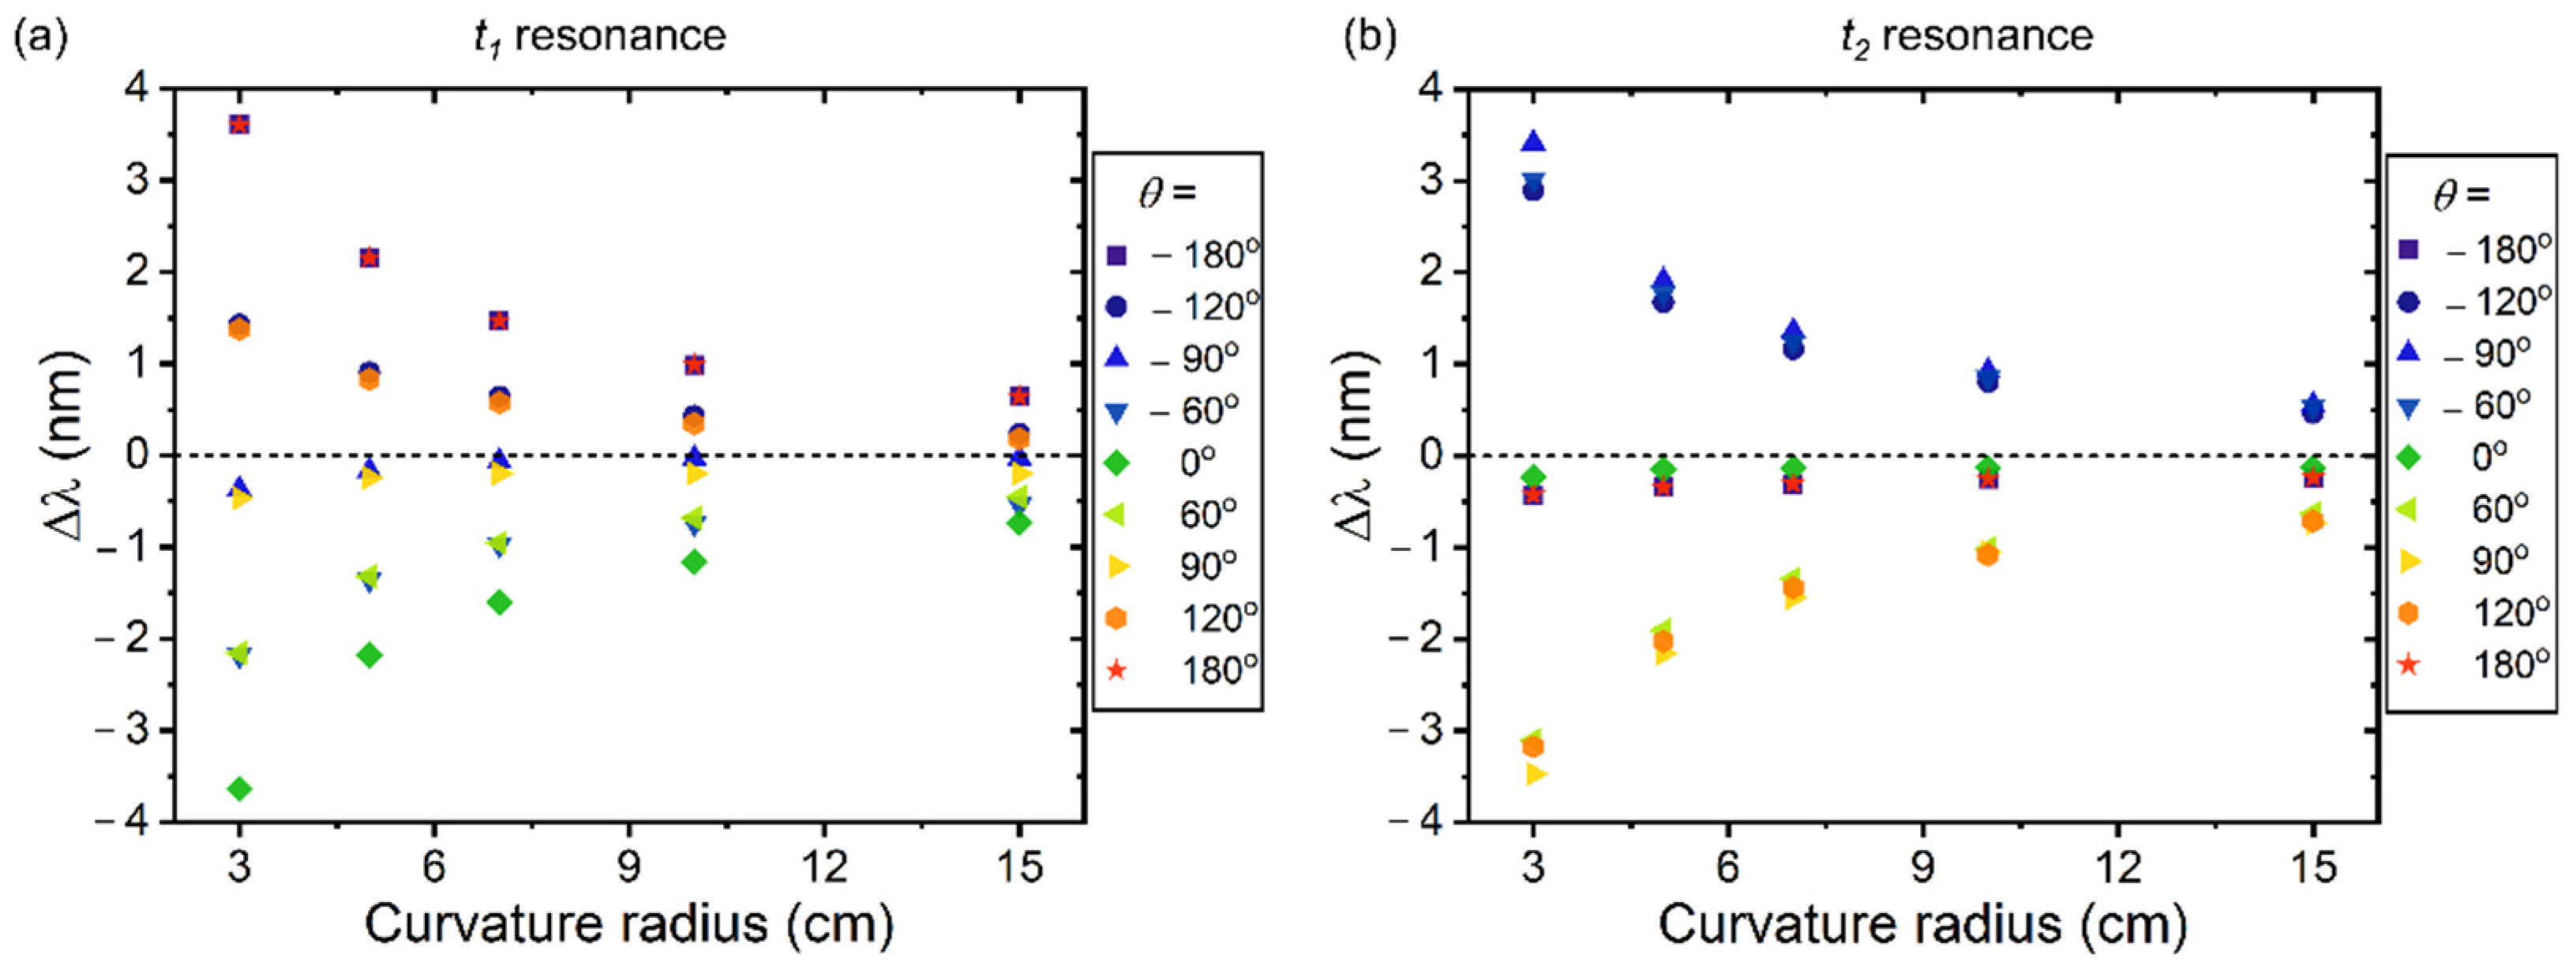
Additionally, it is worth mentioning that altering the curvature angle for a fixed curvature radius also implies shifting of the spectral positions of the tubes’ resonances. To exemplify such a situation, we show, in Figure 3, the wavelength shifts of the resonances associated with t1 and t2 as a function of the curvature radius for representative curvature angles. By observing the data in Figure 3a (corresponding to the wavelength shifts associated with the resonance of the cladding tube with thickness t1) at the curvature radius of 3 cm, for example, one sees that Δλ values vary from −3.64 nm when θ = 0° to −0.47 nm when θ = 90° and to 3.60 nm when θ = 180°. In turn, data in Figure 3b (corresponding to the wavelength shifts associated with the resonance of the cladding tube with thickness t2) at the curvature radius of 3 cm show that Δλ values change from –0.23 nm when θ = 0° to −3.47 nm when θ = 90° and to −0.46 nm when θ = 180°. The results in Figure 3 also show that the variation of Δλ values due to changes in θ is smaller for larger curvature radii.
3.2. Calibration of the Fiber Response
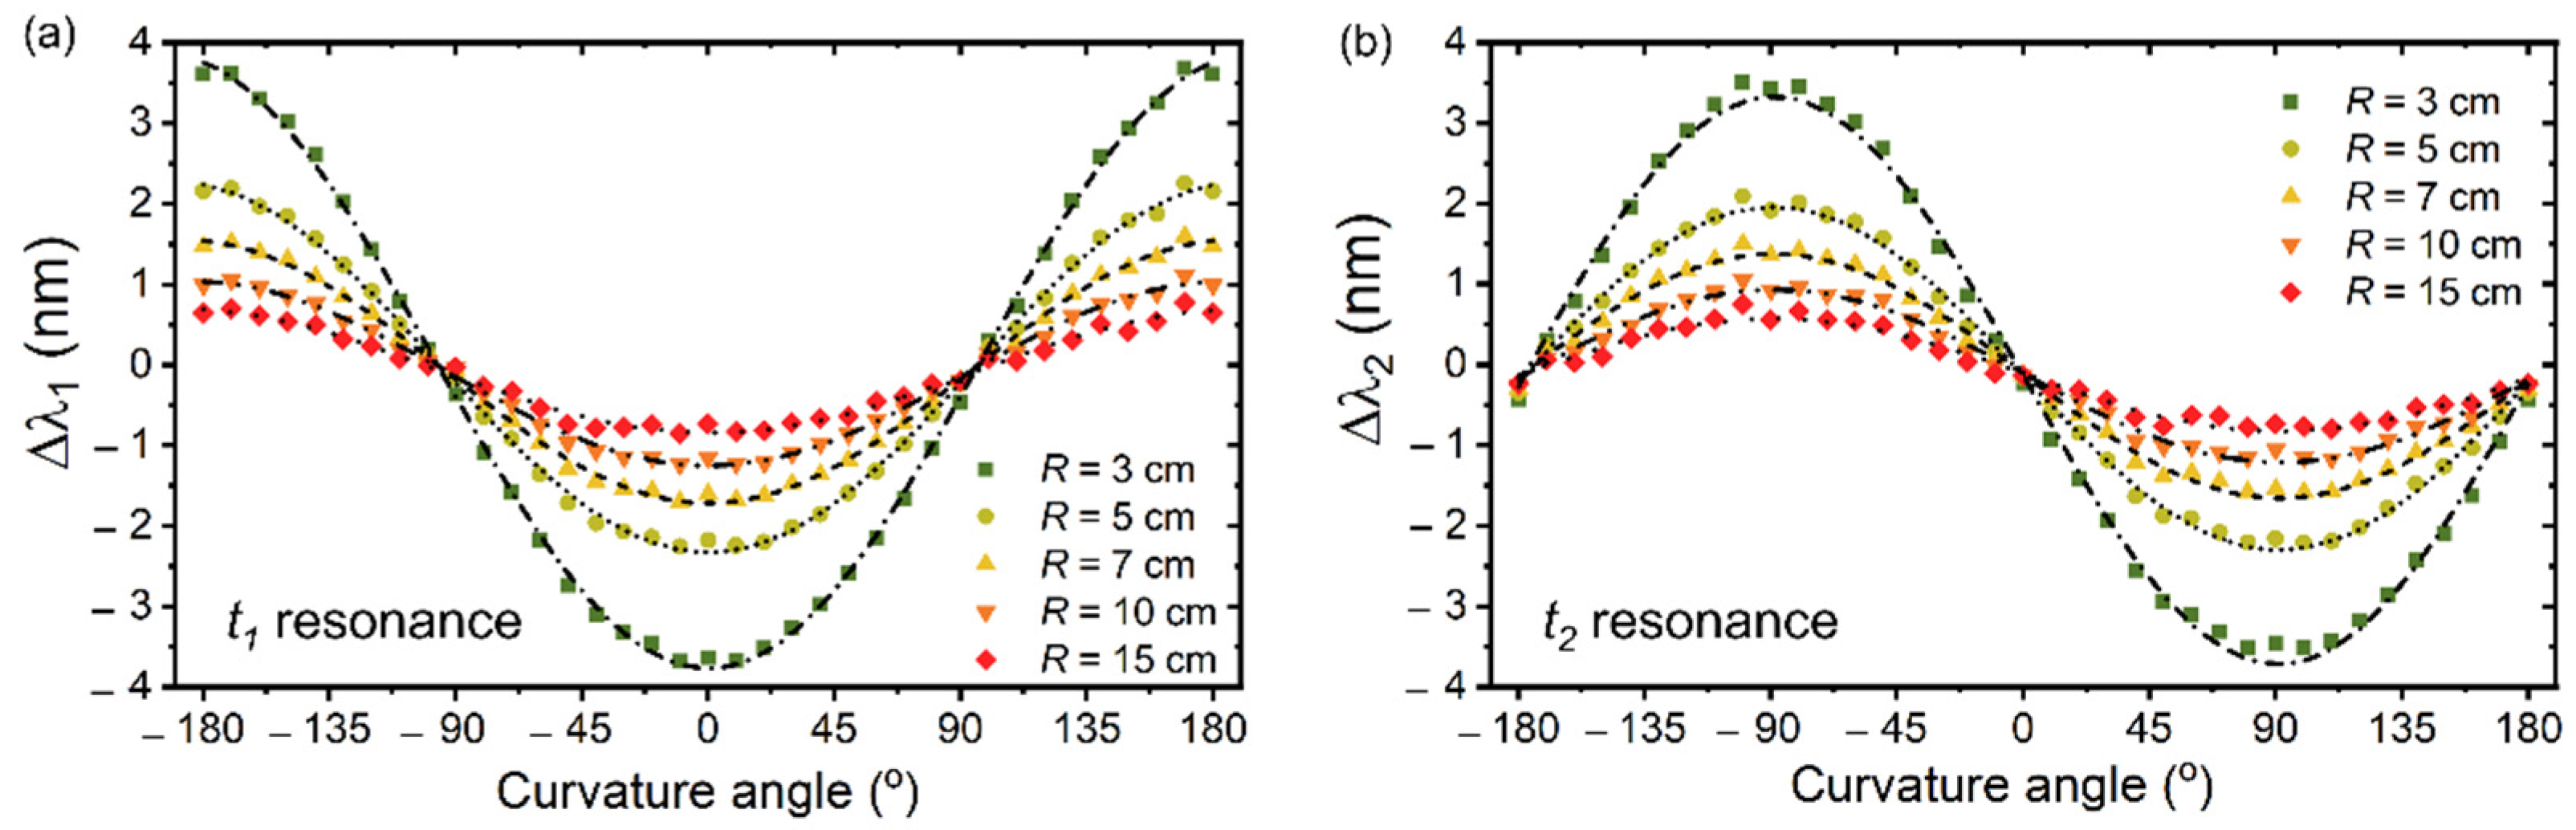
Figure 4 consolidates the spectral shifts of the resonances around λ1 = 680 nm and λ2 = 835 nm (identified as Δλ1 and Δλ2, respectively) for θ between −180° and 180° and R = 3 cm, 5 cm, 7 cm, 10 cm, and 15 cm. The data in Figure 4 allow for the calibration of the fiber optical response by conveniently fitting Δλ for different R and θ. Here, we empirically chose a sinusoidal fitting function, as shown in Equation (1), to account for Δλ. The choice of the function in Equation (1) was driven by the observation of the sinusoidal trend of the data points in Figure 4. In Equation (1), Δλ0, Λ, θ0, and δ are fitting parameters. The fitted functions are presented as dashed and dotted lines in Figure 4. The coefficients of determination (R2) associated with the fits ranged from 0.987 to 0.999 for t1 resonance and from 0.972 to 0.977 for t2 resonance.
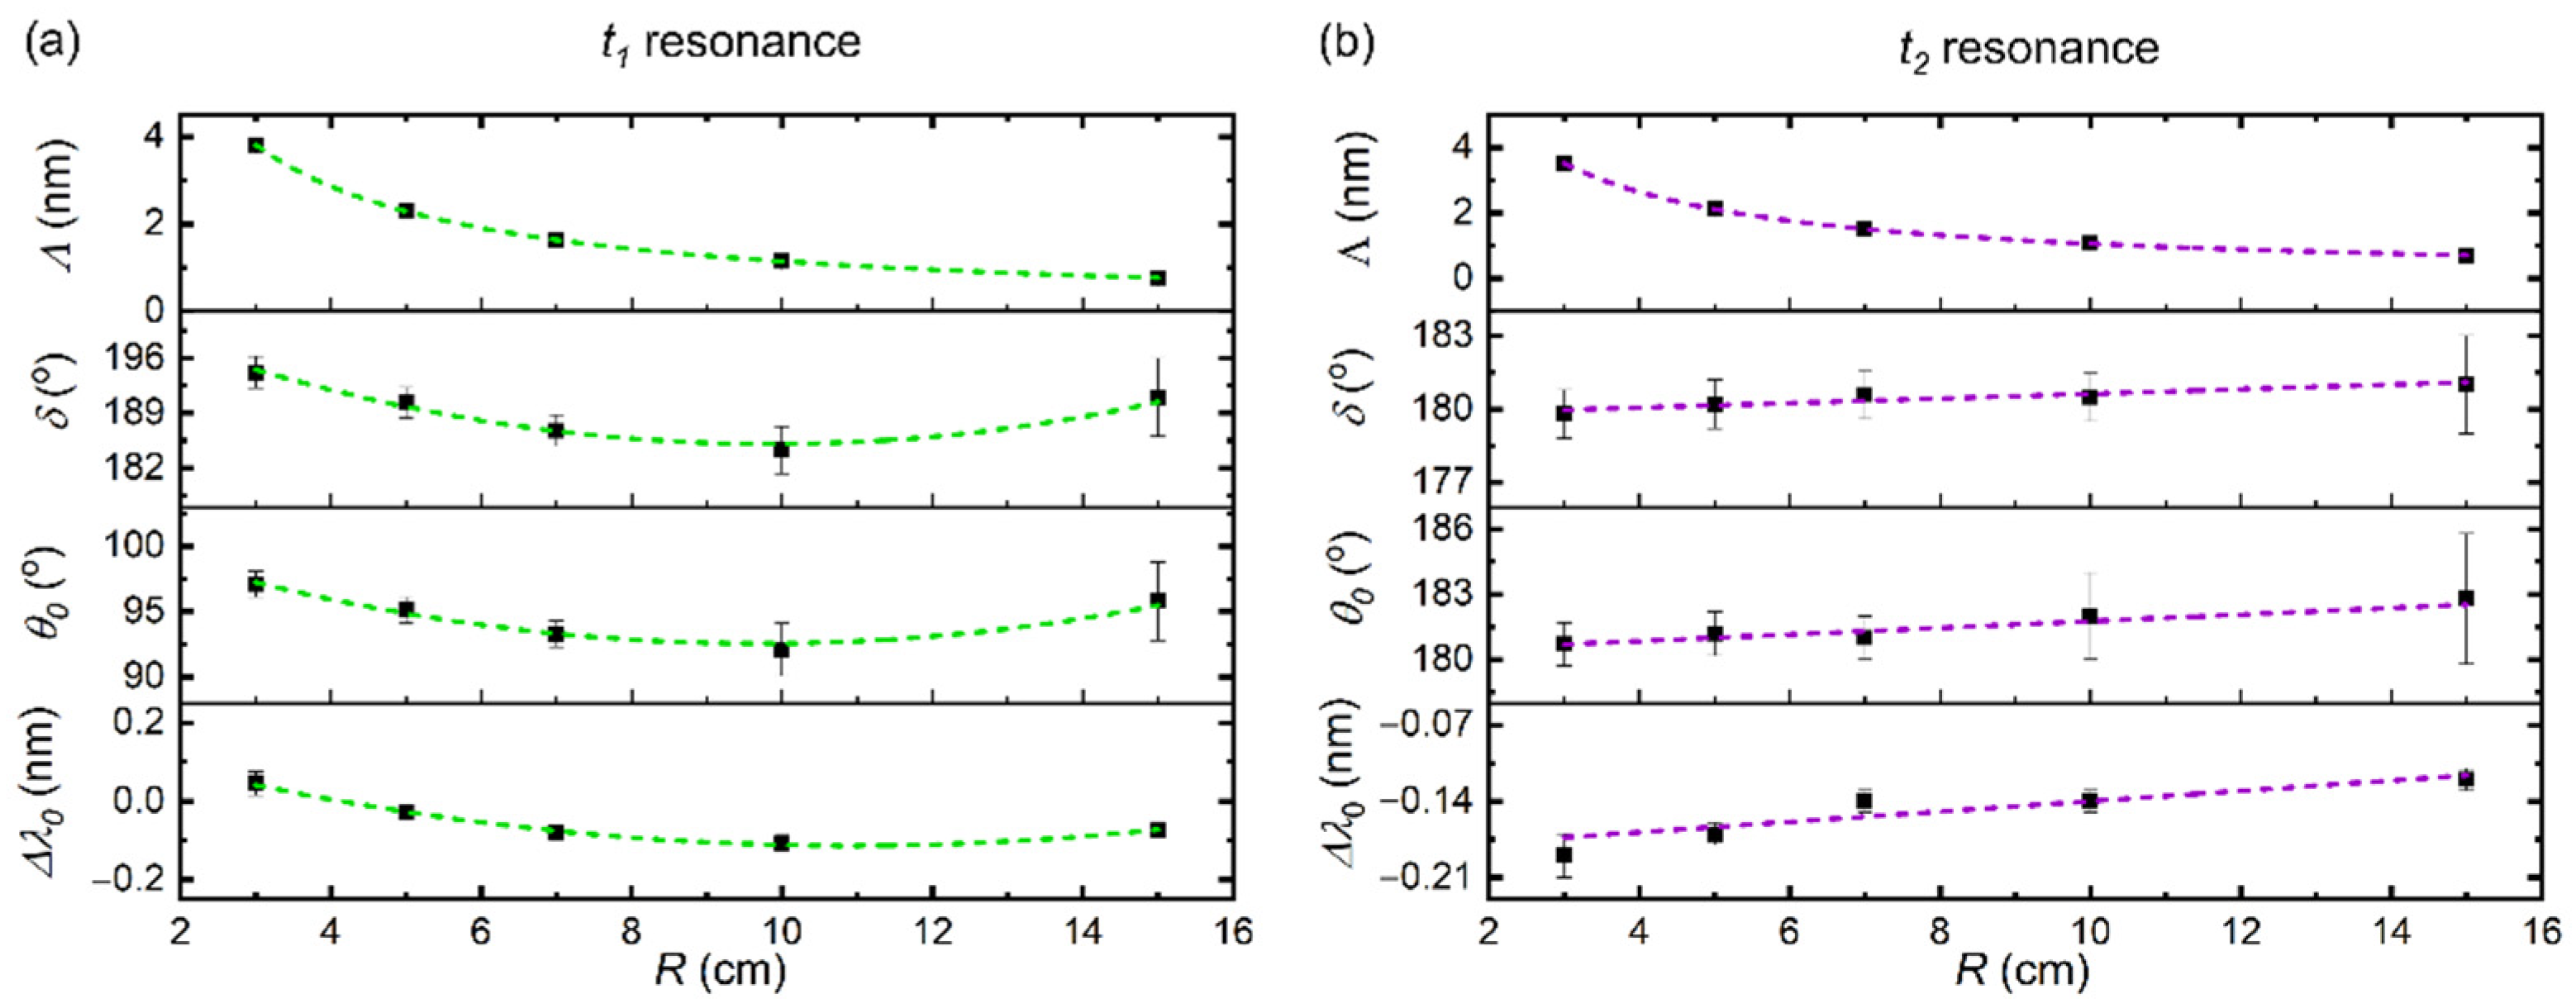
To attain a suitable calibration of the fiber optical response, the parameters Δλ0, Λ, θ0, and δ can be plotted as a function of R and fitted by using empirical functions. Figure 5 exhibits graphs of Δλ0, Λ, θ0, and δ as a function of R, together with the fitting curves. Table 1 shows the fitting functions which have been used to adjust Δλ0, Λ, θ0, and δ trends as a function of R. It is worth observing that Λ is related to the amplitudes of the wavelength shifts and δ to the conversion between radians and degrees. In turn, θ0 accounts for the cosine-like and sine-like behaviors of Δλ1 and Δλ2, respectively.
As the dependency of Δλ0, Λ, θ0, and δ with R was obtained by the fitting curves in Figure 5, one can assume Δλ0, Λ, θ0, and δ as functions of R and, thus, rewrite Equation (1) by considering Δλ as a function of R and θ. Therefore, we obtain Equation (2), where Δλ0(R), Λ(R), θ0(R), and δ(R) are the fitted functions.
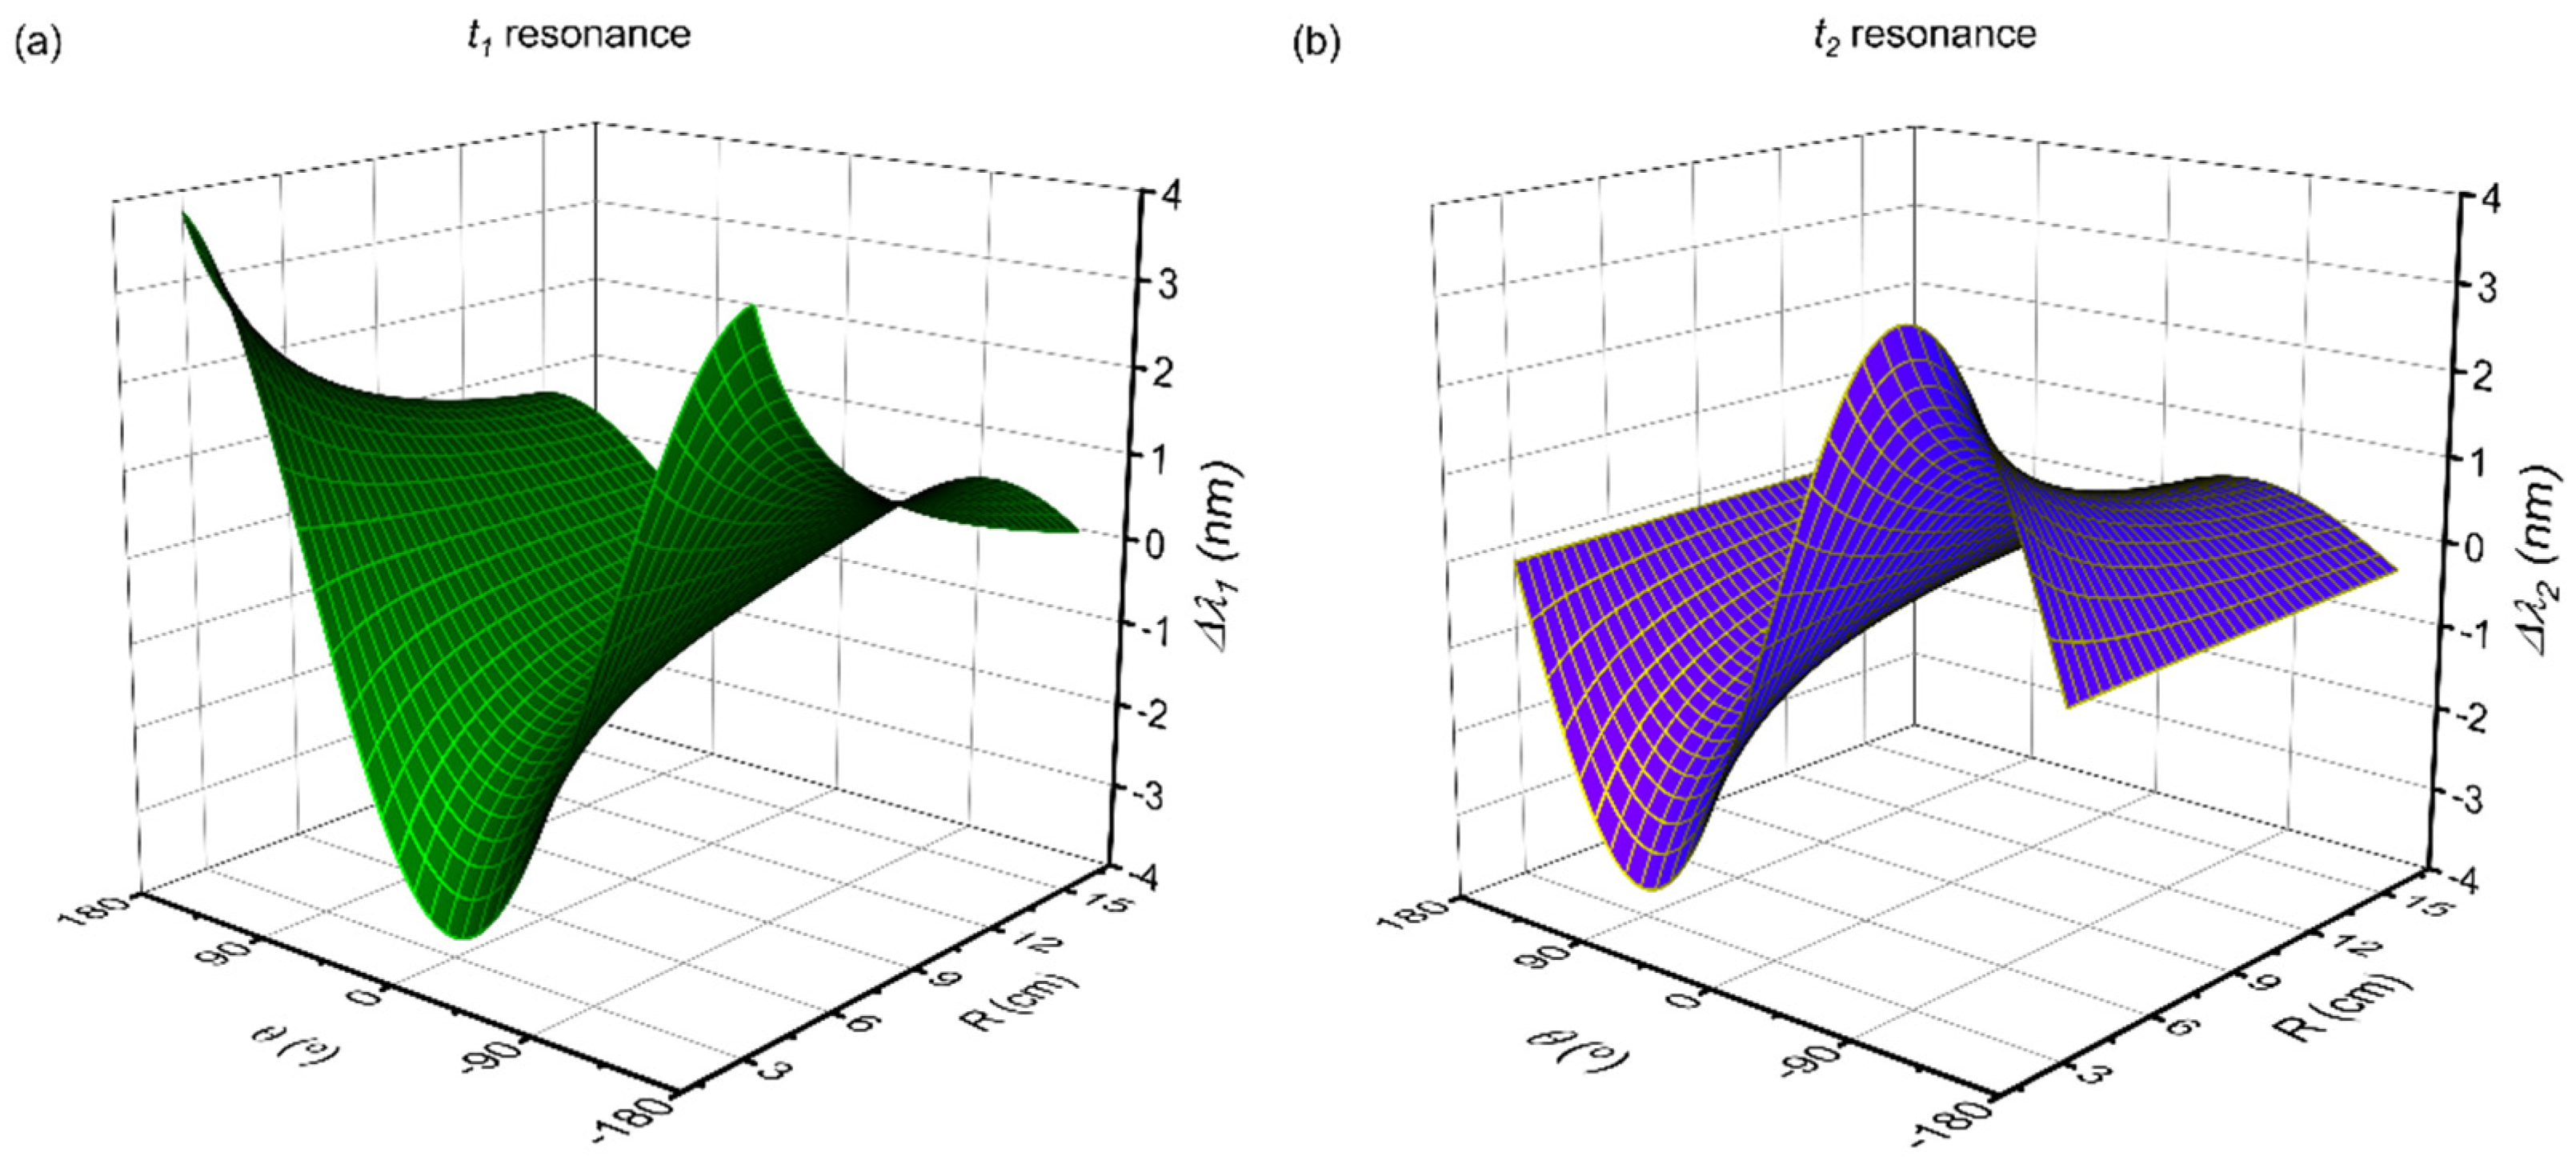
Figure 6 shows the 3D plots for , associated with the resonances around λ1 = 680 nm and λ2 = 835 nm − and , respectively, which have been calculated by considering Equation (2) and the adjusted functions. Indeed, these plots are the basis of the sensing operation principle reported herein, which relies on considering the pair (Δλ1, Δλ2) and associating it with the bending radius and angle univocally. The analytical functions shown in Figure 6 are, thus, the calibration curves of the sensor response. Indeed, the plots in Figure 6 are strongly correlated to the ones shown in Figure 4, from which the fitting parameters have been determined.
4. Discussion
To demonstrate the sensing technique’s operation and its effectiveness, we studied a set of situations by comparing, for selected values of R and θ, the corresponding wavelength shifts that were calculated from the BPM simulations and the ones that were reported from the fitted functions. In the studied cases, we considered R and θ values which were different from the ones employed in the system calibration fittings, but which were within the calibration interval, i.e., 3 cm < R < 15 cm and −180° < θ < 180°.
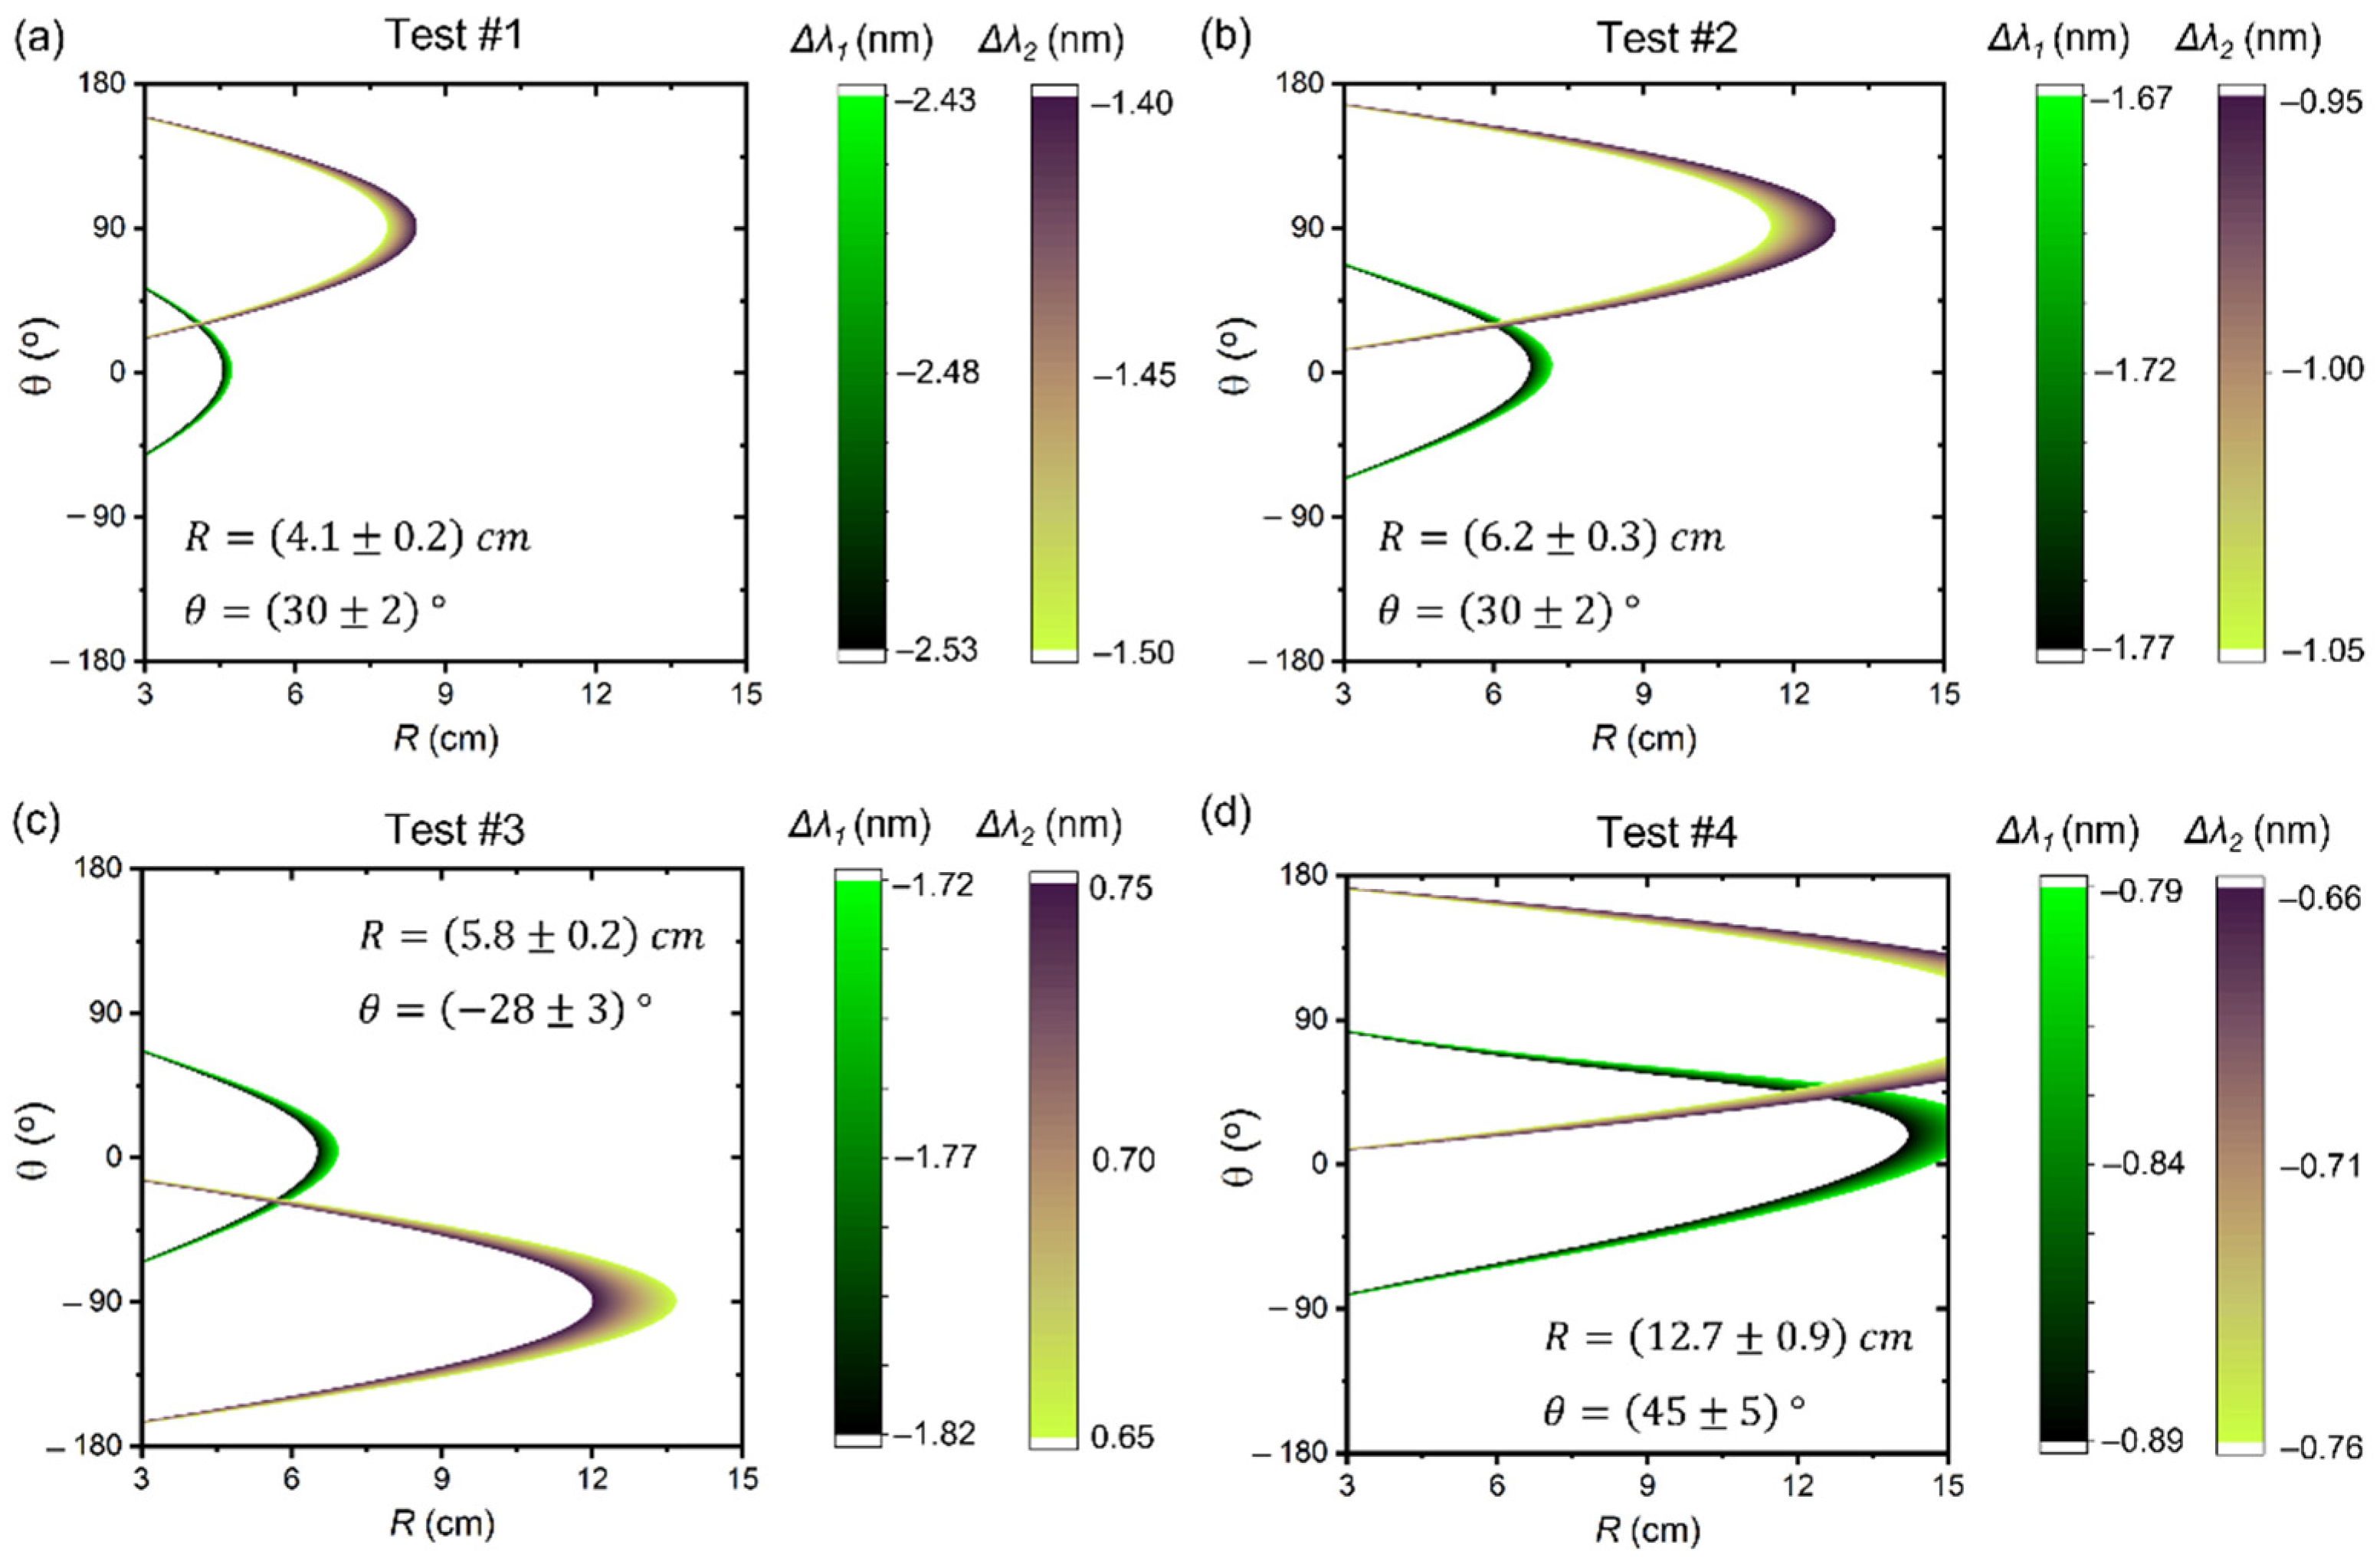
Figure 7 illustrates the method for obtaining R and θ from Δλ1 and Δλ2. The first studied case (Test #1, Figure 7a) considers that, in a hypothetical measurement, Δλ1 and Δλ2 have been measured as Δλ1 = (2.48 ± 0.05) nm and Δλ2 = (−1.45 ± 0.05) nm. By intersecting the latter Δλ1 and Δλ2 values with system calibration curves (as shown in Figure 6), we obtained the 2D color plots shown in Figure 7a, which maps the R and θ that could correspond to the considered Δλ1 and Δλ2. The intersecting region between the Δλ1 and Δλ2 plots readily communicates the R and θ values expected from the calibration. For the Δλ1 and Δλ2 values used in this example, the calibration allowed for the determination of R = (4.1 ± 0.2) cm and θ = (30 ± 2)°. Indeed, the BPM simulations using R = 4.0 cm and θ = 30° yielded Δλ1 = −2.48 nm and Δλ2 = −1.45 nm. Therefore, the method reported herein allows for R and θ to be obtained via the knowledge of Δλ1 and Δλ2.
Figure 7 also shows three other examples of the sensing method operation. In Figure 7b, we assume that a hypothetical measurement allowed Δλ1 = (−1.72 ± 0.05) nm and Δλ2 = (−1.00 ± 0.05) nm (Test #2) to be determined. Similarly, Figure 7b presents color maps on the considered Δλ1 and Δλ2 values as reported from the calibration. In this case, our methods allow R = (6.2 ± 0.3) cm and θ = (30 ± 2)° to be determined, which are, once again, in good agreement with the BPM simulations’ results (which yields Δλ1 = −1.72 nm and Δλ2 = −1.00 nm for R = 6.0 cm and θ = 30°). The two other examples’ results (Test #3 and Test #4) are summarized in Table 2 (together with the data from Test #1 and Test #2). Remarkably, the sensing approach reported herein allows the curvature radius and angle to be determined if Δλ1 and Δλ2 are known. All the R and θ values retrieved in the test cases are consistent with the estimated error bars, and the maximum percentual error between expected and retrieved values has been found to be 5.8% for R values and 6.6% for θ values. A new angle-resolved curvature sensing approach based on HCPCF technology has thus been developed.
5. Conclusions
In this manuscript, we proposed and demonstrated a new HCPCF-based curvature sensing method able to resolve the curvature radius and angle. The sensing approach employs SR-TL HCPCF displaying tubes with three different thicknesses which are judiciously arranged on the fiber cross-section to provide a curvature-dependent optical response. Indeed, by positioning the tubes with different thicknesses in orthogonal directions within the fiber microstructure, one can attain curvature-dependent shifts on the tubes’ resonance spectral positions. Thus, via a convenient calibration procedure, which encompasses suitable fitting of empirical functions to the fiber optical response, the curvature radii and angles can be adequately retrieved. Compared to other fiber structures employed in directional curvature sensing configurations, which typically display off-center cores [22,25,31,32], the fiber architecture reported herein exhibits the core in the fiber geometrical center, facilitating its integration with standard optical fibers. Also, the fiber architecture reported herein represents a significant simplification compared with the structure reported in [23], as it avoids the need to have five different cladding tube thicknesses in the fiber structure. This simplification is achieved thanks to the calibration procedure we proposed in this manuscript which allows the curvature radius and angle to be adequately retrieved. We understand that the sensing technique proposed herein provides new insight on the utilization of hollow-core fibers to attain angle-resolved curvature sensors.
Author Contributions
Conceptualization, C.M.B.C. and J.H.O.; methodology, C.M.B.C., M.A.R.F. and J.H.O.; numerical simulations, W.M.G. and M.A.R.F.; validation, C.M.B.C., M.A.R.F. and J.H.O.; data curation, W.M.G. and J.H.O.; writing—original draft preparation, J.H.O.; writing—review and editing, W.M.G., C.M.B.C., M.A.R.F. and J.H.O.; supervision, C.M.B.C., M.A.R.F. and J.H.O. All authors have read and agreed to the published version of the manuscript.
Funding
This research received no external funding.
Institutional Review Board Statement
Not applicable.
Informed Consent Statement
Not applicable.
Data Availability Statement
Data underlying the results reported herein can be requested from the authors upon reasonable request.
Acknowledgments
C.M.B.C. and M.A.R.F. thank the National Council for Scientific and Technological Development (CNPq).
Conflicts of Interest
The authors declare no conflict of interest.
References
- Debord, B.; Amrani, F.; Vincetti, L.; Gérôme, F.; Benabid, F. Hollow-core fiber technology: The rising of ‘gas photonics’. Fibers 2019, 7, 16. [Google Scholar] [CrossRef] [Green Version]
- Gao, S.F.; Wang, Y.Y.; Ding, W.; Jiang, D.L.; Gu, S.; Zhang, X.; Wang, P. Hollow-core conjoined-tube negative-curvature fibre with ultralow loss. Nat. Commun. 2018, 19, 2828. [Google Scholar] [CrossRef] [Green Version]
- Amrani, F.; Osório, J.H.; Delahaye, F.; Giovanardi, F.; Vincetti, L.; Debord, B.; Gérôme, F.; Benabid, F. Low-loss single-mode hybrid-lattice hollow-core photonic-crystal fibre. Light Sci. Appl. 2021, 10, 7. [Google Scholar] [CrossRef]
- Sakr, H.; Chen, Y.; Jasion, G.T.; Bradley, T.D.; Hayes, J.R.; Mulvad, H.C.H.; Davidson, I.A.; Fokoua, E.N.; Poletti, F. Hollow core optical fibres with comparable attenuation to silica fibres between 600 and 1100 nm. Nat. Commun. 2020, 11, 6030. [Google Scholar] [CrossRef] [PubMed]
- Chafer, M.; Osório, J.H.; Amrani, F.; Delahaye, F.; Maurel, M.; Debord, B.; Gérôme, F. benabid, F. 1-km hollow-core fiber with loss at the silica Rayleigh limit in the green spectral range. IEEE Photon. Technol. Lett. 2019, 31, 685–688. [Google Scholar] [CrossRef]
- Gao, S.-F.; Wang, Y.-Y.; Ding, W.; Hong, Y.-F.; Wang, P. Conquering the Rayleigh scattering limit of silica glass fiber at visible wavelengths with a hollow-core fiber approach. Laser Photonics Rev. 2019, 14, 1900241. [Google Scholar]
- Osório, J.H.; Amrani, F.; Delahaye, F.; Dhaybi, A.; Vasko, K.; Tessier, G.; Giovanardi, F.; Vincetti, L.; Debord, B.; Gérôme, F.; et al. Hollow-core fiber with ultralow loss in the ultraviolet range and sub-thermodynamic equilibrium surface-roughness. arXiv 2021, arXiv:2105.11900. [Google Scholar]
- Cordier, M.; Delaye, P.; Gérôme, F.; Benabid, F.; Zaquine, I. Raman-free fibered photon-pair source. Sci. Rep. 2020, 10, 1650. [Google Scholar] [CrossRef]
- Okaba, S.; Yu, D.; Vincetti, L.; Benabid, F.; Katori, H. Superradiance from lattice-confined atoms inside hollow core fibre. Commun. Phys. 2019, 2, 136. [Google Scholar] [CrossRef] [Green Version]
- Chafer, M.; Osório, J.H.; Dhaybi, A.; Ravetta, F.; Amrani, F.; Delahaye, F.; Debord, B.; Caiteau-Fischbach, C.; Ancellet, G.; Gérôme, F.; et al. Near- and middle-ultraviolet reconfigurable Raman source using a record-low UV/visible transmission loss inhibited-coupling hollow-core fiber. arXiv 2021, arXiv:2108.11327. [Google Scholar]
- Ni, W.; Yang, C.; Luo, Y.; Xia, R.; Lu, P.; Hu, D.J.J.; Danto, S.; Shum, P.P.; Wei, L. Recent advancements of anti-resonant hollow-core fibers for sensing applications. Photonics 2021, 8, 128. [Google Scholar] [CrossRef]
- Yu, R.; Chen, Y.; Shui, L.; Xiao, L. Hollow-core photonic crystal fiber gas sensing. Sensors 2020, 20, 2996. [Google Scholar] [CrossRef] [PubMed]
- Cubillas, A.M.; Jiang, X.; Euser, T.G.; Taccardi, N.; Etzold, B.J.M.; Wasserscheid, P.; Russell, P.S. Photochemistry in a soft-glass single-ring hollow-core photonic crystal fiber. Analyst 2017, 142, 925–929. [Google Scholar] [CrossRef] [Green Version]
- Nissen, M.; Doherty, B.; Hamperl, J.; Kobelke, J.; Weber, K.; Henkel, T.; Schmidt, M.A. UV absorption spectroscopy in water-filled antiresonant hollow core fibers for pharmaceutical detection. Sensors 2018, 18, 478. [Google Scholar] [CrossRef] [PubMed] [Green Version]
- Sardar, M.R.; Faisal, M.; Ahmed, K. Simple hollow core photonic crystal fiber for monitoring carbon dioxide gas with very high accuracy. Sens. Bio-Sens. Res. 2021, 31, 100401. [Google Scholar] [CrossRef]
- Arman, H.; Olyaee, S. Realization of low confinement loss acetylene gas sensor by using hollow-core photonic bandgap fiber. Opt. Quantum Electron. 2021, 53, 328. [Google Scholar] [CrossRef]
- Sardar, M.R.; Faisal, M.; Ahmed, K. Design and characterization of rectangular slotted porous core photonic crystal fiber for sensing CO2 gas. Sens. Bio-Sens. Res. 2021, 30, 100379. [Google Scholar] [CrossRef]
- Olyaee, S.; Arman, H.; Naraghi, A. Design, simulation, and optimization of acetylene gas sensor using hollow-core photonic bandgap fiber. Sens. Lett. 2015, 13, 387–392. [Google Scholar] [CrossRef]
- Ravaille, A.; Feugnet, G.; Debord, B.; Gérôme, F.; Benabid, F.; Bretenaker, F. Rotation measurements using a resonant fiber optic gyroscope based on Kagome fiber. Appl. Opt. 2019, 58, 2198–2204. [Google Scholar] [CrossRef] [PubMed]
- Sanders, G.A.; Taranta, A.A.; Narayanan, C.; Fokoua, E.N.; Mousavi, S.A.; Strandjord, L.K.; Smiciklas, M.; Bradley, T.D.; Hayes, J.; Jasion, G.T.; et al. Hollow-core resonator fiber optic gyroscope using nodeless anti-resonant fiber. Opt. Lett. 2021, 46, 46–49. [Google Scholar] [CrossRef]
- Yang, F.; Gyger, F.; Thévenaz, L. Intense Brillouing amplification in gas using hollow-core waveguides. Nat. Photonics. 2020, 14, 700–708. [Google Scholar] [CrossRef]
- Huang, X.; Zang, J.; Yoo, S. Multiple hollow-core anti-resonant fiber as a supermodal fiber interferometer. Sci. Rep. 2019, 9, 9342. [Google Scholar] [CrossRef] [PubMed]
- Cordeiro, C.M.B.; Osório, J.H.; Guimarães, W.M.; Franco, M.A.R. Azimuthally asymmetric tubular lattice hollow-core optical fiber. J. Opt. Soc. Am. B 2021, 38, F23–F28. [Google Scholar] [CrossRef]
- Wang, Y.; Rao, Y. A novel long period fiber grating sensor measuring and determining bend-direction simultaneously. IEEE Sens. J. 2005, 5, 839–843. [Google Scholar] [CrossRef]
- Chen, X.; Zhang, C.; Webb, D.J.; Kalli, K.; Peng, G. Highly sensitive bend sensor based on Bragg grating in eccentric core polymer fiber. IEEE Photon. Technol. Lett. 2010, 22, 850–852. [Google Scholar] [CrossRef] [Green Version]
- Luo, H.; Su, L.; Zhang, J.; Yuan, W.; Liu, S.; Wang, Y.; Wang, C.; Wang, X. C-shape microfiber taper interferometer for simultaneous measurement of curvature and temperature. Optik 2017, 145, 181–187. [Google Scholar] [CrossRef]
- Gong, Y.; Zhao, T.; Rao, Y.; Wu, Y. All-fiber curvature sensor based on multimode interference. IEEE Photon. Technol. Lett. 2011, 23, 679–681. [Google Scholar] [CrossRef]
- Frazão, O.; Viegas, J.; Caldas, P.; Santos, J.L.; Araújo, F.M.; Ferreira, L.A.; Farahi, F. All-fiber Mach-Zehnder curvature sensor based on multimode interference combined with a long-period grating. Opt. Lett. 2007, 32, 3074–3076. [Google Scholar] [CrossRef] [PubMed]
- Tang, Z.; Lou, S.; Wang, X.; Zhang, W.; Yan, S.; Xing, Z. High-performance bending vector and strain sensor using a dual-tapered photonic crystal fiber Mach-Zehnder interferometer. IEEE Sens. J. 2019, 19, 4062–4068. [Google Scholar] [CrossRef]
- Frazão, O.; Baptista, J.M.; Santos, J.L.; Roy, P. Curvature sensor using a highly birefringent photonic crystal fiber with two asymmetric hole regions in a Sagnac interferometer. Appl. Opt. 2008, 47, 2520–2523. [Google Scholar] [CrossRef] [PubMed]
- Osório, J.H.; Oliveira, R.; Aristilde, S.; Chesini, G.; Franco, M.A.R.; Nogueira, R.N.; Cordeiro, C.M.B. Bragg gratings in surface-core fibers: Refractive index and directional curvature sensing. Opt. Fiber Technol. 2017, 34, 86–90. [Google Scholar] [CrossRef]
- Newkirk, A.V.; Antonio-Lopez, J.E.; Valazquez-Benitez, A.; Albert, J.; Amezcua-Correa, R.; Schülzgen, A. Bending sensor combining multicore fiber with a mode-selective photonic lantern. Opt. Lett. 2015, 40, 5188–5191. [Google Scholar] [CrossRef] [Green Version]
- Mousavi, S.A.; Sandoghchi, S.R.; Richardson, D.J.; Poletti, F. Broadband high birefringence and polarizing hollow core antiresonant fibers. Opt. Express. 2016, 24, 22943–22958. [Google Scholar] [CrossRef] [PubMed]
- Yerolatsitis, S.; Shurvinton, R.; Song, P.; Zhang, Y.; Francis-Jones, R.J.A.; Rusimova, K.R. Birefringent anti-resonant hollow-core fiber. J. Lightwave Technol. 2020, 38, 5157–5162. [Google Scholar] [CrossRef]
- Osório, J.H.; Chafer, M.; Debord, B.; Giovanardi, F.; Cordier, M.; Maurel, M.; Delahaye, F.; Amrani, F.; Vincetti, L.; Gérôme, F.; et al. Tailoring modal properties of inhibited-coupling guiding fibers by cladding modification. Sci. Rep. 2019, 9, 1376. [Google Scholar] [CrossRef] [PubMed] [Green Version]
- Wang, C.; Yu, R.; Debord, B.; Gérôme, F.; Benabid, F.; Chiang, K.S.; Xiao, L. Ultralow-loss fusion splicing between negative curvature hollow-core fibers and conventional SMFs with a reverse-tapering method. Opt. Express. 2021, 29, 22470–22478. [Google Scholar] [CrossRef] [PubMed]
- Suslov, D.; Komanec, M.; Fokoua, E.R.N.; Dousek, D.; Zhong, A.; Zvánovec, S.; Bradley, T.D.; Poletti, F.; Richardson, D.J.; Slavík, R. Low loss and high performance interconnection between standard single-mode fiber and antiresonant hollow-core fiber. Sci. Rep. 2021, 11, 8799. [Google Scholar] [CrossRef]
- Yu, R.; Wang, C.; Benabid, F.; Chiang, K.S.; Xiao, L. Robust mode matching between structurally dissimilar optical fiber waveguides. ACS Photon. 2021, 8, 857–863. [Google Scholar] [CrossRef]
- Bradley, T.D.; Wang, Y.; Alharbi, M.; Debord, B.; Fourcade-Dutin, C.; Beaudou, B.; Gérôme, F.; Benabid, F. Optical properties of low loss (70dB/km) hypocycloid-core kagome hollow core photonic crystal fiber for Rb and Cs based optical applications. J. Light. Technol. 2013, 31, 2752–2755. [Google Scholar] [CrossRef]
- Couny, F.; Benabid, F.; Roberts, P.J.; Light, P.S.; Raymer, M.G. Generation and photonic guidance of multi-octave optical frequency combs. Science 2007, 318, 1118–1121. [Google Scholar] [CrossRef]
- Debord, B.; Amsanpally, A.; Chafer, M.; Baz, A.; Maurel, M.; Blondy, J.M.; Hugonnot, E.; Scol, F.; Vincetti, L.; Gérôme, F.; et al. Ultralow transmission loss in inhibited-coupling guiding hollow fibers. Optica 2017, 4, 209–217. [Google Scholar] [CrossRef] [Green Version]
- Malitson, I.H. Intraspecimen comparison of the refractive index of fused silica. J. Opt. Soc. Am. 1965, 55, 1205–1208. [Google Scholar] [CrossRef]
- Sakr, H.; Bradley, T.D.; Jasion, G.T.; Fokoua, E.N.; Sandoghchi, S.R.; Davidson, I.A.; Taranta, A.; Guerra, G.; Shere, W.; Chen, Y.; et al. Hollow core NANFs with five nested tubes and record low loss at 850, 1060, 1300 and 1625 nm. In Proceedings of the 2021 Optical Fiber Communications Conference and Exhibition (OFC), San Francisco, CA, USA, 6–10 June 2021. F3A.4. [Google Scholar]
- Wang, K.; Dong, X.; Köhler, M.H.; Kienle, P.; Bian, Q.; Jakobi, M.; Koch, A.W. Advances in optical fiber sensors based on multimode interference (MMI): A review. IEEE Sens. J. 2021, 21, 132–142. [Google Scholar] [CrossRef]
- Osório, J.H.; Guimarães, W.M.; Peng, L.; Franco, M.A.R.; Warren-Smith, S.C.; Ebendorff-Heidepriem, H.; Cordeiro, C.M.B. Exposed-core fiber multimode interference sensor. Results Opt. 2021, 5, 100125. [Google Scholar] [CrossRef]
- Setti, V.; Vincetti, L.; Argyros, A. Flexible tube lattice fibers for terahertz applications. Opt. Express. 2013, 21, 3388–3399. [Google Scholar] [CrossRef]
- Frosz, M.H.; Roth, P.; Günendi, M.C.; Russell, P.S. Analytical formulation for bending loss in single-ring hollow-core photonic crystal fibers. Photon. Res. 2017, 5, 88–91. [Google Scholar] [CrossRef] [Green Version]
Figure 1.
(a) HCPCF cross-section diagram (t0, t1, and t2: thicknesses of the cladding tubes; θ: curvature angle). (b) Typical transmission spectrum for a straight fiber and mode profiles at selected wavelengths.
Figure 1.
(a) HCPCF cross-section diagram (t0, t1, and t2: thicknesses of the cladding tubes; θ: curvature angle). (b) Typical transmission spectrum for a straight fiber and mode profiles at selected wavelengths.

Figure 2.
Simulated wavelength shifts (Δλ) associated with t1 and t2 resonances as a function of the curvature radius for (a) θ = 0°, (b) θ = 90°, (c) θ = 180°, and (d) θ = 270°.
Figure 2.
Simulated wavelength shifts (Δλ) associated with t1 and t2 resonances as a function of the curvature radius for (a) θ = 0°, (b) θ = 90°, (c) θ = 180°, and (d) θ = 270°.

Figure 3.
Wavelength shifts (Δλ) associated with the tubes with thicknesses (a) t1 and (b) t2 as a function of the curvature radius tube for representative curvature angles, θ.
Figure 3.
Wavelength shifts (Δλ) associated with the tubes with thicknesses (a) t1 and (b) t2 as a function of the curvature radius tube for representative curvature angles, θ.

Figure 4.
Wavelength shifts as a function of the curvature angle (θ) for different curvature radii (R) for the resonances associated with the tubes with thicknesses (a) t1 (Δλ1) and (b) t2 (Δλ2).
Figure 4.
Wavelength shifts as a function of the curvature angle (θ) for different curvature radii (R) for the resonances associated with the tubes with thicknesses (a) t1 (Δλ1) and (b) t2 (Δλ2).

Figure 5.
Parameters Δλ0, θ0, δ, and Λ as a function of the curvature radius (R), corresponding to the resonances associated to the tubes with thicknesses (a) t1 and (b) t2.
Figure 5.
Parameters Δλ0, θ0, δ, and Λ as a function of the curvature radius (R), corresponding to the resonances associated to the tubes with thicknesses (a) t1 and (b) t2.

Figure 6.
Calibration curves: (a) and (b) .

Figure 7.
Color plots from calibration for selected Δλ1 and Δλ2 values. The intersecting region between Δλ1 and Δλ2 plots allows the curvature radius and angle expected from the calibration to be obtained. (a) Test #1, (b) Test #2, (c) Test #3, and (d) Test #4.
Figure 7.
Color plots from calibration for selected Δλ1 and Δλ2 values. The intersecting region between Δλ1 and Δλ2 plots allows the curvature radius and angle expected from the calibration to be obtained. (a) Test #1, (b) Test #2, (c) Test #3, and (d) Test #4.


Table 1.
Fitting functions used to adjust Δλ0, θ0, δ, and Λ trends as a function of R (a, b, c, and d are representative fitting constants).
Table 1.
Fitting functions used to adjust Δλ0, θ0, δ, and Λ trends as a function of R (a, b, c, and d are representative fitting constants).
| Parameter | Fitting Function (t1 Resonance) | Fitting Function (t2 Resonance) |
|---|---|---|
| Λ | ||
| δ | ||
| θ0 | ||
| Δλ0 |
Publisher’s Note: MDPI stays neutral with regard to jurisdictional claims in published maps and institutional affiliations. |
© 2021 by the authors. Licensee MDPI, Basel, Switzerland. This article is an open access article distributed under the terms and conditions of the Creative Commons Attribution (CC BY) license (https://creativecommons.org/licenses/by/4.0/).
Share and Cite
MDPI and ACS Style
Guimarães, W.M.; Cordeiro, C.M.B.; Franco, M.A.R.; Osório, J.H. Angle-Resolved Hollow-Core Fiber-Based Curvature Sensing Approach. Fibers 2021, 9, 72. https://0-doi-org.brum.beds.ac.uk/10.3390/fib9110072
AMA Style
Guimarães WM, Cordeiro CMB, Franco MAR, Osório JH. Angle-Resolved Hollow-Core Fiber-Based Curvature Sensing Approach. Fibers. 2021; 9(11):72. https://0-doi-org.brum.beds.ac.uk/10.3390/fib9110072
Chicago/Turabian StyleGuimarães, William M., Cristiano M. B. Cordeiro, Marcos A. R. Franco, and Jonas H. Osório. 2021. "Angle-Resolved Hollow-Core Fiber-Based Curvature Sensing Approach" Fibers 9, no. 11: 72. https://0-doi-org.brum.beds.ac.uk/10.3390/fib9110072
Note that from the first issue of 2016, this journal uses article numbers instead of page numbers. See further details here.