
Novel Insight into the Intricate Shape of Flax Fibre Lumen

 , , , , ,
Abstract
:1. Introduction
2. Materials and Methods
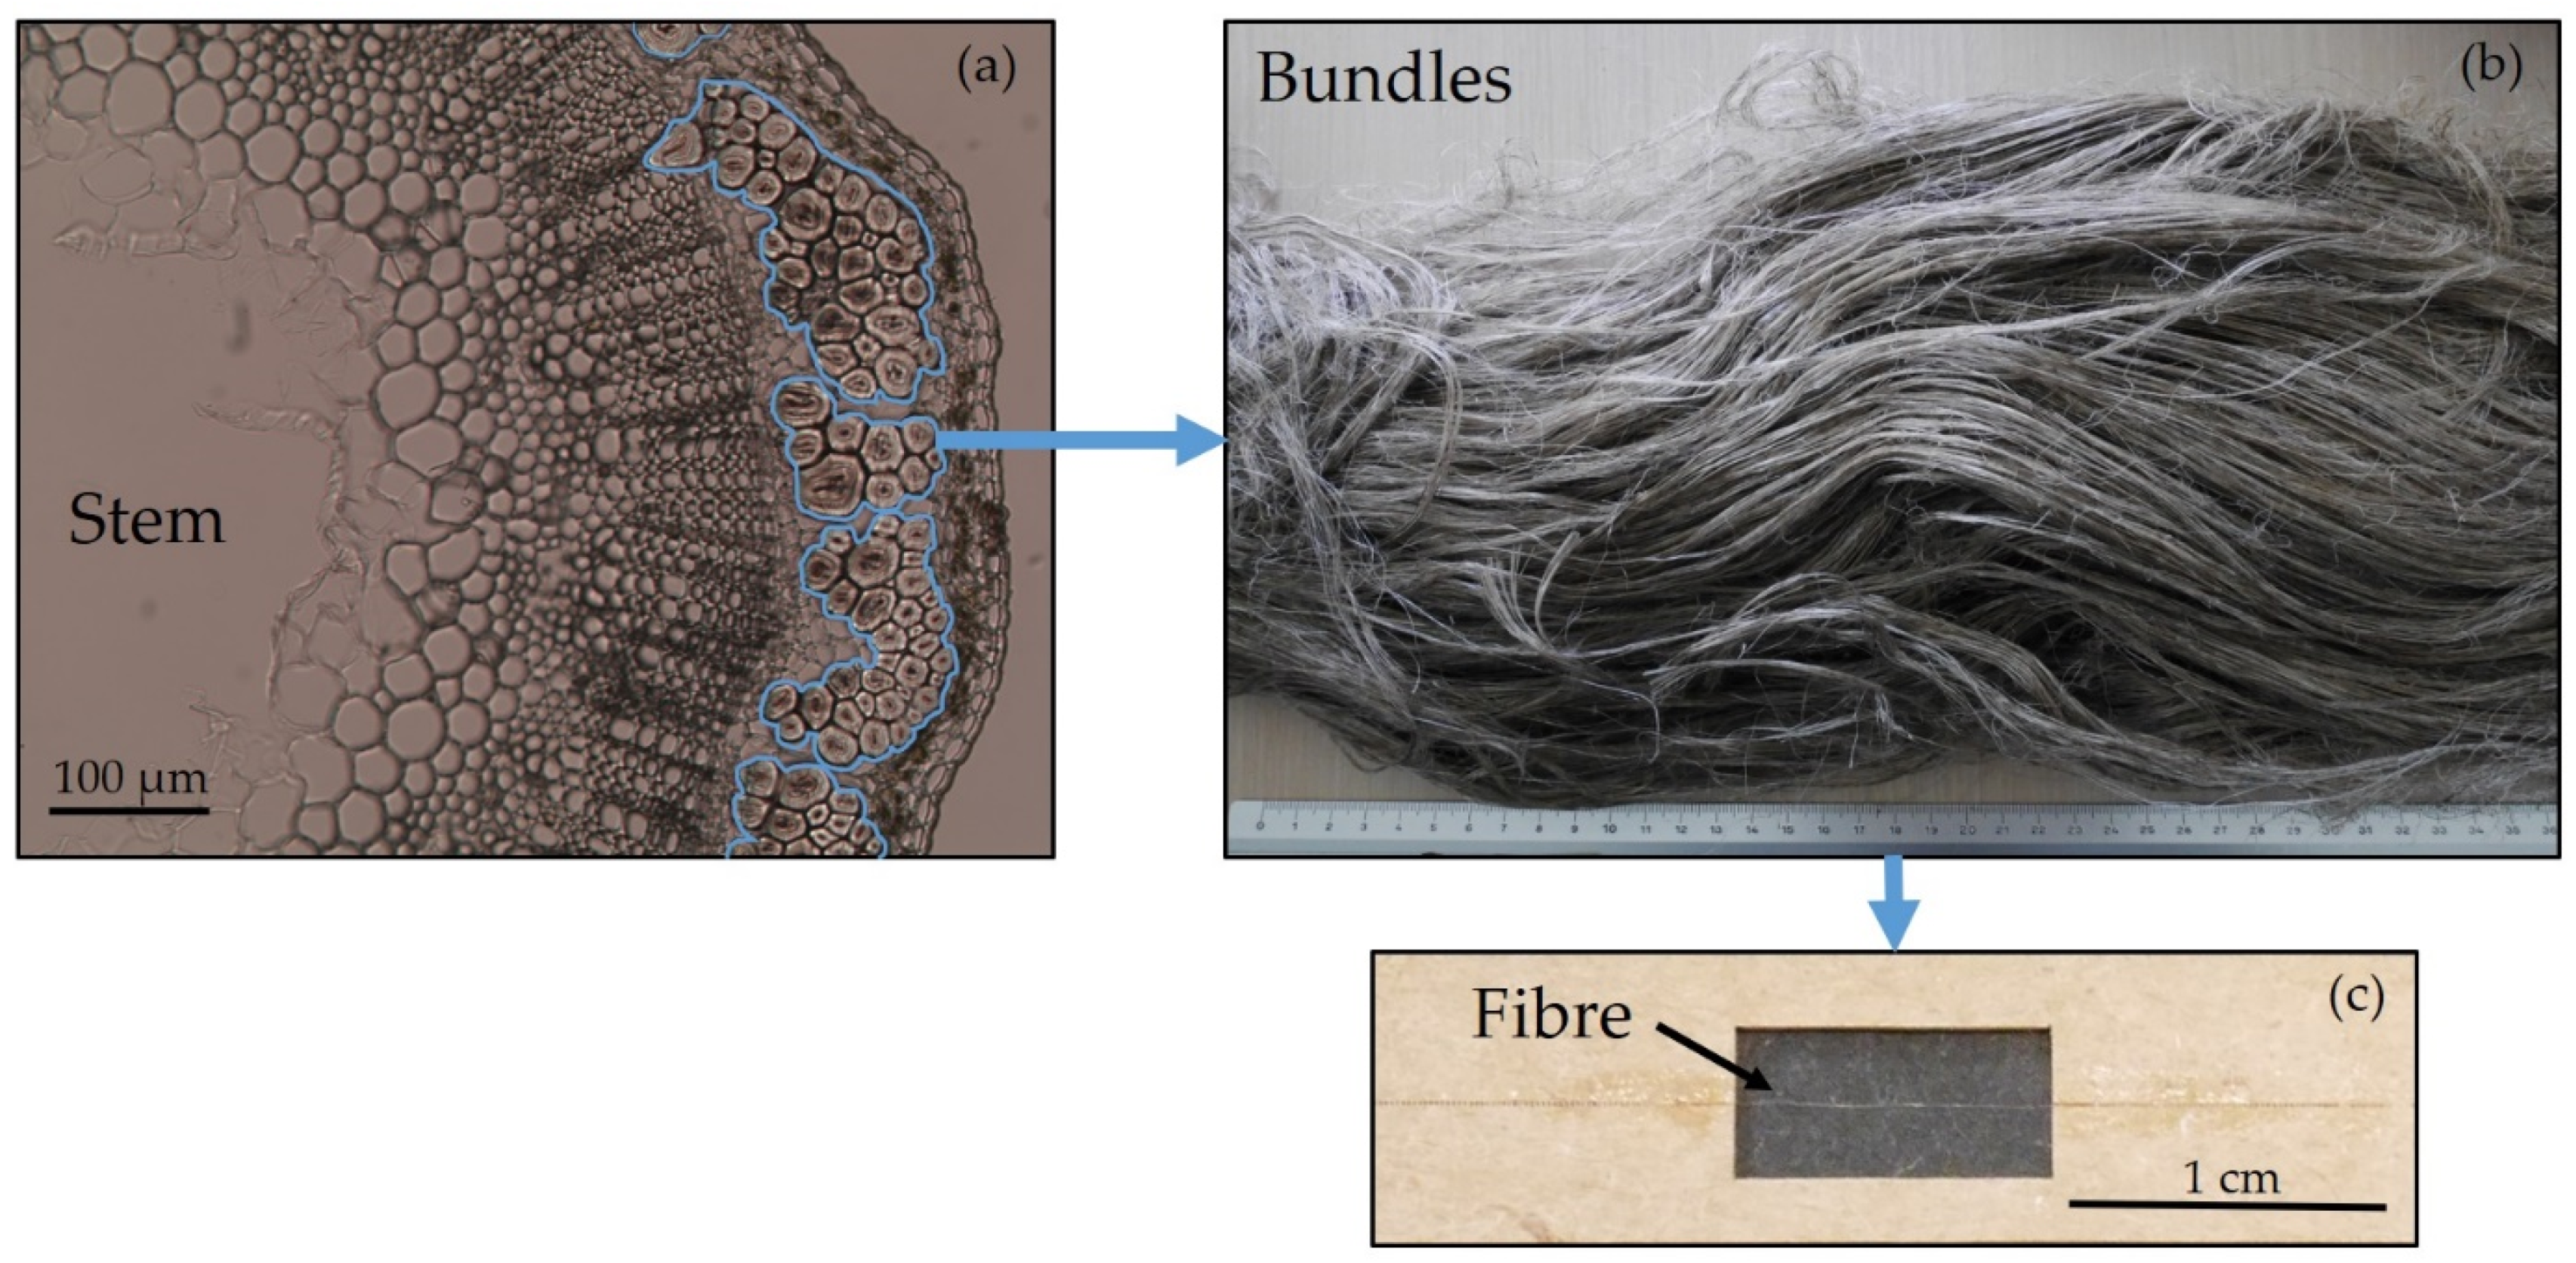
2.1. Materials
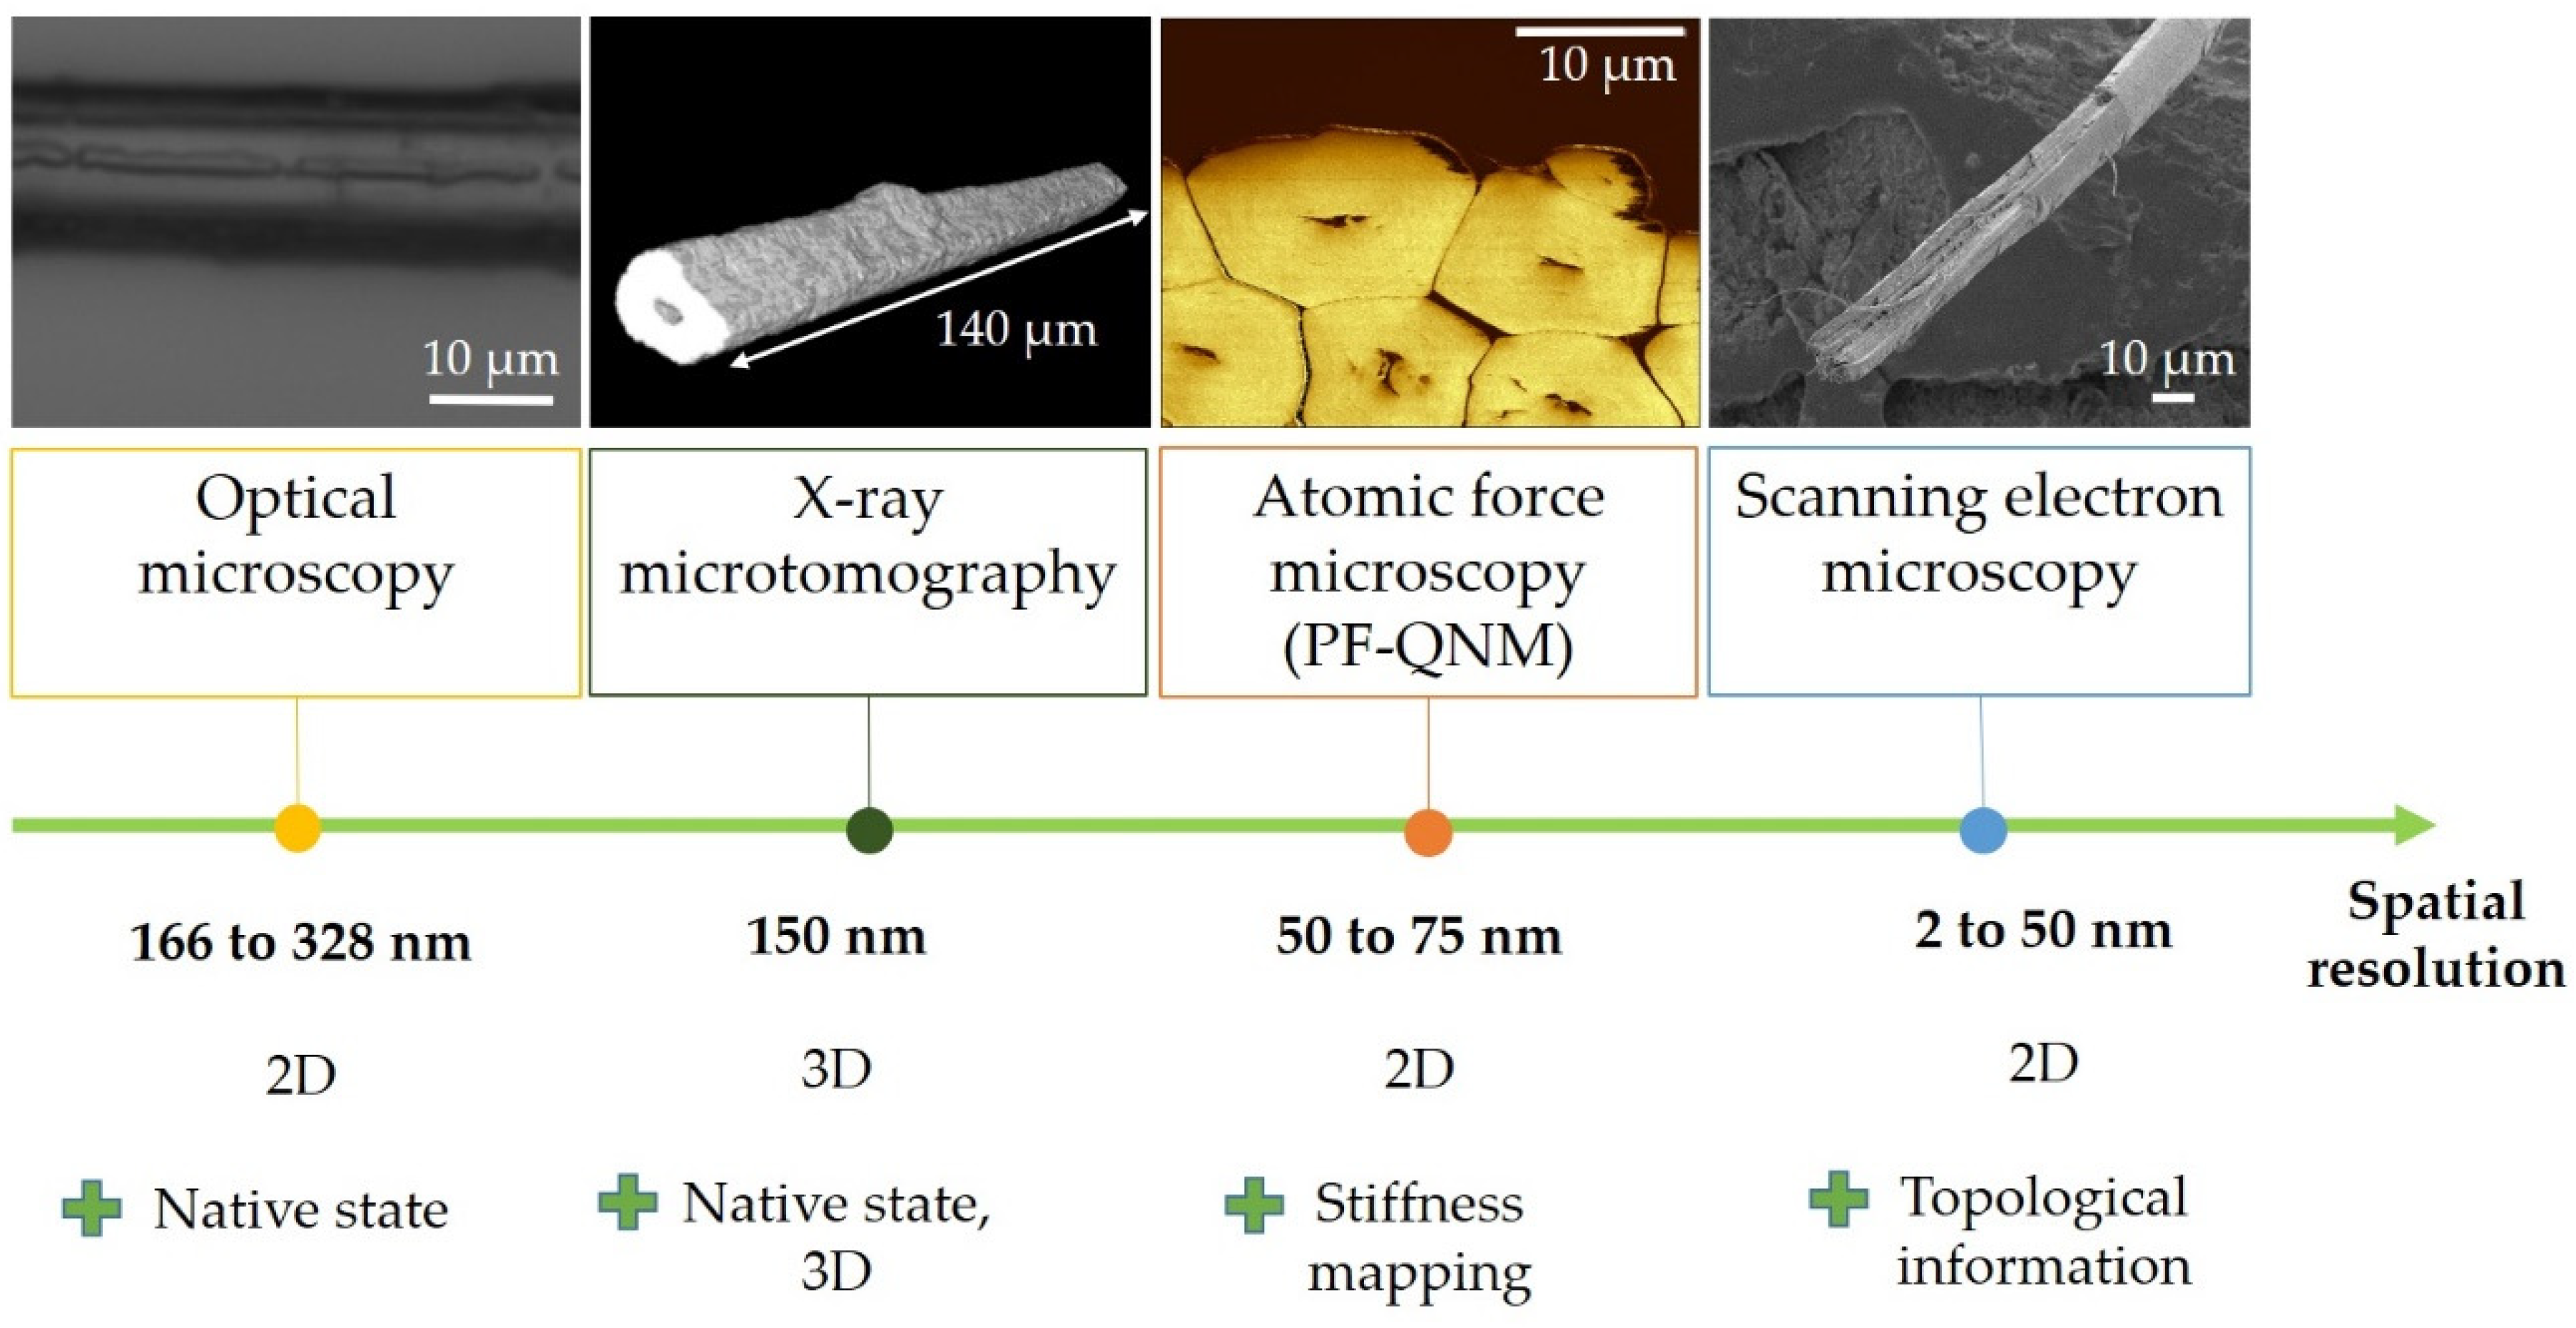
2.2. X-ray Tomography Imaging
2.3. Atomic Force Microscopy
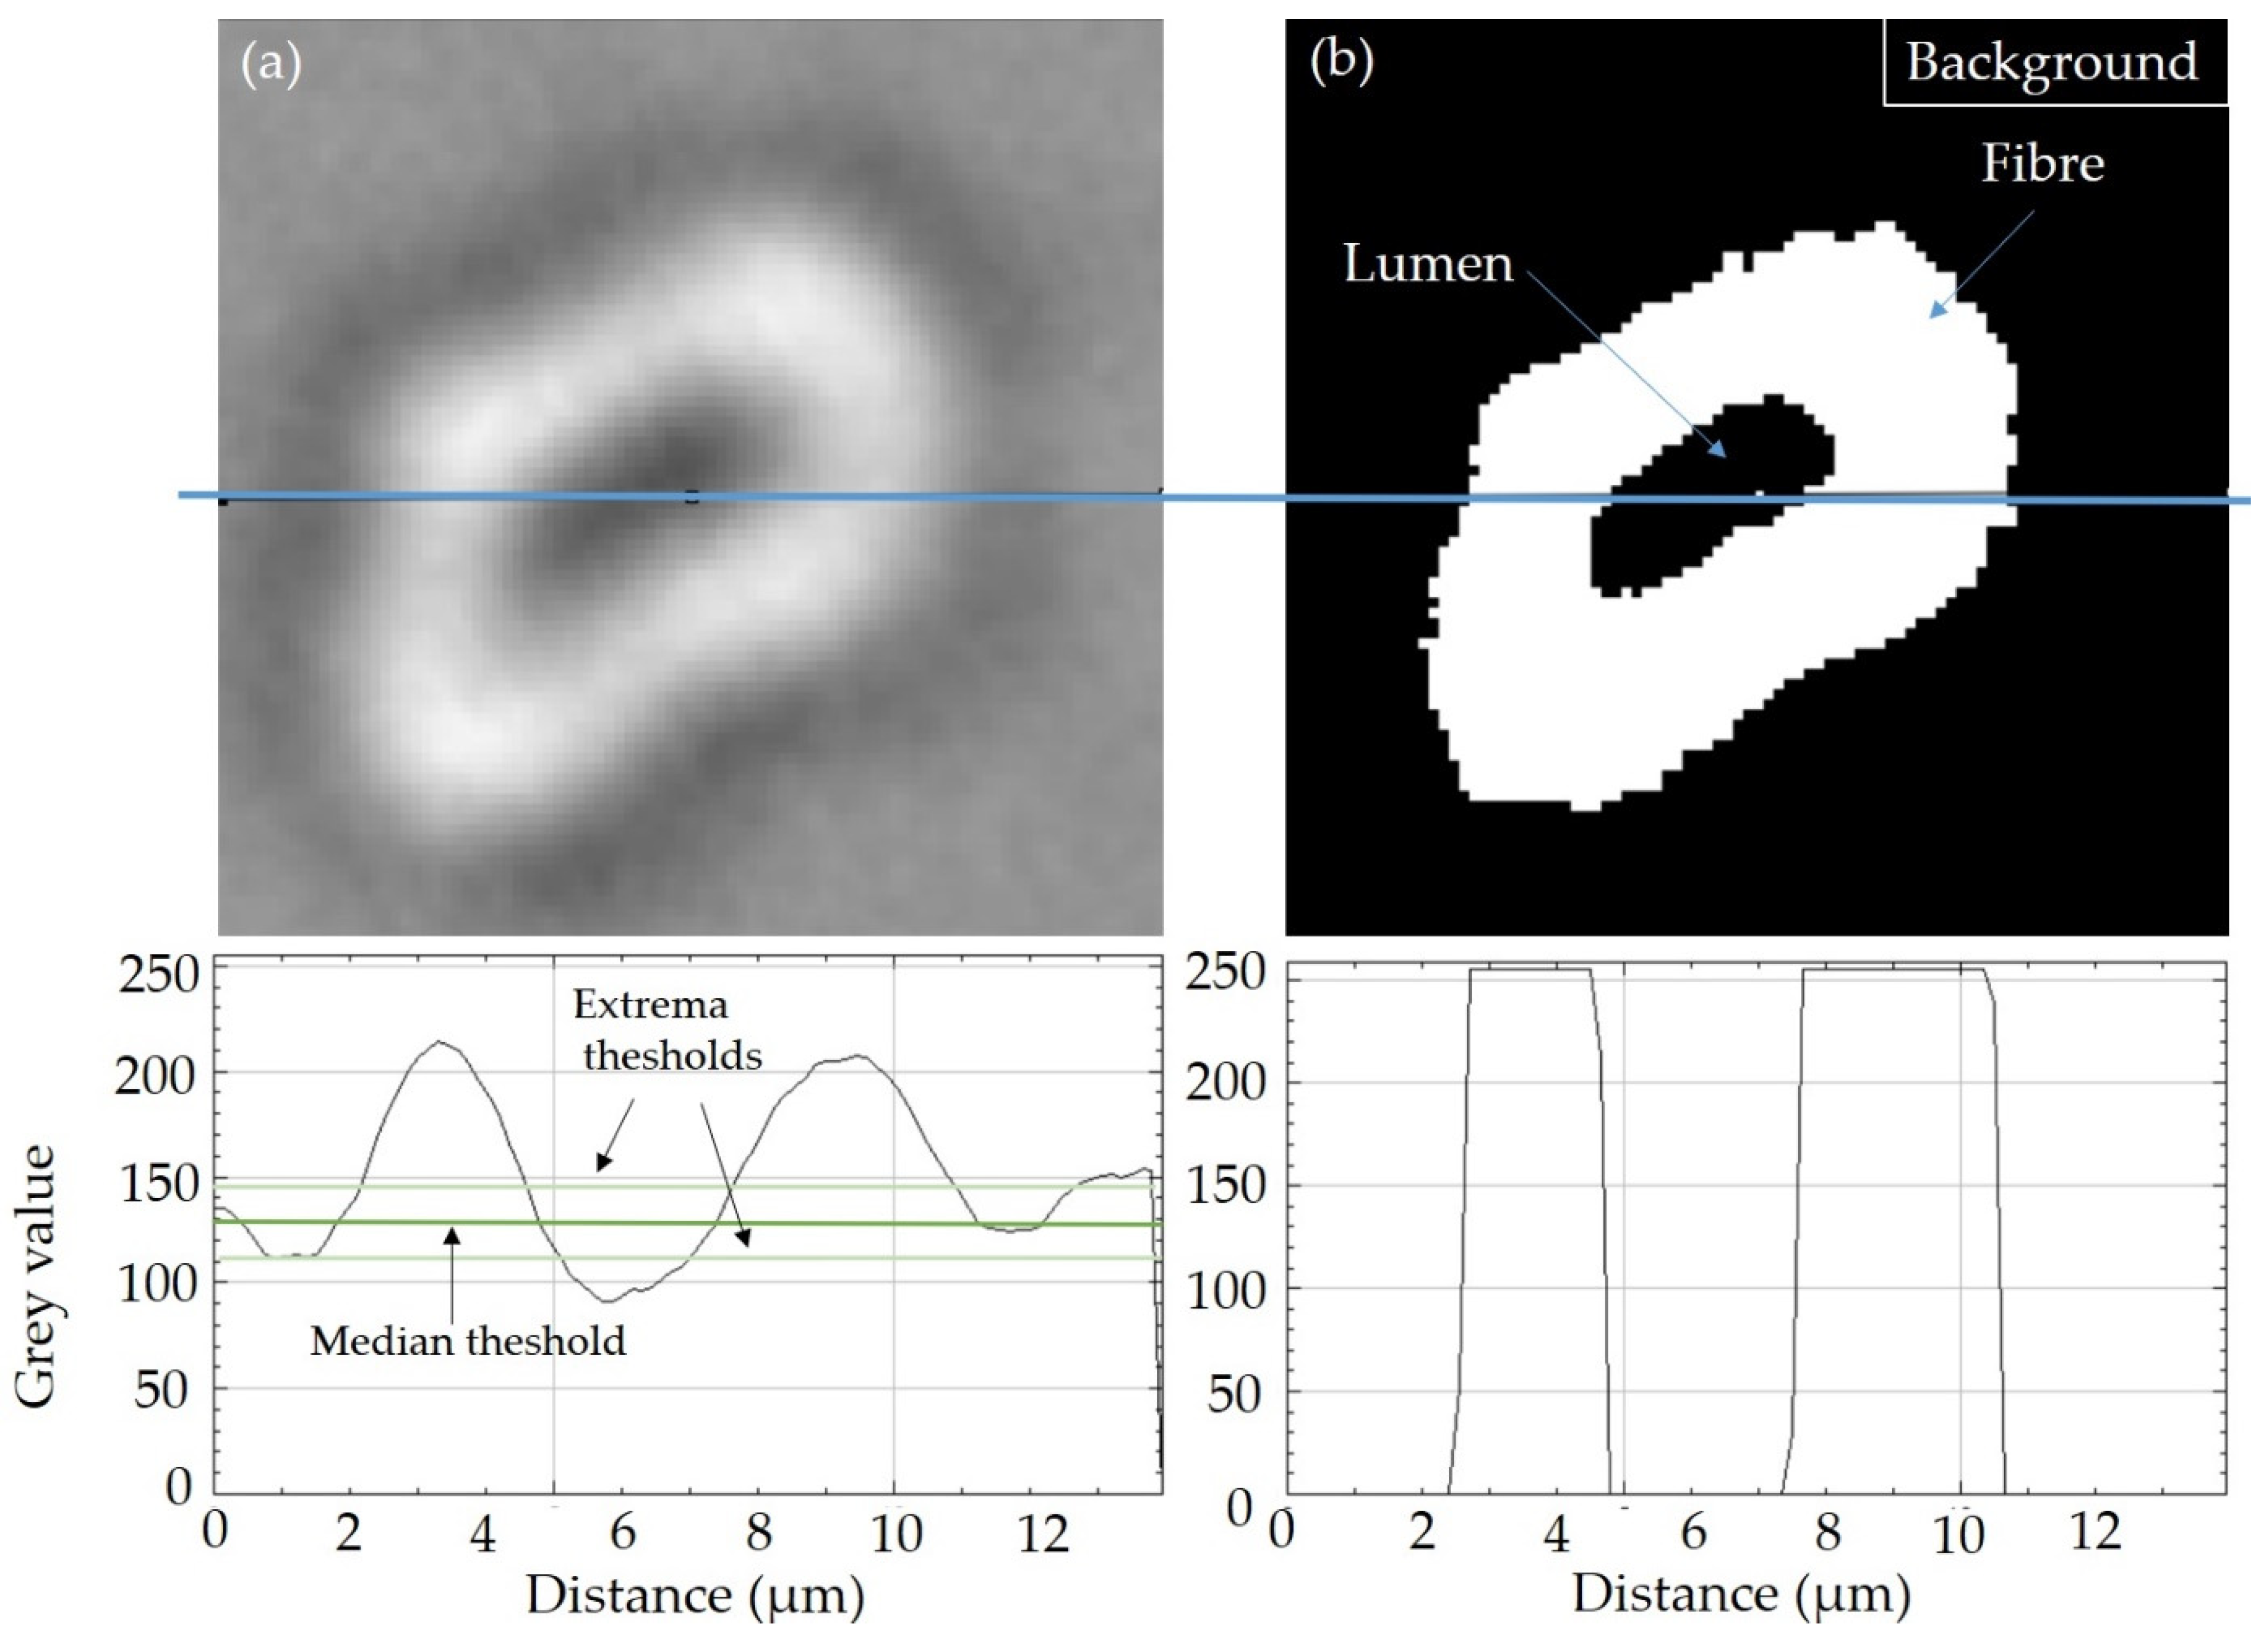
2.4. Optical Microscopy
2.5. Tensile Testing
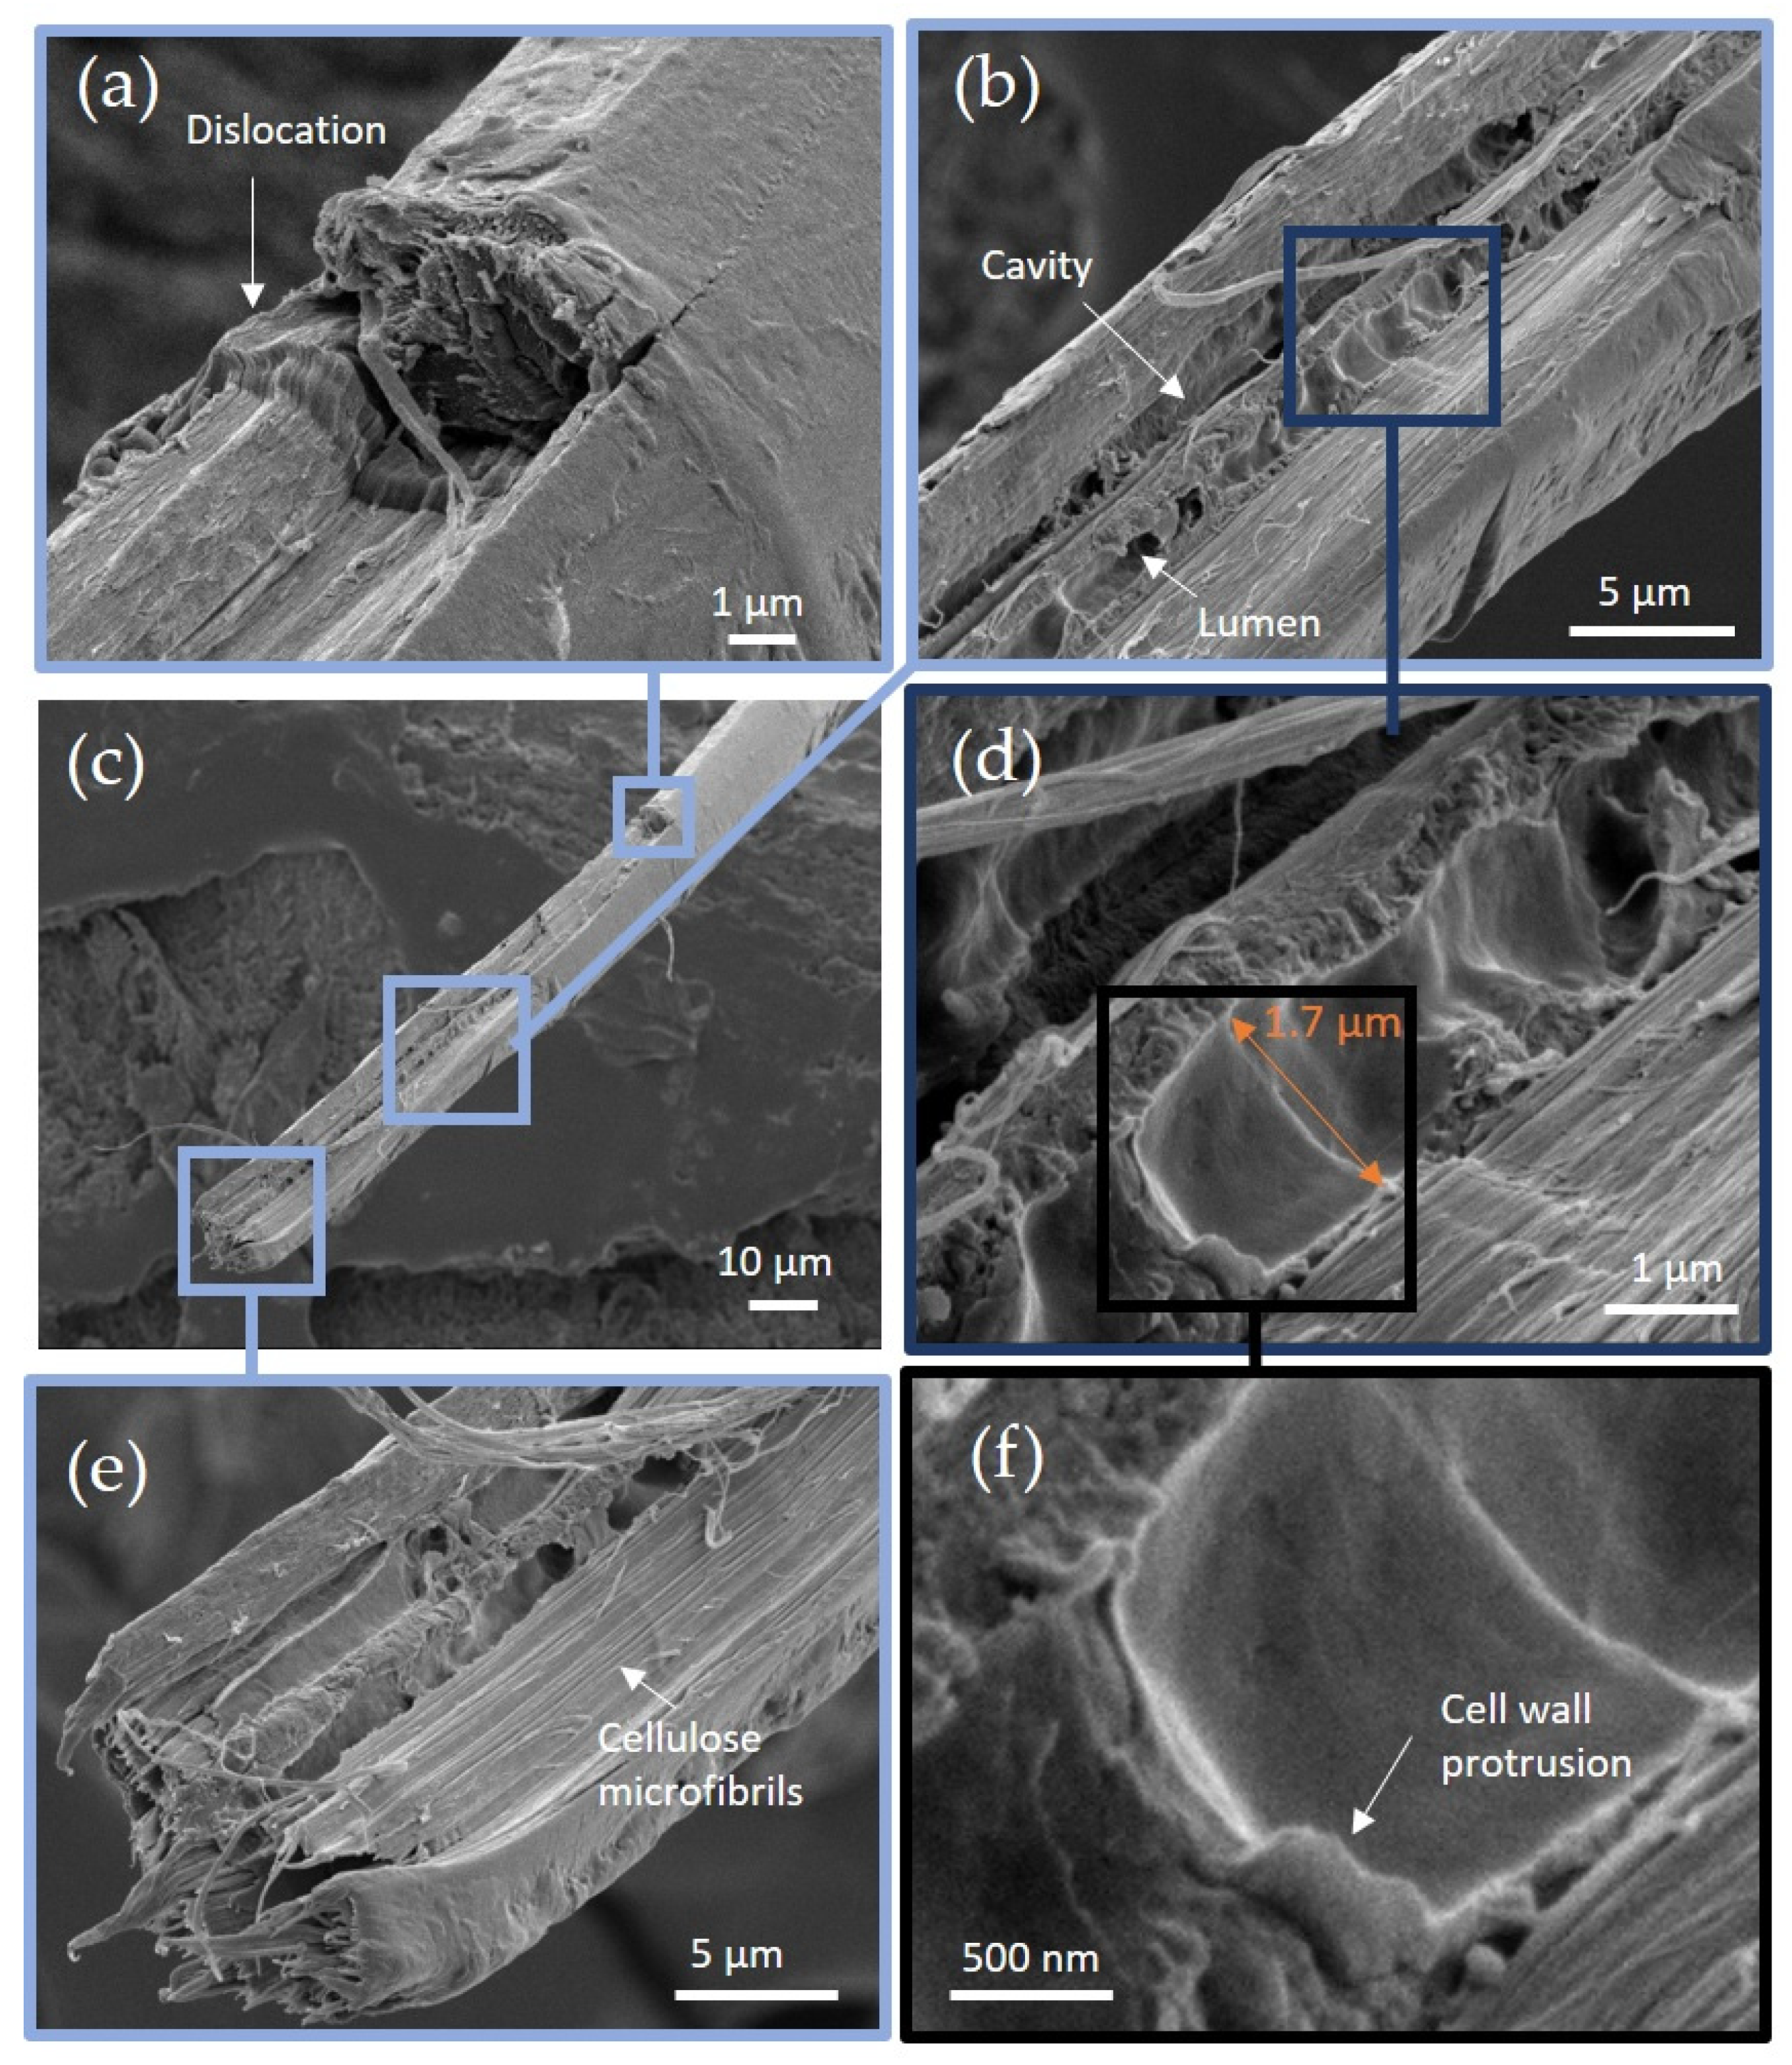
2.6. Scanning Electron Microscopy Observations
3. Results
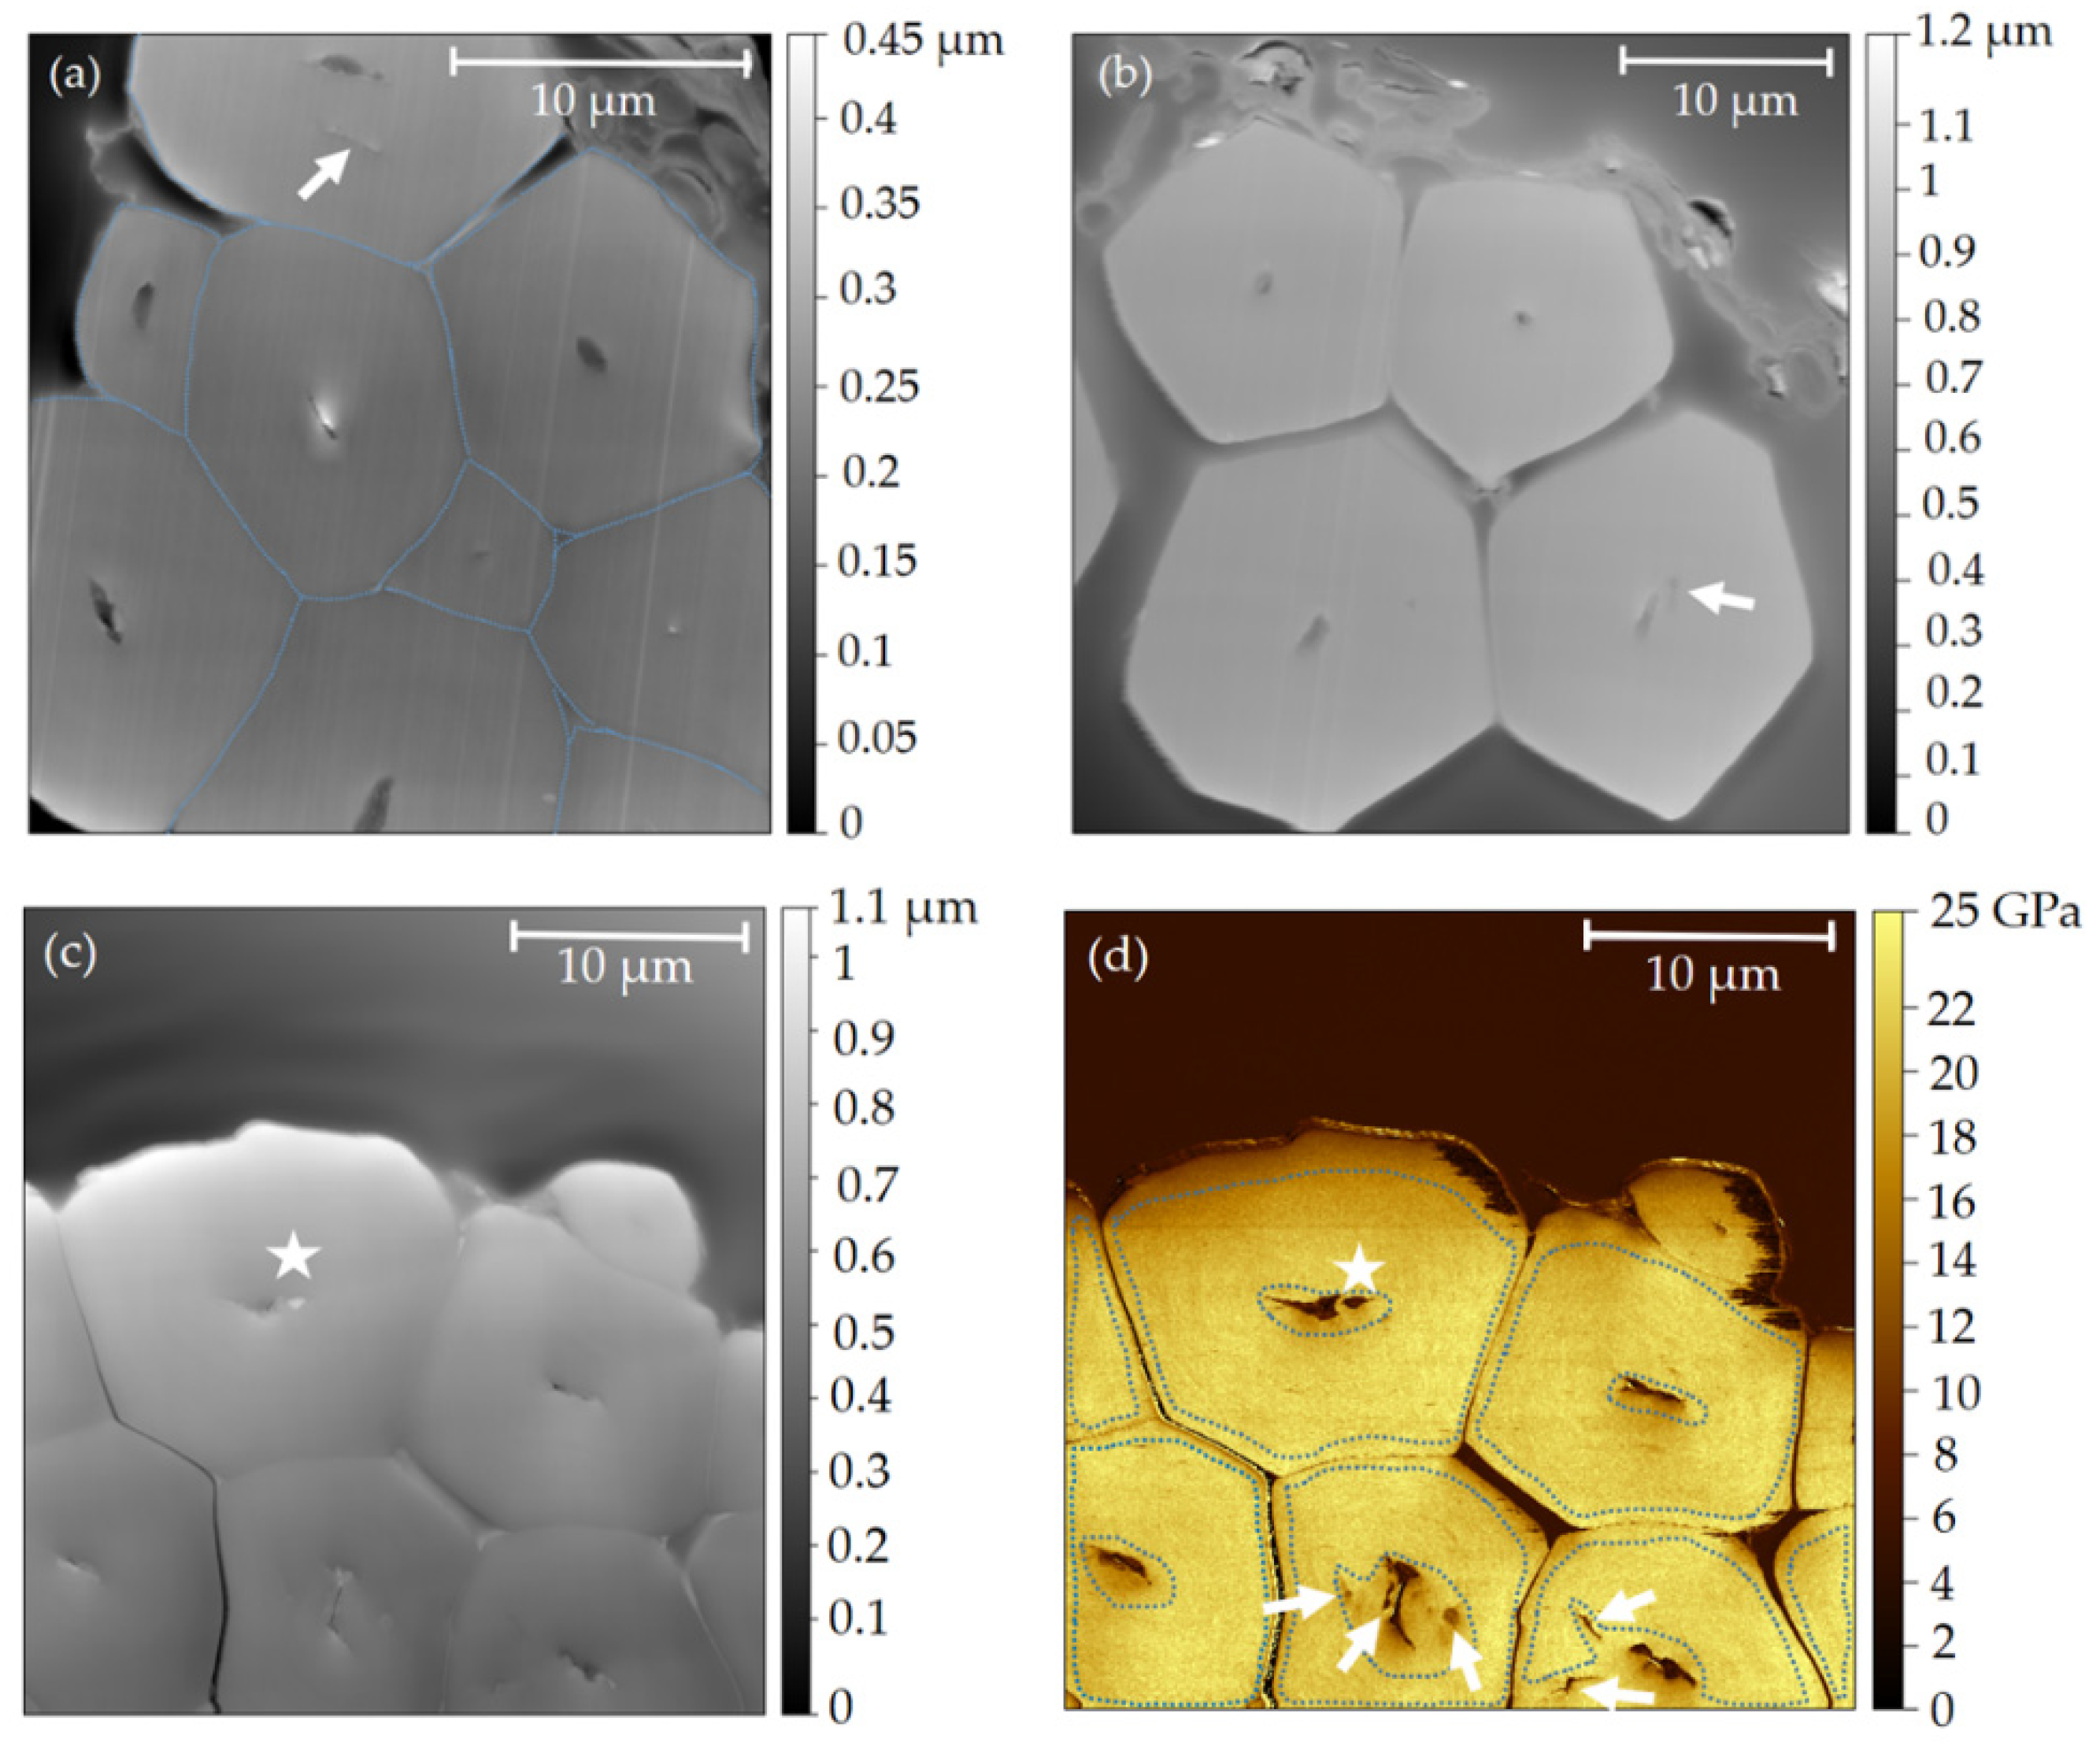
3.1. Transversal View: Atomic Force Microscopy
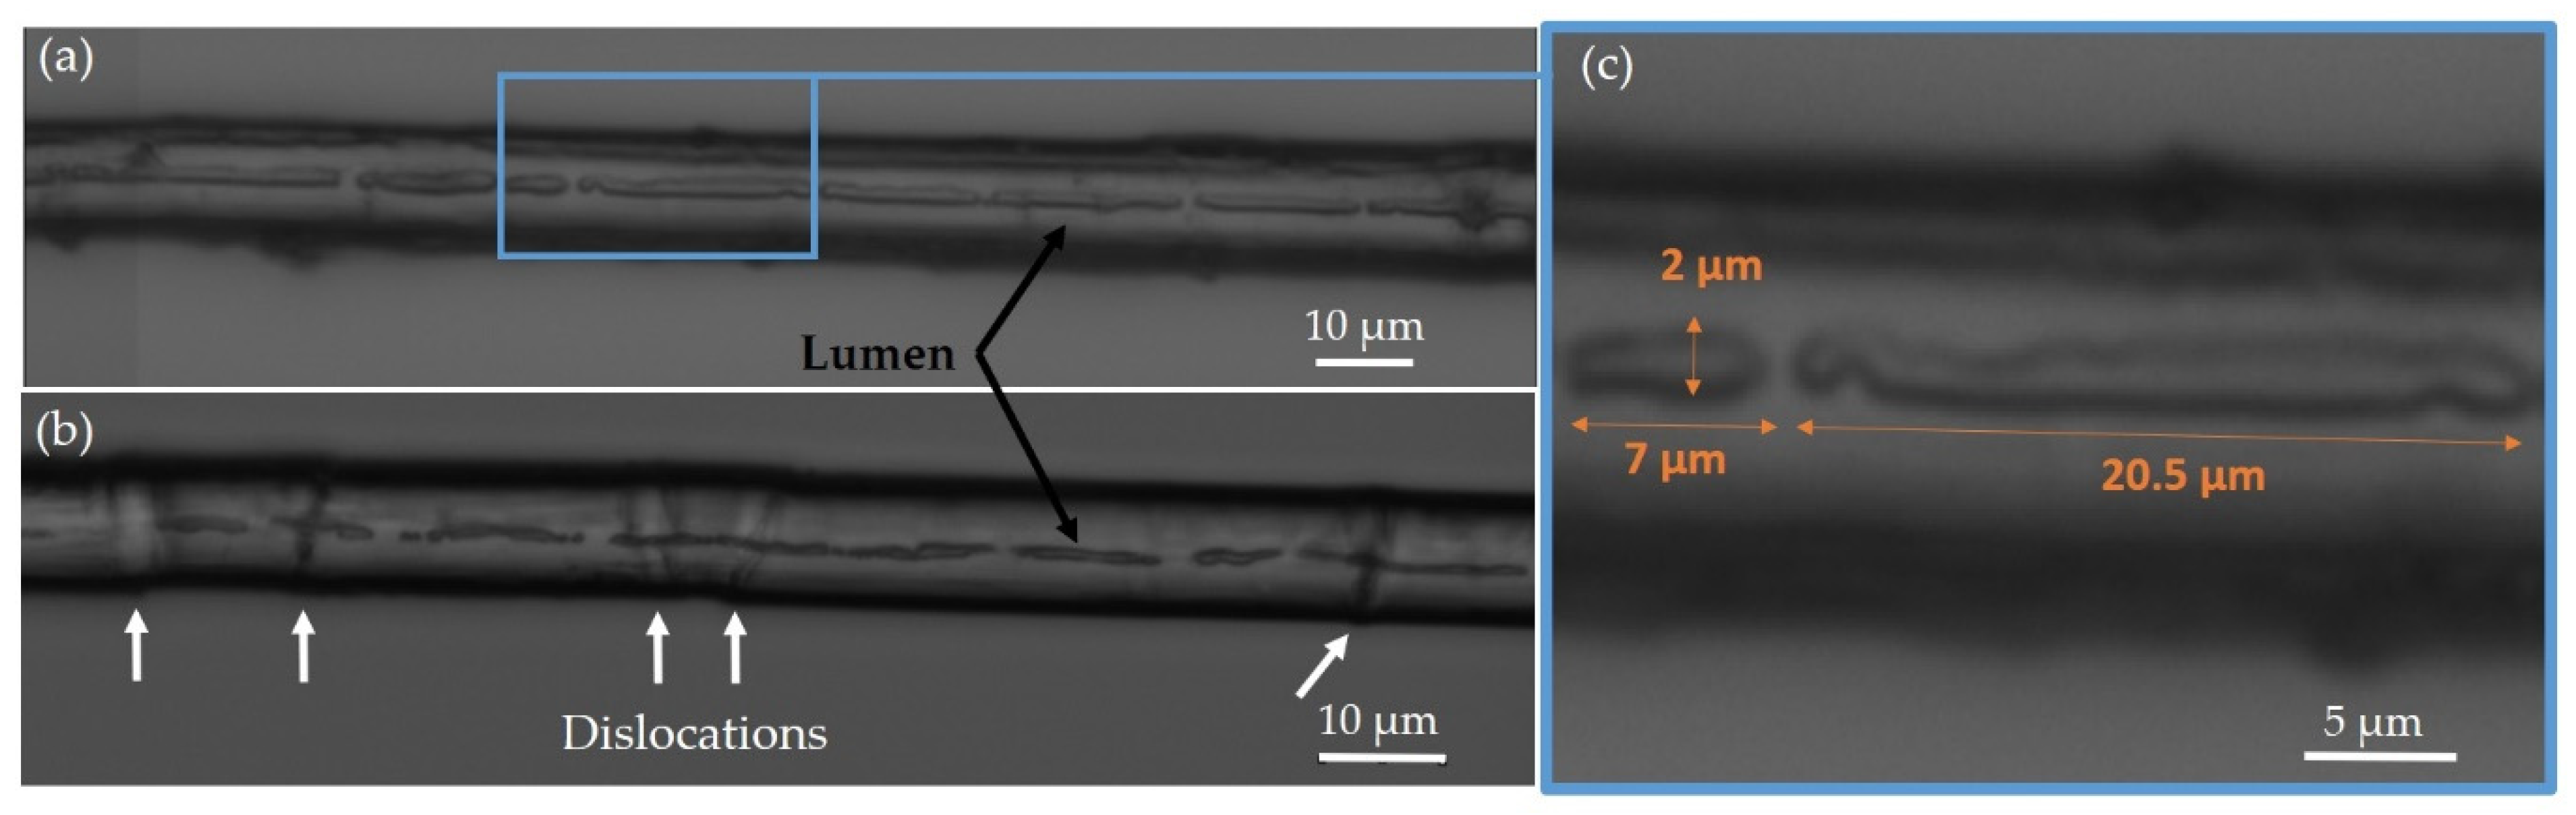
3.2. Longitudinal View: Optical Microscopy
3.3. Volume Reconstruction: X-ray Microtomography
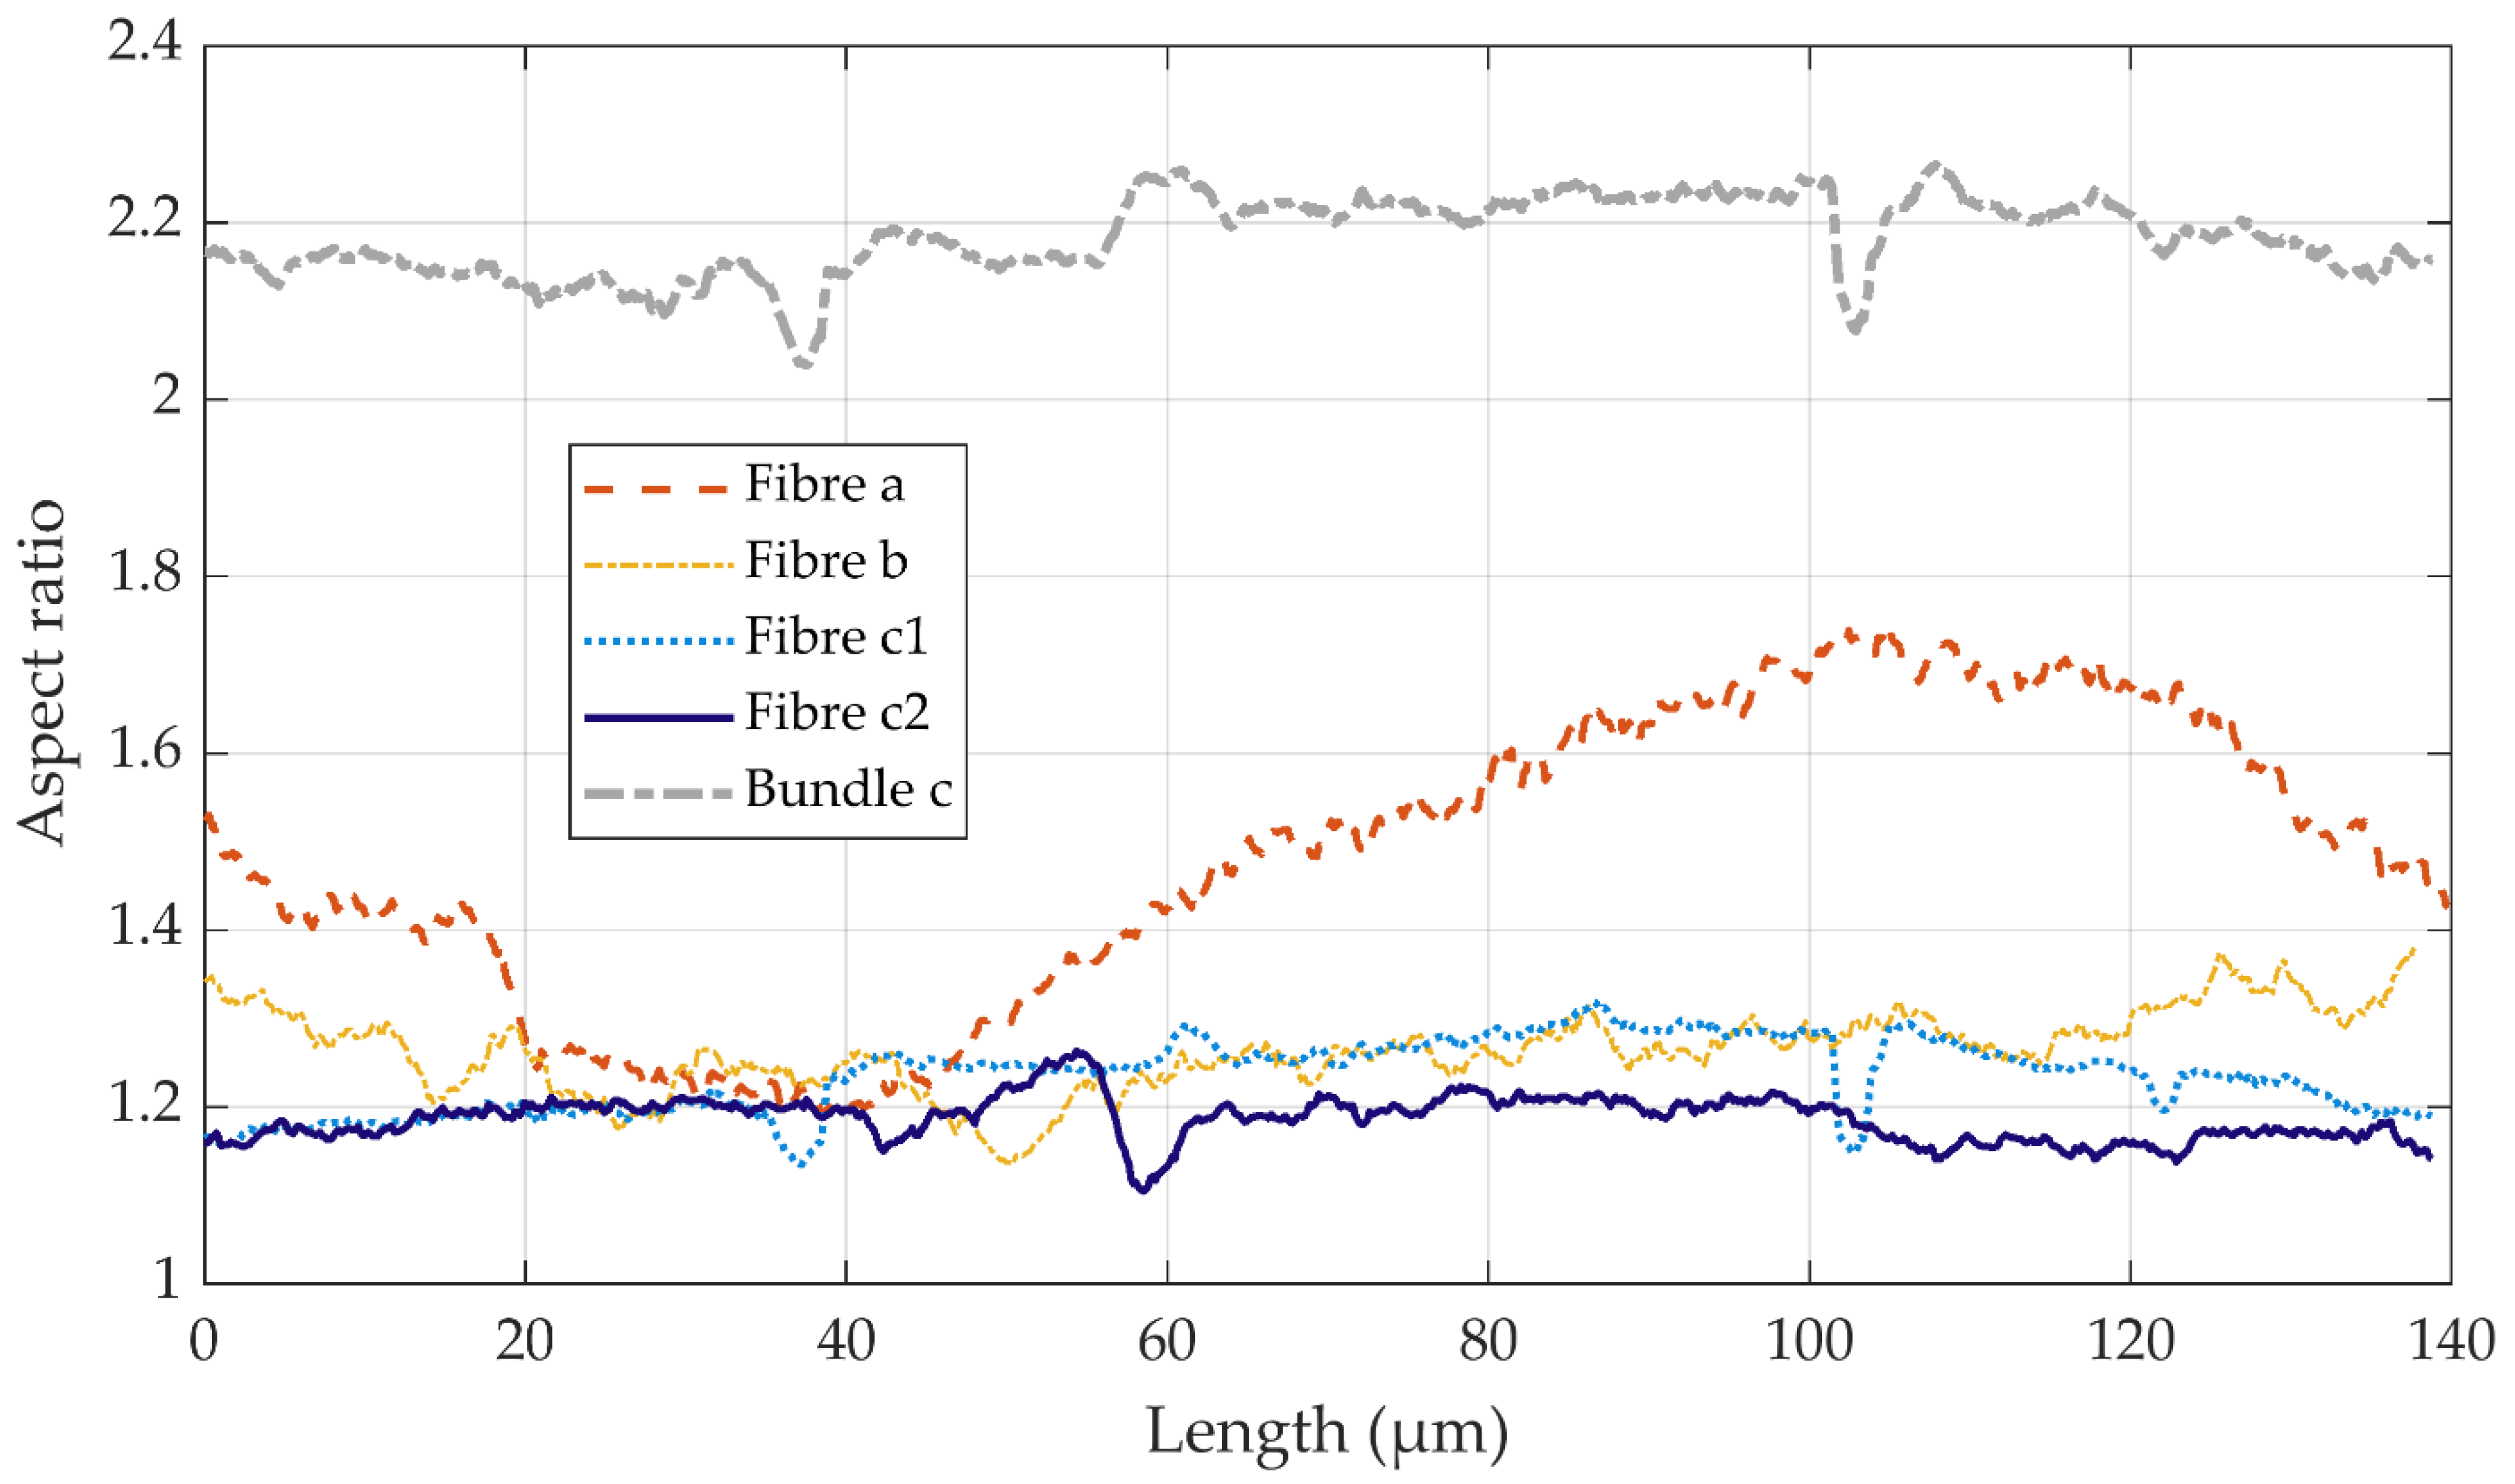
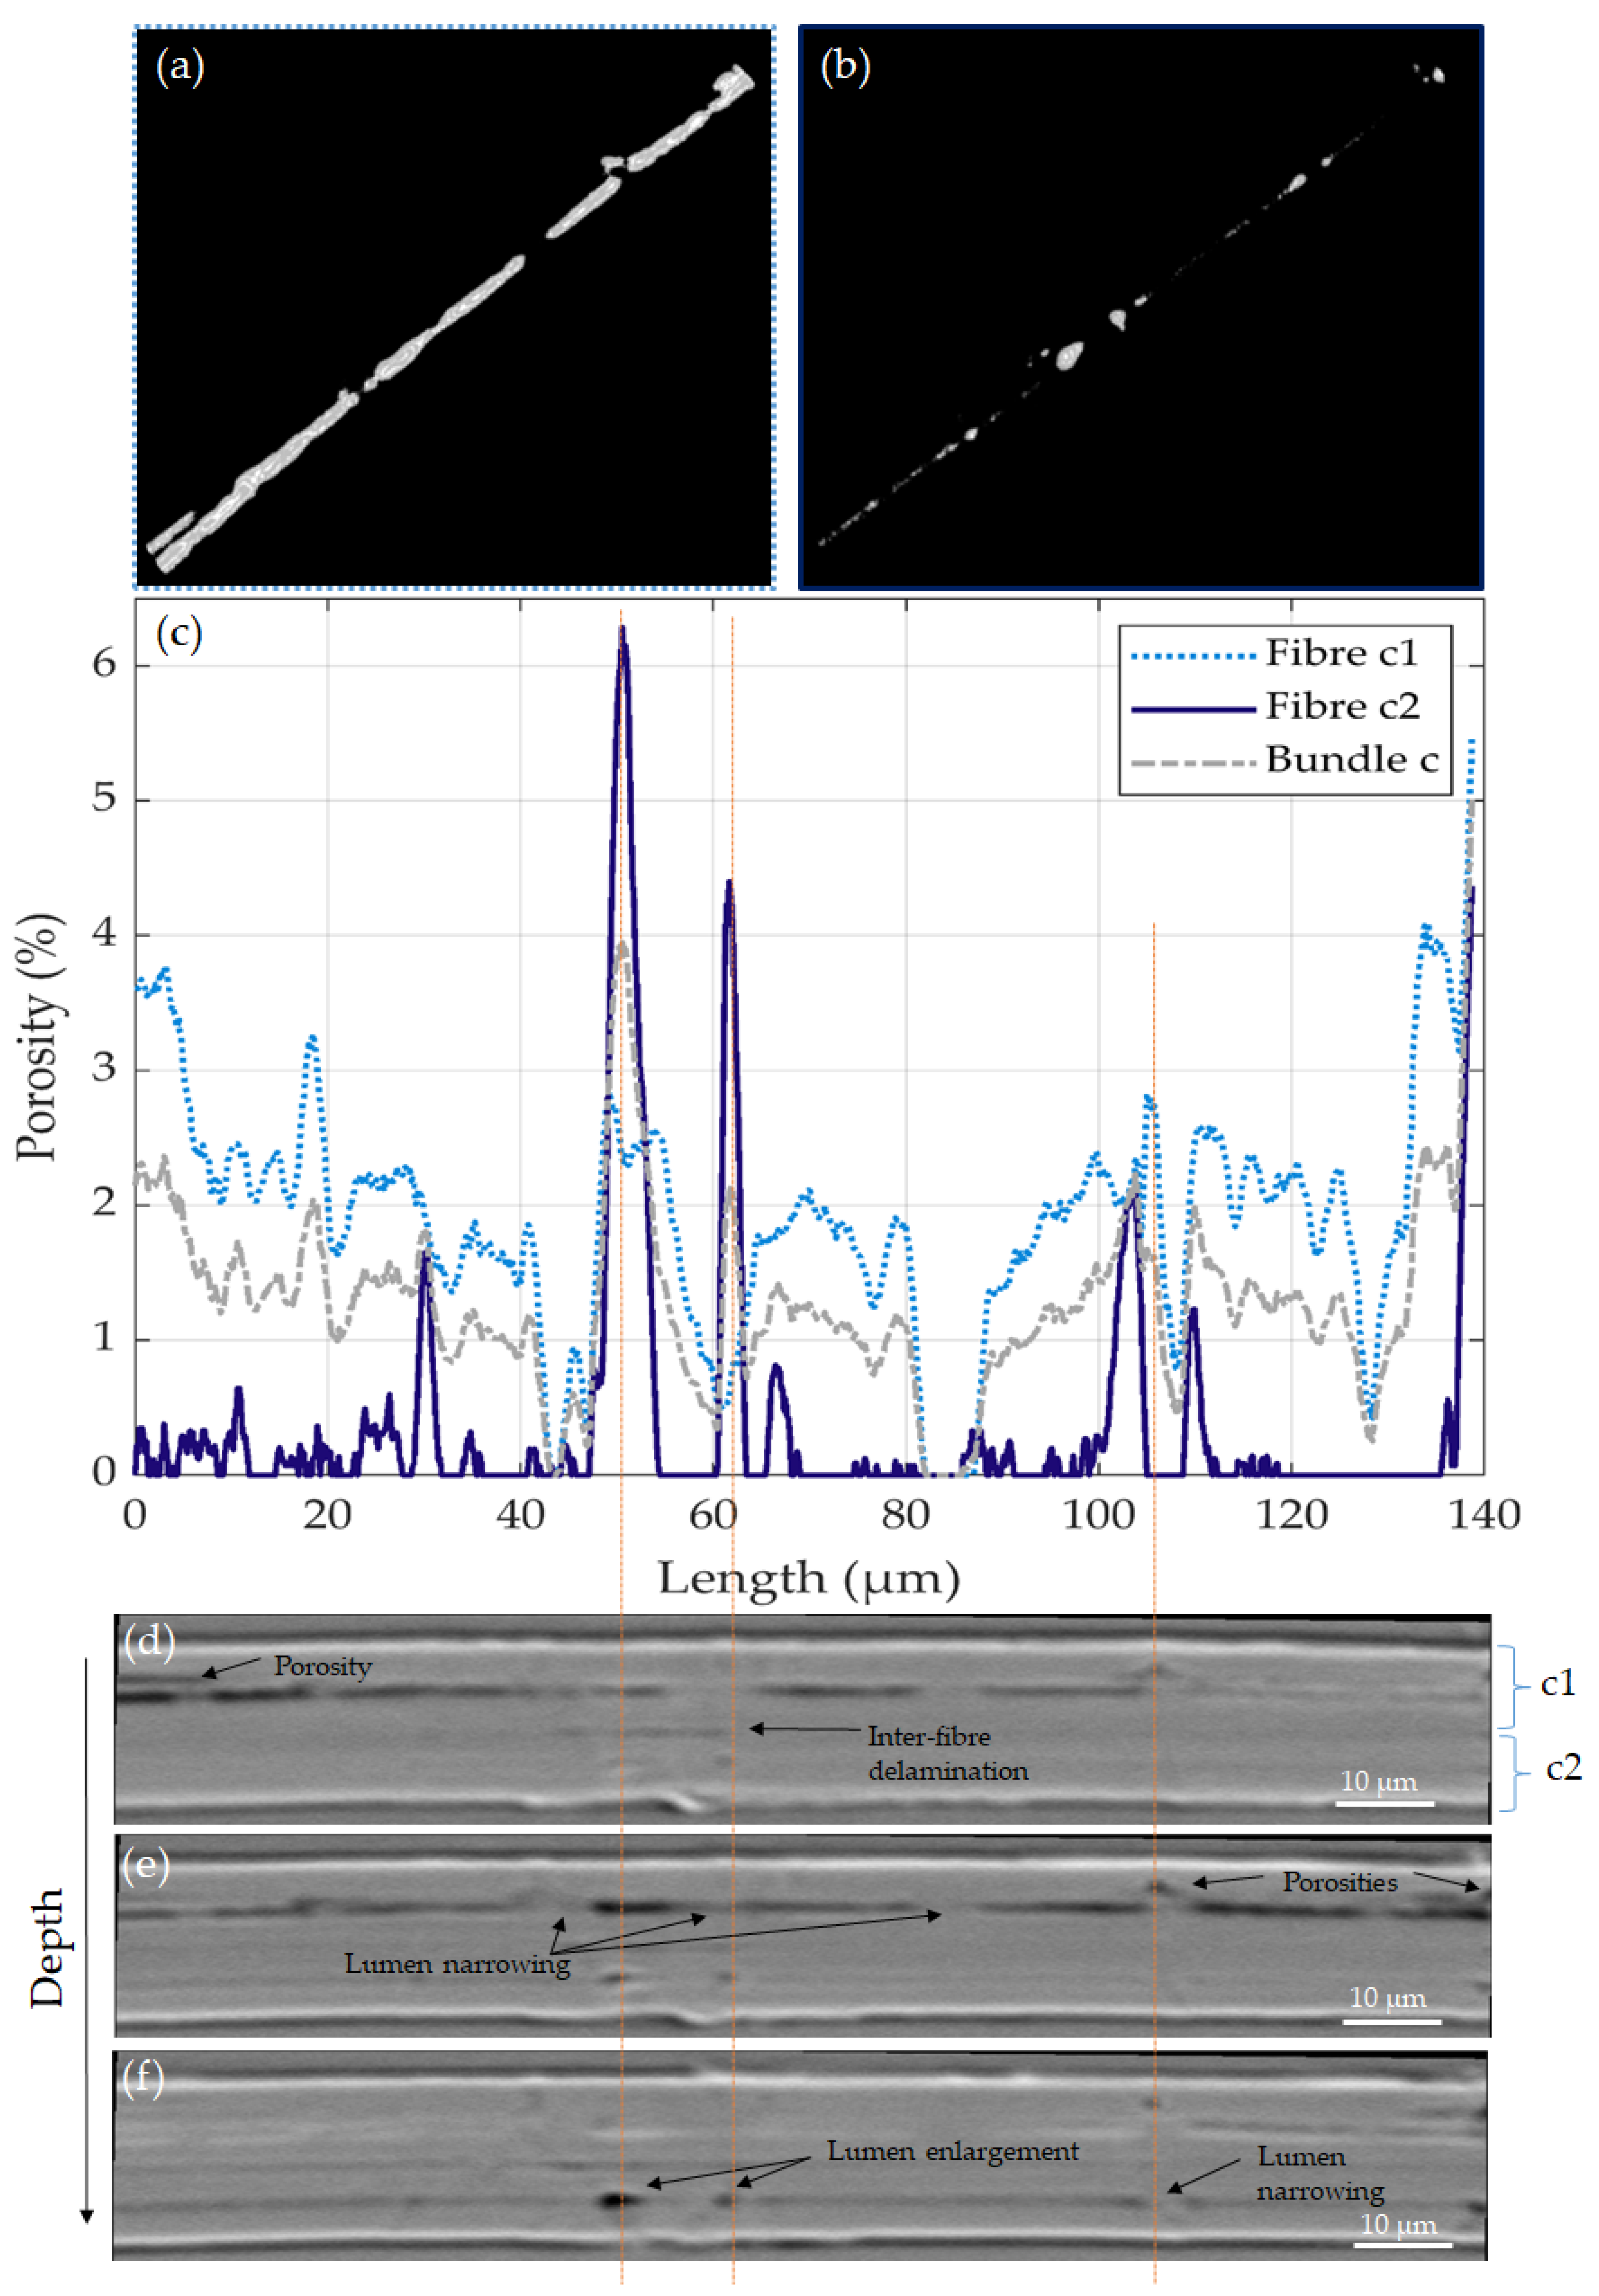
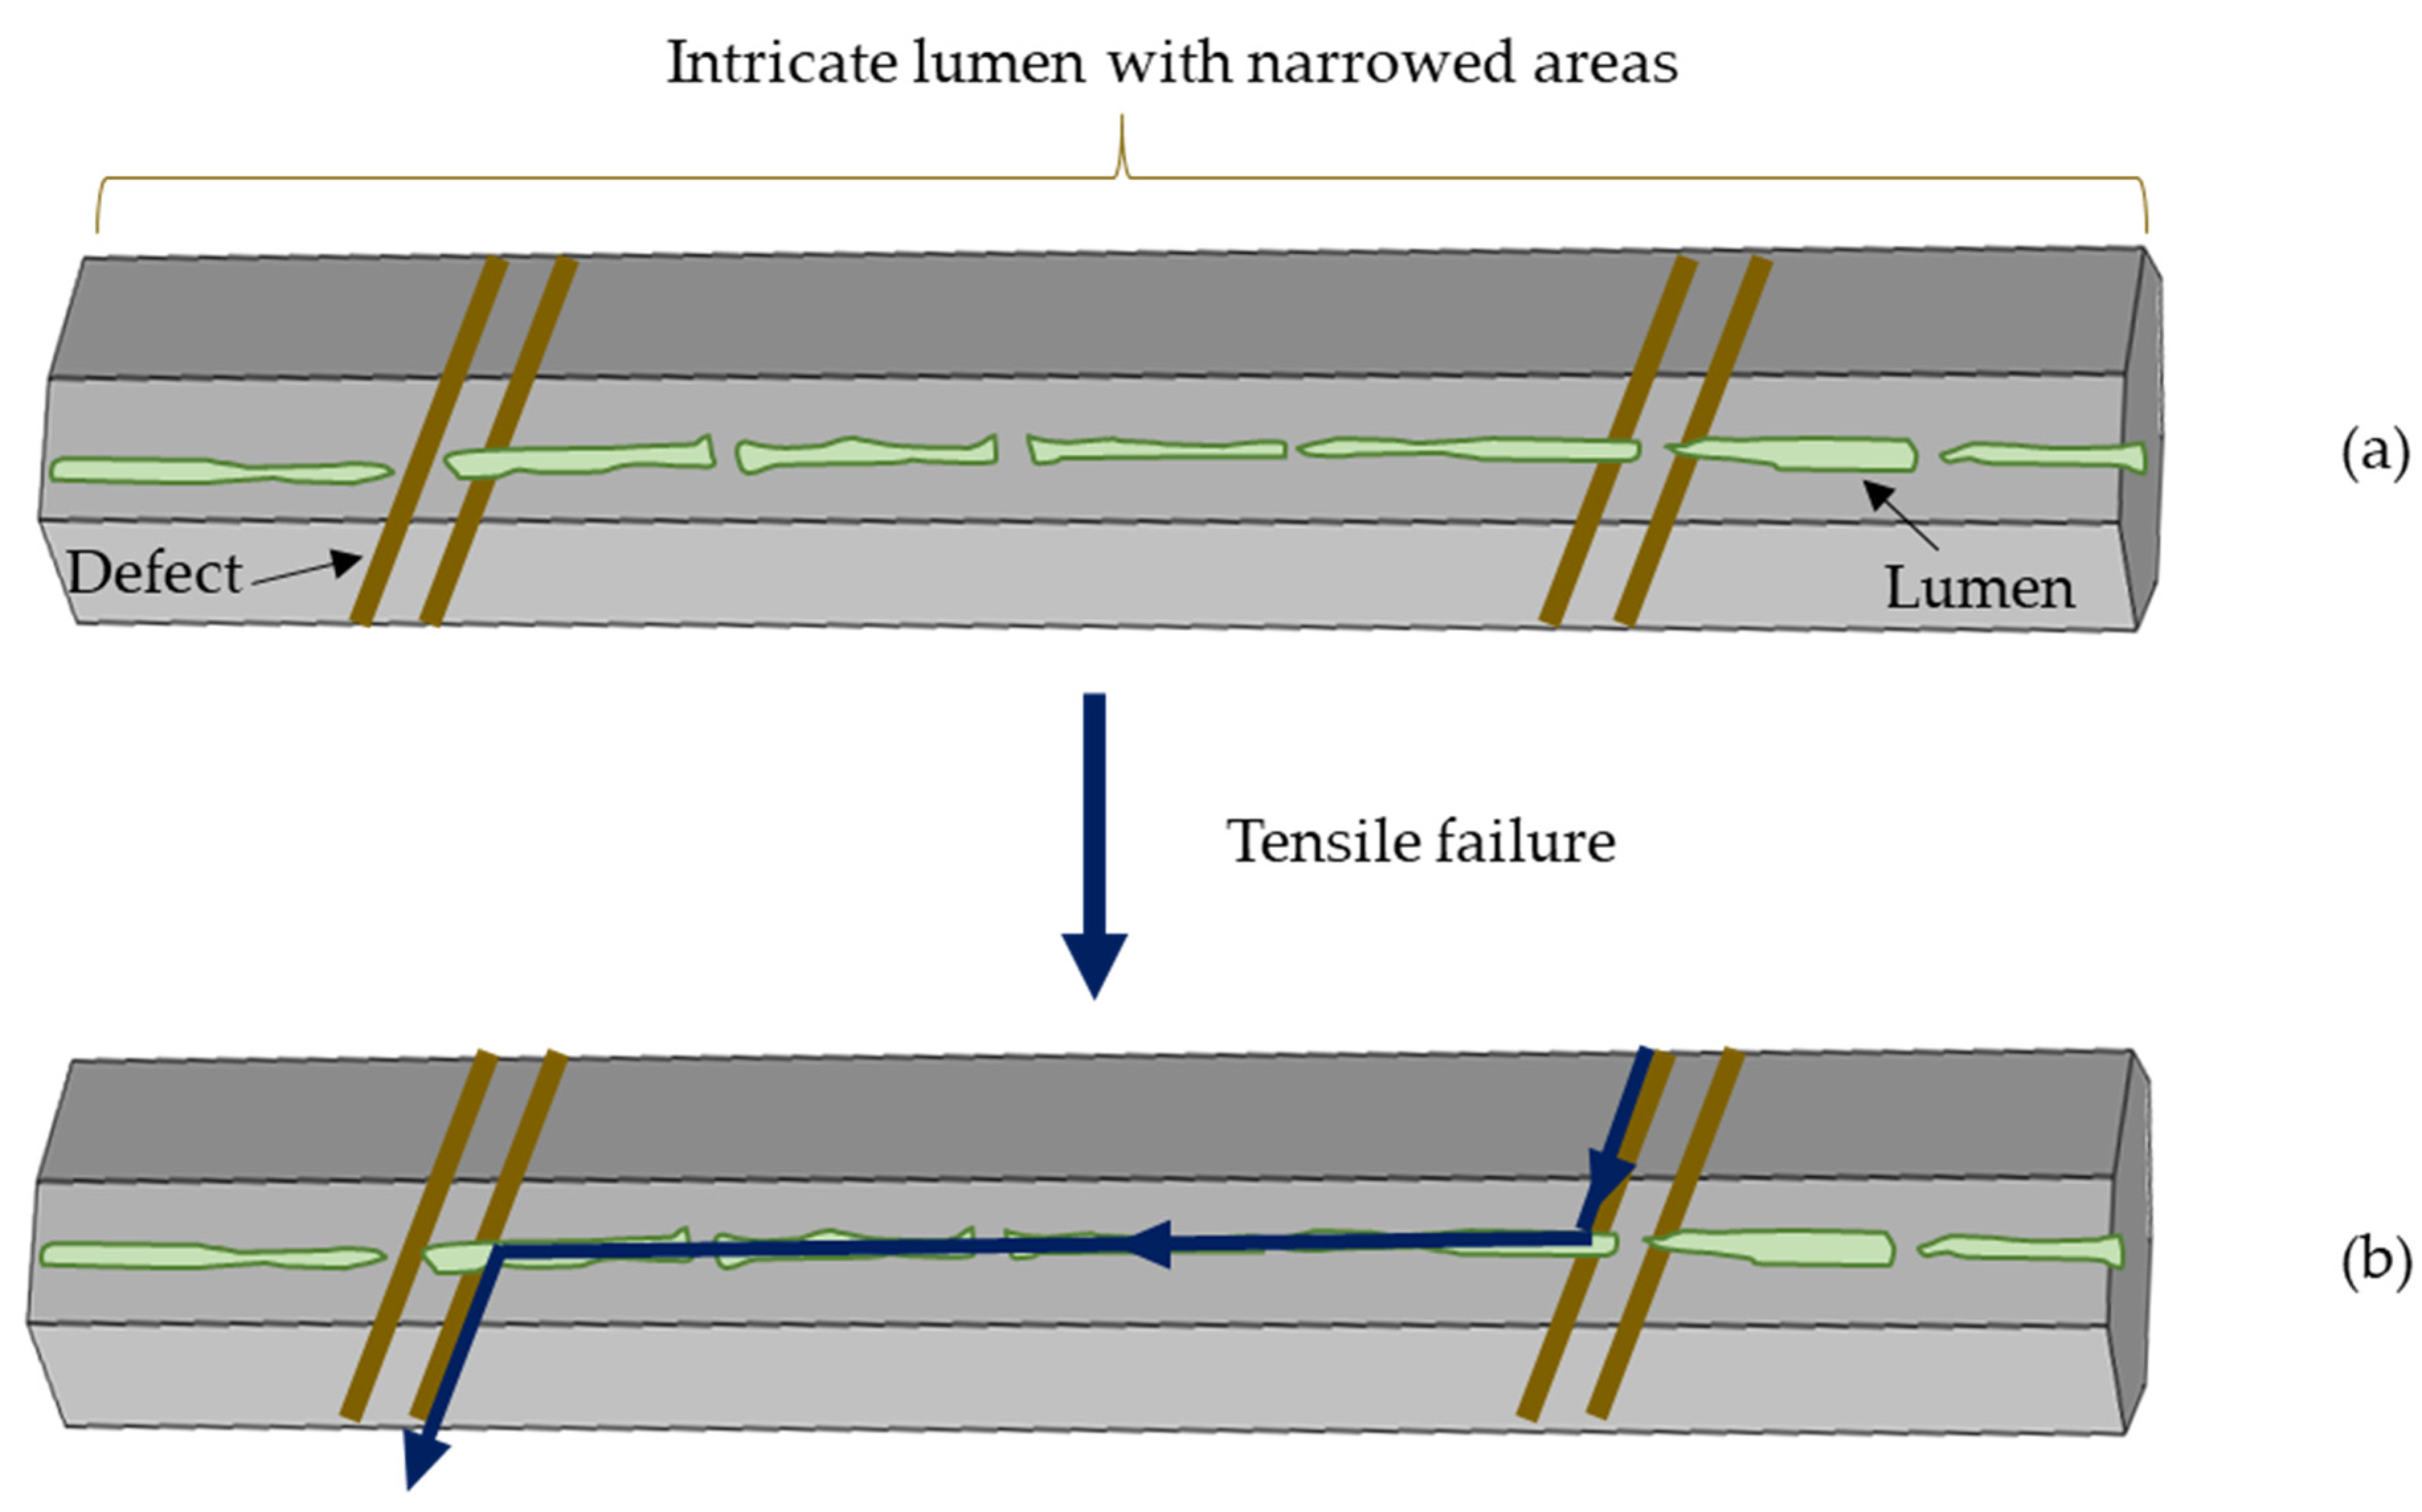
3.4. Lumen, Defects and Fibre Failure
4. Discussion
5. Conclusions
Supplementary Materials
Author Contributions
Funding
Institutional Review Board Statement
Informed Consent Statement
Data Availability Statement
Acknowledgments
Conflicts of Interest
References
- Charlet, K.; Jernot, J.; Eve, S.; Gomina, M.; Bréard, J. Multi-scale morphological characterisation of flax: From the stem to the fibrils. Carbohydr. Polym. 2010, 82, 54–61. [Google Scholar] [CrossRef]
- Madsen, B.; Gamstedt, E.K. Wood versus Plant Fibers: Similarities and Differences in Composite Applications. Adv. Mater. Sci. Eng. 2013, 2013, 1–14. [Google Scholar] [CrossRef] [Green Version]
- Thuault, A. Approche Multi-échelle de la Structure et du Comportement Mécanique de la Fibre de lin. Ph.D. Thesis, University of Caen Basse Normandie, Caen, France, 2011. [Google Scholar]
- Hernandez-Estrada, A.; Reza, M.; Hughes, M. The Structure of Dislocations in Hemp (Cannabis sativa L.) Fibres and Implications for Mechanical Behaviour. BioResources 2020, 15, 2579–2595. [Google Scholar]
- Zhang, H.; Sui, T.; Thygesen, L.G.; O’Brien, P.; Korsunsky, A.M. Multi-modal microscopy characterisation of nodal markings in flax fibre. In Proceedings of the World Congress on Engineering, London, UK, 1–3 July 2015. [Google Scholar]
- Beaugrand, J.; Guessasma, S.; Maigret, J.-E. Damage mechanisms in defected natural fibers. Sci. Rep. 2017, 7, 14041. [Google Scholar] [CrossRef] [Green Version]
- Guessasma, S.; Beaugrand, J. Damage Kinetics at the Sub-micrometric Scale in Bast Fibers Using Finite Element Simulation and High-Resolution X-Ray Micro-Tomography. Front. Plant Sci. 2019, 10, 194. [Google Scholar] [CrossRef] [PubMed] [Green Version]
- Garat, W.; Le Moigne, N.; Corn, S.; Beaugrand, J.; Bergeret, A. Swelling of natural fibre bundles under hygro- and hydrothermal conditions: Determination of hydric expansion coefficients by automated laser scanning. Compos. Part A Appl. Sci. Manuf. 2020, 131, 105803. [Google Scholar] [CrossRef]
- Le Duigou, A.; Requile, S.; Beaugrand, J.; Scarpa, F.; Castro, M. Natural fibres actuators for smart bio-inspired hygromorph biocomposites. Smart Mater. Struct. 2017, 26, 125009. [Google Scholar] [CrossRef] [Green Version]
- Li, Y.; Ma, H.; Shen, Y.; Li, Q.; Zheng, Z. Effects of resin inside fiber lumen on the mechanical properties of sisal fiber reinforced composites. Compos. Sci. Technol. 2015, 108, 32–40. [Google Scholar] [CrossRef]
- Baley, C.; Perrot, Y.; Busnel, F.; Guézénoc, H.; Davies, P. Transverse tensile behaviour of unidirectional plies reinforced with flax fibres. Mater. Lett. 2006, 60, 2984–2987. [Google Scholar] [CrossRef] [Green Version]
- Aslan, M.; Chinga-Carrasco, G.; Sørensen, B.F.; Madsen, B. Strength variability of single flax fibres. J. Mater. Sci. 2011, 46, 6344–6354. [Google Scholar] [CrossRef] [Green Version]
- Charlet, K.; Jernot, J.-P.; Breard, J.; Gomina, M. Scattering of morphological and mechanical properties of flax fibres. Ind. Crop. Prod. 2010, 32, 220–224. [Google Scholar] [CrossRef]
- Liu, K.; Takagi, H.; Osugi, R.; Yang, Z. Effect of lumen size on the effective transverse thermal conductivity of unidirectional natural fiber composites. Compos. Sci. Technol. 2012, 72, 633–639. [Google Scholar] [CrossRef]
- Fidelis, M.E.A.; Pereira, T.V.C.; Gomes, O.D.F.M.; Silva, F.D.A.; Filho, R.D.T. The effect of fiber morphology on the tensile strength of natural fibers. J. Mater. Res. Technol. 2013, 2, 149–157. [Google Scholar] [CrossRef] [Green Version]
- Schäfer, T.; Honermeier, B. Effect of sowing date and plant density on the cell morphology of hemp (Cannabis sativa L.). Ind. Crop. Prod. 2006, 23, 88–98. [Google Scholar] [CrossRef]
- Beaugrand, J.; Nottez, M.; Konnerth, J.; Bourmaud, A. Multi-scale analysis of the structure and mechanical performance of woody hemp core and the dependence on the sampling location. Ind. Crop. Prod. 2014, 60, 193–204. [Google Scholar] [CrossRef]
- Charlet, K. Contribution à l’étude de Composites Unidirectionnels Renforcés par des Fibres de lin: Relation Entre la Microstructure de la Fibre et ses Propriétés Mécaniques. Ph.D. Thesis, University of Caen Basse Normandie, Caen, France, 2008. [Google Scholar]
- De Rosa, I.M.; Kenny, J.M.; Puglia, D.; Santulli, C.; Sarasini, F. Morphological, thermal and mechanical characterization of okra (Abelmoschus esculentus) fibres as potential reinforcement in polymer composites. Compos. Sci. Technol. 2010, 70, 116–122. [Google Scholar] [CrossRef]
- Abbey, B.; Eve, S.; Thuault, A.; Charlet, K.; Korsunsky, A. Synchrotron X-ray tomographic investigation of internal structure of individual flax fibres. In Proceedings of the 6th World Congress of Biomechanics (WCB 2010), Singapore, 1–6 August 2010; pp. 1151–1154. [Google Scholar]
- Legland, D.; Arganda-Carreras, I.; Andrey, P. MorphoLibJ: Integrated library and plugins for mathematical morphology with ImageJ. Bioinformatics 2016, 32, 413–3534. [Google Scholar] [CrossRef] [Green Version]
- Melelli, A.; Arnould, O.; Beaugrand, J.; Bourmaud, A. The Middle Lamella of Plant Fibers Used as Composite Reinforcement: Investigation by Atomic Force Microscopy. Molecules 2020, 25, 632. [Google Scholar] [CrossRef] [Green Version]
- Nečas, D.; Klapetek, P. Gwyddion: An open-source software for SPM data analysis. Open Phys. 2012, 10. [Google Scholar] [CrossRef]
- Bourmaud, A.; Beaugrand, J.; Shah, D.U.; Placet, V.; Baley, C. Towards the design of high-performance plant fibre composites. Prog. Mater. Sci. 2018, 97, 347–408. [Google Scholar] [CrossRef]
- Ageeva, M.V.; Petrovská, B.; Kieft, H.; Sal’Nikov, V.V.; Snegireva, A.V.; Van Dam, J.E.G.; Van Veenendaal, W.L.H.; Emons, A.M.C.; Gorshkova, T.A.; Van Lammeren, A.A.M. Intrusive growth of flax phloem fibers is of intercalary type. Planta 2005, 222, 565–574. [Google Scholar] [CrossRef] [PubMed]
- Gorshkova, T.A.; Sal’Nikov, V.V.; Chemikosova, S.B.; Ageeva, M.V.; Pavlencheva, N.V.; Van Dam, J.E. The snap point: A transition point in Linum usitatissimum bast fiber development. Ind. Crop. Prod. 2003, 18, 213–221. [Google Scholar] [CrossRef]
- Bourmaud, A.; Gibaud, M.; Lefeuvre, A.; Morvan, C.; Baley, C. Influence of the morphology characters of the stem on the lodging resistance of Marylin flax. Ind. Crop. Prod. 2015, 66, 27–37. [Google Scholar] [CrossRef]
- Snegireva, A.V.; Ageeva, M.V.; Amenitskii, S.I.; Chernova, T.E.; Ebskamp, M.; Gorshkova, T.A. Intrusive growth of sclerenchyma fibers. Russ. J. Plant Physiol. 2010, 57, 342–355. [Google Scholar] [CrossRef]
- Ageeva, M.V.; Chernova, T.E.; Gorshkova, T.A. Processes of protoplast senescence and death in flax fibers: An ultrastructural analysis. Russ. J. Dev. Biol. 2012, 43, 94–100. [Google Scholar] [CrossRef]
- Ibragimova, N.N.; Ageeva, M.V.; Gorshkova, T.A. Development of gravitropic response: Unusual behavior of flax phloem G-fibers. Protoplasma 2016, 254, 749–762. [Google Scholar] [CrossRef]
- Schmid, R.; Evert, R.F. (Franklin) Esau’s Plant Anatomy: Meristems, Cells, and Tissues of the Plant Body: Their Structure, Function, and Development. TAXON 2008, 57, 678. [Google Scholar] [CrossRef]
- Pejic, B.M.; Kostic, M.M.; Skundric, P.D.; Praskalo, J.Z. The effects of hemicelluloses and lignin removal on water uptake behavior of hemp fibers. Bioresour. Technol. 2008, 99, 7152–7159. [Google Scholar] [CrossRef]
- Petrova, A.A.; Kozlova, L.V.; Gaifullina, I.Z.; Ananchenko, B.A.; Martinson, E.A.; Mikshina, P.V.; Gorshkova, T.A. AFM analysis reveals polymorphism of purified flax rhamnogalacturonans I of distinct functional types. Carbohydr. Polym. 2019, 216, 238–246. [Google Scholar] [CrossRef]
- Baley, C.; Morvan, C.; Grohens, Y. Influence of the Absorbed Water on the Tensile Strength of Flax Fibers. Macromol. Symp. 2005, 222, 195–202. [Google Scholar] [CrossRef]
- Morvan, C.; Andème-Onzighi, C.; Girault, R.; Himmelsbach, D.S.; Driouich, A.; Akin, D.E. Building flax fibres: More than one brick in the walls. Plant Physiol. Biochem. 2003, 41, 935–944. [Google Scholar] [CrossRef]
- Milthorpe, F.L. Fibre Development of Flax in Relation to Water Supply and Light IntensityI. Ann. Bot. 1945, 9, 31–53. [Google Scholar] [CrossRef]
- Gibaud, M.; Bourmaud, A.; Baley, C. Understanding the lodging stability of green flax stems; The importance of morphology and fibre stiffness. Biosyst. Eng. 2015, 137, 9–21. [Google Scholar] [CrossRef]
- Joffre, T.; Isaksson, P.; Dumont, P.J.J.; du Roscoat, S.R.; Sticko, S.; Orgéas, L.; Gamstedt, E.K. A Method to Measure Moisture Induced Swelling Properties of a Single Wood Cell. Exp. Mech. 2016, 56, 723–733. [Google Scholar] [CrossRef]
- Akin, D.E. Linen Most Useful: Perspectives on Structure, Chemistry, and Enzymes for Retting Flax. ISRN Biotechnol. 2013, 2013, 1–23. [Google Scholar] [CrossRef] [PubMed] [Green Version]
- Rask, M.; Madsen, B.; Sørensen, B.F.; Fife, J.L.; Martyniuk, K.; Lauridsen, E.M. In situ observations of microscale damage evolution in unidirectional natural fibre composites. Compos. Part A Appl. Sci. Manuf. 2012, 43, 1639–1649. [Google Scholar] [CrossRef] [Green Version]
- Wang, H.M.; Wang, X. Surface morphologies and internal fine structures of bast fibers. Fibers Polym. 2005, 6, 6–12. [Google Scholar] [CrossRef] [Green Version]
- Bos, H.L.; Oever, M.J.A.V.D.; Peters, O.C.J.J. Tensile and compressive properties of flax fibres for natural fibre reinforced composites. J. Mater. Sci. 2002, 37, 1683–1692. [Google Scholar] [CrossRef]
- Madsen, B.; Aslan, M.; Lilholt, H. Fractographic observations of the microstructural characteristics of flax fibre composites. Compos. Sci. Technol. 2016, 123, 151–162. [Google Scholar] [CrossRef] [Green Version]


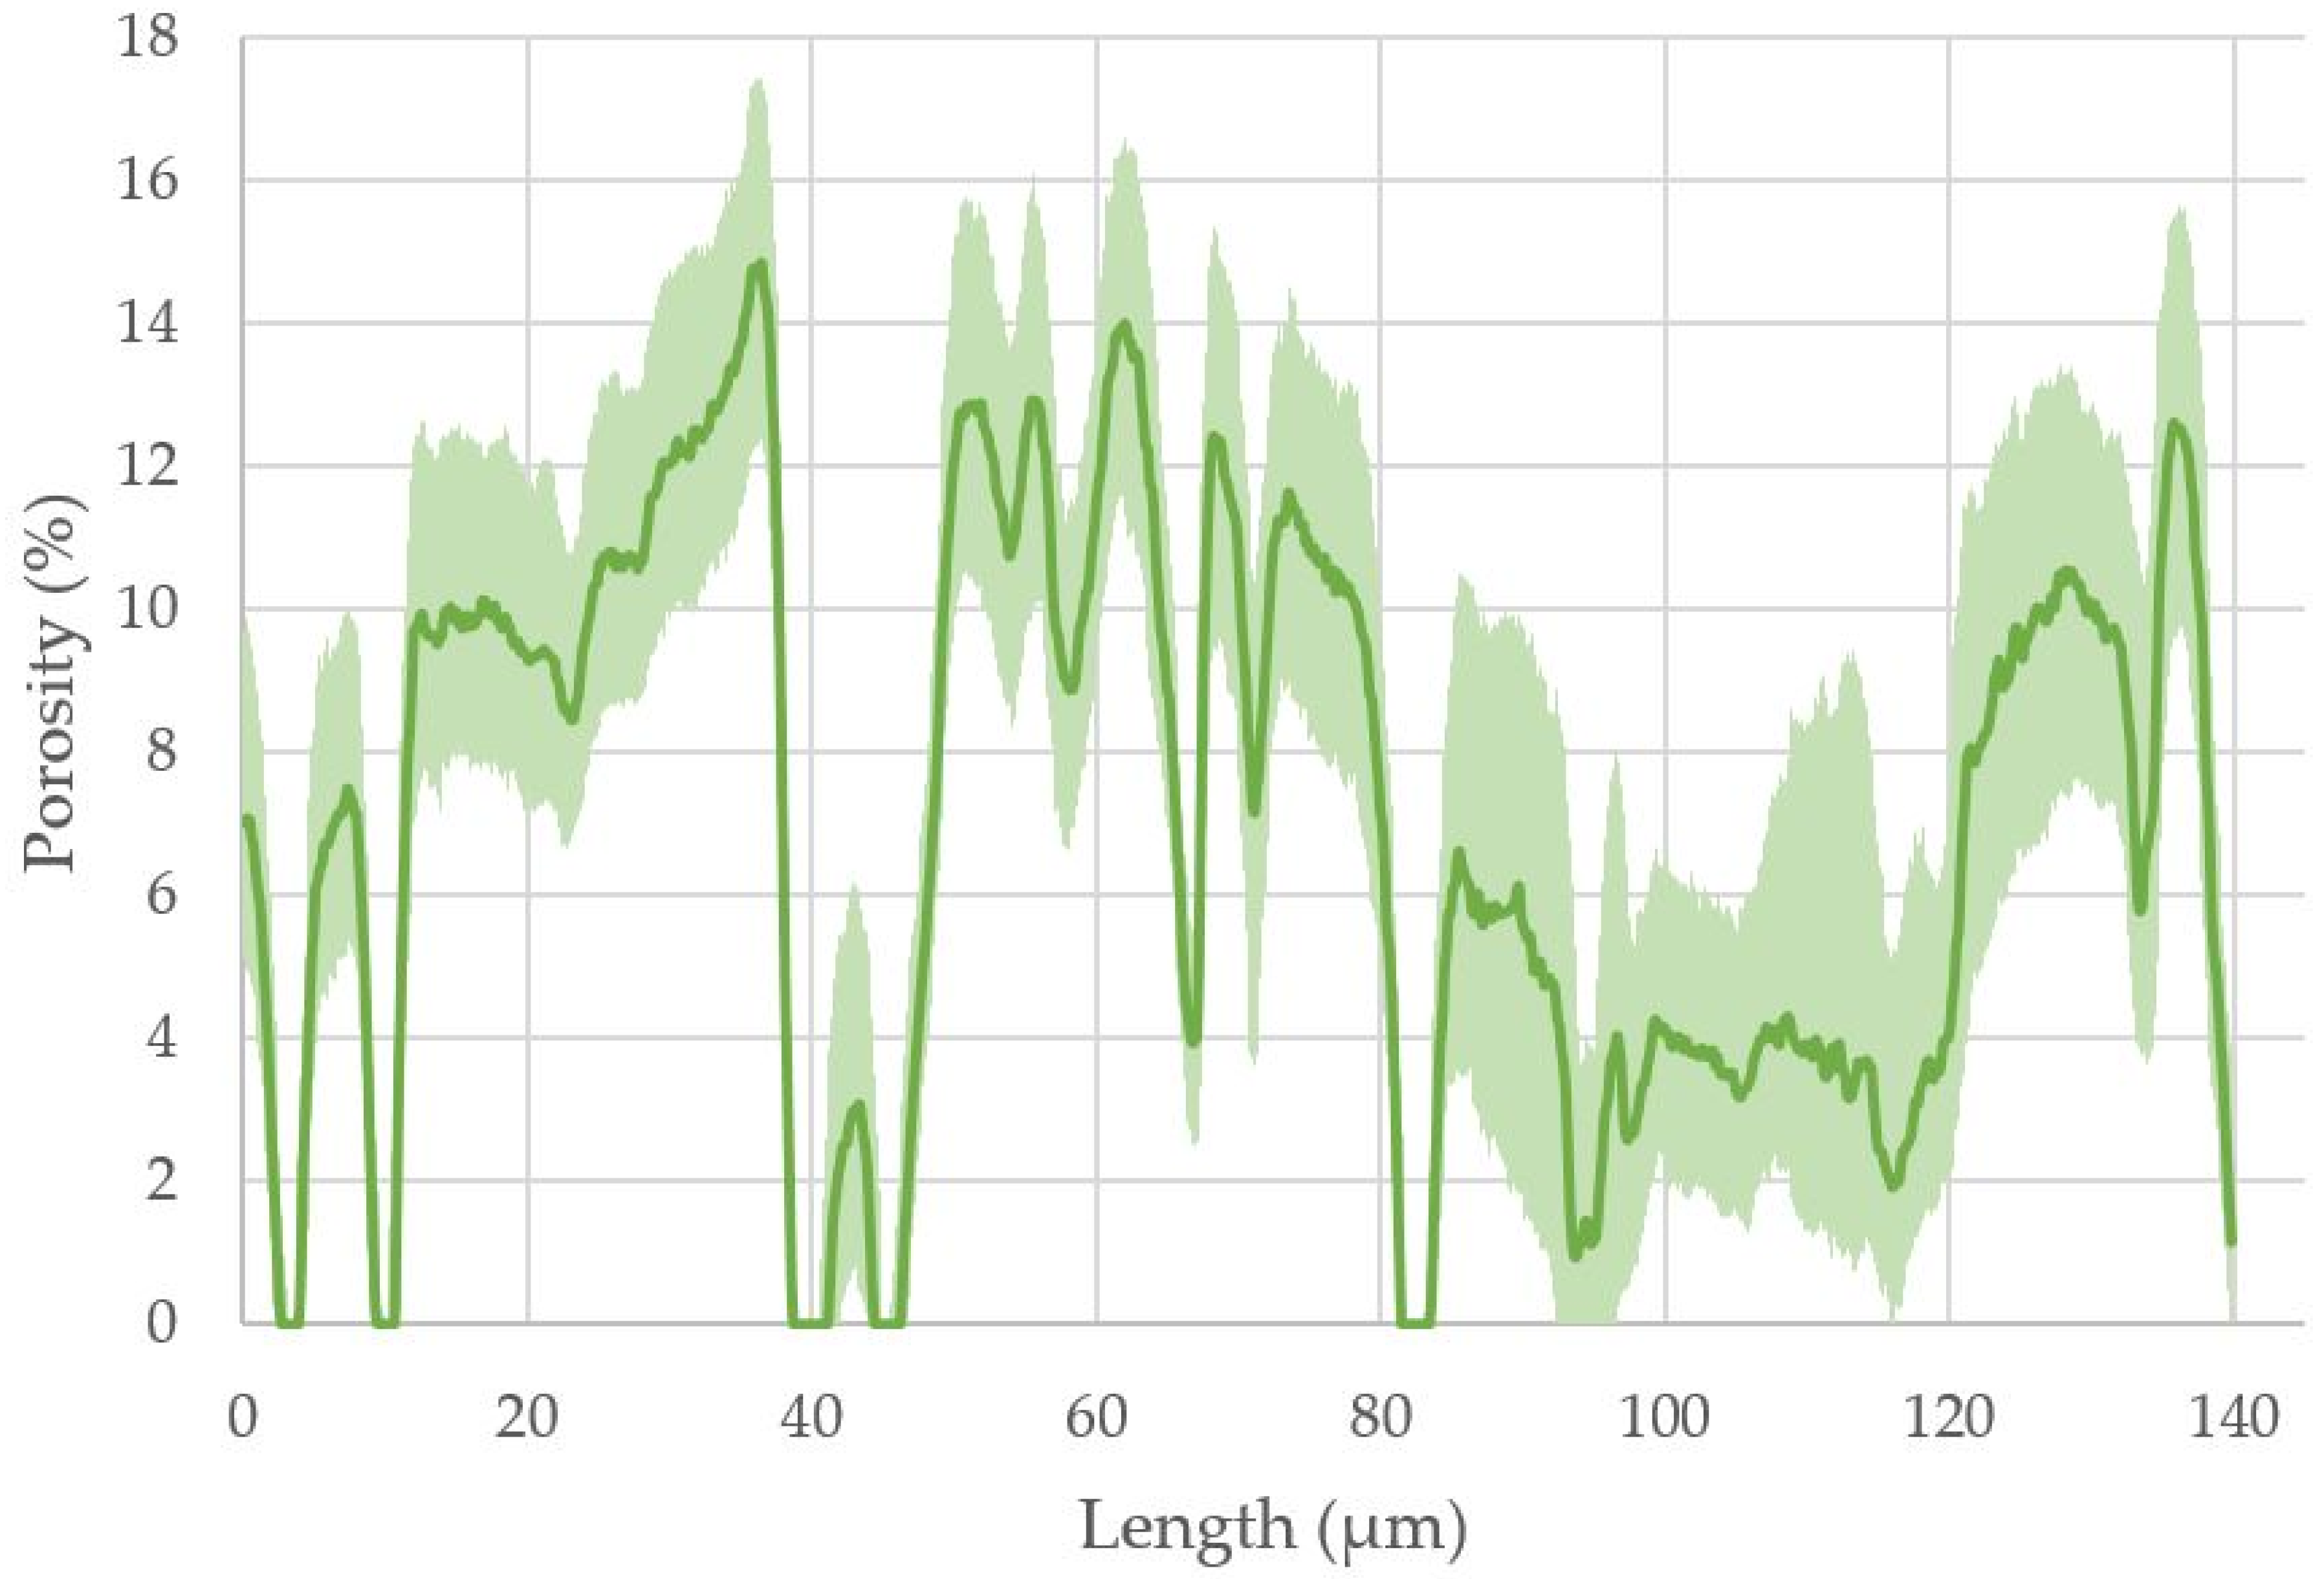
| Fibre Surface Area (µm2) | Lumen Surface Area (µm2) | Porosity (%) | |
|---|---|---|---|
| Mean | 129 | 1.1 | 1.2 |
| Standard deviation | 87 | 0.7 | 1.1 |
| Minimum | 23 | 0.1 | 0.4 |
| Maximum | 307 | 2.4 | 4.3 |
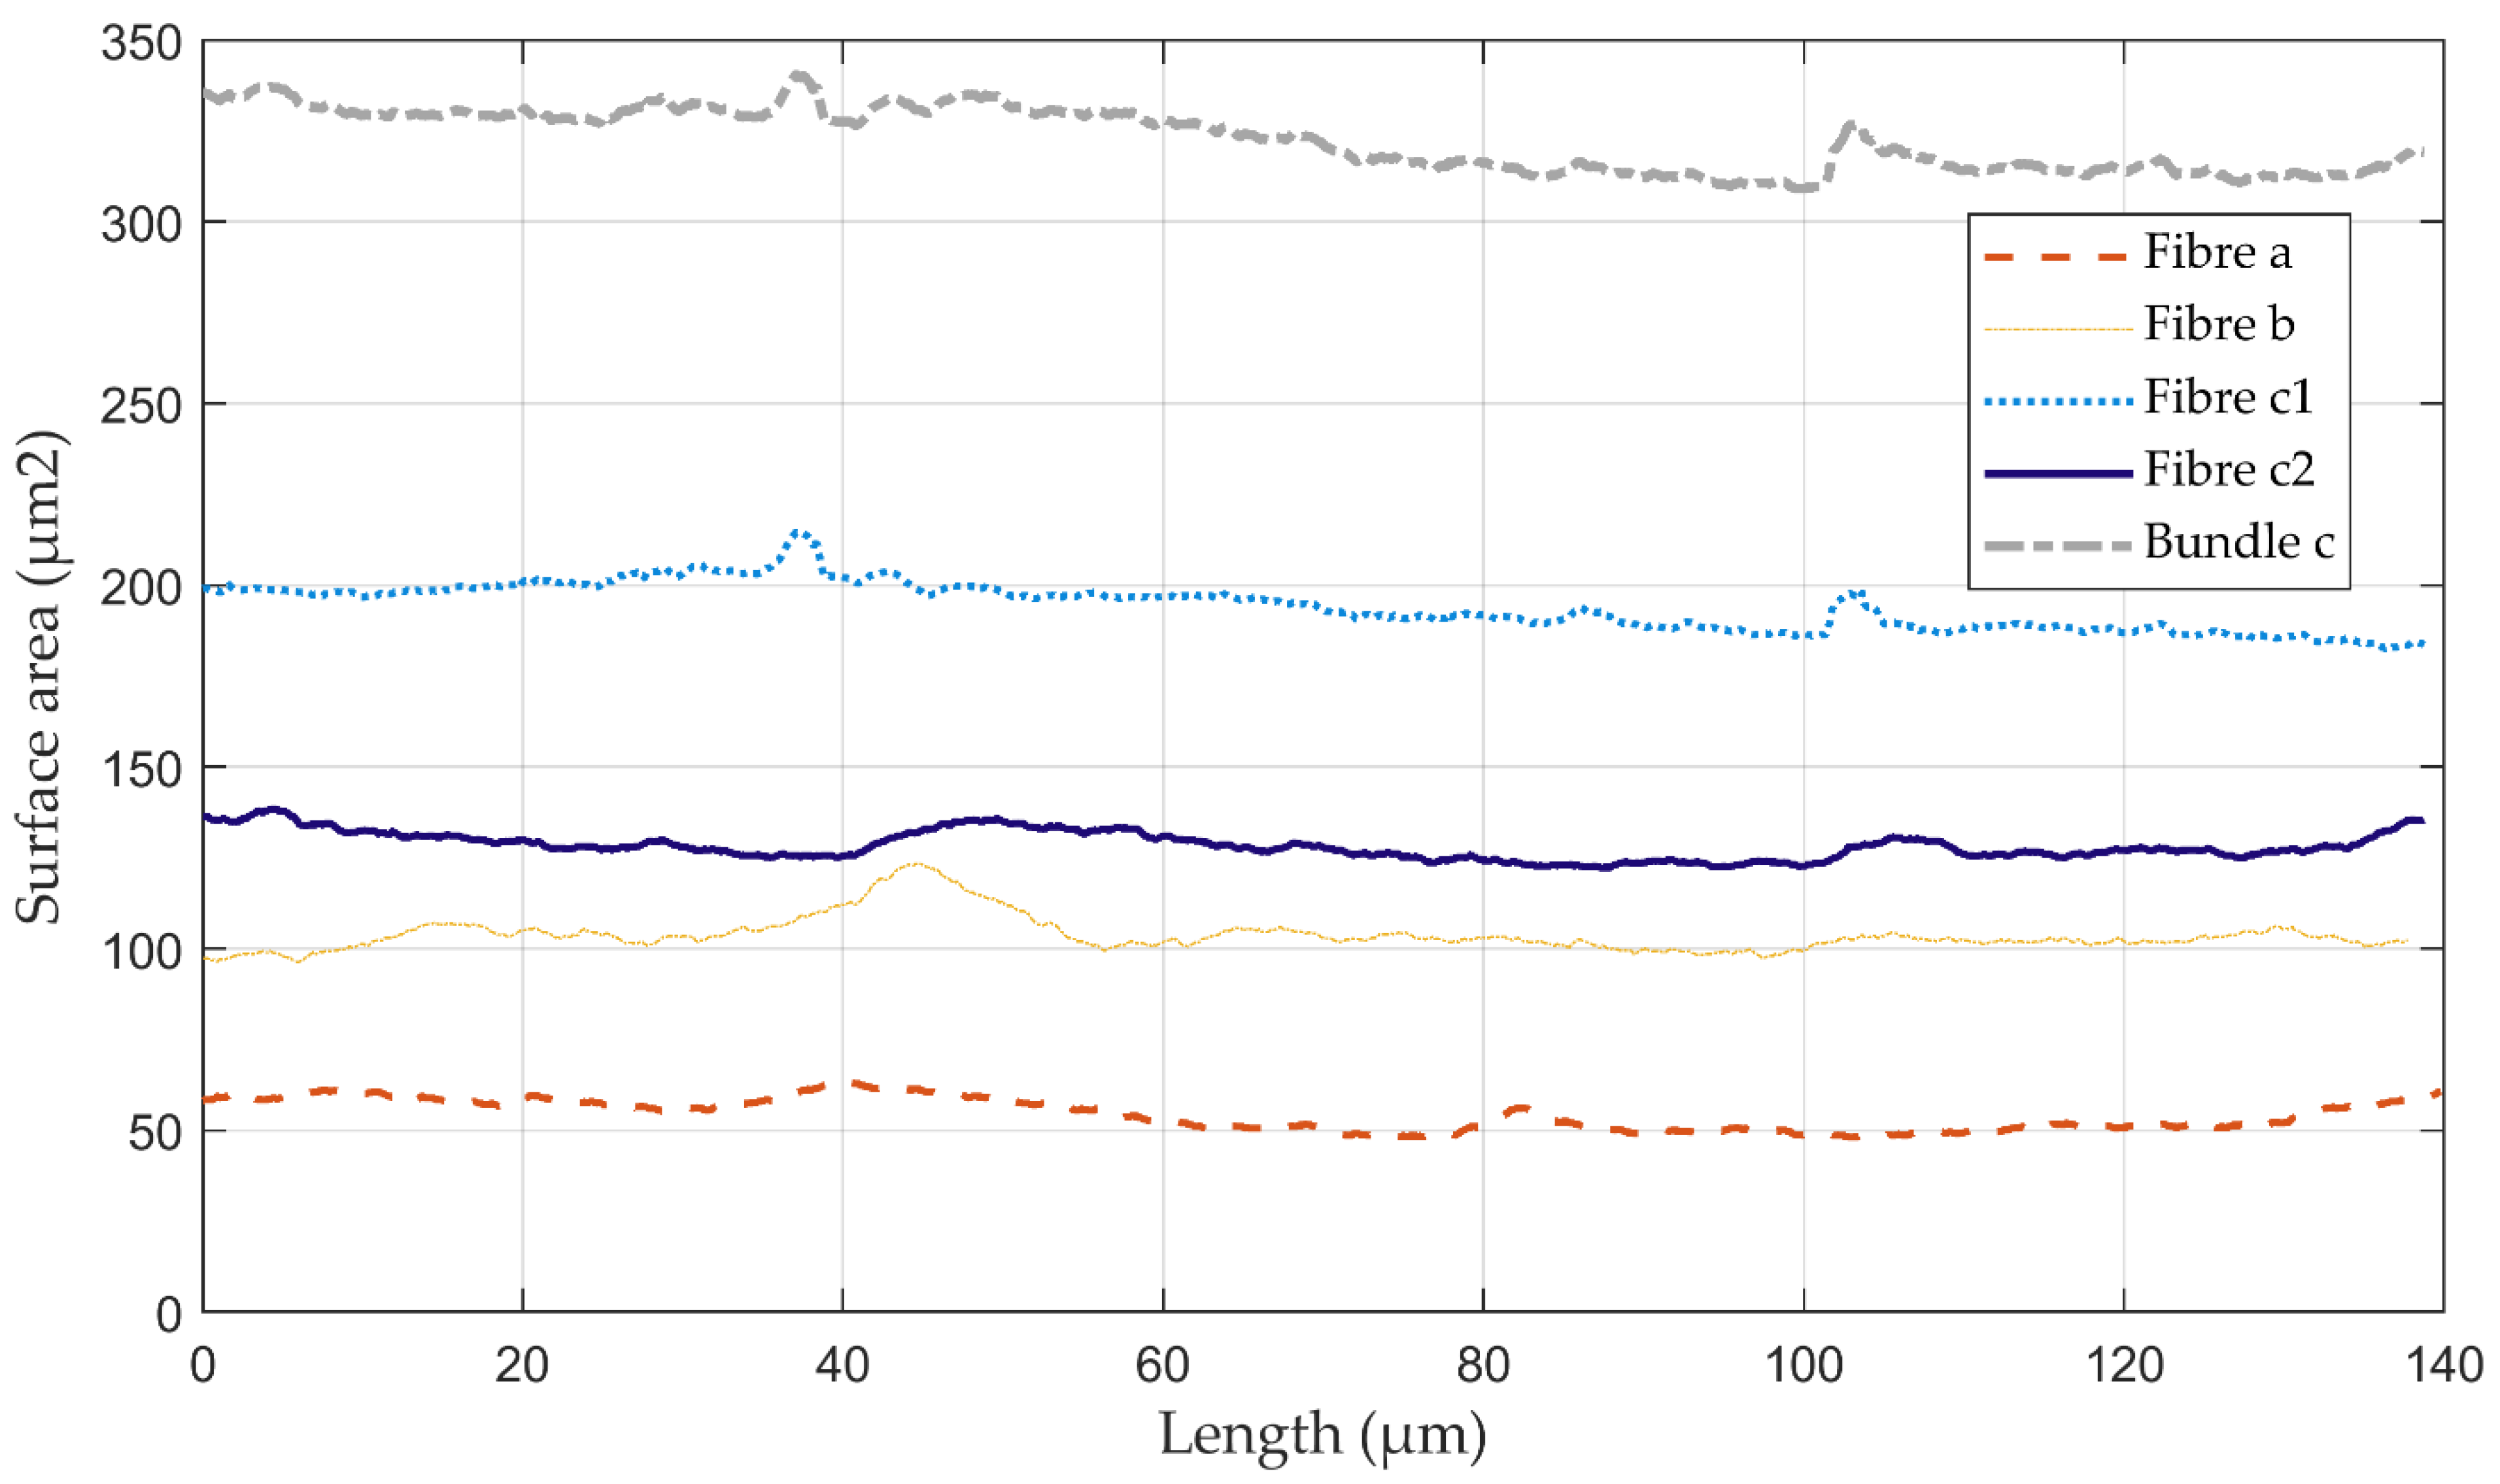
| Flax Sample | Fibre a | Fibre b | Bundle c | Fibre c1 | Fibre c2 | Mean | |
|---|---|---|---|---|---|---|---|
| Aspect ratio | µ | 1.48 | 1.26 | 2.18 | 1.24 | 1.19 | 1.29 |
| σ | 0.17 | 0.04 | 0.04 | 0.04 | 0.02 | 0.11 | |
| Surface area (µm2) | µ | 54.3 | 103.8 | 322.5 | 194.2 | 128.3 | 120.2 |
| σ | 4.3 | 4.9 | 8.4 | 6.4 | 3.7 | 50.4 | |
| Porosity (%) | µ | 7.2 | 2.6 | 1.3 | 1.9 | 0.4 | 3.0 |
| σ | 4.0 | 1.1 | 0.7 | 0.9 | 1.0 | 2.5 | |
Publisher’s Note: MDPI stays neutral with regard to jurisdictional claims in published maps and institutional affiliations. |
© 2021 by the authors. Licensee MDPI, Basel, Switzerland. This article is an open access article distributed under the terms and conditions of the Creative Commons Attribution (CC BY) license (https://creativecommons.org/licenses/by/4.0/).
Share and Cite
Richely, E.; Durand, S.; Melelli, A.; Kao, A.; Magueresse, A.; Dhakal, H.; Gorshkova, T.; Callebert, F.; Bourmaud, A.; Beaugrand, J.; et al. Novel Insight into the Intricate Shape of Flax Fibre Lumen. Fibers 2021, 9, 24. https://0-doi-org.brum.beds.ac.uk/10.3390/fib9040024
Richely E, Durand S, Melelli A, Kao A, Magueresse A, Dhakal H, Gorshkova T, Callebert F, Bourmaud A, Beaugrand J, et al. Novel Insight into the Intricate Shape of Flax Fibre Lumen. Fibers. 2021; 9(4):24. https://0-doi-org.brum.beds.ac.uk/10.3390/fib9040024
Chicago/Turabian StyleRichely, Emmanuelle, Sylvie Durand, Alessia Melelli, Alexander Kao, Anthony Magueresse, Hom Dhakal, Tatyana Gorshkova, Franck Callebert, Alain Bourmaud, Johnny Beaugrand, and et al. 2021. "Novel Insight into the Intricate Shape of Flax Fibre Lumen" Fibers 9, no. 4: 24. https://0-doi-org.brum.beds.ac.uk/10.3390/fib9040024