
Application of Capillary Polypropylene Membranes for Microfiltration of Oily Wastewaters: Experiments and Modeling


1
Faculty of Chemical Technology and Engineering, West Pomeranian University of Technology in Szczecin, ul. Pułaskiego 10, 70-322 Szczecin, Poland
2
CEA, DES, IRESNE/DEC, 13108 Saint-Paul-lez-Durance, France
*
Authors to whom correspondence should be addressed.
Fibers 2021, 9(6), 35; https://0-doi-org.brum.beds.ac.uk/10.3390/fib9060035
Submission received: 23 March 2021
/
Revised: 19 April 2021
/
Accepted: 28 May 2021
/
Published: 2 June 2021
(This article belongs to the Special Issue Hollow Fiber Membranes 2021)
Abstract
:Oily wastewaters are considered as one of the most dangerous types of environmental pollution. In the present study, the microfiltration (MF) process of model emulsions and real oily wastewaters was investigated. For this purpose, capillary polypropylene (PP) membranes were used. The experiments were conducted under transmembrane pressure (TMP) and feed flow rate (VF) equal to 0.05 MPa and 0.5 m/s, respectively. It was found that the used membranes ensured a high-quality permeate with turbidity equal to about 0.4 NTU and oil concentration of 7–15 mg/L. As expected, a significant decrease in the MF process performance was noted. However, it is shown that the initial decline of permeate flux could be slightly increased by increasing the feed temperature from 25 °C to 50 °C. Furthermore, Hermia’s models were used to interpret the fouling phenomenon occurring in studied experiments. It was determined that cake formation was the dominant fouling mechanism during filtration of both synthetic and real feeds. Through detailed studies, we present different efficient methods of membrane cleaning. Results, so far, are very encouraging and may have an important impact on increasing the use of polypropylene MF membranes in oily wastewater treatments.
1. Introduction
Oily wastewaters from shipping may seriously damage the marine environment, human health, and natural resources [1,2,3]. Indeed, ships generate large quantities of effluents containing water, fats, hydrocarbons (benzene, toluene, ethylbenzene, xylene), metal ions, detergents, surfactants, and petroleum products, such as crude oil, diesel oil, gasoline, lubricant, and kerosene [4]. To counter this, restrictive environmental regulations, requiring effective treatments of wastewaters, have been passed. According to them, the maximum concentration of oil in oily wastewaters is 5–40 mg/L [5]. For instance, the International Maritime Organization (IMO) regulations (MARPOL (Marine Pollution) 73/78) require that the amount of oil discharged into the sea from ships should be less than 15 mg/L [6]. In turn, the Oslo-Paris (OSPAR) convention regulates the maximum oil concentration in the discharged wastewater as equal to 30 mg/L [7]. Consequently, oily wastewaters are of great interest for wastewater treatment research [8]. Nevertheless, the treatment of industrial oily wastewaters is an ambitious task as they are complex media characterized by diverse and changing composition [9]. Indeed, oily wastewaters may contain suspended and dissolved species differing in concentration, size, charge, and density [10].
Currently, oily wastewater treatment includes conventional methods, such as flotation, coagulation, and biological treatment. However, they usually do not ensure that the oil concentration in the treated wastewaters is within the permissible discharge limit [11,12]. Indeed, it has been widely reported [13,14,15] that traditional techniques are not efficient for the separation of wastewaters with low oil concentration and finely dispersed oil droplets. Moreover, there are several issues associated with the application of conventional techniques [16]. As described by Sun et al. [17], the most important limitations of traditional shipboard wastewater treatment systems include, for instance, (i) high capital investment, (ii) requirement of large onboard space and additional post polishing devices, and (iii) difficulties in operation and maintenance on ships, which are not suitable for onboard installation.
Therefore, membrane-based separation processes are competitive with the traditional techniques. This is related to the fact that they offer high-quality permeate and high separation efficiency, low energy consumption, module scalability, compact design, small chemical footprint, easy installation, and straightforward automation [5,12,18,19,20,21,22,23,24]. In view of the abovementioned excellent performance of membrane techniques, there is no doubt that they can be successfully used in oily wastewater treatment. Nevertheless, it is well known that the choice of technique used for oil–water separation depends on factors such as oil droplet size, oil concentration, and chemical composition. Microfiltration (MF), a pressure-driven membrane process, has widely been recognized as an effective pretreatment process for the separation of oil droplets, total organic carbon, chemical oxygen demand, and grease from oily wastewaters. A detailed overview on oily wastewater separation using the MF process can be found in a recently published review article [5].
It must be recognized that the economic and technological viability of the MF processes is limited by membrane fouling. Roughly speaking, fouling is a phenomenon characterized by a decrease in permeate flux over time, which leads to the loss of system performance, and it is caused by interactions between the membrane and the components in the feed solution. Accordingly, during filtration of oily wastewaters, membrane fouling may be caused by the blocking of membrane pores through adsorption of continuous or disperse phases of the emulsion or their deposition onto the membrane surface [25]. Consequently, it leads to increase in energy consumption, treatment time, membrane replacement costs, etc. [8,26,27,28,29]. Hence, from the standpoint of practical operation, it is necessary to regularly carry out an effective and efficient membrane cleaning to restore module performance. Generally, methods used to remove oil from the membrane surface and restore water flux include hydraulic, mechanical, and chemical cleaning [30]. It is important to note that cleaning requirements depend on the type of oily water systems and used membranes [12]. It is well known that the phenomenon of oil fouling can be limited by the use of hydrophilic membranes. However, in regard to industrial applications of the MF process, the chemical resistance of membranes plays a key role, which, in turn, is ensured by hydrophobic materials.
Commercially available membranes are divided into ceramic and polymeric membranes. However, a critical review of the available literature conveys an important concern for research. Most studies that reported the treatment of oily wastewaters and oil-in-water emulsions by the MF process tended to focus on the use of ceramic membranes (for instance, [8,12,31,32,33,34,35,36,37,38,39,40,41,42,43,44,45,46,47,48]). In turn, investigations on the application of polymeric membranes for this purpose were very limited and mainly included membranes made of materials such as polyacrylonitrile (PAN) [12], polyvinylidene difluoride (PVDF) [49,50,51], polytetrafluoroethylene (PTFE) [51], polysulfone (PS) [52,53], and PP [54,55]. Moreover, the weakness in the abovementioned studies is that they mainly focused on synthetic feed separation. Indeed, Tummons et al. [30] pointed out that approximately 75% of published studies on low-pressure-driven processes (MF and UF) used synthetic emulsions rather than real oily wastewaters. To the best of our knowledge, no single study exists which adequately demonstrates the application of polypropylene MF membranes for the treatment of industrial oily wastewaters.
Ceramic membranes have gained popularity due to their mechanical, thermal, and chemical stability [33,40,56,57,58,59,60] and lower sensitivity to adsorption [34] compared to polymeric membranes. However, the major limitations for their industrial application are the limited availability of pore size range [56] and high cost [33]. Indeed, the price of ceramic membranes is 5–10 times higher than that of organic membranes [41]. In turn, polymeric membranes are regarded as effective membrane types due to their low cost, high porosity and separation efficiency, and easy functionality [37,61,62]. For instance, it has been widely reported [63,64,65,66,67,68] that polypropylene is an excellent membrane material, due to its especially low cost and several superior properties such as chemical stability, solvent resistance, and high mechanical strength. However, the issue pertaining to its usage in the separation of oily wastewaters is its relatively high hydrophobicity and, thus, sensitivity to high-oil fractions [43]. Thus, since the economic and technological viability of separation processes plays a significant role in shifting the industry toward membrane techniques, studies on the treatment of industrial oily wastewaters by polymeric MF membranes is of paramount importance. Taking the abovementioned into account, herein, we demonstrate a pioneering study focused on the application of capillary polypropylene membranes for microfiltration of real oily wastewaters.
2. Materials and Methods
2.1. Oily Wastewaters
In the present study, synthetic and real wastewaters were used to investigate the performance of polypropylene MF membranes. Model emulsions with 50 mg/L, 90 mg/L, and 150 mg/L oil concentration were prepared in the laboratory by mixing different amounts of oil concentrate and distillate water. The real oily wastewaters were obtained from the harbor wastewater treatment plant. In this treatment plant, a process of slop oil recovery from bilge waters was performed. The formed aqueous phase (contaminated by the remainder of the oil) was first subjected to the treatment by coagulation/flotation, and the effluents were biologically purified. The oily wastewaters were mixed with treated municipal wastewaters in an amount up to 10 vol.% of the bioreactor, which allowed maintaining its uninterrupted operation. The main characteristics of the oily wastewaters used as a feed are shown in Table 1.
2.2. MF Process
The MF process was performed with the use of commercial polypropylene capillary membranes Accurel PP S6/2 (Membrana GmbH, Wuppertal, Germany). The capillary diameter and average pore size were equal to 1.8/2.6 mm and 0.2 µm, respectively. Two submerged membrane modules, MF1 and MF2, have been used. In order to study model solutions as a feed, the MF1 module containing two capillaries of a size equal to 0.54 m (F = 0.0061 m2) was used. In turn, the MF2 module was used to perform the long-term MF process of the real wastewaters collected from the wastewater treatment plant. In this module, three membranes with a length of 1.1 m (F = 0.0187 m2) were assembled. The increased length of the MF2 module allowed obtaining a length of capillary membranes similar to that of those installed in industrial modules. It provided an investigation of the fouling phenomenon and the MF process efficiency under conditions similar to those occurring in industrial installations.
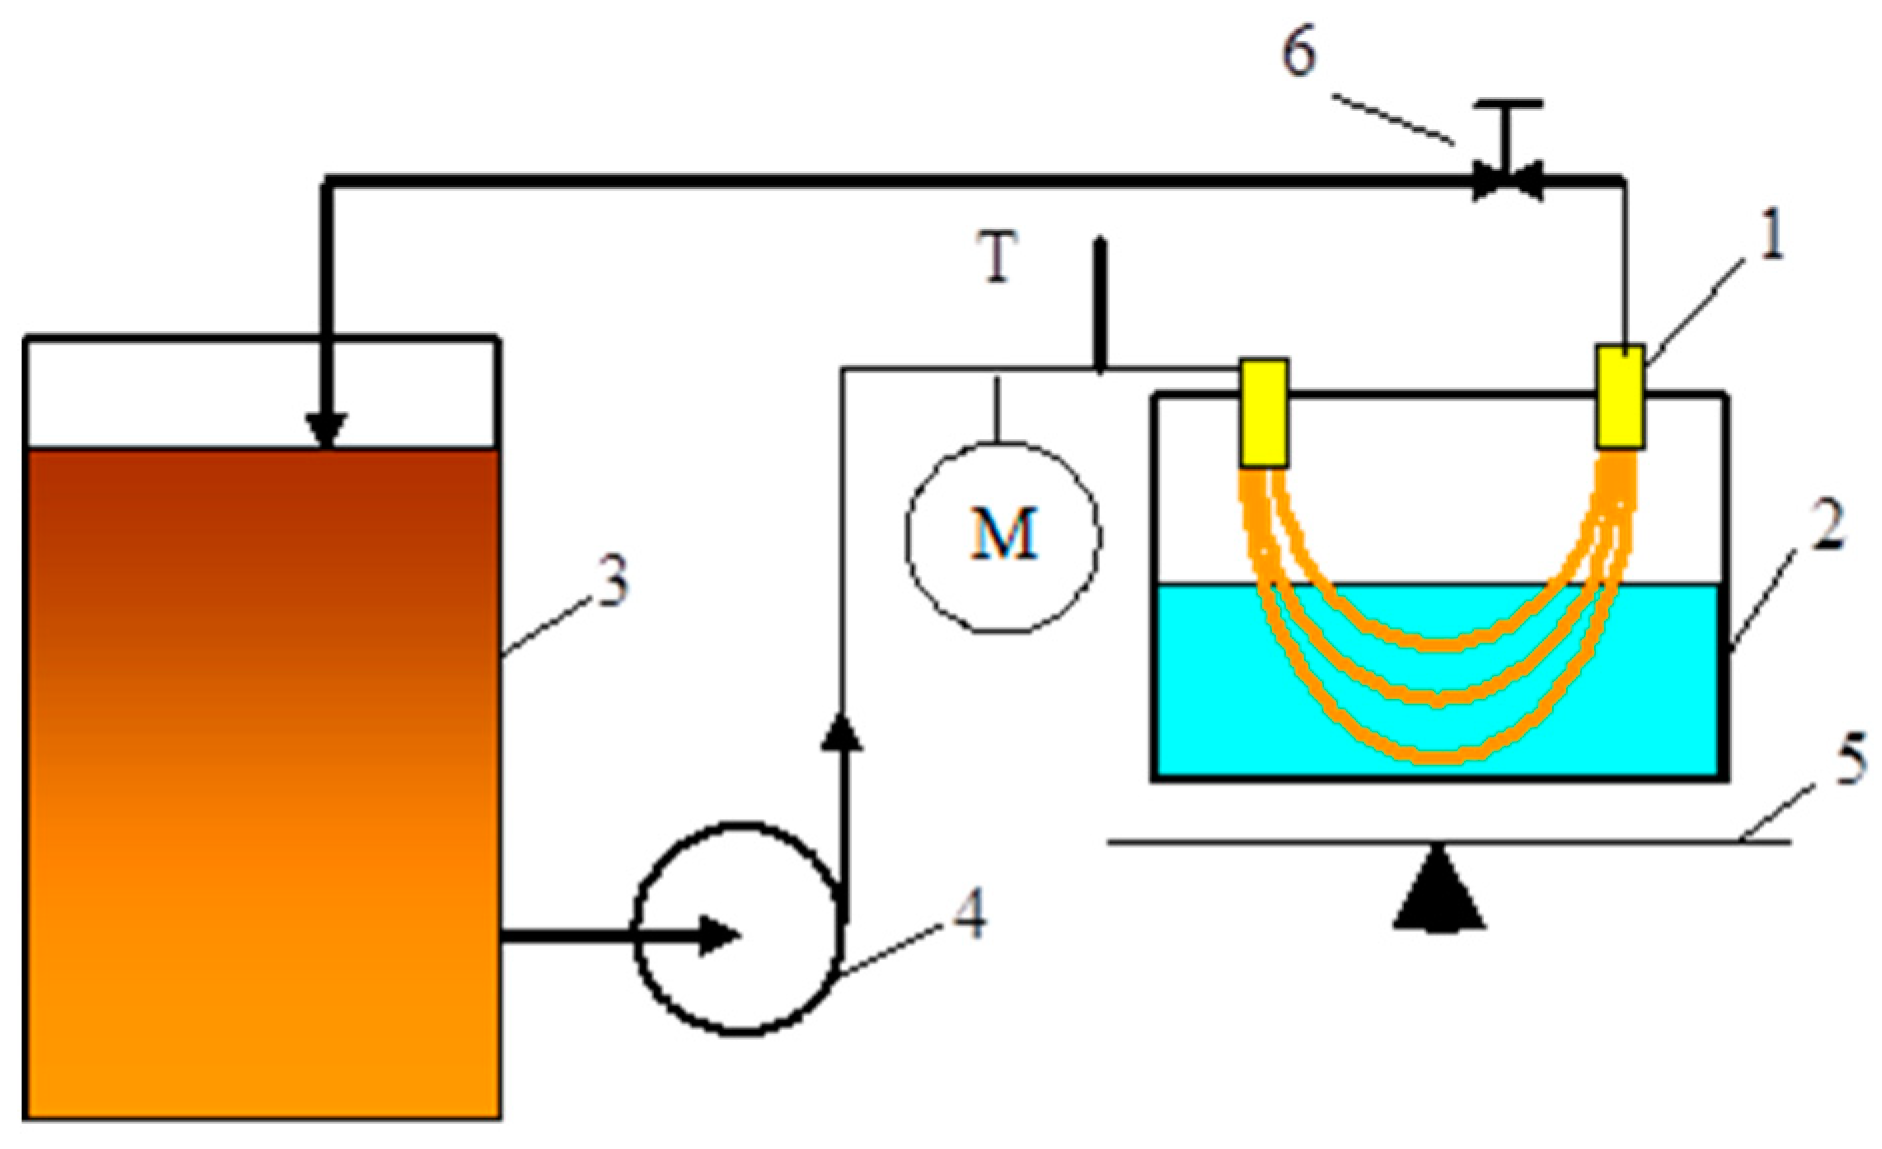
The experimental setup is presented in Figure 1. The permeate flux was calculated on a basis of changes in the permeate volume over a determined period of time (2–15 min). The relative flux was determined as the ratio between the actual permeate flux and its initial value for distilled water. The MF process of the model emulsions (CF of 50 mg/L and 150 mg/L) was performed under transmembrane pressure (TMP) and feed flow rate (VF) equal to 0.05 MPa and 0.5 m/s, respectively. In order to investigate the impact of temperature on the permeate flux, the treatment process of the model solution (CF equal to 90 mg/L) was conducted at temperatures equal to 25 °C and 50 °C. The process of real oily wastewater filtration was carried out at ambient temperature (22–25 °C) under TMP of 0.05 MPa and VF of 0.8 m/s.
2.3. Membrane Hydrophilization
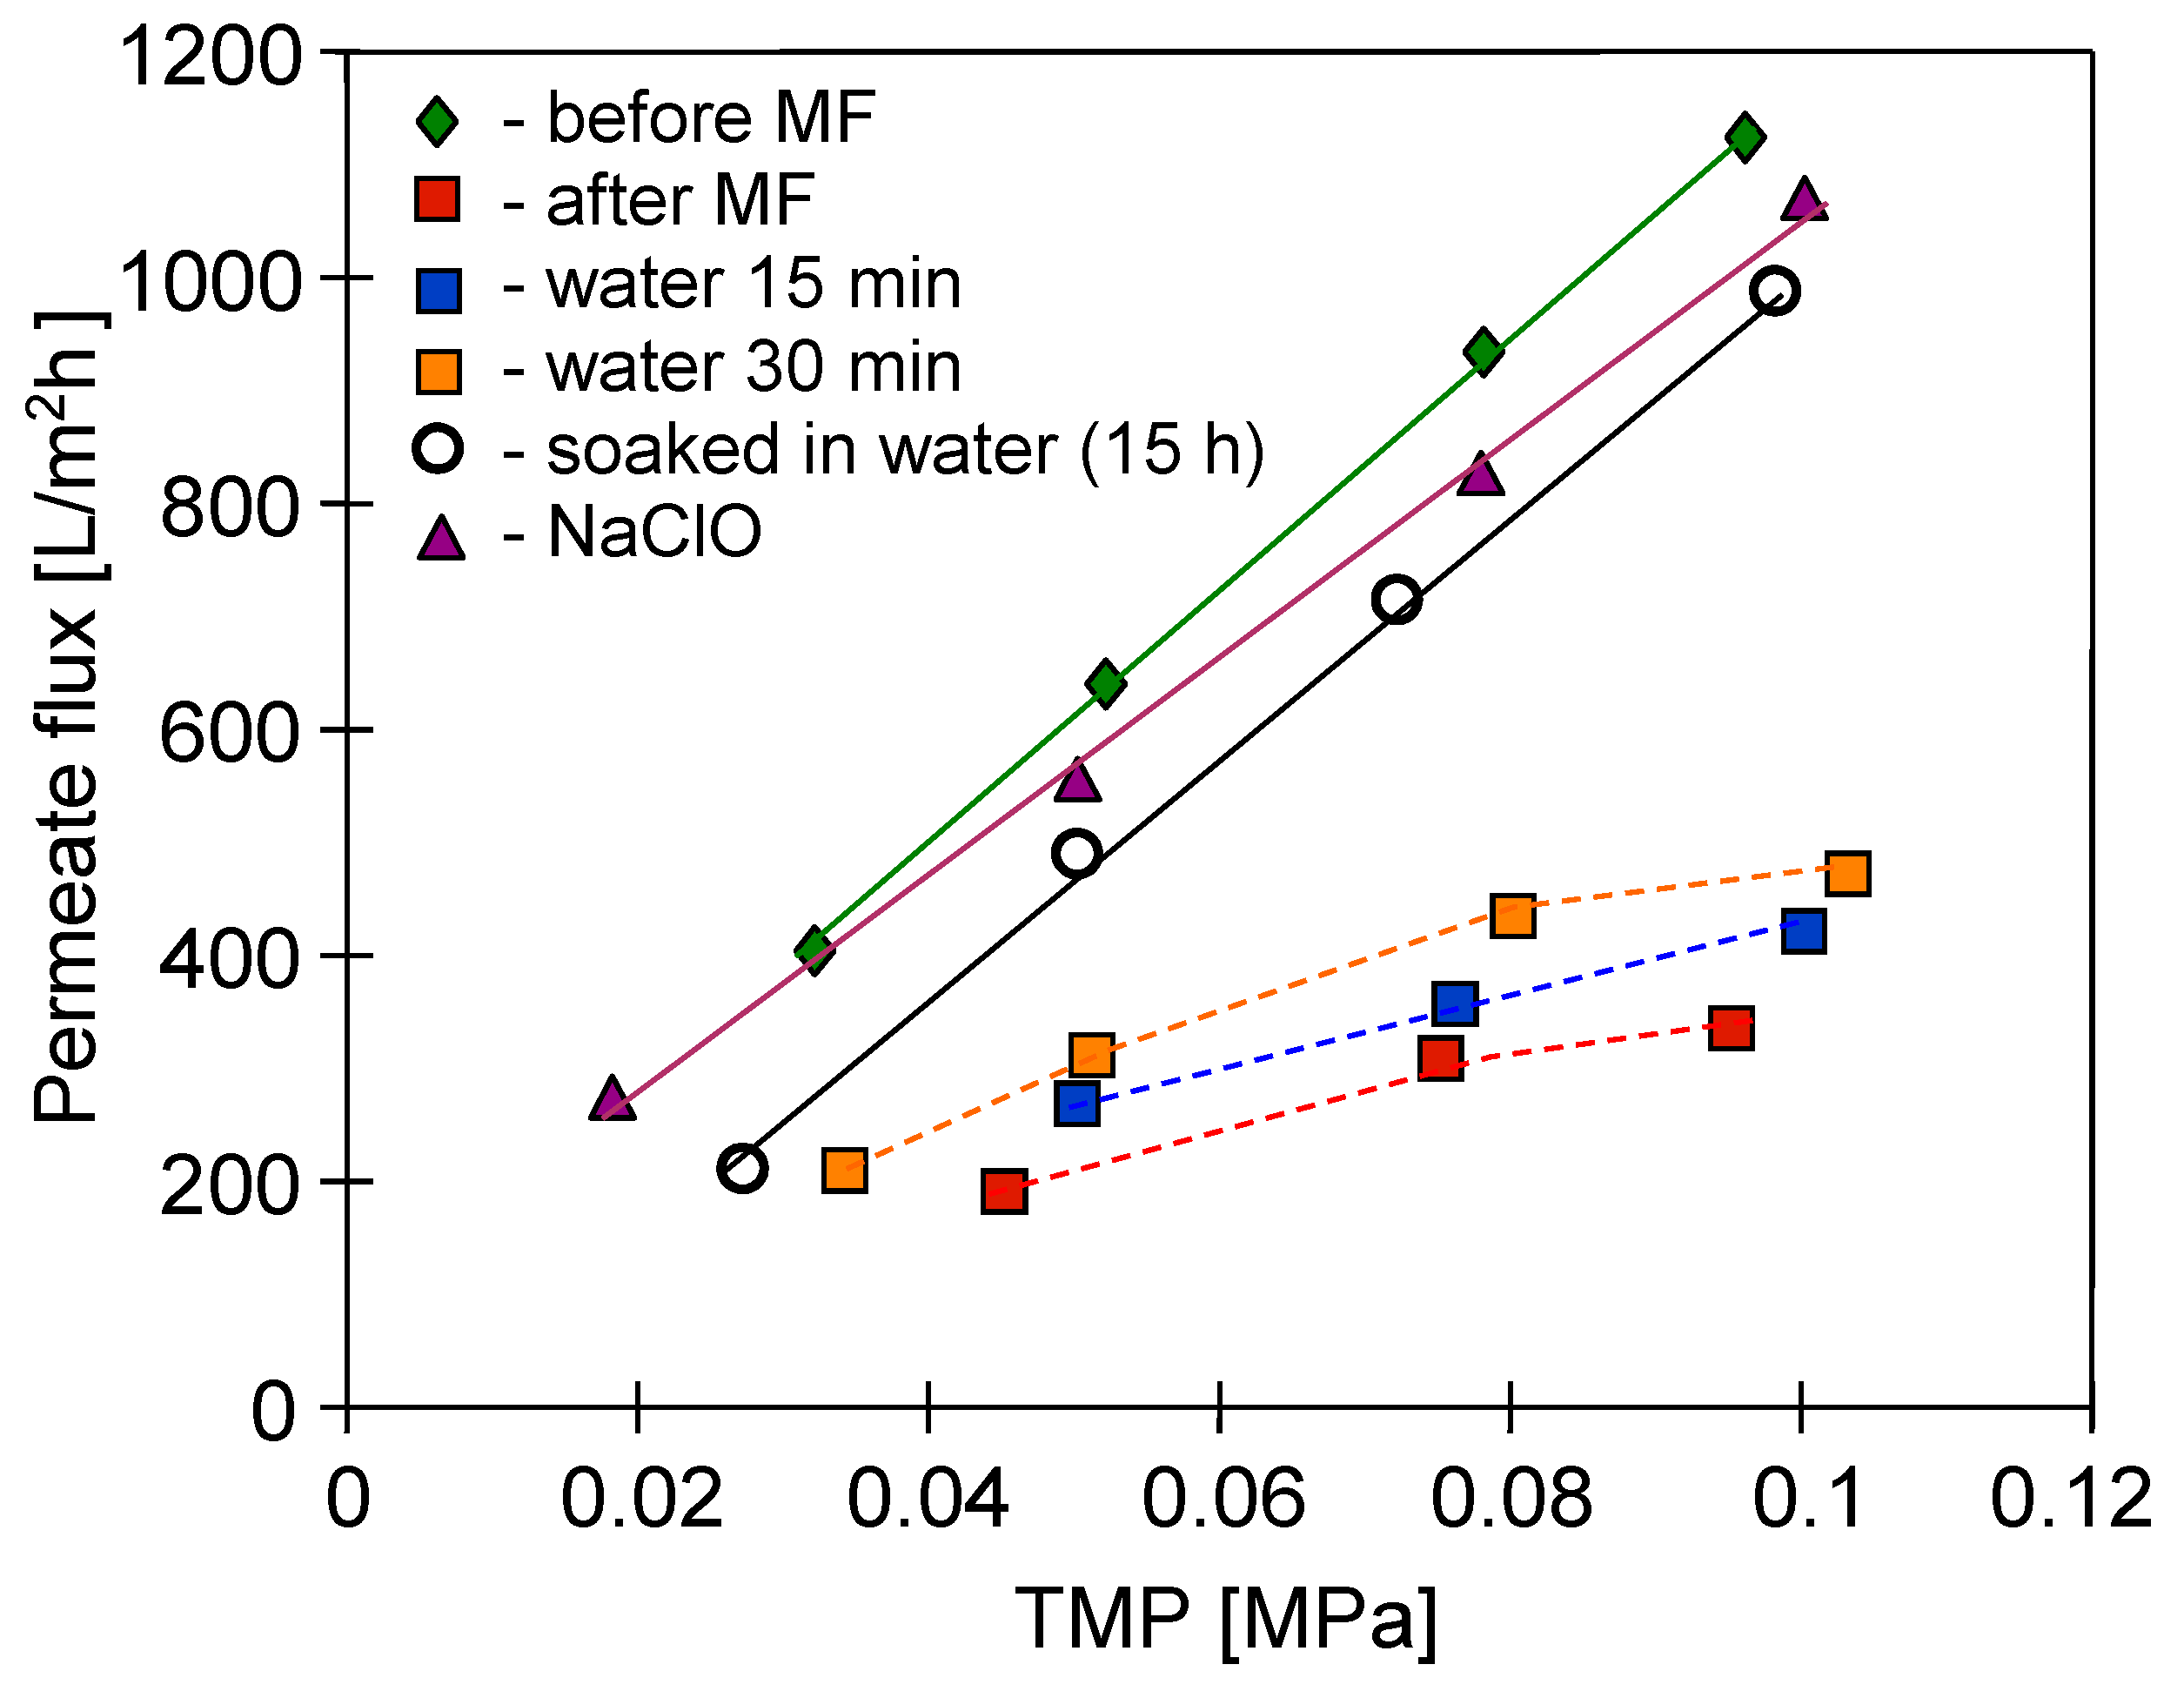
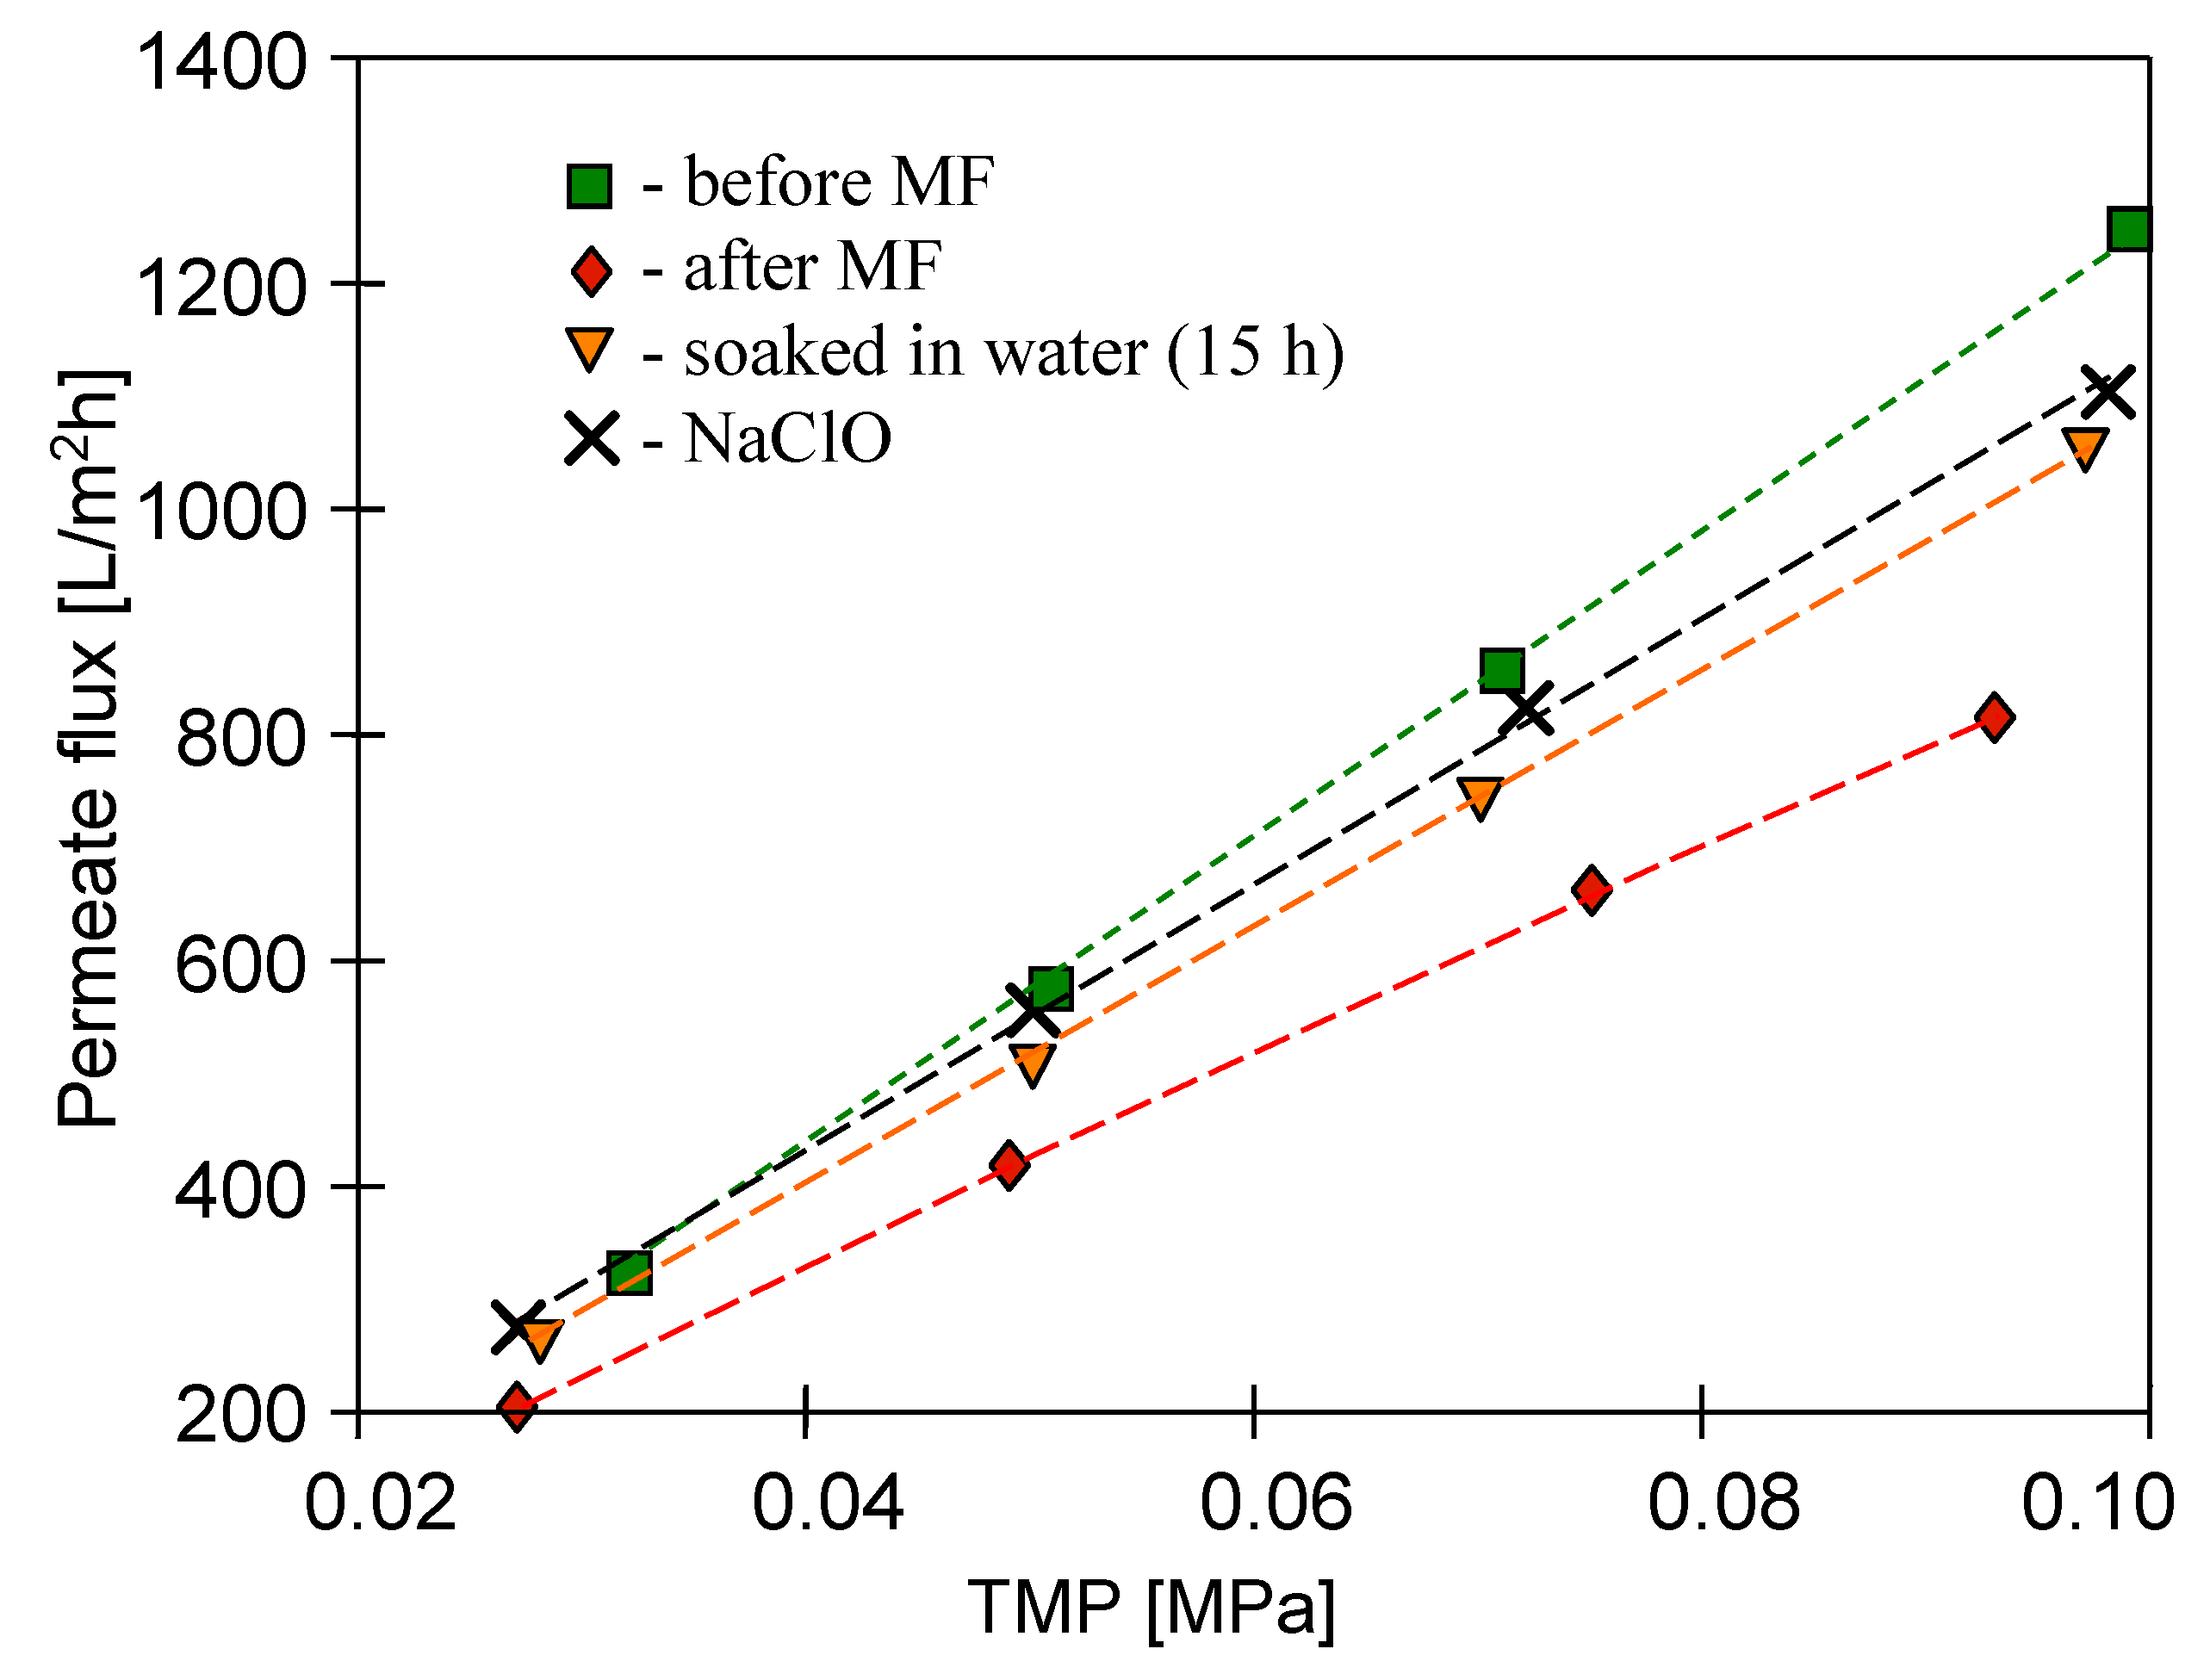
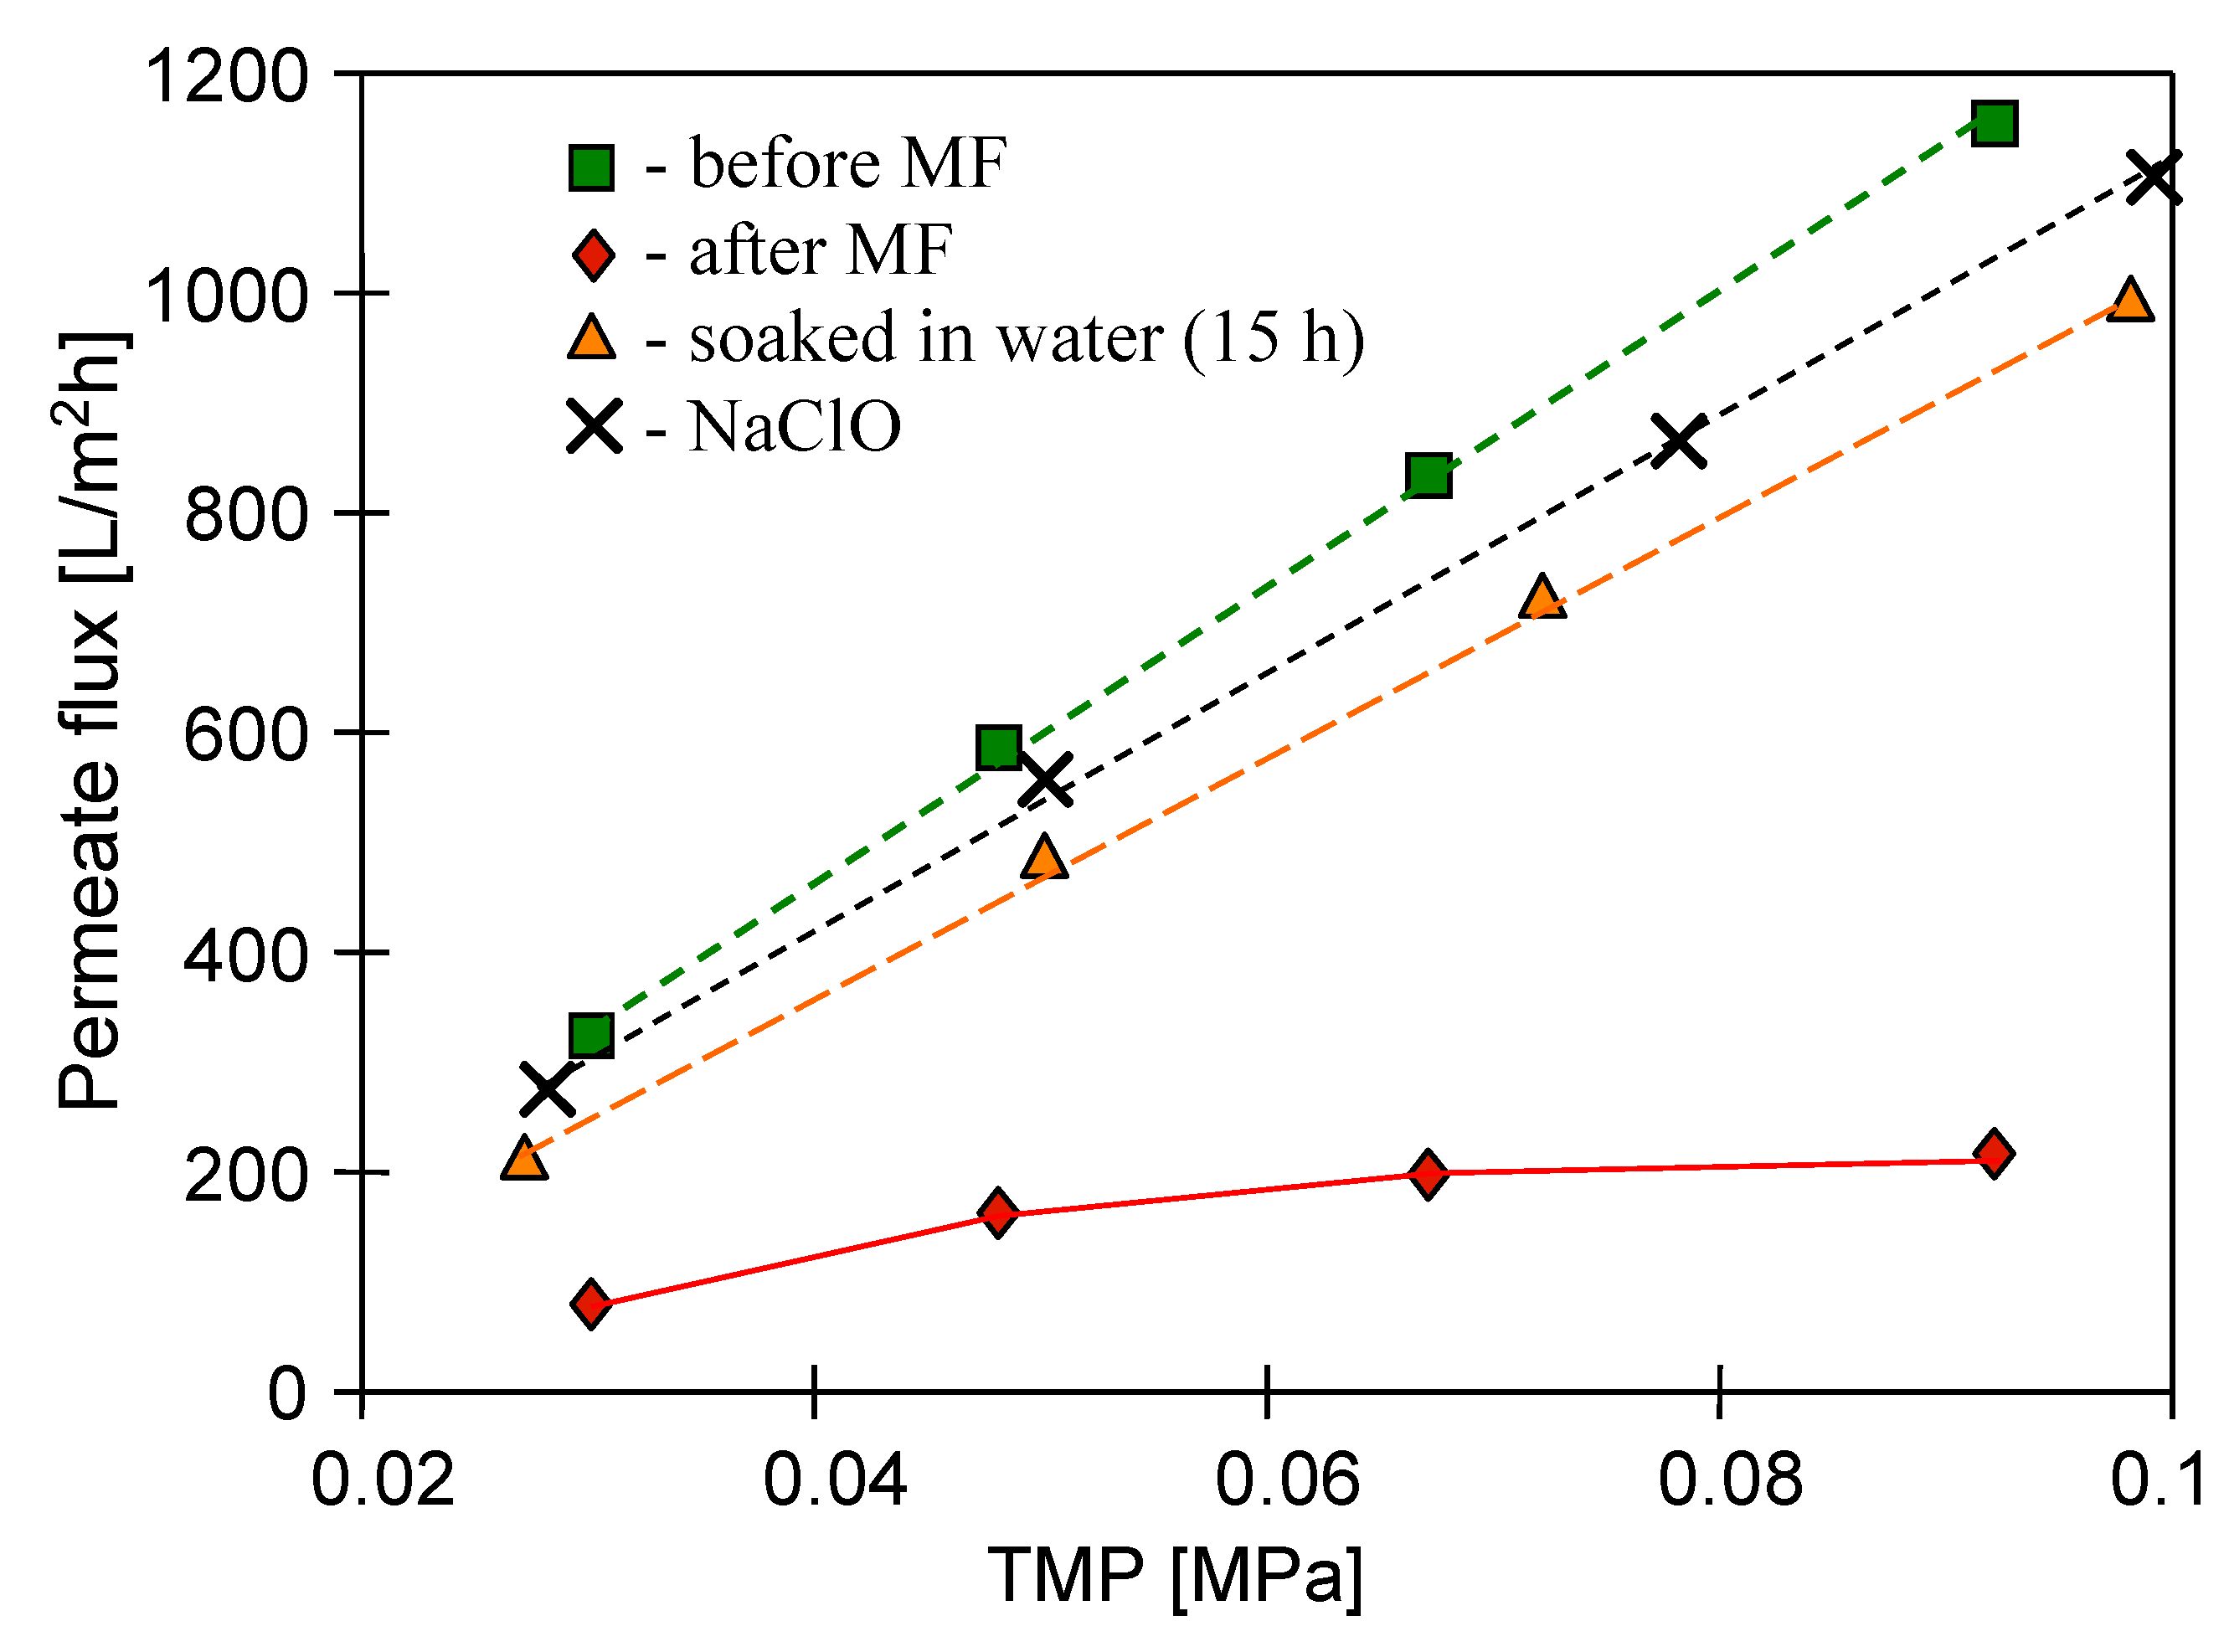
It is well known that the membrane wettability plays an important role in the filtration process performance. The Accurel PP S6/2 membranes used in the present study are hydrophobic; thus, water does not wet their pores. Therefore, before carrying out the MF process, the membranes were wetted. Generally, for this purpose, alcohols are used. In [69], it was shown that this purpose can be achieved more easily with isopropanol. However, when the water is filtered, the membranes regain their hydrophobic properties, and the wetting process has to be repeated several times. The applied procedure of membrane wetting applied in the present study is shown in Table 2. Between each stage performed, the water flux as a function of TMP was determined using a pressure in the range between 0.02 MPa and 0.107 MPa. The feed flow rate and temperature were set to 0.5 m/s and 22 °C, respectively. As expected, a linear relationship between distilled water permeate flux and TMP was noted. However, initially, the permeate J flux changed (Table 2). Finally, the maximum permeate flux under TMP of 0.05 MPa was equal to 590 L/m2h and 700 L/m2h for the modules MF1 and MF2, respectively.
2.4. Analytical Methods
The oil concentration in the examined samples was determined by means of the oil analyzer OCMA 310 (HORIBA, Kyoto, Japan). The turbidity was measured using the turbidimeter 2100 AN IS (HACH, Loveland, CO, USA) with a detection limit of 0.01 NTU.
The rejection coefficients R for oil and turbidity were respectively calculated as follows:
where CF and Cp are the oil concentrations in the feed and permeate, respectively, and τF and τp are the turbidity of the feed and permeate, respectively.
The determinations of oil droplet size distribution were carried out using a laser light scattering system Mastersizer 3000E (Malvern Instruments, Grovewood Rd, UK).
The membrane morphology and deposit composition were studied using an SU8020 (Hitachi High Technologies Co., Tokyo, Japan) scanning electron microscope (SEM) coupled with energy dispersion spectrometry (EDS). All samples were sputter-coated with chromium. A mercury porosimetery (Autopore III, Micrometrics GmbH, Aachen, Germany) was applied to determine membrane structure.
The electrical conductivity, pH, and total dissolved solids (TDS) of solutions were measured using a 6P Ultrameter (Myron L Company, Carlsbad, CA, USA). This meter was calibrated for TDS measurements with NaCl using a TDS/Conductivity standard Solution (Myron L Company).
2.5. Modeling
In the present study, in order to analyze the fouling phenomenon during treatment of model emulsions and oily wastewaters by MF process, Hermia’s models were applied. As recognized in the literature, they are the most useful and applicable models to investigate the MF flux decline. Indeed, they have been widely applied in studies on the treatment of oil-in-water emulsions and real oily wastewaters by low-pressure-driven filtration processes, such as MF [8,20,38,39,40,41,44,52] and UF [70,71,72,73,74,75,76].
Hermia’s models are described in terms of permeation volume V and filtration time t, as follows [77]:
where k is a constant and n depends on the fouling mechanisms, which include cake formation (n = 0), intermediate blocking (n = 1.0), standard blocking (n = 1.5), and complete blocking (n = 2.0) (Figure 2).
When oil droplets are larger than membrane pore sizes and do not enter into the membrane pores, cake formation is the dominant membrane fouling phenomenon [8,20,38,40,73] (Figure 2a). As a result, oil droplets form a gel layer on the membrane surface, which may increase the resistance to flow through the membrane, as well as change the efficiency of oil droplet removal. Permeate flux can be obtained by the following equation:
where Kg is a constant.
Intermediate pore blocking occurs when the sizes of particles and membrane pores are equivalent [38,39,40,73] (Figure 2b). Consequently, oil droplets block some membrane pores or settle on other oil droplets. Permeate flux can be expressed by the following equation:
where Ki is a constant.
Standard blocking considers that the oil droplets are smaller than the average pore size of the membrane [8,20,38,39,40,44,73] (Figure 2c). Consequently, the oil droplets present in the feed enter the pores and are adsorbed or trapped inside the pore walls, leading to a decrease in pore volume. The permeate flux is expressed as
where Ks is a constant.
According to complete pore blocking model, it is assumed that the size of the droplets is bigger than that of the membrane pores; therefore, each oil droplet arriving at the membrane surface blocks the pore entrances [8,20,38,39,40,52] (Figure 2d), which leads to a decrease in the membrane surface. Permeate flux can be represented by the following equation:
where Kg is a constant.
The suitable fitness of the experimentally obtained data with the above-presented fouling mechanisms was determined by comparing the correlation coefficients (R2) reported from linear regression analysis using Equations (4)–(7). It was assumed that the equation with the best R2 value corresponded to the dominant membrane fouling mechanism [70].
3. Results and Discussion
3.1. Membrane Characteristics
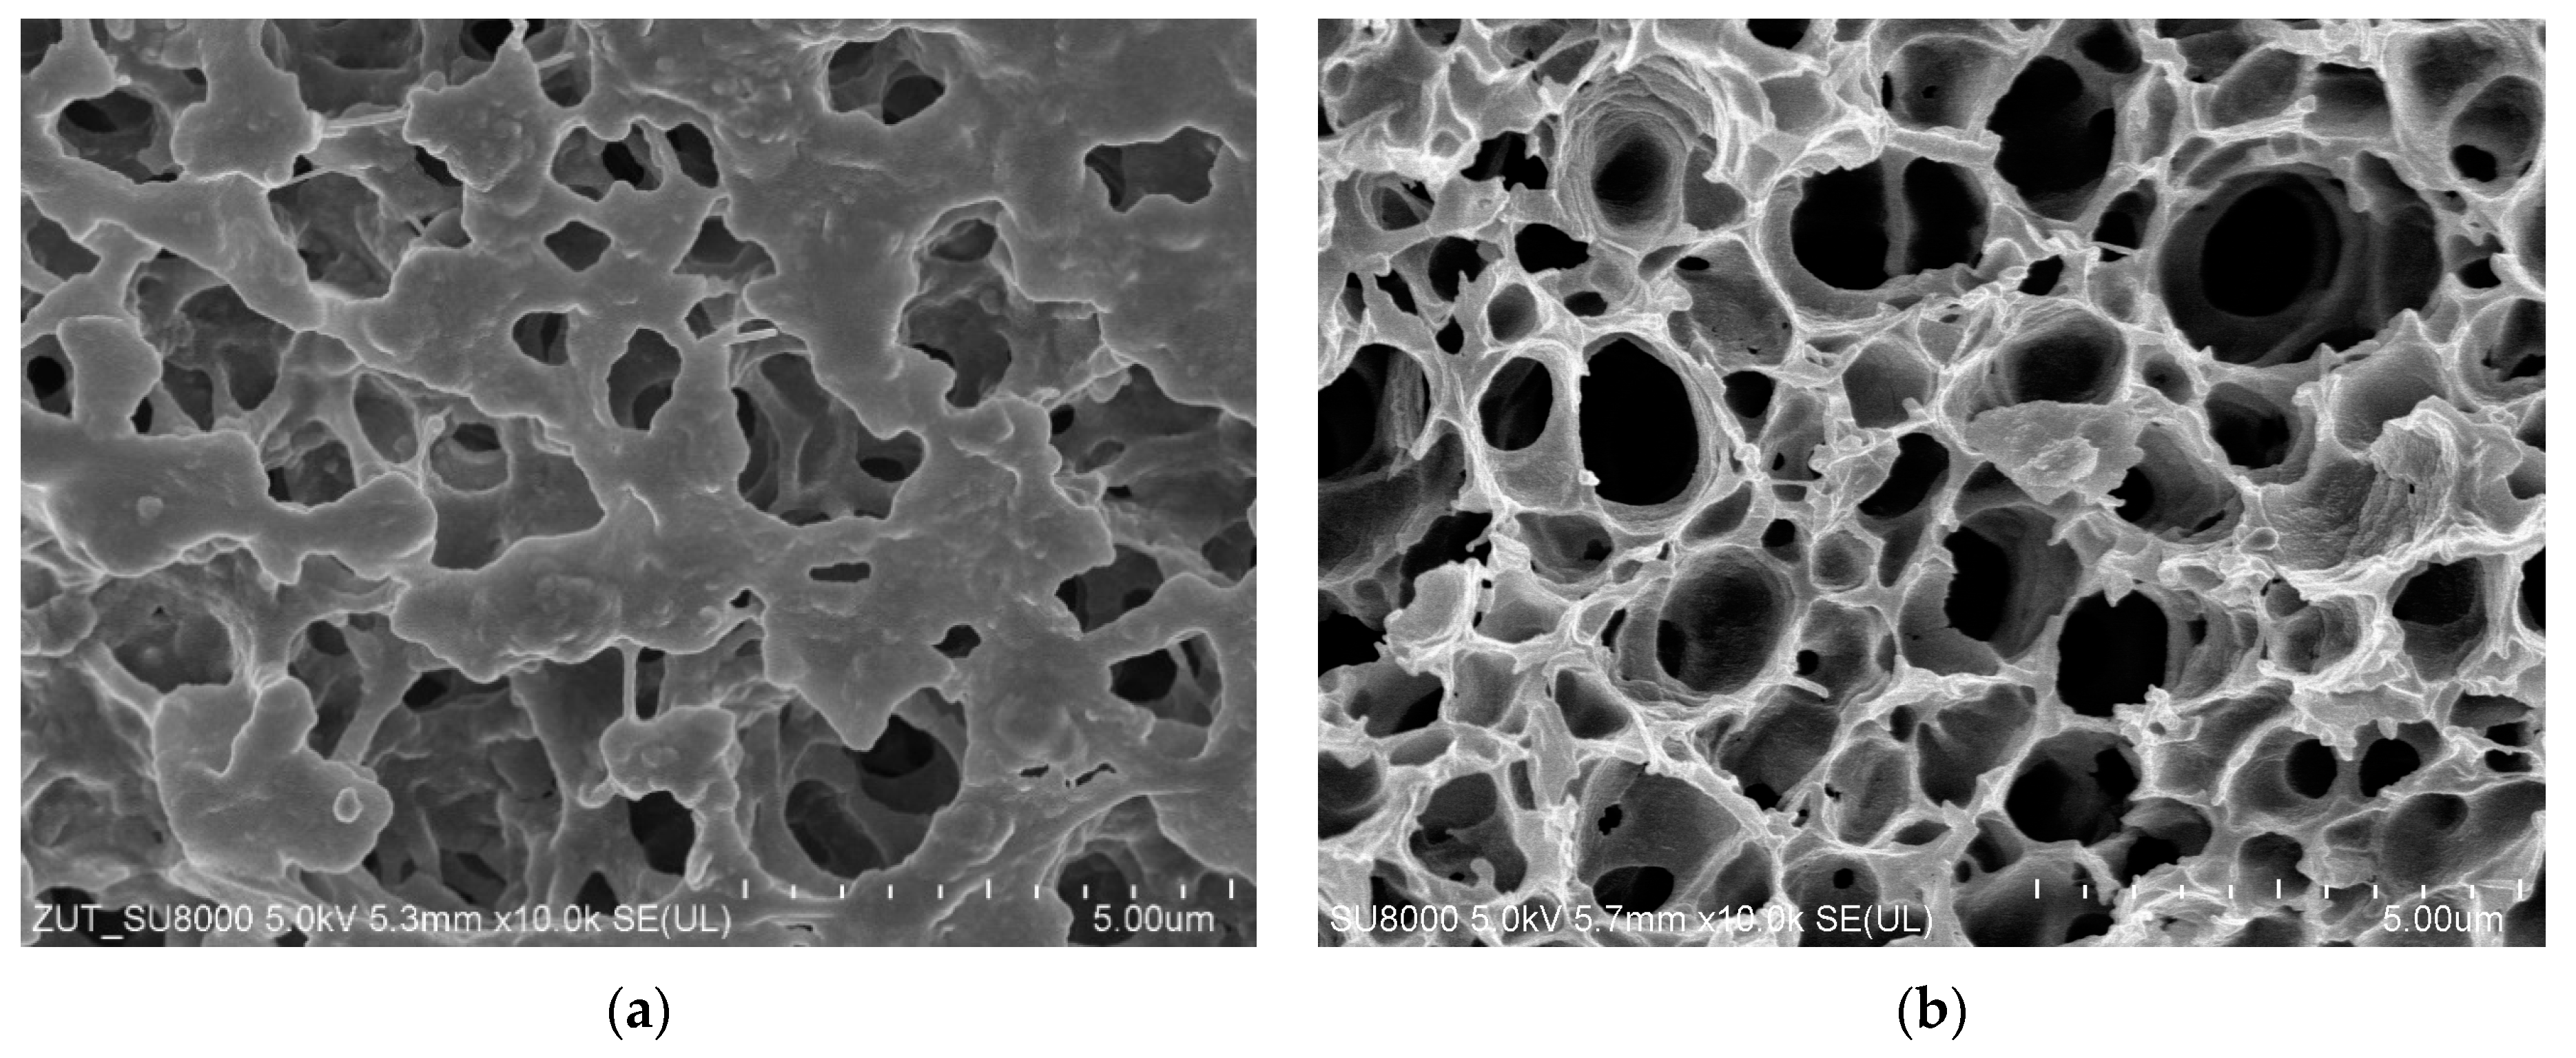
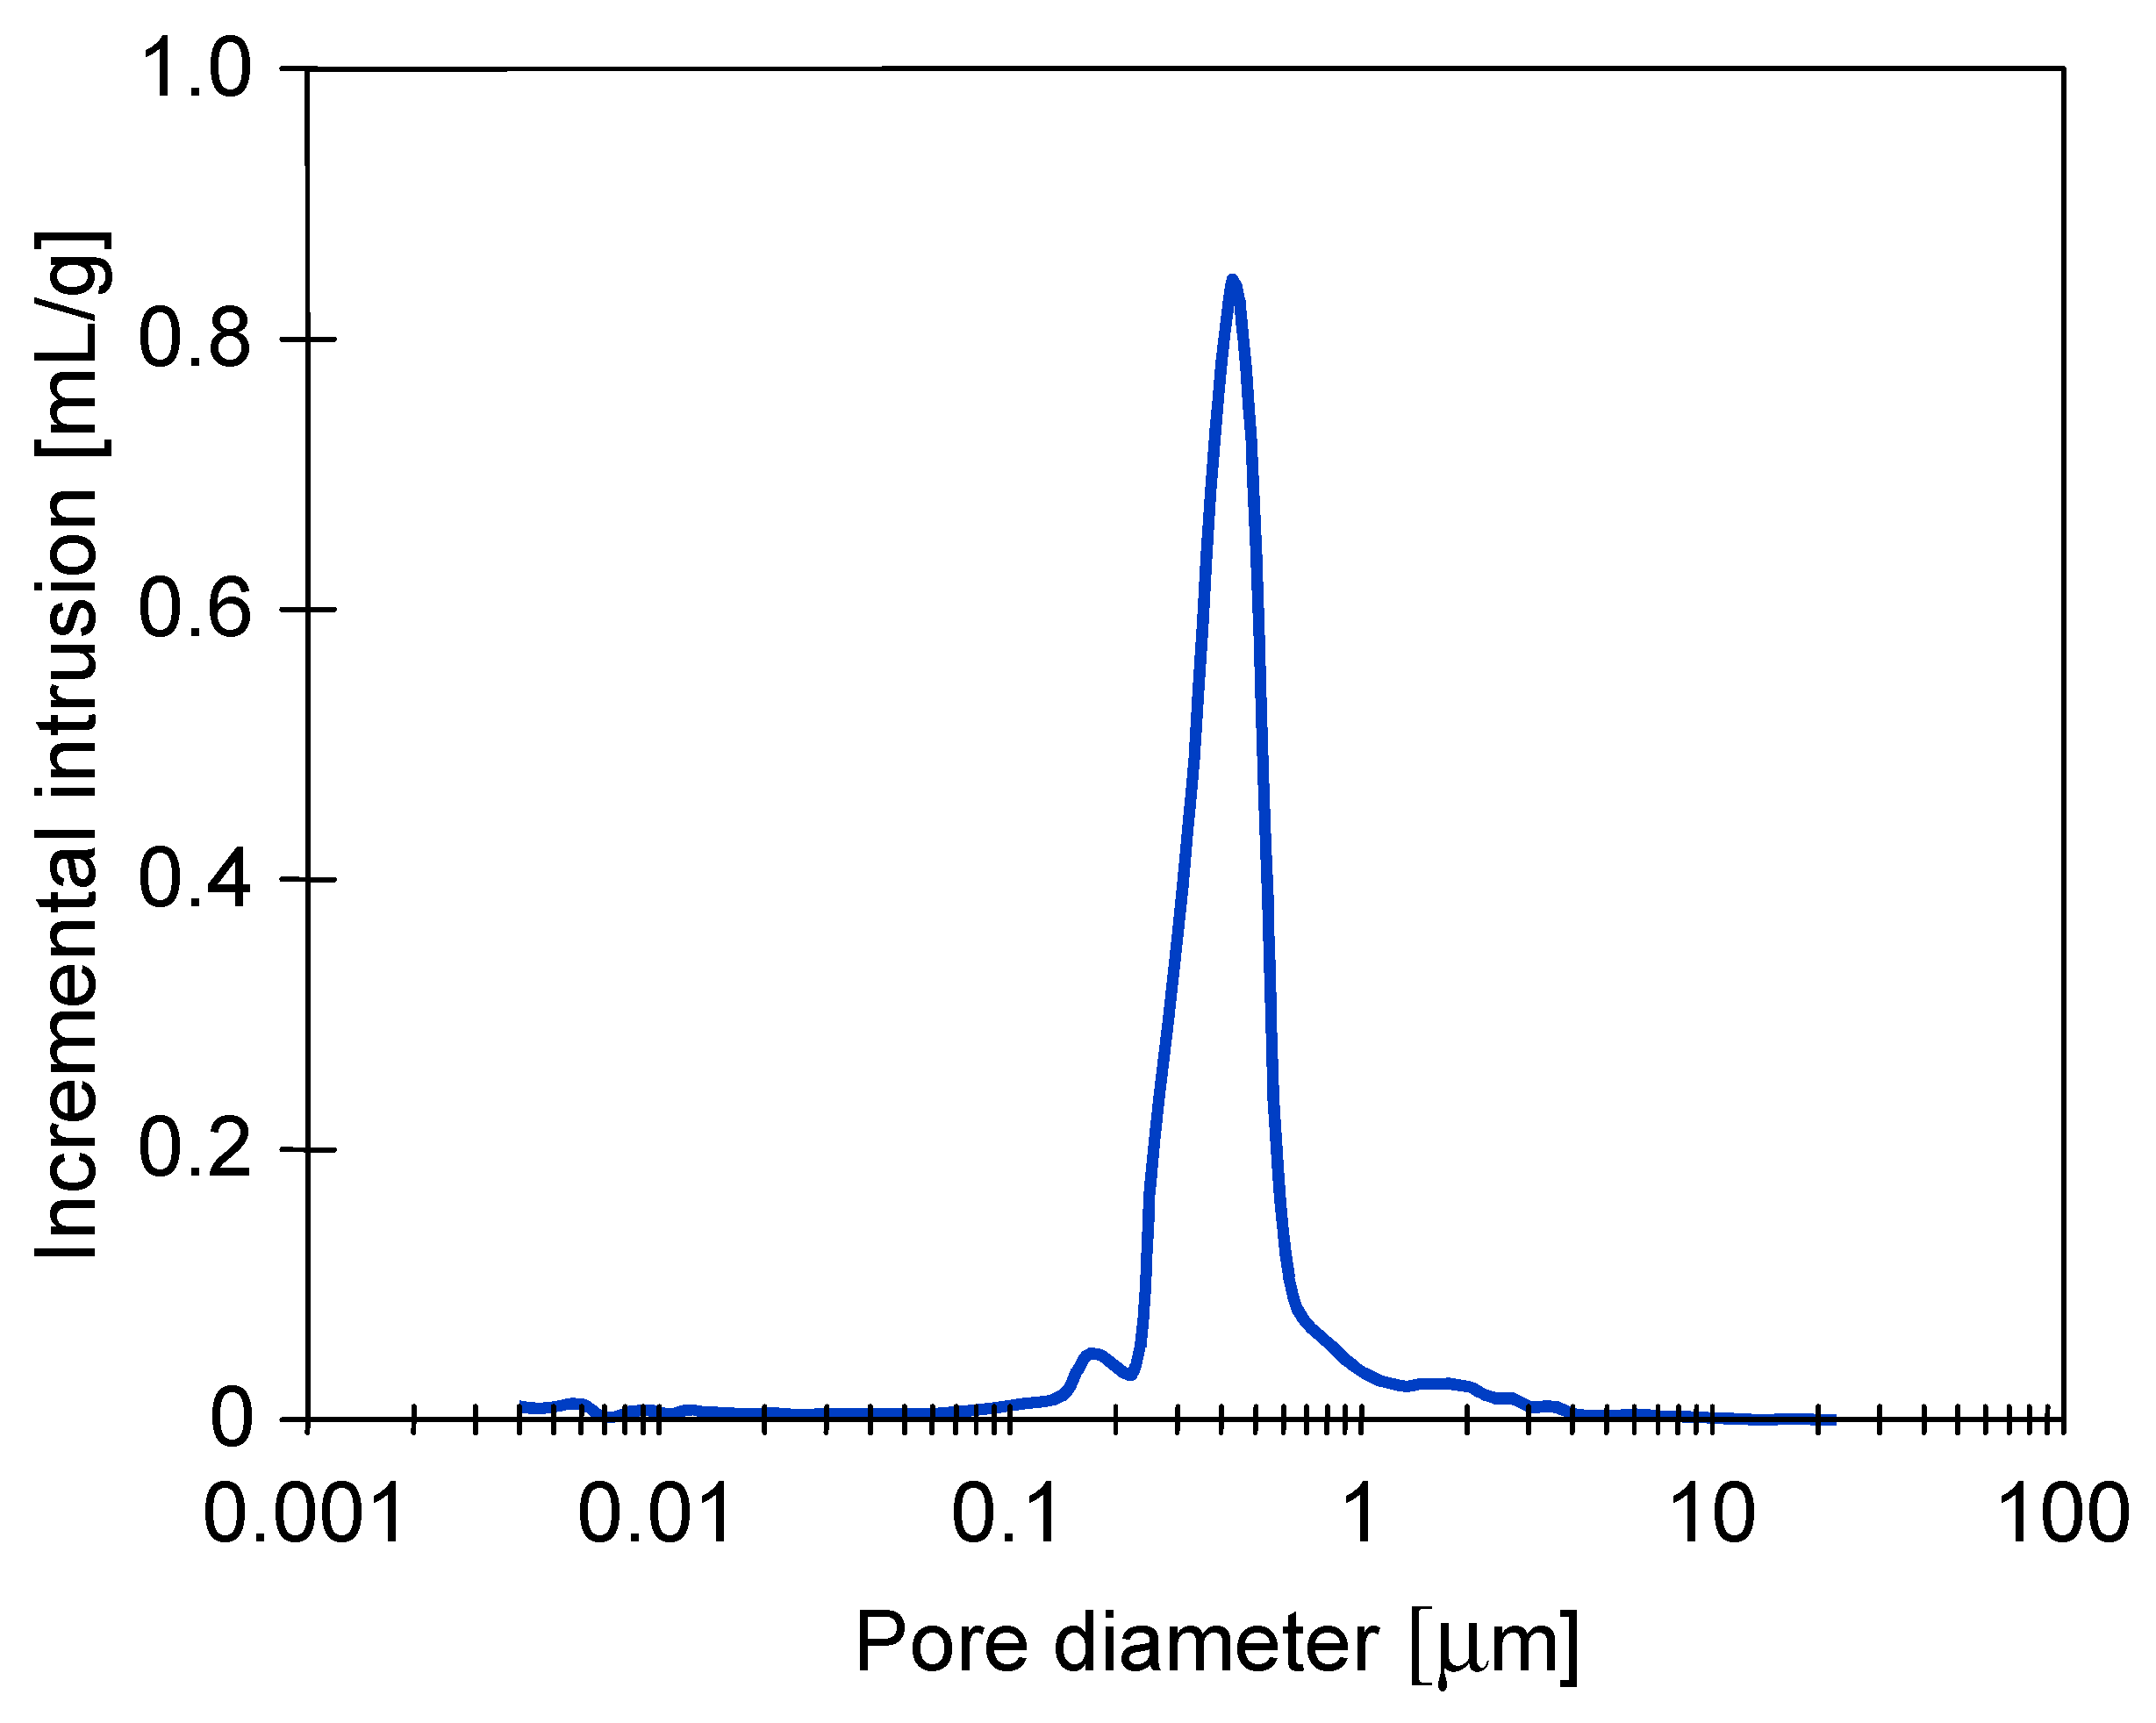
The structure of used membranes was characterized using scanning electron microscopy (SEM) analysis (Figure 3). SEM studies revealed that the membranes were symmetric with a sponge-like structure. The tested membranes were produced for the MF process and according to the manufacturer’s instructions, suggesting that they could retain particles with a size of about 0.2 µm. In turn, a graphical representation (Figure 4) of the obtained mercury intrusion porosimetry data show that the average pore size of the studied membranes was in the range between 0.2 and 1 µm. The determined difference is related to the fact that the MF separation efficiency was determined by the dimension of “chambers” connecting the individual pore cells. As it can be observed (Figure 3b), these “chambers” were significant smaller.
3.2. MF of Model Emulsions
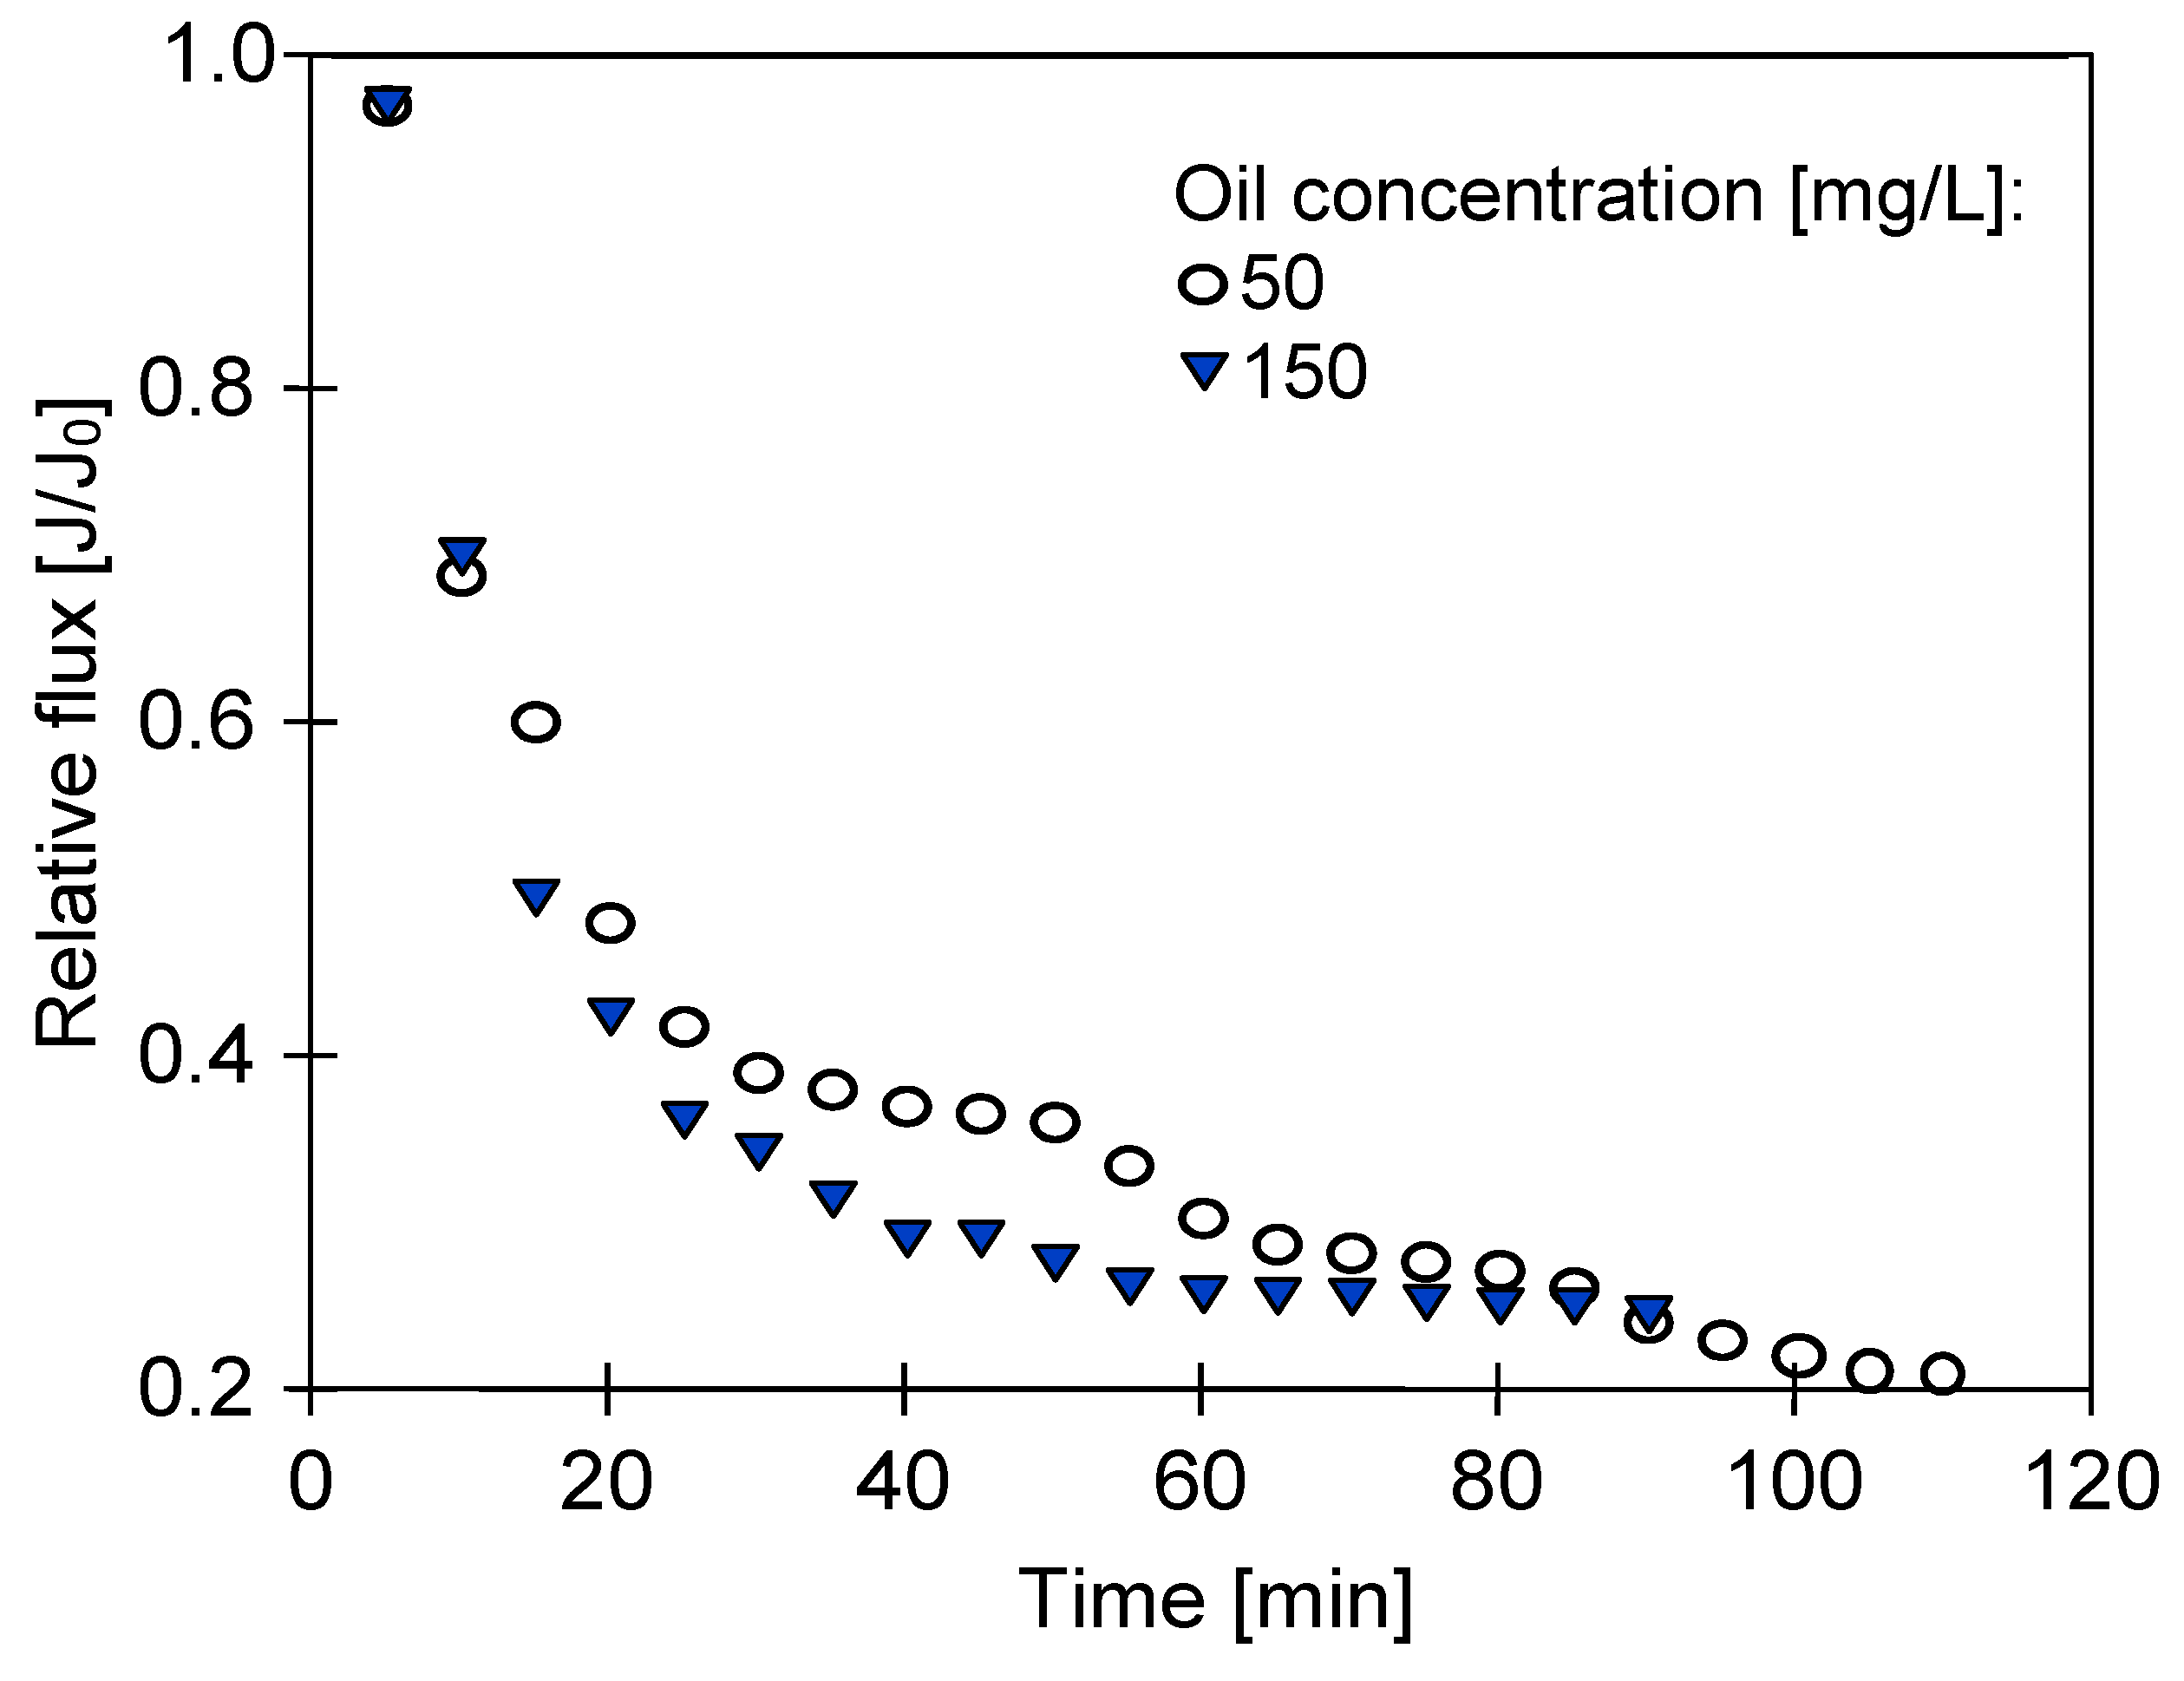
In the present study, to investigate the application of PP microfiltration membranes for the separation of oily wastewaters, the MF process of model emulsions with oil concentrations (CF) equal to 50 mg/L and 150 mg/L was performed. The experiments were carried out at ambient temperature (22 °C). The applied transmembrane pressure (TMP) and feed flow rate (VF) were equal to 0.05 MPa and 0.5 m/s, respectively. The permeate samples were returned to the feed tank for recycling, which limited the feed concentration.
As expected, for both studied model solutions, a significant reduction in membrane performance was observed (Figure 5). For the emulsion with CF equal to 50 mg/L, the relative permeate flux decreased to 48% of its maximum value within 20 min of the experimental run. After 60 min, it was equal to 30%, and, at the end of the process (90 min), a relative flux of 24% was noted. Although similar flux decline trends for the 150 mg/L oil emulsion were noted, in the first 60 min of the process run, a more noticeable permeate flux decline was observed. Indeed, the relative flux was equal to 42%, 26%, and 24% within 20 min, 60 min, and 90 min, respectively. Generally, this can be explained by the fact that, at higher feed concentration, the increased number of oil droplets present in the system led to increased membrane blocking propensity. Similar relationships between the permeate flux and oil concentration during MF of synthetic oily wastewaters using ceramic [12,34,36,38,40,44], coal-based carbon [78], and PAN [12] membranes have been reported in the literature. For instance, Li et al. [78] investigated the application of coal-based carbon membranes coupled with an electric field for oily wastewater treatment. For this purpose, the authors performed the MF process of synthetic wastewaters with oil concentrations equal to 50 ppm, 100 ppm, and 125 ppm. It was noted that, for the wastewaters with oil concentrations of 50 ppm and 100 ppm, the permeate flux decreased slowly, and, at the end of the process, it was equal to 184.48 L/m2 h bar and 166.04 L/m2 h bar, respectively. In turn, for the feed with an oil concentration of 125 ppm, the most significant permeate decline has been observed. At the end of the process, it was equal to 93 L/m2h bar.
It is clear that the noted decline of the permeate flux was caused by the fouling phenomenon. The results obtained from fitting of the experimental data to Hermia’s models (Table A1, Appendix A) demonstrate that, for both studied model emulsions, cake formation was the most dominant fouling mechanism leading to the flux decline during the studied processes. Therefore, it can be indicated that the more significant decrease in membrane performance during the treatment of emulsions with a higher oil concentration was due to a higher growth rate and a thicker layer of the coalesced oil stuck on the membrane surface, leading to more severe fouling resistance. Similar results were reported in [38,40,44], where it was demonstrated that the cake filtration model was the best model to portray the flux decline mechanism for MF of synthetic oily wastewater with ceramic membranes.
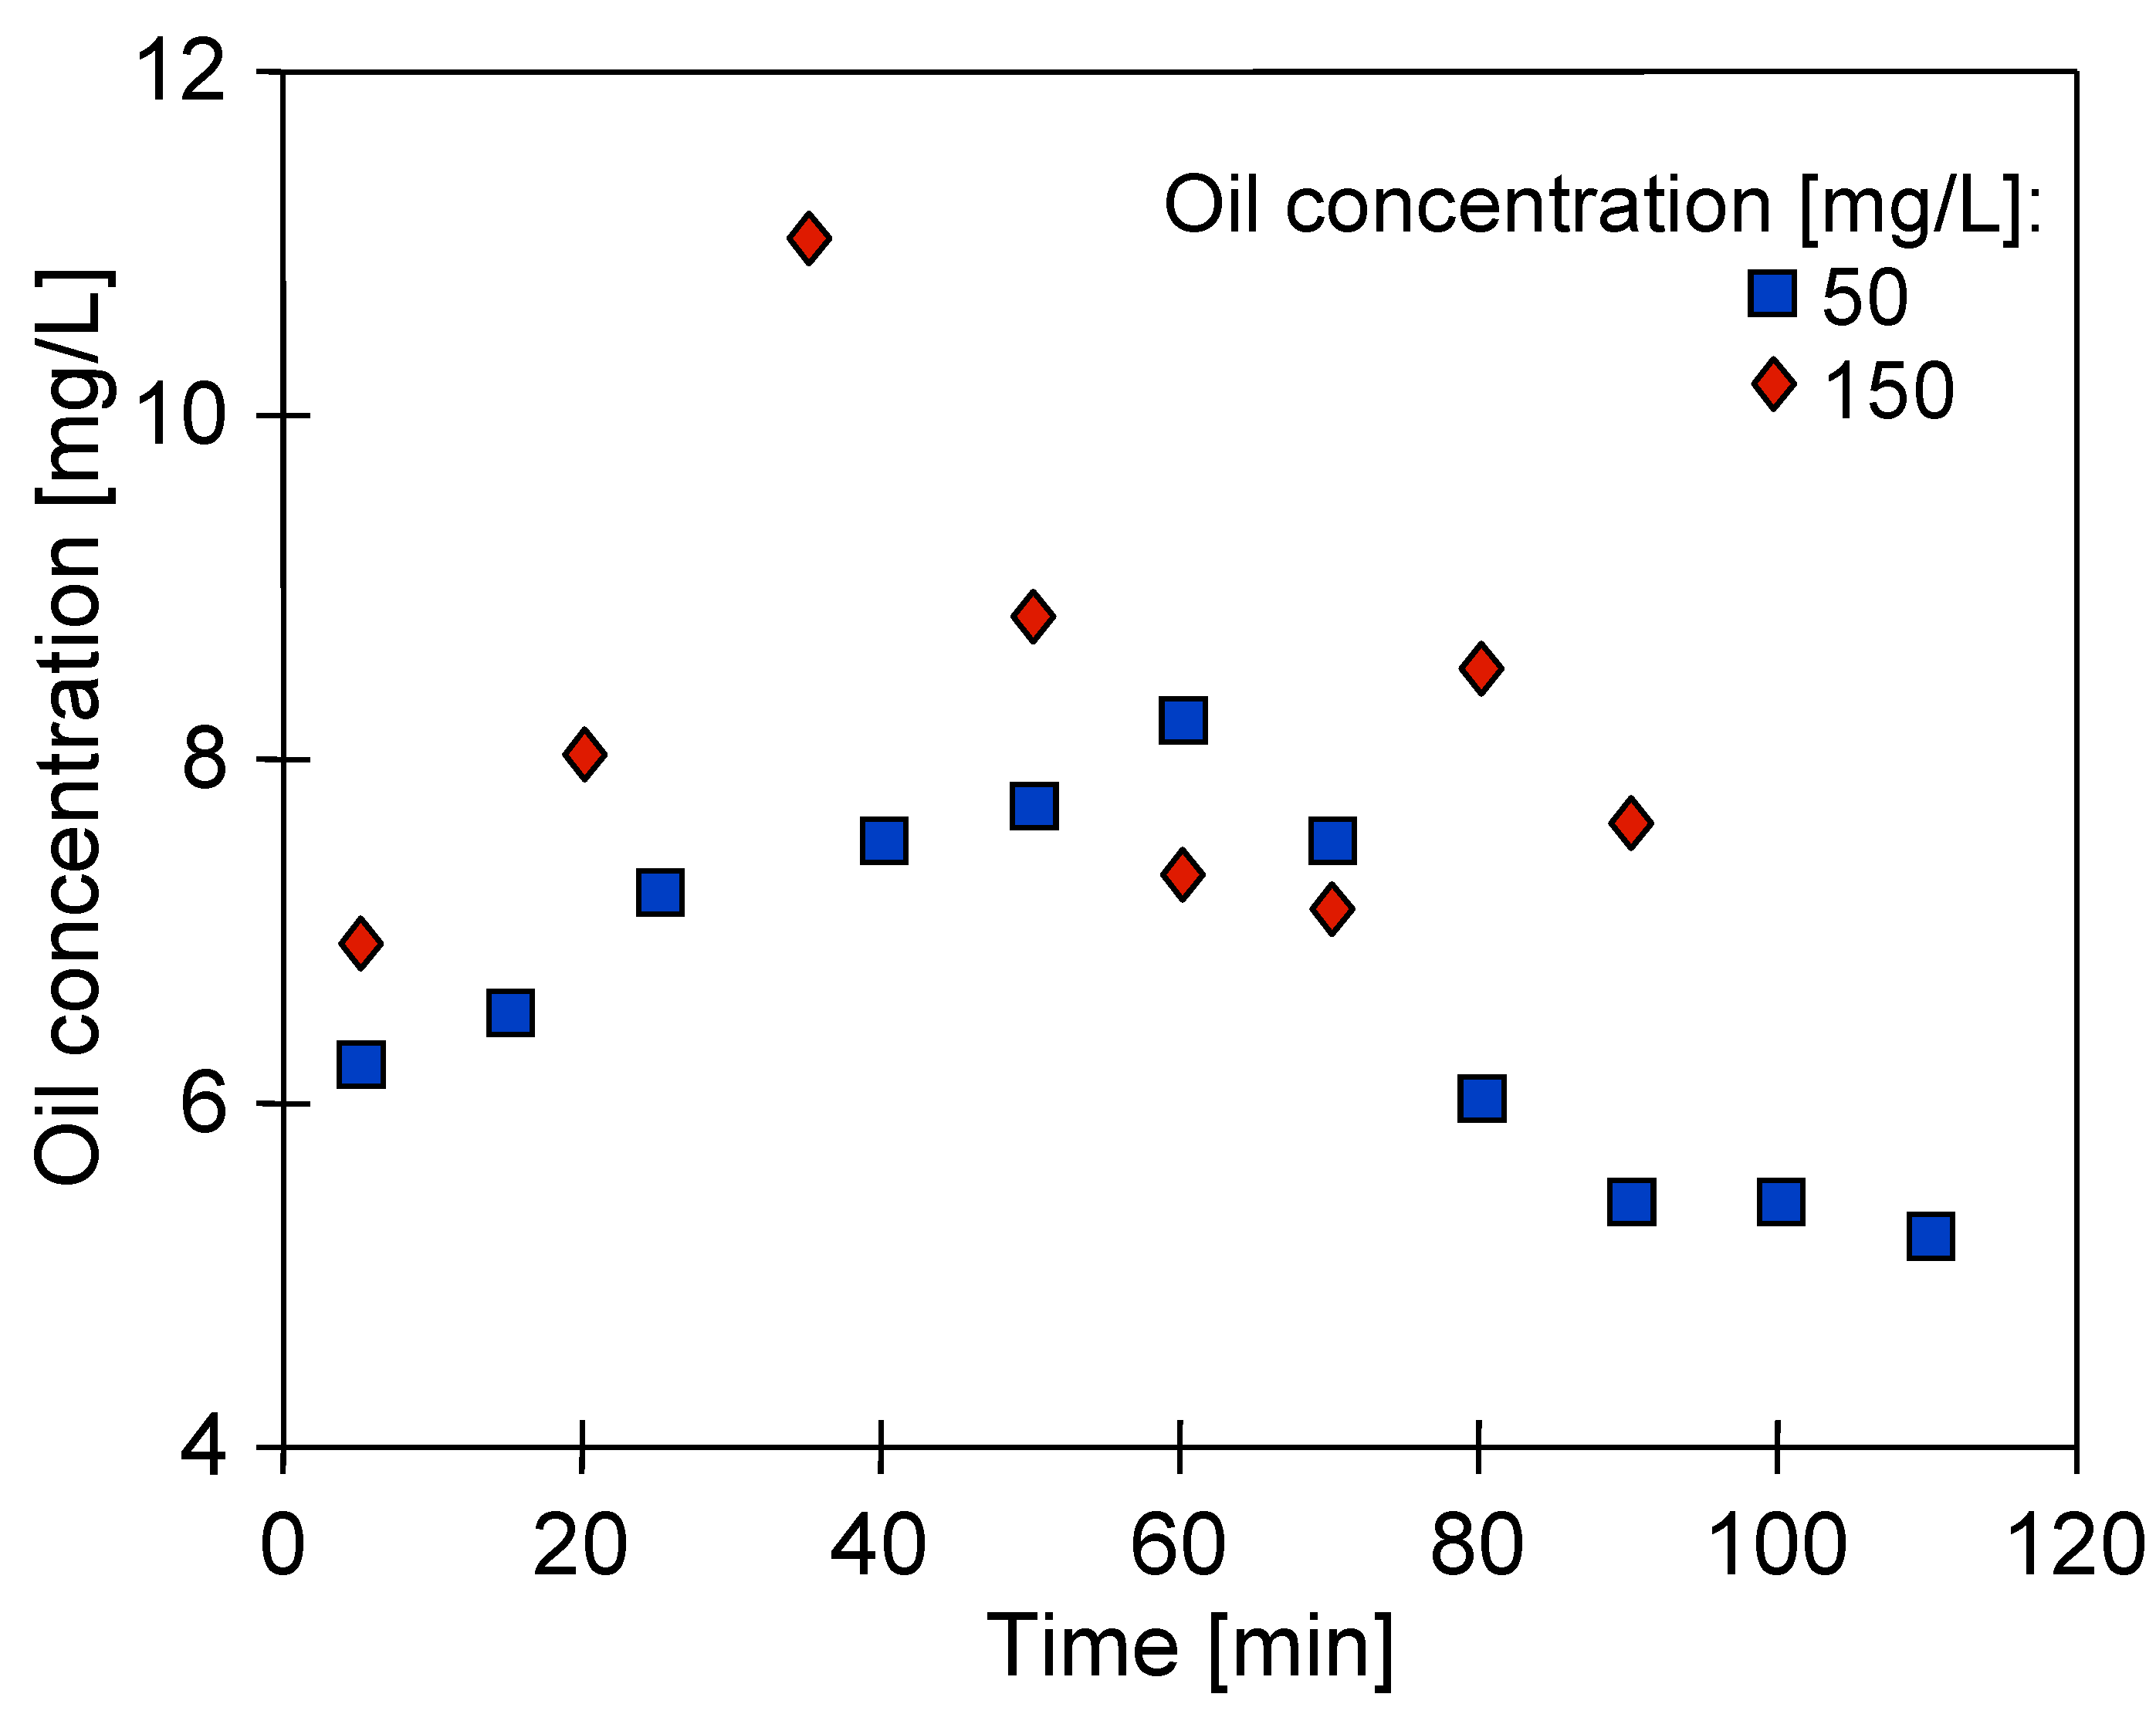
The effectiveness of the PP microfiltration membranes for the treatment of model emulsions was assessed by permeate quality. Figure 6 shows the changes in oil concentration in the permeate obtained during the conducted experiments. It was found that, during the first 40–60 min, the oil concentration in the permeate increased from 6 mg/L to 8.5 mg/L and from 7 mg/L to 11 mg/L for emulsions with CF equal to 50 and 150 mg/L, respectively. Subsequently, the permeate quality improved, and an oil concentration of 5–7 mg/L was reported. The most crucial result to emerge from these data is that performing the MF process of model emulsions with the PP microfiltration membranes ensured an oil removal percentage Roil (Equation (1)) equal to at least 90%. Comparing these data with those available in the literature, this can be considered satisfactory. For instance, Ebrahimi et al. [11] showed that ceramic (Al2O3) MF membranes (pore size of 0.1 and 0.2 µm) were able to provide oil removal from model emulsions in the range from 58% to 82% at TMP equal to 0.1 MPa and a feed temperature of 60 °C.
It is essential to mention that greater stability in the permeate quality was achieved for the feed with a lower oil concentration (CF = 50 mg/L). In turn, for the emulsion with CF equal to 150 mg/L, after a significant decrease in the oil concentration (Figure 6, 60 min), the oil content increased and then decreased again (80 min). This observation may indicate that some larger oil drops flowed periodically through the membrane and reached the permeate stream. This conclusion is confirmed by the results obtained from the investigation of the droplet size distribution in the permeate (Figure 7). Since the majority of the membrane pores had a size below 1 µm (Figure 4), the detection of such large oil drops (above 5–10 µm) in the permeate could have been caused by the accumulation of oil droplets on the membrane surface and their coalescence during the filtration run. The phenomenon of oil droplet coalescence and permeation through the MF membrane pores was also observed in previous studies, in which ceramic membranes were used for separation oil-in-water emulsions [40,48] and synthetic oily wastewater [38].
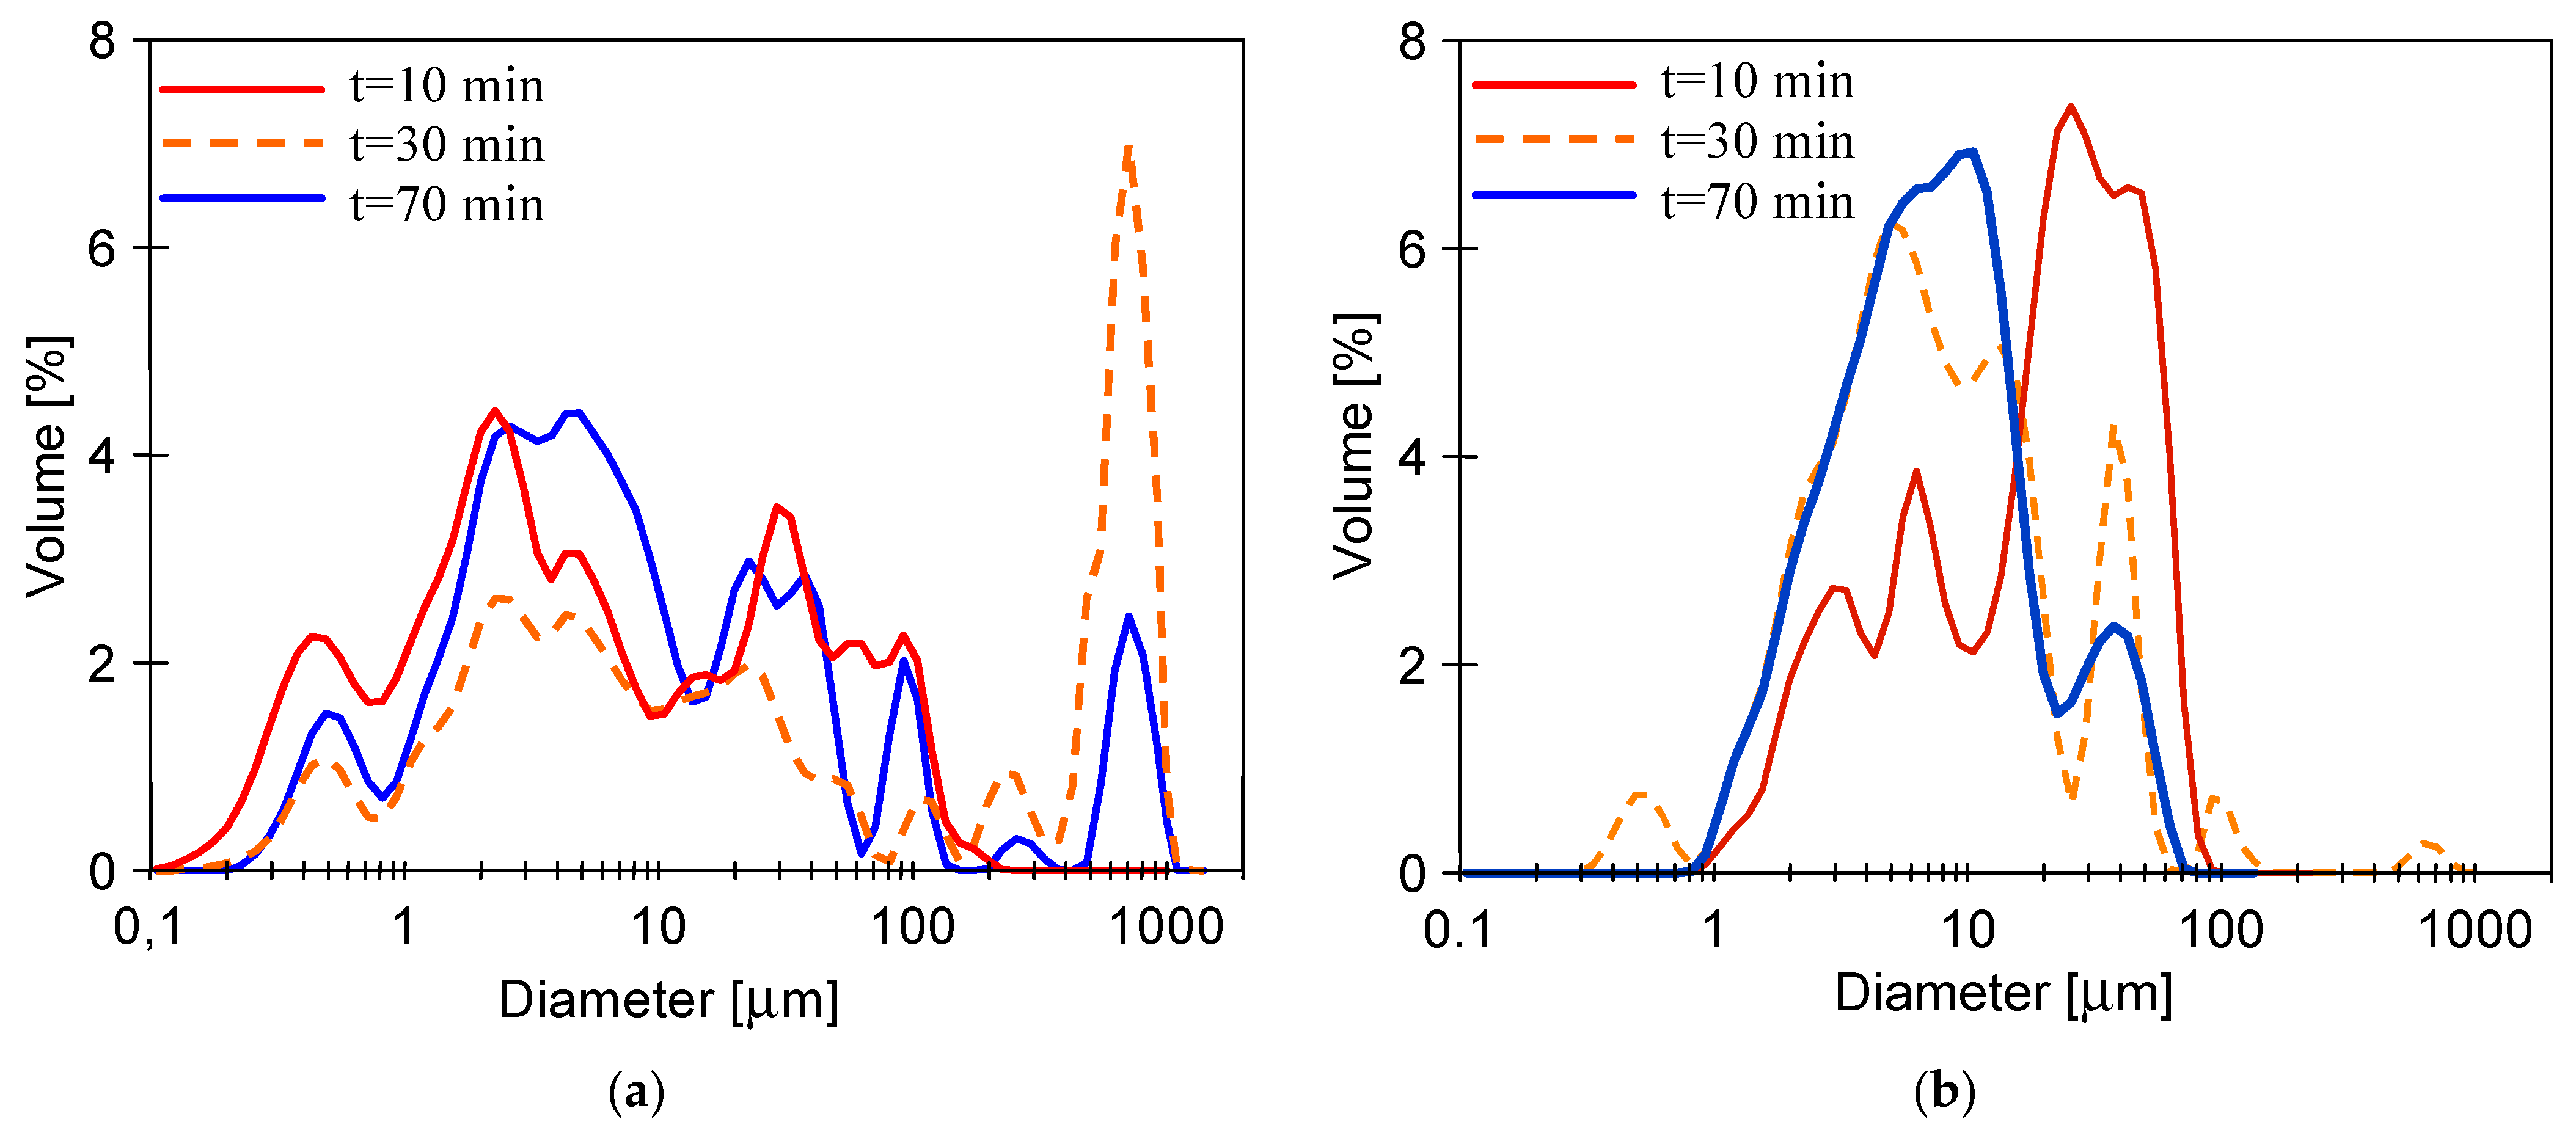
In this part of the study, the MF process of the feed from the tank (5 L) previously unmixed was examined. The conducted study on the droplet size distribution in the feed (Figure 8) showed that the feed parameters changed during the MF run. In the first minutes of the process, a multimodal distribution in the droplet size ranging from 10 to 100 µm was observed. Then, some of the droplets agglomerated, and the presence of droplets with a size of up to 1000 µm was recorded. Such large droplets were released from the feed, and the formation of an oil film on the liquid surface was observed. As a consequence, droplets with a distribution of 10–100 µm remained in the emulsion, and this phenomenon was more intense for a more concentrated emulsion (CF = 150 mg/L, Figure 8b). The observed phenomenon indicates that the connection of the MF installation with the clarifier enabled the separation of the oil phase from the surface of the concentrated feed.
It should be emphasized that studies focusing on membrane cleaning are of great importance for the MF practical applications. Indeed, recovery of the membrane performance is essentially required in order for its reuse. Therefore, in the present study, as soon as each MF run was completed, the procedure of membrane cleaning has been performed. Figure 9 shows the variations in permeate flux during the membrane cleaning after the treatment of model oily wastewater with CF equal to 150 mg/L. As expected, membrane cleaning with distilled water was not efficient. However, it was found that 16 h of soaking the membrane in distilled water (so-called osmotic washing) followed by membrane rinsing with a hypochlorite solution NaClO for 15 min was efficient. Similar results of the membrane cleaning performance were obtained after the MF process of the less concentrated emulsion (CF = 50 mg/L). Lastly, the obtained results allowed indicating that the cake layer formed on the membrane surface during the MF of model emulsions was irreversible, thus requiring the cleaning procedure including osmotic washing and chemical cleaning to be performed. Interestingly, in the literature, various chemical agents have been used to clean polymeric MF membranes fouled by oil-in-water emulsions. For instance, Li et al. [49], in order to clean a hydrophilic PVDF membrane (pore size of 0.15 µm) after microfiltration of an oil-in-water emulsion, used demineralized water and Ultrasil P3–25F solution (0.5% in demineralized water, Henkel, Germany). In turn, Mueller et al. [12] showed that alkaline–acidic–alkaline cleaning of a PAN membrane fouled by oily water was the most effective method. For this purpose, the authors used anionic caustic detergent (pH of 12.1, Zenon) and citric acid (pH of 1.4).
It is well known that operational temperature is an important parameter which may enhance the MF process performance. Moreover, the permeate flux not only depends on the TMP, but also on the membrane resistance Rm and the liquid viscosity µF (Figure 8). Since, oils are characterized by high viscosity, an investigation of the impact of the feed temperature on the PP membrane permeability used for the treatment of oily wastewaters is of great importance.
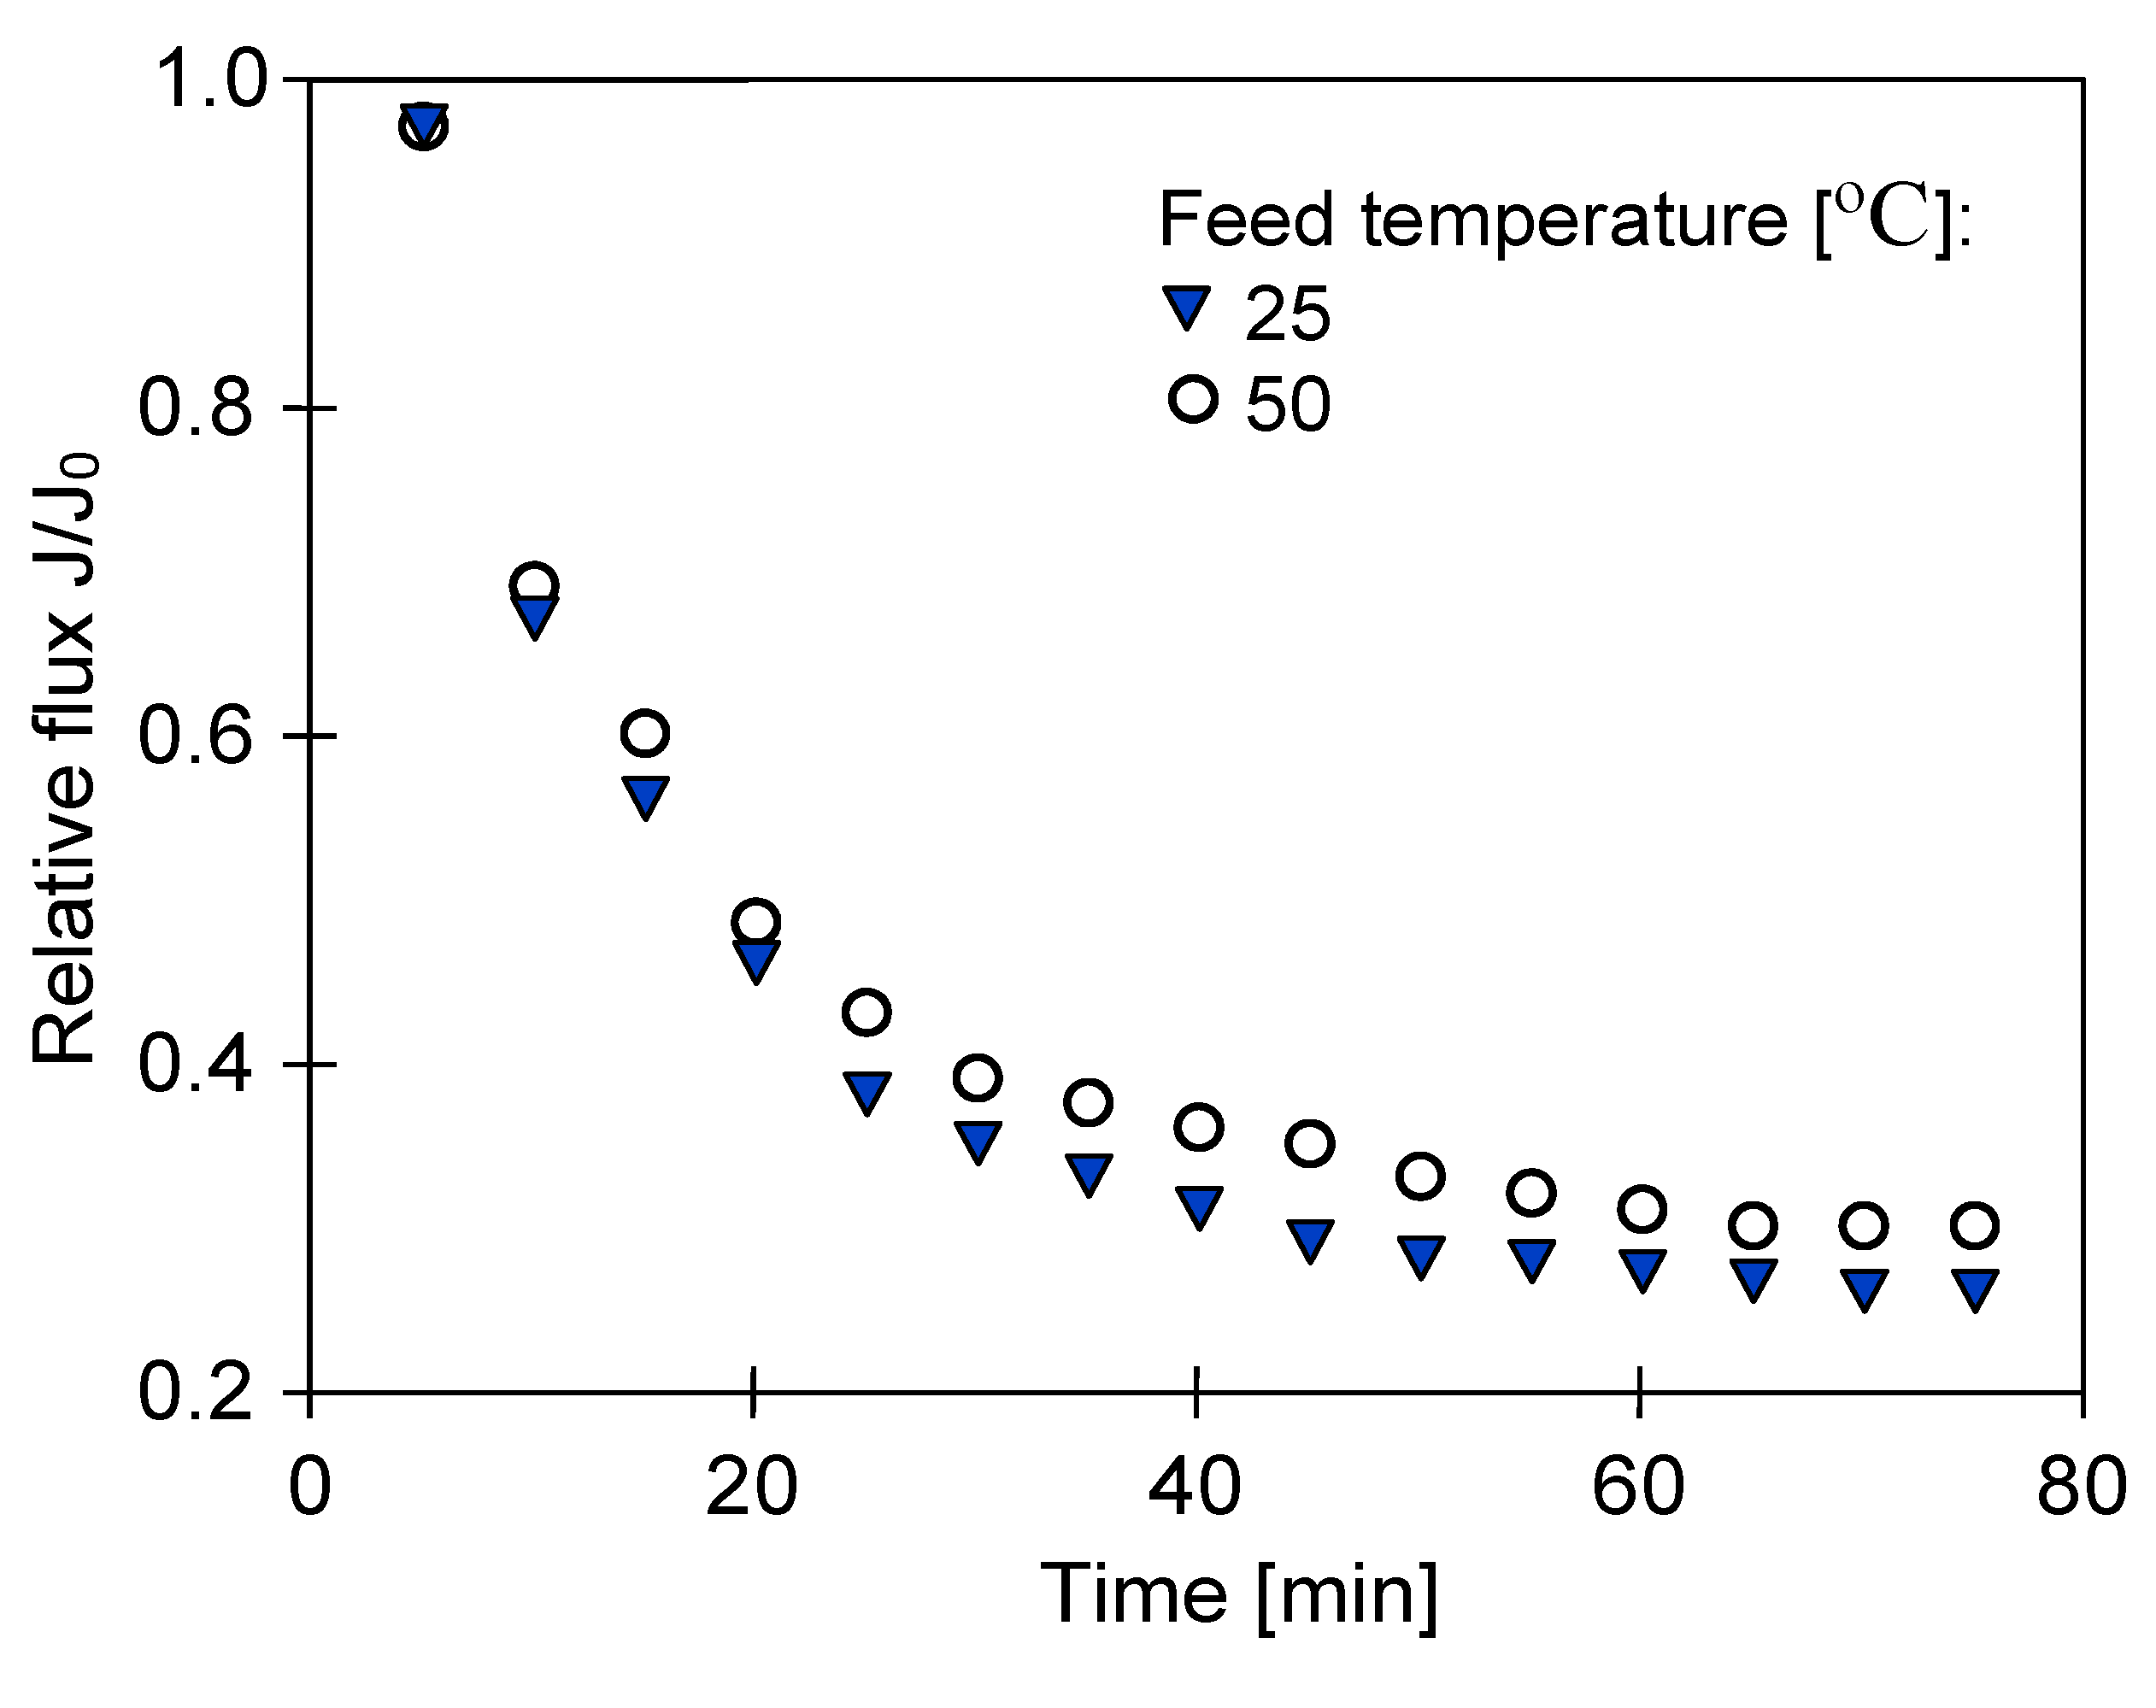
In the present study, in order to study the effect of temperature on the permeate flux, the MF process of model emulsions with CF equal to 90 mg/L was conducted at 25 °C and 50 °C, using a laboratory thermostat (Julabo, 5 L) as a feed tank. As observed (Figure 10), the permeate flux slightly increased upon increasing the feed temperature. Indeed, at a higher temperature, at the end of the process run, the relative permeate flux was equal to 0.3, which was 0.04 p.p. higher than that obtained at a temperature of 25 °C. This observation can be explained by the fact that an increase in temperature led to a decrease in the emulsion viscosity. In addition to the effect on viscosity (Equation (8)), this resulted in an increase in diffusivity and Reynolds number, which, in turn, increased the mass transfer coefficient in the membrane channel [51]. Moreover, since fitting the experimental data to Hermia’s models (Table A1, Appendix A) revealed that cake formation was the most dominant fouling mechanism during the MF process performed at both 25 °C and 50 °C, it can be indicated that increasing the feed temperature allowed reducing the internal attractive force between the membrane surface and cake layer [44]. The results obtained in the present study are in good agreement with the findings demonstrated in several previous works, where it was indicated that an increase in temperature allowed increasing the permeability of ceramic [31,34,44,45], PVDF [50], and PTFE [51] microfiltration membranes employed for treatment of synthetic and real wastewaters. For instance, Wang et al. [50] investigated the effects of operational temperature on the performance of a PVDF microfiltration membrane used for the treatment of laboratory-made emulsified oily wastewater. The authors demonstrated that increasing the temperature from 30 °C to 50 °C led to an increase in the permeate flux from about 75 L/m2h to about 83 L/m2h.
It was found that, after the MF process performed at a temperature equal to 50 °C, osmotic membrane washing followed by cleaning with NaClO solution was efficient (Figure 11). Taking the abovementioned into account, it can be summarized that the presented membrane cleaning protocol ensured a restoration of membrane performance after the treatment process of model emulsions conducted under the entire applied range of temperature (22–50 °C) and oil concentration in the feed (50–150 mg/L).
3.3. MF of Real Oily Wastewaters
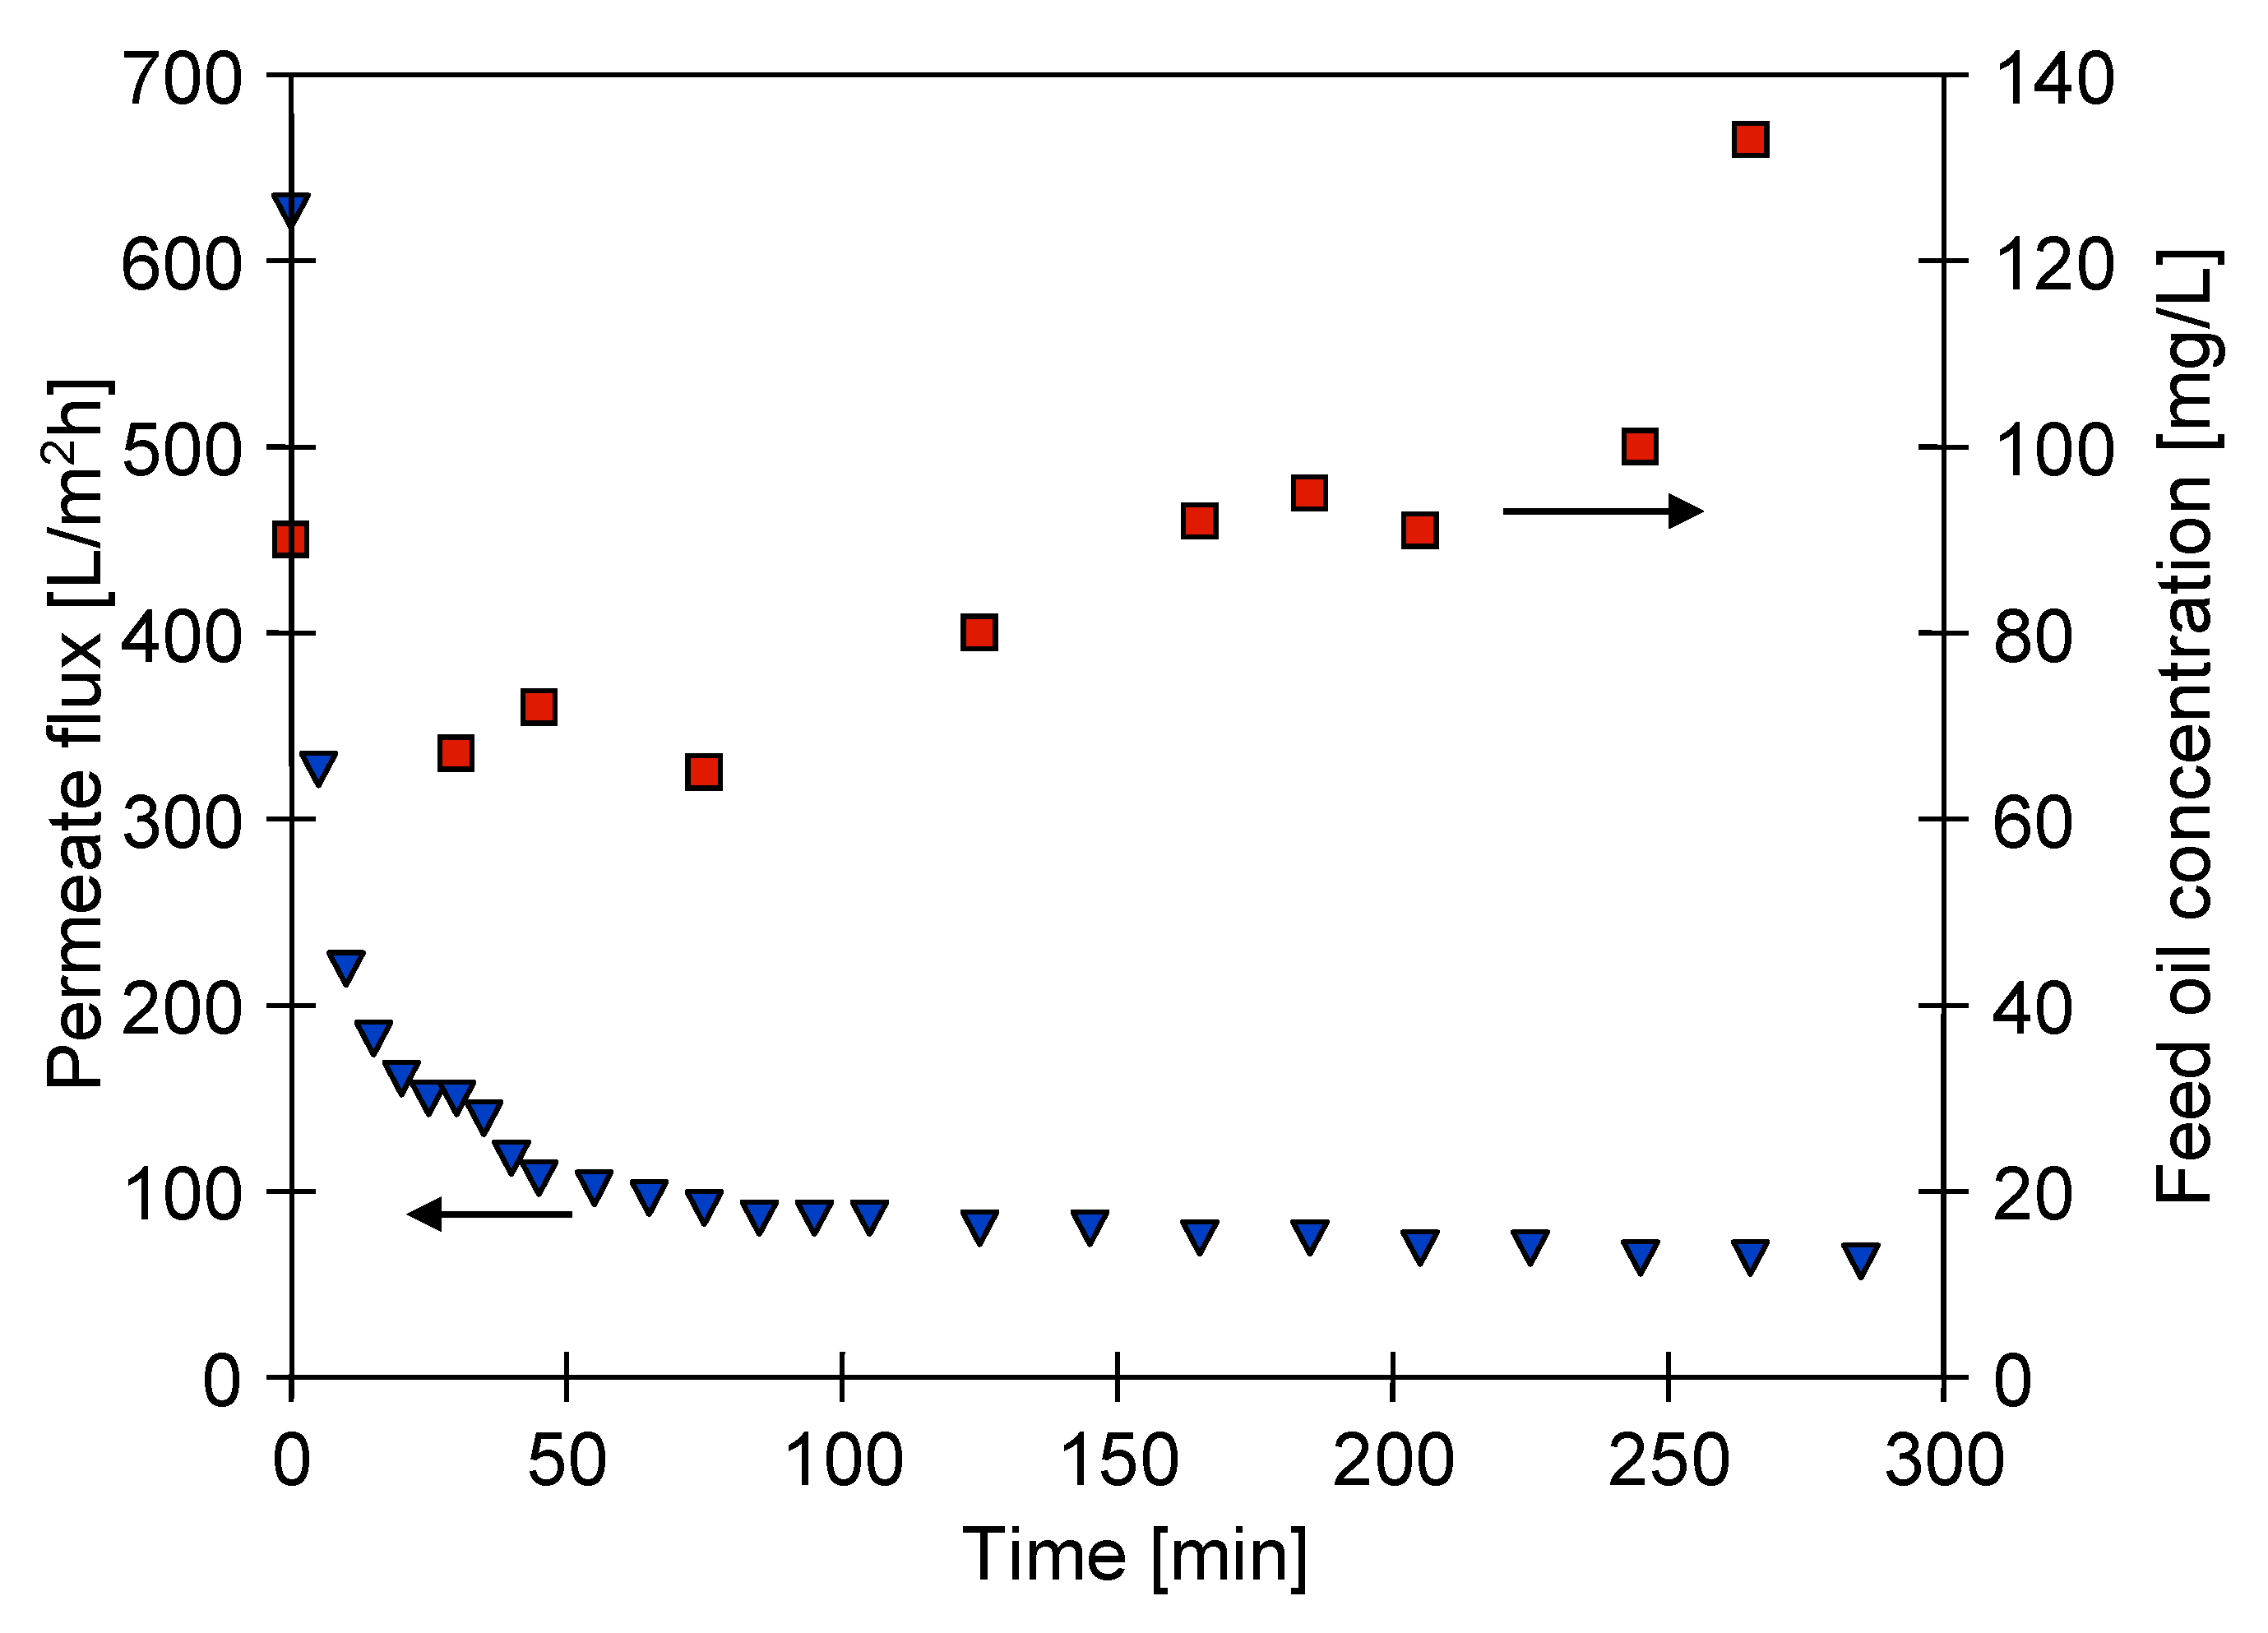
Encouraged by the aforementioned results, we next sought to determine the efficiency and performance of the capillary polypropylene MF membranes used for treatment of industrial oily wastewaters. The initial feed volume was equal to 1.9 L, and the ratio of feed volume to membrane area was 311 L/m2. Figure 12 shows the variations of permeate flux and oil concentration in the feed during the MF of the oily wastewater #1 (Table 1). The process was performed at ambient temperature (22 °C). TMP and VF were maintained at 0.05 MPa and 0.5 m/s, respectively. As expected, a significant reduction in the permeate flux was noted. The initial permeate flux (627 L/m2h) declined sharply in the initial period of the experiment. Indeed, it decreased to 326 L/m2h, 219 L/m2h, and 182 L/m2h after 5 min, 10 min, and 15 min, respectively. Finally, a steady flux of 64 L/m2 bar was achieved. This demonstrates that performing the MF process of industrial oily wastewaters led to a 90% decrease in the membrane performance.
Hermia’s models were employed in order to determine the fouling mechanism of the used membranes. The obtained results (Table A1, Appendix A) allowed indicating that the dominant mechanism of flux decline during the MF of real oily wastewater was cake formation. This result indicates that most of the feed components that were rejected by the membranes were much larger in size than the pores of the membranes. Consequently, the membrane surfaces were covered with a layer of a permeable cake. This finding is consistent with earlier results [52,71], wherein it was shown that cake formation was dominant mechanism leading to flux decline during MF of real oily wastewaters.
Performing the MF process of the industry oil wastewater allowed obtaining a concentrated feed. Indeed, the oil concentration increased from 90 mg/L to 135 mg/L (Figure 12). It is worth noting that an initial decline in oil concentration was observed. This is clearly related to the fact that, before carrying out each series run, the system was cleaned by a hypochlorite solution, leading to oil adsorption on the installation surface.
In turn, the feed turbidity increased from 53.6 NTU to 156 NTU after 265 min of the process run (Figure 13). Analysis of the obtained permeate (Figure 13) shows that the use of PP microfiltration membranes ensured obtaining a high-quality permeate characterized by turbidity in the range 0.2–0.33 NTU and oil concentration in the range of 7–15 mg/L. Thus, the results highlight the efficiency of PP microfiltration membranes in the treatment of real oily wastewaters. Importantly, the noted level of oil concentration in the obtained permeate is in line with the requirements of the MARPOL Convention. Consequently, this result indicates that the used PP membranes ensured a filtrate that was pure enough to be discharged into the environment. To sum up, the results obtained in the present study demonstrate that the microfiltration PP membranes provided oil and turbidity removal efficiencies (Equations (1) and (2)) equal to 83.33% and 99.38%, respectively.
It has to be pointed out that the obtained results (Figure 13) are closely comparable with those described in the literature for MF of real wastewaters. For instance, Abadi et al. [31] demonstrated that a tubular ceramic membrane (α-Al2O3) with a pore size of 0.2 μm could be successfully applied for the treatment of oily wastewaters coming from API effluent of a Tehran refinery. The authors showed that the membrane used provided reductions in oil and turbidity equal to 85% and 98.6%, respectively.
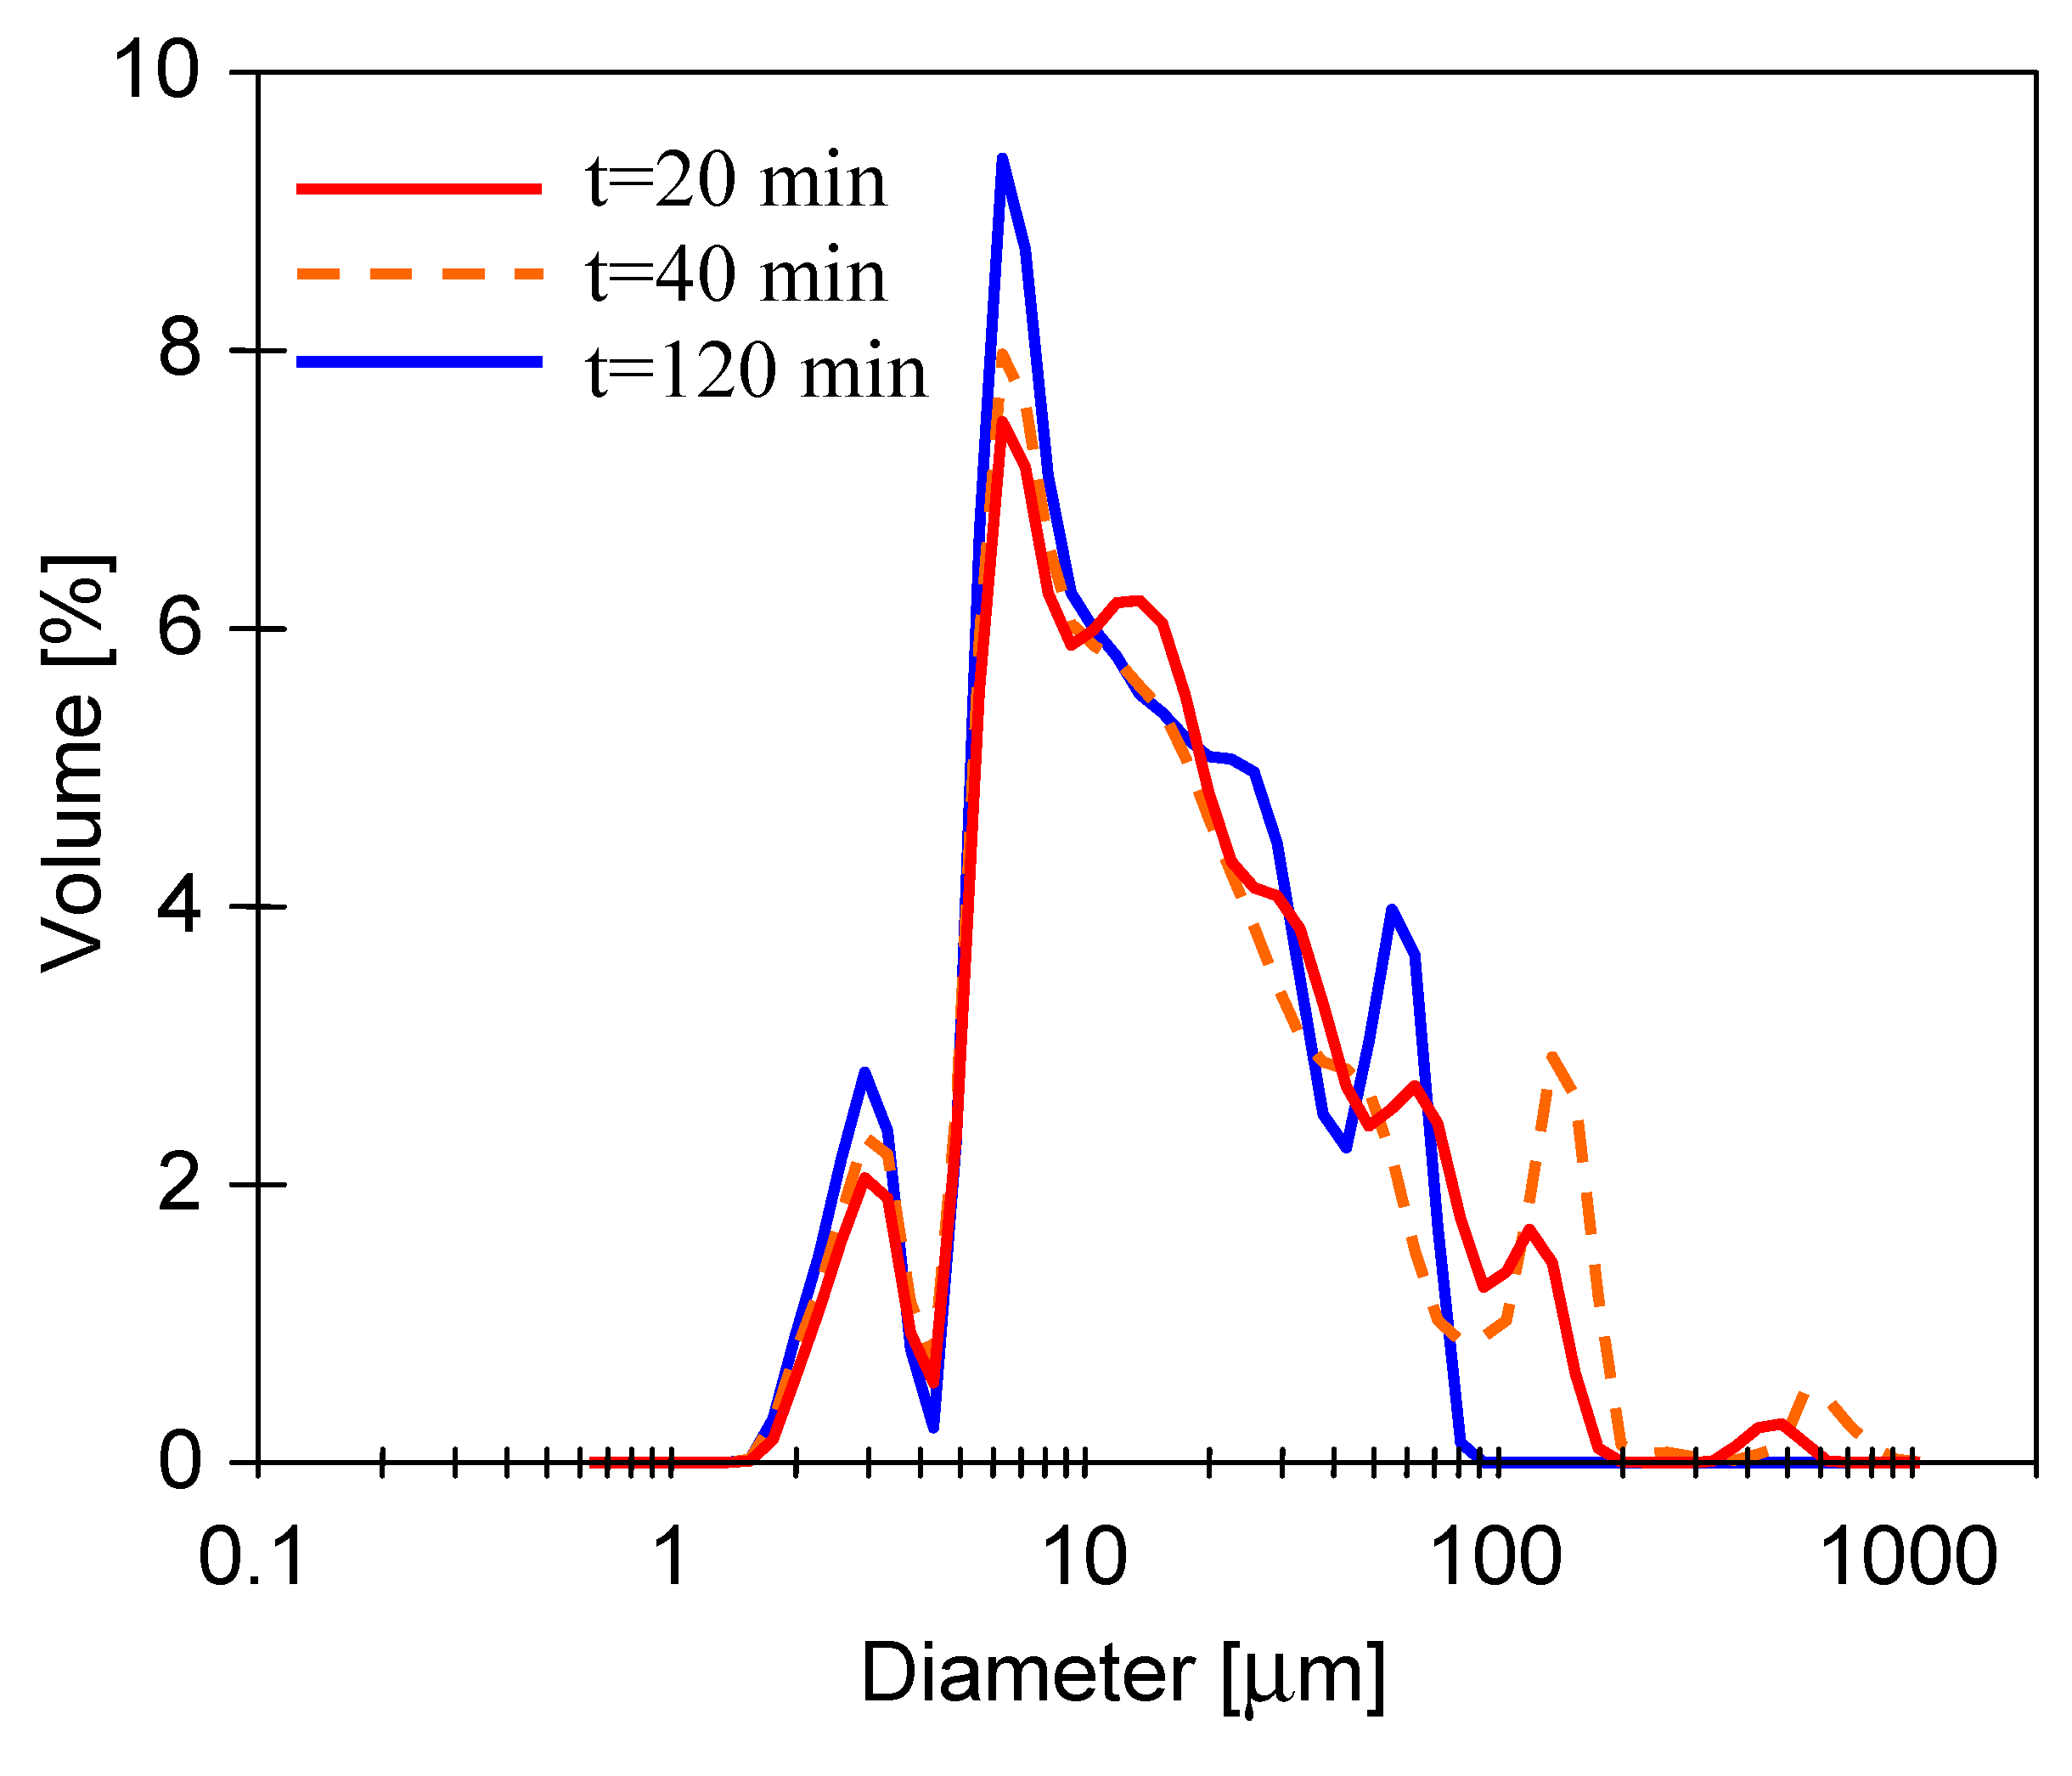
It was found that, contrary to the droplet size distribution for model emulsions (Figure 8), the particle size distribution in the real oily wastewater did not change significantly during the MF process (Figure 14). This is due to the fact that the majority of the feed contained particle sizes corresponding to a solid suspension, which thickened but did not agglomerate. The peaks around 100 µm correspond to oil droplets which, similarly to studied MF of model emulsion (Figure 8), agglomerated during the process and increased to 1000 µm (line t = 40 min) before disappearing, leading to a dominant size in the range of 10–100 µm (line t = 120 min).
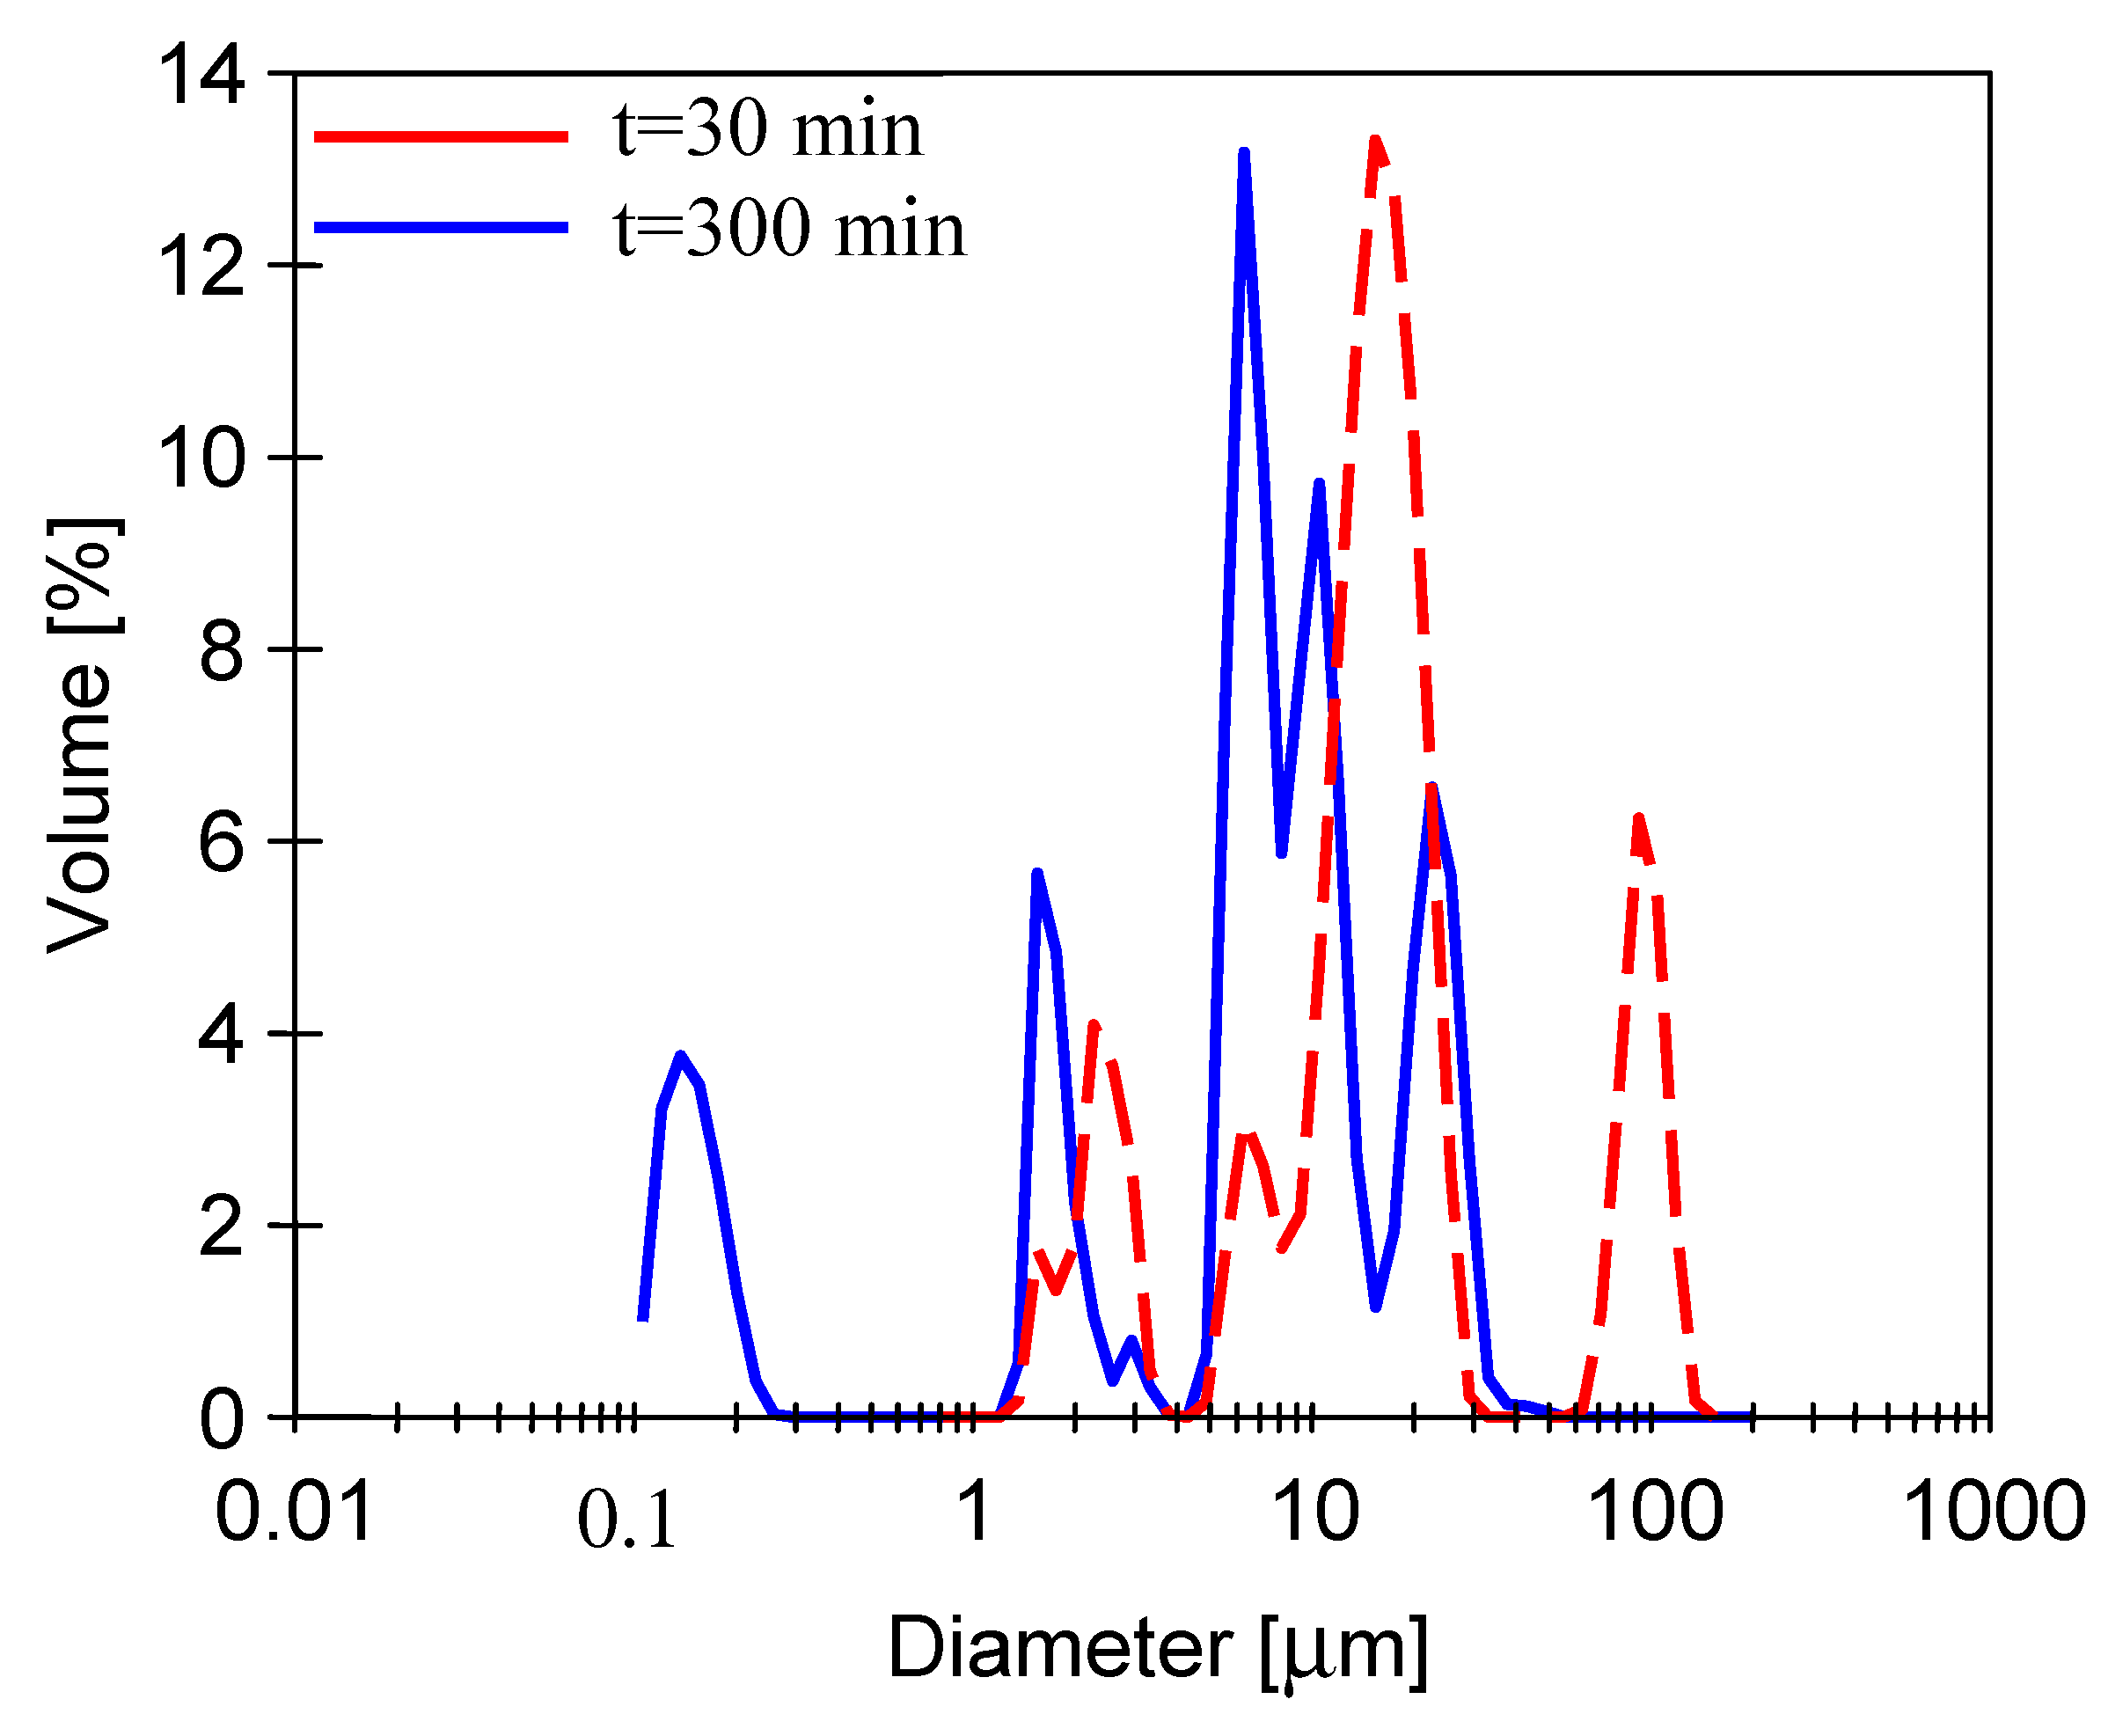
The study of the droplet size distribution in the permeate obtained during the first and last 30 min of the MF process run showed some differences (Figure 15). At the beginning of the process, when the membrane was probably less contaminated, the coalescence and agglomeration processes were more intense and, as a consequence, larger droplets were formed, especially in the ranges of 10–30 µm and 90–110 µm. A similar effect occurred during the MF of model emulsion (Figure 7). However, the formation of a filter cake on the membrane surface changed these effects, whereby, at the end of the process, significantly smaller droplets, mainly below 10 µm, were present in the permeate.
In addition, it was determined that the earlier-presented protocol of membrane cleaning was also effective after the MF process of real wastewaters. Figure 16 shows the variations in permeate flux during membrane cleaning after MF of oily wastewater #1. Indeed, osmotic washing followed by cleaning with NaClO solution allowed a 90% restoration of membrane performance.
3.4. Long-Term MF of Real Oily Wastewaters
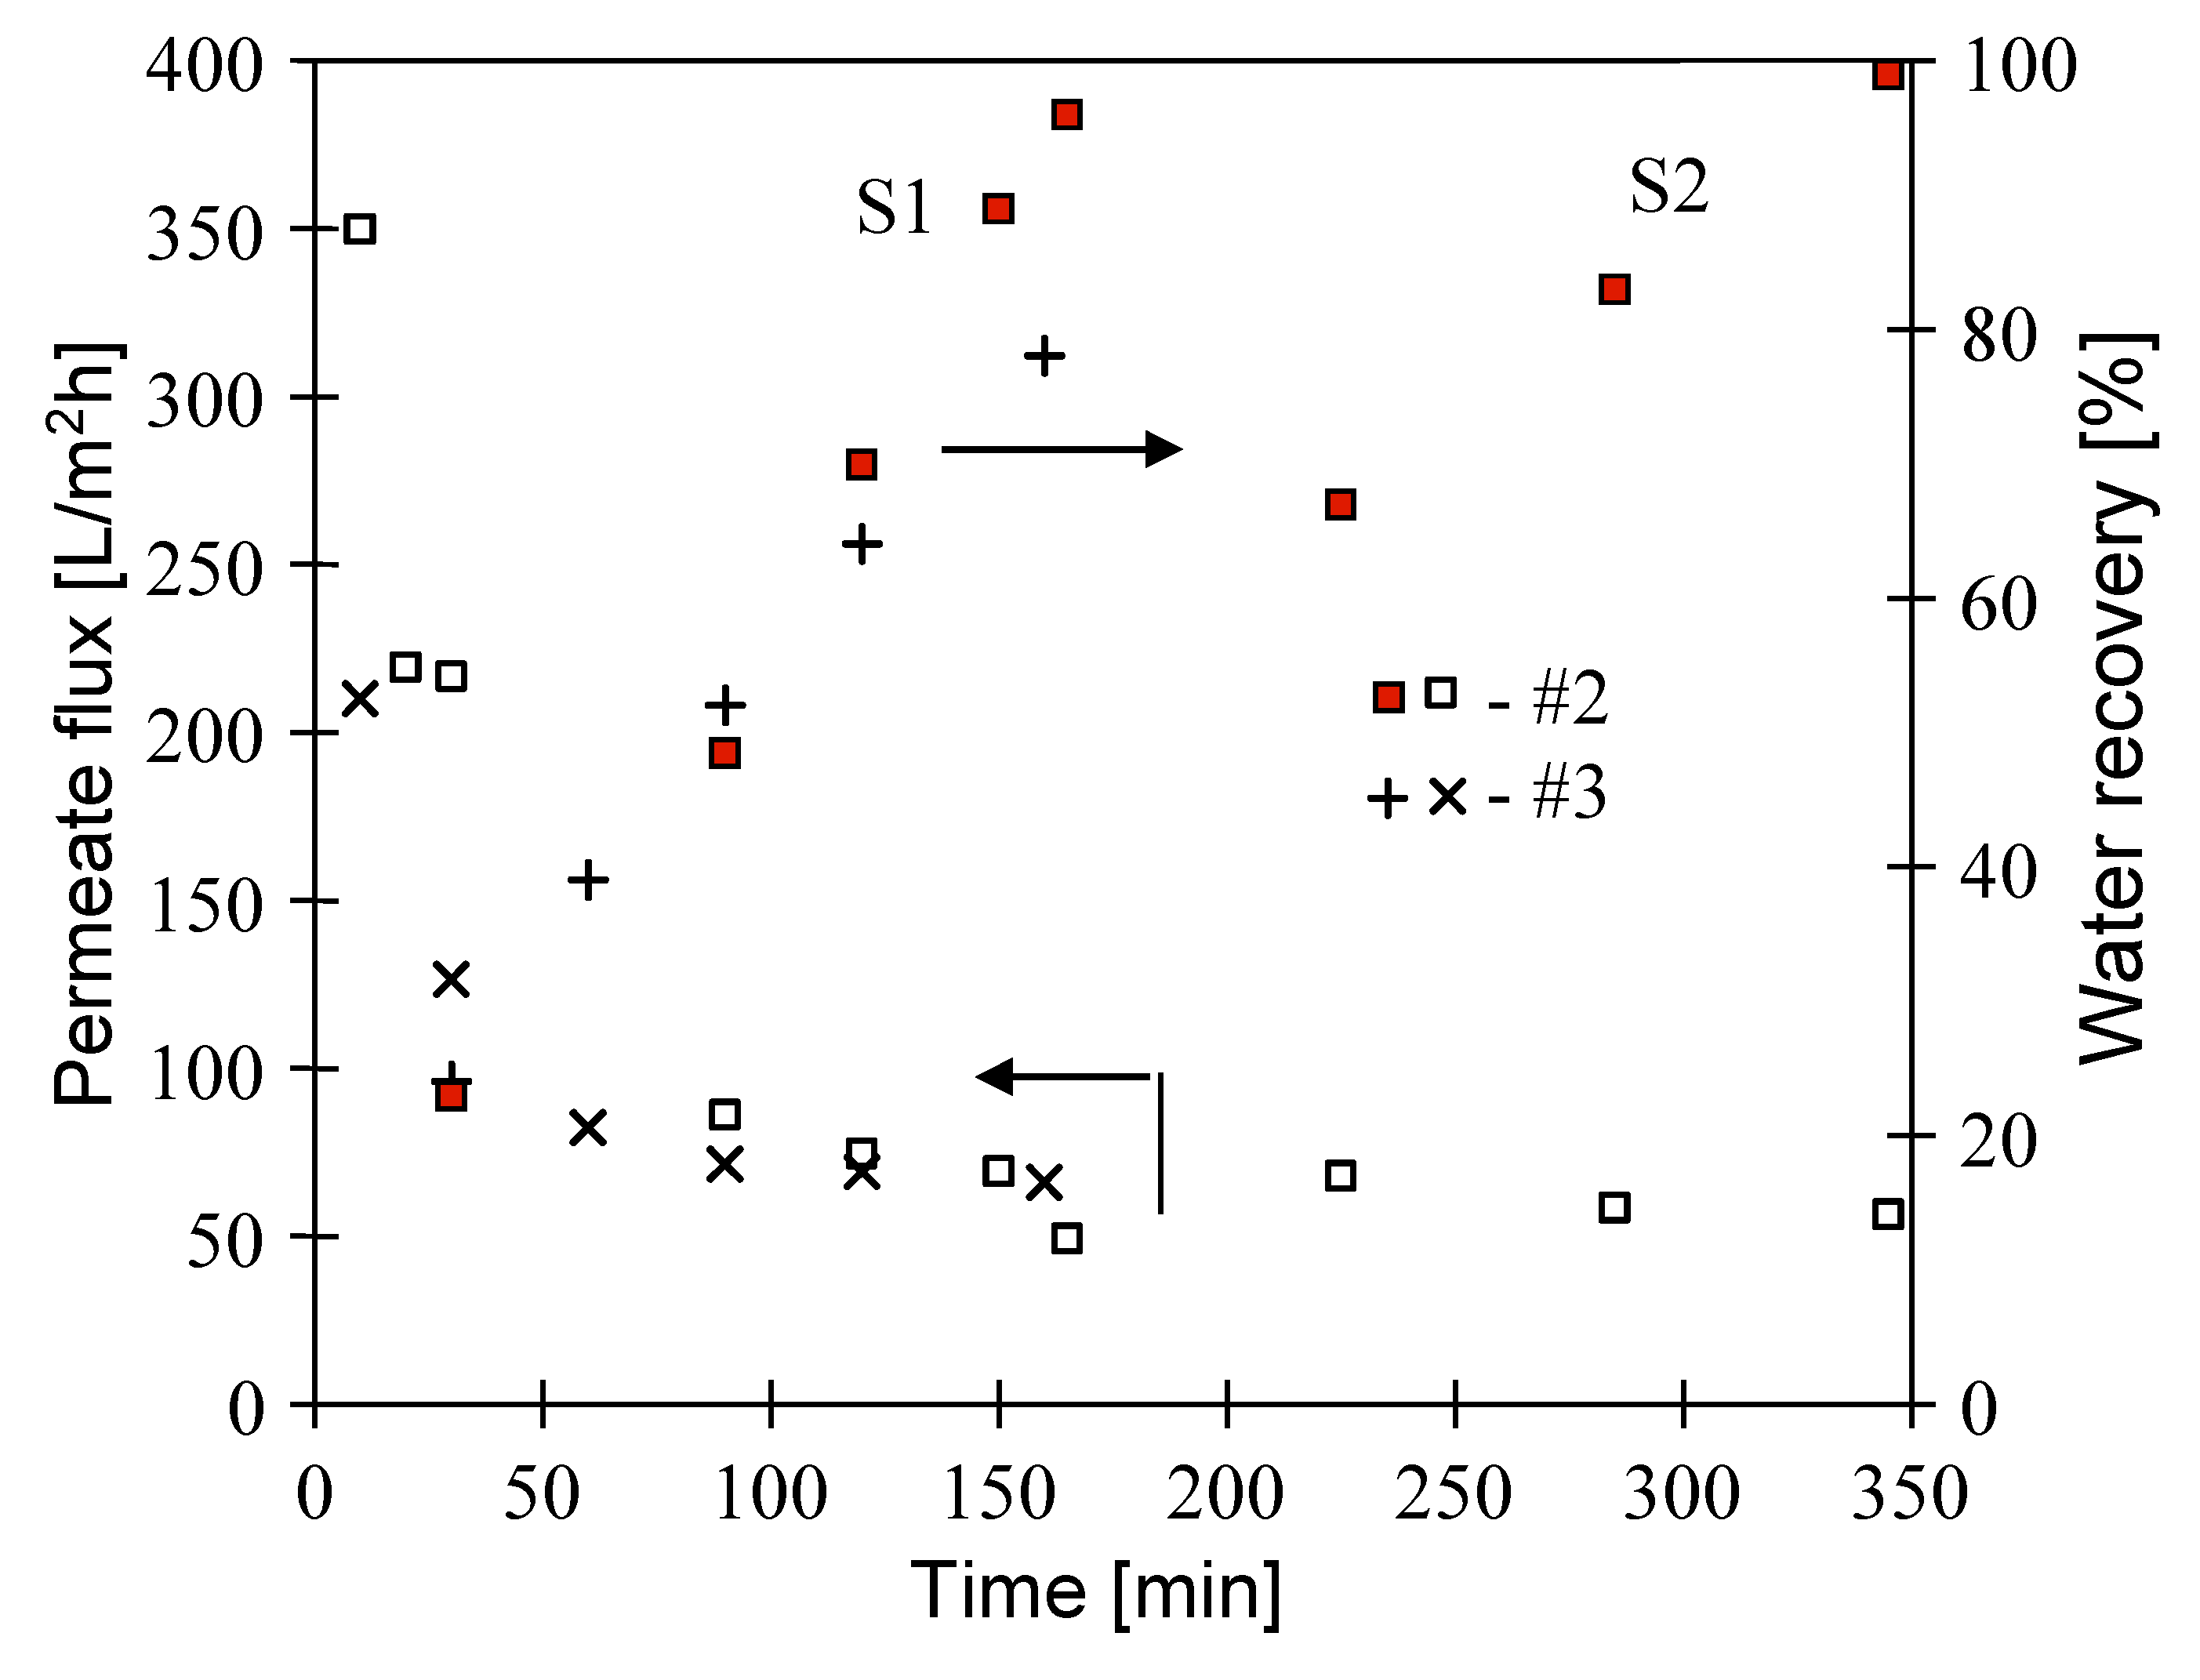
In order to investigate the application of polypropylene MF membranes for long-term treatment of real oily wastewaters, the MF2 module was used. This was motivated by the fact that this module has a length corresponding to that of membranes used in the industry. In the first stage of the long-term MF studies, the treatment of the real oily wastewater #2 (Table 1) was performed. The process was conducted at ambient temperature (22 °C). The TMP and VF were equal to 0.05 MPa and 0.5 m/s, respectively. As stated before, the initial performance of the membrane module (tap water as a feed) under abovementioned conditions was equal to 700 L/m2h. It can be clearly observed that, during the MF of oily wastewater, the permeate flux was significantly reduced (Figure 17). Indeed, the obtained steady state permeate flux was equal to about 55 L/m2h. This result indicates that, during the treatment of studied wastewater, the module performance was equal to about 8% of its maximum value.
It has to be pointed out that performing the MF process of real oily wastewater #2 ensured high values of the water recovery coefficient (Figure 17). Indeed, after 165 min of the experiment run (series S1), it was equal to 97%. Hence, due to the small amount of liquid remaining in the feed tank, a consecutive portion of the wastewater was added. The process was further carried out (series S2), and the overall coefficient of water recovery was about 99% at the end of the process (345 min).
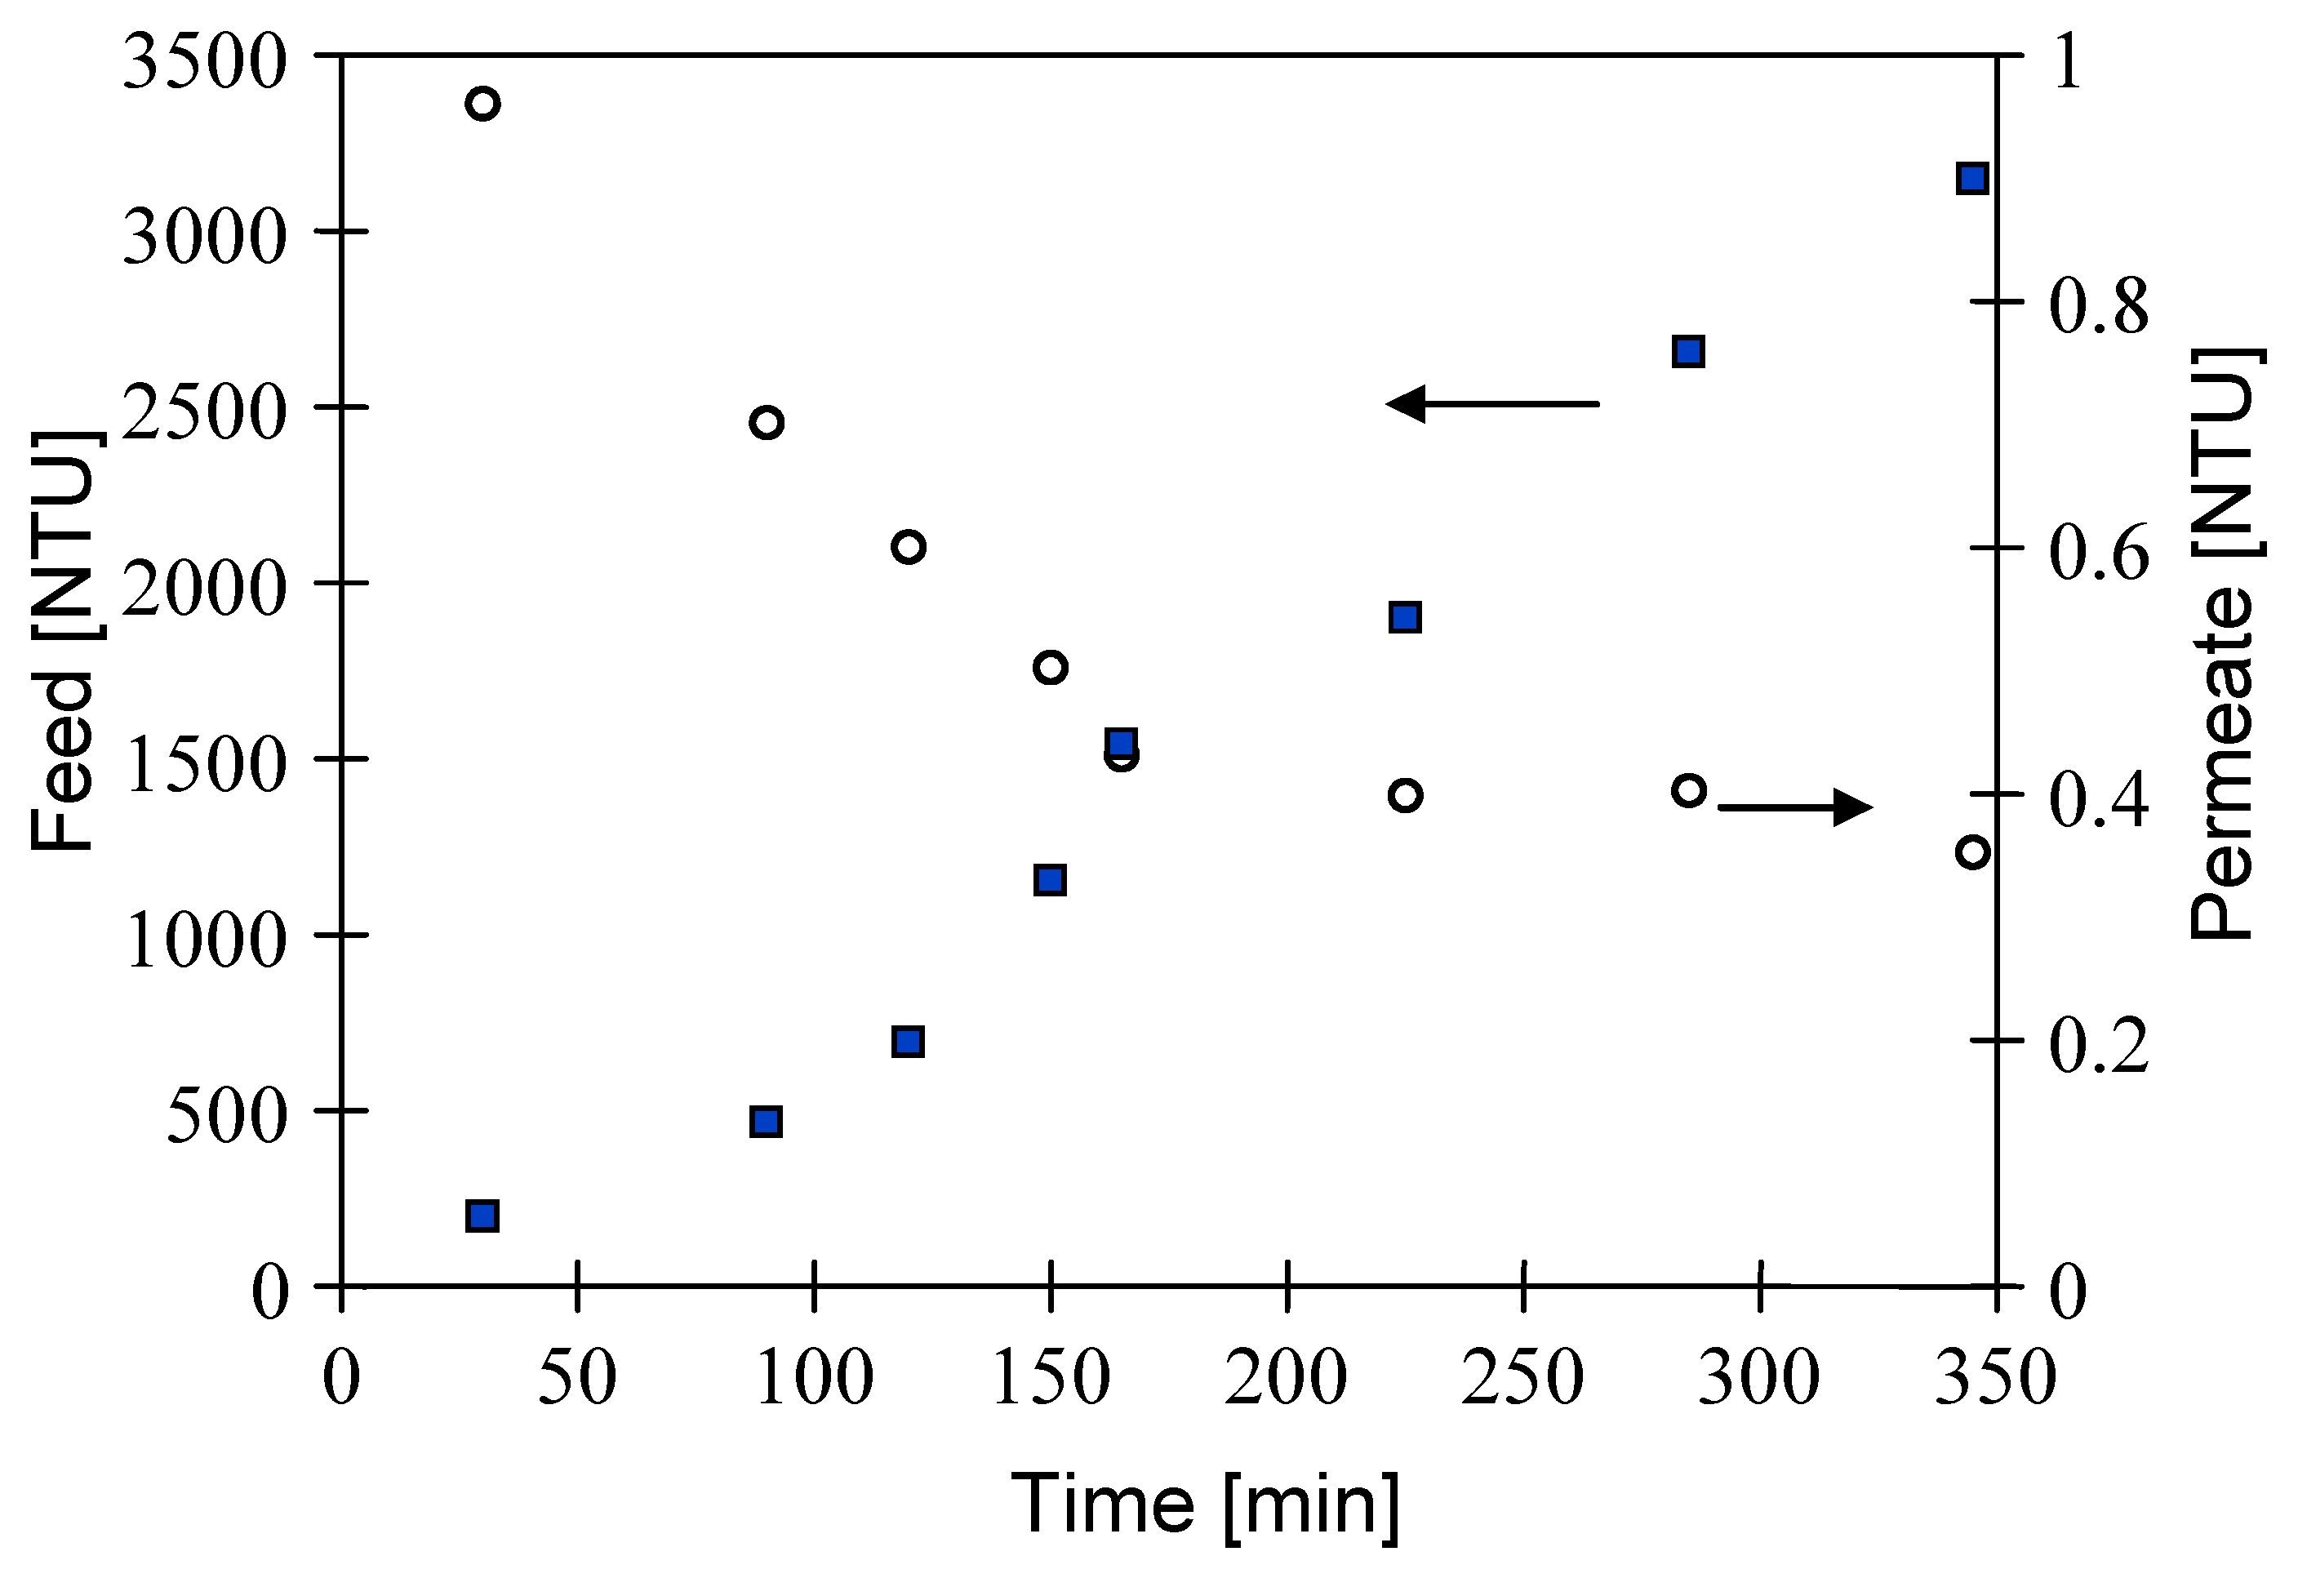
The achievement of high values of water recovery coefficient in the MF process led to a significant concentration of suspended solids in the feed. As a result, a rapid increase in feed turbidity was observed. Carrying out the MF process allowed increasing the feed turbidity ninefold, from 352 NTU to 3200 NTU (Figure 18). Importantly, despite the high values of feed turbidity, the use of PP microfiltration membranes ensured obtaining a high-quality permeate. Indeed, it was noted that, during the first 160 min of the process, the permeate turbidity decreased from 1 to 0.4 NTU and remained at this level until the end of the experiment. This clearly indicates that, in the long-term MF process, the used membranes provided a turbidity removal efficiency Rt (Equation (2)) equal to 99.98%. The key highlight is, therefore, that the used PP membranes also showed excellent separation properties in the long-term oily wastewater treatment process.
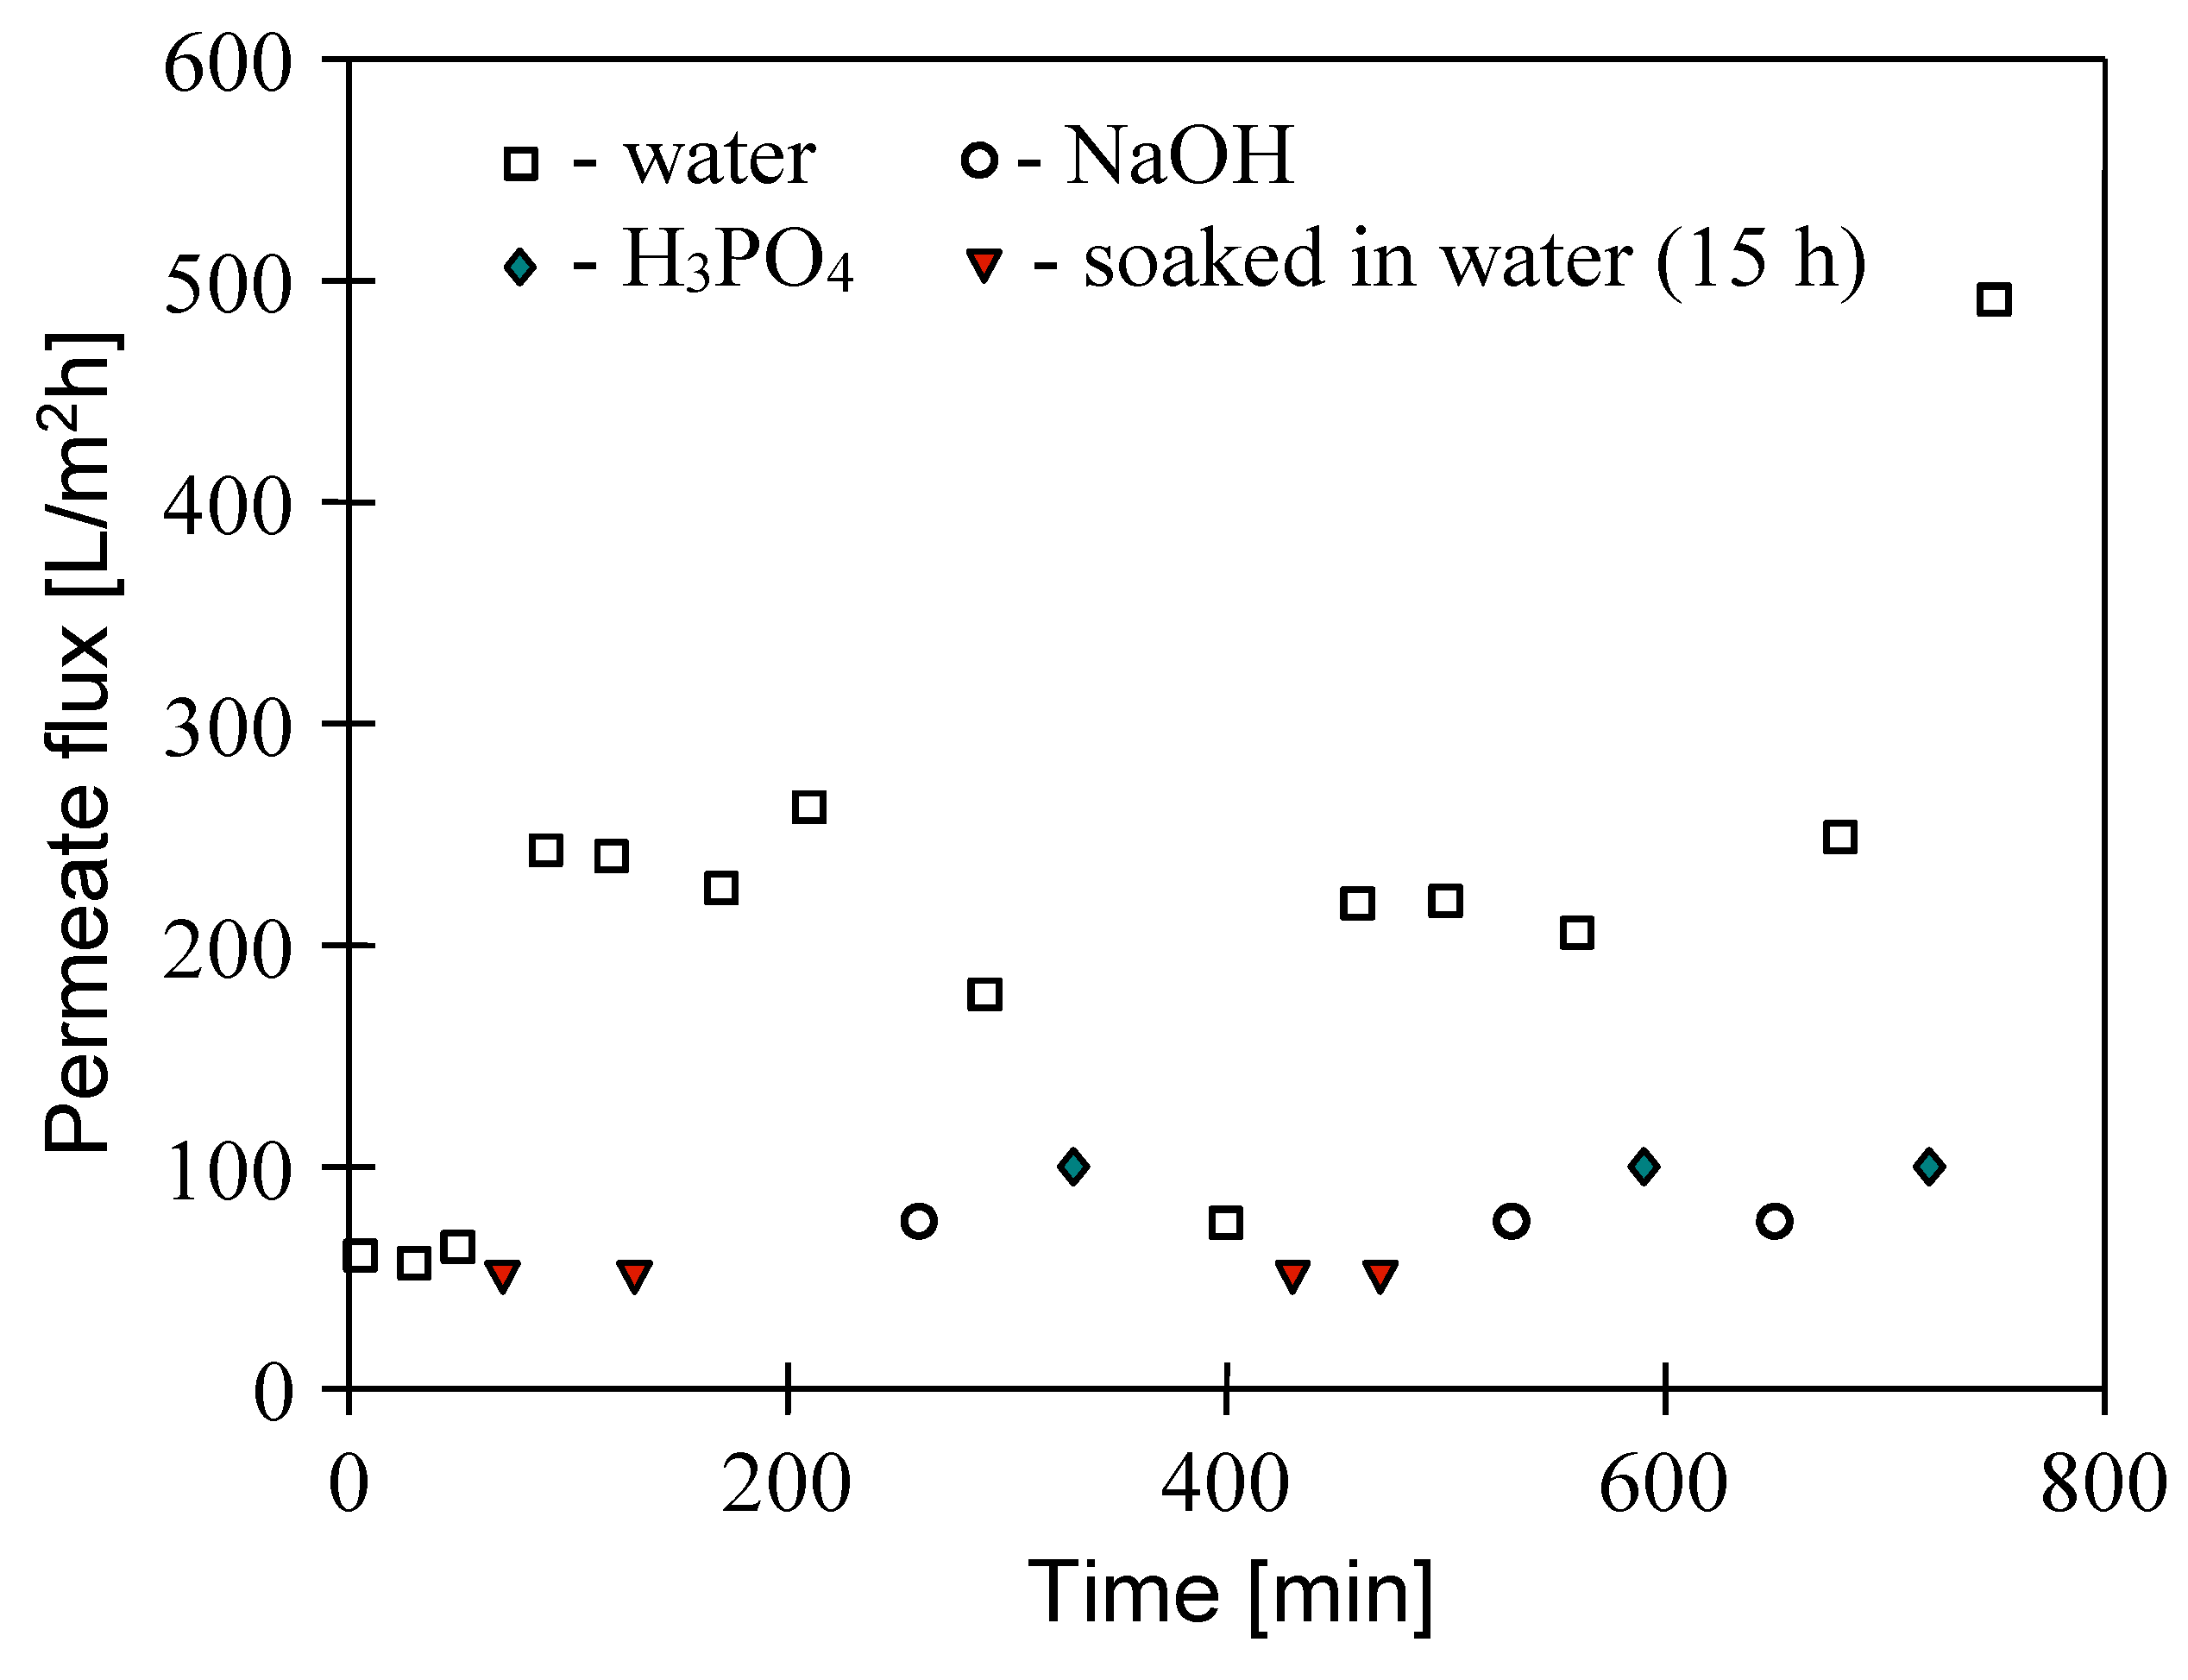
After completing the treatment process of oily wastewater #2, the membranes were cleaned. As presented before (Section 3.3), module cleaning with sodium hypochlorite solution is an effective method. However, it should be emphasized that this agent may be destructive for membrane installations. Therefore, taking into account that the resistance of membranes and installations to chemical agents is one of the basic conditions required for industrial membrane application, at this stage of the studies, the effectiveness of membrane cleaning with less aggressive solutions, such as NaOH and H3PO4, was investigated. The results presented in Figure 19 demonstrate that rinsing the MF2 module with water did not lead to a recovery of its initial performance. This clearly indicates a significant contribution of irreversible fouling to the permeate flux decline. However, it was found that a long period of membrane contact with distilled water (osmotic washing) was advantageous and allowed increasing the module performance to a significant degree. Similar results for the tested membranes (Accurel PP S6/2) were also obtained during the studies of the MF process in a membrane bioreactor [79]. Unfortunately, after 2 days of such MF2 module cleaning, its performance increased only to 270 L/m2h. Therefore, chemical cleaning including module rinsing with NaOH and H3PO4 solutions was performed. As a result, the module performance increased to 478 L/m2h.
In the next stage of the studies, the MF of real oily wastewater #3 was performed. As shown in Figure 17, although wastewater #3 was characterized by significantly higher initial turbidity (585 NTU) than oily wastewater #2 (354 NTU), for both studied feeds, the decrease in PP membrane performance was similar. Moreover, the investigation of fouling mechanisms based on Hermia’s models (Table A1, Appendix A) elucidated that the flux decline during treatment of wastewaters #2 and #3 was mainly caused by the formation of a cake layer on the membrane surface.
The measurements of changes in the feed and permeate turbidity during the MF of oily wastewater #3 demonstrated that the final turbidity of the feed was equal to 1920 NTU, whereas the permeate turbidity was stabilized at a level of 0.35 NTU. Furthermore, it was found that the used PP membranes provided a 78% recovery of water from wastewater in this case (Figure 17). Importantly, these findings indicate that the used PP membranes also showed excellent separation properties in the long-term oily wastewater treatment process. Undoubtedly, it shows their potential in the industrial applications.
After filtration of oily wastewater #3, module cleaning was conducted. It is noticeable that, after one run of the chemical cleaning, the module performance was low (390 L/m2h). With regard to this, the cleaning procedure was repeated. Finally, the permeate flux increased to almost 500 L/m2h, which is similar to that noted at the beginning of the presented studies.
The results obtained in the present study demonstrate that the PP membranes used for long-term MF of real oily wastewater with high turbidity exhibited good effectiveness. The observations of the separation by the deoiling installation in the considered harbor wastewater plant carried out for over a month showed that the coagulation/flotation process proceeded effectively in about 60–65% of cases, and the effluents obtained from these processes had turbidity at a level of 25 NTU. The PP membrane performance used for the treatment of such wastewaters (wastewater #4, Table 1) is presented in Figure 20. The long-term process was performed at a TMP equal to 0.05 MPa and VF of 0.5 m/s. As with the other studied wastewaters, a rapid decline in permeate flux was observed during the initial period of the process run. However, in comparison with the filtration of wastewaters characterized by higher turbidity (wastewaters #2 and #3, Table 1), the period of this decline was longer (150 min).
During the first 419 min of the process (Figure 20, series S1), the feed tank (3 L) was supplied in a continuous mode with fresh portions of wastewater, resulting in a coefficient of water recovery equal to 77% and a permeate with turbidity at a level of 0.4 NTU. Due to the retention of suspended solids by the membranes, the feed turbidity increased to 82 NTU. In the subsequent stage (series S2), the MF process was carried out in batch mode, resulting in a fourfold reduction in feed volume, leading to an increase in its turbidity from 25 NTU to 79 NTU. Next (series S3), the obtained permeate was recycled to the feed tank. Finally, after over 2400 min of the experiment, the maximum process performance was reduced from 500 to 38 L/m2h (steady-state permeate flux). As in the previously conducted MF processes, analysis based on Hermia’s models (Table A1, Appendix A) demonstrated that noted declines in the permeate flux during the long-term treatment of oily wastewater #4 were mainly caused by the formation of a cake layer on the membrane surface.
Figure 21 shows the variations in permeate flux during membrane cleaning after MF of oily wastewater #4. The results obtained highlight the efficiency of P3 Ultrasil 11 agent (pH = 11.8–12.0) in cleaning PP membranes used for the separation of real oily wastewater. However, it should be pointed out that the cleaning procedure had to be repeated several times to restore the module initial performance of 550 L/m2h. Most probably, it was associated with feeding the MF module with a cold cleaning solution (22–25 °C). Importantly, since a stabilized maximum performance of the new MF module was equal to 700 L/m2h, it can be indicated that some of the foulants located inside the membrane wall were not removed during the performed cleaning operation.
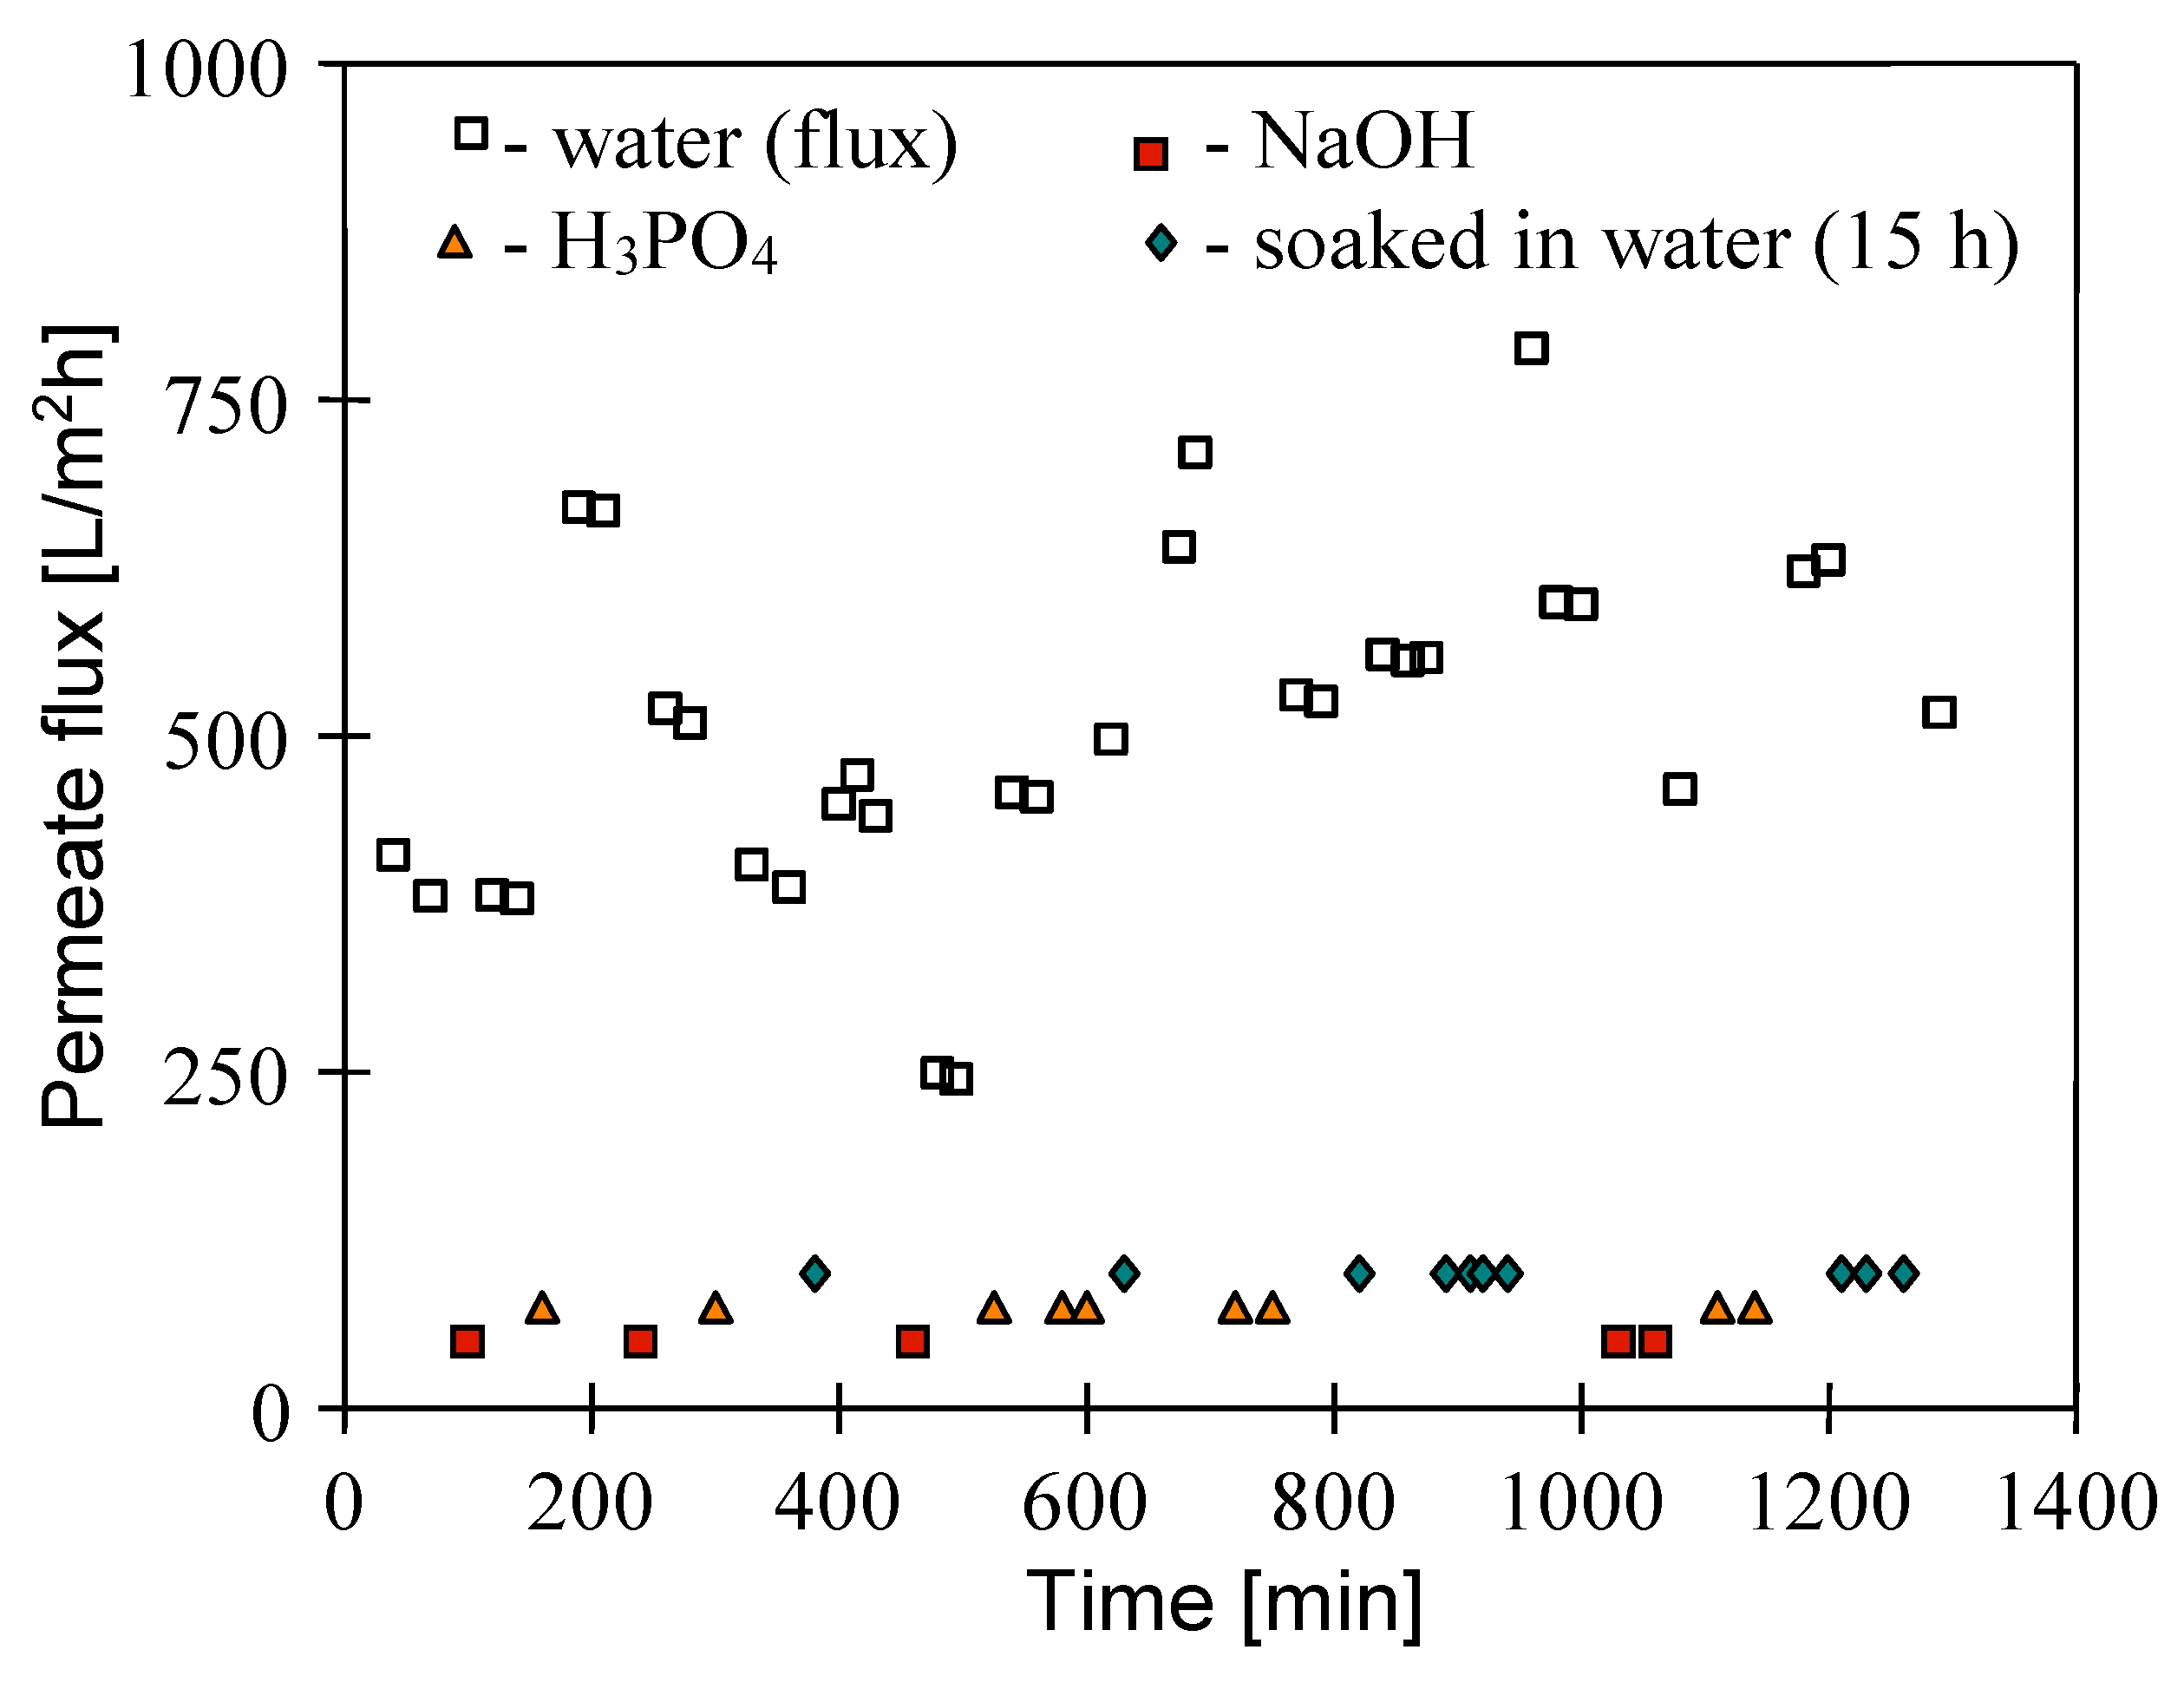
In order to perform a more efficient procedure of membrane cleaning, in the subsequent stage, another operation of membrane cleaning was performed (Figure 22). The studies confirmed the observations from previous studies [79,80], whereby, directly after rinsing the module with NaOH solution, the permeate flux decreased, whereas, in combination with longer membrane soaking in the distilled water and/or upon rinsing with H3PO4 solution, an improvement in module performance could finally be achieved. In the case under study, a permeate flux above 750 L/m2h (Figure 22, 680 min) could be temporarily obtained. However, a further repetition of the cleaning operation resulted in a decrease in module performance, which varied in the range of 500–600 L/m2h; thus, it was similar to that obtained during cleaning with P3 Ultrasil 11 agent.
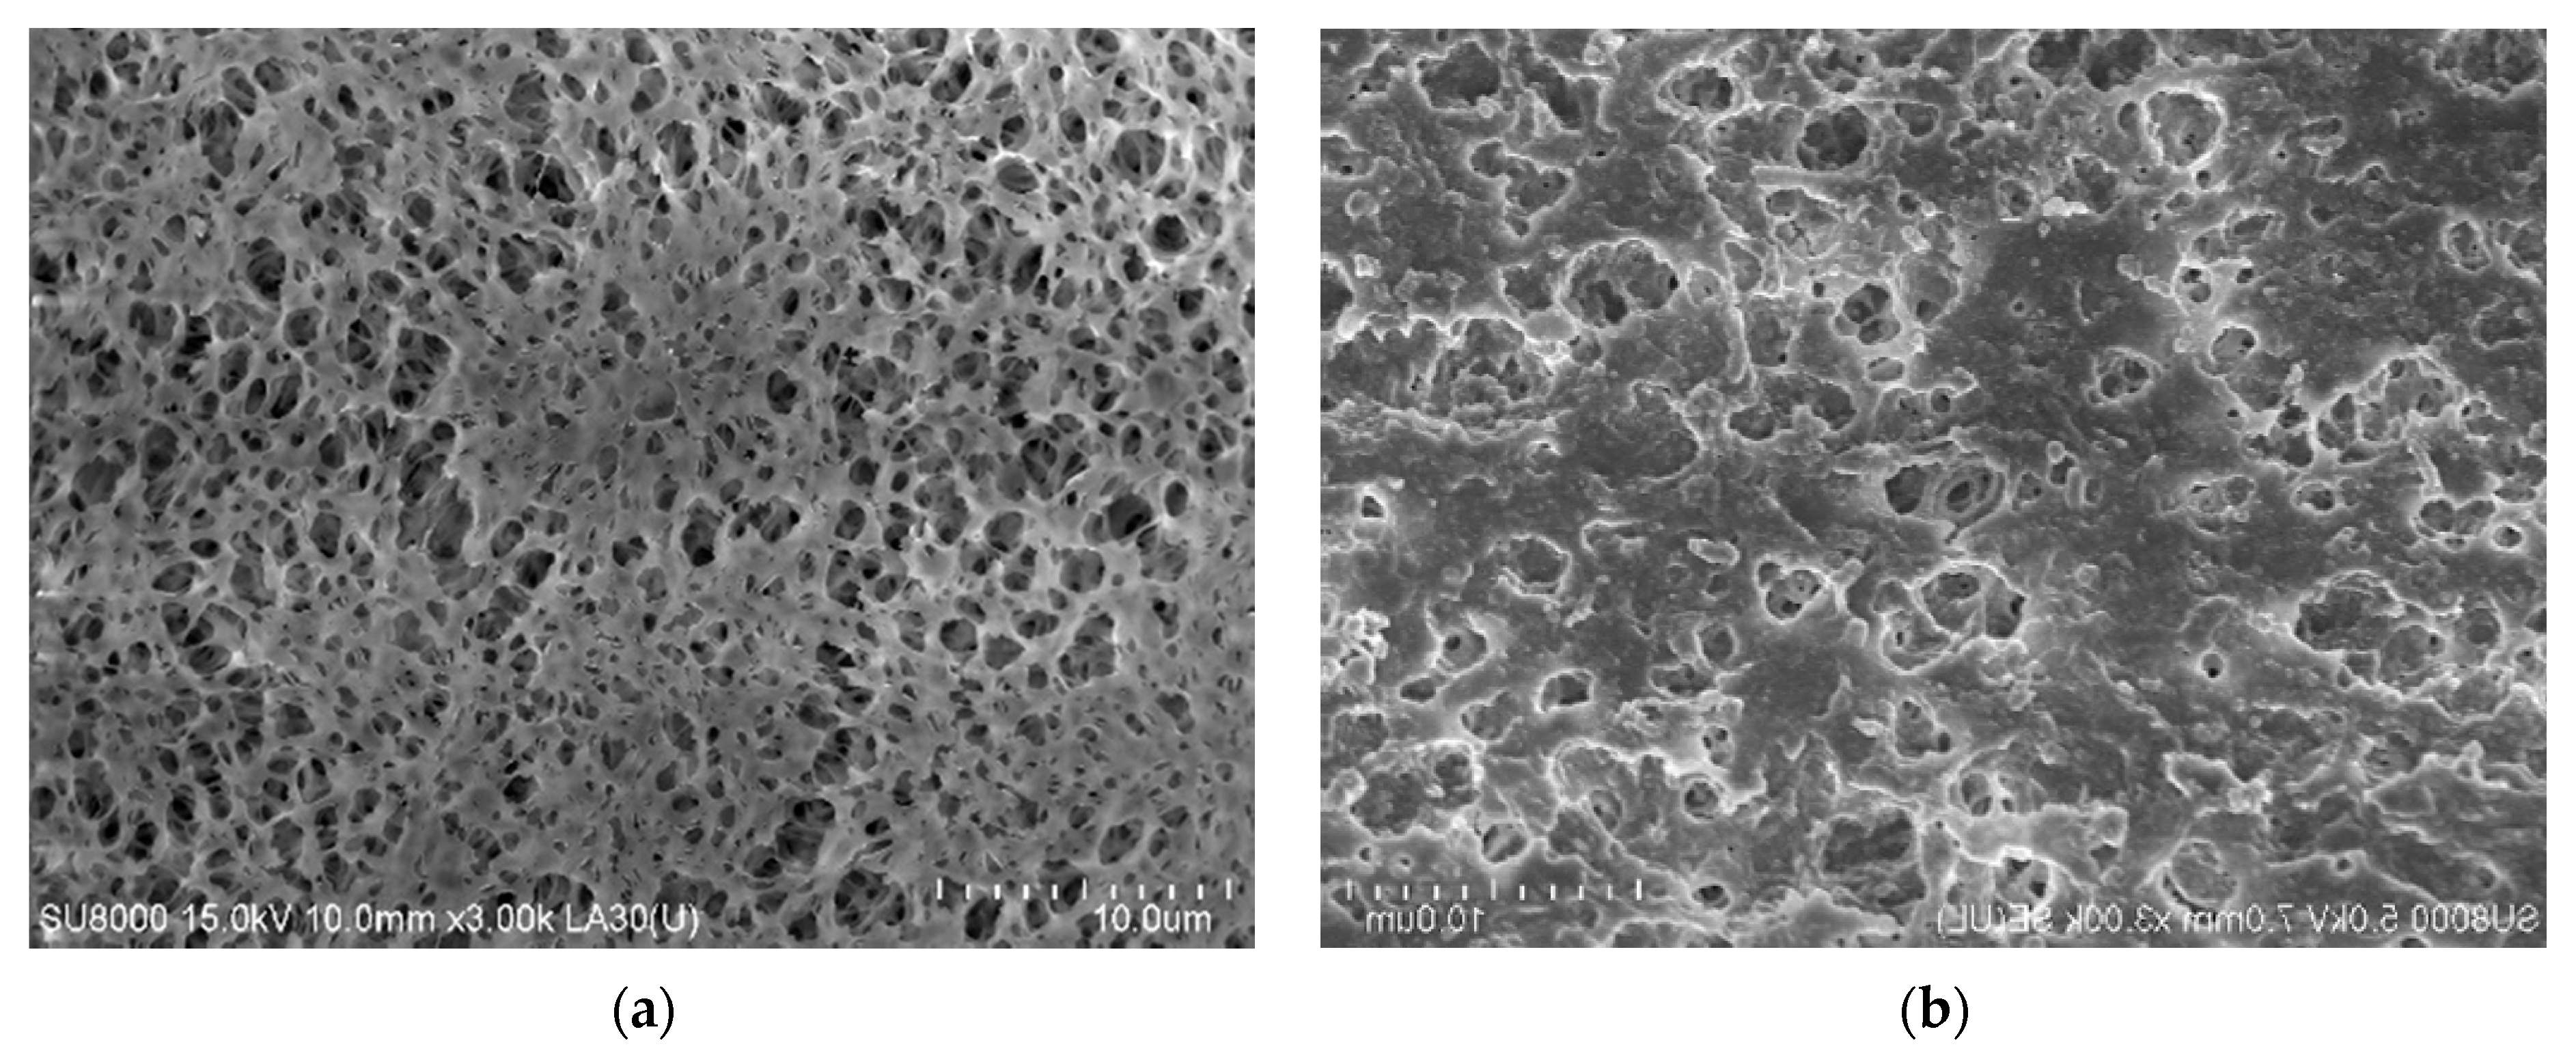
It was found that, although the presented cleaning procedure of the MF module allowed a recovery of its performance at a level of 500–600 L/m2h, some foulants were probably not removed from the membranes. The SEM examinations performed with membrane samples collected from the MF module confirmed this conclusion. Obtained images of the membrane surface were definitely different from the image of the fresh membrane (Figure 23). After the MF process, a thin layer of deposit covered the membrane surface, and this layer covered a significant fraction of the surface pores. However, in the deposit layer, numerous fractures and large holes occurred; thus, a high permeate flux was still obtained in the MF studies. The SEM–EDS analysis of the surface composition revealed, that, in addition to the dominating carbon (96.8 atom%) on the surface, S (0.4%), Si (0.8%), Al. (0.2%), and P (0.1%) were detected.
4. Conclusions
To the best of our knowledge, the present study is a pioneering work that highlights the efficiency of capillary PP microfiltration membranes in the treatment of real oily wastewaters. Through detailed studies, we showed that the used membranes ensured a high-quality permeate. The obtained permeate was characterized by an oil concentration in the range from 7 mg/L to 15 mg/L, which is in the line with the requirements of the MARPOL Convention. Moreover, a complete elimination of suspended solids present in the real oily wastewaters was reported. Indeed, the noted permeate turbidity was equal to about 0.4 NTU. In addition, it was demonstrated that the used PP membranes also showed excellent separation properties in the long-term oily wastewater treatment process.
However, as expected, the significant decrease in the permeate flux was observed. It was shown that increasing the operational temperature from 25 °C to 50 °C allowed a slight increase in membrane performance in the initial stage of the process. Applying Hermia’s models to the experimentally obtained data allowed indicating that cake formation was the prominent mechanism of flux decline for both synthetic and real feeds.
Moreover, the present work demonstrated efficient methods of module cleaning that can be successfully applied in the industry. Collectively, our work is a clear improvement of the current research on the treatments of real oily wastewaters. The results obtained, so far, are very encouraging and indicate the possibility of using the polypropylene MF membranes on an industrial scale. Lastly, we recommend further studies on the impact of operational parameters, such as transmembrane pressure and feed flow rate, on the PP membrane performance and efficiency in the treatment of real oily wastewaters.
Author Contributions
Conceptualization, M.G. and W.T.; methodology, M.G.; formal analysis, M.G. and W.T.; investigation, M.G. and W.T.; resources, M.G.; data curation, M.G.; writing—original draft preparation, W.T.; writing—review and editing, M.G.; visualization, M.G. and W.T.; supervision, M.G.; project administration, M.G.; funding acquisition, M.G. All authors have read and agreed to the published version of the manuscript.
Funding
This research was funded by the National Science Center, Poland, grant number 2018/29/B/ST8/00942.
Institutional Review Board Statement
Not applicable.
Data Availability Statement
Not applicable.
Conflicts of Interest
The authors declare no conflict of interest.
Appendix A

Table A1.
Coefficients of determination (R2) for Hermia’s models.
| Feed | CF (mg/L) | TMP (MPa) | VF (m/s) | T (°C) | Complete Blocking | Standard Blocking | Intermediate Blocking | Cake Formation |
|---|---|---|---|---|---|---|---|---|
| Oil-in-water emulsion | 50 | 0.05 | 0.5 | 22 | 0.8599 | 0.9178 | 0.9574 | 0.9790 |
| 150 | 0.05 | 0.5 | 22 | 0.7453 | 0.8047 | 0.8351 | 0.9244 | |
| 90 | 0.05 | 0.5 | 25 | 0.8238 | 0.8741 | 0.9140 | 0.9622 | |
| 90 | 0.05 | 0.5 | 50 | 0.8339 | 0.8823 | 0.9216 | 0.9704 | |
| Oily wastewater #1 | 90 | 0.05 | 0.5 | 22 | 0.5965 | 0.7345 | 0.8321 | 0.9434 |
| Oily wastewater #2 | 8 | 0.05 | 0.5 | 22 | 0.6611 | 0.6910 | 0.7023 | 0.8646 |
| Oily wastewater #3 | 21 | 0.05 | 0.5 | 22 | 0.6460 | 0.7003 | 0.7509 | 0.8362 |
| Oily wastewater #4—Series 1 | 13.3 | 0.05 | 0.5 | 22 | 0.4840 | 0.5862 | 0.6676 | 0.7469 |
| Oily wastewater #4—Series 2 | 13.3 | 0.05 | 0.5 | 22 | 0.7301 | 0.7518 | 0.7696 | 0.8006 |
| Oily wastewater #4—Series 3 | 13.3 | 0.05 | 0.5 | 22 | 0.6147 | 0.7743 | 0.7795 | 0.8339 |
References
- McLaughlin, C.; Falatko, D.; Danesi, R.; Albert, R. Characterizing Shipboard Bilgewater Effluent before and after Treatment. Envrion. Sci. Pollut. Res. 2014, 21, 5637–5652. [Google Scholar] [CrossRef]
- Tiselius, P.; Magnusson, K. Toxicity of Treated Bilge Water: The Need for Revised Regulatory Control. Mar. Pollut. Bull. 2017, 114, 860–866. [Google Scholar] [CrossRef]
- Walker, T.R.; Adebambo, O.; Del Aguila Feijoo, M.C.; Elhaimer, E.; Hossain, T.; Edwards, S.J.; Morrison, C.E.; Romo, J.; Sharma, N.; Taylor, S.; et al. Environmental Effects of Marine Transportation. In World Seas: An Environmental Evaluation; Elsevier: Amsterdam, The Netherlands, 2019; pp. 505–530. ISBN 978-0-12-805052-1. [Google Scholar]
- Han, M.; Zhang, J.; Chu, W.; Chen, J.; Zhou, G. Research Progress and Prospects of Marine Oily Wastewater Treatment: A Review. Water 2019, 11, 2517. [Google Scholar] [CrossRef] [Green Version]
- Behroozi, A.H.; Ataabadi, M.R. Improvement in Microfiltration Process of Oily Wastewater: A Comprehensive Review over Two Decades. J. Environ. Chem. Eng. 2021, 9, 104981. [Google Scholar] [CrossRef]
- Available online: www.imo.org (accessed on 22 February 2021).
- Available online: www.ospar.org (accessed on 22 February 2021).
- Garmsiri, E.; Rasouli, Y.; Abbasi, M.; Izadpanah, A.A. Chemical Cleaning of Mullite Ceramic Microfiltration Membranes Which Are Fouled during Oily Wastewater Treatment. J. Water Process Eng. 2017, 19, 81–95. [Google Scholar] [CrossRef]
- Gornati, R.; Maisano, M.; Pirrone, C.; Cappello, T.; Rossi, F.; Borgese, M.; Giannetto, A.; Cappello, S.; Mancini, G.; Bernardini, G.; et al. Mesocosm System to Evaluate BF-MBR Efficacy in Mitigating Oily Wastewater Discharges: An Integrated Study on Mytilus Galloprovincialis. Mar. Biotechnol. 2019, 21, 773–790. [Google Scholar] [CrossRef]
- Tanudjaja, H.J.; Hejase, C.A.; Tarabara, V.V.; Fane, A.G.; Chew, J.W. Membrane-Based Separation for Oily Wastewater: A Practical Perspective. Water Res. 2019, 156, 347–365. [Google Scholar] [CrossRef] [PubMed]
- Ebrahimi, M.; Ashaghi, K.S.; Engel, L.; Willershausen, D.; Mund, P.; Bolduan, P.; Czermak, P. Characterization and Application of Different Ceramic Membranes for the Oil-Field Produced Water Treatment. Desalination 2009, 245, 533–540. [Google Scholar] [CrossRef]
- Mueller, J. Crossflow Microfiltration of Oily Water. J. Membr. Sci. 1997, 129, 221–235. [Google Scholar] [CrossRef]
- Padaki, M.; Surya Murali, R.; Abdullah, M.S.; Misdan, N.; Moslehyani, A.; Kassim, M.A.; Hilal, N.; Ismail, A.F. Membrane Technology Enhancement in Oil–Water Separation. A Review. Desalination 2015, 357, 197–207. [Google Scholar] [CrossRef]
- Chakrabarty, B.; Ghoshal, A.K.; Purkait, M.K. Ultrafiltration of Stable Oil-in-Water Emulsion by Polysulfone Membrane. J. Membr. Sci. 2008, 325, 427–437. [Google Scholar] [CrossRef]
- Chakrabarty, B.; Ghoshal, A.K.; Purkait, M.K. Cross-Flow Ultrafiltration of Stable Oil-in-Water Emulsion Using Polysulfone Membranes. Chem. Eng. J. 2010, 165, 447–456. [Google Scholar] [CrossRef]
- Kalla, S. Use of Membrane Distillation for Oily Wastewater Treatment—A Review. J. Environ. Chem. Eng. 2021, 9, 104641. [Google Scholar] [CrossRef]
- Sun, C.; Leiknes, T.; Weitzenböck, J.; Thorstensen, B. Development of an Integrated Shipboard Wastewater Treatment System Using Biofilm-MBR. Sep. Purif. Technol. 2010, 75, 22–31. [Google Scholar] [CrossRef]
- Otitoju, T.A.; Ahmad, A.L.; Ooi, B.S. Polyvinylidene Fluoride (PVDF) Membrane for Oil Rejection from Oily Wastewater: A Performance Review. J. Water Process Eng. 2016, 14, 41–59. [Google Scholar] [CrossRef]
- Bolto, B.; Zhang, J.; Wu, X.; Xie, Z. A Review on Current Development of Membranes for Oil Removal from Wastewaters. Membranes 2020, 10, 65. [Google Scholar] [CrossRef] [PubMed] [Green Version]
- Masoudnia, K.; Raisi, A.; Aroujalian, A.; Fathizadeh, M. Treatment of Oily Wastewaters Using the Microfiltration Process: Effect of Operating Parameters and Membrane Fouling Study. Sep. Sci. Technol. 2013, 48, 1544–1555. [Google Scholar] [CrossRef]
- Shamaei, L.; Khorshidi, B.; Islam, M.A.; Sadrzadeh, M. Industrial Waste Lignin as an Antifouling Coating for the Treatment of Oily Wastewater: Creating Wealth from Waste. J. Clean. Prod. 2020, 256, 120304. [Google Scholar] [CrossRef]
- Cheryan, M.; Rajagopalan, N. Membrane Processing of Oily Streams. Wastewater Treatment and Waste Reduction. J. Membr. Sci. 1998, 151, 13–28. [Google Scholar] [CrossRef]
- Yan, L.; Hong, S.; Li, M.L.; Li, Y.S. Application of the Al2O3–PVDF Nanocomposite Tubular Ultrafiltration (UF) Membrane for Oily Wastewater Treatment and Its Antifouling Research. Sep. Purif. Technol. 2009, 66, 347–352. [Google Scholar] [CrossRef]
- Kong, J.; Li, K. Oil Removal from Oil-in-Water Emulsions Using PVDF Membranes. Sep. Purif. Technol. 1999, 16, 83–93. [Google Scholar] [CrossRef]
- Barambu, N.U.; Bilad, M.R.; Bustam, M.A.; Kurnia, K.A.; Othman, M.H.D.; Nordin, N.A.H.M. Development of Membrane Material for Oily Wastewater Treatment: A Review. Ain Shams Eng. J. 2020, S2090447920302355. [Google Scholar] [CrossRef]
- Obotey Ezugbe, E.; Rathilal, S. Membrane Technologies in Wastewater Treatment: A Review. Membranes 2020, 10, 89. [Google Scholar] [CrossRef] [PubMed]
- Yalcinkaya, F.; Boyraz, E.; Maryska, J.; Kucerova, K. A Review on Membrane Technology and Chemical Surface Modification for the Oily Wastewater Treatment. Materials 2020, 13, 493. [Google Scholar] [CrossRef] [Green Version]
- Huang, S.; Ras, R.H.A.; Tian, X. Antifouling Membranes for Oily Wastewater Treatment: Interplay between Wetting and Membrane Fouling. Curr. Opin. Colloid Interface Sci. 2018, 36, 90–109. [Google Scholar] [CrossRef] [Green Version]
- Anis, S.F.; Hashaikeh, R.; Hilal, N. Microfiltration Membrane Processes: A Review of Research Trends over the Past Decade. J. Water Process Eng. 2019, 32, 100941. [Google Scholar] [CrossRef]
- Tummons, E.; Han, Q.; Tanudjaja, H.J.; Hejase, C.A.; Chew, J.W.; Tarabara, V.V. Membrane Fouling by Emulsified Oil: A Review. Sep. Purif. Technol. 2020, 248, 116919. [Google Scholar] [CrossRef]
- Abadi, S.R.H.; Sebzari, M.R.; Hemati, M.; Rekabdar, F.; Mohammadi, T. Ceramic Membrane Performance in Microfiltration of Oily Wastewater. Desalination 2011, 265, 222–228. [Google Scholar] [CrossRef]
- Aloulou, H.; Aloulou, W.; Daramola, M.O.; Ben Amar, R. Silane-Grafted Sand Membrane for the Treatment of Oily Wastewater via Air Gap Membrane Distillation: Study of the Efficiency in Comparison with Microfiltration and Ultrafiltration Ceramic Membranes. Mater. Chem. Phys. 2021, 261, 124186. [Google Scholar] [CrossRef]
- Abbasi, M.; Reza Sebzari, M.; Mohammadi, T. Enhancement of Oily Wastewater Treatment by Ceramic Microfiltration Membranes Using Powder Activated Carbon. Chem. Eng. Technol. 2011, 34, 1252–1258. [Google Scholar] [CrossRef]
- Abbasi, M.; Mirfendereski, M.; Nikbakht, M.; Golshenas, M.; Mohammadi, T. Performance Study of Mullite and Mullite–Alumina Ceramic MF Membranes for Oily Wastewaters Treatment. Desalination 2010, 259, 169–178. [Google Scholar] [CrossRef]
- Abdalla, M.; Nasser, M.; Kayvani Fard, A.; Qiblawey, H.; Benamor, A.; Judd, S. Impact of Combined Oil-in-Water Emulsions and Particulate Suspensions on Ceramic Membrane Fouling and Permeability Recovery. Sep. Purif. Technol. 2019, 212, 215–222. [Google Scholar] [CrossRef] [Green Version]
- Hua, F.L.; Tsang, Y.F.; Wang, Y.J.; Chan, S.Y.; Chua, H.; Sin, S.N. Performance Study of Ceramic Microfiltration Membrane for Oily Wastewater Treatment. Chem. Eng. J. 2007, 128, 169–175. [Google Scholar] [CrossRef]
- Jafari, B.; Abbasi, M.; Hashemifard, S.A. Development of New Tubular Ceramic Microfiltration Membranes by Employing Activated Carbon in the Structure of Membranes for Treatment of Oily Wastewater. J. Clean. Prod. 2020, 244, 118720. [Google Scholar] [CrossRef]
- Vinoth Kumar, R.; Kumar Ghoshal, A.; Pugazhenthi, G. Elaboration of Novel Tubular Ceramic Membrane from Inexpensive Raw Materials by Extrusion Method and Its Performance in Microfiltration of Synthetic Oily Wastewater Treatment. J. Membr. Sci. 2015, 490, 92–102. [Google Scholar] [CrossRef]
- Nandi, B.K.; Uppaluri, R.; Purkait, M.K. Treatment of Oily Waste Water Using Low-Cost Ceramic Membrane: Flux Decline Mechanism and Economic Feasibility. Sep. Sci. Technol. 2009, 44, 2840–2869. [Google Scholar] [CrossRef]
- Nandi, B.K.; Moparthi, A.; Uppaluri, R.; Purkait, M.K. Treatment of Oily Wastewater Using Low Cost Ceramic Membrane: Comparative Assessment of Pore Blocking and Artificial Neural Network Models. Chem. Eng. Res. Des. 2010, 88, 881–892. [Google Scholar] [CrossRef]
- Rasouli, Y.; Abbasi, M.; Hashemifard, S.A. Fabrication, Characterization, Fouling Behavior and Performance Study of Ceramic Microfiltration Membranes for Oily Wastewater Treatment. J. Asian Ceram. Soc. 2019, 7, 476–495. [Google Scholar] [CrossRef]
- Zhang, Q.; Fan, Y.; Xu, N. Effect of the Surface Properties on Filtration Performance of Al2O3–TiO2 Composite Membrane. Sep. Purif. Technol. 2009, 66, 306–312. [Google Scholar] [CrossRef]
- Zhong, J.; Sun, X.; Wang, C. Treatment of Oily Wastewater Produced from Refinery Processes Using Flocculation and Ceramic Membrane Filtration. Sep. Purif. Technol. 2003, 32, 93–98. [Google Scholar] [CrossRef]
- Abbasi, M.; Sebzari, M.R.; Salahi, A.; Mirza, B. Modeling of Membrane Fouling and Flux Decline in Microfiltration of Oily Wastewater Using Ceramic Membranes. Chem. Eng. Commun. 2012, 199, 78–93. [Google Scholar] [CrossRef]
- Yu, X.; Zhong, Z.; Xing, W. Treatment of Vegetable Oily Wastewater Using an Integrated Microfiltration–Reverse Osmosis System. Water Sci. Technol. 2010, 61, 455–462. [Google Scholar] [CrossRef]
- Chang, Q.; Zhou, J.; Wang, Y.; Liang, J.; Zhang, X.; Cerneaux, S.; Wang, X.; Zhu, Z.; Dong, Y. Application of Ceramic Microfiltration Membrane Modified by Nano-TiO2 Coating in Separation of a Stable Oil-in-Water Emulsion. J. Membr. Sci. 2014, 456, 128–133. [Google Scholar] [CrossRef]
- Lee, S.-H.; Chung, K.-C.; Shin, M.-C.; Dong, J.-I.; Lee, H.-S.; Auh, K.H. Preparation of Ceramic Membrane and Application to the Crossflow Microfiltration of Soluble Waste Oil. Mater. Lett. 2002, 52, 266–271. [Google Scholar] [CrossRef]
- Tummons, E.N.; Tarabara, V.V.; Chew, J.W.; Fane, A.G. Behavior of Oil Droplets at the Membrane Surface during Crossflow Microfiltration of Oil–Water Emulsions. J. Membr. Sci. 2016, 500, 211–224. [Google Scholar] [CrossRef]
- Li, L.; Ding, L.; Tu, Z.; Wan, Y.; Clausse, D.; Lanoisellé, J.-L. Recovery of Linseed Oil Dispersed within an Oil-in-Water Emulsion Using Hydrophilic Membrane by Rotating Disk Filtration System. J. Membr. Sci. 2009, 342, 70–79. [Google Scholar] [CrossRef]
- Wang, Y.; Chen, X.; Zhang, J.; Yin, J.; Wang, H. Investigation of Microfiltration for Treatment of Emulsified Oily Wastewater from the Processing of Petroleum Products. Desalination 2009, 249, 1223–1227. [Google Scholar] [CrossRef]
- Hu, B.; Scott, K. Microfiltration of Water in Oil Emulsions and Evaluation of Fouling Mechanism. Chem. Eng. J. 2008, 136, 210–220. [Google Scholar] [CrossRef]
- Salahi, A.; Gheshlaghi, A.; Mohammadi, T.; Madaeni, S.S. Experimental Performance Evaluation of Polymeric Membranes for Treatment of an Industrial Oily Wastewater. Desalination 2010, 262, 235–242. [Google Scholar] [CrossRef]
- Madaeni, S.S.; Gheshlaghi, A.; Rekabdar, F. Membrane Treatment of Oily Wastewater from Refinery Processes: Membrane Treatment of Oily Wastewater. Asia-Pac. J. Chem. Eng. 2013, 8, 45–53. [Google Scholar] [CrossRef]
- Daiminger, U.; Nitsch, W.; Plucinski, P.; Hoffmann, S. Novel Techniques for Oil/Water Separation. J. Membr. Sci. 1995, 7, 197–203. [Google Scholar] [CrossRef]
- Gorouhi, E.; Sadrzadeh, M.; Mohammadi, T. Microfiltration of Oily Wastewater Using PP Hydrophobic Membrane. Desalination 2006, 200, 319–321. [Google Scholar] [CrossRef]
- Vatai, G.N.; Krstic, D.M.; Koris, A.K.; Gáspár, I.L.; Tekic, M.N. Ultrafiltration of Oil-in-Water Emulsion: Comparison of Ceramic and Polymeric Membranes. Desalination Water Treat. 2009, 3, 162–168. [Google Scholar] [CrossRef]
- Bayat, A.; Mahdavi, H.R.; Kazemimoghaddam, M.; Mohammadi, T. Preparation and Characterization of γ-Alumina Ceramic Ultrafiltration Membranes for Pretreatment of Oily Wastewater. Desalination Water Treat. 2016, 57, 24322–24332. [Google Scholar] [CrossRef]
- Yang, C.; Zhang, G.; Xu, N.; Shi, J. Preparation and Application in Oil±water Separation of ZrO2/—-Al2O3 MF Membrane. J. Membr. Sci. 1998, 235–243. [Google Scholar] [CrossRef]
- Song, Q.; Qiu, L.; Qiu, Q.; Cheng, R. Development and Application of Ceramic Membrane in Oily Wastewater Treatment. In Proceedings of the 2017 6th International Conference on Energy and Environmental Protection (ICEEP 2017), Zhuhai, China, 29–30 June 2017; Atlantis Press: Zhuhai, China, 2017. [Google Scholar]
- Lobo, A.; Cambiella, Á.; Benito, J.M.; Pazos, C.; Coca, J. Ultrafiltration of Oil-in-Water Emulsions with Ceramic Membranes: Influence of PH and Crossflow Velocity. J. Membr. Sci. 2006, 278, 328–334. [Google Scholar] [CrossRef]
- Ismail, N.H.; Salleh, W.N.W.; Ismail, A.F.; Hasbullah, H.; Yusof, N.; Aziz, F.; Jaafar, J. Hydrophilic Polymer-Based Membrane for Oily Wastewater Treatment: A Review. Sep. Purif. Technol. 2020, 233, 116007. [Google Scholar] [CrossRef]
- Kaur, H.; Bulasara, V.K.; Gupta, R.K. Effect of Carbonates Composition on the Permeation Characteristics of Low-Cost Ceramic Membrane Supports. J. Ind. Eng. Chem. 2016, 44, 185–194. [Google Scholar] [CrossRef]
- Tabatabaei, S.; Carreau, P.; Ajji, A. Microporous Membranes Obtained from Polypropylene Blend Films by Stretching. J. Membr. Sci. 2008, 325, 772–782. [Google Scholar] [CrossRef]
- Himma, N.F.; Anisah, S.; Prasetya, N.; Wenten, I.G. Advances in Preparation, Modification, and Application of Polypropylene Membrane. J. Polym. Eng. 2016, 36, 329–362. [Google Scholar] [CrossRef]
- Li, P.; Zhang, M.; Zhai, Z.; Wang, M.; Li, P.; Hou, Y.; Jason Niu, Q. Precise Assembly of a Zeolite Imidazolate Framework on Polypropylene Support for the Fabrication of Thin Film Nanocomposite Reverse Osmosis Membrane. J. Membr. Sci. 2020, 612, 118412. [Google Scholar] [CrossRef]
- Li, R.; Liu, J.; Shi, A.; Luo, X.; Lin, J.; Zheng, R.; Fan, H.; Selasie, S.V.; Lin, H. A Facile Method to Modify Polypropylene Membrane by Polydopamine Coating via Inkjet Printing Technique for Superior Performance. J. Colloid Interface Sci. 2019, 552, 719–727. [Google Scholar] [CrossRef] [PubMed]
- Ariono, D.; Wardani, A.K. Modification and Applications of Hydrophilic Polypropylene Membrane. IOP Conf. Ser. Mater. Sci. Eng. 2017, 214, 012014. [Google Scholar] [CrossRef] [Green Version]
- Himma, N.F.; Wardani, A.K.; Wenten, I.G. Preparation of Superhydrophobic Polypropylene Membrane Using Dip-Coating Method: The Effects of Solution and Process Parameters. Polym. Plast. Technol. Eng. 2017, 56, 184–194. [Google Scholar] [CrossRef]
- García-Payo, M.C.; Izquierdo-Gil, M.A.; Fernández-Pineda, C. Wetting Study of Hydrophobic Membranes via Liquid Entry Pressure Measurements with Aqueous Alcohol Solutions. J. Colloid Interface Sci. 2000, 230, 420–431. [Google Scholar] [CrossRef]
- Tomczak, W.; Gryta, M. Application of Ultrafiltration Ceramic Membrane for Separation of Oily Wastewater Generated by Maritime Transportation. Sep. Purif. Technol. 2021, 261, 118259. [Google Scholar] [CrossRef]
- Salahi, A.; Abbasi, M.; Mohammadi, T. Permeate Flux Decline during UF of Oily Wastewater: Experimental and Modeling. Desalination 2010, 251, 153–160. [Google Scholar] [CrossRef]
- Noshadi, I.; Salahi, A.; Hemmati, M.; Rekabdar, F.; Mohammadi, T. Experimental and ANFIS Modeling for Fouling Analysis of Oily Wastewater Treatment Using Ultrafiltration: Membrane Fouling. Asia-Pac. J. Chem. Eng. 2013, 8, 527–538. [Google Scholar] [CrossRef]
- Poyai, T.; Khiewpuckdee, P.; Wongrueng, A.; Painmanakul, P.; Chawaloesphonsiya, N. Enhancement of Crossflow Ultrafiltration for the Treatment of Stabilized Oily Emulsions. Eng. J. 2019, 23, 15–27. [Google Scholar] [CrossRef]
- Rajasekhar, T.; Trinadh, M.; Veera Babu, P.; Sainath, A.V.S.; Reddy, A.V.R. Oil–Water Emulsion Separation Using Ultrafiltration Membranes Based on Novel Blends of Poly(Vinylidene Fluoride) and Amphiphilic Tri-Block Copolymer Containing Carboxylic Acid Functional Group. J. Membr. Sci. 2015, 481, 82–93. [Google Scholar] [CrossRef]
- Shi, L.; Lei, Y.; Huang, J.; Shi, Y.; Yi, K.; Zhou, H. Ultrafiltration of Oil-in-Water Emulsions Using Ceramic Membrane: Roles Played by Stabilized Surfactants. Colloids Surf. A Physicochem. Eng. Asp. 2019, 583, 123948. [Google Scholar] [CrossRef]
- Yi, X.S.; Yu, S.L.; Shi, W.X.; Wang, S.; Jin, L.M.; Sun, N.; Ma, C.; Sun, L.P. Separation of Oil/Water Emulsion Using Nano-Particle (TiO2/Al2O3) Modified PVDF Ultrafiltration Membranes and Evaluation of Fouling Mechanism. Water Sci. Technol. 2013, 67, 477–484. [Google Scholar] [CrossRef]
- Hermia, J. Constant Pressure Blocking Filtration Laws-Application to Power-Law Non-Newtonian Fluids. Trans. Inst. Chem. Eng. 1982, 60, 183–187. [Google Scholar]
- Li, C.; Song, C.; Tao, P.; Sun, M.; Pan, Z.; Wang, T.; Shao, M. Enhanced Separation Performance of Coal-Based Carbon Membranes Coupled with an Electric Field for Oily Wastewater Treatment. Sep. Purif. Technol. 2016, 168, 47–56. [Google Scholar] [CrossRef]
- Gryta, M.; Waszak, M.; Tomaszewska, M. Studies of Polypropylene Membrane Fouling during Microfiltration of Broth with Citrobacter Freundii Bacteria. Pol. J. Chem. Technol. 2015, 17, 56–64. [Google Scholar] [CrossRef] [Green Version]
- Gryta, M.; Tomczak, W. Microfiltration of Post-Fermentation Broth with Backflushing Membrane Cleaning. Chem. Pap. 2015, 69. [Google Scholar] [CrossRef]
Figure 1.
MF process experimental setup; 1—submerged MF module, 2—permeate tank, 3—feed tank with temperature regulator, 4—peristaltic pump, 5—balance, 6—valve (pressure regulator), M—manometer, T—thermometer.
Figure 1.
MF process experimental setup; 1—submerged MF module, 2—permeate tank, 3—feed tank with temperature regulator, 4—peristaltic pump, 5—balance, 6—valve (pressure regulator), M—manometer, T—thermometer.

Figure 2.
Schematic representation of blocking mechanisms: (a) cake formation; (b) intermediate blocking; (c) standard blocking; (d) complete blocking.
Figure 2.
Schematic representation of blocking mechanisms: (a) cake formation; (b) intermediate blocking; (c) standard blocking; (d) complete blocking.

Figure 3.
SEM images of membranes: (a) surface; (b) wall cross-sections. Magnification ×10,000.

Figure 4.
Mercury intrusion porosimetry.

Figure 5.
Effect of oil concentration on the permeate flux during MF of model oily emulsions. Module MF1, VF = 0.5 m/s, TMP = 0.05 MPa, T = 22 °C.
Figure 5.
Effect of oil concentration on the permeate flux during MF of model oily emulsions. Module MF1, VF = 0.5 m/s, TMP = 0.05 MPa, T = 22 °C.

Figure 6.
Changes in the oil concentration in permeate during MF of model oily emulsions. Module MF1, VF = 0.5 m/s, TMP = 0.05 MPa, T = 22 °C.
Figure 6.
Changes in the oil concentration in permeate during MF of model oily emulsions. Module MF1, VF = 0.5 m/s, TMP = 0.05 MPa, T = 22 °C.

Figure 7.
Droplet size distribution of the permeate obtained in MF of the model emulsion (CF = 150 mg/L). Module MF1, VF = 0.5 m/s, TMP = 0.05 MPa, T = 22 °C.
Figure 7.
Droplet size distribution of the permeate obtained in MF of the model emulsion (CF = 150 mg/L). Module MF1, VF = 0.5 m/s, TMP = 0.05 MPa, T = 22 °C.

Figure 8.
Changes in the droplet size distribution of the model emulsions during the MF process: (a) CF = 50 mg/L; (b) CF = 150 mg/L.
Figure 8.
Changes in the droplet size distribution of the model emulsions during the MF process: (a) CF = 50 mg/L; (b) CF = 150 mg/L.

Figure 9.
Variations in permeate flux during membrane cleaning after MF of model emulsion (CF = 150 mg/L, T = 25 °C).
Figure 9.
Variations in permeate flux during membrane cleaning after MF of model emulsion (CF = 150 mg/L, T = 25 °C).

Figure 10.
Effect of temperature on the relative permeate flux during MF of model emulsion (CF = 90 mg/L). Module MF1, VF = 0.5 m/s, TMP = 0.05 MPa.
Figure 10.
Effect of temperature on the relative permeate flux during MF of model emulsion (CF = 90 mg/L). Module MF1, VF = 0.5 m/s, TMP = 0.05 MPa.

Figure 11.
Variations in permeate flux during membrane cleaning after MF of model oily wastewater (CF = 90 mg/L, T = 50 °C).
Figure 11.
Variations in permeate flux during membrane cleaning after MF of model oily wastewater (CF = 90 mg/L, T = 50 °C).

Figure 12.
Variations in permeate flux and oil concentration in the feed during MF of oily wastewater #1. Module MF1, TMP = 0.05 MPa, T = 22 °C, vF = 0.5 m/s.
Figure 12.
Variations in permeate flux and oil concentration in the feed during MF of oily wastewater #1. Module MF1, TMP = 0.05 MPa, T = 22 °C, vF = 0.5 m/s.

Figure 13.
Changes in the feed and permeate turbidity, as well as permeate oil concentration, during the MF process of oily wastewater #1. Module MF1, TMP = 0.05 MPa, T = 22 °C, VF = 0.5 m/s.
Figure 13.
Changes in the feed and permeate turbidity, as well as permeate oil concentration, during the MF process of oily wastewater #1. Module MF1, TMP = 0.05 MPa, T = 22 °C, VF = 0.5 m/s.

Figure 14.
Changes in the droplet size distribution in real oily wastewater #1 during the MF process. Module MF1, TMP = 0.05 MPa, T = 22 °C, VF = 0.5 m/s.
Figure 14.
Changes in the droplet size distribution in real oily wastewater #1 during the MF process. Module MF1, TMP = 0.05 MPa, T = 22 °C, VF = 0.5 m/s.

Figure 15.
Changes in the droplet size distribution in the permeate obtained in the MF process of real oily wastewater #1. Module MF1, TMP = 0.05 MPa, T = 22 °C, VF = 0.5 m/s.
Figure 15.
Changes in the droplet size distribution in the permeate obtained in the MF process of real oily wastewater #1. Module MF1, TMP = 0.05 MPa, T = 22 °C, VF = 0.5 m/s.

Figure 16.
Variations in permeate flux during membrane cleaning after MF of oily wastewater #1.

Figure 17.
Changes in permeate flux and water recovery coefficient during MF of real wastewaters #2 and #3. Module MF2, TMP = 0.05 MPa, vF = 0.5 m/s, T = 22 °C.
Figure 17.
Changes in permeate flux and water recovery coefficient during MF of real wastewaters #2 and #3. Module MF2, TMP = 0.05 MPa, vF = 0.5 m/s, T = 22 °C.

Figure 18.
Changes in feed and permeate turbidity during MF of real oily wastewater #2 (Figure 17, series S1). Module MF2, TMP = 0.05 MPa, VF = 0.5 m/s, T = 22 °C.
Figure 18.
Changes in feed and permeate turbidity during MF of real oily wastewater #2 (Figure 17, series S1). Module MF2, TMP = 0.05 MPa, VF = 0.5 m/s, T = 22 °C.

Figure 19.
Variations in permeate flux during membrane cleaning after MF of oily wastewater #2.

Figure 20.
Changes in permeate flux and water recovery coefficient during long-term MF of oily wastewater #4. Module M2, TMP = 0.05 MPa, VF = 0.5 m/s, T = 22 °C.
Figure 20.
Changes in permeate flux and water recovery coefficient during long-term MF of oily wastewater #4. Module M2, TMP = 0.05 MPa, VF = 0.5 m/s, T = 22 °C.

Figure 21.
Variations in permeate flux during membrane cleaning with P3 Ultrasil 11 solution (1.5 g/L) after MF of oily wastewater #4.
Figure 21.
Variations in permeate flux during membrane cleaning with P3 Ultrasil 11 solution (1.5 g/L) after MF of oily wastewater #4.

Figure 22.
Variations in permeate flux during membrane cleaning after MF of oily wastewater #4.

Figure 23.
SEM images of Accurel PP S6/2 membrane: (a) internal surface of new membrane; (b) internal surface with deposit.
Figure 23.
SEM images of Accurel PP S6/2 membrane: (a) internal surface of new membrane; (b) internal surface with deposit.

Table 1.
Characteristics of real oily wastewaters.
| Oily Wastewater | TDS (g/L) | Conductivity (mS/cm) | pH | NTU | NTU 5d 1 | Oil (mg/L) |
|---|---|---|---|---|---|---|
| #1 | 3208 | 6.08 | 7.73 | 132.0 | 53.8 | 90.0 |
| #2 | 6647 | 11.82 | 7.40 | 354.0 | 56.3 | 8.0 |
| #3 | 6612 | 11.60 | 7.10 | 585.0 | 87.3 | 21.0 |
| #4 | 4782 | 12.30 | 8.20 | 25.2 | 12.6 | 13.3 |
1 NTU after 5 days of sedimentation.
Table 2.
Procedure of membrane wetting.
| Stage | Medium | t (h) | TMP (MPa) | J * (L/m2h) |
|---|---|---|---|---|
| 1 | isopropanol | 0.5 | 0.05 | 1500 |
| 2 | water | 1.0 | 0.08 | 1200 |
| 3 | isopropanol | 0.5 | 0.05 | 1420 |
| 4 | water (membrane soaked) | 22.0 | 0 | 460 |
| 5 | NaClO | 0.1 | 0.05 | 580 |
| 6 | water | 6.0 | 0.08 | 470 |
| 7 | water (membrane soaked) | 20.0 | 0 | 380 |
| 8 | NaClO | 0.1 | 0.05 | 590 |
* Permeate flux noted for the module MF1: distilled water (feed), TMP = 0.05 MPa.
Publisher’s Note: MDPI stays neutral with regard to jurisdictional claims in published maps and institutional affiliations. |
© 2021 by the authors. Licensee MDPI, Basel, Switzerland. This article is an open access article distributed under the terms and conditions of the Creative Commons Attribution (CC BY) license (https://creativecommons.org/licenses/by/4.0/).
Share and Cite
MDPI and ACS Style
Tomczak, W.; Gryta, M. Application of Capillary Polypropylene Membranes for Microfiltration of Oily Wastewaters: Experiments and Modeling. Fibers 2021, 9, 35. https://0-doi-org.brum.beds.ac.uk/10.3390/fib9060035
AMA Style
Tomczak W, Gryta M. Application of Capillary Polypropylene Membranes for Microfiltration of Oily Wastewaters: Experiments and Modeling. Fibers. 2021; 9(6):35. https://0-doi-org.brum.beds.ac.uk/10.3390/fib9060035
Chicago/Turabian StyleTomczak, Wirginia, and Marek Gryta. 2021. "Application of Capillary Polypropylene Membranes for Microfiltration of Oily Wastewaters: Experiments and Modeling" Fibers 9, no. 6: 35. https://0-doi-org.brum.beds.ac.uk/10.3390/fib9060035
Note that from the first issue of 2016, this journal uses article numbers instead of page numbers. See further details here.