Article

Seismic Performance of RC Beam–Column Joints Designed According to Older and Modern Codes: An Attempt to Reduce Conventional Reinforcement Using Steel Fiber Reinforced Concrete

by
Alexander-Dimitrios Tsonos
,
George Kalogeropoulos
*,
Pantelis Iakovidis
,
Marios-Zois Bezas
and
Michail Koumtzis
Department of Civil Engineering, Aristotle University of Thessaloniki, GR-54-124 Thessaloniki, Greece
*
Author to whom correspondence should be addressed.
Submission received: 8 May 2021 / Revised: 1 June 2021 / Accepted: 30 June 2021 / Published: 5 July 2021

Abstract

:
An analytical and experimental investigation was conducted herein to examine the cyclic load behavior of beam–column joint subassemblages, typical of both the modern reinforced concrete (RC) structures and of the pre-1960s–1970s existing ones. Seven exterior RC beam–column joint subassemblages were constructed and subjected to earthquake-type loading. Three specimens were designed according to the requirements of the Eurocode (EC) for ductility class medium (DCM), while the other three specimens possessed poor seismic details, conforming to past building codes. The hysteresis behavior of the subassemblages was evaluated. An analytical model was used to calculate the ultimate shear capacity of the beam–column joint area, while also predicting accurately the failure mode of the specimens. It was clearly demonstrated experimentally and analytically that it is possible for excessive seismic damage of the beam–column joint region to occur when designing according to the current European building codes. In addition, the proposed analytical model was found to be very satisfactory in accurately predicting seismic behavior and in preventing the premature brittle shear failure of the joints. The seventh subassemblage, constructed with steel fiber RC and significantly less transverse reinforcement than that required according to the EC, exhibited satisfactory ductile seismic performance, demonstrating the effectiveness of the proposed design solution.

1. Introduction

Catastrophic collapses of RC structures during strong earthquakes of the last sixty years worldwide indicated that the design of beam–column connections for them to remain elastic throughout seismic excitation is the sine qua nonfactor for ensuring the preservation of structural integrity of ductile moment-resisting frames. In the case of existing RC structures before 1960s–1970s, however, the brittle and premature failure of beam–column joints was particularly common, owing to a plethora of structural deficiencies. These include, for instance, the quality of the materials, the use of plain steel reinforcement and concrete of low compression strength, poor reinforcement details, sparsely-spaced (or not existing) stirrups providing low confinement and/or shear strength, inadequate anchorages of reinforcement [1]. As a result, these structures are underperforming with respect to modern code requirements [2,3,4,5]. In particular, they exhibit rapid strength and stiffness degradation, poor deformability, and low energy dissipation capacity during cycling. Ultimately, the excessive damage of the joints may cause the collapse of the structures due to P-Δ effects or due to the formation of soft-story mechanism [6,7,8,9,10].
The devastating impact of joints’ failure in the hysteresis behavior of RC structures (particularly the framed ones) triggered the advancements in the seismic design of modern RC structures. As a result, in the middle of the 1960s–1970s period, the capacity design approach was introduced, which was based on the controllable and hierarchically developed damage control philosophy. Thus, the conception of modern codes for the design of beam–column connections of RC structures aims at designing the joints so that they could remain intact during cycling while the damage and the formation of the plastic hinges are expected to be developed in the adjacent beam. A review of experimental studies that were found in literature and that take into account the variation of beam–column joint configurations converged in different seismic code provisions was made by Uma and Jain [11].
Nevertheless, evidence from experimental data acquired during the testing of well-designed joints according to the current codes is not sufficient to fully support code provisions. For instance, there is a complete lack of rules for calculating the joint shear strength in the current provisions of Eurocode 8 (EC8) regarding ductility class medium (DCM) structures for the design of multi-story RC buildings (EC8 §10.9.1) [12]. However, the joint shear forces (both the horizontal and the vertical ones) are much higher than those resisted by the structural members framing at the joints (i.e., beams, columns). Consequently, the vast majority of modern European buildings designed according to EC8 (DCM) is susceptible to develop premature brittle shear damages or failures during future strong earthquakes, which may cause partial or general collapse. Moreover, during the design process, practicing civil engineers are literally unaware of the real magnitude of the shear forces resisted by the beam–column joints of RC buildings designed according to EC8 (DCM).
In EC8 §12.4.3.3, there is an inaccurate basis being used as a design consideration, which is that the flexural strength ratio Σ M Rc / Σ M Rb 1.30 secures the formation of plastic hinges and the damage concentration in the beams (beam–sway mechanisms in a strong column/weak beam frame), with the help of capacity design rules to avoid brittle failure modes (given in EC8 Section 10). Nonetheless, the beam–column joints of buildings designed according to EC8 (DCM) are in serious danger of exhibiting brittle shear damages or failures. Furthermore, it has been clearly demonstrated many times that brittle joint–shear failure can occur even for flexural strength ratios significantly higher than 1.30 [13,14,15,16].
Tsonos [13,14] examined the performance under cyclic lateral loading of six one-half scale exterior RC beam–column joint subassemblages designed according to different modern codes, i.e., the Eurocode (EC2 and EC8) [12,17], the ACI 318-05 [18], the ACI-ASCE Committee 352-02R [19], the Greek Code for the Design of RC Structures (CDCS 1995) [20] and the Greek Earthquake Resistant Code (ERC 1995) [21]. All specimens were typical of new structures, and all incorporated full seismic details in current building codes, including the weak girder–strong column design philosophy. The subassemblages were subjected to a large number of inelastic cycles. It is worth mentioning that all the structural members (columns, beams, and beam–column joints), of three of them named E1, E2 and E3, were designed according to the provisions of EC2 and EC8. The connections of subassemblages E1 and E3, contrary to expectations, exhibited shear failure during the early stages of the seismic loading. The damage occurred in both their joint area and in their columns’ critical regions. Hence, it was demonstrated that despite the implementation of the design assumptions of EC2 and EC8, the premature joint shear failure was not inhibited. Likewise, the design process failed to secure the development of the optimal failure mechanism with plastic hinges in the beams near their adjacent column, according to the requisite “strong column/weak beam”. Recently, an analytical model was proposed by Tsonos to be incorporated in EC8 for the design of joints for DCM buildings. This model is characterized not only for its accuracy but also for its elegant mathematical description of the joint inner mechanics, while allowing for the prediction of the ultimate shear capacity of the joint region. Moreover, the efficiency of the analytical model is boosted further to ensure that the beam–column connections remain intact during strong and catastrophic earthquakes. Therefore, this recently established model helps in avoiding collapses of RC constructions during strong earthquakes.
The primary scope of the present study is to examine the weaknesses of the Eurocode requirements for the design of beam–column joints for DCM structures, as well as to propose an alternative cost-effective design solution by using innovative materials. For this reason, the seismic performance of exterior RC beam–column joint subassemblages designed according to current Eurocode provisions (EC2 and EC8) is thoroughly investigated, both experimentally and analytically. Moreover, the hysteresis behavior of these well-designed specimens is compared with the performance of similar subassemblages, representative of structural members found in existing pre-1960s–1970s RC structures. An in-depth analysis of the developed failure mechanisms is subsequently performed, which aims to examine the effectiveness of designing the beam–column connections based on the capacity design rules only, in precluding the brittle failure of the joints. Furthermore, it is clearly demonstrated for the first time that the most crucial factor for securing the elastic response of the joints during an earthquake event is the combination of increased capacity design ratio values with low values of the developed shear stresses in the joint region. The latter can be achieved by using the analytical formulation proposed by Tsonos for accurately predicting the ultimate shear capacity of the joint while retaining the shear stresses lower than half the ultimate shear capacity value. This further emphasizes the significance of the proposed analytical formulation in substantially improving the design of beam–column connections. An alternative solution is also proposed for the design of beam–column joints of modern RC structures, while securing the ductile dissipating hysteresis performance during strong seismic excitations. In particular, an attempt is made to significantly reduce the use of the transverse steel reinforcement in the joint, the columns and the beam by replacing the conventional RC with an innovative material, namely steel fiber reinforced concrete. The main scope here is to propose a cost-effective design solution that is easy to apply while providing the necessary shear resistance to the joint region to allow for the concentration of damage and the formation of the plastic hinge solely in the beam in the juncture with the joint.
The related works found in literature are rather few. Henager [22] successfully replaced all the hoops in the beam–column joint region and part of the hoops in the critical regions of the adjacent beam and column of a beam–column joint subassemblage with steel fibers (1.67% fiber volume fraction was used). This replacement resulted in 50% reduction in building costs. An alternative process called SIMCON (slurry infiltrated mat concrete) seems to be very effective in strengthening applications [23]. Nevertheless, the SIMCON technique has the same disadvantages as FRPs. Tsonos [24] achieved a significant reduction of the number of ties in the beam–column joint region (5∅8 to 1∅8) using 0.5% by volume of steel fibers mixed in a nonshrinking high-strength concrete repair mix for the post-earthquake repair of exterior beam–column joints by the removal and replacement method. The cracking of the joint was effectively prevented, and the damage of the subassemblage was concentrated in the beam. The same type of HSSFC jacket was also used for the strengthening of the columns and the beam–column joint region of another specimen. In this case, the percentage of steel fibers was increased to 1.0% per volume. A new innovative technique was proposed for the first time by Tsonos (2007 patent No. 1005657/2007, 2014) [25] for the strengthening of poorly detailed structural members of old buildings. It uses nonshrink, nonsegregating steel fiber concrete of ultrahigh strength, without the addition of conventional reinforcement in the jackets. In addition, Shannag et al. [26] used high performance steel fiber reinforced concrete with various amounts of brass-coated or hooked steel fibers instead of conventional concrete in the joint region of six specimens, to evaluate their seismic behavior with respect to that of reference beam–column joint subassemblages.

2. Materials and Methods

The shear capacity of the beam-to-column connections is directly related to the ultimate deformation capacity of structures (especially of the framed ones), as well as to the control of damage and collapse prevention. Thus, the joint shear resistance decisively affects the overall seismic behavior of RC structures. This is true not only for the existing pre-1960s–1970s RC structures but for the modern ones as well. Moreover, shear damaging of the beam–column joint region is a brittle and extremely dangerous failure mode, which causes rapid deterioration of the hysteresis behavior and potential collapse. As a result, the structural integrity is seriously jeopardized during strong earthquakes by premature joint shear failures.
In the present analytical and experimental study, the seismic performance of RC beam–column joints designed according to the older codes or to the current EC2 and EC8 (DCM) provisions was evaluated. Moreover, an alternative design solution was proposed, one that uses steel fiber reinforced concrete instead of conventional RC to significantly reduce the transverse steel reinforcement required according to the EC2 and EC8 provisions. For this purpose, an experimental program was conducted for 7 one-half scale subassemblages of exterior RC beam–column joints ( D C M _ 1 , D C M _ 2   D C M _ 3 , D 1 , D 2 , D3, and SFJ1). Subassemblages D C M _ 1 , D C M _ 2 , and D C M _ 3 were designed according to EN1992-1 and EN1998-1 for ductility class medium (DCM), given that the vast majority of modern RC structures are of this class; after construction, these were then subjected to incremental amplitudes of reversed inelastic lateral displacements. Dimensions of the cross sections, reinforcement details, and design parameters of the subassemblages D C M _ 1 , D C M _ 2 , and D C M _ 3 are shown in Figure 1 and Table 1. Steel reinforcement B500C and concrete C20/25 were used for the construction of the specimens. Material properties are shown in Table 2. The main differences between D C M _ 1 and D C M _ 2 were the volume ratio of the column longitudinal reinforcement (0.668 in the case of D C M _ 1 and 0.77 in the case of D C M _ 2 ); the flexural strength ratio Σ M R c / Σ M R b , whose values were 1.31 and 1.60 for specimens D C M _ 1 and D C M _ 2 , respectively; and the position of the first tie of the beam. In particular, in the case of D C M _ 2 the first tie was placed at a 50 mm distance from the side of the beam in the juncture with the joint, according to EN1998-1 §5.4.3.1.2. On the contrary, the corresponding distance of the first tie from the extreme side of the beam is 5 mm in specimen D C M _ 1 . The capacity design ratio Σ M R c / Σ M R b of the beam-to-column joint subassemblage D C M _ 3 equaled to 1.49 > 1.30, while the specimen had a different volume ratio of the column and the beam longitudinal reinforcement compared to D C M _ 1 and D C M _ 2 . Moreover, closed ties of 8 mm diameter were used in the beam of D C M _ 3 instead of ties of 5 mm diameter in the case of subassemblages D C M _ 1 and D C M _ 2 . The ∅8 mm ties were spaced at a distance of 75 mm in the critical region of the beam of D C M _ 3 and at 150 mm in the noncritical region. The specimens were considered to be members of a four-story building founded in a soil of category B. Thus, the fundamental period of vibration of the building, T 1 , and the soil factor, S , were approximately 0.4   s and 1.2 , respectively. The behavior factor, q , was calculated according to Equation (1), where q 0 denotes the basic value of the behavior factor (i.e., 3.0 × a u / a 1 ); k w is a factor reflecting the prevailing failure mode in framed-structural systems, which is equal to 1.0 ; and a u / a 1 is the ratio of the multiplier of the horizontal seismic design action at the formation of the global plastic mechanism to the multiplier of the horizontal seismic design action at the formation of the first plastic hinge in the system, which is equal to 1.3 for framed structures. The curvature ductility factor of the specimens, μ φ , was calculated according to Equation (2), where T c is the upper limit of the period of the constant spectral acceleration branch, equal to 0.5 . The width of the concrete cover of subassemblages was 2.5   cm .
q = q 0 · k w 1.5  
μ φ = 1 + 2 · q 0 1 · T c / T 1
Three exterior RC beam–column joint subassemblages, i.e., D 1 , D 2 , and D 3 , representative of the structural members found in pre-1960s–1970s RC structures, were also constructed and subjected to the same sequence of reversed lateral displacements as specimens D C M _ 1 , D C M _ 2 , and D C M _ 3 . The subassemblages were made of concrete with low compression strength (i.e., 12.50 MPa for D 1 , 10.32 MPa for D 2 , and 11.50 MPa for D 3 ) and plain steel reinforcement, S220. Material properties of D 1 , D 2 , and D 3 are summarized in Table 2. All subassemblages had a joint capacity design ratio value ( Σ M R c / Σ M R b ) greater than 1.30. In particular, the latter ratios were 2.46, 2.07, and 1.61 in the case of specimens D 1 , D 2 , and D 3 , respectively. Moreover, the beam longitudinal reinforcement of the beam-to-column joint specimens was well anchored in the joint region, while the bars on both sides of the beams were also welded to 2∅10 bar segments in the transverse direction to prevent slipping of the reinforcement. The main difference between D 1 , D 2 , and D 3 was the volume ratio of the column and the beam longitudinal reinforcement.
Details about the seventh specimen, SFJ1, are given in Section 3.4 of the present study. The beam–column joint subassemblages were subjected to a large number of inelastic cyclic lateral displacements under a constant axial loading of 150 kN applied to the columns, to simulate the equivalent of strong earthquake motions.
The seismic tests of the beam–column joint subassemblages D C M _ 1 , D C M _ 2 , D C M _ 3 , D 1 , D 2 , D 3 , and SFJ1 were conducted in the test setup shown in Figure 2a, which is located at the Laboratory of Reinforced Concrete and Masonry Structures of the Aristotle University of Thessaloniki. Specific arrangements, i.e., those connected to the reaction frame and to the free ends of the columns by hinges, were used to simulate the inflection points of the columns. Thus, both the horizontal and vertical displacements of the columns’ ends were restrained while still able to rotate freely. All specimens were subjected to a large number of inelastic cycles of incremental lateral displacement amplitudes. In Figure 2b the qualitative deformed shape of the beam–column subassemblages is illustrated. The application of the lateral load to the free end of the beam was achieved using a two-way actuator. A load cell was used to measure the lateral load values during cycling. A constant axial load of 150 kN was imposed on the columns of the subassemblages by a hydraulic jack (see Figure 2a). The load point displacement was measured by a calibrated linear variable differential transducer (LVDT). Electrical resistant strain gauges were installed on the beam’s longitudinal steel bars of each specimen. The instrumentation used for performing the seismic tests was completely new and was measured by the supplying companies. The error in measurements was found to be negligible. Since the behavior of subassemblages is mainly demonstrated by the envelope curves, an ascending lateral displacement history with one cycle per amplitude of displacement was adopted, without considerable influence in the seismic performance of the subassemblages. All specimens were loaded transversely following the displacement-controlled schedule shown in Figure 2b. The steps of loading were determined using a test subassemblage that was similar to the examined specimens and was first loaded to its yield displacement. This was measured from the plot of resisted shear versus displacement of the test specimen for the point when a significant decrease in stiffness occurred. This was further verified by the yielding of the longitudinal beam reinforcement at the column face. The loading was continued in the same direction (push cycles) to 1.5 times the yield displacement, and the subassemblage was subsequently loaded in the opposite direction (pull cycles) to the same lateral displacement. After the first cycle of loading, the maximum displacement of each subsequent cycle was incremented by 0.5 times the yield displacement [27,28,29].
The strain rate of the earthquake-type loading applied to the specimens corresponded to static conditions. However, during seismic excitations, the strain rate, ε, is higher than that corresponding to static conditions. Soroushian and Sim [30] showed that an increase in ε with respect to static conditions leads to a moderate increase in the strength of concrete. Scott et al. [31] tested column specimens with various amounts of hoop reinforcement under strain rates ranging from 0.33 × 10⁻⁵∙s−1 (static loading), to 0.0167 × 10⁻⁵∙s−1 (seismic loading). Their test results conformed with the results obtained from Equation (3). Using the aforementioned expression, it is estimated that for a strain rate of ε = 0.0167 × 10⁻⁵∙s−1 an increase in concrete strength by about 20% occurs (compared with the static one). An expression similar to Equation (3) can be found in the CEB Code [32]. Thus, the strengths exhibited by the subassemblages used in this study during testing were somewhat lower than the strengths they would exhibit if subjected to load histories similar to actual seismic events.
f c , d y n = 1.48 + 0.160 · log έ + 0.0127 log έ 2 · f c , s t a t

3. Results

3.1. Interpretation of the Hysteresis Behavior of the Subassemblages

The cyclic lateral response of the exterior RC beam-to-column joint subassemblages, i.e., D C M _ 1 , D C M _ 2 , D C M _ 3 , D 1 , D 2 , and D 3 , is subsequently evaluated using data acquired from the experimental equipment during testing. Thus, the reliability of both the modern and the older code provisions for the design of beam–column connections was investigated by evaluating the perceived lateral strength, peak-to-peak stiffness, and hysteretic energy dissipation capacity.
Specimens D C M _ 1 , D C M _ 2 , and D C M _ 3 were designed according to the current Eurocode provisions with the capacity design ratio Σ M R c / Σ M R b > 1.30 (i.e., 1.31, 1.60, and 1.49 for D C M _ 1 , D C M _ 2 , and D C M _ 3 , respectively). Therefore, the seismic performance of these subassemblages would have to be consistent with the behavior documented in the seismic design philosophy of the modern codes, that is, the concentration of damage and the formation of the plastic hinges are to be found in the beam, while the beam–column joint region remains intact throughout testing. However, contrary to expectations, the specimens exhibited undesirable brittle shear failure of the joint region, while no cracking of the beam of the subassemblages was observed. In particular, hairline shear cracks appeared in both diagonal directions of the joint region during the first cycle of the earthquake-type loading of D C M _ 1 , D C M _ 2 , and D C M _ 3 . This was attributed to the significantly increased value of the joint shear force, which was almost six times higher than the beam shear force. During the incremental amplitudes of the cyclic lateral displacement sequence, the joint shear cracks progressively dilated, causing disintegration of the core concrete. Meanwhile, for the drift angle, R, which was 3.33%, the bond stress value in the circumference of the beam reinforcing bars that were anchored in the joint region exceeded the doubled tensile strength of the concrete ( 2 σ c t 
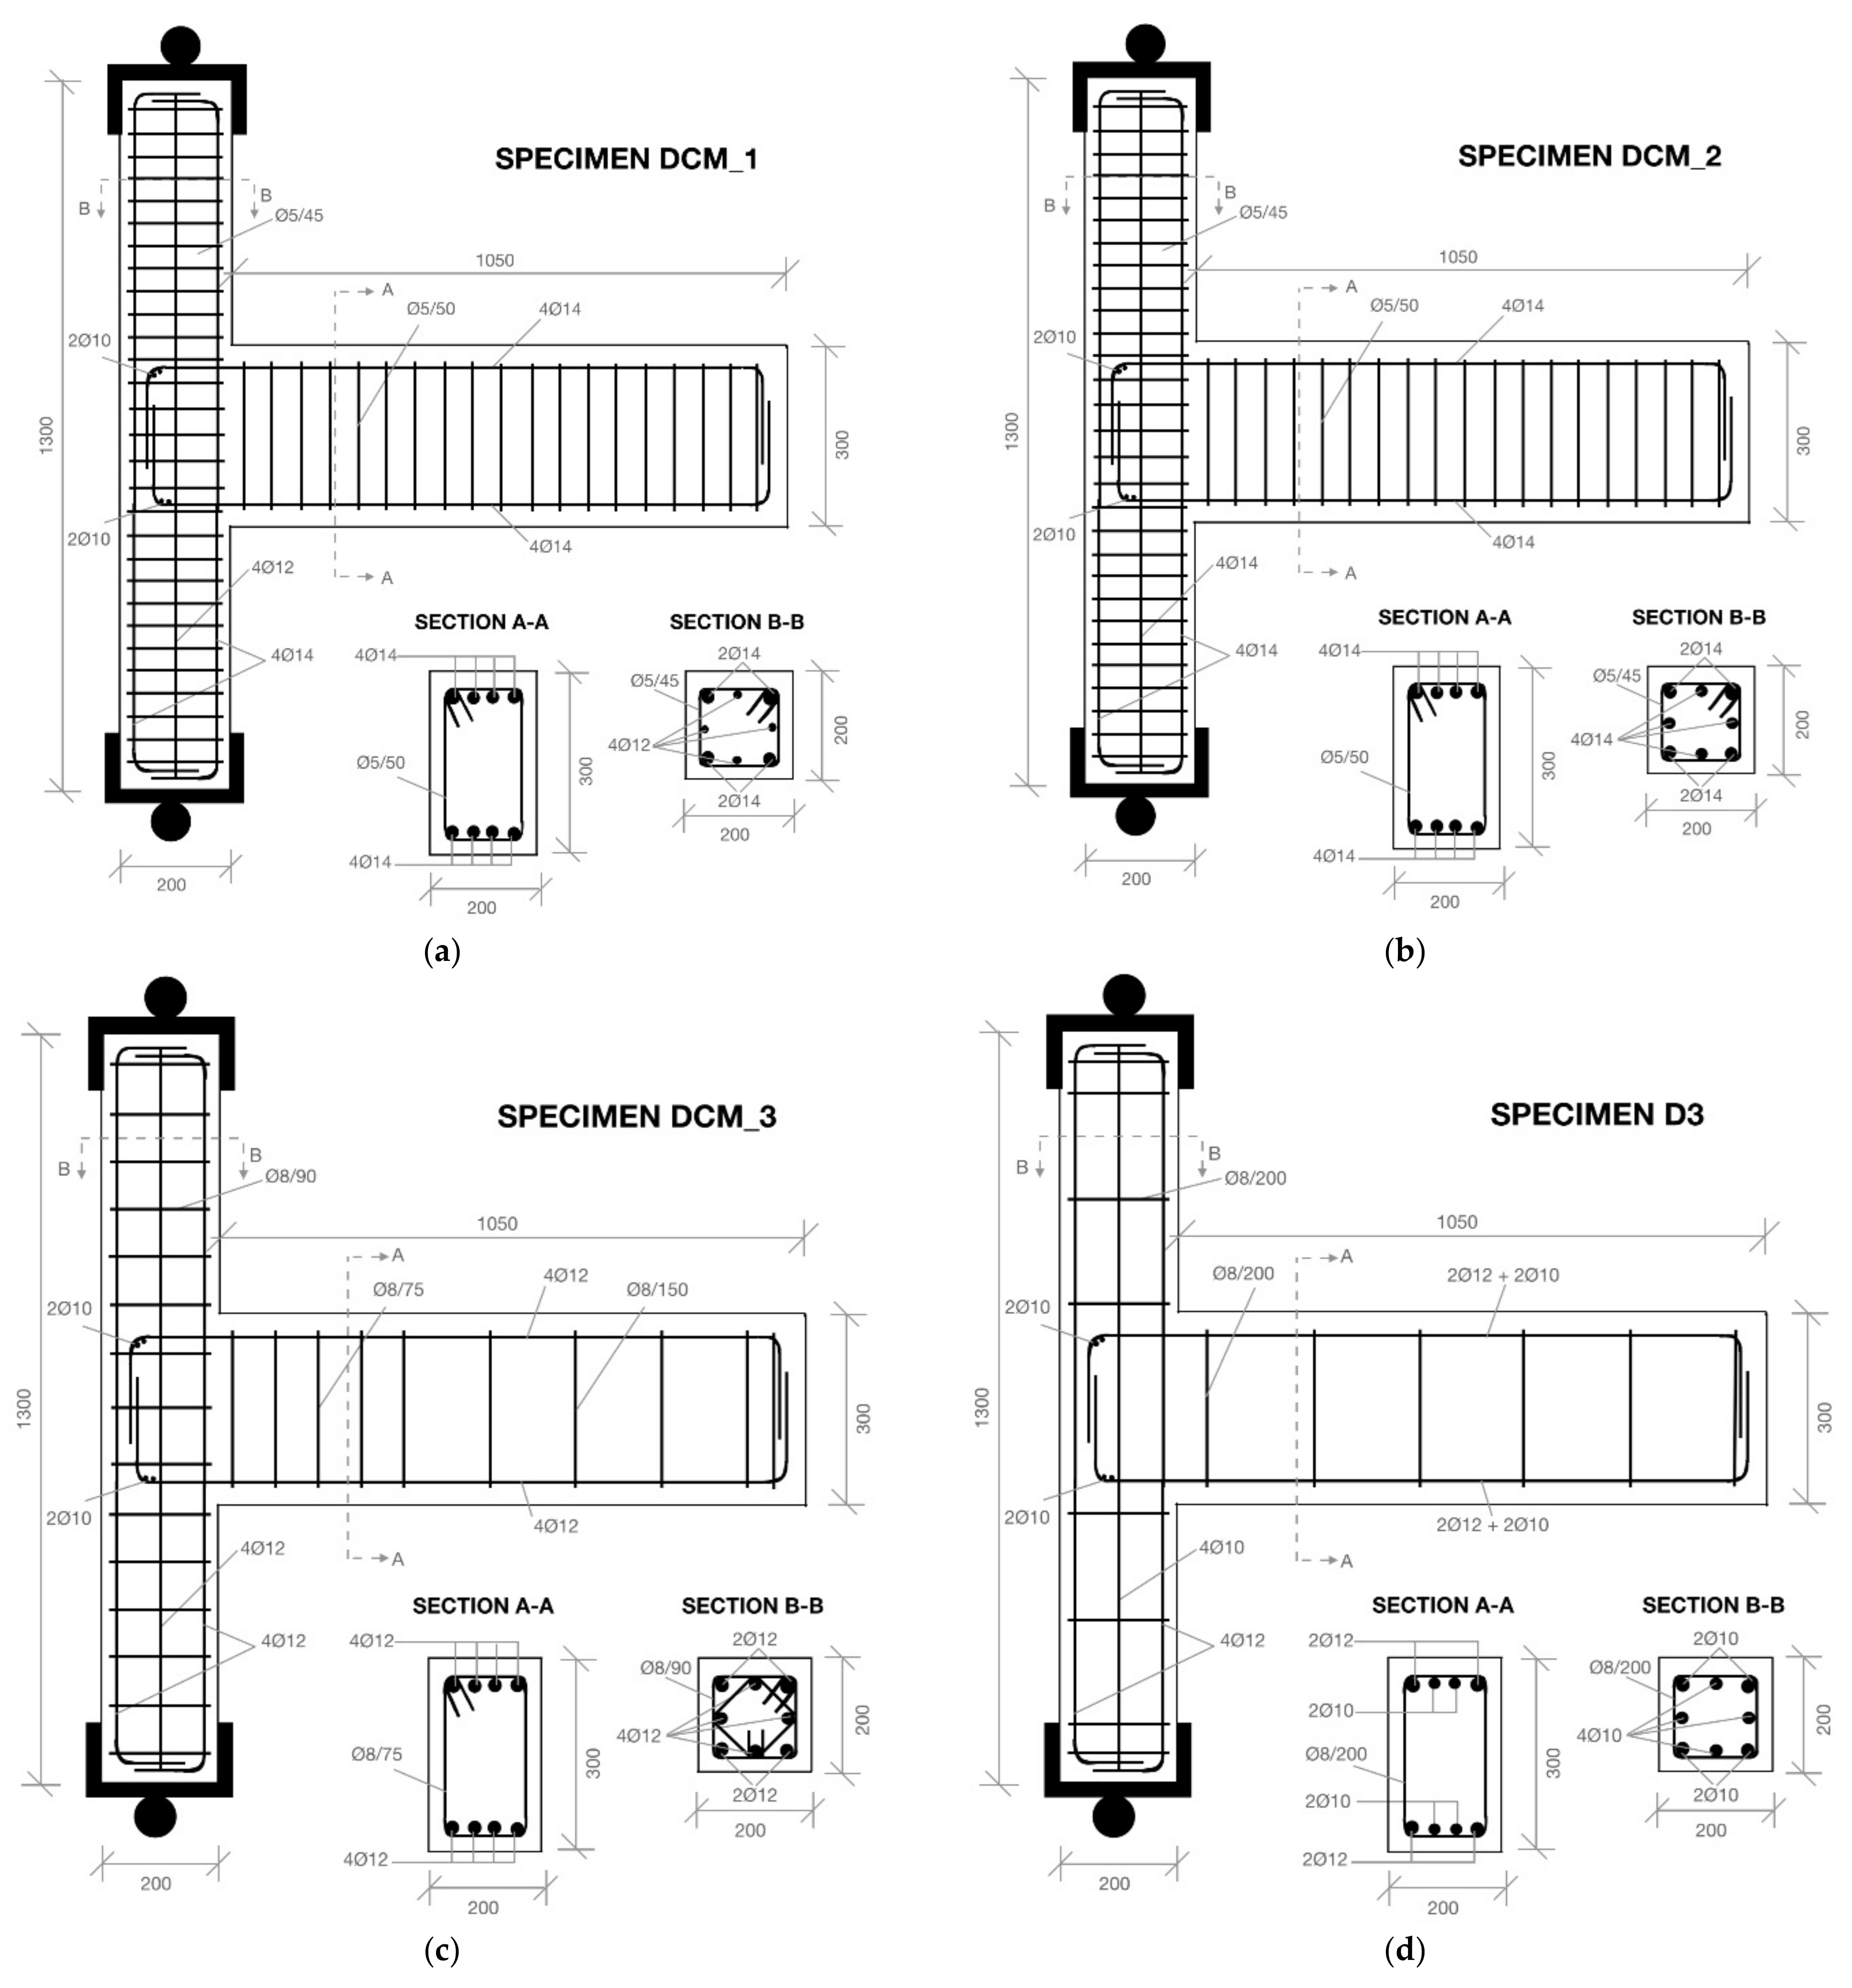
). As a result, splitting cracks were formed in the concrete perpendicular to the bars. The propagation of these cracks resulted in the gradual partial loss of the concrete cover in the rear face of the joint. It is worth noting that while the beam longitudinal bars were well anchored in the joint region, they were also welded to 2∅10 mm bar segments in the transverse direction (see Figure 1a–c) to preclude slipping during tests. Furthermore, the closely spaced hoops of the columns did not open.
Subassemblages, D C M _ 1 and D C M _ 2 
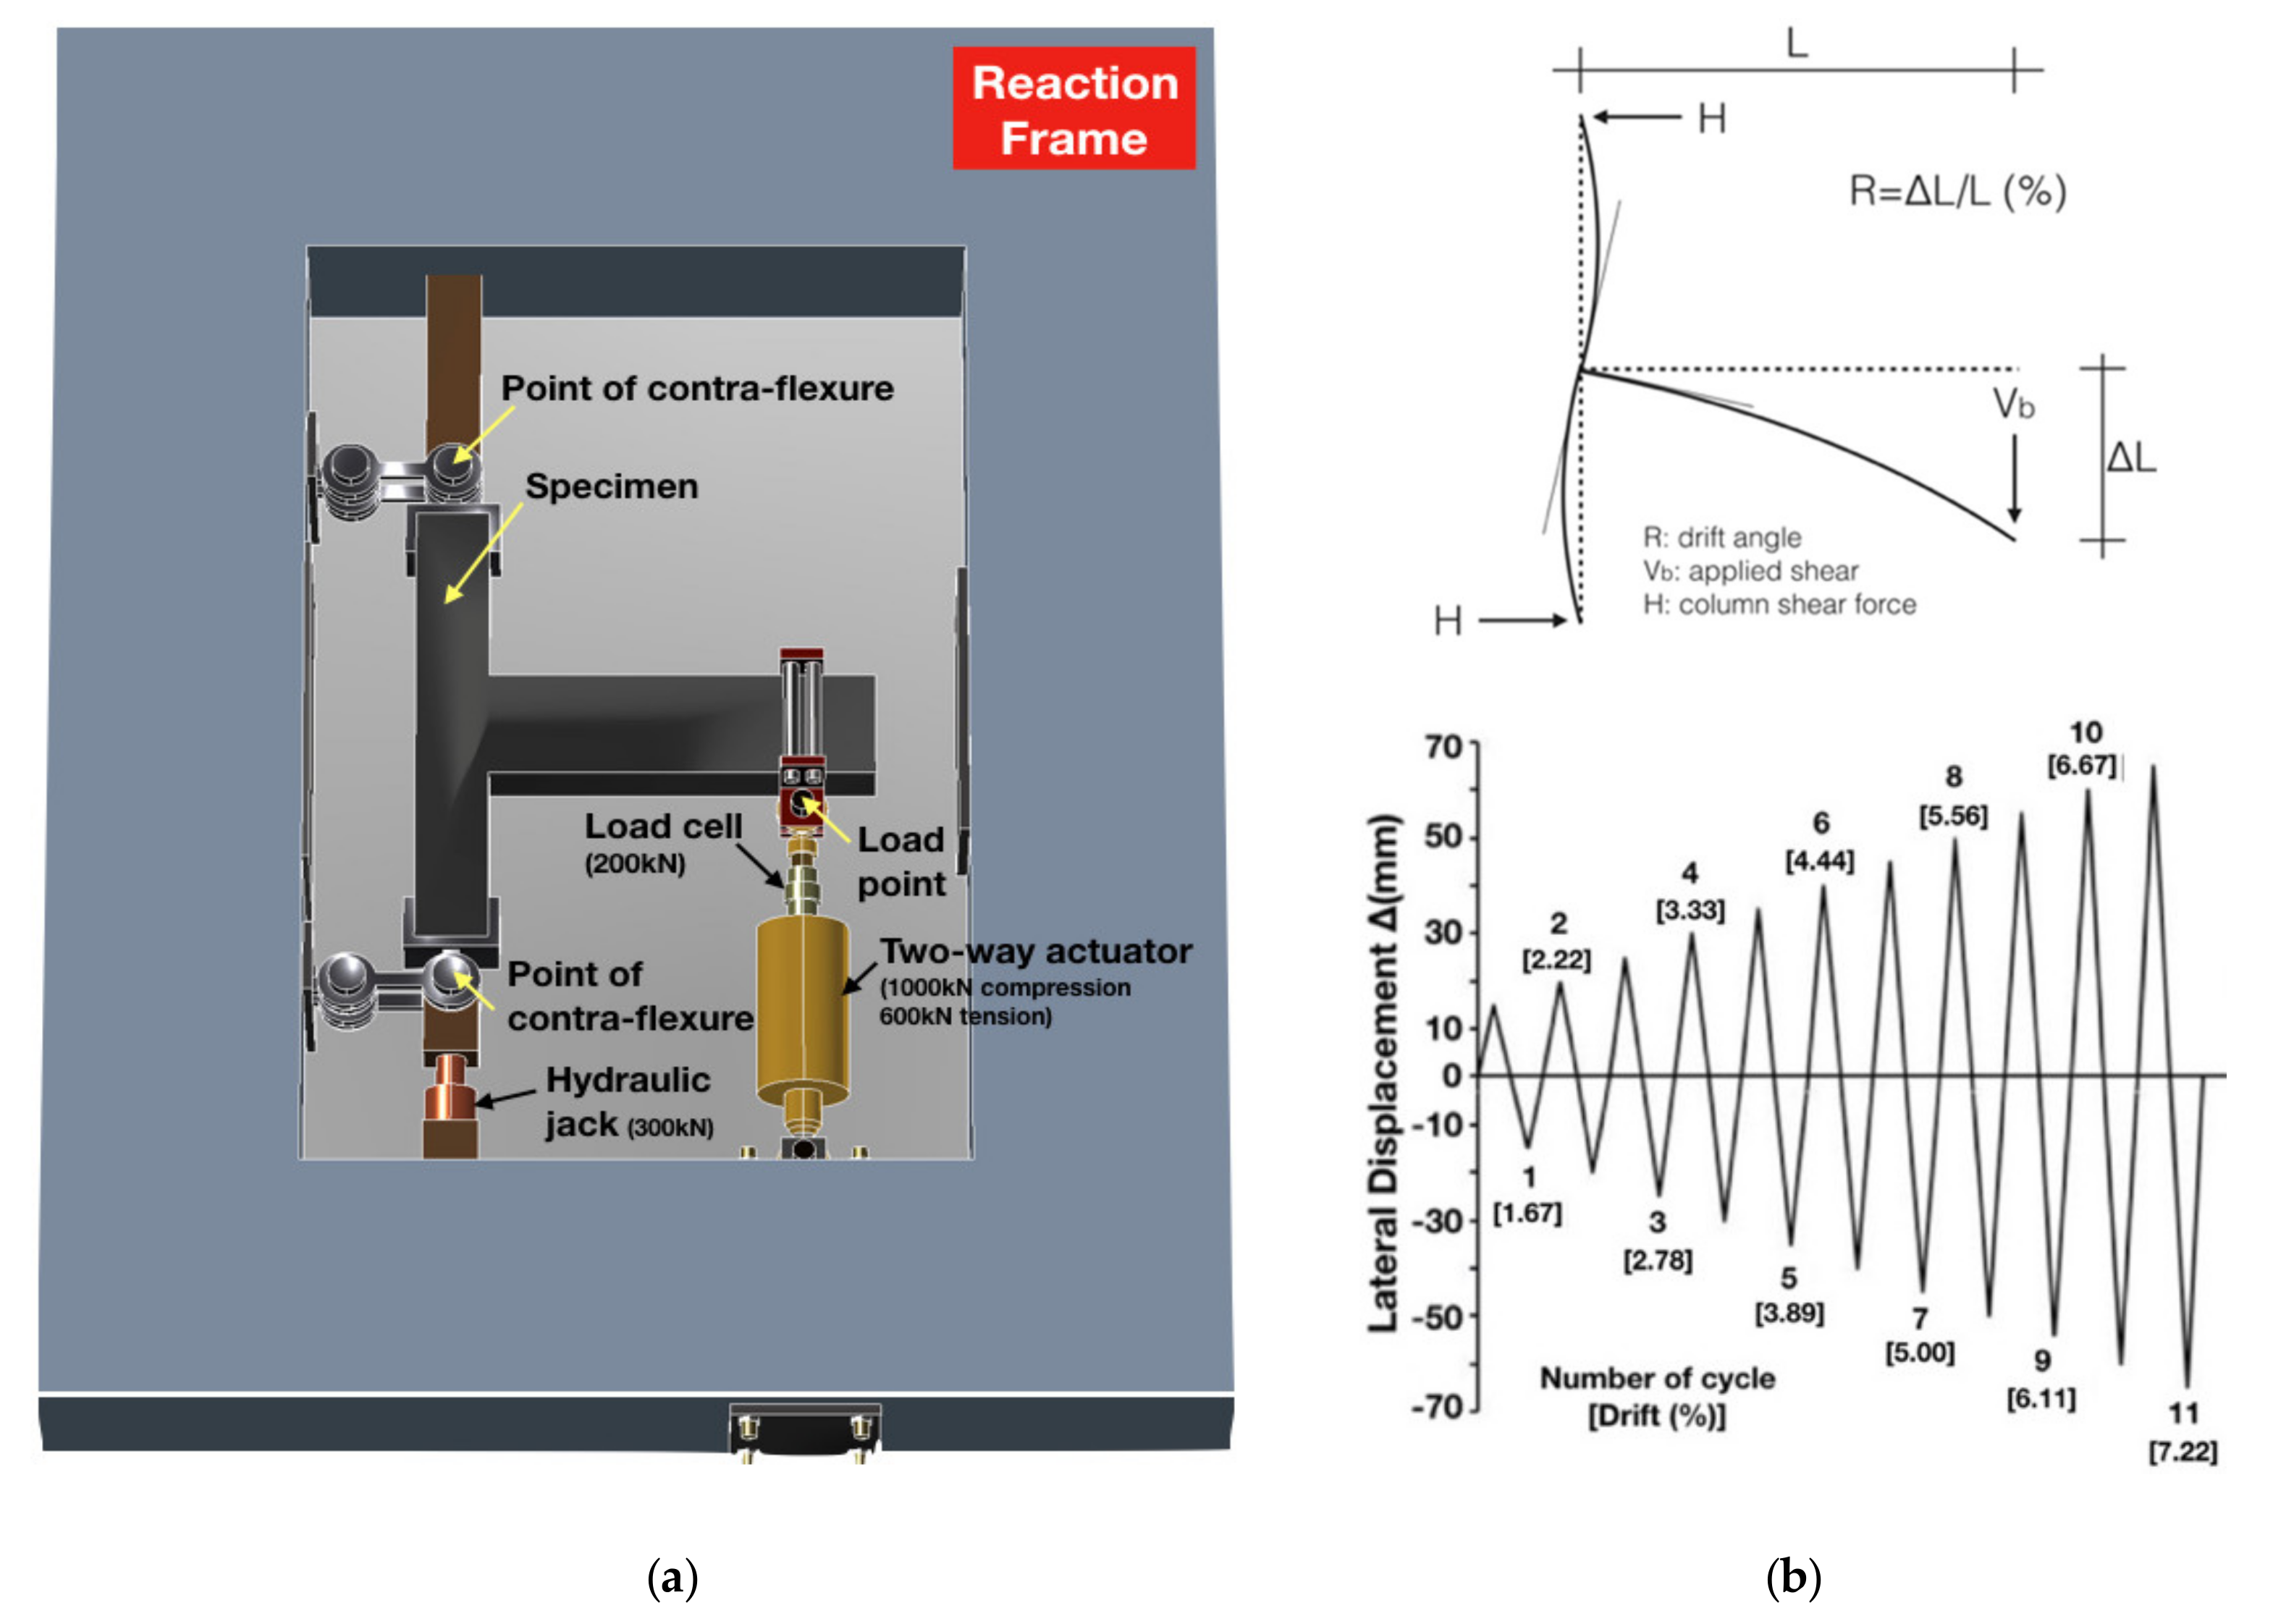
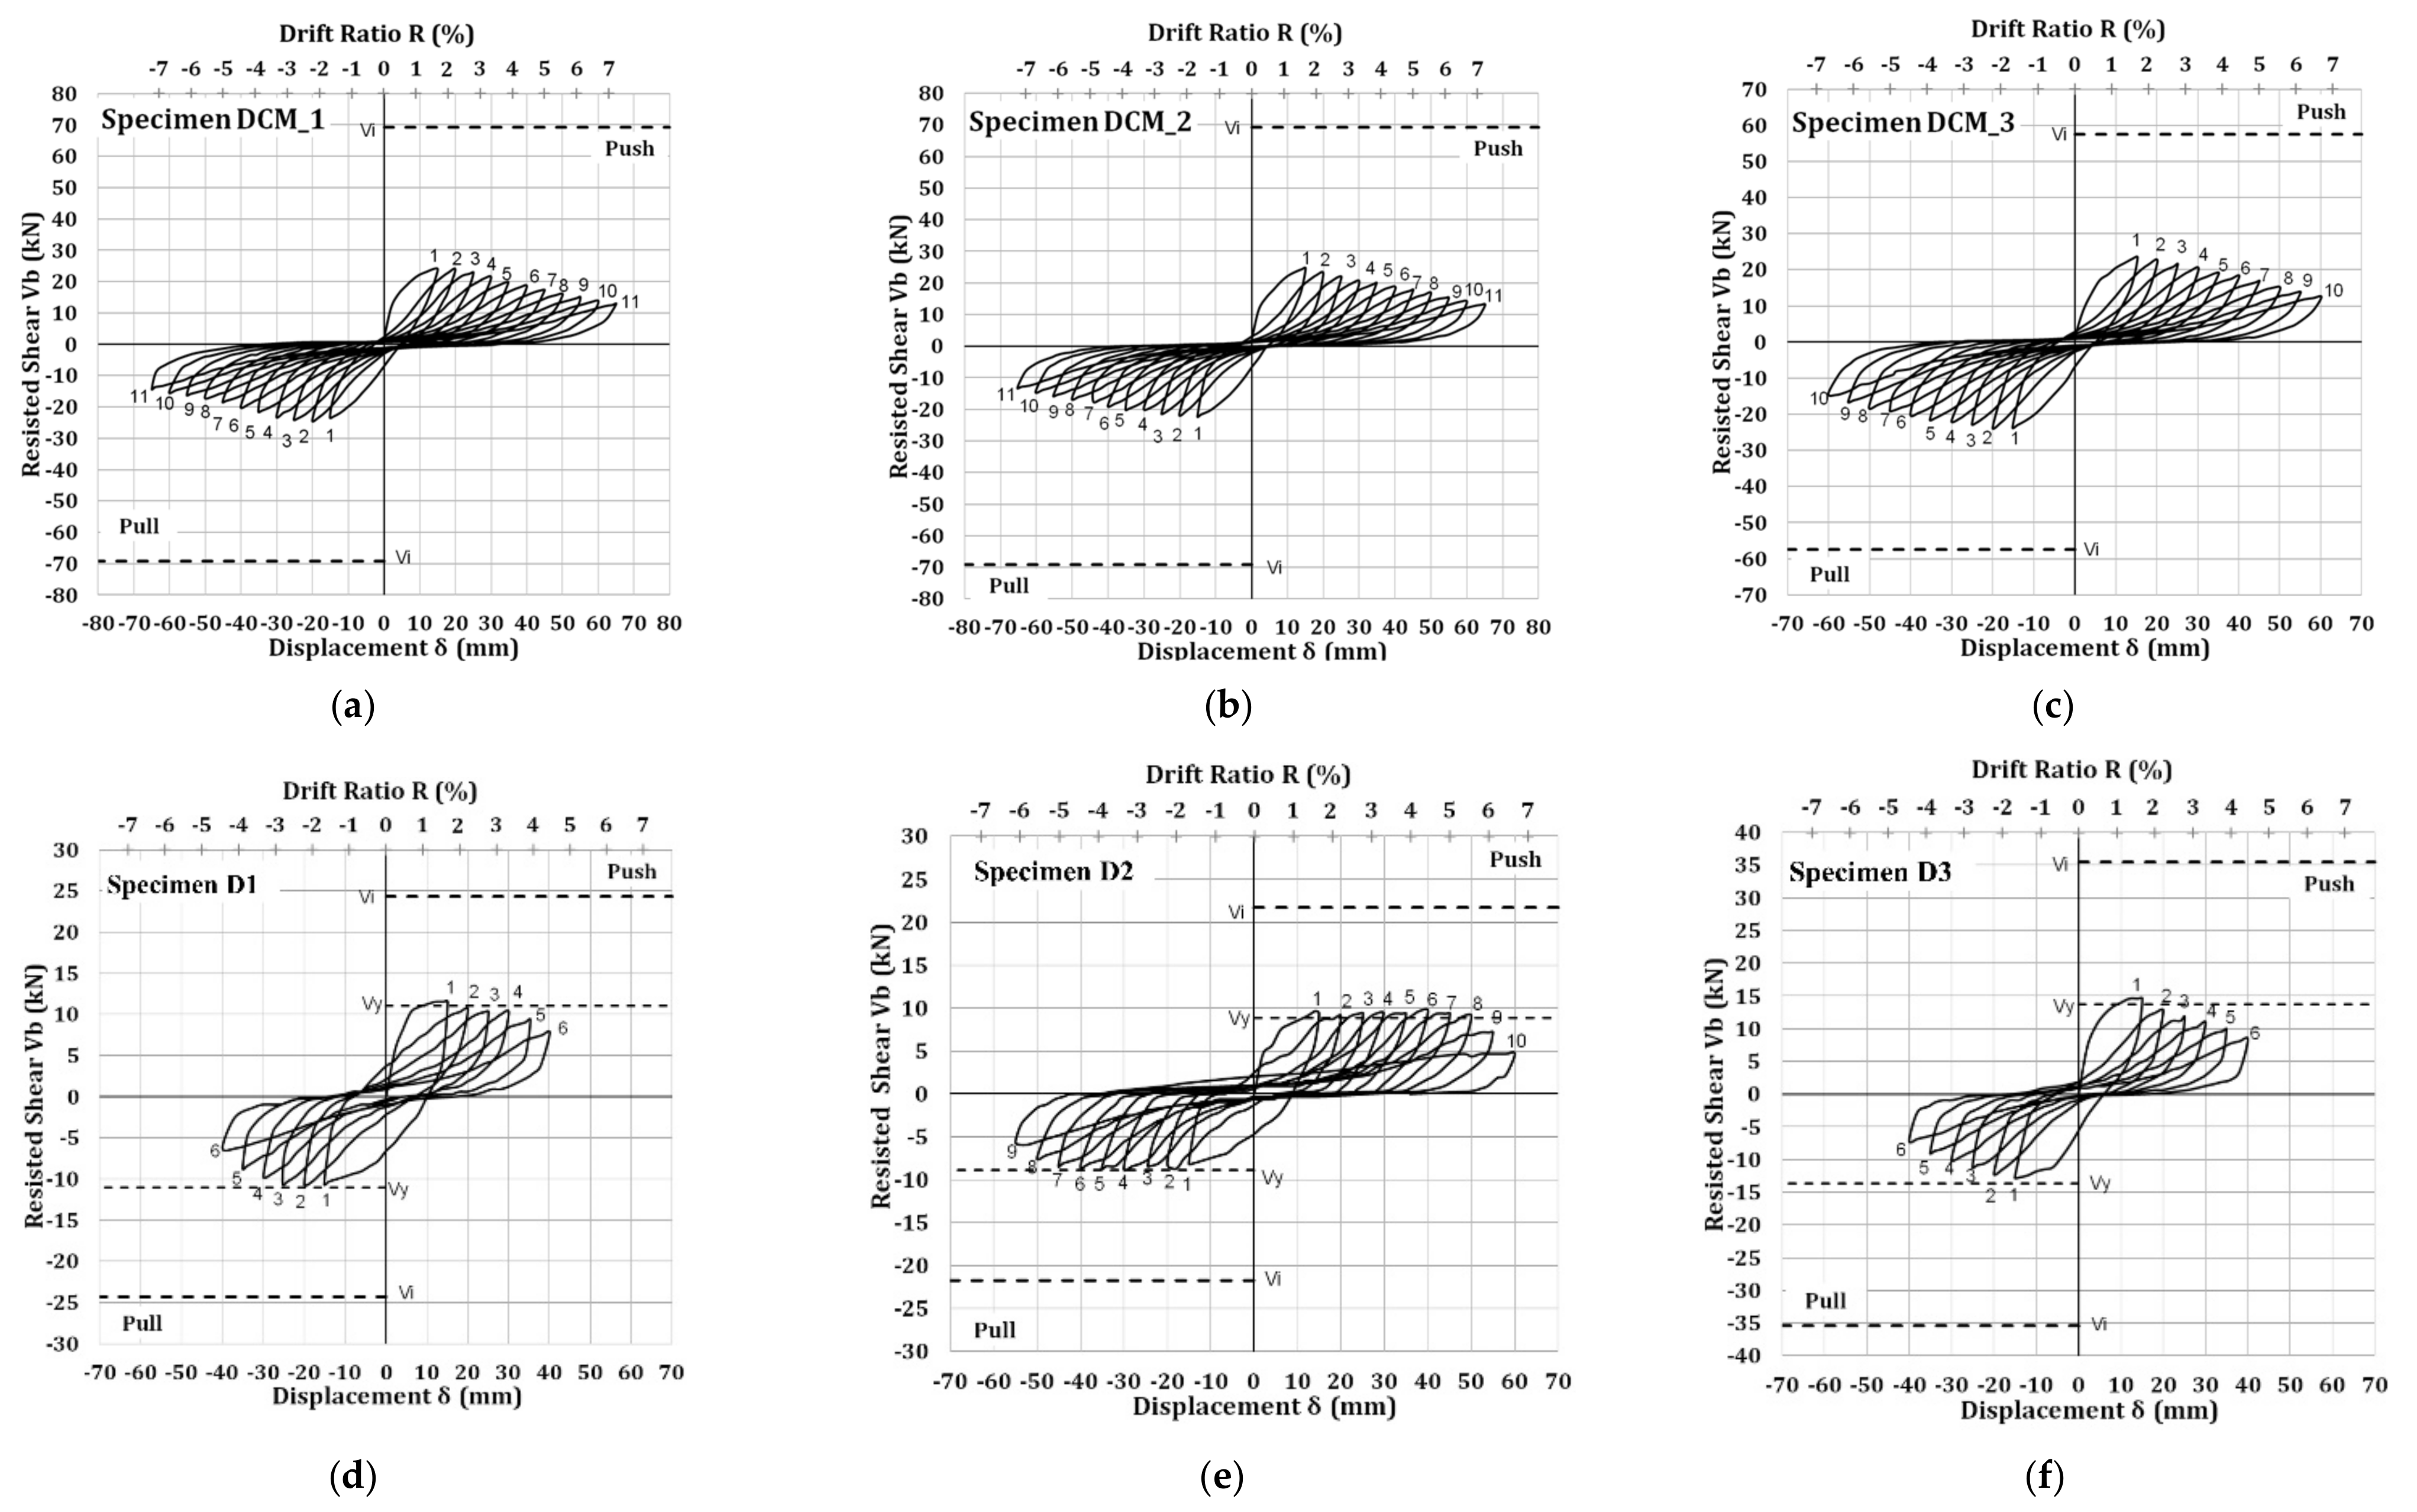
, showed a progressive slow-rate reduction of lateral strength and of peak-to-peak stiffness in both cases of the push half-cycles and the pull half-cycles of the earthquake-type loading (see Figure 3a,b). In the case of specimen D C M _ 3 , the reduction of lateral strength and peak-to-peak stiffness was more intensive than that in specimens D C M _ 1 and D C M _ 2 . This can be observed in the hysteresis loops of the subassemblages (see Figure 3a–c). None of the three beam–column joint specimens developed its nominal flexural moment capacity, while the resisted shear forces, which were 22.83 kN for D C M _ 1 , 24.63 kN for D C M _ 2 , and 23.69 kN for D C M _ 3 
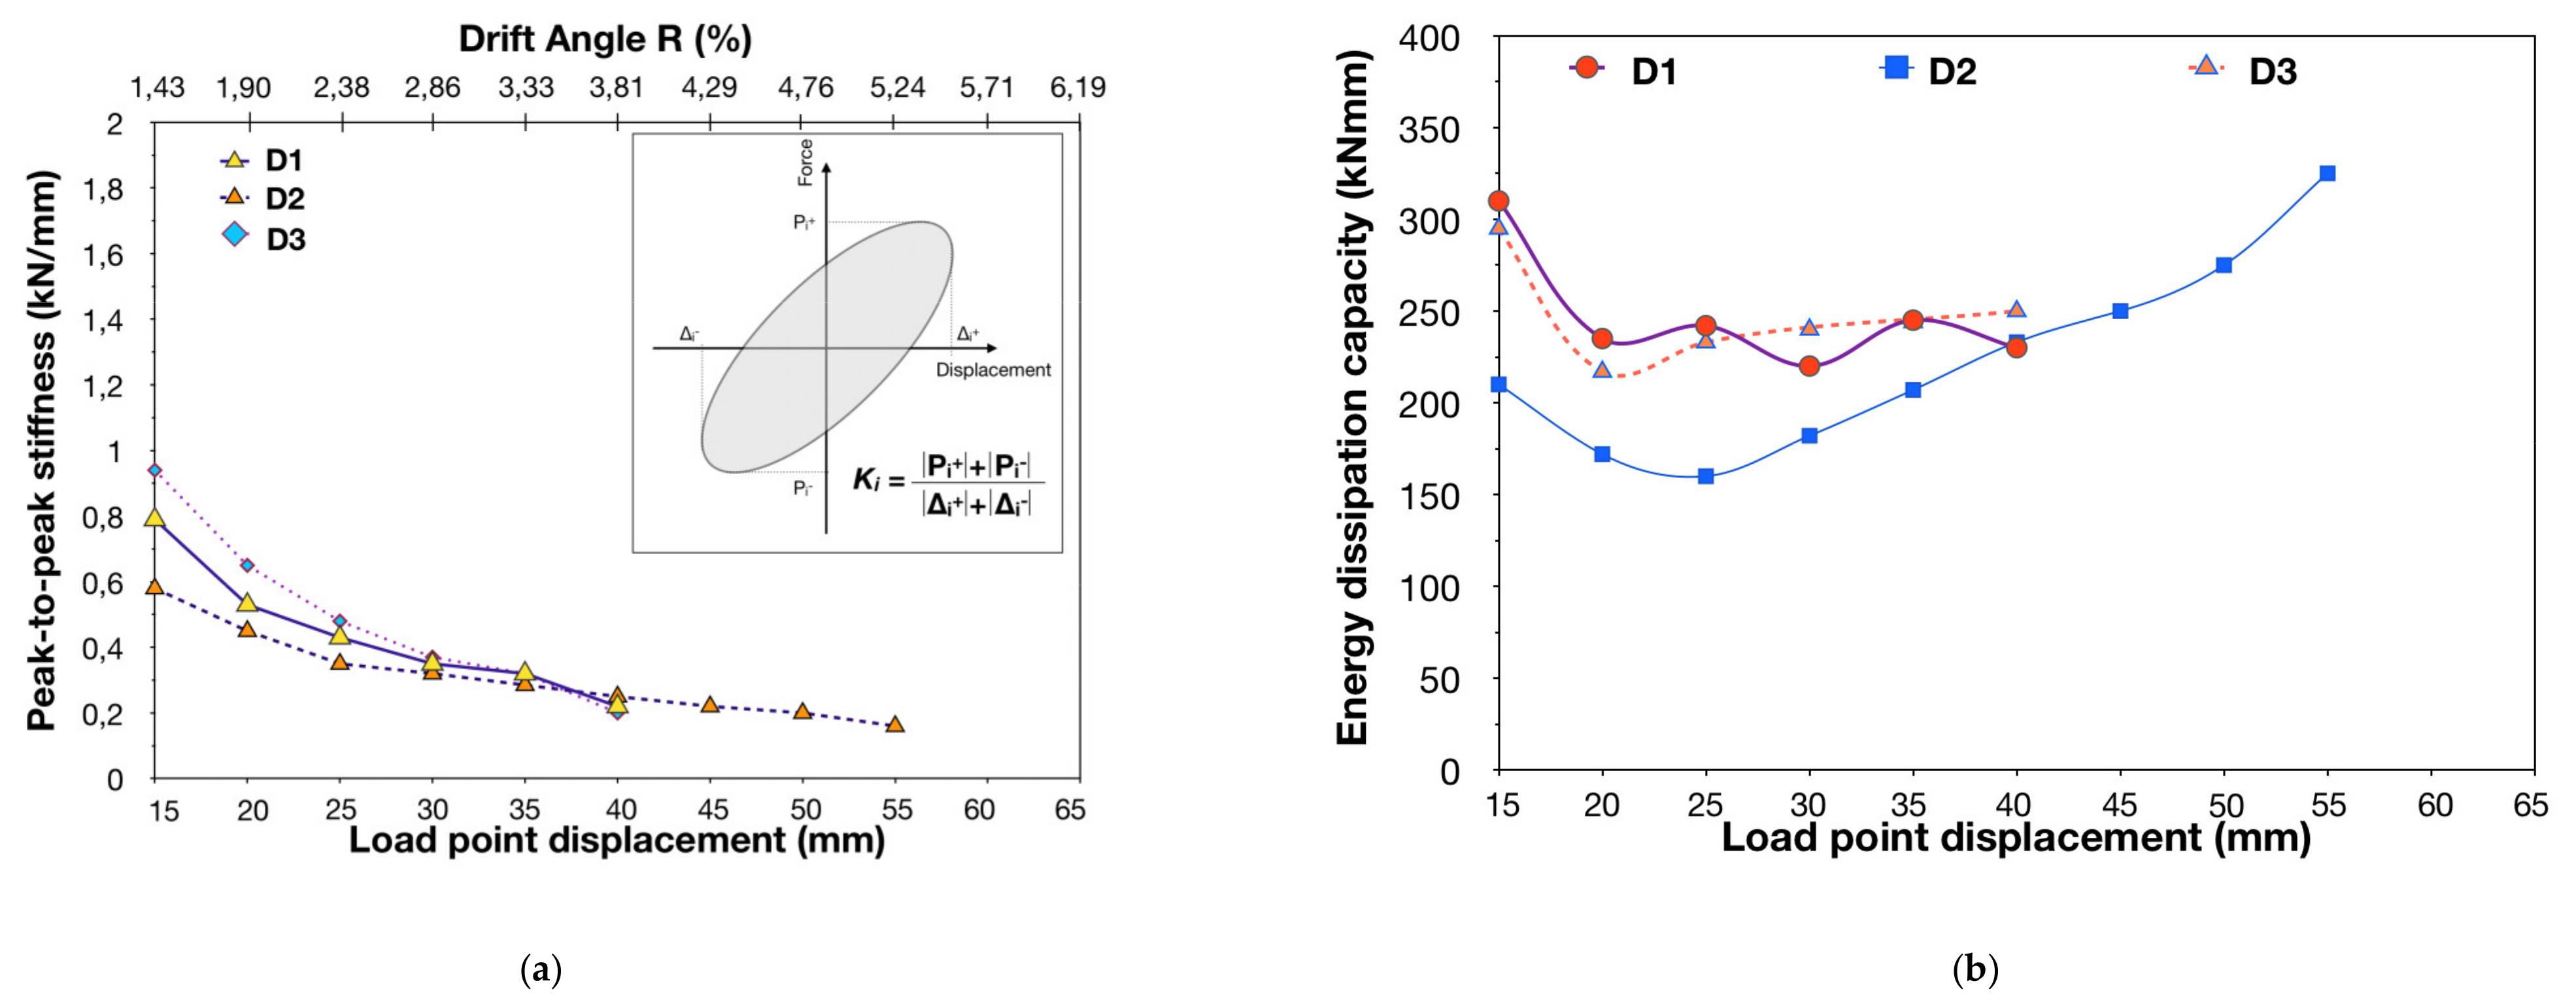
, were only a mere portion (33%, 35.6%, and 41.3%, respectively) of the shear capacity of the joints (69.17 kN and 57.41 kN). The peak-to-peak stiffness values of D C M _ 1 and D C M _ 2 were similar throughout testing. For instance, D C M _ 1 retained 17.80% of its initial peak-to-peak stiffness at the end of testing. The corresponding values in the case of subassemblages D C M _ 2 and D C M _ 3 were 19.42 and 12.82%, respectively (see Figure 4a). Moreover, specimens D C M _ 1 , D C M _ 2 , and D C M _ 3 . showed poor energy dissipation capacity, characterized by a slight increase of energy dissipation values during the consecutive cycles of the earthquake-type loading. In particular, for drift angle R, which was 6.67%, the energy dissipated in the case of subassemblage D C M _ 1 was 49.91% higher than that dissipated during the first cycle of loading. The corresponding values in the case of subassemblages D C M _ 2 and D C M _ 3 were 20% and 35.25%, respectively (see Figure 4b). Ultimately, despite being designed according to current EC8 provisions for DCM, the beam–column joint subassemblages D C M _ 1 , D C M _ 2 , and D C M _ 3 showed poor overall hysteresis behaviour, while exhibiting undesirable brittle shear failure of the joint region.
Thus, it was clearly demonstrated experimentally that designing the RC beam-to-column joint regions according to the current Eurocode provisions for DCM with flexural strength ratio Σ M R c / Σ M R b 1.30 is not always enough, neither to secure the formation of the plastic hinges solely in the beams nor to effectively preclude the brittle shear failure of the joints. Therefore, modern RC structures designed for DCM in earthquake-prone areas are still susceptible to possess controversial seismic performance and to develop undesirable failure mechanisms responsible for possible collapse. Furthermore, the efficiency and reliability of retrofitting measures, which were designed according to current Eurocode provisions for improving the cyclic response of beam–column joints of existing pre-1960s–1970s RC structures, are also questionable.
The beam–column joint subassemblages D 1 , D 2 , and D 3 showed poor overall hysteresis behavior, dominated by the shear failure of the joint area. The latter is clearly reflected in the hysteresis loops of the specimens (see Figure 3d–f). The initial damage of D 1 , D 2 , and D 3 during the first cycle of the earthquake-type loading included hairline shear cracking of the joint region in both diagonal directions and the formation of the principal flexural crack in the beam in juncture with the joint. Thereupon, the damage evolved and was concentrated solely in the joint region of the specimens, while no further cracking—except for the principal flexural crack which gradually dilated during testing—was observed in the beams. None of the three subassemblages developed its nominal moment flexural capacity. In fact, the maximum shear force resisted by specimens D 1 , D 2 , and D 3 corresponded to 63%, 52.6%, and 40.8% of its shear capacity, respectively. Subassemblage D 2 exhibited a more stable hysteresis behaviour with respect to D 1 and D 3 . Nevertheless, the lateral strength values of D 1 were slightly increased compared to the corresponding values of D 2 . The beam–column joint specimens D 1 and D 3 failed prematurely in brittle shear for the drift angle value of R = 4.44%, while D 2 failed for drift angle value of R = 6.67%. Moreover, the specimens showed particularly low energy dissipation capacity. In the case of specimen D 1 , a continuous reduction of the energy dissipation capacity values was observed during the consecutive cycles of loading, owing to the severe shear damage of the joint region. For instance, at the end of the testing of D 1 (for the lateral drift angle value of R = 4.44%), the energy dissipation capacity was 75.47% of the initial value during the first cycle of loading. The corresponding value in the case of specimen D 3 was 85.32% (see Figure 5a,b). In comparison, for the drift angle value R = 6.67%, specimen D 2 showed a 53.37% increase in energy dissipation capacity with respect to the initial value (see Figure 5b).
It is noteworthy that the subassemblages D 1 , D 2 , and D 3 were designed with a capacity design ratio value of Σ M R c / Σ M R b > 1.30   (see Table 1 and Table 3). Nevertheless, they all developed excessive premature shear damaging of the joint. This was mainly attributed to the sparsely spaced stirrups in the columns and the joint region, which were unable to provide adequate confinement to the core concrete to withstand the significantly increased shear forces inserted to the joint of the specimens from the well-anchored beam longitudinal reinforcement. As a result, D 1 , D 2 , and D 3 literally collapsed, due to the loss of axial load carrying capacity, while buckling of the column longitudinal reinforcement occurred. This is clearly illustrated in the failure mode of the specimens (see Figure 6d–f).
From the comprehensive interpretation of the hysteresis behavior of subassemblages D C M _ 1 , D C M _ 2 , D C M _ 3 , D 1 , D 2 , and D 3 , it is evident that the undesirable brittle shear failure of RC beam–column connections cannot always be effectively inhibited, considering only the design assumption of flexural ratio value of Σ M R c / Σ M R b > 1.30 . On the other hand, the inner mechanisms of the joint region should necessarily be sufficiently described, while the shear capacity of the joint should also be accurately calculated.

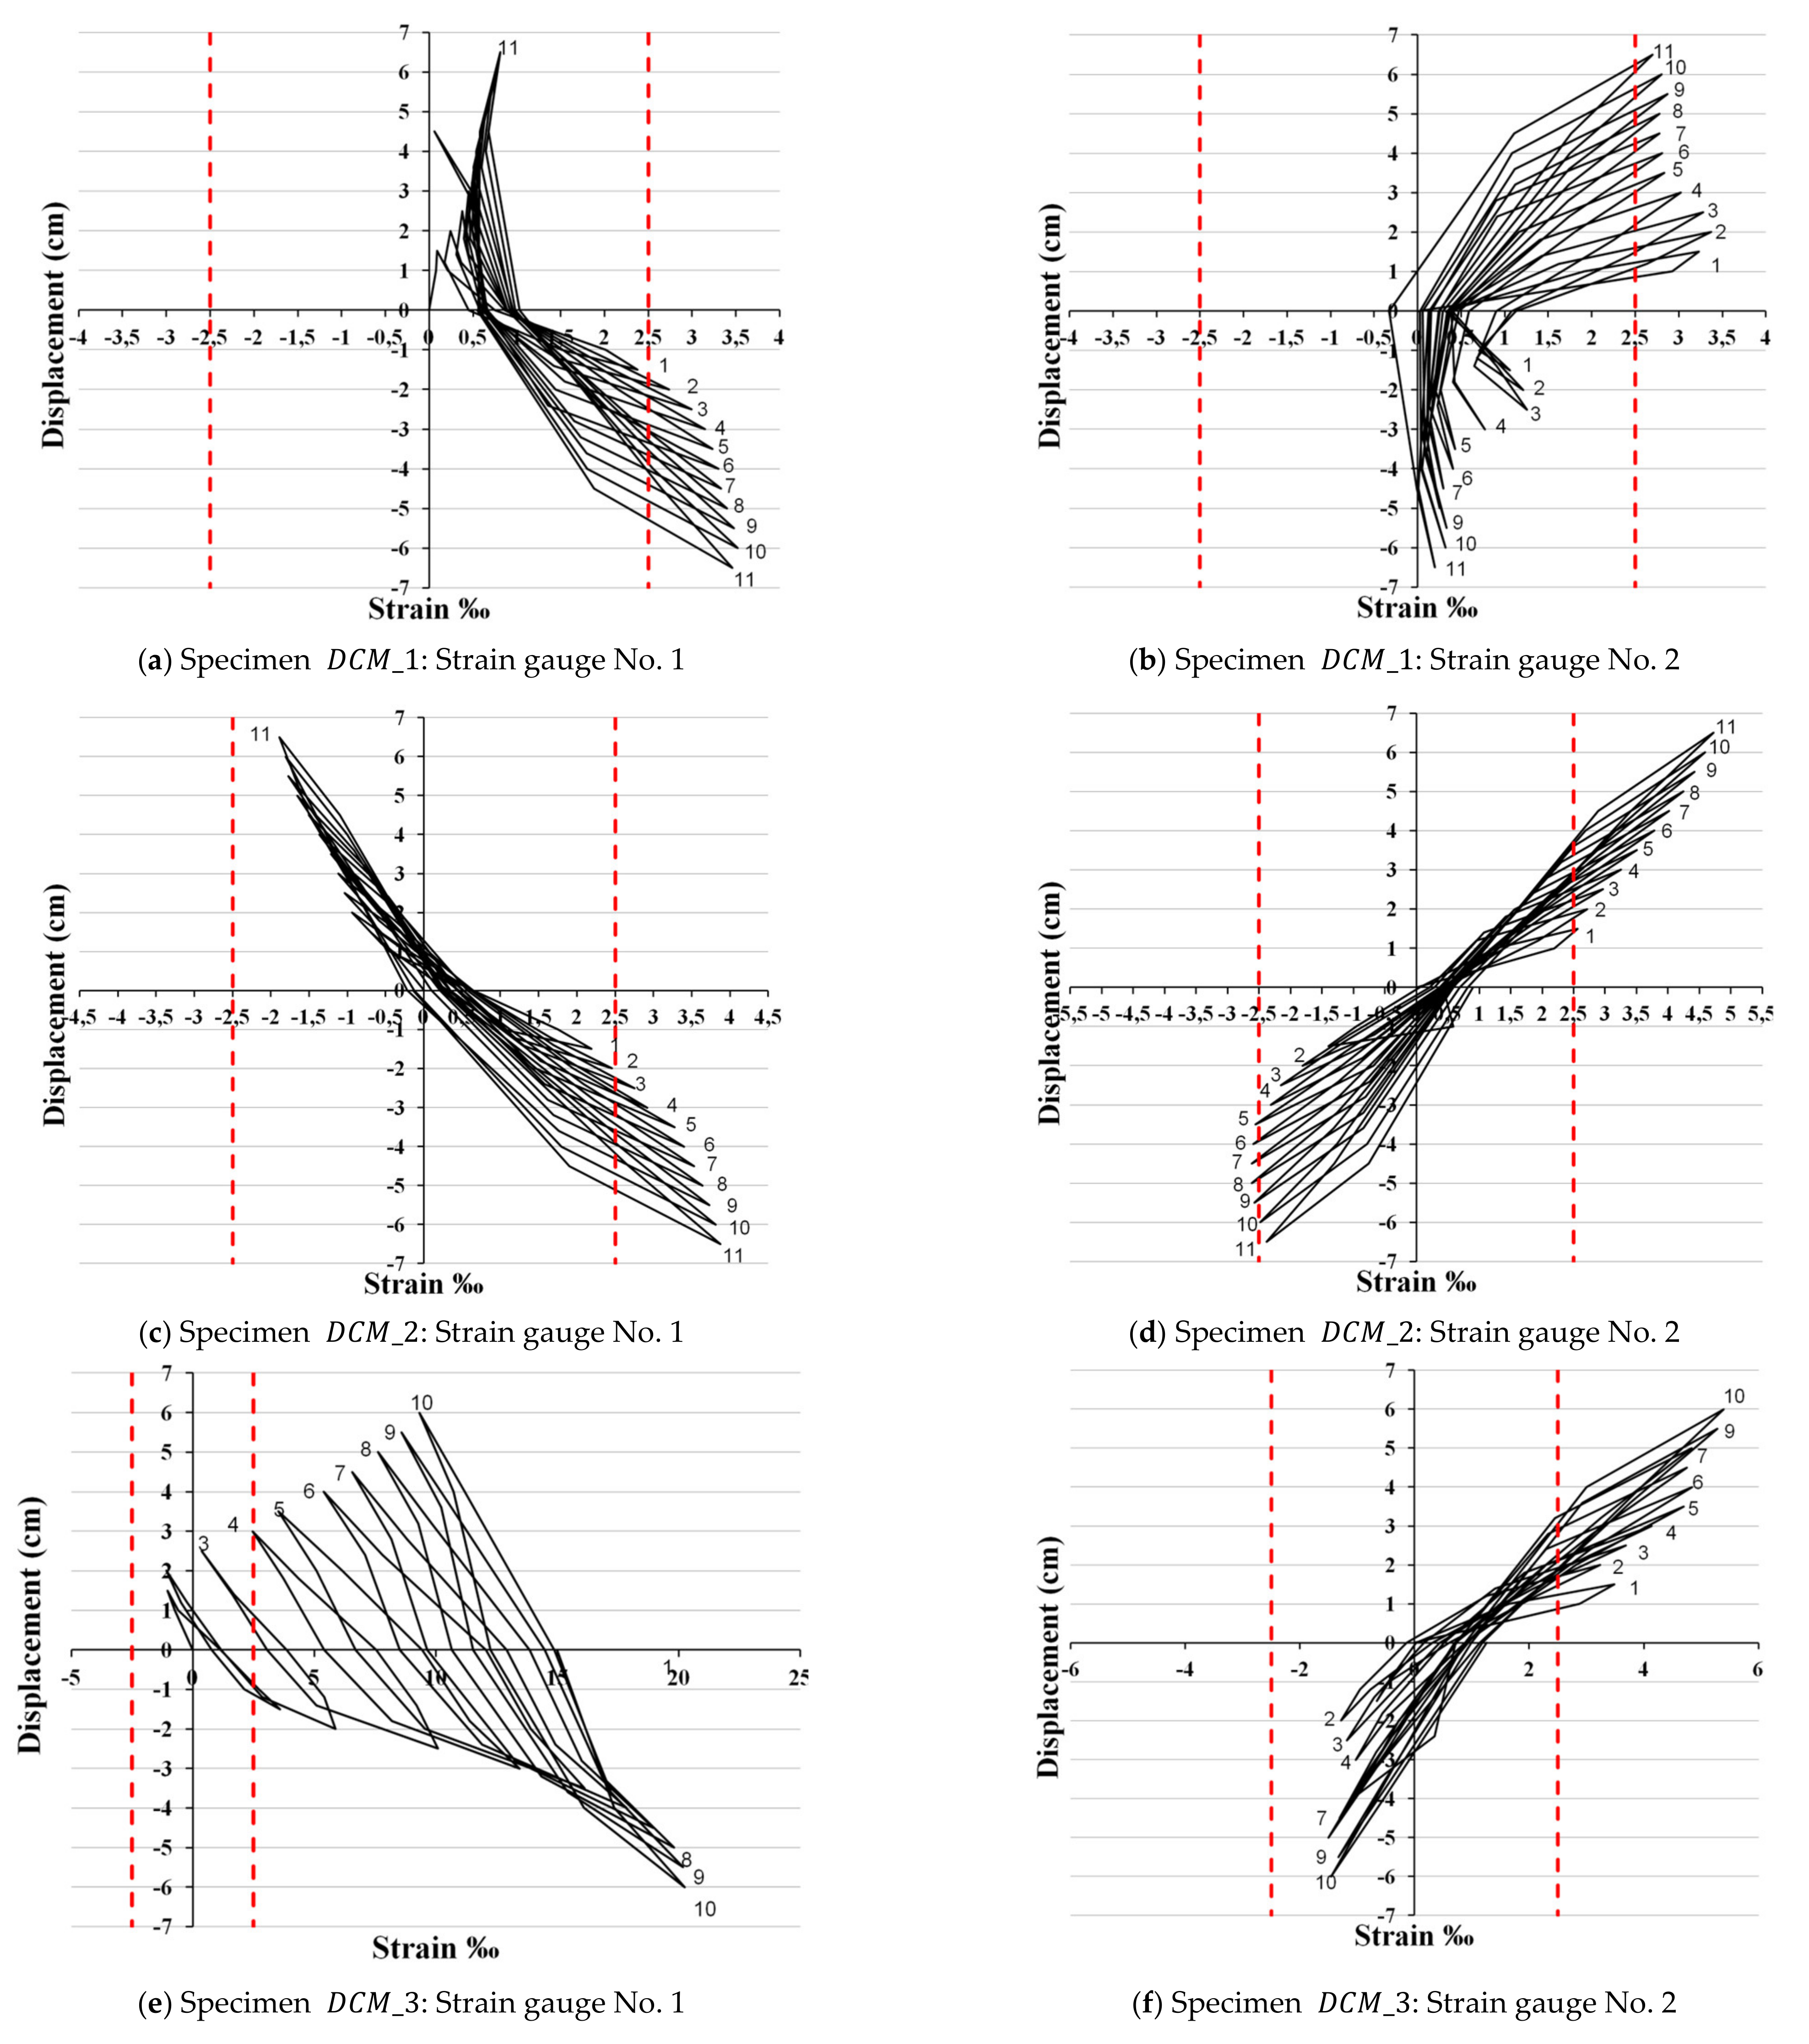
3.2. Monitoring of the Steel Bar Micro-Strain

Monitoring of the steel strain value variations during the earthquake-type loading of the beam–column joint subassemblages was achieved using electrical resistant strain gauges, which were attached to the bars. The exact location of each strain gauge is presented in Figure 7, while in Figure 8 the plots of the load point displacement versus strain of reinforcement are illustrated. The latter provided critical and valuable information about the specimens’ response when they were subjected to inelastic cyclic lateral deformations [33]. Similar work can be found in literature [34,35], where the transverse reinforcement and fiber hoop strains were monitored experimentally. In particular, the strain values that exceeded the yield strain were recorded during testing for both cases of the plain S220 bars of subassemblage D 2 and the B500C beam reinforcement of specimens D C M _ 1 , D C M _ 2 , and D C M _ 3 (see Figure 8a–f).
A comprehensive interpretation of the data acquired using the strain gauges requires careful observation and analysis of the damage evolution. It is also worth noting that the most crucial factor for the seismic performance of the beam–column joint region is the combination of the capacity design ratio value (ΣMRc/ΣMRb) and the value of coefficient γ of the developed shear stresses in the joint ( τ = γ f c ). The latter can be found using the proposed analytical formulation of Tsonos, which also allows for the precise prediction of the ultimate shear capacity of the joint (γult). It was proven experimentally [14] that for values of the coefficient γ < 0.5 γult, the developed shear stresses are low, and they allow for the concentration of damage solely in the beam, while the joint region remains intact. For high values of the coefficient γ (γ > γult), shear damage of the joint occurs prior to the development of the beam flexural moment capacity. For intermediate values of the coefficient γ (0.5 γult < γ < γult), it is possible that a mixed-type failure (including damage in the beam and the joint region) can occur. Under these lines, the damage evolution of the beam–column joint subassemblages is subsequently examined.
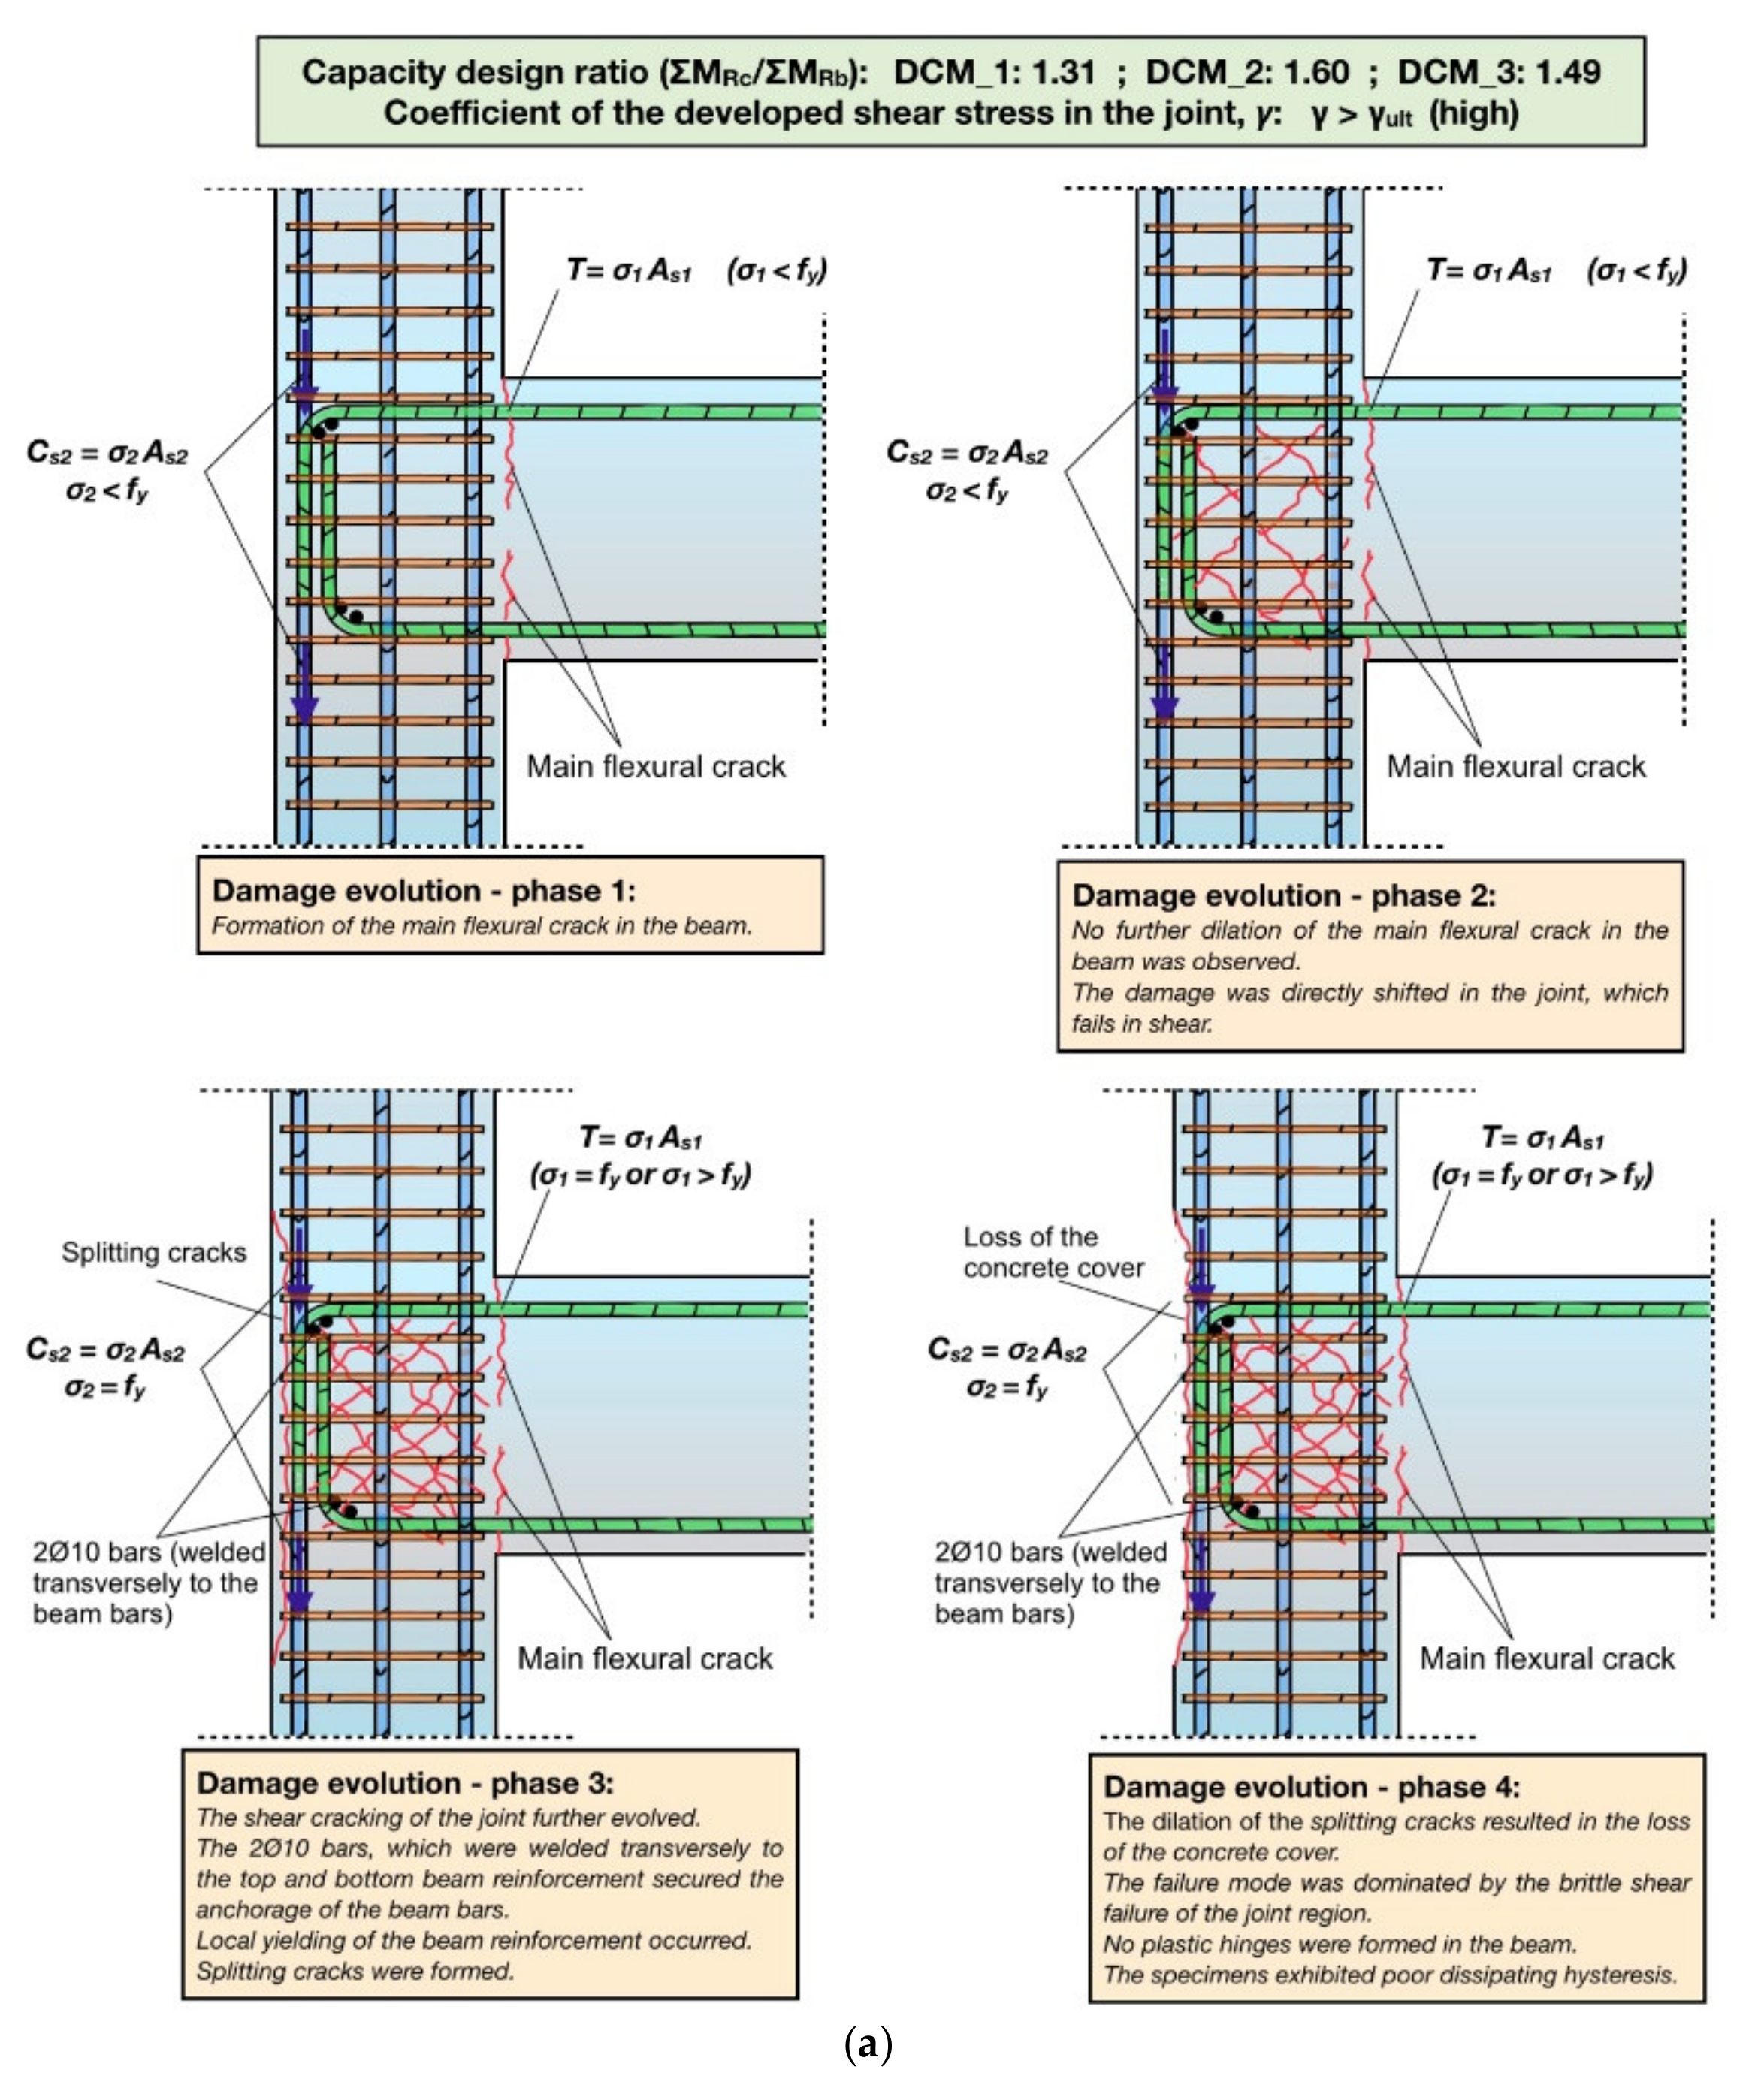
Specimens D C M _ 1 , D C M _ 2 , and D C M _ 3   were designed with capacity design ratios of 1.31, 1.60, and 1.49, respectively, satisfying the requirement of EC8 for ΣMRc/ΣMRb > 1.30. However, the developed shear stresses in the joint region of the subassemblages were significantly high and exceeded the ultimate shear capacities, as shown in Table 4. As a result, early failure of the joint region of D C M _ 1 , D C M _ 2 , and D C M _ 3   occurred. In particular, after the formation of the main flexural crack in the beam during the first cycle of the earthquake-type loading (see Figure 9a, Phase 1), the damage was directly shifted in the joint region of the specimens, where shear cracking gradually evolved (see Figure 9a, Phase 2). This is attributed to the particularly high value of the shear force introduced in the joint, which is six times the value of the shear force of the beam. After the fourth cycle, splitting cracks were formed along the longitudinal column bars in the back side of the joint specimens when the normal stress acting between the bars and the surrounding concrete exceeded the value 2fct, where fct is the tensile stress of the concrete (see Figure 9a, Phase 3). The rapid dilation of these cracks resulted in the loss of the concrete cover (see Figure 9a, Phase 4). Meanwhile, the use of 2Ø10 bars, which were welded perpendicular to the beam longitudinal reinforcement (see Figure 1 and Figure 9a), as well as the increased number of the ties in the joint region, secured the anchorage of the beam rebars and allowed for steel yielding. For instance, a continuous increase in maximum steel strain to post-yield values during consecutive cycles of loading was observed in the cases of D C M _ 1 , D C M _ 2 , and D C M _ 3 (see Figure 8a,c–f); the latter indicates the absence of bar slipping [33]. The opposite is true for stable or decreasing strain values, which reflect hysteresis deterioration due to the slippage of the bars, as long as buckling has not taken place (see Figure 8b,g). It is noteworthy that despite the yielding of the beam longitudinal reinforcement being eventually achieved, this occurred only locally in the position of the main flexural crack, where the strain gauges were attached to the rebars. This is also apparent from the absence of plastic hinges in the beam of the specimens, and this explains the low energy dissipation capacity of the subassemblages (see Figure 6a–c and Figure 9a). Thus, the overall seismic response of D C M _ 1 , D C M _ 2 , and D C M _ 3 was dominated by the premature brittle shear failure of the joints, which prevented the development of the nominal moment flexural capacities of the specimens. Of course, this type of failure is not acceptable for modern structures, and this clearly demonstrates the importance of the combination of ΣMRc/ΣMRb and γ values as a key factor that controls the seismic performance of the beam–column joint region.
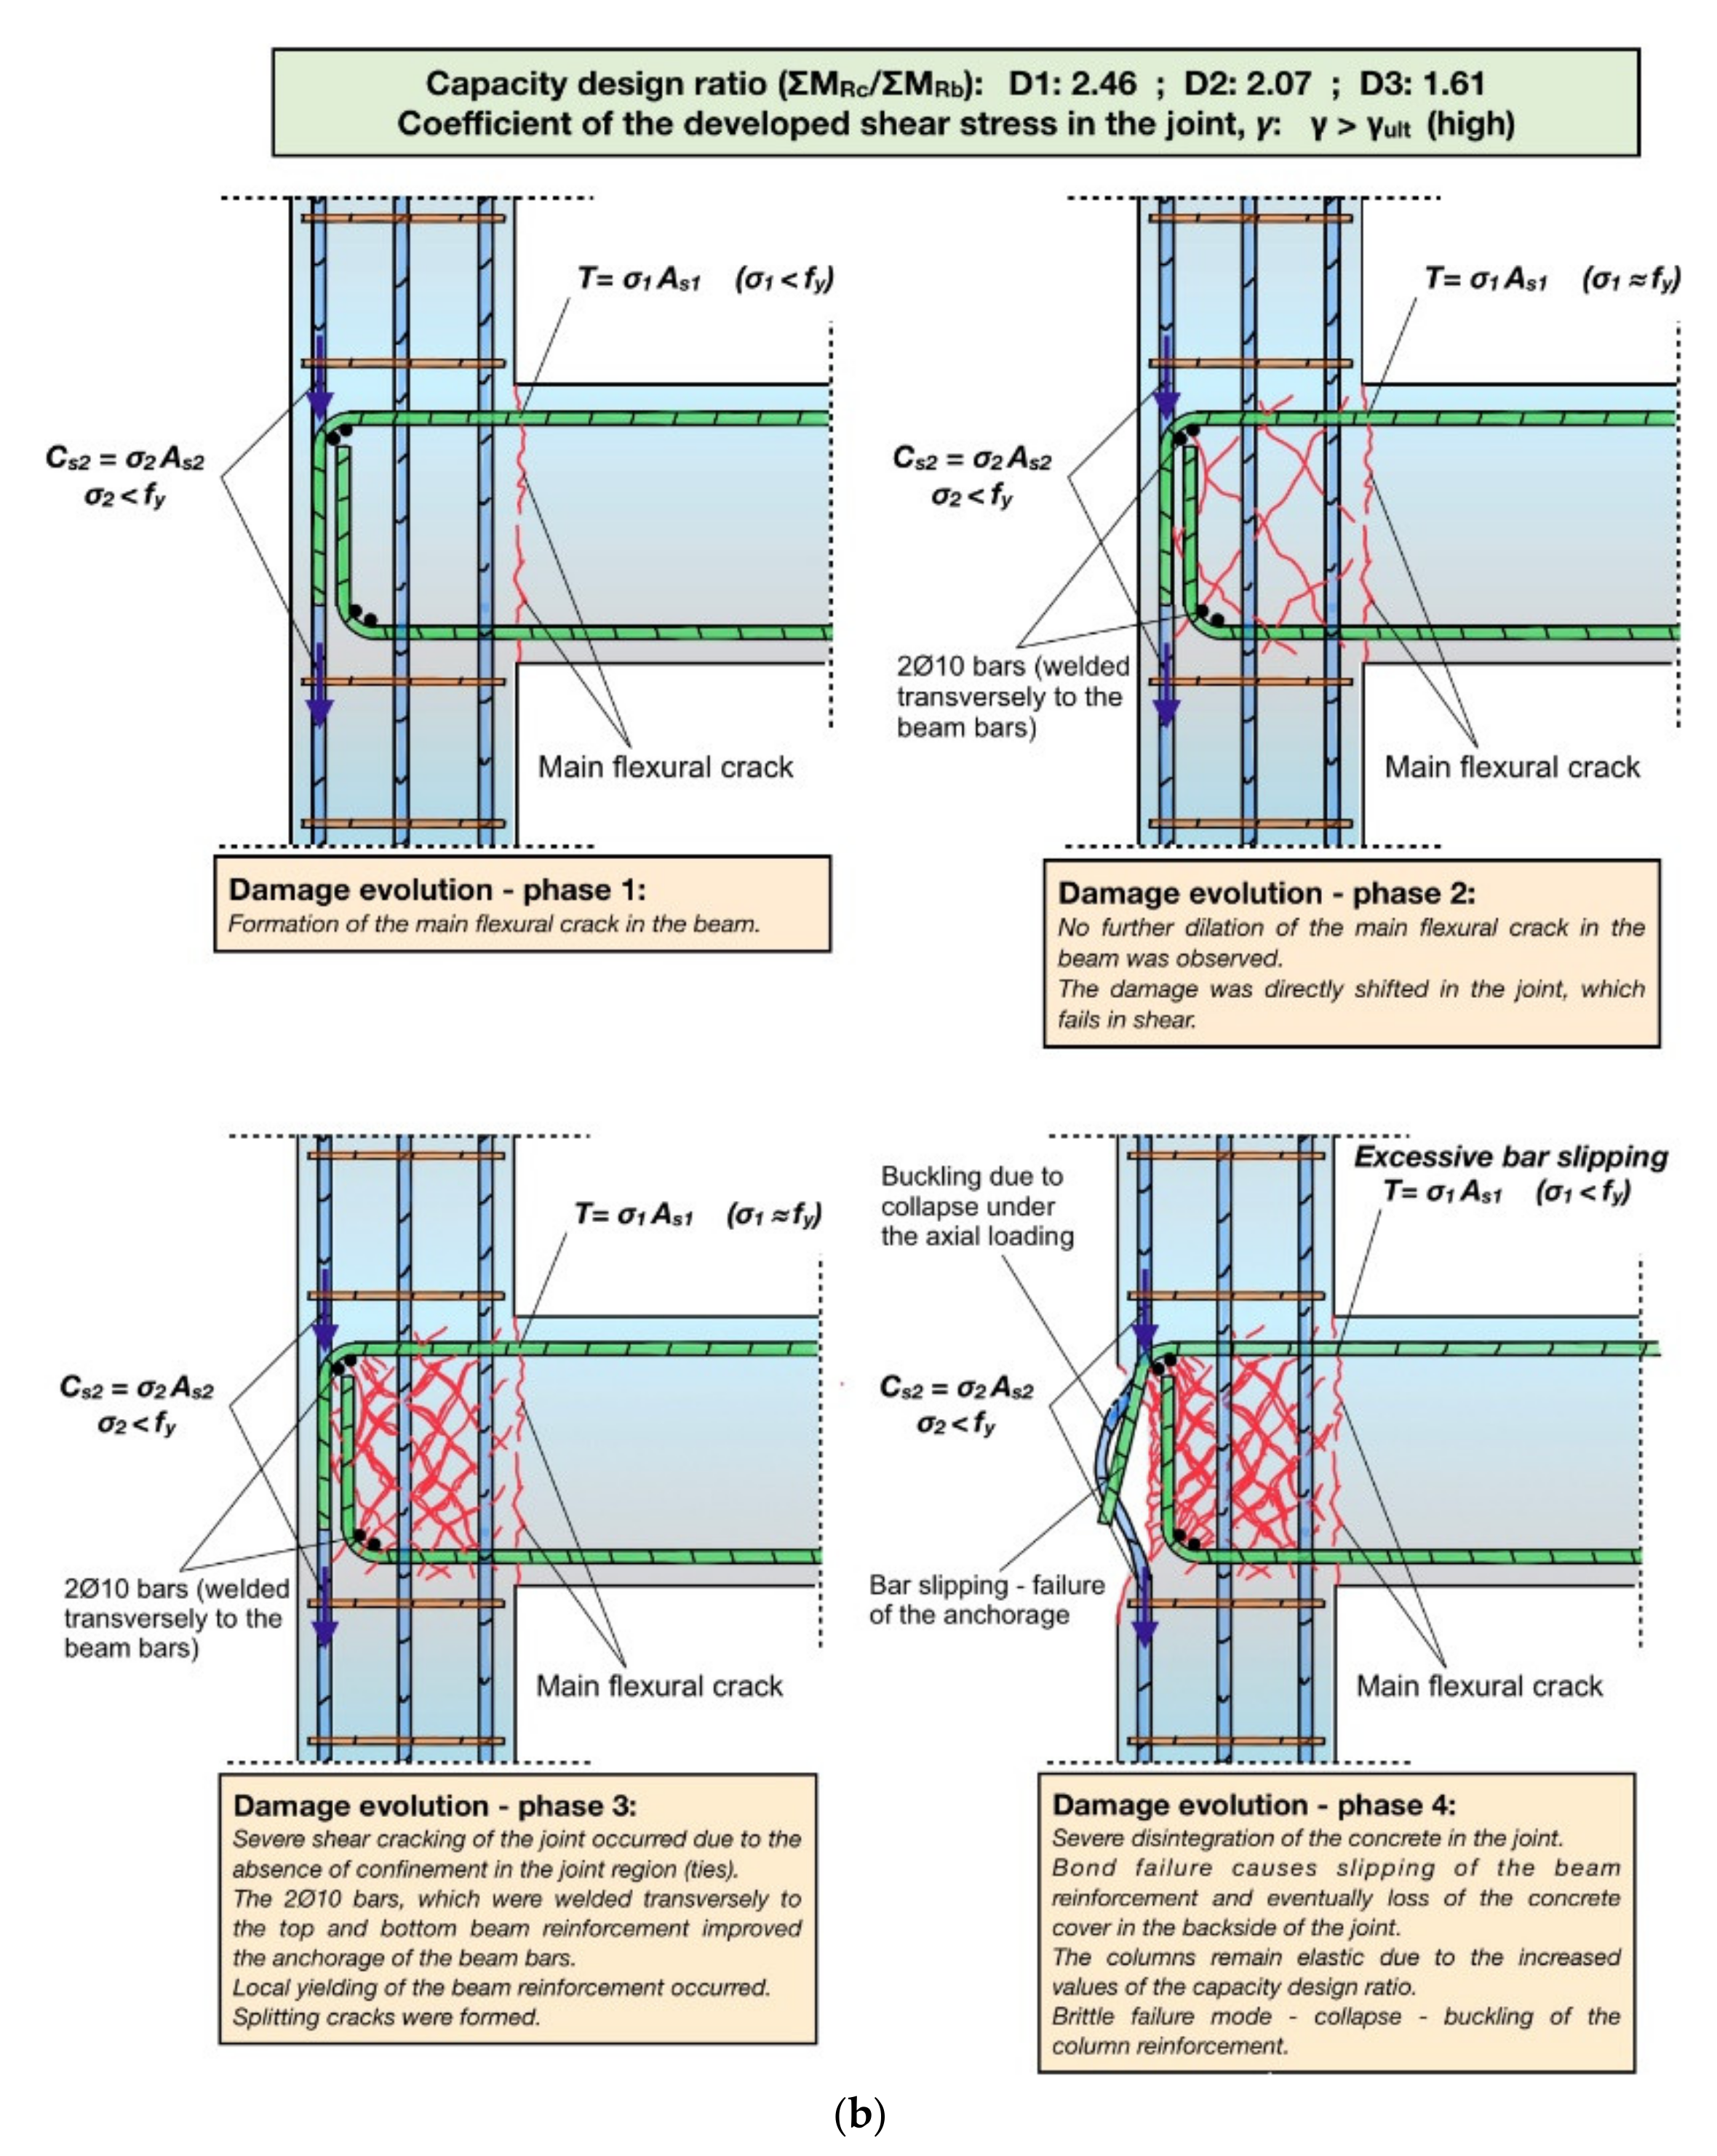
The capacity design ratios of subassemblages D 1 , D 2 , and D 3 were 2.46, 2.07, and 1.61, respectively. These values were significantly increased with respect to the required value by EC8, i.e., ΣMRc/ΣMRb > 1.30, especially in the case of specimens D 1   and D 2 . Moreover, the developed shear stresses in the joint region were particularly high, exceeding the ultimate shear capacities of the joints (γ > γult) (see Table 4). Hence, after the formation of the main flexural crack in the beam in the vicinity of the joint (see Figure 9b, Phase 1), the damage was shifted and concentrated solely in the joint region, which failed in shear (see Figure 9b, Phase 2). However, contrary to subassemblages D C M _ 1 , D C M _ 2 , and D C M _ 3 , which were confined with a significant number of horizontal ties in the joint region, the joints of D 1 , D 2 , and D 3 were totally unconfined. As a result, the joint shear damage evolved rapidly and excessive disintegration of the core concrete occurred (see Figure 9b, Phase 3). The latter also caused severe deterioration of the bond conditions between the longitudinal bars of the beam and the surrounding concrete, which eventually resulted in bond–slip failure and excessive slipping of the bars. This is clearly reflected by the descending strain values during the consecutive cycles of the earthquake-type loading (see Figure 8g). It is noteworthy that due to the increased values of the capacity design ratio, the columns over and under the joint of specimens D 1 , D 2 , and D 3 still remained elastic, while no splitting cracks were formed along the column longitudinal rebars in the joint region. Thus, the loss of the concrete cover in the back side of the beam–column joint specimens (see Figure 9b, Phase 4) was caused by the slipping of the beam’s longitudinal reinforcement, which was adversely affected by the absence of horizontal ties in the joint region. Eventually, the significant reduction of the cross-section area of the joints resulted in the collapse of the subassemblages due to the loss of the axial load carrying capacity. The latter caused buckling of the longitudinal column reinforcement (see Figure 6d–f and Figure 9b). Consequently, although local yielding of some of the longitudinal beam bars may not be precluded (see Figure 8h), the seismic performance of specimens D 1 , D 2 , and D 3   was indisputably dominated by the explosive brittle shear failure of the joint region, which resulted in catastrophic collapse. This extremely dangerous failure mode caused many collapses of existing pre-1960s–1970s RC buildings during moderate-to-strong earthquake events worldwide.

3.3. Theoretical Considerations

Strong seismic excitations of the last sixty years revealed numerous serious structural deficiencies of RC structures built in the 1960s and 1970s (or previously) worldwide, owed mainly to lack of capacity design approach and/or poor detailing of reinforcement. For instance, the beam–column joint regions of these buildings were often found to be totally unconfined, in turn possessing minimal lateral strength, poor deformability and, hence, low ductility. As a result, damage of the joint regions incurred by earthquakes triggered brittle shear failure mechanisms while causing loss of structural integrity and catastrophic partial or general collapse [1,36,37,38,39,40,41,42,43,44,45,46,47]. Undesirable brittle earthquake damaging of beam–column connections has also been developed in many cases of modern RC frame structures, incorporating full seismic detail according to current building codes [13,14]. This clearly indicates that during future earthquakes, not only are the pre-1960s–1970s RC structures extremely susceptible to collapse because of beam–column joints’ failure, but the hysteresis behavior and safety of modern RC structures may be jeopardized as well due to premature joint shear damaging.
An analytical formulation for effectively preventing the collapse of RC buildings subjected to a large number of reversed inelastic lateral displacements was proposed by Tsonos [14,48]. The model ensures not only the formation of plastic hinges in the beams but also the final concentration of damage in these elements, while the columns and the joints remain intact during an earthquake. In particular, the ultimate shear capacity of the beam–column joint region is initially computed and is subsequently compared to the value of the connection’s shear stress developed when yielding of the beam longitudinal reinforcement is achieved. Therefore, the model accurately predicts whether the joint fails earlier than the beam or not. Moreover, during a strong seismic excitation, the shear forces acting in the beam–column joints are significantly higher than those acting in the adjacent columns [49]. As a result, the joints fail earlier than the adjacent columns. It is noteworthy that the prediction of the actual values of connections’ shear stresses during an earthquake also involves predicting the actual values of the structures’ flexural strength ratio, MR, with the same accuracy. Consequently, a model that precisely predicts the value of the joint’s shear stress could also generally predict the actual values of shear forces and moments resisted by the structures in the beams and columns, in the vicinity of the joint region during strong earthquakes.
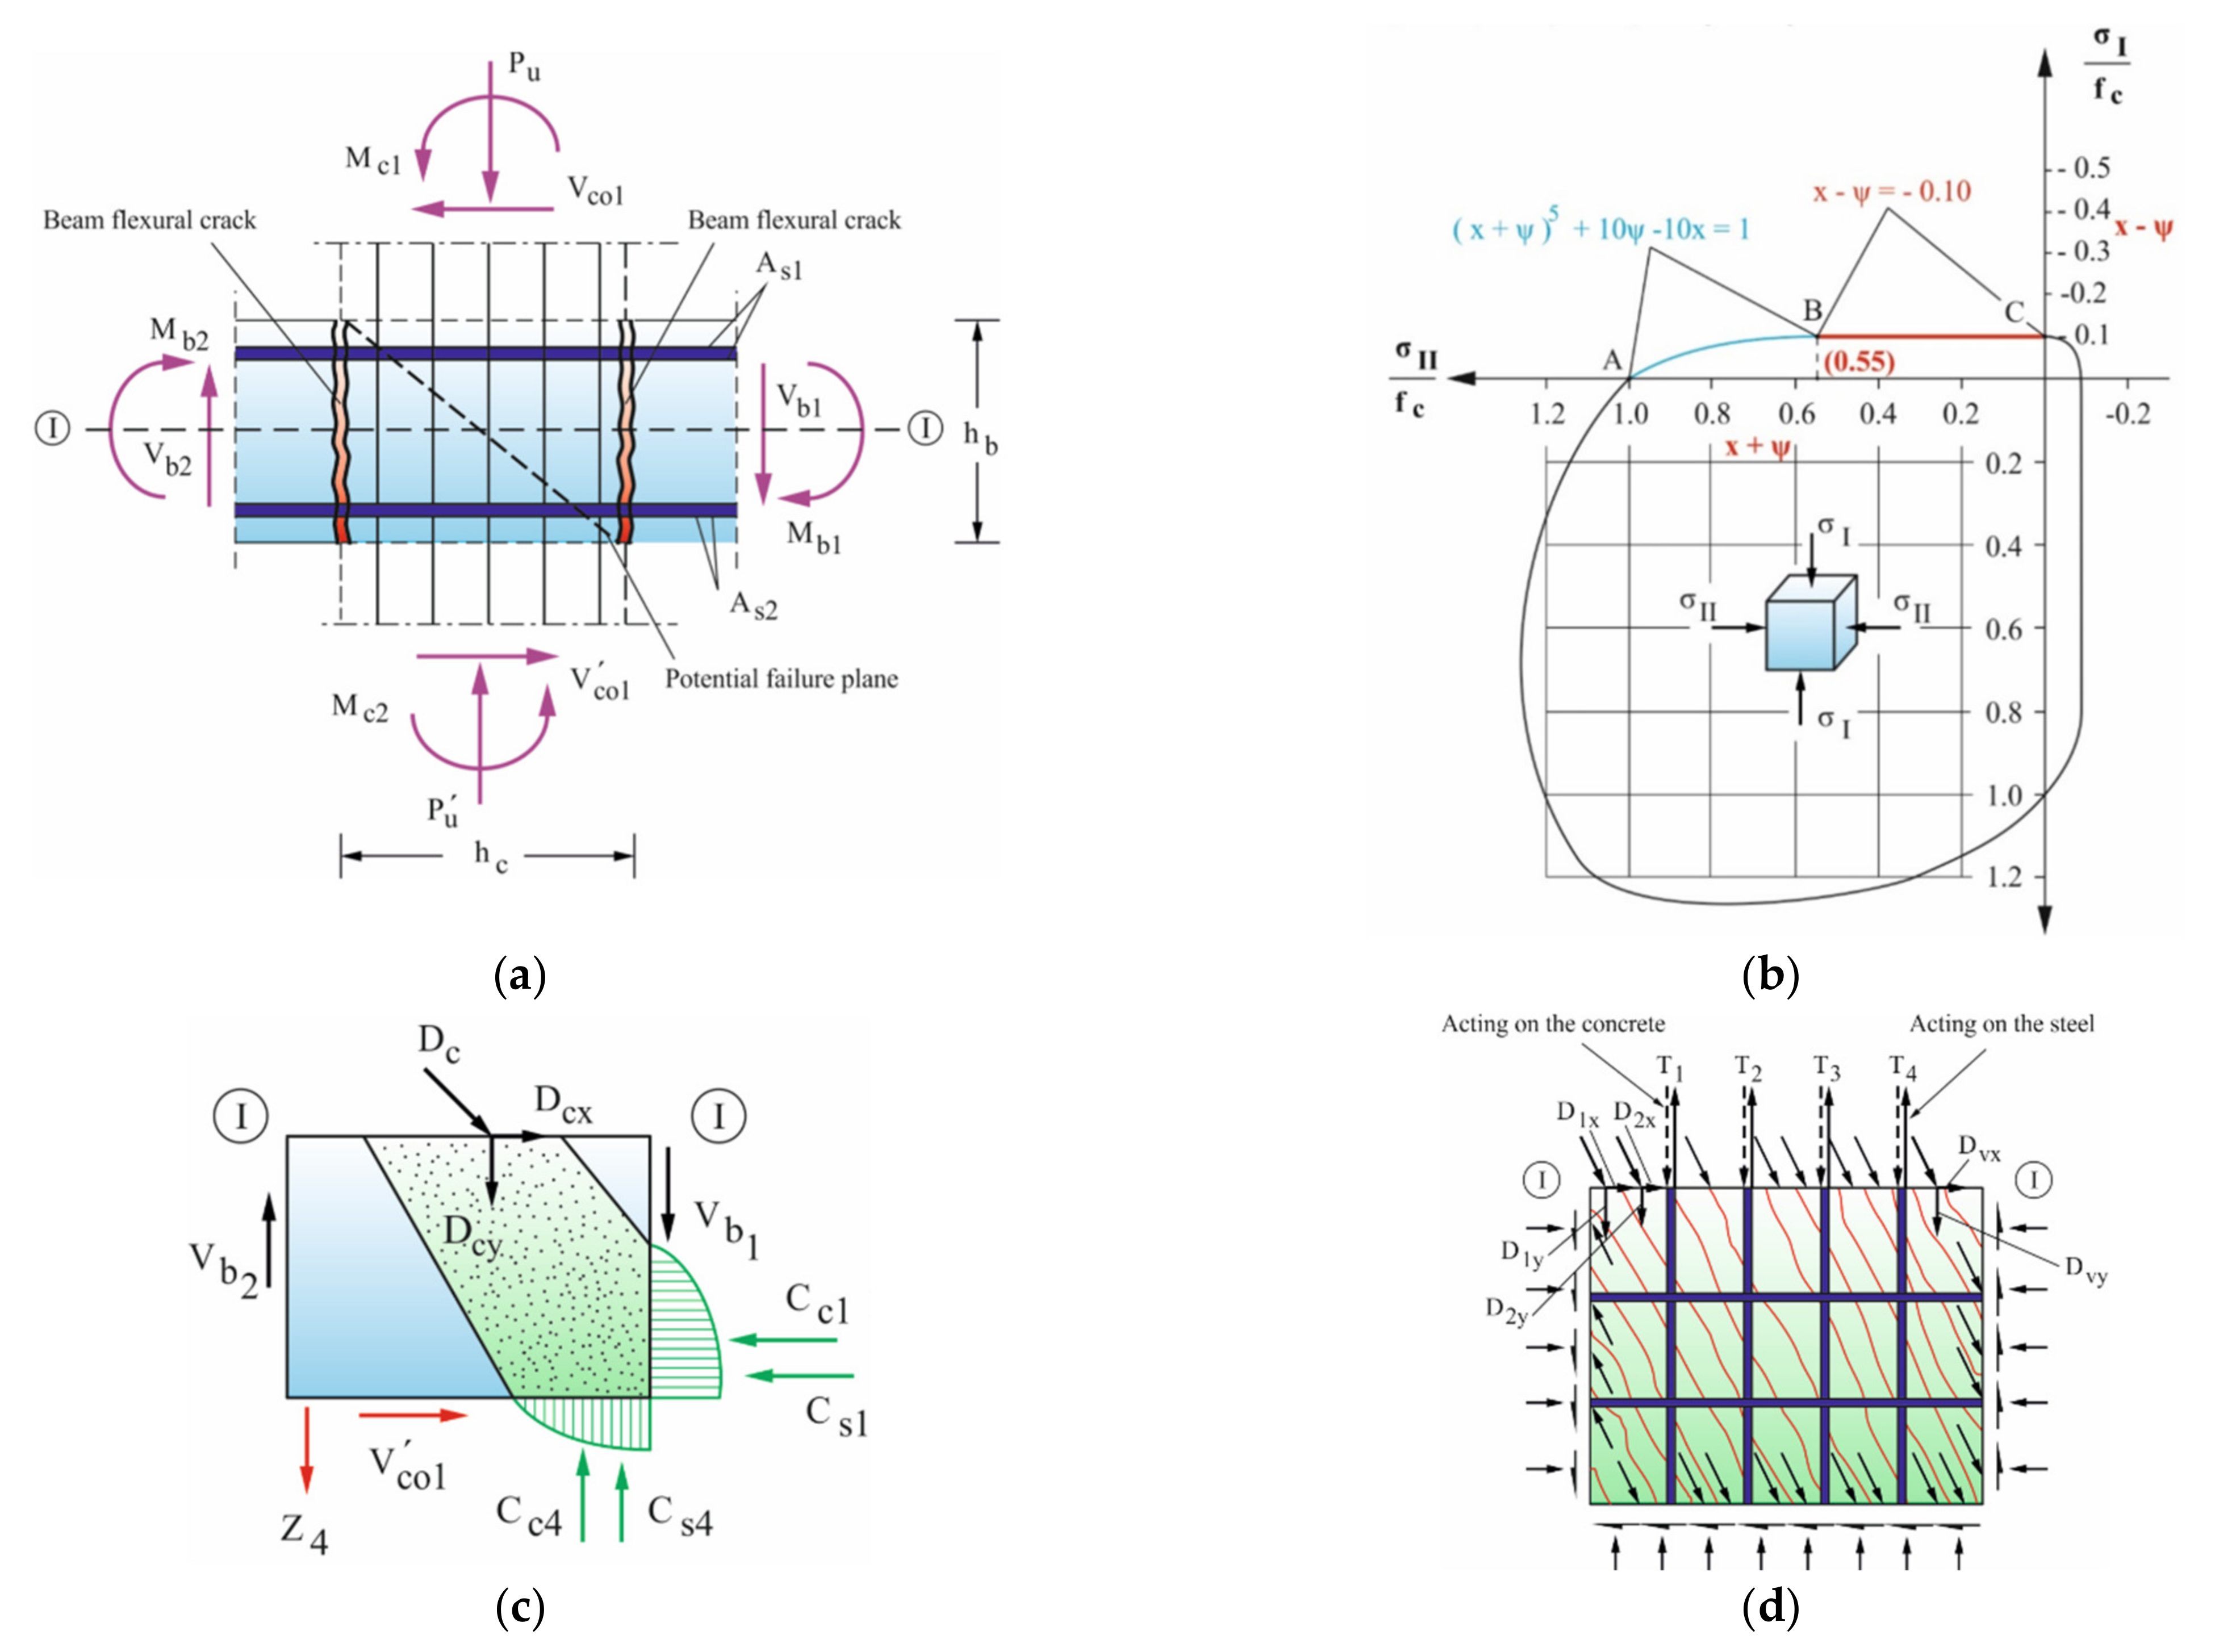
According to the analytical model, which was thoroughly explained by Tsonos [48], the shear forces acting in the core of a beam–column joint of a moment resisting RC frame during a seismic event are resisted in two ways, i.e., (i) partly by a diagonal compression strut acting between diagonally opposite corners of the joint core and (ii) partly by a truss mechanism formed by horizontal and vertical reinforcement and concrete compression struts. Therefore, the ultimate concrete strength of the joint core under tension/compression controls the ultimate strength of the connection, while after concrete failure the strength is limited by the gradual crushing along the cross-diagonal cracks, especially along the potential failure planes (see Figure 10a). In a previous work of Tsonos [48], the main equation for calculating the ultimate joint shear strength, a fifth degree parabola (Equation (4)), was simplified and satisfactorily substituted with a linear equation (Equation (7)), with negligible effect on the results. The joint ultimate strength, τ u l t = γ u l t f c   M P a , depends both on the increased joint concrete compressive strength, fc, (Equations (8) and(9)) due to the confining described in [31] and also on the aspect ratio α. Thus, the solution of the system of Equations (4)–(7) for a given value of the joint aspect ratio gives the ultimate shear strength, τ u l t , using standard mathematical analysis. The acting calculated joint shear stress is expressed as τ c a l = γ c a l f c (in MPa). It is calculated from the horizontal joint shear force, assuming that the top beam reinforcement yields. In Equations (4)–(7), fc is the concrete compression strength; fc is the increased joint concrete compressive strength due to confinement [31]; fyh is the yield strength of the horizontal hoops; and ρs is the volume ratio of transverse reinforcement.
In Table 4, the experimental and predicted values of concrete shear stress in the potential failure plane of subassemblages DCM_1, DCM_2, DCM_3, D1, D2, and D3 are summarized. When the calculated joint shear stress τ c a l is greater or equal to the ultimate strength, τ u l t , then the predicted actual value of connection’s shear stress, τ p r e d , is expected to be near τ u l t because the connection fails earlier than the adjacnt beam(s)” should be used. Otherwise, when the calculated joint shear stress τ c a l is lower than the connection’s ultimate strength, τ u l t , then the predicted actual value of connection’s shear stress, τ p r e d , should be near τ c a l , while the connection permits yielding of reinforcement of the adjacent beam. The implementation of the analytical formulation allowed for the successful prediction of the failure mode of the specimens, which in all cases included undesirable premature brittle shear failure of the joint region (see Table 4).
x + ψ 5 + 10 ψ 10 x = 1
x = α · γ 2 f c
ψ = α · γ 2 f c 1 + 4 α 2
x ψ = 0.1
f c = k · f c
k = 1 + ρ s · f y h f c

3.4. Use of Steel Fiber Reinforced Concrete for Reducing Conventional Reinforcement

From the performed experimental and analytical investigation, it was clearly demonstrated that the seismic behavior of RC beam–column connections depends on both the capacity design ratio value and on the value of coefficient γ of the joint shear stress. In fact, if the developed shear stress in the joint region is higher than half the value of the ultimate shear capacity, τult, the shear cracking of the joint cannot be precluded even for significantly higher capacity design ratio values than the required one by the EC8, regardless of the number of ties used to confine the joint. This results from the inherent low tensile strength of the concrete. Therefore, an attempt was made herein to prevent brittle failure modes and to secure the ductile seismic performance of the beam–column joints while also reducing the transverse steel reinforcement significantly. The latter was achieved by using steel fiber reinforced concrete instead of the conventional reinforced concrete, which is an innovative material with improved tensile strength.
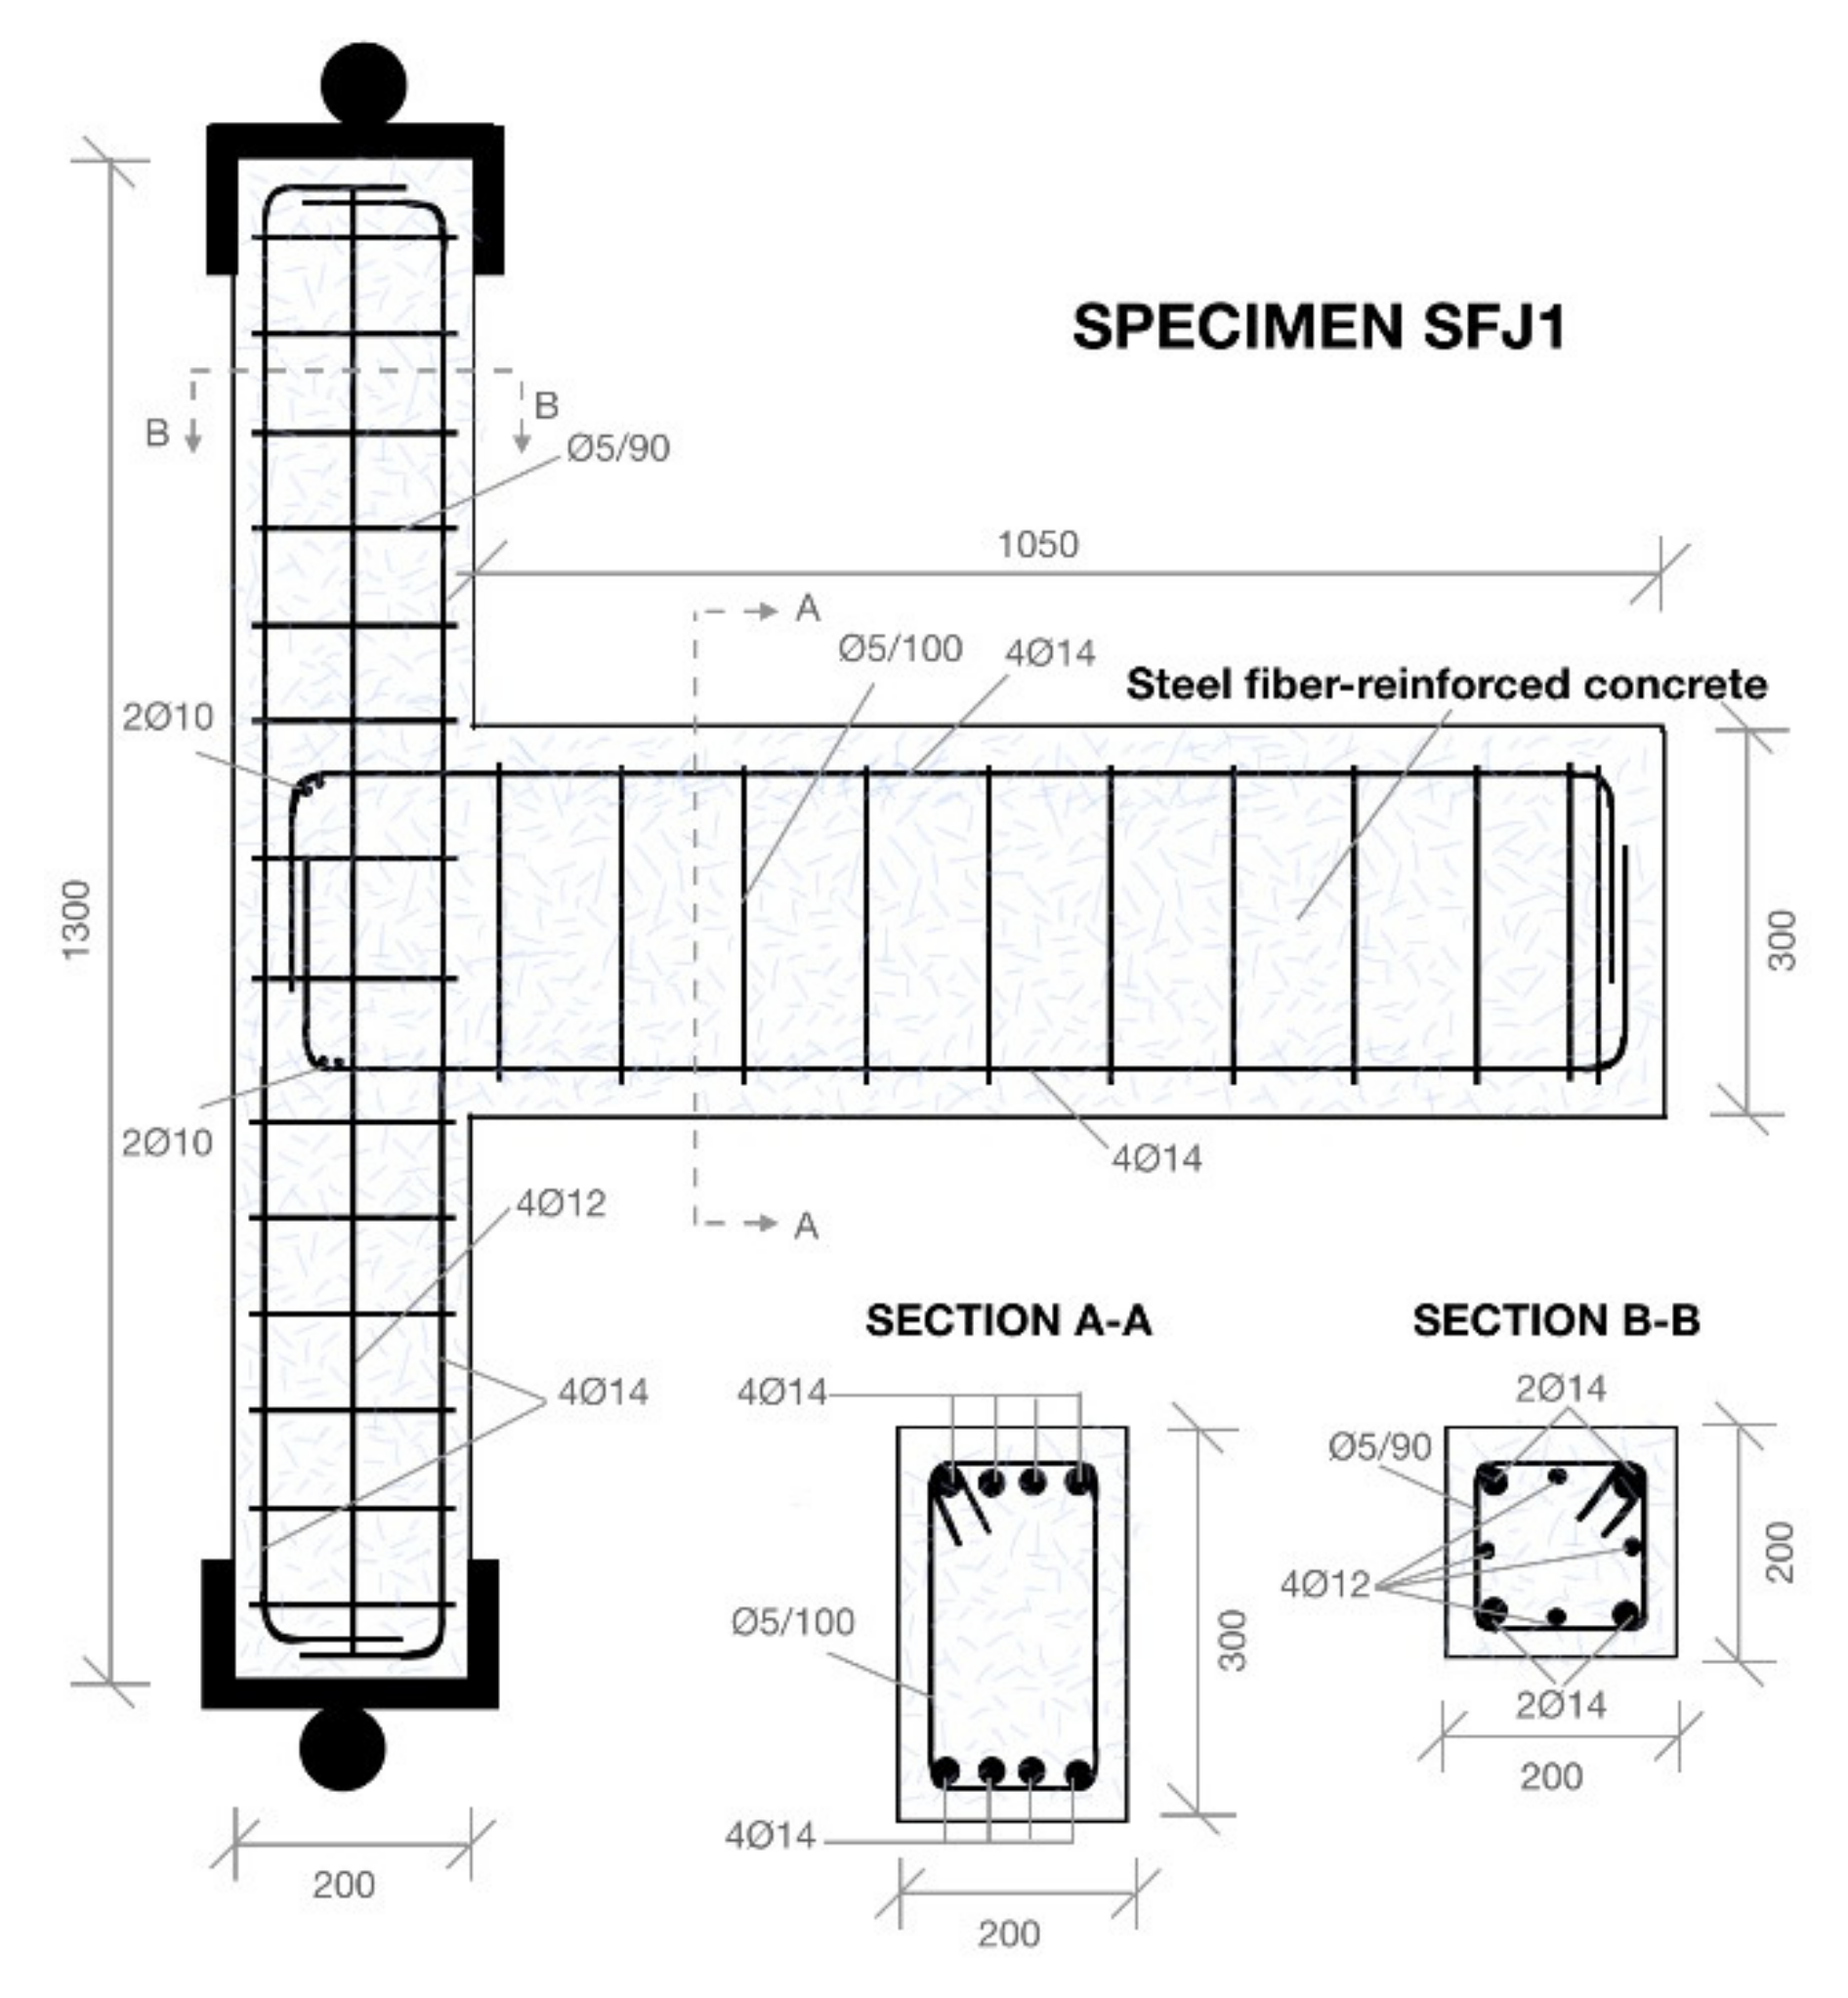
In particular, a beam–column joint subassemblage with similar cross-sectional dimensions as specimen D C M _ 1 but with significantly reduced transverse steel reinforcement was constructed with steel fiber reinforced concrete of 20 MPa compressive strength (see Figure 11). The specimen was designated SFJ1 and had the same longitudinal reinforcement in the columns and the beam as specimen D C M _ 1 . However, the transverse reinforcement in the joint region of SFJ1 consisted of only 2Ø5 B500C ties, while it was half the corresponding transverse reinforcement of D C M _ 1 in the columns and the beam. The steel fiber volume fraction ratio used for subassemblage SFJ1 was 1.5%. The steel fibers had a tensile strength (Rm,nom) of 1270 N/mm, a Young’s modulus of ±210,000 N/mm2, a length (l) of 30 mm, diameter (d) of 0.62 mm, and aspect ratio (l/d) of 45. Specimen SFJ1 was subjected to the same history of reversed lateral displacements as specimen
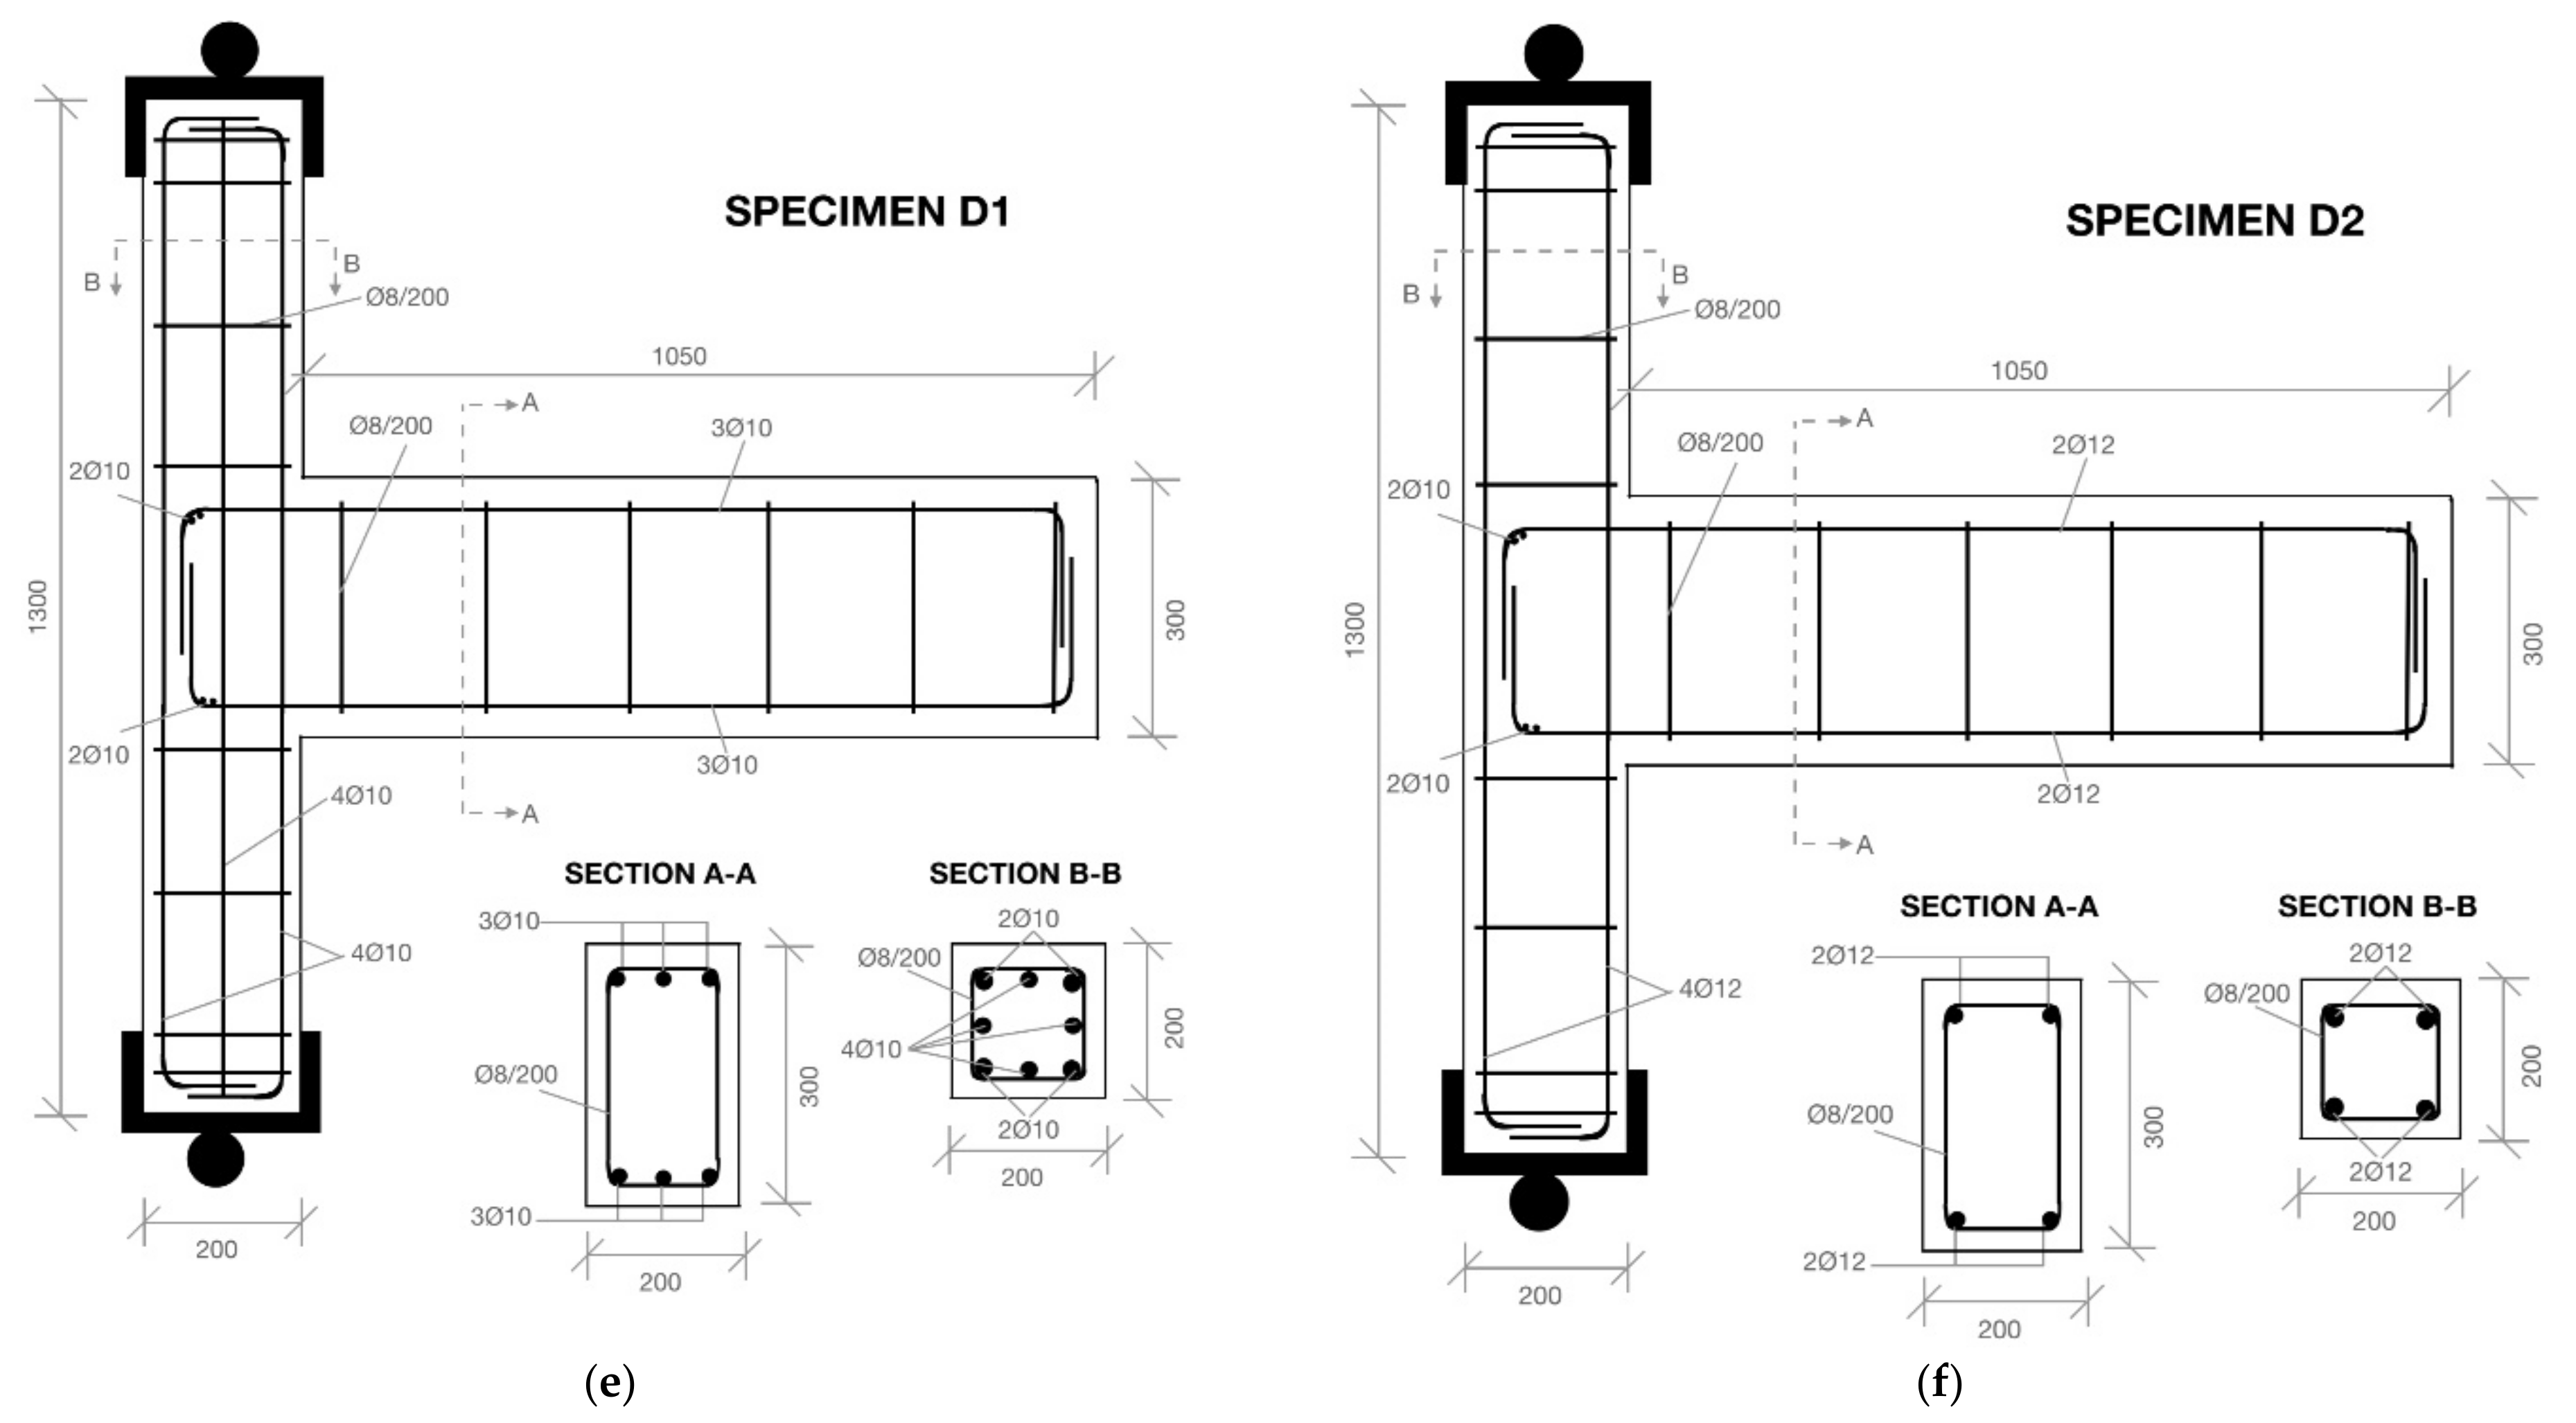
 D C M _ 1 , depicted in Figure 2b.
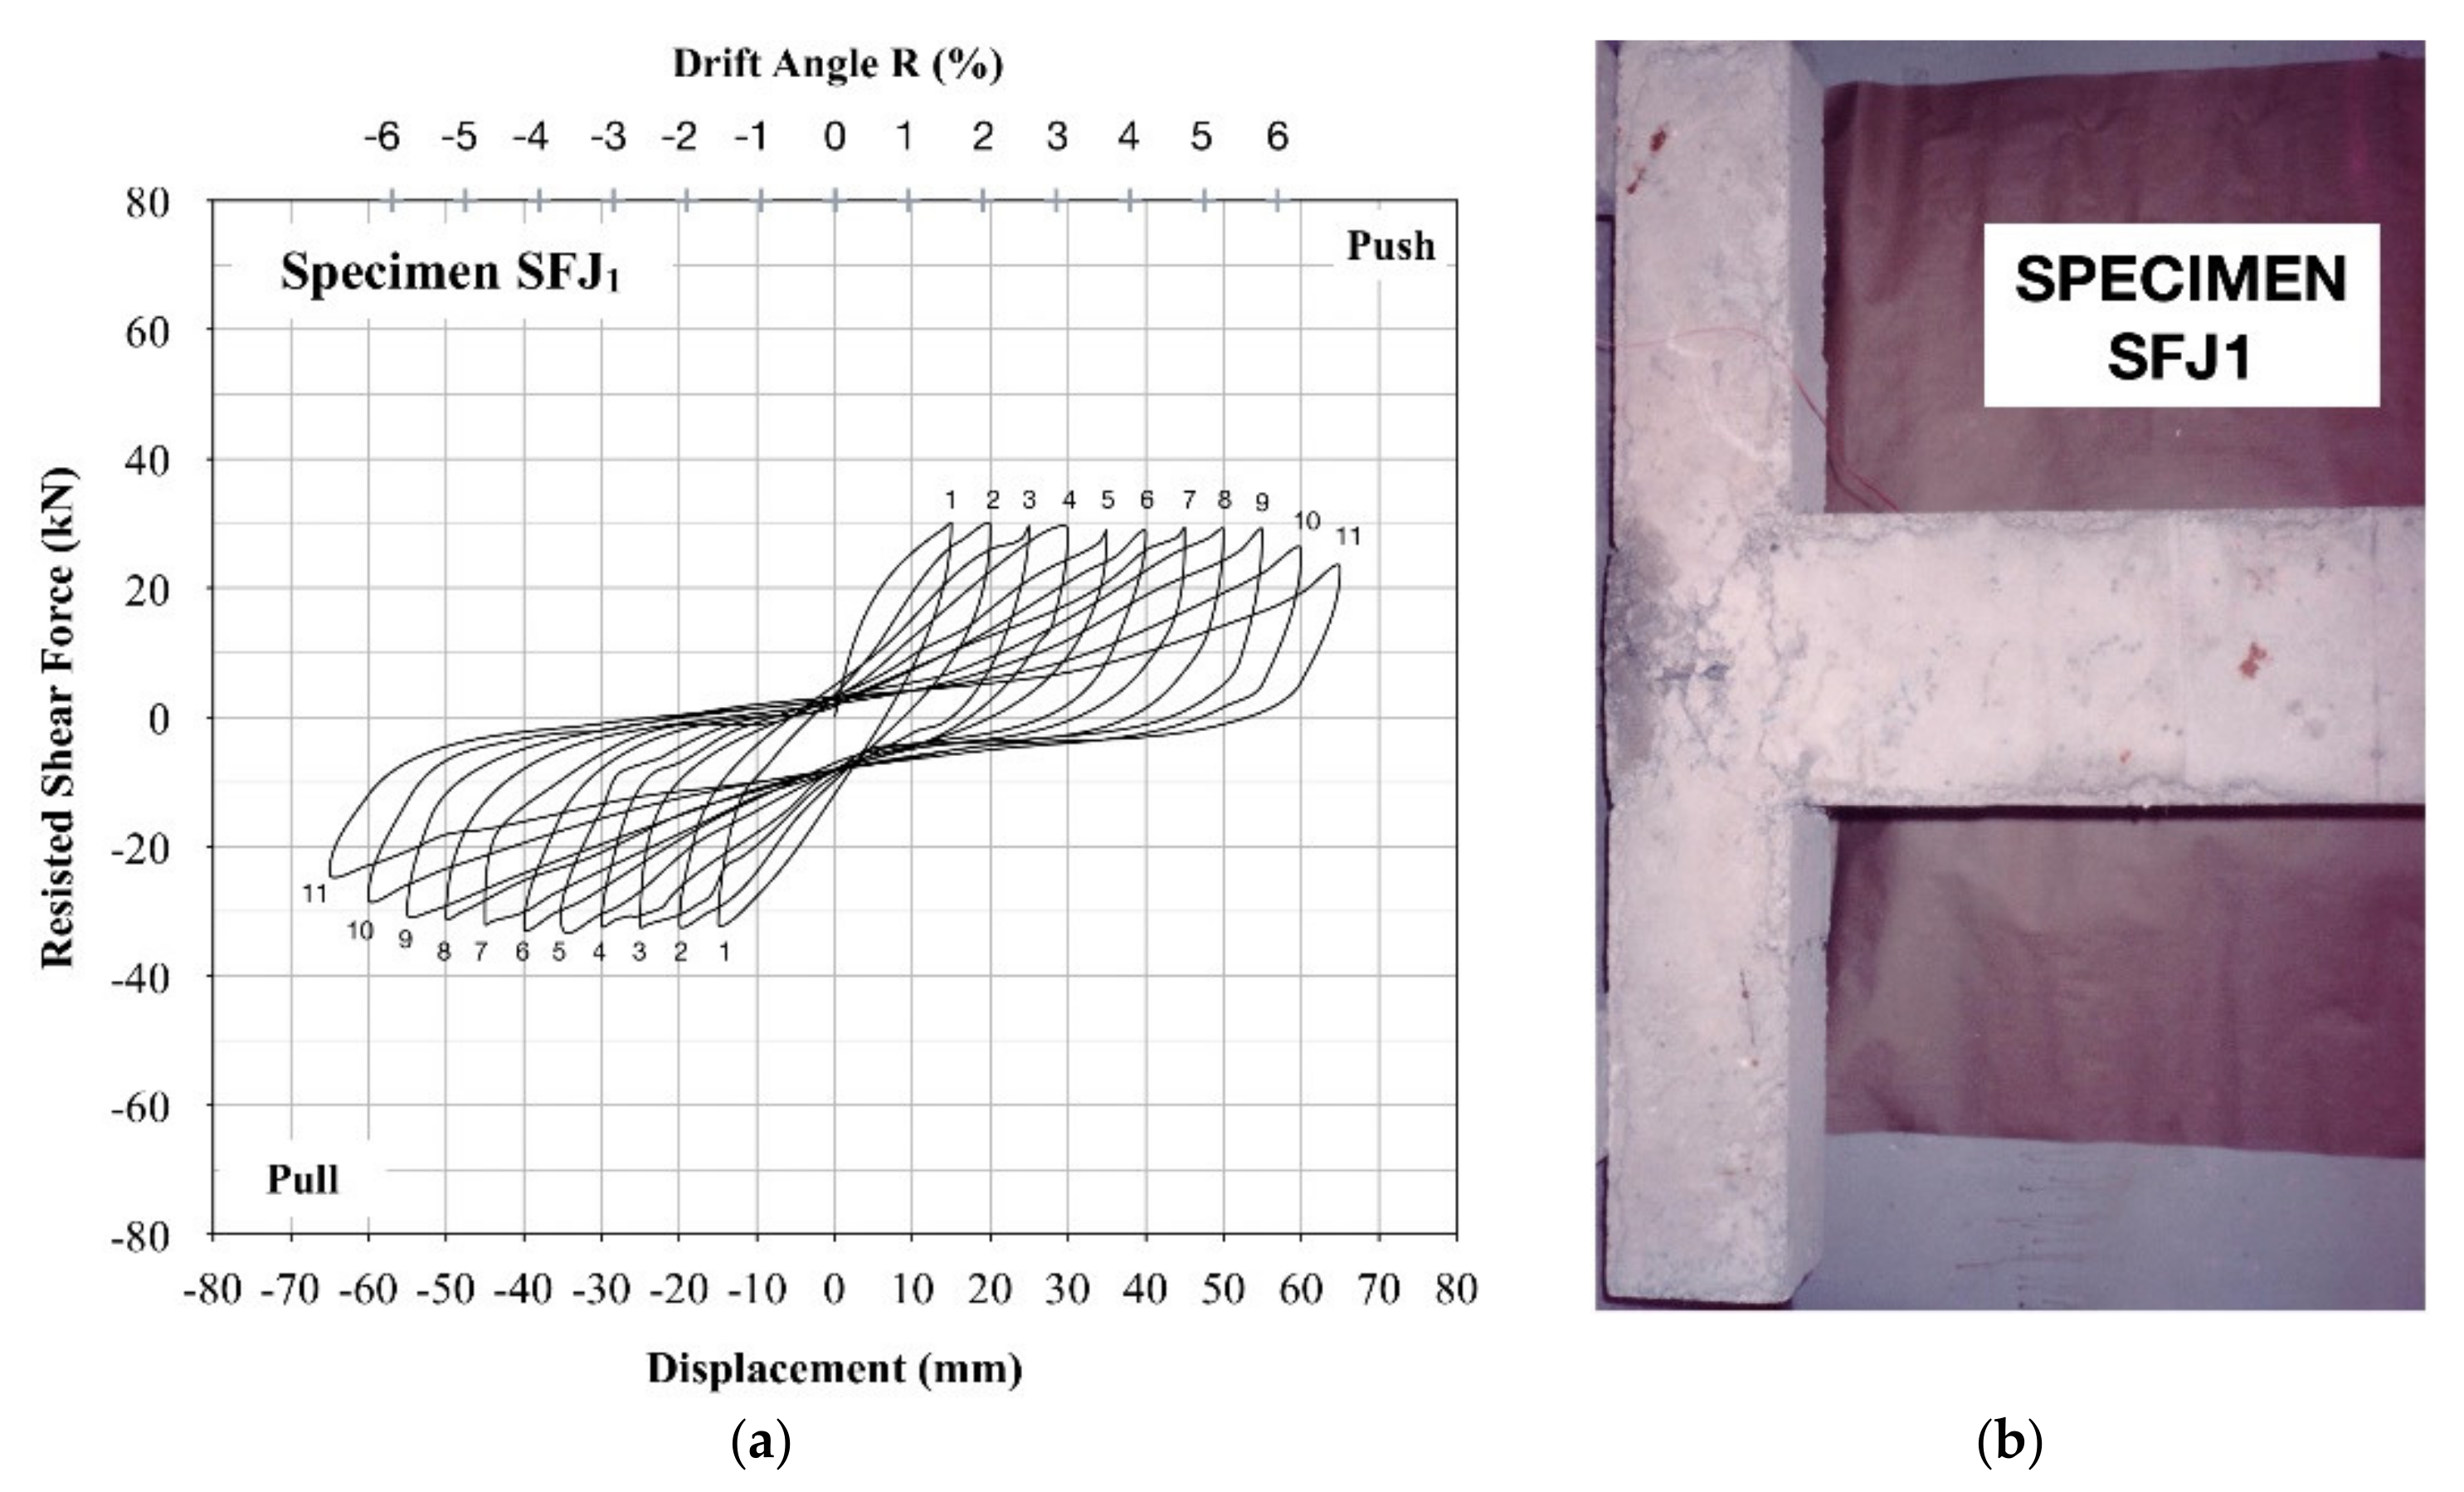
From the plots of resisted shear force versus displacement of subassemblages SFJ1 and D C M _ 1 (shown in Figure 3a and Figure 12a, respectively), it was clearly demonstrated that specimen SFJ1 achieved an indisputable superiority in the hysteresis behavior with respect to D C M _ 1 . In particular, SFJ1 exhibited a dissipating hysteresis response with continuously increasing values of dissipated seismic energy during the consecutive cycles of loading (see Figure 12a and Figure 13b), while preserving its lateral bearing capacity. Moreover, SFJ1 showed increased lateral resistance with respect to D C M _ 1 . For instance, the values of the resisted shear force of SFJ1 were 27.66% and 43.18%, which show an increase compared to the corresponding values of specimen D C M _ 1 during the first push half-cycle and pull half-cycle of loading, respectively. The corresponding values at the end of the 11th push half-cycle and the 11th pull half-cycle of loading were 88.8% and 70.4%, respectively. At the end of testing, SFJ1 retained 76.67% (11th push half-cycle) and 75% (11th pull half-cycle) of its initial lateral bearing strength during the first cycle. The corresponding values for subassemblage D C M _ 1 were 54.47% and 59.06%, respectively (see Figure 12a and Figure 14a).
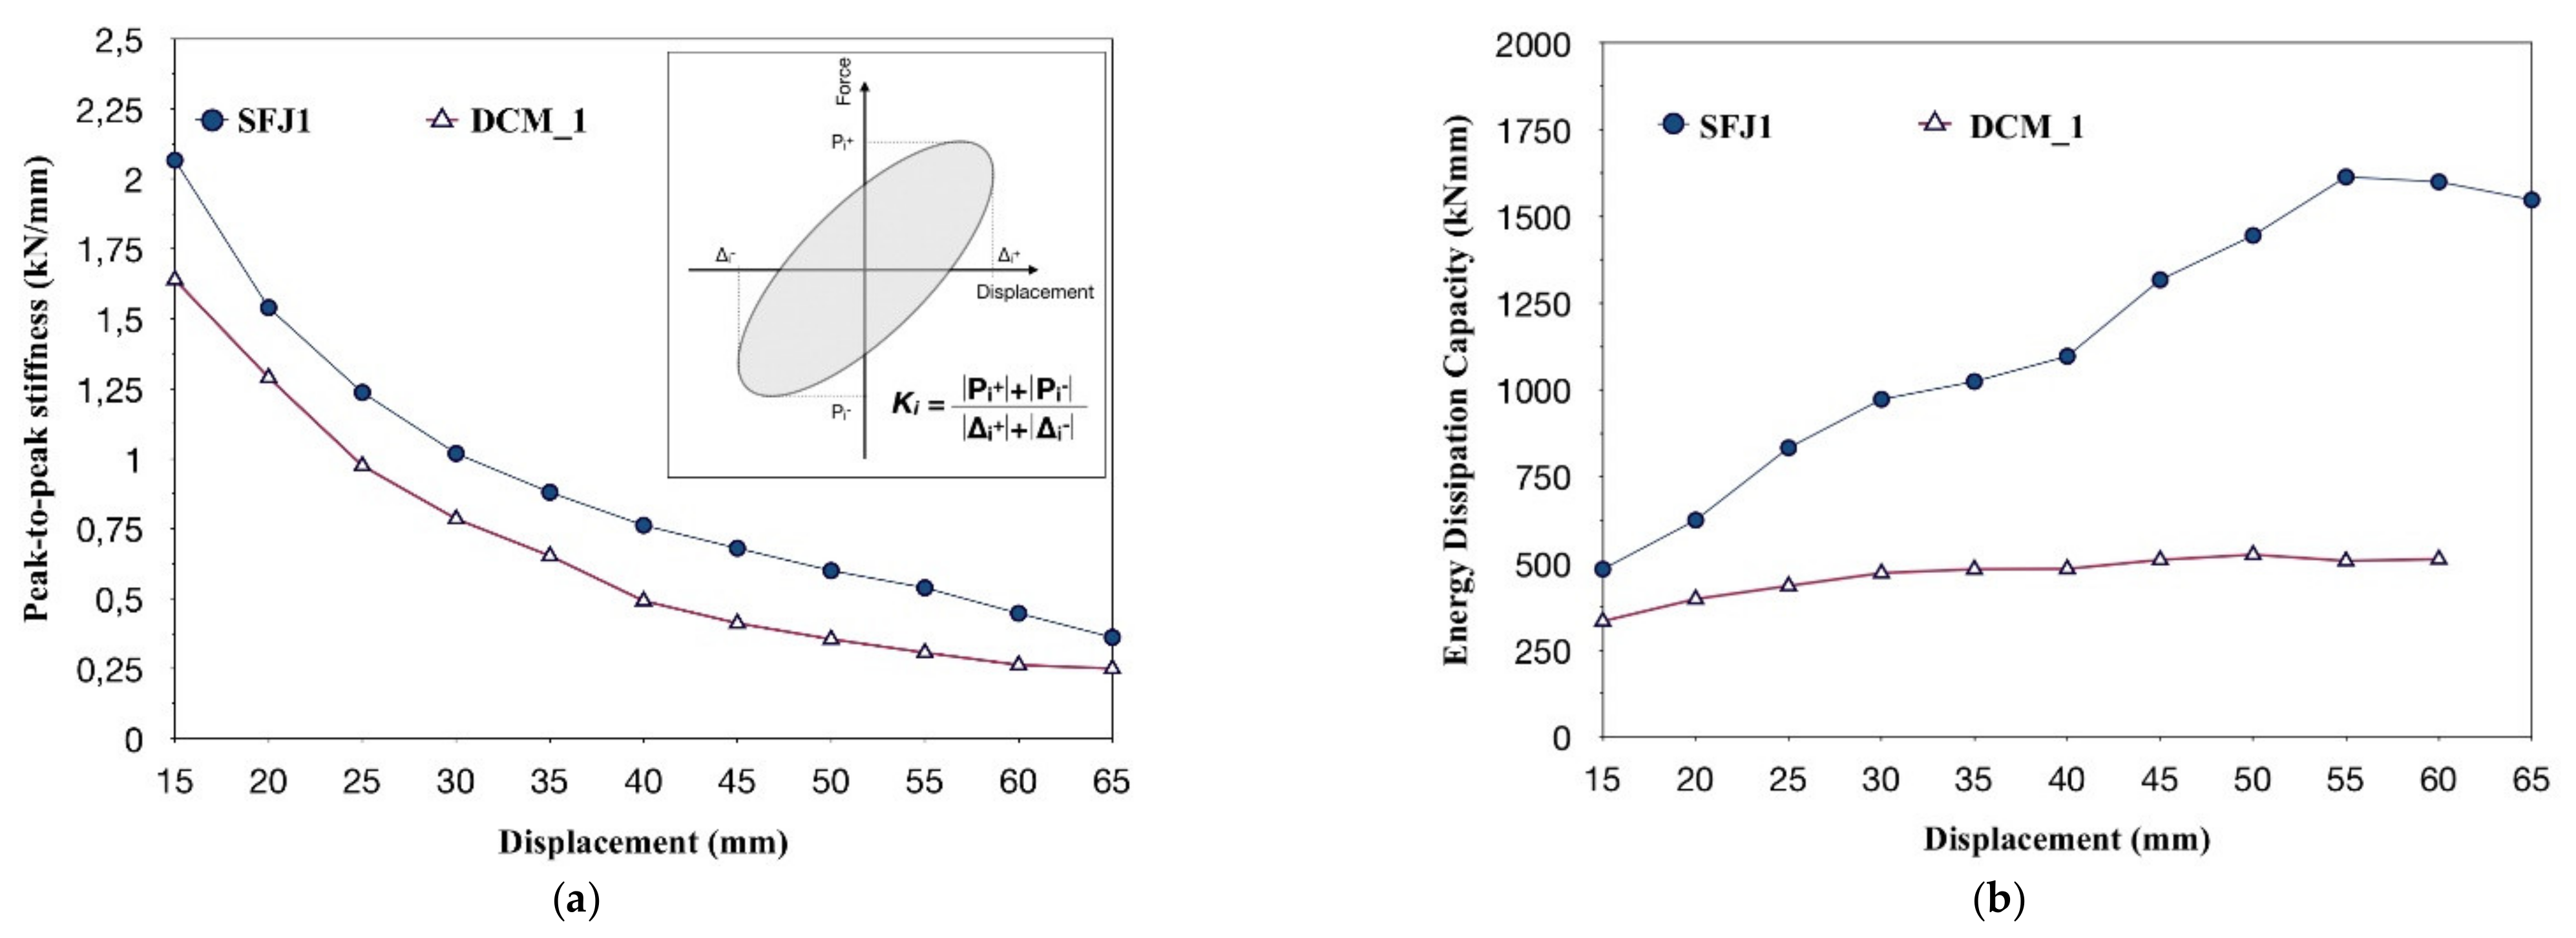
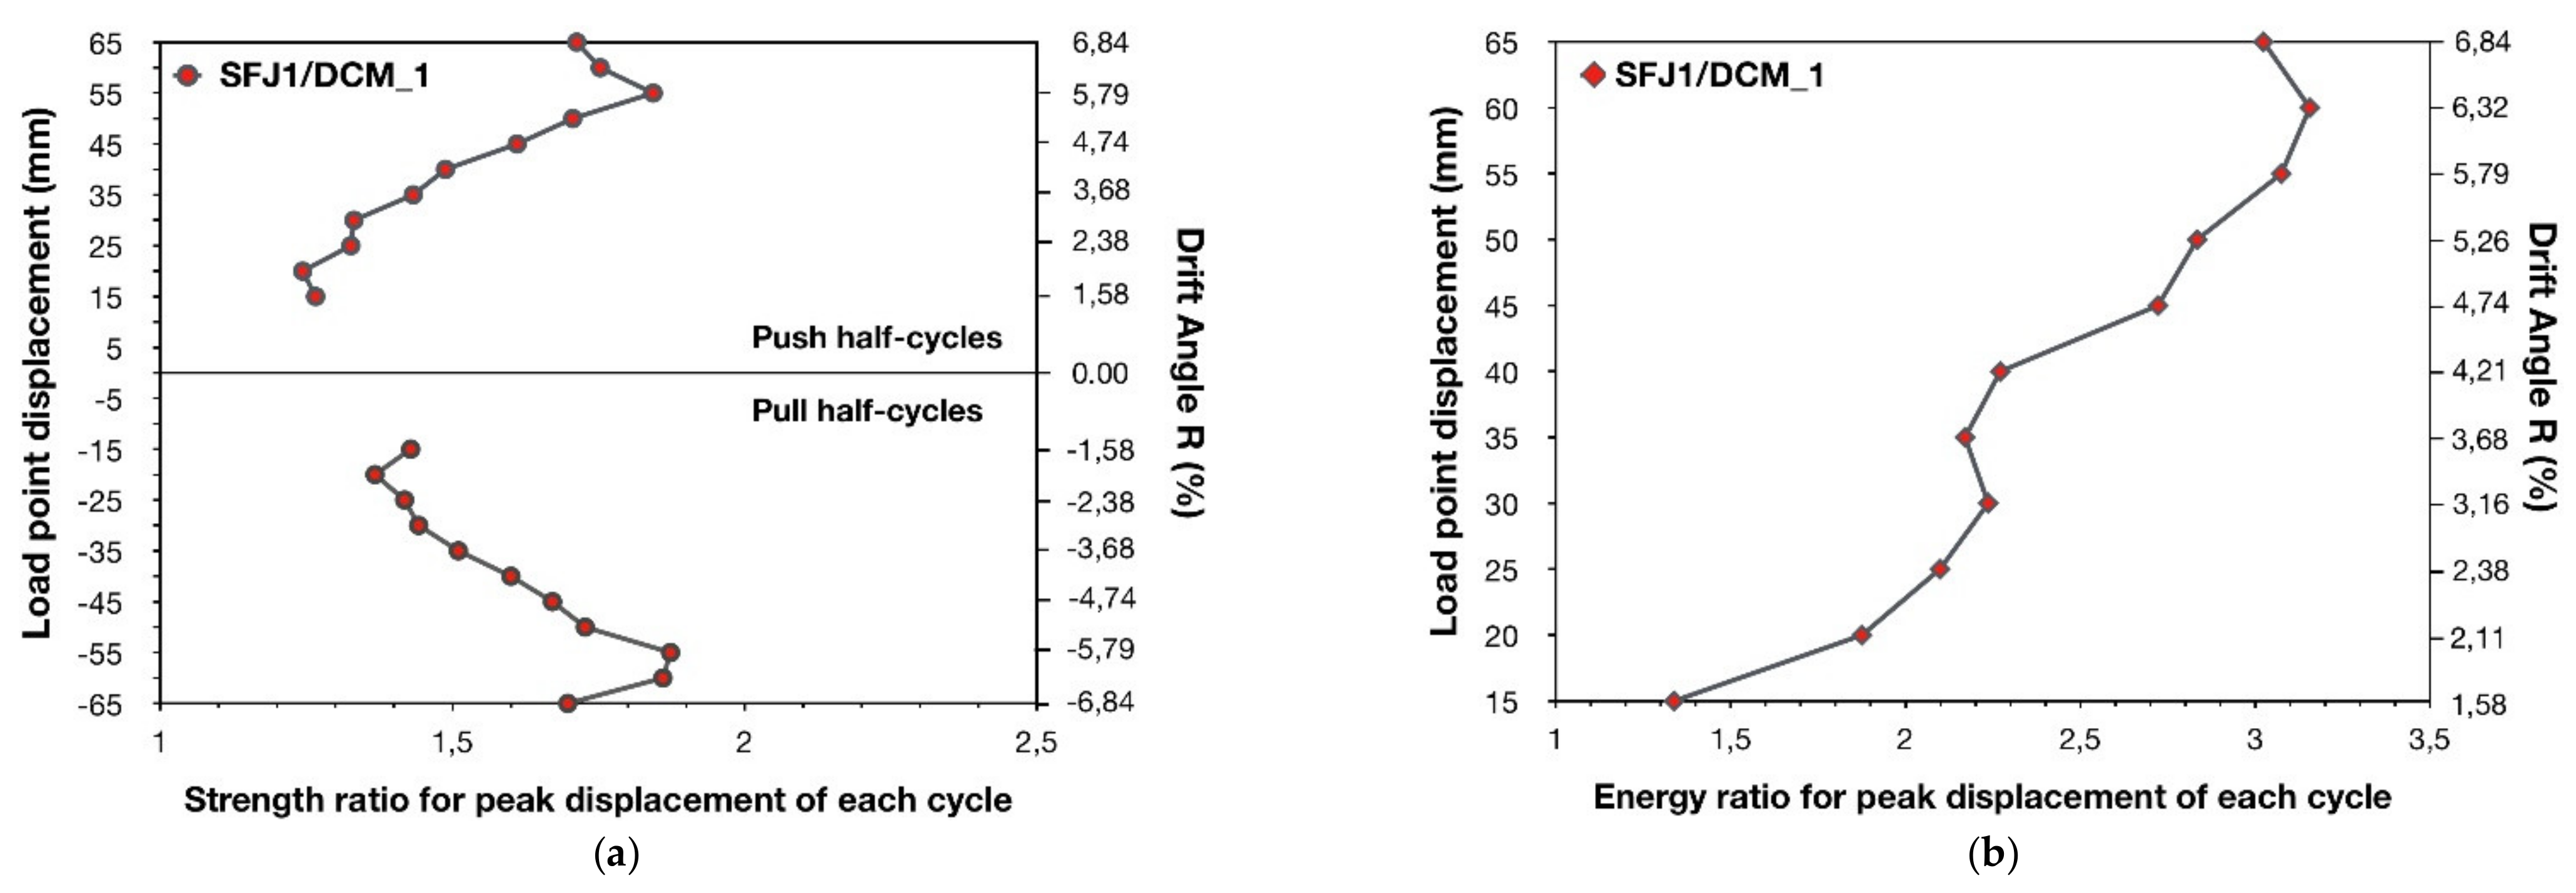
A significant increase in the peak-to-peak stiffness values of specimen SFJ1 was also achieved with respect to the values of D C M _ 1 (see Figure 13a). For instance, the peak-to-peak stiffness ratio value SFJ1/ D C M _ 1 during the first cycle of the earthquake-type loading was 1.26 while at the end of testing the corresponding ratio value was 1.45.
In Figure 14b the energy dissipation capacity ratio SFJ1/ D C M _ 1 for peak displacement of each cycle versus load point displacement is illustrated. As can be observed, the energy dissipation capacity of subassemblage SFJ1 was substantially improved with respect to that of D C M _ 1 (see Figure 13b and Figure 14b). For instance, during the earthquake-type loading, the energy dissipation ratio SFJ1/ D C M _ 1 ranged from 1.34 to 3.16, while for the lateral drift angle, R, equal to 6.84%, specimn SFJ1 dissipated, dissipated 302.34% more energy than D C M _ 1 . Despite the significantly lower number of ties found in the joint of specimen SFJ1 with respect to the ties of D C M _ 1 , the use of steel fiber reinforced concrete allowed for the dissipation of continuously incremental values of seismic energy during cycling. Indeed, a 220.41% increase in the amount of dissipated energy of SFJ1 was achieved after eleven cycles of loading with respect to the first cycle. Contrarily, the energy dissipation capacity of subassemblage D C M _ 1 was poor and stable during cycling due to the excessive damage of the joint, which failed in brittle shear (see Figure 15b).
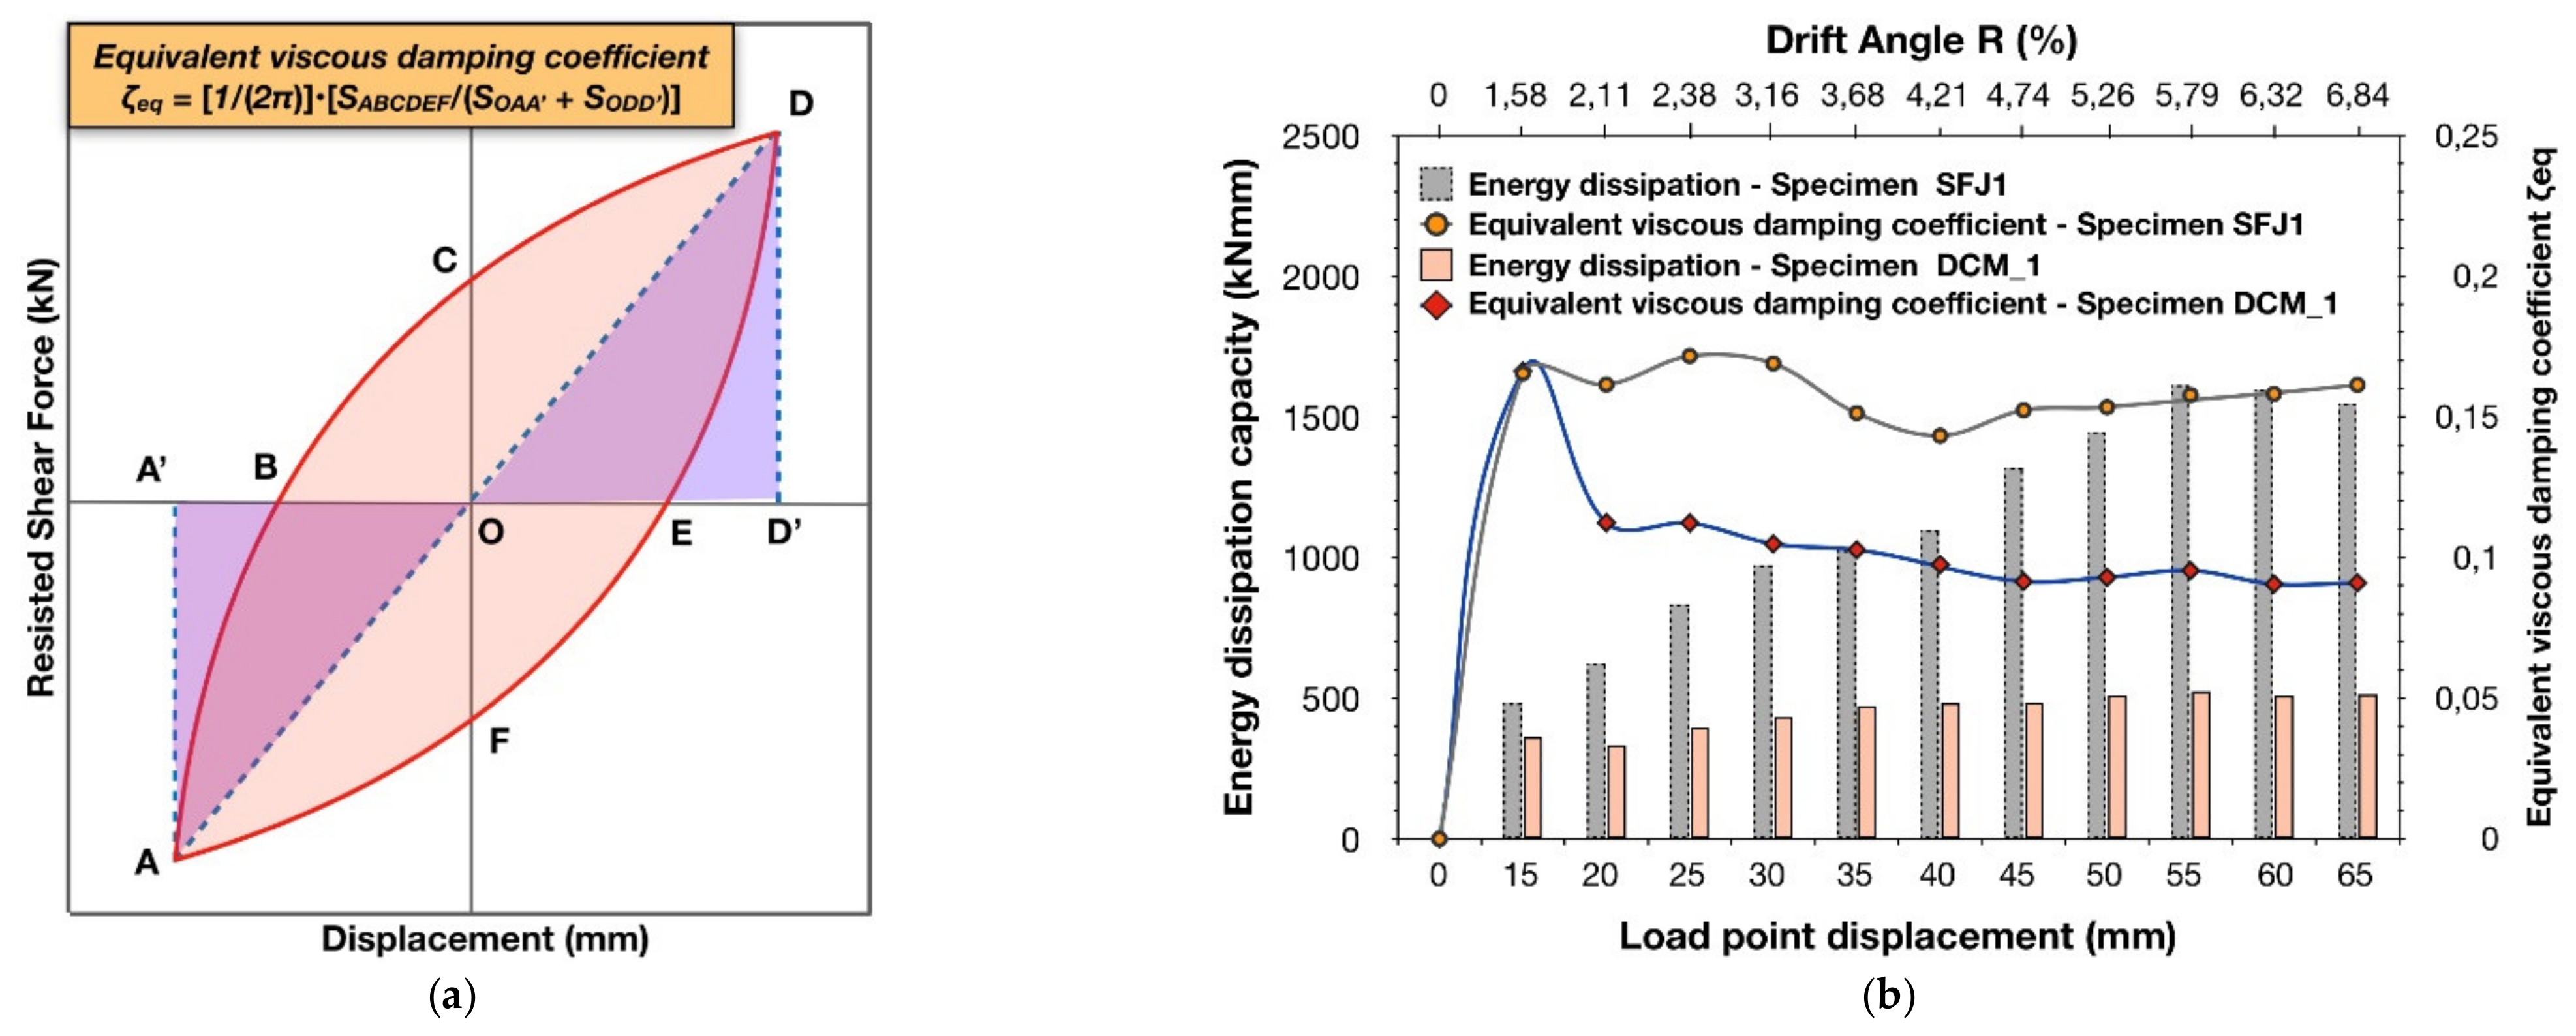
A crucial parameter for the seismic performance of RC structures is its ability to possess adequate displacement ductility, which allows for the dissipation of the kinetic energy induced by earthquakes through damping. The latter requires a ductile seismic response with the formation of the plastic hinges in the beam while the beam–column joints remain elastic. Therefore, it is useful to examine the equivalent viscous damping coefficient, ζeq (see Figure 15a), which is related to deformability and to the inelastic characteristics of the structural member, while consisting of both the hysteretic and the elastic damping. It is noteworthy that the equivalent viscous damping ratio values are higher for structural members that possess dissipating hysteresis behavior. Contrarily, poor energy dissipation capacity may result in the collapse of the structural member due to the cumulative seismic energy under small deformations. Coefficient ζeq is expressed as the ratio of the energy dissipated within a given cycle of the lateral loading to the elastic strain energy corresponding to this cycle (see Figure 15a). In 
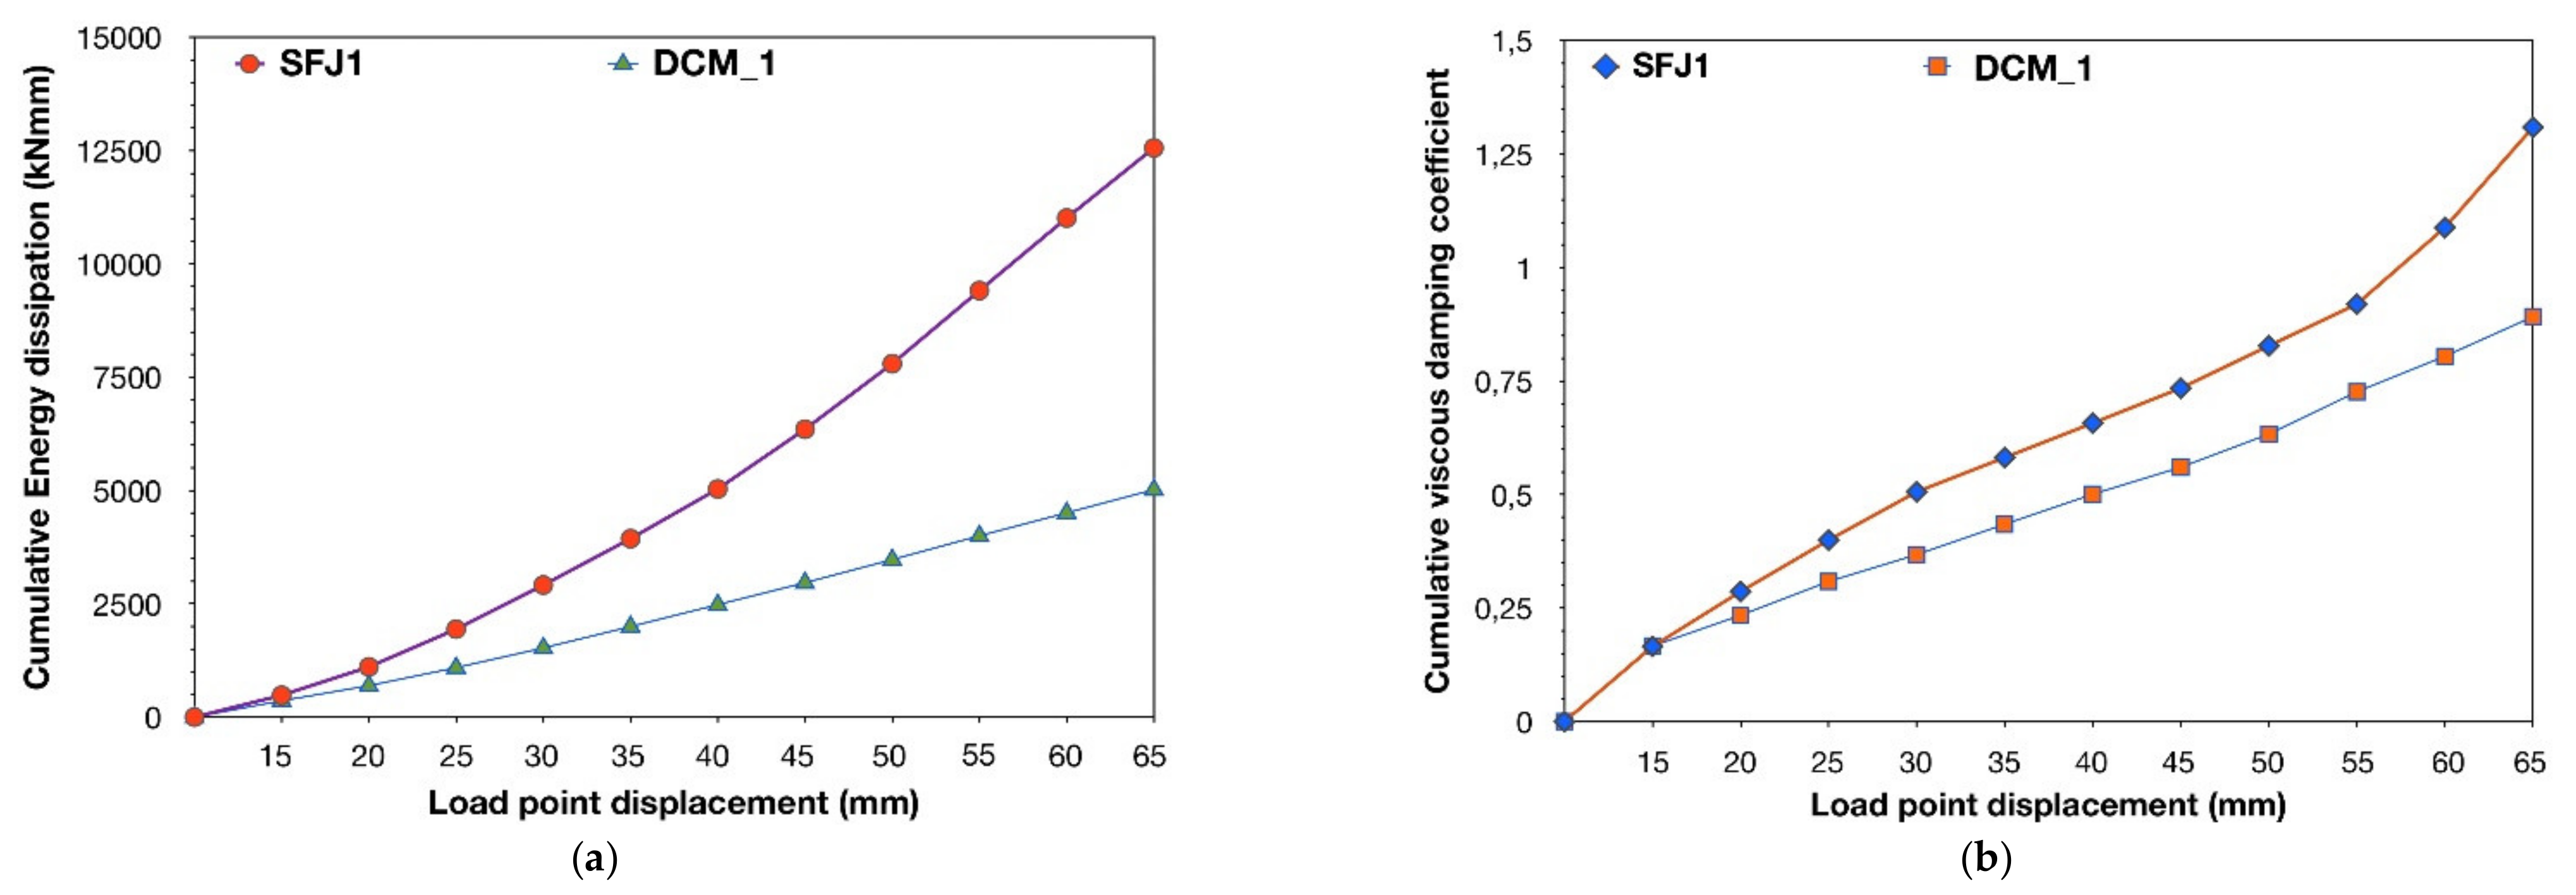
Figure 15b the energy dissipation capacity and the value of coefficient ζeq per cycle of loading are shown, while Figure 16a,b illustrates the cumulative dissipated energy and the cumulative equivalent viscous damping coefficient. As can be observed, the substantially increased energy dissipation capacity of subassemblage SFJ1 with respect to that of D C M _ 1 resulted in higher values of the equivalent viscous damping coefficient, ζeq, since the differences in the elastic strain energy were small.
Ultimately, the use of steel fiber reinforced concrete with a steel fiber volume fraction ratio of 1.5% allowed for the satisfactory concentration of damage in the beam of SFJ1, while the beam–column joint region remained almost intact, i.e., only hairline shear cracks were formed in the joint region (see Figure 12b). Thus, the proposed design scheme was proven to be particularly satisfactory in securing the ductile seismic performance of the beam–column connection while being an effective alternative design solution to the one of the EC8.

4. Conclusions

Seven one-half scale subassemblages of exterior RC beam–column joints were constructed with capacity design ratios higher than 1.30. Three of the specimens, D C M _ 1 , D C M _ 2 , and D C M _ 3 , were designed according to the provisions of EN1992-1 and EN1998-1 for ductility class medium (DCM). Subassemblages D 1 , D 2 , and D 3 were representative of the beam–column joints found in pre-1960s–1970s RC structures and, thus, possessed poor reinforcement details. The seventh specimen, SFJ1, was constructed using steel fiber reinforced concrete with a steel fiber volume fraction ratio of 1.5 instead of conventional RC. Moreover, the transverse reinforcement of SFJ1 was only a portion of the one required according to the EN1992-1 and EN1998-1 provisions. All specimens were subjected to the same sequence of incremental amplitudes of reversed inelastic lateral displacements under constant axial loading of the columns. Furthermore, the analytical model proposed by Tsonos was used to accurately predict the ultimate shear capacity of the joints and, hence, the seismic behavior of the subassemblages. The following conclusions are drawn based on the experimental and analytical work presented herein.
The beam–column joint specimens D C M _ 1 , D C M _ 2 , and D C M _ 3 , which were representative of the structural members found in modern RC structures designed according to the Eurocode, exhibited an unexpected seismic performance dominated by brittle shear failure of the joint region. As a result, the subassemblages showed poor hysteresis behavior while failing to develop their nominal flexural moment capacity. Both the increased number of ties in the joints of D C M _ 1 , D C M _ 2 , and D C M _ 3 and the 2Ø10 bars, which were welded transversely to the beam reinforcement, prevented the early failure of the anchorage and the slipping of the beam bars, while allowing for the yielding of reinforcement. However, this occurred locally only in the position of the main flexural crack of the beam. Thus, no plastic hinges were formed in the beam, and the amount of the dissipated hysteretic energy remained stable and particularly low during cycling.
Subassemblages D 1 , D 2 , and D 3   exhibited a degrading hysteresis behavior, which included a rapid evolution of the damage in the totally unconfined joint region. The latter included early brittle joint shear failure as well as anchorage failure of the beam’s reinforcement, which occurred prior to the development of the nominal flexural moment capacity. Eventually,   D 1 , D 2 , and D 3 collapsed due to the loss of the axial load carrying capacity.
In both cases of the subassemblages D C M _ 1 , D C M _ 2 , and D C M _ 3   and the specimens D 1 , D 2 , and D 3 , the capacity design ratio values exceeded the required value by the EN1998-1 provisions, which is 1.30. Nevertheless, the beam–column connections failed in brittle shear. Therefore, it was clearly demonstrated that the ductile seismic performance of the joints cannot be achieved solely by designing the RC structures based on the capacity design ratio rules. On the other hand, it is crucial to examine the combination of the capacity design ratio value with the value of coefficient γ of shear stress developed in the joint region. In particular, if the developed shear stress on the joint exceeds the ultimate shear capacity (τ > τult), then shear failure is inevitable to occur regardless of the capacity design ratio value and the amount of ties provided in the joint region.
The analytical formulation of Tsonos allows for the precise calculation of the actual shear stress and of the ultimate shear capacity of the joint while also satisfactorily predicting the seismic performance of the beam–column joint subassemblages D C M _ 1 , D C M _ 2 ,   D C M _ 3 , D 1 , D 2 and D 3 .
It was clearly demonstrated that specimen SFJ1 achieved an indisputable superiority in the hysteresis performance with respect to the corresponding subassemblage,   D C M _ 1 , designed according to the EC. Thus, the proposed design solution, which includes the use of steel fiber reinforced concrete (with a steel fiber volume fraction ratio of 1.5%) allows for the significant reduction of the transverse reinforcement in the columns, the beam, and the joint region, with respect to the one required by EC2 and EC8. At the same time, it secures the ductile response of the beam–column joint by shifting the damage in the beam. Hence, the proposed design solution was proven to be a very satisfactory, cost-effective, and easy-to-apply alternative for the design of earthquake-resistant, beam–column joints.

Author Contributions

Conceptualization, A.-D.T. and G.K.; methodology, A.-D.T. and G.K.; soft- ware, G.K. and P.I.; validation, A.-D.T. and G.K.; formal analysis, G.K.; investigation, G.K.; resources, G.K., P.I, M.-Z.B., and M.K.; data curation, G.K. and P.I; writing—original draft preparation, G.K.; writing—review and editing, A.-D.T. and G.K.; visualization, G.K. and P.I.; supervision, A.-D.T. All authors have read and agreed to the published version of the manuscript.

Funding

This research received no external funding.

Acknowledgments

The authors gratefully acknowledge the kind donation of the steel reinforcement by Sidenor, S.A. industry.

Conflicts of Interest

The authors declare no conflict of interest. https://elib.uni-stuttgart.de/handle/11682/515.

References

  1. Kalogeropoulos, G.; Tsonos, A.-D.; Konstandinidis, D.; Tsetines, S. Pre-earthquake and post-earthquake retrofitting of poorly detailed exterior RC beam-to-column joints. Eng. Struct. 2016, 109, 1–15. [Google Scholar] [CrossRef]
  2. Masi, A.; Santarsiero, G.; Lignola, G.P.; Verderame, G.M. Study of the seismic behaviour of external RC beam–column joints through experimental tests and numerical simulations. Eng. Struct. 2013, 52, 207–219. [Google Scholar] [CrossRef]
  3. Turk, A.M.; Mangir, A.; Cosgun, T.; Kiymaz, G. Experimental bahaviour and failure of beam-column joints with plain bars, low-strength concrete and different anchorage details. Eng. Fail. Anal. 2020, 109, 104247. [Google Scholar]
  4. Sharma, A. Seismic Behavior and Retrofitting of RC Frame Structures with Emphasis on Beam-Column Joints: Experiments and Numerical Modeling. Ph.D. Thesis, University of Stuttgart, Stuttgart, Germany, 2013. Available online: https://elib.uni-stuttgart.de/handle/11682/515 (accessed on 28 June 2021). [CrossRef]
  5. Melo, J.; Varum, H.; Rossetto, T. Cyclic behaviour of interior beam-column joints reinforced with plain bars. Earthq. Eng. Struct. Dyn. 2014, 44, 1351–1371. [Google Scholar] [CrossRef]
  6. Leon, R.T.M. Shear strength and hysteretic behavior of interior beam-column joints. ACI Struct. J. 1990, 87, 3–11. [Google Scholar]
  7. Fernandes, C.; Melo, J.; Varum, H.; Costa, A. Cyclic behavior of substandard reinforced concrete beam-column joints with plain bars. Mat. Sci. ACI Struct. J. 2013, 110, 137–148. [Google Scholar]
  8. De Risi, M.-T.; Ricci, P.; Verderame, G.; Manfredi, G. Experimental assessment of unreinforced exterior beam-column joints with deformed bars. Eng. Struct. 2016, 112, 215–232. [Google Scholar] [CrossRef]
  9. Ricci, P.; De Risi, M.-T.; Verderame, G.; Manfredi, G. Experimental tests of unreinforced exterior beam–column joints with plain bars. Eng. Struct. 2016, 118, 178–194. [Google Scholar] [CrossRef]
  10. Akguzel, U.; Pampanin, S. Effects of variation of axial load and bidirectional loading on seismic performance of GFRP retrofitted reinforced concrete exterior beam-column joints. J. Comp. Constr. 2010, 14, 94–104. [Google Scholar] [CrossRef]
  11. Uma, S.R.; Jain, S.K. Seismic design of beam–column joints on RC moment resisting frames—Review of codes. Struct. Eng. Mech. Int. J. 2006, 23, 579–597. [Google Scholar] [CrossRef] [Green Version]
  12. EN 1998-1 Eurocode 8. Design of Structures for Earthquake Resistance. Part 1: General Rules, Seismic Actions and Rules for Buildings; Stage 51; The European Union: Brussels, Belgium, 2004; 229p. [Google Scholar]
  13. Tsonos, A.G. Cyclic Load behaviour of reinforced concrete beam-column subassemblages designed according to modern codes. J. Eur. Earthq. Eng. 2006, 3, 3–21. [Google Scholar]
  14. Tsonos, A.G. Cyclic load behaviour of reinforced concrete beam-column subassemblages of modern structures. ACI Struct. J. 2007, 194, 468–478. [Google Scholar]
  15. Carydis, P.G.; Mouzakis, H.; Lu, Y. Shaking table testing of two-storeyed RC frames designed for different ductility classes and using different types of reinforcement. In Proceedings of the 11th European Conference on Earthquake Engineering, Paris, Greek, 6–11 September 1998. [Google Scholar]
  16. Lu, Y.; Hao, H.; Carydis, P.G.; Mouzakis, H. Seismic performance of RC frames designed for three different ductility levels. Eng. Struct. 2001, 23, 537–547. [Google Scholar] [CrossRef]
  17. EN 1998-1-1 Eurocode 2. Design of Concrete Structures. Part 1-1: General Rules and Rules for Buildings; The European Union: Brussels, Belgium, 2004; 224p. [Google Scholar]
  18. ACI 318-05. Building Code Requirements for Structural Concrete; American Concrete Institute: Farmington Hills, MI, USA, 2005. [Google Scholar]
  19. ACI-ASCE Committee 352. Recommendations for Design of Beam-Column Connections in Monolithic Reinforced Concrete Structures (ACI 352R-02); Reported by Joint ACI-ASCE Committee 352; American Concrete Institute: Farmington Hills, MI, USA, 2002. [Google Scholar]
  20. New Greek Code for the Design of Reinforced Concrete Structures (C.D.C.S.-1995); Ministry of Environment, Land Planning and Public Works, General Secretariat of Public Works: Athens, Greece, 1995. (In Greek)
  21. New Greek Earthquake Resistant Code (E.R.C.-1995); Ministry of Environment, Land Planning and Public Works, General Secretariat of Public Works: Athens, Greece, 1995. (In Greek)
  22. Henager, C.H. Steel fibrous ductile concrete joints for seismic-resistant structures. Reinforced Concrete Structures in Seismic Zones. In ACI Special Publications SP-53; American Concrete Institute: Detroit, MI, USA, 1997. [Google Scholar]
  23. Hackman, L.; Farell, M.; Dunhan, O. Slurry infiltrated mat concrete (SIMCON). Concr. Int. 1992, 14, 53–56. [Google Scholar]
  24. Tsonos, A.D. An innovative solution for strengthening of old R/C structures and for improving the FRP strengthening method. Struct. Monit. Maint. 2014, 1, 323–338. [Google Scholar] [CrossRef]
  25. Tsonos, A.D. Steel Fiber Reinforced Concrete of High-Strength for the Construction of Jackets for Earthquake- Strengthening of Buildings without the Use of Conventional Reinforcement. Patent No. 1005657, 2007. [Google Scholar]
  26. Shannag, M.J.; Abu-Dyya, N.; Abu-Farsakh, G. Lateral load response of high performance fiber reinforced concrete beam-column joints. Const. Build. Mat. 2005, 19, 500–508. [Google Scholar] [CrossRef]
  27. Hakuto, S.; Park, R.; Tanaka, H. Seismic load tests on interior and exterior beam-column joints with substandard reinforcing details. ACI Struct. J. 2000, 97, 11–25. [Google Scholar]
  28. Ehsani, M.R.; Wight, J.K. Effect of transverse and slab on behavior of reinforced concrete beam-to-column connections. ACI J. Proc. 1985, 82, 188–195. [Google Scholar]
  29. Durrani, A.J.; Wight, J.K. Earthquake resistance of reinforced concrete interior connections including a floor slab. ACI J. Proc. 1987, 84, 400–406. [Google Scholar]
  30. Soroushian, P.; Sim, J. Axial behavior of reinforced concrete columns under dynamic loads. ACI J. Proc. 1986, 83, 1018–1025. [Google Scholar]
  31. Scott, B.D.; Park, R.; Priestley, M.J.N. Stress-strain behavior of concrete confined by overlapping hoops at low and high strain rates. ACI J. Proc. 1982, 79, 13–27. [Google Scholar]
  32. CEB. CEB—FIP Modes Code 1990, Bulletin d’ Information CEB; 213/214; CEB: Lausanne, Switzerland, 1993. [Google Scholar]
  33. Ehsani, M.R.; Wight, J.K. Exterior reinforced concrete beam-to-column connections subjected to earthquake-type loading. ACI J. Proc. 1985, 82, 492–499. [Google Scholar]
  34. Toska, K.; Faleschini, F.; Zanini, M.A.; Hofer, L.; Pellegrino, C. Repair of severely damaged RC columns through FRCM composites. Constr. Build. Mat. 2021, 273, 121739. [Google Scholar] [CrossRef]
  35. Faleschini, F.; Zanini, M.A.; Hofer, L.; Toska, K.; De Domenico, D.; Pellegrino, C. Confinement of reinforced concrete columns with glass fiber reinforced cementious matrix jackets. Eng. Struct. 2020, 218. [Google Scholar] [CrossRef]
  36. Paulay, T.; Park, R. Joints of Reinforced Concrete Frames Designed for Earthquake Resistance; Research Report No. 84-9; Department of Civil Engineering, University of Canterbury: Christchurch, New Zealand, 1984. [Google Scholar]
  37. Karayannis, C.; Chalioris, C.; Sideris, K. Effectiveness of R/C beam-column connection repair using epoxy resin injections. J. Earthq. Eng. 1998, 2, 217–240. [Google Scholar] [CrossRef]
  38. Park, R. A summary of results of simulated seismic load tests on reinforced concrete beam—column joints, beams and columns with substandard reinforcing details. J. Earthq. Eng. 2000, 6, 147–174. [Google Scholar] [CrossRef]
  39. Karayannis, C.G.; Favvata, M.J.; Kakaletsis, D. Seismic behavior of infilled and pilotis RC frame structures with beam-column joint degradation effect. Eng. Struct. 2011, 33, 2821–2831. [Google Scholar] [CrossRef]
  40. Kalogeropoulos, G.; Tsonos, A.-D. Effectiveness of r/c jacketing of substandard r/c columns with short lap splices. Struct Monit Maint 2014, 1, 273–292. [Google Scholar] [CrossRef]
  41. Karayannis, C. Mechanics of external RC beam—column joints with rectangular spiral shear reinforcement: Experimental verification. Meccanica 2015, 50, 311–322. [Google Scholar] [CrossRef]
  42. Tsonos, A.-D.; Kalogeropoulos, G.; Iakovidis, P.; Konstantinidis, D. Seismic retrofitting of pre-1970 RC bridge columns using innovative jackets. Int. J. Struct. Eng. 2017, 8, 13. [Google Scholar] [CrossRef]
  43. Kalogeropoulos, G.; Tsonos, A.D. Improvement of the Cyclic Response of RC Columns with Inadequate Lap Splices-Experimental and Analytical Investigation. Earthq. Struct 2019, 16, 279–293. [Google Scholar]
  44. Kalogeropoulos, G.; Tsonos, A.D.; Konstantinidis, D.; Iakovidis, P. Earthquake-Resistant Rehabilitation of Existing RC Structures Using High-Strength Steel Fiber-Reinforced Concrete Jackets. Earthq. Struct An. Int. J. 2019, 17, 115–129. [Google Scholar]
  45. Golias, E.; Karayannis, C.G.; Karabinis, A.I. Tests of external beam-column joint with x-type reinforcement under cyclic loading. In Proceedings of the 16th European Conference on Earthquake Engineering, Thessaloniki, Greece, 18–21 June 2018. [Google Scholar]
  46. Karayannis, C.G.; Golias, E.; Chalioris, C.E. Local FRP-retrofitting of exterior reinforced concrete beam-column joints under cyclic lateral loading. In Proceedings of the 16th European Conference on Earthquake Engineering, Thessaloniki, Greece, 18–21 June 2018. [Google Scholar]
  47. Karayannis, C.G. Design of Reinforced Concrete Structures and Seismic Actions. Modern Perceptions and Eurocodes: Thessaloniki, Greece, 2019. [Google Scholar]
  48. Tsonos, A.-D. Model for the evaluation of the beam-column joint ultimate strength-a more simplified version. Earthq. Struct. 2019, 16, 141–148. [Google Scholar]
  49. Paulay, T.; Priestley, M.J.N. Seismic Design of Reinforced Concrete and Masonry Buildings; John Wiley & Sons: New York, NY, USA, 1992. [Google Scholar]
Figure 1. Dimensions, reinforcement, and cross-section details of subassemblages (a) DCM_1, (b) DCM_2, (c) DCM_3, (d) D3, (e) D1, (f) D2.
Fibers 09 00045 g001aFibers 09 00045 g001b
Figure 2. (a) Aerial view of the test setup and instrumentation used; (b) qualitative deformed shape of the specimens and lateral displacement sequence.
Fibers 09 00045 g002
Figure 3. Plots of shear resisted force versus displacement of the beam–column joint subassemblages of modern RC structures: (a) specimen D C M _ 1 ; (b) specimen D C M _ 2 ; (c) specimen D C M _ 3 and of existing pre-1960s–1970s RC structures; (d) specimen D 1 ; (e) specimen D 2 ; (f) specimen D 3 .
Fibers 09 00045 g003
Figure 4. Plots of (a) peak-to-peak stiffness versus displacement and (b) energy dissipation capacity versus displacement of the subassemblages D C M _ 1 , D C M _ 2 , and D C M _ 3 .
Fibers 09 00045 g004
Figure 5. Plots of (a) peak-to-peak stiffness versus displacement and (b) energy dissipation capacity versus displacement of the subassemblages D 1 , D 2 , and D 3 .
Fibers 09 00045 g005
Figure 6. Failure mode of the beam-to-column joint subassemblages: (ac) Specimens designed according to the EC2 and EC8 provisions for DCM; (df) Specimens representing pre-1960s–1970s RC structures.
Fibers 09 00045 g006
Figure 7. Location of the strain gauges: Subassemblages (a) D C M _ 1 , (b) D C M _ 2 , (c) D C M _ 3 , and (d) D 2 .
Fibers 09 00045 g007
Figure 8. Plots of the load point displacement versus strain of reinforcement: (a) Specimen D C M _ 1 , Strain gauge No. 1; (b) Specimen D C M _ 1 , Strain gauge No. 2; (c) Specimen D C M _ 2 , Strain gauge No. 1; (d) Specimen D C M _ 2 , Strain gauge No. 2; (e) Specimen D C M _ 3 , Strain gauge No. 1; (f) Specimen D C M _ 3 , Strain gauge No. 2; (g) Specimen D 2 , Strain gauge No. 1; (h) Specimen D 2 , Strain gauge No. 2. Yield strains of specimens’ D C M _ 1 , D C M _ 2 , and D C M _ 3 were 2.5‰, while the yield strain of specimen D 2 was 1.78‰.
Fibers 09 00045 g008aFibers 09 00045 g008b
Figure 9. Evolution of damage for (a) subassemblages D C M _ 1 , D C M _ 2 , and D C M _ 3 ; (b) subassemblages D 1 , D 2 , and D 3 .
Fibers 09 00045 g009aFibers 09 00045 g009b
Figure 10. (a) Interior beam–column joint; (b) representation of the concrete biaxial strength curve by a parabola of 5th degree [14] and the substitute linear branch BC; (c,d) forces acting in the joint core concrete through section I–I from the two mechanisms (concrete compression strut (c) and truss mechanism (d)). These are same for exterior beam–column joints.
Fibers 09 00045 g010
Figure 11. Reinforcement and cross-section details of beam–column joint subassemblage SFJ1.
Fibers 09 00045 g011
Figure 12. (a) Plots of resisted shear force versus displacement and (b) failure mode of subassemblage SFJ1.
Fibers 09 00045 g012
Figure 13. Plots of (a) peak-to-peak stiffness versus displacement and (b) energy dissipation capacity versus displacement of subassemblages SFJ1 and DCM_1.
Fibers 09 00045 g013
Figure 14. Plots of (a) load point displacement versus strength ratio for peak displacement of each cycle and (b) load point displacement versus energy dissipation ratio for peak displacement of each cycle of subassemblages SFJ1 and DCM_1.
Fibers 09 00045 g014
Figure 15. Plots of (a) equivalent viscous damping coefficient; (b) energy dissipation capacity versus displacement, and equivalent viscous damping coefficient versus displacement of subassemblages SFJ1 and DCM_1.
Fibers 09 00045 g015
Figure 16. Plots of (a) cumulative energy dissipation versus load point displacement and (b) cumulative viscous damping coefficient versus load point displacement of subassemblages SFJ1 and DCM_1.
Fibers 09 00045 g016
Table 1. Reinforcement, nominal flexural moment capacity, and shear capacity force of subassemblages designed according to EC2 and EC8 for DCM.
Subassemblage   D C M _ 1 (where Σ M R c / Σ M R b = 1.31 > 1.30 )
Cross section (mm)Beam 300 × 200Column over 200 × 200Column under 200 × 200
Longitudinal reinforcement up/down
(mm)
4∅14/4∅144∅14 + 4∅124∅14 + 4∅12
Transverse reinforcement
(mm)
∅5/50∅5/45∅5/45
M R   (kN·m) M R b = 62.25 M R c , o v e r = 39.20 M R c , u n d e r = 42.56
V c a p   (kN)69.1746.9050.92
V c o l = V c a p · L / H = 44.47   kN , steel reinforcement B500C
Subassemblage D C M _ 2 (where Σ M R c / Σ M R b = 1.60 > 1.30 )
Cross section (mm)Beam 300 × 200Column over 200 × 200Column under 200 × 200
Longitudinal reinforcement up/down
(mm)
4∅14/4∅148∅148∅14
Transverse reinforcement
(mm)
∅5/50∅5/45∅5/45
M R   (kN·m) M R b = 62.25 M R c , o v e r = 47.68 M R c , u n d e r = 51.84
V c a p   (kN)69.1759.6564.85
V c o l = V c a p · L / H = 44.47   kN , steel reinforcement B500C
Subassemblage D C M _ 3 ( Σ M R c / Σ M R b = 1.49 > 1.30 )
Cross section (mm)Beam 300 × 200Column over 200 × 200Column under 200 × 200
Longitudinal reinforcement up/down
(mm)
4∅12/4∅128∅128∅12
Transverse reinforcement
(mm)
∅8/75 (critical)
∅8/150 (noncritical)
∅8/90∅8/90
M R   (kN·m) M R b = 51.67 M R c , o v e r = 37.18 M R c , u n d e r = 39.84
V c a p   (kN)57.4153.1156.91
V c o l = V c a p · L / H = 36.91   kN , steel reinforcement B500C
Table 2. Concrete compression strength and steel yield stress of the subassemblages.
Designed According to EC2 and EC8Pre-1960s–1970s
Specimen D C M _ 1 D C M _ 2 D C M _ 3 D 1 D 2 D 3
Concrete compression strength (MPa)19.2618.6016.6012.5010.3211.50
Steel yield stress (MPa)518 (B500C)355 (plain S220)
Table 3. Reinforcement, nominal flexural moment capacity, and shear capacity force of subassemblages designed in the 1960s–1970s.
Subassemblage   D 1 ( Σ M R c / Σ M R b = 2.46 > 1.30 )
Cross section (mm)Beam 300 × 200Column over 200 × 200Column under 200 × 200
Longitudinal reinforcement up/down
(mm)
3∅10/3∅108∅108∅10
Transverse reinforcement
(mm)
∅8/200∅8/200∅8/200
M R   (kN·m) M R b = 20.72 M R c , o v e r = 25.00 M R c , u n d e r = 26.00
V c a p   (kN)23.0235.7137.14
V c o l = V c a p · L / H = 14.80   kN , steel reinforcement S220 (plain)
Subassemblage D 2 ( Σ M R c / Σ M R b = 2.07 > 1.30 )
Cross section (mm)Beam 300×200Column over 200×200Column under 200×200
Longitudinal reinforcement up/down
(mm)
2∅12/2∅124∅124∅12
Transverse reinforcement
(mm)
∅8/200∅8/200∅8/200
M R   (kN·m) M R b = 19.57 M R c , o v e r = 19.81 M R c , u n d e r = 20.64
V c a p   (kN)21.7428.3029.49
V c o l = V c a p · L / H = 13.97   kN , steel reinforcement S220 (plain)
Subassemblage D 3 ( Σ M R c / Σ M R b = 1.61 > 1.30 )
Cross section (mm)Beam 300×200Column over 200×200Column under 200×200
Longitudinal reinforcement up/down (mm)2∅10 + 2∅128∅108∅10
Transverse reinforcement
(mm)
∅8/200∅8/200∅8/200
M R   (kN·m) M R b = 30.85 M R c , o v e r = 23.92 M R c , u n d e r = 25.76
V c a p   (kN)34.2834.1736.80
V c o l = V c a p · L / H = 19.83   kN , steel reinforcement S220 (plain)
Table 4. Experimental and predicted values of concrete shear stress in the potential failure plane.
Specimen f c
(MPa)
f c
(MPa)
γ c a l γ u l t τ c a l
(MPa)
τ u l t
(MPa)
τ p r e d (MPa) τ c a l / τ u l t  
D C M _ 1 24.4419.261.6940.9898.3754.8894.8891.713
D C M _ 2 23.8318.601.7150.9768.3724.7664.7661.757
D C M _ 3 23.5216.601.0650.9705.1654.7074.7071.098
D 1 -12.500.6340.7072.2422.4992.2420.907
D 2 -10.320.6720.6432.1592.0642.0641.046
D 3 -11.501.1070.6783.7542.2992.2991.632
Joint aspect ratio α = 1.5 for all specimens.
Publisher’s Note: MDPI stays neutral with regard to jurisdictional claims in published maps and institutional affiliations.

