Article

Insight into the Effects of Solvent Treatment of Natural Fibers Prior to Structural Composite Casting: Chemical, Physical and Mechanical Evaluation

1
Department of Civil Engineering, University of Minho, ISISE, 4800-058 Guimarães, Portugal
2
Department of Polymer Engineering, University of Minho, IPC, 4800-058 Guimarães, Portugal
3
Department of Mechanical Engineering, University of Minho, 2C2T, 4710-057 Guimarães, Portugal
*
Authors to whom correspondence should be addressed.
Submission received: 26 June 2021 / Revised: 12 August 2021 / Accepted: 18 August 2021 / Published: 1 September 2021
(This article belongs to the Special Issue Fibres in Construction: Mechanical Modelling and Characterisation)

Abstract

:
This paper presents an optimized washing protocol for as-received natural fibers, prior to large-scale composite manufacturing, for the structural strengthening of historic masonry. The aim was to achieve a simple protocol for standard cleaning of fiber surfaces from low molecular weight constituents that may be detrimental towards interfacial strength without damaging the fibers. The proposed procedure employs the application of the solvent sequence: ethanol, acetone, hexane, with optimized incubation times and stirring conditions. Additionally, this procedure may change the surface of the fiber, thereby enhancing the durability of the fiber-matrix interface. The washing protocol resulted in an increase of tensile strength by 56%, 52% and 22% for flax, hemp and sisal fibers, respectively, as compared to the corresponding non-washed fibers, without loss of elongation. The static contact angle measurements confirmed exposure of a higher fraction of the hydrophilic crystalline cellulose, with a higher wettability observed after washing protocols.

1. Introduction

Nowadays, it is manifestly known by researchers that natural fiber textiles present an appealing and promising solution as green, economical and strong reinforcements for composite materials; this is investigated in different fields of science [1]. For structural purposes, and particularly for the repairing and strengthening of historical masonry structures, natural fiber-based textile reinforced mortars (NTRM) establish a new milestone in external retrofitting-based techniques for previously built heritage sites. In previous work [2], authors highlight recent findings concerning the advantages of employing NTRM to strengthen culturally built heritage. Nevertheless, the durability of natural fiber reinforcements is evidently compromised when embedded in highly alkaline lime or cementitious matrices [3,4,5,6]. The deterioration kinetics of these hydrophilic fibers are represented mainly by the mineralization of fibers, owing to the migration of hydration salts (i.e., calcium hydroxide; present in water of mortar pores) to the fiber lumen. This leads to aging, a drop in the fibers’ mechanical properties and embrittlement of their composites [7,8]. Supplementary pozzolanic materials were added to the matrices to mitigate the aging effect in such highly alkaline environments [9,10]. However, the treatment of the fiber surface arose as a parallel beneficial approach to confront such drawbacks [1,11]. It is worthwhile to note that various surface treatments and coatings are based on the coupling and cross-linking of hydrophobic molecules to free hydroxyl groups present on the fiber surface (namely from lignin and cellulose) [12]. Such approaches are more effective in the presence of an apt amount of available OH groups, leading to a high yield of surface modification and fiber hydrophobization [13,14]. In order to expose higher fractions of functional hydroxyl groups, present mostly in lignin or cellulose, a partial extraction of lipophilic, amorphous polysaccharides and waxes (that block OH groups) could be employed. Additionally, the excessive presence of such extractive compounds might interfere with chemical protocols designed for further fiber treatments [15]. Finally, their partial removal can enhance the fibers’ mechanical properties, adding better dimensional stability in their composites.
To date, cleansing of the extractive content of the fiber has been performed via Soxhlet extractors in laboratories [16,17]. This technique comprises the utilization of solvents with different polarities, such as ethanol, toluene, benzene and acetone [11,12,13,14]. However, Soxhlet extraction is costly in terms of time and materials for large-scale applications of natural fiber composites, such as in retrofitting techniques of existing buildings. Therefore, an accessible and rapid technique is necessary to partially wash natural fiber-based meshes that are engaged with the large-scale manufacturing of NTRM. Likewise, it is of great importance to establish a standard washing approach, in terms of incubation time and stirring conditions, to control the extraction process; thus, avoiding both the harsh removal of the non-cellulosic cementing products as well as the severe consequences of inflicting damage to the fiber microstructure. To the best of the authors’ knowledge, repeatable and normative washing protocols for large-scale natural fibers as building materials prior to surface treatment have not yet been reported.
In this paper, the authors present washing protocols based on the sequential employment of solvents with different polarities in line with optimizing the incubation time, stirring and drying conditions. It is, consequently, important to spot the physical, chemical, wettable and mechanical effects of such procedures on the lignocellulosic reinforcements investigated in this work.

2. Materials and Methods

2.1. Fibers and Solvents

Three types of fibers (yarns) were employed in this study, two bast fibers (hemp and flax) and a leaf-based fiber (sisal). Hemp yarn comprises two twisted cords (with nominal linear density 2 × 400 Tex). Flax fibers (with a nominal linear density of 1500 Tex) were purchased from Bcomp (Fribourg, Switzerland); sisal and hemp were purchased from Agenzia Industrie Difesa (Naples, Italy). Ultra-pure water (W) supplied by IPC, University of Minho, pure ethanol 99% (E), hexane (assay GC 98.37%) (H) and acetone 99.6% (A) were analytical reagent-grade and purchased from Fisher Scientific. (Porto Salvo, Portugal) All tests were conducted at room temperature conditions. From this section onwards, the terminology (fibers) in the paper refers to yarns.

2.2. Samples Casting and Washing Protocols

Each of the three fibers was, as-received, subjected to the washing protocols listed in Table 1. The methodology carried out in this paper comprises two approaches (Group A and Group B). The terminology of each fiber after each washing protocol (Table 1) is composed of the fiber type (flax, sisal or hemp) followed by the group name (A or B) and the initials of the solvents used (E, H, A and W). The first approach, Group A, concerned the soaking of the fibers (4 m-long each) in one solvent only, for a limited time (45 min to 1 h, Table 1), without stirring. The main goal of employing Group A washing protocols is to understand the selectivity of each solvent, characterized by a different polarity, to extract a specific non-cellulosic product from the fibers. Thereafter, a water-based fast rinse was carried out to dispose of any residual solvent in the fibers’ structure. The second group, Group B, involved three washing protocols (applied to 4 m-long fibers each) based on the employment of sequences of the three solvents for a standard period (20 min each) with ultrasound stirring in a laboratory environment. The solvent sequence applied in Group B was varied to evaluate the effect upon the extraction process relying on their elution ability. After washing, the fibers were dried for two hours at 75–80 °C and kept in a desiccator for future tests. The washed fibers from each treatment were later tested for physical, chemical, wettable and mechanical characterizations.

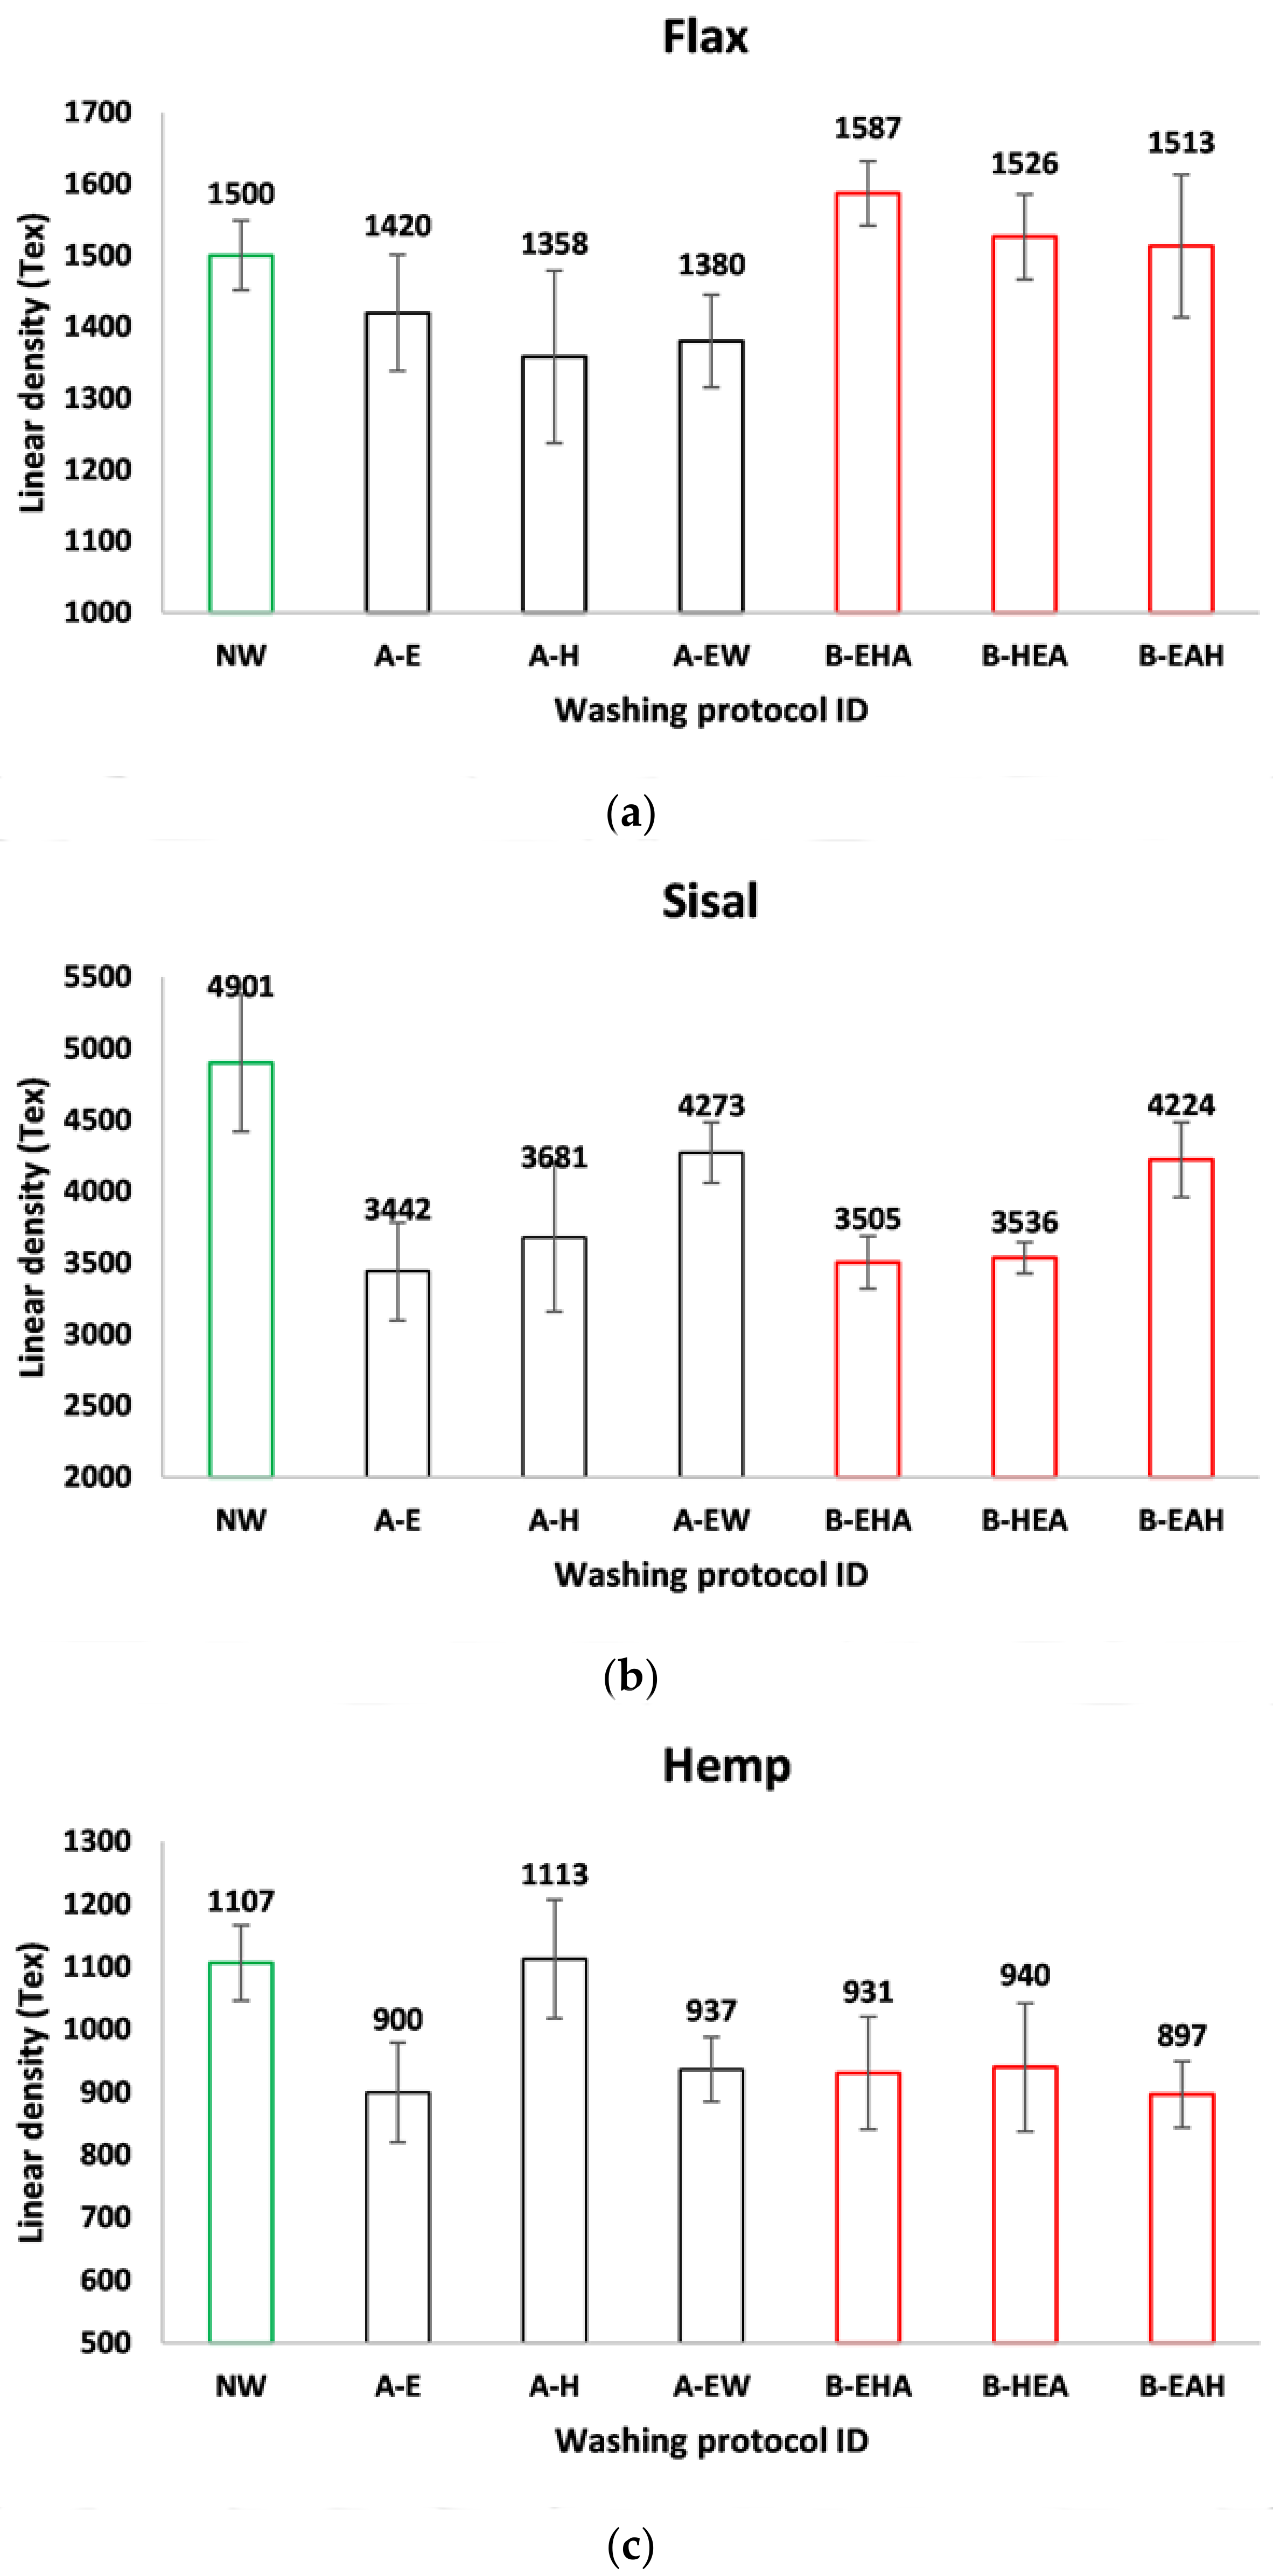
2.3. Physical Properties Characterization (Density and Linear Density)

In this work, the Archimedes method was selected as a good approach to achieve reproducible density data [18]. The Archimedes method concerns the gauging of fiber density by relying upon the relation between the fiber dry weight, fiber submersed weight and the density of the liquid used, Equation (1). Particularly, distilled water has been most commonly used to measure density [19]. In previous works, various immersing liquids have been employed (instead of water) as submersion liquids such as plant-based/mineral oils [20] and ethanol [21,22]. In this study, hexane was used as the submersion liquid. Henceforth, the liquid density in Equation (1) refers to hexane, where ρ l i q u i d = ρ h e x a n e = 0.655 g/cm3. In terms of sample preparation, each 10 cm long sample was gently tangled to form a knot and to be later weighed in air, as well as fully submerged in hexane. A Denver Instrument-SI-234 with the precision of 0.1 mg was used for density measurements. Each fiber density was calculated as the average of ≥5 replicates.
ρ g / c m 3 = w d r y w s u b m e r g e d w d r y × ρ l i q u i d
Linear density measurements were performed according to the standard ISO 7211-5 (1984) [23]. The straightened lengths were measured for 10 cm-yarns, for ≥10 replicates of each fiber type under a stretching load of 0.1 N. Afterward, yarns weights were measured by an analytical balance. The linear density was calculated according to Equation (2). Moreover, all measurements acquired by the physical tests were statically analyzed (considering significance level 5%) to remove outlier observations. Quartiles, Dixon’s, Grubbs’ and Tietjen-Moore tests, according to the standard (ASTM E178-16a) [24], were conducted for standard deviations and coefficients of variation. Only observations that were verified and cleared of outliers (via all the above-mentioned criteria) were included in the calculation of density and linear density. After the acquisition of the physical properties of each fiber type, the area of yarn was calculated based on CNR guidelines [25,26], Equation (3).
L i n e a r   d e n s i t y   T e x = W e i g h t   g L e n g t h   km
A y a r n = L i n e a r   d e n s i t y   T e x   D e n s i t y   g / cm 3 × 1000

2.4. Chemical Analysis via Attenuated Total Reflectance–Fourier Transform Infrared Spectroscopy

The attenuated total reflectance–Fourier transform infrared spectroscopy (ATR-FTIR) was employed to investigate the chemical modifications of the surface structure of the three fiber types, before and after washing, owing to the partial removal of waxes, fatty acids, amorphous polysaccharides (i.e., hemicellulose, pectin and noncrystalline cellulose) and possibly leading to the exposure of the crystalline cellulosic backbone and changes of polymorph cellulose [27]. The spectra were acquired on a Japan and Golden Gate™ Single Reflection Diamond ATR System (FTIR-4100 LE, Jasco) in the range from 4000 cm−1 to 650 cm−1 over 64 scans with a resolution of 8 cm−1.

2.5. Wettability Evaluation via Static Sessile Drop Contact Angle

The measurement of the contact angle on natural fibers is extremely challenging, especially due to the fibers’ surface roughness and geometry. In this work, an image/video capturing-based optical contact angle apparatus (OCA 20 from Dataphysics, Filderstadt, Germany) was used to inspect the wettability of the as-received and washed fibers. For the sample preparation, the yarns were tightly aligned in an adjacent manner on plastic plates using double-sided tape to cover an area of approximately 2 × 5 cm2. Thereafter, each sample was compacted under a constant weight of 2.5 N for 72 h, so that no damage was induced to the fibers before testing at ambient temperature. A water droplet of 10 μL was placed on three different locations of each sample plate. Three sample plates were prepared for each fiber type. Finally, the measurements were recorded perpendicular to fiber orientation.

2.6. Tensile Testing

A total of 10 replicates of each fiber (sisal, hemp and flax), before and after each washing protocol type, were studied under uniaxial direct tensile tests using H100KS testing equipment from Hounsfield, equipped with a load cell of 2.5 kN. Each replicate had a 250 mm-gauge length, and displacement control was used to apply a constant displacement rate of 250 mm/min monotonically until total rupture, according to standard EN ISO 2062-1995 [28]. Before each test, a preload of 5 N, 7.5 N and 25 N for hemp, flax and sisal, respectively, was applied. Analogous to the physical property study, a statistical study was carried out to clear the outlier population. The results are presented as stress-strain graphs and tenacity (cN/Tex)-strain. Young’s modulus was calculated as the slope of the elastic part between 10–50% of the tensile strength in stress-strain graphs (further illustrated in Section 3.4).

3. Results and Discussion

3.1. Physical Characterization

Fiber density measurements are fundamental to quantify fiber content in every composite material and cross-sectional area of yarn. However, the evaluation of density in lignocellulosic fibers is challenging, given their anisotropy, along even one yarn length. Apart from the different methods used to quantify the density of lignocellulosic material, buoyancy (based on Archimedes principle) is recommended [21]. However, the main challenge in delivering a meaningful density measurement is associated with the fiber swelling phenomenon that occurs upon contact with water [29,30]. It is known that swelling results in blocking of the neighboring capillary pores within the fiber structure [29], hence hindering water propagation to the fiber’s inner parts (lumen mainly), thus, limiting fiber wetting and preventing an accurate density measurement. Therefore, a submersion liquid (such as hexane) with low bonding to the porous structure of the fiber, and low surface tension (0° contact angle), is recommended to be used [31]. The results obtained for the density of all fibers, as-received and washed, are presented in Table 2. As it can be seen, the results obtained for the density of the non-washed flax were in good agreement with those reported for measurements performed in ethanol [22,32] as well as using a gas pycnometer [21]. Hexane is a non-polar liquid with the ability to reach the fiber lumen, typically forming a contact angle of ~0° with the surface of natural fibers. To the best of our knowledge, density measurements of natural fibers by immersion in hexane have not yet been reported.
Being rich with extractive content [30], sisal showed a drop in density with the A-H protocol (around 6.4%). It was also observed that the B-EAH protocol induced a slightly higher density in flax and hemp compared with those obtained by the single solvent-based protocols (A-H and A-E). This limited density increment may be due to the removal of less dense non-crystalline materials from the fibers’ structure, leaving the fiber with a larger content of dense crystalline backbone. In general, the results showed that the differences between washed and non-washed fibers are not detectable; the density SD values in Table 2 highlighted that the structures of the fibers were not decayed by the protocols.
On the other hand, flax has exhibited a decrease in its linear density that was only observed by Group A, Figure 1a. For hemp fibers, ethanol arose as a harsh extraction solvent, while hexane (i.e., A-H) did not confer major changes in the apparent physical properties. Group B flax fibers delivered a larger cross-section than that of Group A. In the case of sisal, the B-EAH protocols show a higher cross-sectional area than the other protocols, Table 2. Despite these observations, it is important to stress that the physical characterization did not demonstrate any clear effects of the fiber’s extraction components on its physical properties.

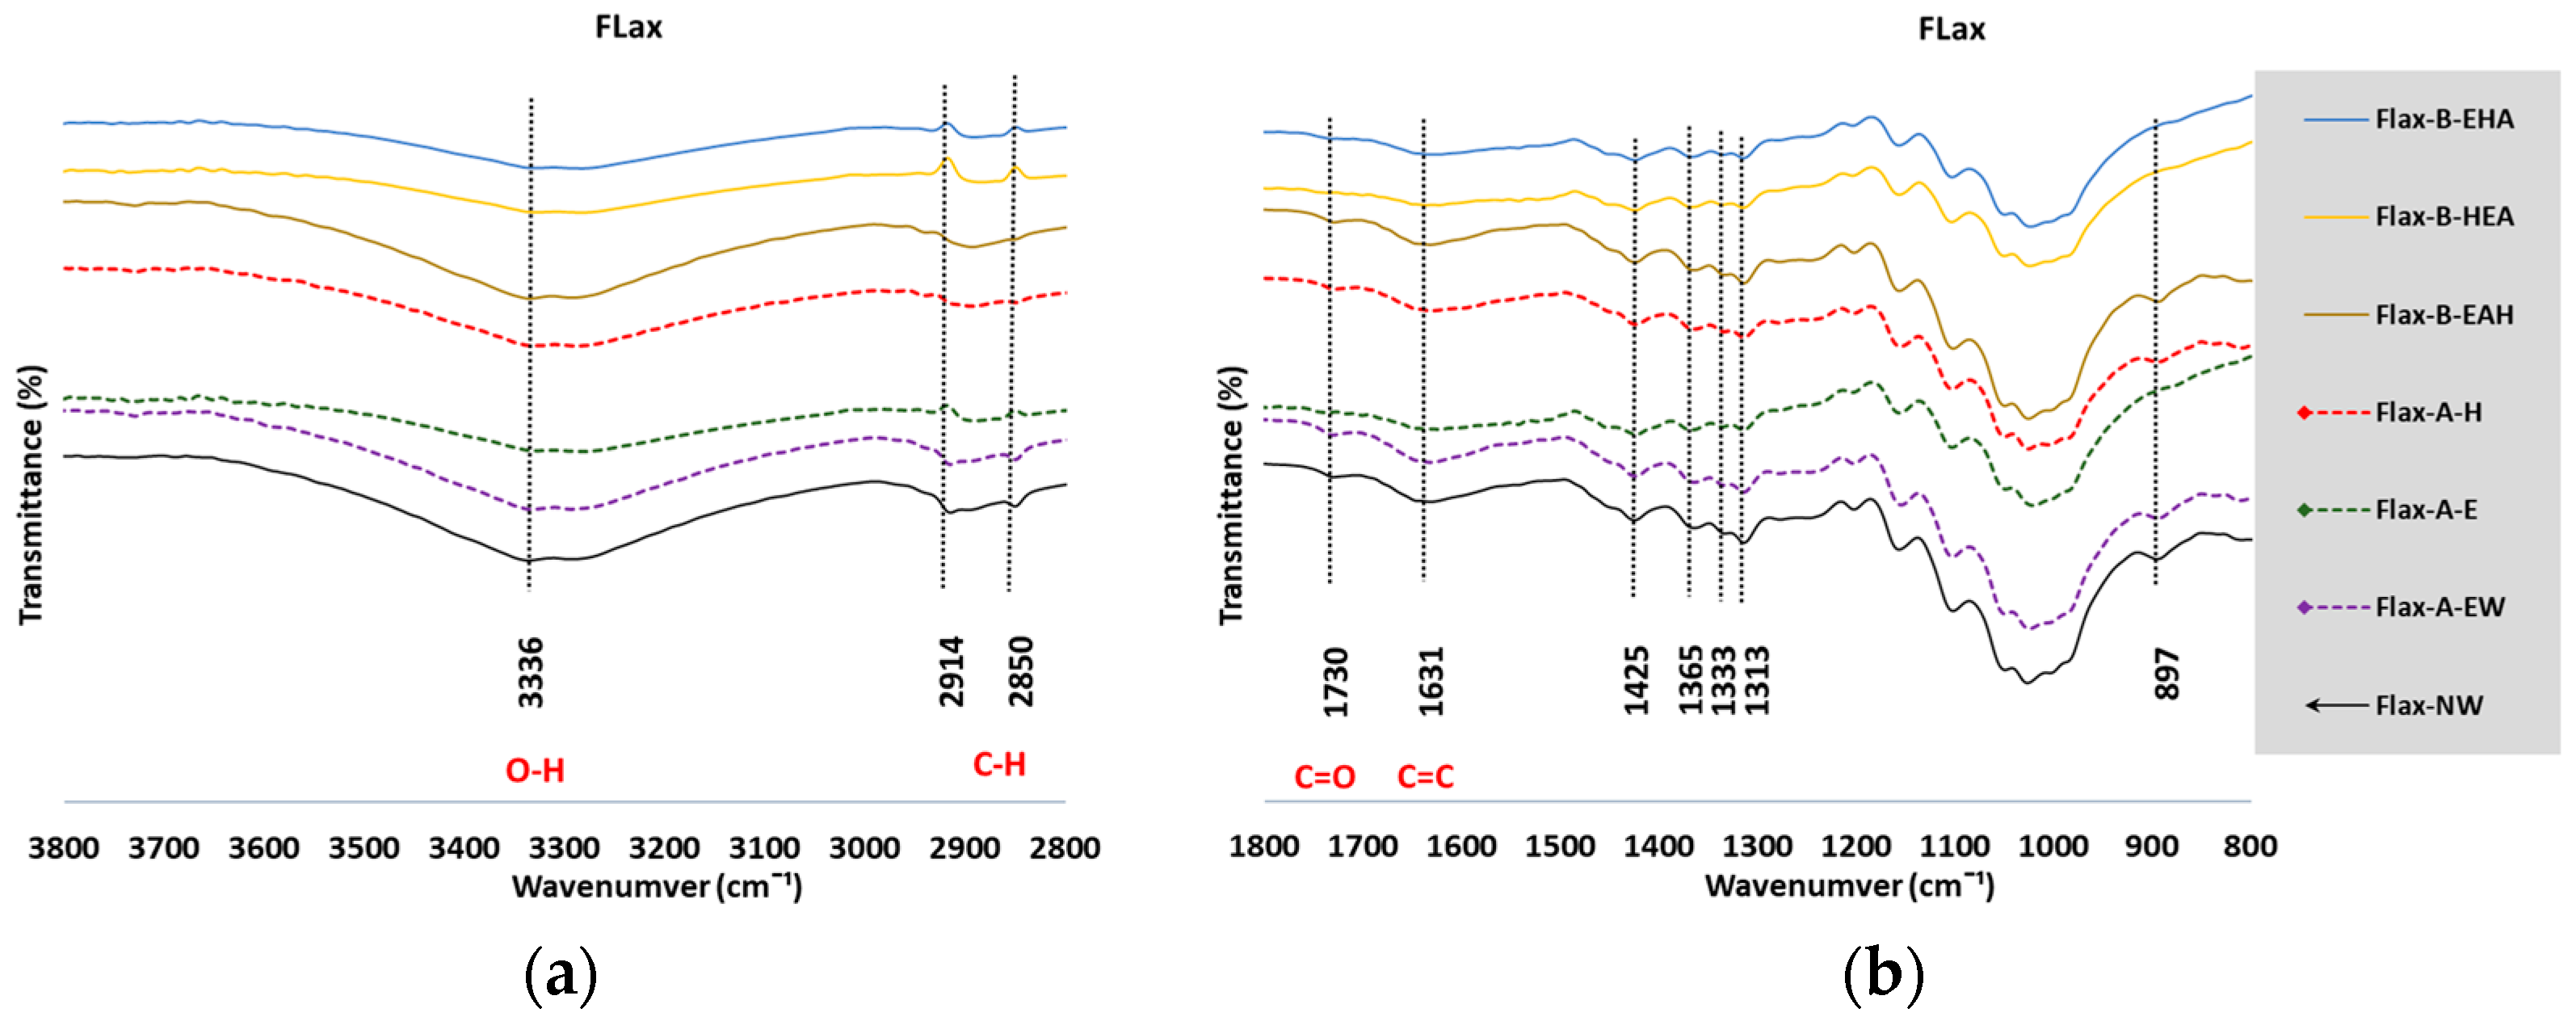
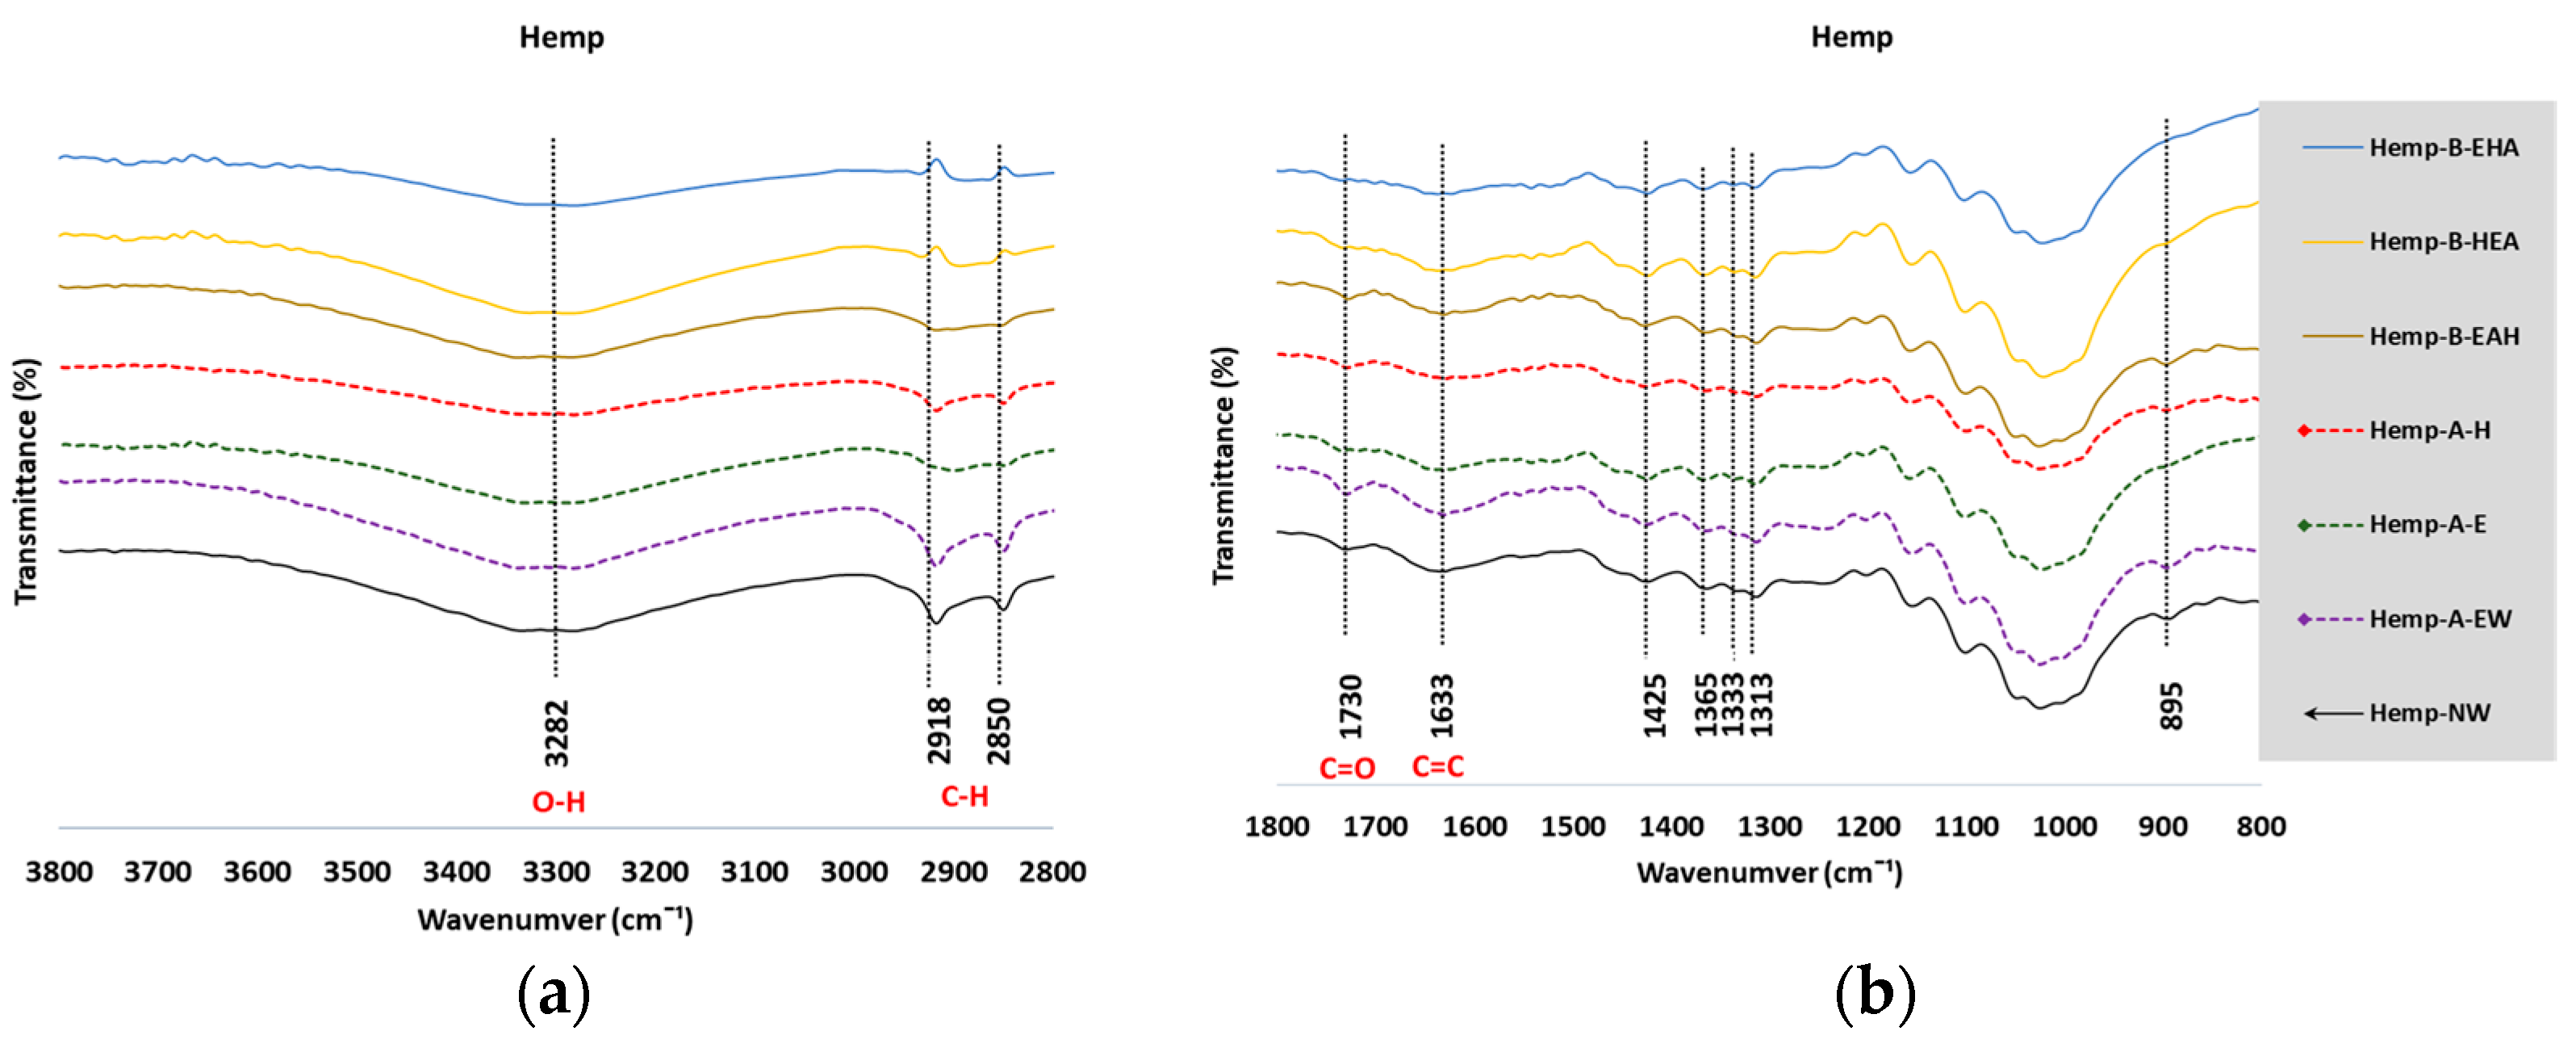
3.2. Fourier-Transform Infrared Spectroscopy

3.2.1. Analysis of the FTIR Spectra

ATR-FTIR spectra were collected for flax, sisal and hemp fibers before and after solvent treatments. The functional group (4000–1500 cm−1) and fingerprint (1500–650 cm−1) regions were analyzed in detail. The three types of fibers studied present typical spectra of lignocellulosic materials (i.e., cellulose, hemicellulose, lignin, pectin, resins and fatty acids) [30,33]; however, they also display some differences that reflect their overall chemical composition. Lignocellulosic materials contain a large concentration of -OH groups with different neighborhoods, originating in a wide band that extends from 3100–3600 cm−1. According to Schwanninger et al. [34], a maximum of around 3340 cm−1 can be assigned to cellulosic intramolecular hydrogen bonds [35], while a shift to lower wavenumbers near ~3310–3230 cm−1 is assigned to intermolecular OH bonds. Typical spectra of cellulosic materials depict the presence of both components [36]. Figure 2 illustrates intramolecular hydrogen bonding as curved dashed lines and intermolecular hydrogen bonds as straight dashed lines. Each type of interaction leads to different crystalline arrangements of the cellulosic backbone [37]. The intermolecular hydrogen bonds play an important role in fostering the parallel packing of cellulosic chains to produce elementary fibrils and microfibers [37,38,39].
Figure 3, Figure 4 and Figure 5a illustrates the –OH stretching bands of flax, sisal and hemp fibers in the wavenumber range 4000–2800 cm−1 studied in this work. A wide band is observed, with two shoulders of equivalent intensity centered near 3336 cm−1 and 3280 cm−1, indicative of intra- and intermolecular hydrogen bonding, respectively. The three types of fibers are present in this band before and after the solvent treatment procedures. All fibers depict a set of bands in the range of 2950–2800 cm−1, assigned to C–H asymmetric and symmetric stretching vibrations in methyl and methylene groups present in polysaccharides (cellulose [40,41], pectin and hemicellulose [35,42]). Lipids and fatty acids also contribute to the intensity of these bands, due to their hydrocarbon chain content in these compounds [4,29,35,43]. The latter are typically hydrophobic molecules that may be extracted by non-polar solvents. The sisal fibers revealed the highest C–H concentration as confirmed by the high intensity of the bands centered near 2850 cm−1 and 2920 cm−1 for non-washed fibers, Figure 4a They also depict a large decrease in intensity of these bands after application of all Group B-protocols, as well as A-H protocols, confirming the efficiency of hexane for the extraction of hydrocarbon-containing compounds. The former results were reflected by the sharp density-drop of sisal-A-H fibers, Table 2. This conclusion is supported by the intensity reduction observed in the fingerprint region for methylene C-H bending [34], above 1455 cm−1, for the sisal fibers treated with B and A-H protocols (Figure 4b). This peak shows a lower intensity for flax and hemp fibers compared to sisal, consistent with a lower lipid/fatty acid content. Conversely, the peak centered near 1425 cm−1 is more intense for flax and hemp fibers as compared to sisal. This peak (usually reported between 1420–1430 cm−1) relates to the crystalline structure of cellulose [35,43,44,45,46]. Treatment with polar solvents (protocols A-E and A-EW) did not induce significant removal of hydrocarbon-based compounds.
The band near 1730 cm−1 corresponds to carboxyl/aldehyde groups of the uronic acids present in hemicellulose [24,25,26,27,28,30,35,42,47,48,49,50,51], carbonyl/carboxyl groups in pectin [52], lignin segments [4,30,51,53] and aliphatic fatty acids that constitute the waxy fraction of fibers [30].
The wide band centered near 1630 cm−1 is assigned to C=C double bonds in the aromatic moieties present in lignin [30], which may overlap with water OH bending [42,52,53,54,55].
The peaks near 1365 cm−1 (for flax and hemp) and 1373 cm−1 (for sisal) are characteristic of C-H bending in cellulose and hemicellulose [35,36,53,55,56,57]. Oh et al. [54] reported that a shift of this band to a higher wavenumber could be assigned to a less ordered cellulose structure. The band centered at 1313–1317 cm−1 observed in Figure 3, Figure 4 and Figure 5b is assigned to CH2 wagging and is characteristic of crystalline cellulose, while the band near 1336 cm−1 is due to C–O–H in-plane bending and is a contribution from amorphous cellulose [49].
The C–O–C group in the aromatic moieties of lignin presents a stretching vibration at 1245 cm−1, which is more evident for sisal than for flax and hemp fibers. The characteristic C–O–C asymmetric stretching for carbohydrates and cellulose is observed near 1155 cm−1. Furthermore, minimal changes in the position and intensity of the bands near 1100 cm−1 before and after washing, using the different protocols, were observed.
The band around 1022–1026 cm−1 is assigned to C–O stretching in carbohydrates (mainly cellulose) [35,58] but may also be attributed to aromatic C–H deformation in lignin [27,29,51,59,60].
Finally, the low-intensity bands recorded in the range 895–899 cm−1 in flax, sisal and hemp were assigned to C–O–C [29,61,62] and to C–H out-of-plane bending [43,45,54] or asymmetric out-of-phase ring stretching in amorphous cellulose [49,52,63]. The application of protocols B-EHA and B-HEA, as well as A-E, lead to a considerable decrease of this band intensity for all fiber types.
The above interpretations associated with the IR spectra of lignocellulosic materials clearly illustrate their complexity. The presence of polysaccharides with similar chemical nature but different structures, together with complex lignin molecules, lipids, fatty acids, and so on, make unequivocal band assignment a very challenging task [52].

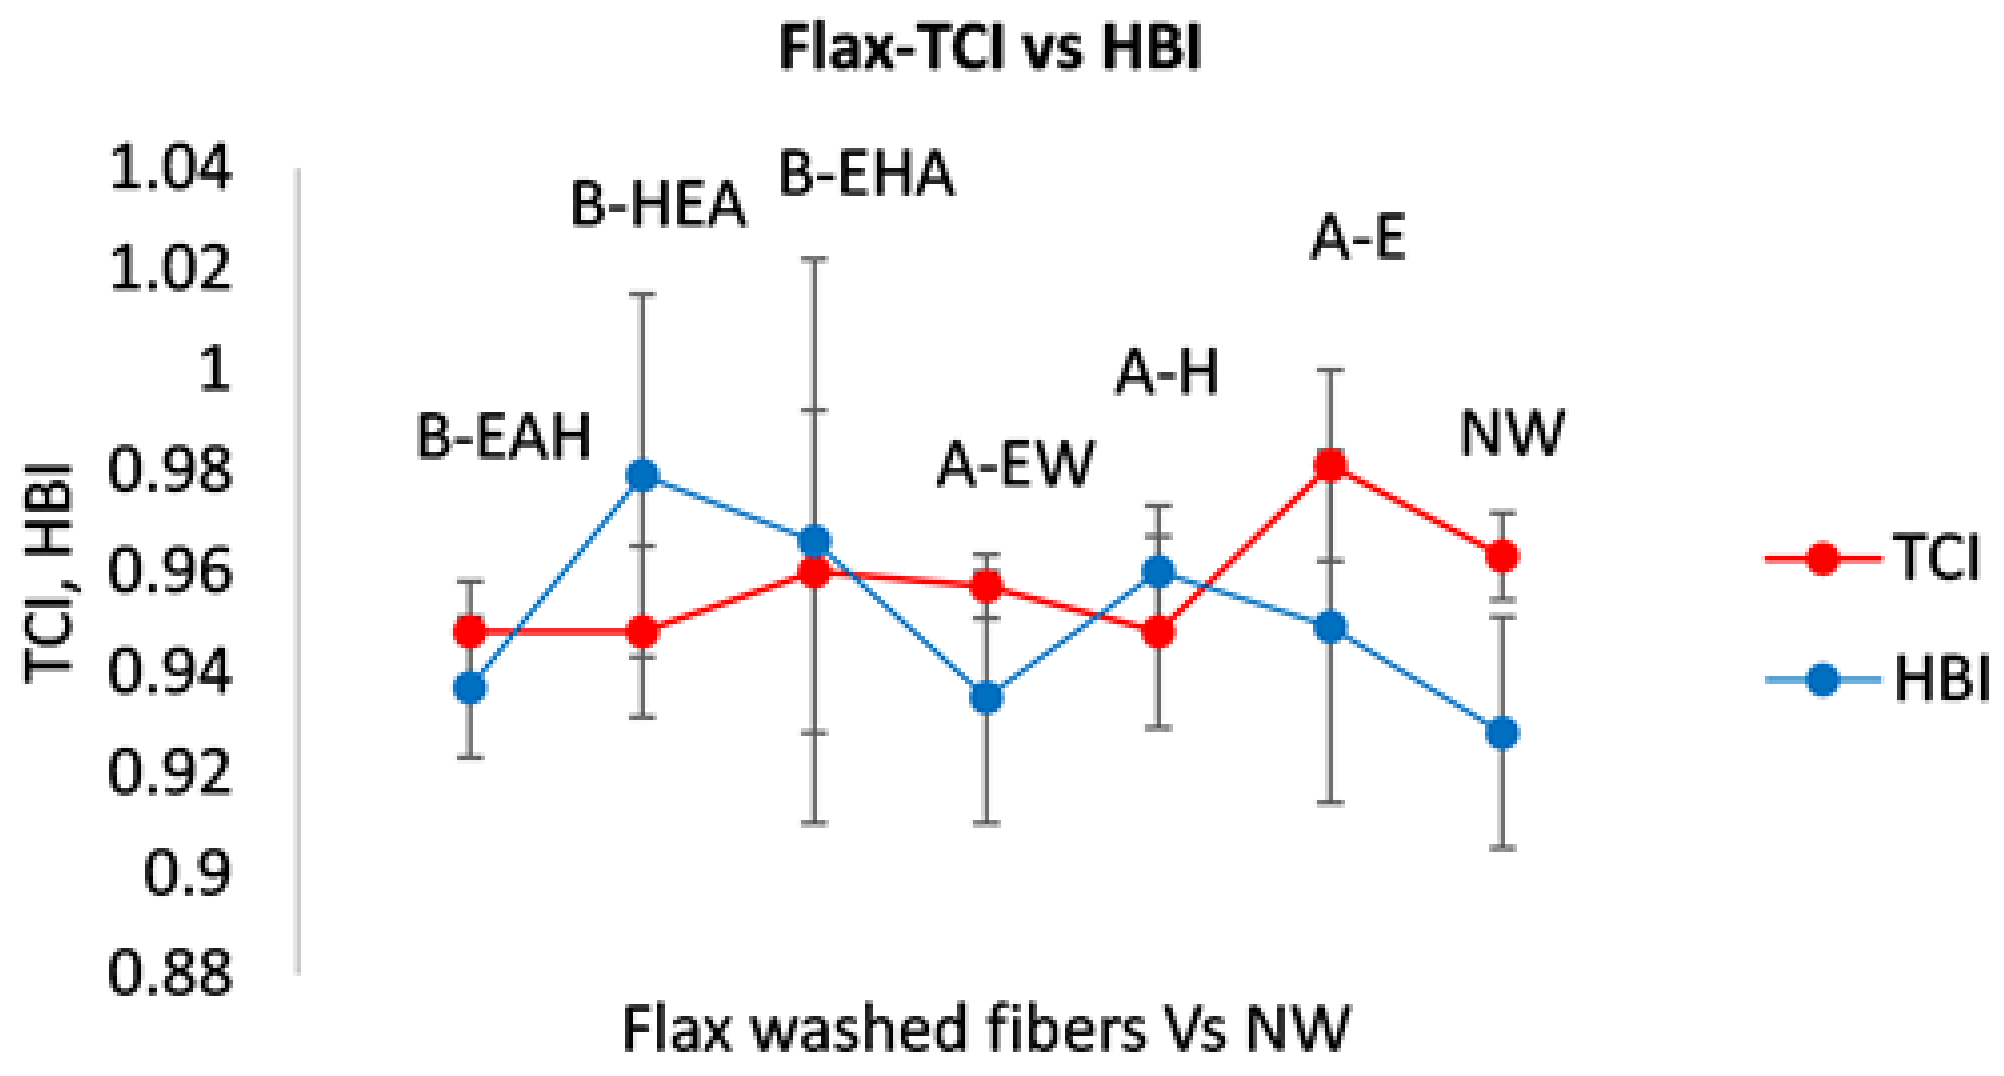
3.2.2. Estimate of Crystallinity Indexes

The FTIR analysis of lignocellulosic materials has been described in the literature as an interesting tool to characterize crystallinity changes in these materials, providing reasonable correlations with X-ray diffraction results [43,49]. In spite of the FTIR limitations in terms of detection limits and consistency of peak resolution, shape and wavenumber over a large concentration range, the technique is widely available and may provide relevant structural data.
Several indexes based on band intensity ratios were reported to provide reliable information about structural changes by lignocellulosic materials after exposure to chemical and enzymatic treatments. A crystallinity index (CI) is defined as the ratio of intensities of a crystallinity-related peak to a non-crystalline peak in the same spectrum. Thus, based on the FTIR spectrum, a number of indexes were defined that relate to the molecular organization. Hydrogen bond intensity (HBI) was defined as the ratio between 3350 cm−1/1336 cm−1 bands, correlating the intensity of the hydroxyl band in the 4000–3000 cm−1 region to the intensity of C–OH in-plane bending at 1336 cm−1. HBI relates the hydrogen bond length to chain mobility, as described by several authors [54,56,64]. Lateral order index (LOI) relates to the ordered regions perpendicular to the direction of the cellulosic chain [61] and is expressed as the intensity ratio between 1429 cm−1 (characteristic of crystalline cellulose) and 897 cm−1 bands (originating from amorphous cellulose). The total crystallinity index (TCI) is defined by the ratio between 1370 cm−1 and 2900 cm−1 bands, as described by Nelson and O’Connor (1964). Finally, the intensity ratio I, between 1317 cm−1 and 1336 cm−1 (corresponding to CH2 wagging in crystalline cellulose and C-OH in-plane bending, respectively) was reported to quantify crystallinity and correlate to the state of cellulose structure, with increasing I values indicating higher crystallinity [49].
The results obtained for the aforementioned parameters are listed in Tables S3–S5 (in Supplementary Materials) for flax, sisal and hemp, respectively. The LOI parameter could not be calculated for most of the treated samples owing to the absence of the band near ~897 cm−1, Figure 3, Figure 4 and Figure 5b. The intensity ratio (I = 1317 cm/1336 cm−1) results were quite invariant for flax and hemp before and after solvent washing, pointing at good stability of the crystalline content towards these solvents. However, it should be noted that these semi-quantitative-based parameters obtained from the FTIR spectrum are not always consistent and require confirmation using other techniques [45].
TCI values reflect the concentration of C-H asymmetric stretching vibrations near 2900 cm−1, which in turn is proportional to the amount of hydrocarbon-based compounds, as mentioned previously [43]. Solvent treatment is expected to extract part of the hydrocarbon and lipid components partially dissolving in ethanol and acetone, while the non-polar chains of fatty acids and wax-based components will preferentially dissolve in hexane. Thus, higher TCI values are expected for samples with higher hydrocarbon content, such as unwashed hemp (Figure 6) and sisal (Table S4), as was generally observed.
HBI values did not experience significant variations, showing no evidence for major crystallinity modifications due to the solvent protocols (Figure 7). To this end, the different chemical compositions along with the anisotropic nature of the investigated lignocellulosic materials, even along one single yarn, generate several complexities to conduct a uniform and meaningful measurement of crystallinity using FTIR analysis.

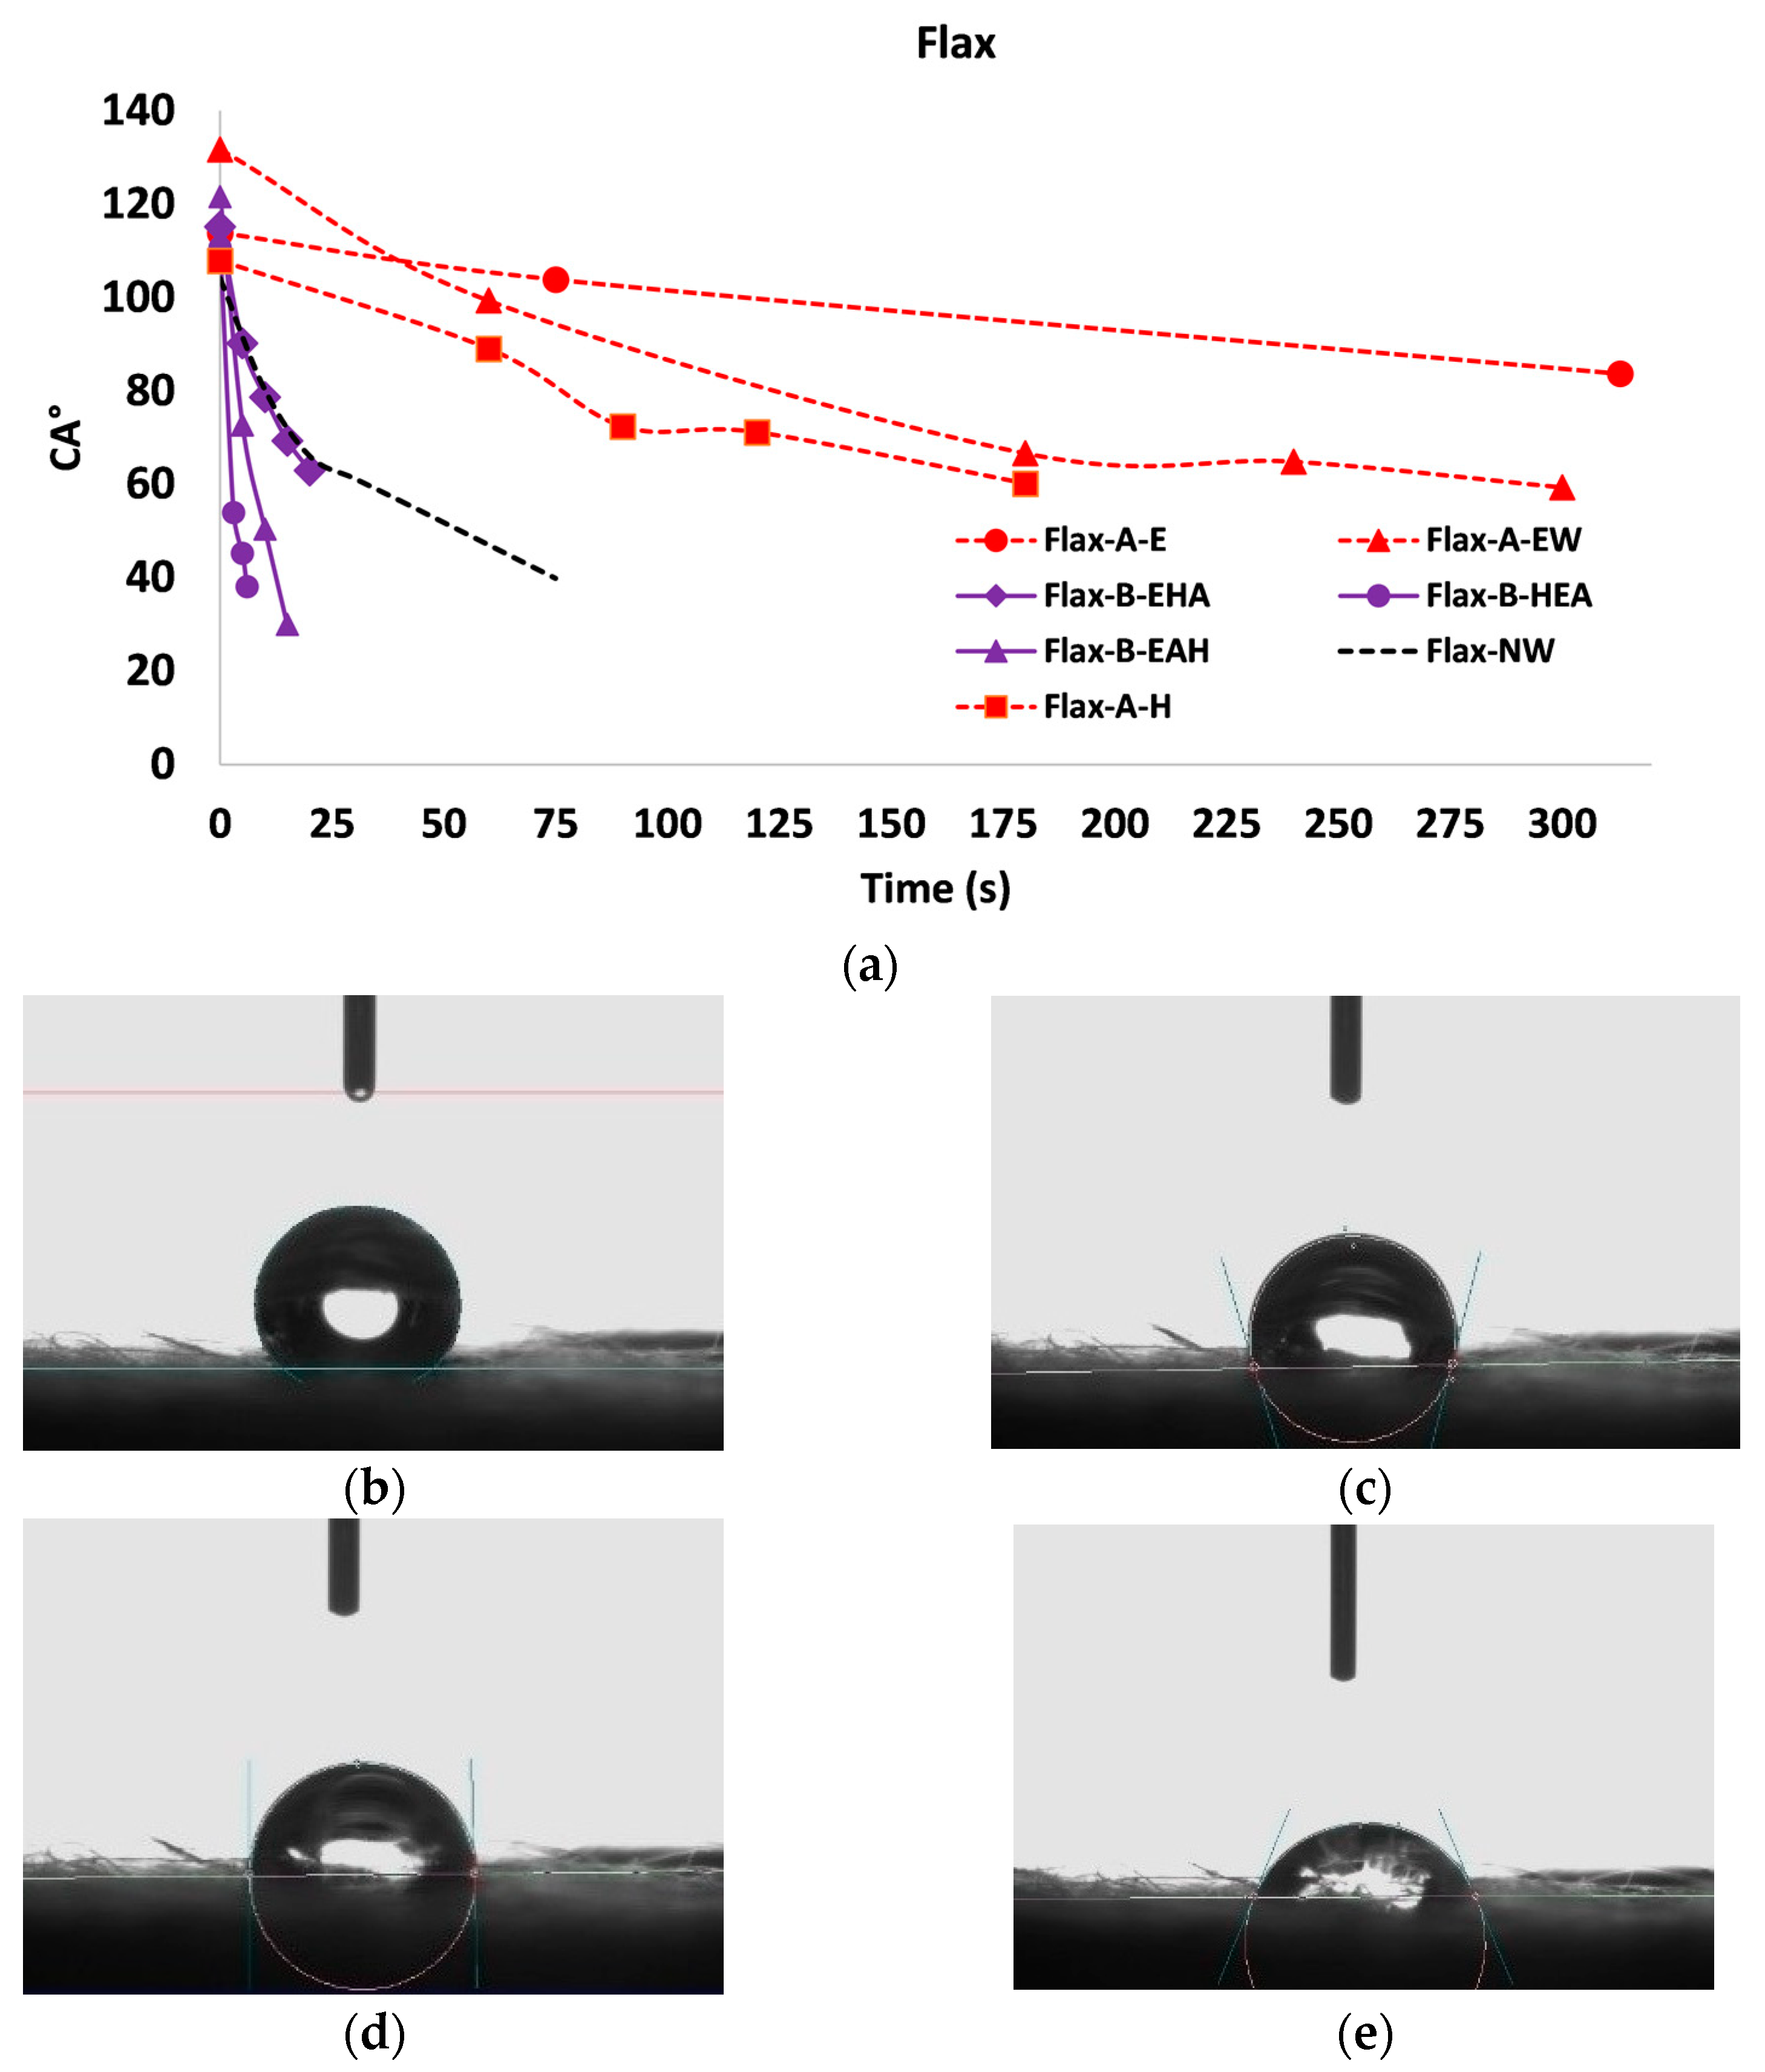
3.3. Wettability Characterization

The sessile drop contact angle (SCA) with water was measured for flax and hemp fibers, and its variation with time was recorded; the results are presented in Figure 8 and Figure 9. The contact angle was recorded within 5 min of drop deposition or until the total spread of the droplet. The droplet shape became unstable after approximately 3 min after deposition on flax-A-H fibers, and thus the measurements were suspended.
Free hydroxyl groups present in polysaccharides (namely cellulosic β-glucose, hemicellulose and pectin) induce fiber hydrophilicity, and thus, increase wettability towards water [65,66]. Furthermore, aldehyde groups, mainly present in polysaccharides and hemicellulose, may also increase hydrophilicity [65]. Observation of the flax and hemp FTIR spectra show lower intensities of the 1730 cm−1 band (associated with aldehyde) for the Group A-treated fibers, which may contribute to the higher hydrophobicity observed in Figure 8 and Figure 9. FTIR spectra also show that hemp fibers present a higher concentration of methylene groups (2920–2850 cm−1) compared to flax. The C-H groups partly originate on fatty acids and other wax-type compounds, thus contributing to the higher hydrophobicity observed for hemp fibers in general.
Lignin is less hydrophilic than cellulose due to its aromatic carbon content and is highly resistant to extraction compared to hemicellulose [67]. The extractable compounds are hydrophilic polysaccharides, such as pectin and hemicellulose, and on the more hydrophobic side, waxes. The former compounds may partially dissolve in ethanol and acetone, while the latter consists of a mixture of compounds with a range of functional groups and will partially dissolve in all solvents. The hydrocarbon fraction of the wax is mostly extracted by hexane. The contact angle results for flax and hemp illustrate a consistent hydrophobic character of the Group A-treated fibers, showing lower hydrophobicity for hexane treatment. Treatment with a single polar solvent partially extracts non-crystalline hydrophilic compounds, leaving non-polar constituents of the fibers, thus enhancing the hydrophobic character. Treatment with hexane alone reduces the hydrophobicity of the fibers, although maintaining a general hydrophobic tendency. Finally, treatment with a combination of two solvents with intermediate polarity and a non-polar solvent demonstrated high efficiency to dissolve polar and apolar non-crystalline compounds, leaving the crystalline cellulose fraction and most of the lignin intact. The higher hydrophilicity rendered by Group B may be associated with the exposure to the hydrophilic cellulosic backbone [66].

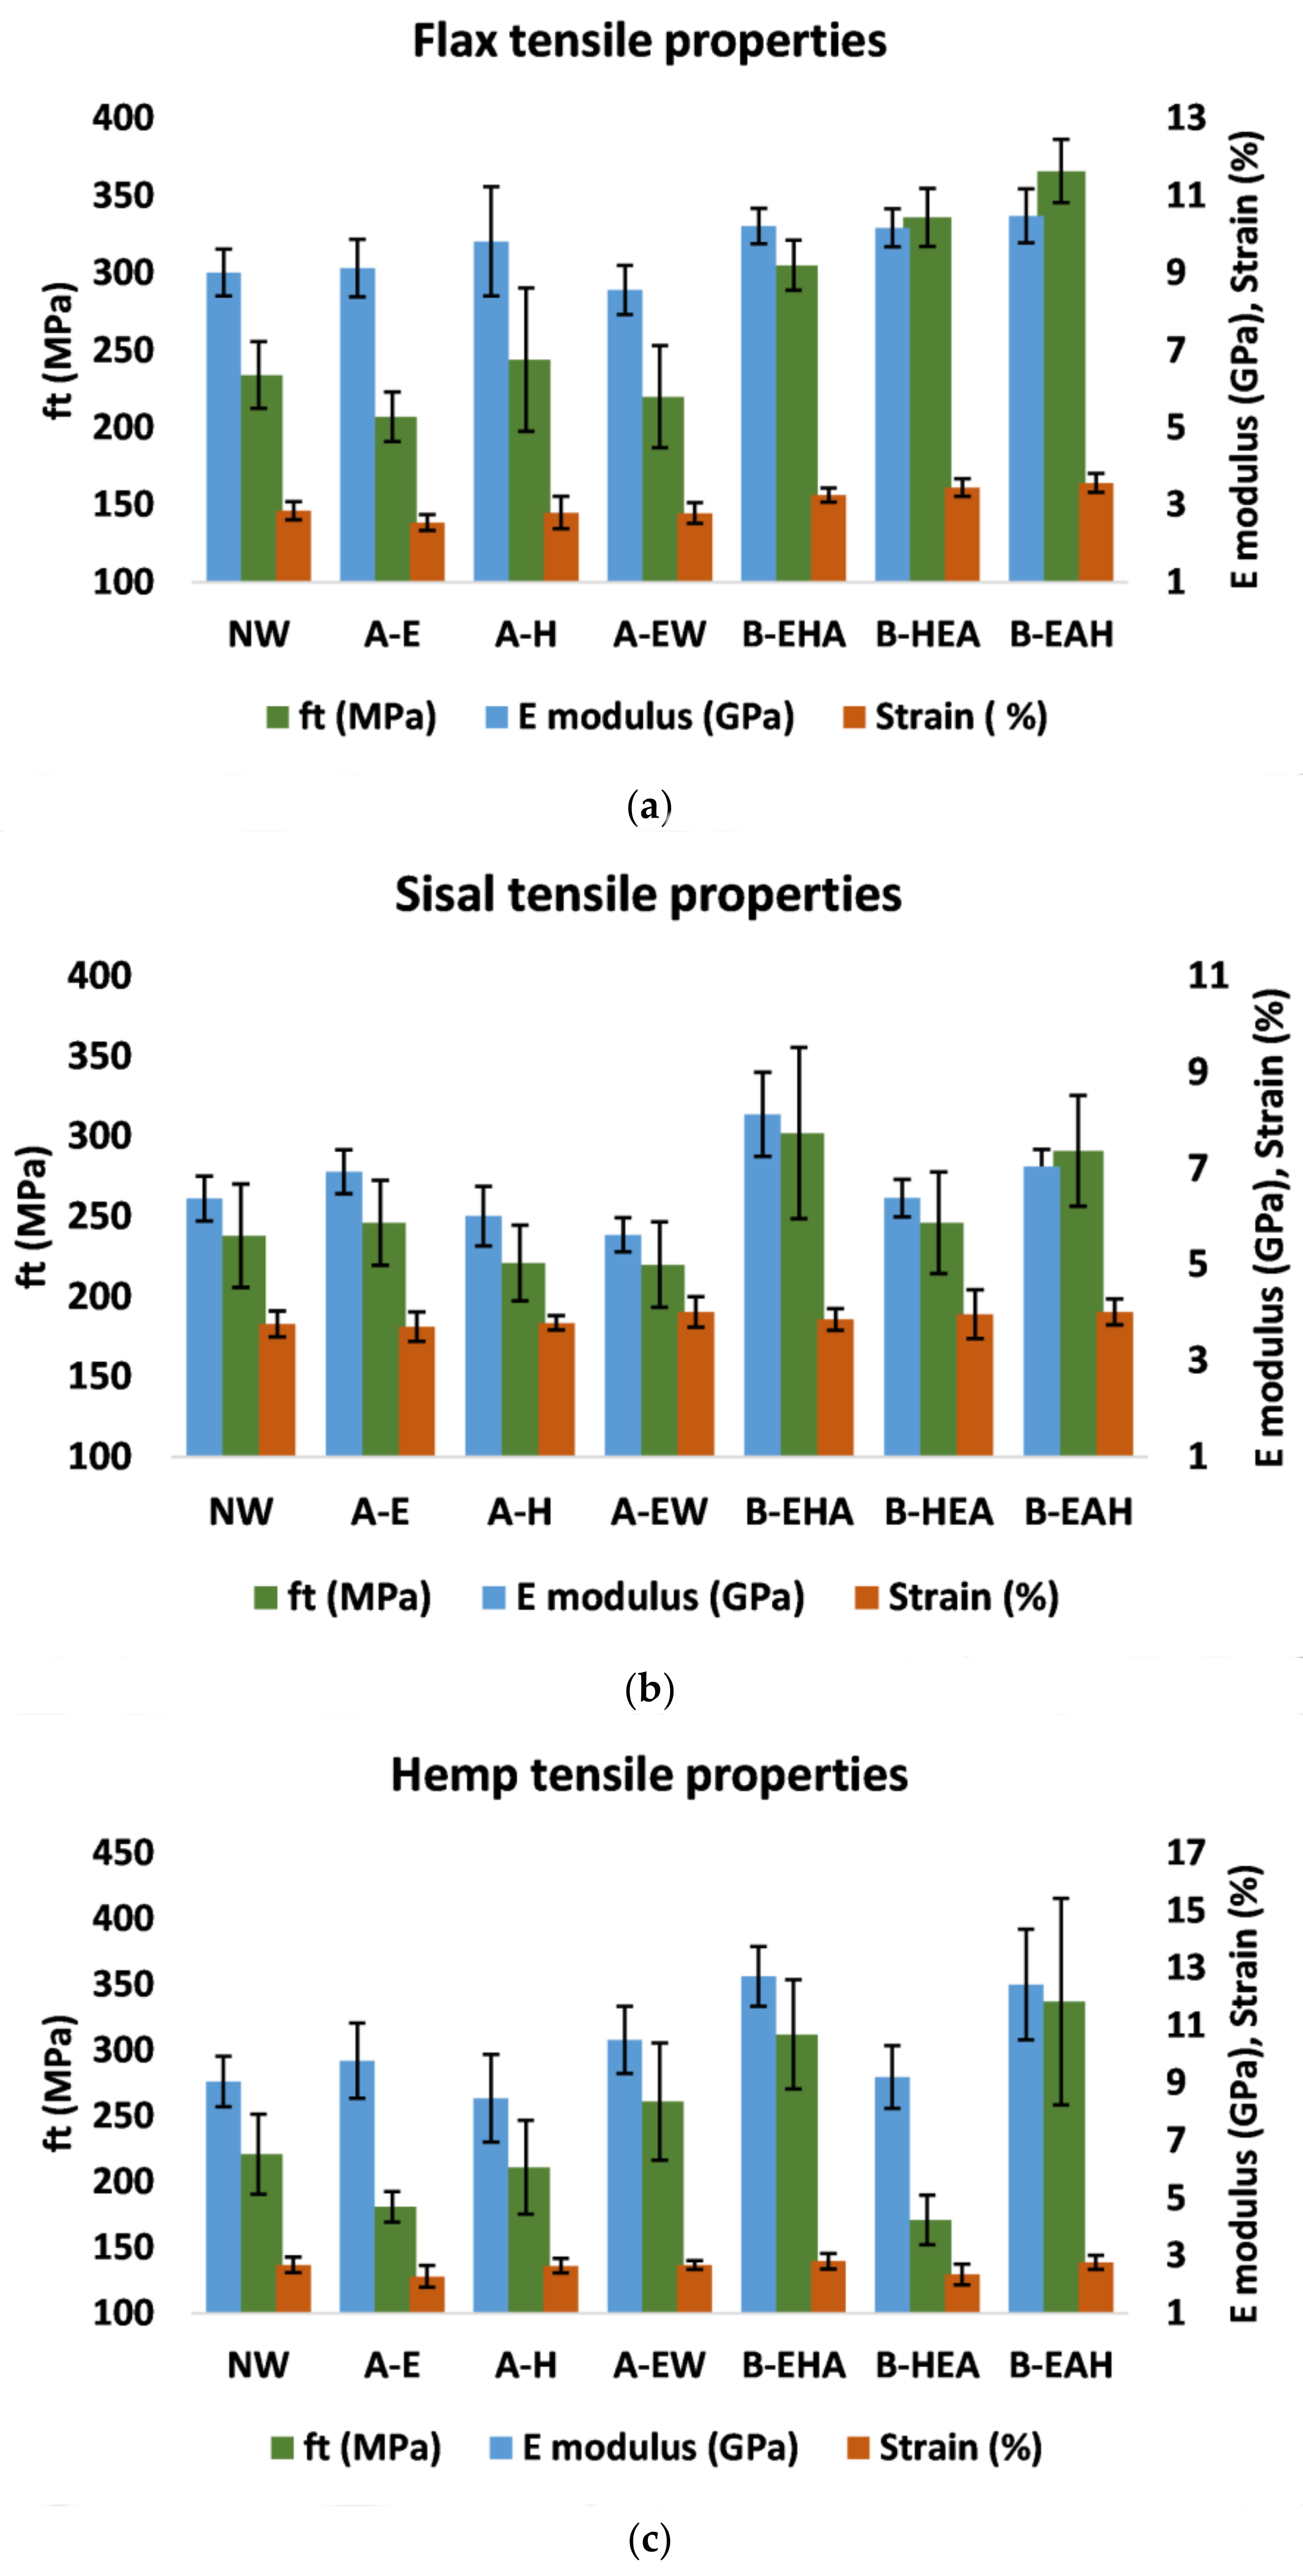
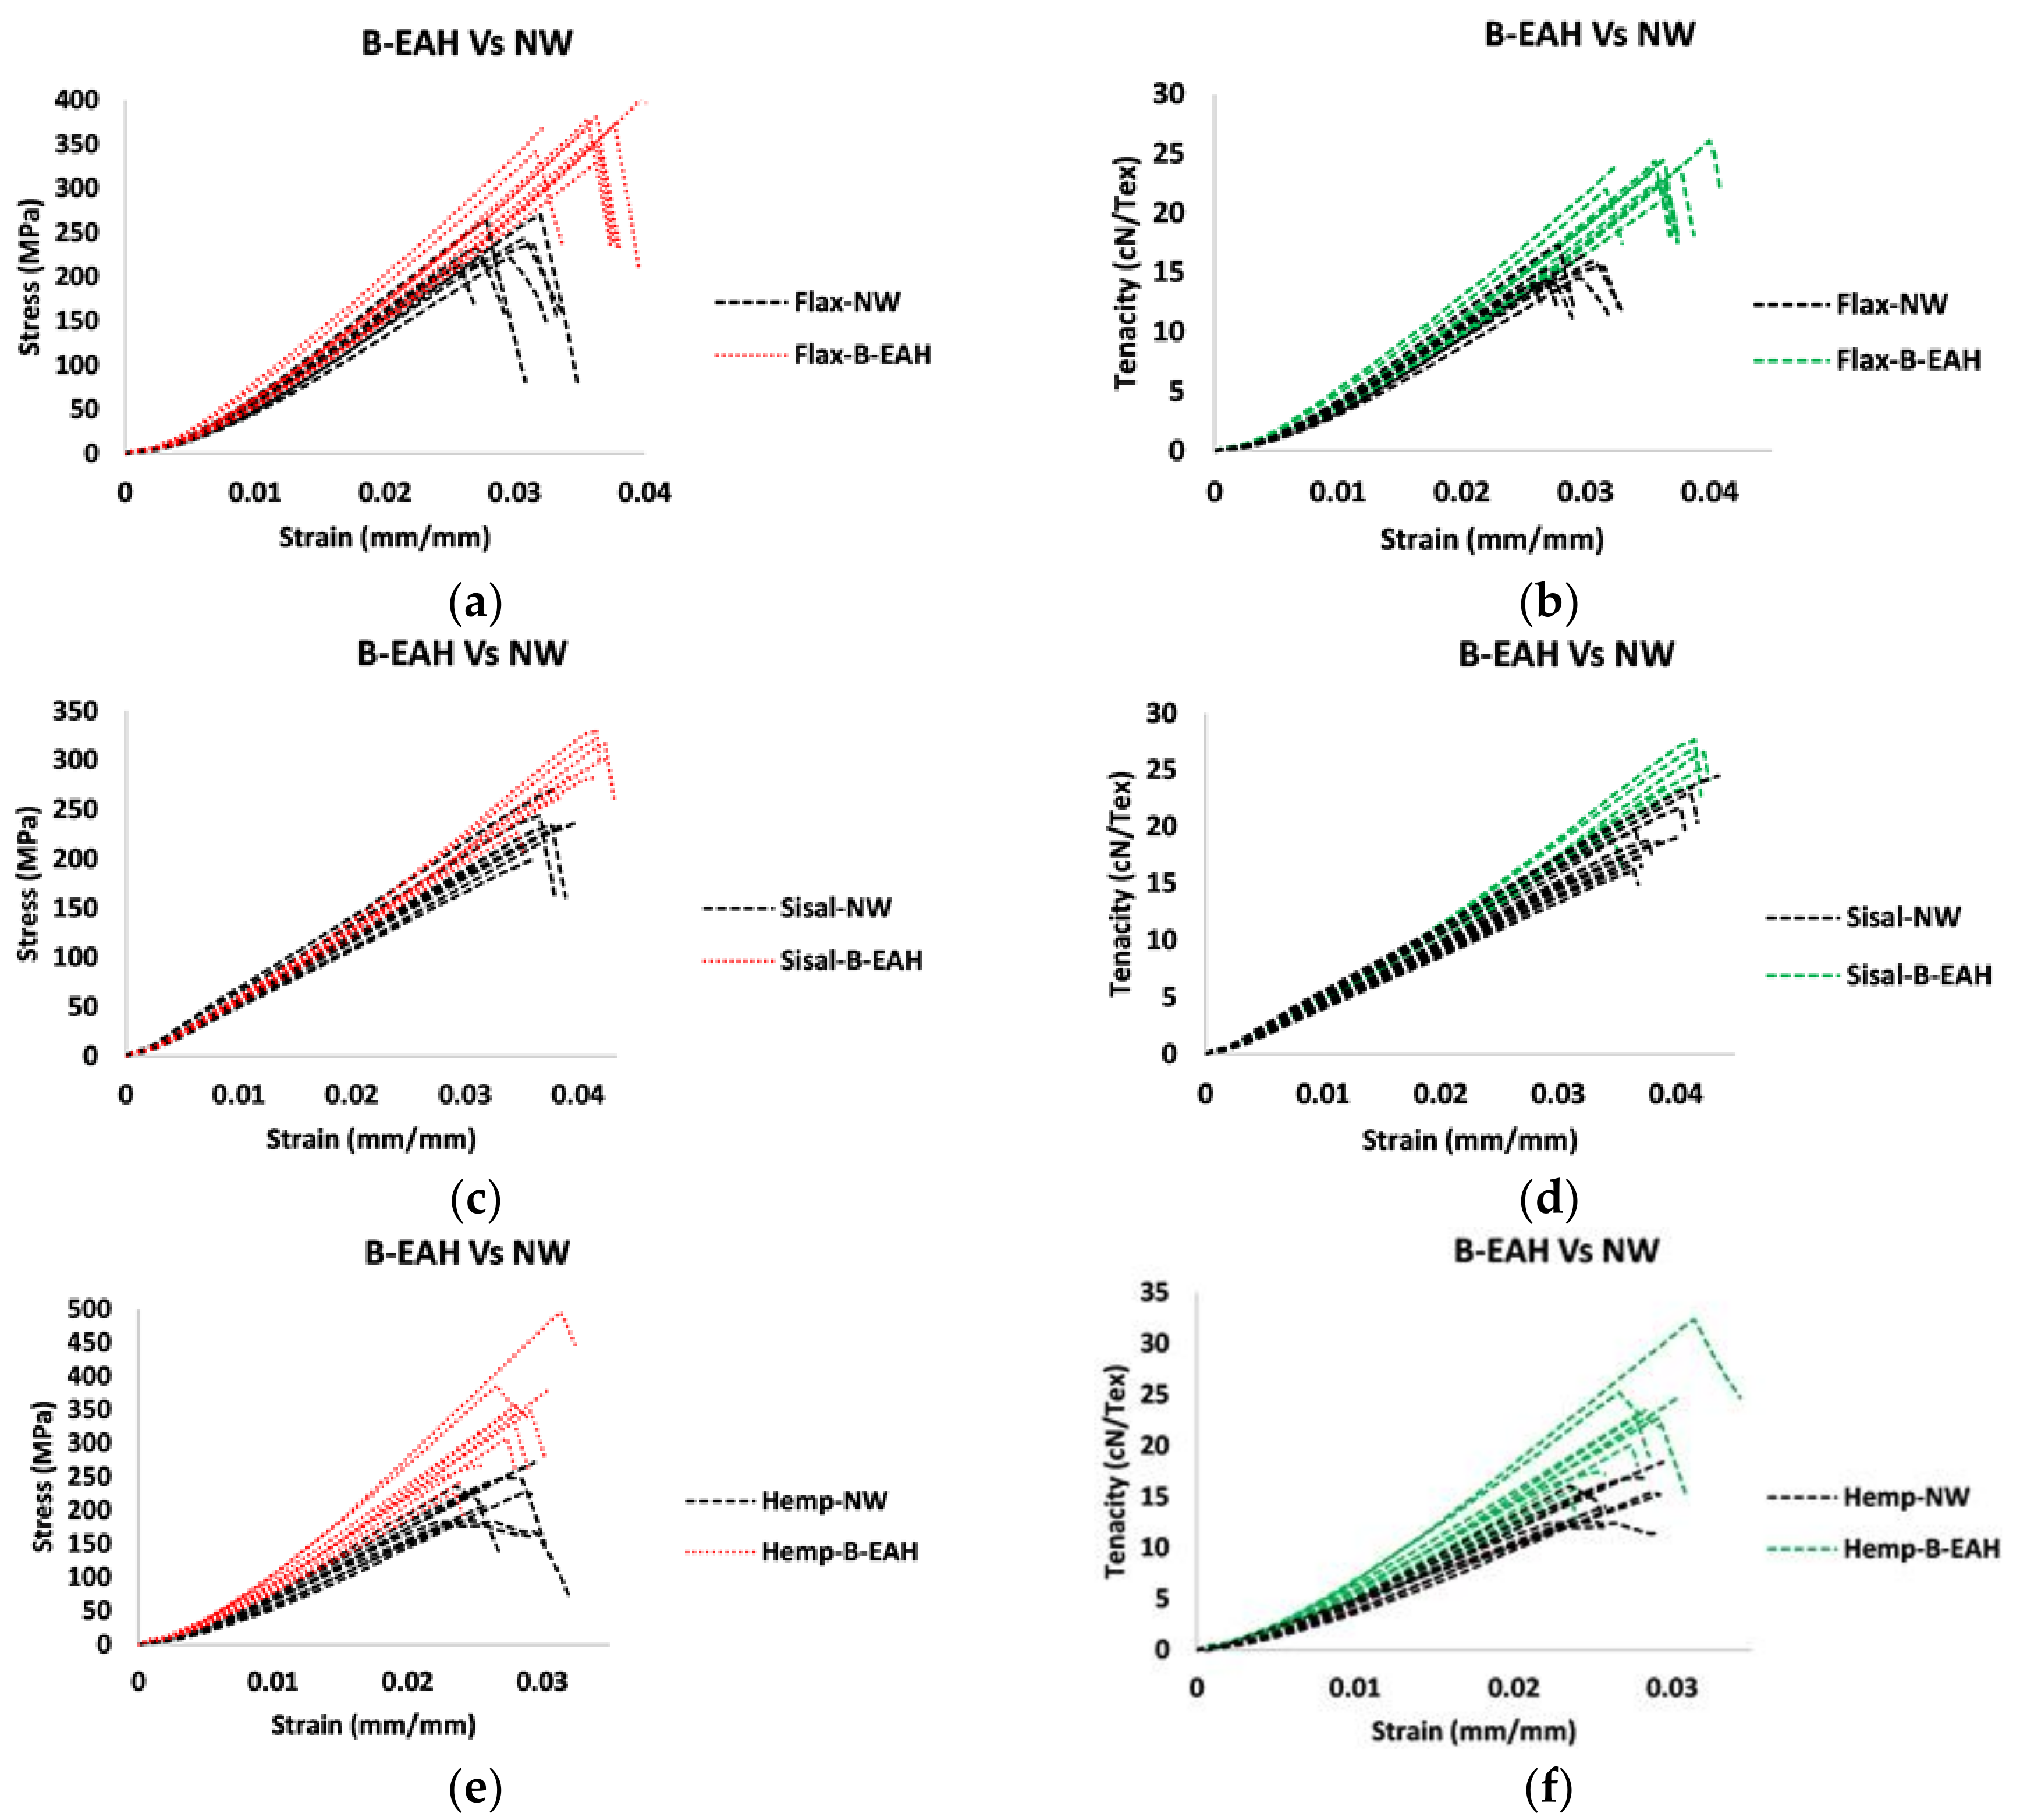
3.4. Tensile Properties Characterization

The results of the fibers’ tensile properties, including rupture load (Pmax), tensile strength ( f t ), modulus of elasticity (E), elongation at break ( ε t ) and tenacity (T) are presented in Tables S6–S8 (Supplementary Materials), Figure 10a–c for flax, sisal and hemp, respectively, as well as Figure 11. In terms of rupture mechanisms, all tested samples experienced a brittle rupture in the middle of the gauge length (samples breaking near the clamps were neglected). There was a gradual decrease in fiber cross-sections along with load increase, reaching the maximum capacity of the fiber and ending in abrupt failure.
The stress-strain graphs illustrate the tensile response of all the fibers; the non-washed fibers present a significantly lower initial stiffness, especially for bast fibers (i.e., flax and hemp), relative to leaf-based fibers (sisal), Figure 11a,c,e. This low initial stiffness reached up to 7–10% of the load-carrying capacity of the fibers. This limitation in natural fibers can be attributed to their limited ability to rearrange along the tensile direction at the beginning of loading, which could be from their inadequate transferability of stresses at the early phases of the test. Consequently, it is held that this phenomenon induces further complications to their composite’s anisotropy, thus, affecting the deformability as well as triggering the occurrence of premature cracks in the mortar. However, researchers proposed that after that initial phase, the tilt angle of the fibrils becomes smaller, an issue that confers a stable and higher Young’s modulus to the yarn until rupture [32]. Hereby, Young’s modulus was calculated as the slope of the elastic part between 10–50% of ( f t ). In Figure 10, it is evident that Group B protocols (mainly B-EAH) have led to the highest tensile results ( f t ,   E   and   ε t ), excluding hemp-B-HEA, while Group A treatments caused a drop in the fibers tensile properties. To further detail, flax-B-EAH scored greater tensile strength, Young’s modulus and elongation at break (by 56%, 16% and 25% respectively), compared to the non-washed samples, Figure 10a. For hemp-B-EAH and sisal-B-EAH, we found a 52% and 22% higher tensile strength (Figure 10b,c), 37% and 10% higher Young’s modulus and 3.5% and 6.6% higher deformability, respectively. It is worth mentioning that Group B-sisal fibers have exhibited the most scattered results (Figure 10b) compared to the other two fiber types. However, variations are expected to occur in naturally-occurring lignocellulosic fibrous materials, e.g., drop of mechanical properties of hemp-B-HEA, given their anisotropic nature and responses to solvents. The higher stiffness and strength delivered by Group B can be the result of defect removal from the fibers without inducing damage; thus, better homogeneity amid interfibrillar areas [42], inter-fibrous friction and a higher fraction of cellulose could be achieved. The latter issue can be reflected by boosting fibers’ ability to restructure and reorientate along tensile direction [67]. By contrast, Group A led to the excessive removal of specific types of cementing non-cellulosic materials (depending on the solvent type) and/or damage throughout kick band and excessive fiber defibrillation [65,67].
Figure 11b,d,f depict tenacity-strain graphs of B-EAH-samples compared to the unwashed samples. In a relevant study, Corbin et al. [68] investigated the changes in the tenacity of flax yarns and rovings. Similarly, apart from twist level variations (important factor affecting yarn and roving tenacity), they reported a higher tenacity and modulus induced after the removal of impurities and amorphous components in flax rovings.
According to Baley [32], for a natural fiber to deform under tension, the non-crystalline regions play a crucial role in enabling a significant shearing in the non-crystalline region to comply with the new configuration of the fibrillar structure. By previewing the drop of the ultimate strain capacity by Group A, an emphasis on the structural importance of the non-cellulosic product was pointed out [21,65,69].
Figure 12 depicts the relation between the flax and hemp fibers’ wettability properties with respect to their mechanical properties. It is held that since the material studied in this work is naturally-occurring, a limited R2 value might deliver a meaningful statistical interpretation. There is a valid indication that the fiber hydrophilicity observed in Group B can be justified by the exposure of a higher fraction of the hydrophilic and crystalline cellulosic backbone, especially since they mechanically outperformed Group A-washed fibers. Furthermore, such a relation was also observed when hemp-B-HEA (Group B) showed low mechanical properties revealing a hydrophobic trend, Figure 12b.

4. Conclusions

This work presents an optimized washing protocol for as-received natural fibers (flax, hemp and sisal), intended to prepare fibers for large-scale composite manufacturing (i.e., structural strengthening of historical masonry). The protocol employed washing with selected solvents, individually and in sequence (ethanol/acetone/hexane), for cleaning compounds that may be detrimental to interfacial strength, exposure of the crystalline cellulosic backbone, and enhancement of the mechanical properties of the fibers.
It was observed that the washing process itself could be controlled to enhance the fibers’ mechanical properties and induce characteristics desired in composite manufacturing (namely adhesion enhancement and dimensional stability). Furthermore, the extraction liquids used to soak the fibers may be reusable for the same purpose after decantation and distillation, hence improving sustainability.
The experimental characterization used contact angle and tensile tests to confirm successful exposures of high-content hydrophilic and crystalline cellulose.
FTIR techniques did not demonstrate a decrease in crystallinity upon application of the proposed protocol. However, FTIR may not be a robust tool to characterize crystallinity in the lignocellulosic material; thus, more specific techniques should be used to investigate crystallinity changes.
This work demonstrates the importance of controlling the partial extraction of materials with low reinforcing character. Similar to any composite material, an elementary fiber is a unitary composite material that comprises reinforcements (crystalline cellulosic fibrils) and cementing materials (i.e., pectin, hemicellulose and lignin) that bond these fibrils in the interfibrillar regions. Hence, excessive removal of these components compromises the structural behavior of the elementary fiber and, consequently, the resultant yarn. Partial removal of these binders may enhance the yarns’ mechanical properties and expose a surface with adequate chemistry for further protection and strengthening.

Supplementary Materials

The following are available online at https://0-www-mdpi-com.brum.beds.ac.uk/article/10.3390/fib9090054/s1. Table S1: Semi-quantitative estimate of crystallinity for flax fibers, Table S2: Semi-quantitative estimate of crystallinity of sisal fibers, Table S3: Semi-quantitative estimate of crystallinity of hemp fibers, Table S4: Tensile properties of flax yarns, Table S5: Tensile properties of sisal yarns, Table S6: Tensile properties of hemp yarns.

Author Contributions

Conceptualization, M.C.P., D.V.O. and A.A.; methodology, A.A., M.C.P., D.V.O.; investigation, A.A.; data curation, A.A.; writing—original draft preparation, A.A.; writing—review and editing, M.C.P., D.V.O., P.B.L. and R.F.; supervision, M.C.P., D.V.O. and P.B.L.; funding acquisition, P.B.L. All authors have read and agreed to the published version of the manuscript.

Funding

This work was partly financed by the Portuguese Foundation for Science and Technology (FCT/MCTES) through national funds (PIDDAC) under the R&D Unit Institute for Sustainability and Innovation in Structural Engineering (ISISE) under reference UIDB/04029/2020. IPC acknowledges the support of FCT through National Funds References UIDB/05256/2020 and UIDP/05256/2020. The authors wish to acknowledge FCT for the PhD scholarship granted to the first author (SFRH/BD/144106/2019).

Data Availability Statement

Not applicable.

Acknowledgments

The authors wish to acknowledge FCT for the PhD scholarship granted to the first author (SFRH/BD/144106/2019).

Conflicts of Interest

The authors declare no conflict of interest.

References

  1. Pickering, K.L.; Efendy, M.G.A.; Le, T.M. A review of recent developments in natural fibre composites and their mechanical performance. Compos. Part A Appl. Sci. Manuf. 2016, 83, 98–112. [Google Scholar] [CrossRef] [Green Version]
  2. Abbass, A.; Lourenço, P.B.; Oliveira, D.V. The use of natural fibers in repairing and strengthening of cultural heritage buildings. Mater. Today Proc. 2020, 31, S321–S328. [Google Scholar] [CrossRef]
  3. Wei, J.; Meyer, C. Degradation mechanisms of natural fiber in the matrix of cement composites. Cem. Concr. Res. 2015, 73, 1–16. [Google Scholar] [CrossRef]
  4. De Almeida, J.; Filho, M.; De Andrade, F.; Dias, R.; Filho, T. Degradation kinetics and aging mechanisms on sisal fiber cement composite systems. Cem. Concr. Compos. 2013, 40, 30–39. [Google Scholar] [CrossRef]
  5. Claramunt, J.; Ardanuy, M.; García-Hortal, J.A.; Filho, R.D.T. The hornification of vegetable fibers to improve the durability of cement mortar composites. Cem. Concr. Compos. 2011, 33, 586–595. [Google Scholar] [CrossRef]
  6. de Carvalho Bello, C.B.; Cecchi, A. Experiments on natural fibers: Durability and mechanical properties. Adv. Mater. Process. Technol. 2017, 3, 632–639. [Google Scholar] [CrossRef]
  7. Wei, J. Degradation behavior and kinetics of sisal fiber in pore solutions of sustainable cementitious composite containing metakaolin. Polym. Degrad. Stab. 2018, 150, 1–12. [Google Scholar] [CrossRef]
  8. Filho, R.D.T.; Scrivener, K.; England, G.L.; Ghavami, K. Durability of alkali-sensitive sisal and coconut ® bres in cement mortar composites. Cem. Concr. Compos. 2000, 22, 127–143. [Google Scholar] [CrossRef]
  9. Grilo, J.; Silva, A.S.; Faria, P.; Gameiro, A.; Veiga, R.; Velosa, A. Mechanical and mineralogical properties of natural hydraulic lime-metakaolin mortars in different curing conditions. Constr. Build. Mater. 2014, 51, 287–294. [Google Scholar] [CrossRef]
  10. Arizzi, A.; Cultrone, G. Aerial lime-based mortars blended with a pozzolanic additive and different admixtures: A mineralogical, textural and physical-mechanical study. Constr. Build. Mater. 2012, 31, 135–143. [Google Scholar] [CrossRef]
  11. Sawpan, M.A.; Pickering, K.L.; Fernyhough, A. Effect of various chemical treatments on the fibre structure and tensile properties of industrial hemp fibres. Compos. Part A Appl. Sci. Manuf. 2011, 42, 888–895. [Google Scholar] [CrossRef] [Green Version]
  12. Lv, N.; Wang, X.; Peng, S.; Zhang, H.; Luo, L. Study of the Kinetics and Equilibrium of the Adsorption of Oils onto Hydrophobic Jute Fiber Modified via the Sol-Gel Method. Int. J. Environ. Res. Public Health 2018, 15, 969. [Google Scholar] [CrossRef] [PubMed] [Green Version]
  13. Dong, A.; Fan, X.; Wang, Q.; Yu, Y.; Cavaco-Paulo, A. Hydrophobic surface functionalization of lignocellulosic jute fabrics by enzymatic grafting of octadecylamine. Int. J. Biol. Macromol. 2015, 79, 353–362. [Google Scholar] [CrossRef] [Green Version]
  14. Liu, R.; Dong, A.; Fan, X.; Yu, Y.; Yuan, J.; Wang, P.; Wang, Q.; Cavaco-Paulo, A. Enzymatic Hydrophobic Modification of Jute Fibers via Grafting to Reinforce Composites. Appl. Biochem. Biotechnol. 2016, 178, 1612–1629. [Google Scholar] [CrossRef] [Green Version]
  15. Kudanga, T.; Prasetyo, E.N.; Sipilä, J.; Guebitz, G.M.; Nyanhongo, G.S. Reactivity of long chain alkylamines to lignin moieties: Implications on hydrophobicity of lignocellulose materials. J. Biotechnol. 2010, 149, 81–87. [Google Scholar] [CrossRef]
  16. Wang, K.; Dong, Y.; Zhang, W.; Zhang, S.; Li, J. Preparation of Stable Superhydrophobic Coatings on Wood Substrate Surfaces via Mussel-Inspired. Polymers 2017, 9, 218. [Google Scholar] [CrossRef] [Green Version]
  17. Dong, A.; Yu, Y.; Yuan, J.; Wang, Q.; Fan, X. Hydrophobic modification of jute fiber used for composite reinforcement via laccase-mediated grafting. Appl. Surf. Sci. 2014, 301, 418–427. [Google Scholar] [CrossRef]
  18. Amiri, A.; Triplett, Z.; Moreira, A.; Brezinka, N.; Alcock, M.; Ulven, C.A. Standard density measurement method development for flax fiber. Ind. Crop. Prod. 2017, 96, 196–202. [Google Scholar] [CrossRef]
  19. Kandemir, A.; Pozegic, T.R.; Hamerton, I.; Eichhorn, S.J.; Longana, M.L. Characterisation of Natural Fibres for Sustainable Discontinuous Fibre Composite Materials. Materials 2020, 13, 2129. [Google Scholar] [CrossRef] [PubMed]
  20. Truong, M.; Zhong, W.; Boyko, S.; Alcock, M. A comparative study on natural fibre density measurement. J. Text. Inst. 2009, 100, 525–529. [Google Scholar] [CrossRef]
  21. Le Gall, M.; Davies, P.; Martin, N.; Baley, C. Recommended flax fibre density values for composite property predictions. Ind. Crop. Prod. 2018, 114, 52–58. [Google Scholar] [CrossRef] [Green Version]
  22. Martin, N.; Mouret, N.; Davies, P.; Baley, C. Influence of the degree of retting of flax fibers on the tensile properties of single fibers and short fiber/polypropylene composites. Ind. Crop. Prod. 2013, 49, 755–767. [Google Scholar] [CrossRef] [Green Version]
  23. B.S.I. Part 5: Determination of Linear Density of Yarn Removed from Fabric; 07211-8-1984 (2002) ISO; 1984. Available online: http://www.bsi-global.com (accessed on 25 May 2021).
  24. American National Standard. Dealing with Outlying Observations, E 178–02. In Annual Book of ASTM Standards; ASTM International: West Conshohocken, PA, USA, 2002. [Google Scholar]
  25. Advisory Committee on Technical Recommendations for Construction. Guide for the Design and Construction of Externally Bonded FRP Systems for Strengthening Existing Structures; CNR: Rome, Italy, 2014. [Google Scholar]
  26. Codispoti, R.; Oliveira, D.V.; Olivito, R.S.; Lourenço, P.B.; Fangueiro, R. Mechanical performance of natural fiber-reinforced composites for the strengthening of masonry. Compos. Part B Eng. 2015, 77, 74–83. [Google Scholar] [CrossRef]
  27. Traoré, M.; Kaal, J.; Cortizas, A.M. Application of FTIR spectroscopy to the characterization of archeological wood. Spectrochim. Acta Part A Mol. Biomol. Spectrosc. 2016, 153, 63–70. [Google Scholar] [CrossRef] [PubMed]
  28. TCI/24 Technical Committee. Determination of Single-End Breaking Force and Elongation at Break. EN ISO 2062:2009. Available online: https://www.iso.org/standard/45642.html (accessed on 25 May 2021).
  29. Koutsianitis, D.; Mitani, C.; Giagli, K.; Tsalagkas, D.; Halász, K.; Kolonics, O.; Gallis, C.; Csóka, L. Properties of ultrasound extracted bicomponent lignocellulose thin films. Ultrason. Sonochemistry 2015, 23, 148–155. [Google Scholar] [CrossRef]
  30. Ferreira, S.R.; Silva, F.D.A.; Lima, P.R.L.; Filho, R.D.T. Effect of fiber treatments on the sisal fiber properties and fiber-matrix bond in cement based systems. Constr. Build. Mater. 2015, 101, 730–740. [Google Scholar] [CrossRef]
  31. Pucci, M.F.; Liotier, P.J.; Drapier, S. Capillary wicking in flax fabrics—Effects of swelling in water. Colloids Surf. A Physicochem. Eng. Asp. 2016, 498, 176–184. [Google Scholar] [CrossRef]
  32. Baley, C. Analysis of the flax fibres tensile behaviour and analysis of the tensile stiffness increase. Compos. Part A Appl. Sci. Manuf. 2002, 33, 939–948. [Google Scholar] [CrossRef]
  33. Ferreira, S.R.; de Andrade Silva, F.; Lima, P.R.L.; Filho, R.D.T. Effect of hornification on the structure, tensile behavior and fiber matrix bond of sisal, jute and curauá fiber cement based composite systems. Constr. Build. Mater. 2017, 139, 551–561. [Google Scholar] [CrossRef]
  34. Schwanninger, M.; Rodrigues, J.C.; Pereira, H.; Hinterstoisser, B. Effects of short-time vibratory ball milling on the shape of FT-IR spectra of wood and cellulose. Vib. Spectrosc. 2004, 36, 23–40. [Google Scholar] [CrossRef]
  35. Poletto, M.; Zattera, A.J.; Santana, R.M.C. Structural Differences Between Wood Species: Evidence from Chemical Composition, FTIR Spectroscopy, and Thermogravimetric Analysis. J. Appl. Polym. Sci. 2012, 126, E336–E343. [Google Scholar] [CrossRef]
  36. Popescu, M.; Popescu, C.; Lisa, G.; Sakata, Y. Evaluation of morphological and chemical aspects of different wood species by spectroscopy and thermal methods. J. Mol. Struct. 2011, 988, 65–72. [Google Scholar] [CrossRef]
  37. Moon, R.J.; Martini, A.; Nairn, J.; Simonsen, J.; Youngblood, J. Cellulose nanomaterials review: Structure, properties and nanocomposites. Chem. Soc. Rev 2011, 40, 3941–3994. [Google Scholar] [CrossRef]
  38. Shen, T.; Gnanakaran, S. The stability of cellulose: A statistical perspective from a coarse-grained model of hydrogen-bond networks. Biophys. J. 2009, 96, 3032–3040. [Google Scholar] [CrossRef] [PubMed] [Green Version]
  39. Marsh, K.N.; Pang, S.; Staiger, M.P. Ionic Liquids and Their Interaction with Cellulose. Am. Chem. Soc. 2009, 109, 6712–6728. [Google Scholar] [CrossRef]
  40. El Oudiani, A.; Msahli, S.; Sakli, F. In-depth study of agave fiber structure using Fourier transform infrared spectroscopy. Carbohydr. Polym. 2017, 164, 242–248. [Google Scholar] [CrossRef]
  41. HS, M.; RK, M. Effect of Microorganism on Flax and Linen. J. Text. Sci. Eng. 2015, 6, 229. [Google Scholar] [CrossRef]
  42. Gonzalez-lopez, L.; Claramunt, J.; Hsieh, Y.; Ventura, H. Surface modification of flax nonwovens for the development of sustainable, high performance, and durable calcium aluminate cement composites. Compos. Part B 2020, 191, 107955. [Google Scholar] [CrossRef]
  43. Ornaghi, H.L., Jr.; Poletto, M.; Jose, A. Correlation of the thermal stability and the decomposition kinetics of six different vegetal fibers. Cellulose 2014, 21, 177–188. [Google Scholar] [CrossRef]
  44. Poletto, M.; Pistor, V.; Marlene, R.; Santana, C.; José, A. Materials Produced From Plant Biomass: Part II: Evaluation of Crystallinity and Degradation Kinetics of Cellulose. Mater. Res. 2012, 15, 421–427. [Google Scholar] [CrossRef] [Green Version]
  45. Yuan, J.; Feng, Y.; He, L. Effect of thermal treatment on properties of ramie fibers. Polym. Degrad. Stab. 2016, 133, 303–311. [Google Scholar] [CrossRef]
  46. Cichosz, S.; Masek, A. IR study on cellulose with the varied moisture contents: Insight into the supramolecular structure. Materials 2020, 13, 4573. [Google Scholar] [CrossRef]
  47. Kim, J.T.; Netravali, A.N. Mercerization of sisal fibers: Effect of tension on mechanical properties of sisal fiber and fiber-reinforced composites. Compos. Part A 2010, 41, 1245–1252. [Google Scholar] [CrossRef]
  48. Zhang, H.; Ming, R.; Yang, G.; Li, Y.; Li, Q.; Shao, H. Influence of Alkali Treatment on Flax Fiber for Use as Reinforcements in Polylactide Stereocomplex Composites. Polym. Eng. Sci. 2015, 55, 2553–2558. [Google Scholar] [CrossRef]
  49. Lionetto, F.; Del Sole, R.; Cannoletta, D.; Vasapollo, G.; Maffezzoli, A. Monitoring Wood Degradation during Weathering by Cellulose Crystallinity. Materials 2012, 5, 1910–1922. [Google Scholar] [CrossRef] [Green Version]
  50. Morán, J.I.; Alvarez, V.A.; Cyras, V.P.; Vázquez, A. Extraction of cellulose and preparation of nanocellulose from sisal fibers. Cellulose 2008, 15, 149–159. [Google Scholar] [CrossRef]
  51. Zhuang, J.; Li, M.; Pu, Y.; Ragauskas, A.J.; Yoo, C.G. Observation of Potential Contaminants in Processed Biomass Using Fourier Transform Infrared Spectroscopy. Appl. Sci 2020, 10, 4345. [Google Scholar] [CrossRef]
  52. Makarem, M.; Lee, C.M.; Kafle, K.; Huang, S.; Chae, I.; Yang, H.; Kubicki, J.D.; Kim, S.H. Probing cellulose structures with vibrational spectroscopy. Cellulose 2019, 26, 35–79. [Google Scholar] [CrossRef]
  53. Popescu, C.; Singurel, G.; Popescu, M.; Vasile, C.; Dimitris, S.; Willför, S. Vibrational spectroscopy and X-ray diffraction methods to establish the differences between hardwood and softwood. Carbohydr. Polym. 2009, 77, 851–857. [Google Scholar] [CrossRef]
  54. Oh, S.Y.; Yoo, D., II; Shin, Y.; Seo, G. FTIR analysis of cellulose treated with sodium hydroxide and carbon dioxide. Carbohydr. Res. 2005, 340, 417–428. [Google Scholar] [CrossRef] [PubMed]
  55. Jankowska, I.; Pogorzelec-glaser, K.; Tritt-goc, J. Cellulose microfibers surface treated with imidazole as new proton conductors. Mater. Chem. Phys. 2020, 239, 122056. [Google Scholar] [CrossRef]
  56. Oh, S.Y.; Yoo, I.; Shin, Y.; Kim, C.; Kim, Y. Crystalline structure analysis of cellulose treated with sodium hydroxide and carbon dioxide by means of X-ray diffraction and FTIR spectroscopy. Carbohydr. Res. 2005, 340, 2376–2391. [Google Scholar] [CrossRef] [PubMed]
  57. Gominho, J.; Costa, R.; Lourenço, A.; Neiva, D.M.; Pereira, H. The effect of different pre-treatments to improve delignification of eucalypt stumps in a biorefinery context. Bioresour. Technol. Reports J. 2019, 6, 89–95. [Google Scholar] [CrossRef]
  58. Alix, S.; Philippe, E.; Bessadok, A.; Lebrun, L.; Morvan, C.; Marais, S. Effect of chemical treatments on water sorption and mechanical properties of flax fibres. Bioresour. Technol. 2009, 100, 4742–4749. [Google Scholar] [CrossRef]
  59. Sinha, E.; Rout, S.K. Influence of fibre-surface treatment on structural, thermal and mechanical properties of jute. J. Mater. Sci. 2008, 43, 2590–2601. [Google Scholar] [CrossRef]
  60. Yang, H.; Yan, R.; Chen, H.; Lee, D.H.; Zheng, C. Characteristics of hemicellulose, cellulose and lignin pyrolysis. Fuel 2007, 86, 1781–1788. [Google Scholar] [CrossRef]
  61. Široký, J.; Blackburn, R.S.; Bechtold, T.; Taylor, J.; White, P. Attenuated total reflectance Fourier-transform Infrared spectroscopy analysis of crystallinity changes in lyocell following continuous treatment with sodium hydroxide. Cellulose 2010, 17, 103–115. [Google Scholar] [CrossRef]
  62. Spiridon, I.; Teacă, C.-A.; Bodîrlău, R. Structural changes evidenced by FTIR spectroscopy in cellulosic materials after pre-treatment with ionic liquid and enzymatic hydrolysis. BioResources 2011, 6, 400–413. [Google Scholar] [CrossRef]
  63. Hospodarova, V.; Singovszka, E.; Stevulova, N. Characterization of Cellulosic Fibers by FTIR Spectroscopy for Their Further Implementation to Building Materials. Am. J. Anal. Chem. 2018, 9, 303–310. [Google Scholar] [CrossRef] [Green Version]
  64. Nada, A.M.A.; Kamel, S.; El-sakhawy, M. Thermal behaviour and infrared spectroscopy of cellulose carbamates. Polym. Degrad. Stab. 2000, 70, 347–355. [Google Scholar] [CrossRef]
  65. Lazić, B.D.; Pejić, B.M.; Kramar, A.D.; Vukčević, M.M.; Mihajlovski, K.R.; Rusmirović, J.D.; Kostić, M.M. Influence of hemicelluloses and lignin content on structure and sorption properties of flax fibers (Linum usitatissimum L.). Cellulose 2018, 25, 697–709. [Google Scholar] [CrossRef]
  66. George, M.; Mussone, P.G.; Abboud, Z.; Bressler, D.C. Characterization of chemically and enzymatically treated hemp fibres using atomic force microscopy and spectroscopy. Appl. Surf. Sci. 2014, 314, 1019–1025. [Google Scholar] [CrossRef]
  67. Lazic, B.D.; Janjic, S.D.; Rijavec, T.; Kostic, M.M. Effect of chemical treatments on the chemical composition and properties of flax fibers. J. Serbian Chem. Soc. 2017, 82, 83–97. [Google Scholar] [CrossRef]
  68. Corbin, A.C.; Soulat, D.; Ferreira, M.; Labanieh, A.R.; Gabrion, X.; Placet, V. Multi-scale analysis of flax fibres woven fabrics for composite applications Multi-scale analysis of flax fibres woven fabrics for composite applications. In Proceedings of the IOP Conference Series: Materials Science and Engineering, Milan, Italy, 17–19 September 2018; Volume 406, p. 012016. Available online: https://0-iopscience-iop-org.brum.beds.ac.uk/article/10.1088/1757-899X/406/1/012016 (accessed on 25 May 2021). [CrossRef] [Green Version]
  69. Bledzki, A.K.; Mamun, A.A.; Lucka-Gabor, M.; Gutowski, V.S. The effects of acetylation on properties of flax fibre and its polypropylene composites. Express Polym. Lett. 2008, 2, 413–422. [Google Scholar] [CrossRef]
Figure 1. Linear density values of (a) flax, (b) sisal and (c) hemp before and after washing protocols with the corresponding standard deviations.
Fibers 09 00054 g001
Figure 2. Intra- and intermolecular hydrogen bonds in cellulose (adapted with permission from [39]).
Fibers 09 00054 g002
Figure 3. FTIR spectra of flax fibers before washing (NW) and after washing (B-EHA, B-HEA, A-E, A-H, B-EAH, A-EW). (a) Range 2800–3800 cm−1, (b) range 800–1800 cm−1.
Fibers 09 00054 g003
Figure 4. Spectra of sisal fibers before washing (NW) and after washing (B-EHA, B-HEA, A-E, A-H, B-EAH, A-EW). (a) Range 2800–3800 cm−1, (b) range 800–1800 cm−1.
Fibers 09 00054 g004
Figure 5. Spectra of hemp fibers before washing (NW) and after washing (B-EHA, B-HEA, A-E, A-H, B-EAH, A-EW). (a) Range 2800–3800 cm−1, (b) range 800–1800 cm−1.
Fibers 09 00054 g005
Figure 6. Crystallinity indexes (TCI vs. HBI) of hemp fibers with standard deviations.
Fibers 09 00054 g006
Figure 7. Crystallinity indexes (TCI vs. HBI) of flax fibers with standard deviations.
Fibers 09 00054 g007
Figure 8. (a) Results obtained for the SCA of flax fibers; images of the SCA of Flax-A-H at (b) 0 s; (c) 60 s; (d) 120 s and (e) 150 s.
Fibers 09 00054 g008
Figure 9. Results obtained for the SCA of hemp fibers.
Fibers 09 00054 g009
Figure 10. Tensile properties of (a) flax, (b) sisal and (c) hemp with corresponding standard deviations.
Fibers 09 00054 g010
Figure 11. Stress-strain graphs (a,c,e) and tenacity-strain graphs (b,d,f) of the non-washed and B-EAH-washed fibers for flax, sisal and hemp respectively.
Fibers 09 00054 g011
Figure 12. (a) The exponential relationship between flax strain capacity and fiber wettability (absorption time); (b) the exponential relation between hemp Young’s modulus and fiber wettability (CA at 60 s) (results are presented with standard deviations).
Fibers 09 00054 g012
Table 1. Parameters of washing protocols applied in this study.
GroupProtocol IDTime-Solvent-Stir
AA-E1 h-ethanol + ultrapure water rinsing-no stir
AA-H45 min-hexane + ultrapure water rinsing-no stir
AA-EW1 h-ethanol/water: 1:2 v/v + ultrapure water rinsing-no stir
BB-EHA1 h (20 min each)-ethanol/hexane/acetone-ultrasonication
BB-HEA1 h (20 min each)-hexane/ethanol/acetone-ultrasonication
BB-EAH1 h (20 min each)-ethanol/acetone/hexane-ultrasonication
Table 2. Density and area values of the yarns, with standard deviation (SD), before and after washing protocols.
FiberIDDensity (g/cm3)Density (SD)Area (mm2)Area (SD)
FlaxNW1.5230.0760.9850.049
A-E1.5080.0300.9420.019
A-H1.5350.0900.8850.051
A-EW1.4670.0250.9410.017
B-EHA1.4630.0291.0850.022
B-HEA1.4690.0201.0390.014
B-EAH1.5580.1280.9710.080
SisalNW1.2480.0323.9280.101
A-E1.2490.0192.7550.041
A-H1.1680.0033.1520.008
A-EW1.2750.0613.3580.159
B-EHA1.1970.0152.9290.036
B-HEA1.1980.0332.9520.08
B-EAH1.1970.0313.5300.0919
HempNW1.4730.0330.7520.004
A-E1.5010.0170.5990.004
A-H1.4740.0150.7550.004
A-EW1.6840.1730.5560.007
B-EHA1.4800.0090.6290.008
B-HEA1.4710.0090.6390.021
B-EAH1.5300.0550.5860.055
Publisher’s Note: MDPI stays neutral with regard to jurisdictional claims in published maps and institutional affiliations.

