Article

Advanced Composite Retrofit of RC Columns and Frames with Prior Damages—Pseudodynamic Finite Element Analyses and Design Approaches

by
Theodoros Rousakis
*,
Evgenia Anagnostou
and
Theodora Fanaradelli
Department of Civil Engineering, Democritus University of Thrace, 67100 Xanthi, Greece
*
Author to whom correspondence should be addressed.
Submission received: 6 June 2021 / Revised: 9 August 2021 / Accepted: 24 August 2021 / Published: 6 September 2021

Abstract

:
This study develops three-dimensional (3D) finite element (FE) models of composite retrofits in deficient reinforced concrete (RC) columns and frames. The aim is to investigate critical cases of RC columns with inadequate lap splices of bars or corroded steel reinforcements and the beneficial effects of external FRP jacketing to avoid their premature failure and structural collapse. Similarly, the RC-frame FE models explore the effects of an innovative intervention that includes an orthoblock brick infill wall and an advanced seismic joint made of highly deformable polymer at the boundary interface with the RC frame. The experimental validation of the technique in RC frames is presented in earlier published papers by the authors (as well as for a four-column structure), revealing the potential to extend the contribution of the infills at high displacement ductility levels of the frames, while exhibiting limited infill damages. The analytical results of the advanced FE models of RC columns and frames compare well with the available experimental results. Therefore, this study’s research extends to critical cases of FE models of RC frames with inadequate lap splices or corroded steel reinforcements, without or with brick wall infills with seismic joints. The advanced pseudodynamic analyses reveal that for different reinforcement detailing of RC columns, the effects of inadequate lap-spliced bars may be more detrimental in isolated RC columns than in RC frames. It seems that in RC frames, additional critical regions without lap splices are engaged and redistribution of damage is observed. The detrimental effects of corroded steel bars are somewhat greater in bare RC frames than in isolated RC columns, as all reinforcements in the frame are considered corroded. Further, all critical cases of RC frames with prior damages at risk of collapse may receive the innovative composite retrofit and achieve higher base shear load than the original RC frame without corroded or lap-spliced bars, at comparable top displacement ductility. Finally, the FE analyses are utilized to propose modified design equations for the shear strength and chord rotation in cases of failure of columns with deficiencies or prior damages in RC structures.

1. Introduction

Reinforced concrete (RC) structures in seismic regions may reveal several deficiencies, such as inadequate lap splices of bottom steel bars within critical regions [1,2]. In some cases, slippage of the steel bars in critical regions may jeopardize the seismic performance of the structure and lead to premature collapse. Further, in coastal regions, the issue of corrosion may lead to significant accumulated mass loss of steel bars and stirrups [3] and reduce the bearing capacity and displacement ductility of the structures.
Innovative advanced materials and intervention techniques such as fiber-reinforced polymers (FRPs) in the form of sheets [4,5,6,7,8,9,10,11,12], strips [13,14,15,16], composite ropes [4,17] or composite shells [18,19], among others, are widely used in deficient or damaged RC structures. Suitable retrofit of deficient members can improve their strength, delay further corrosion of the reinforcement and reduce deformations in the serviceability limit state [1,13,14,15,20,21,22,23,24].
In addition, the mechanical response of brick-infilled RC frames depends mainly on stiffness and the difference in yield-failure deformation between the RC frames and the brick wall infills. The majority of buildings are constructed with the use of brittle materials (clay bricks or concrete [25]). Flexible frames cannot support high loads at low excitations, and this can cause damage to the brick wall infills during frequent earthquakes. In the case of aftershocks, damaged infills may fail in- and/or out-of-plane and collapse, causing human injuries or loss. On the contrary, if the infill is too strong compared to the RC columns, it may trigger their shear failure. Seismic isolation of the infills may be an advantageous alternative. In [26,27,28,29,30,31], structural polyurethane flexible joints (PUFJ) at the infill–RC frame interface resulted in desirable RC frame–infill interaction, enhancing the elastic stiffness and the base shear of the composite frame. More importantly, this innovative composite system of peripheral seismic PUFJ, applied together with thermal insulating orthoblock brick infill, maintained significant displacement ductility of the frames during the abovementioned tests. This was the case because the PUFJ seismic joints distributed more uniformly the damage accumulation within a broader region of the infill. Therefore, in-plane or out-of-plane collapse of the infill was avoided even for strong earthquake excitations, resulting in very high inter-story drifts of up to 3.7% [30]. All these aspects may help reduce the inherent uncertainty in the real dynamic contribution of the commonly used brick infills during earthquakes that may jeopardize the desirable collapse mechanism for the whole building. PUFJs can be used to fill cracks or joints or to bond composite materials (for masonry, see [25,32]). In cases where the fiber retrofit is applied with standard epoxy resins or inorganic matrices, the sequence of failures of the infilled RC frames remains unchanged, revealing a significant accumulation of damage for relative displacement of the frame between 0.5% and 1.5% (for example, see [33]). Recent analytical studies have shown that strengthening with highly deformable polyurethane systems may delay infill damage and thus enable the engagement of multiple different infills in a building frame. This aspect may increase their shear capacity significantly [29,34].
Experimental tests on large-scale frames and structures require excessive resources and time. Therefore, it is common that only a few parameters that affect their behavior can be investigated per experimental campaign. Three-dimensional FE analyses may provide a suitable theoretical framework for advanced material models, the rigorous modeling of the interactions among different materials and parts (in our case, the concrete core, steel reinforcements, FRP jackets, brick infills and PUFJ interface joints, among others) and the effects of geometrical and mechanical non-linearity. There are several studies on 3D FE modeling of RC columns utilizing Drucker-Prager type plasticity or damage plasticity models for concrete confined with FRP [8,16,35] or other validated models for pseudoseismic analyses [36,37]. Most of these models reveal shortcomings in the calibration of the variable steel or FRP confinement simultaneously. As such, several of the abovementioned studies refer to suitable modifications and recalibration of the concrete models per different application. Based on a search of the critical literature for unified approaches, it appears that the framework of dynamic 3D FE modelling and analyses, also used in impact engineering, could help with investigating the effects of critical design parameters in RC columns confined with FRP [38]. Deficiencies or damages in frames and structures could also be introduced, considering the available advanced material models and simulation potential. Advanced simulation approaches may overcome local instabilities or failures of materials and interactions and provide a softening load-displacement response if required. Of course, such developments require validation of primary FE models of RC columns or half-RC column-foundation specimens either retrofitted or not, over suitable available experiments [38,39], among others.
This study develops three-dimensional finite element (FE) models of composite retrofits in deficient reinforced-concrete (RC) columns and frames. It investigates critical cases of RC columns with inadequate lap splices of bars or corroded steel reinforcements and the beneficial effects of external FRP jacketing to avoid their premature failure and structural collapse. Similarly, the RC frame FE models explore the effects of an innovative intervention that includes infill wall with special thermal insulating clay brick orthoblocks, having at the boundary interface with the RC frame an advanced seismic joint made of highly deformable polymer. Such retrofit may extend the contribution of the infills at higher displacement ductility levels of the RC frames, while also limiting infill damages. The analytical results of the advanced FE models of RC columns and frames compare well with the available experimental results. Therefore, this study’s research extends to critical cases of FE models of RC frames with inadequate lap splices or corroded steel reinforcements, with or without brick wall infills with seismic joints. This research provides a 3D FE model to address gaps in analyses and improve design for demanding seismic-resistant applications by utilizing available experiments and the model’s unique analytical insight potential. This hybrid approach [38] may minimize valuable testing time, conserve resources and, most importantly, save human lives, as it may help improve our understanding and avoid premature structural collapse.

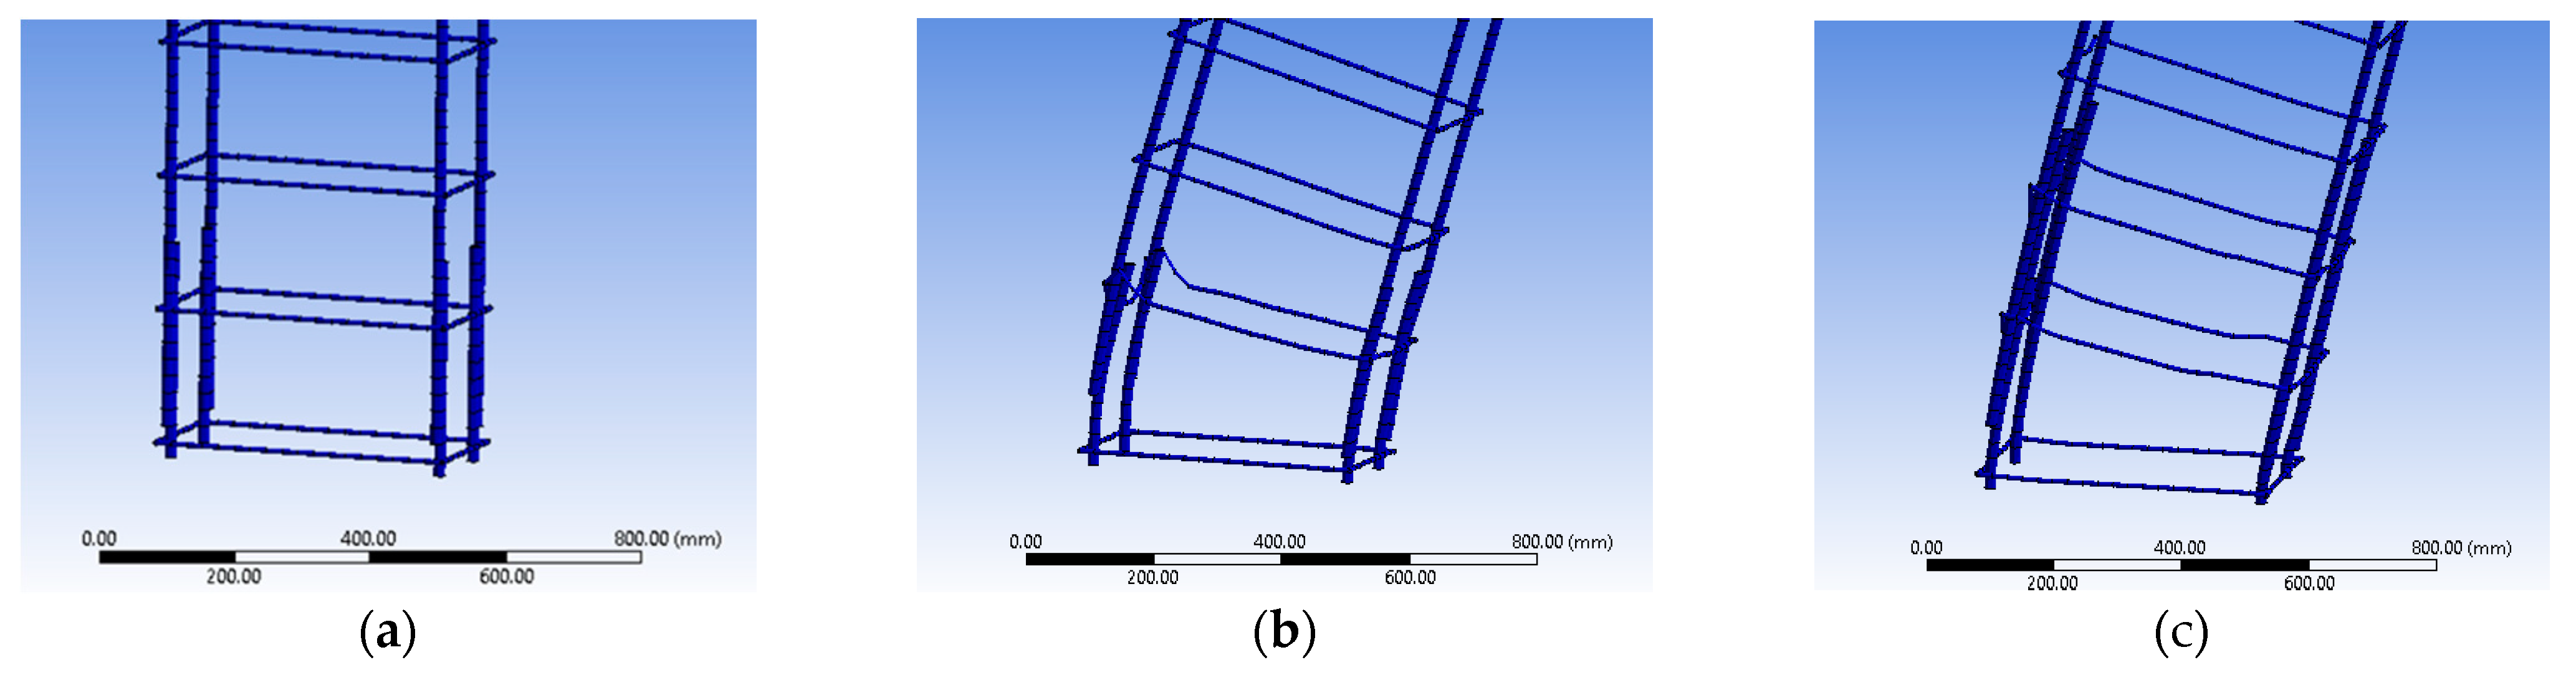
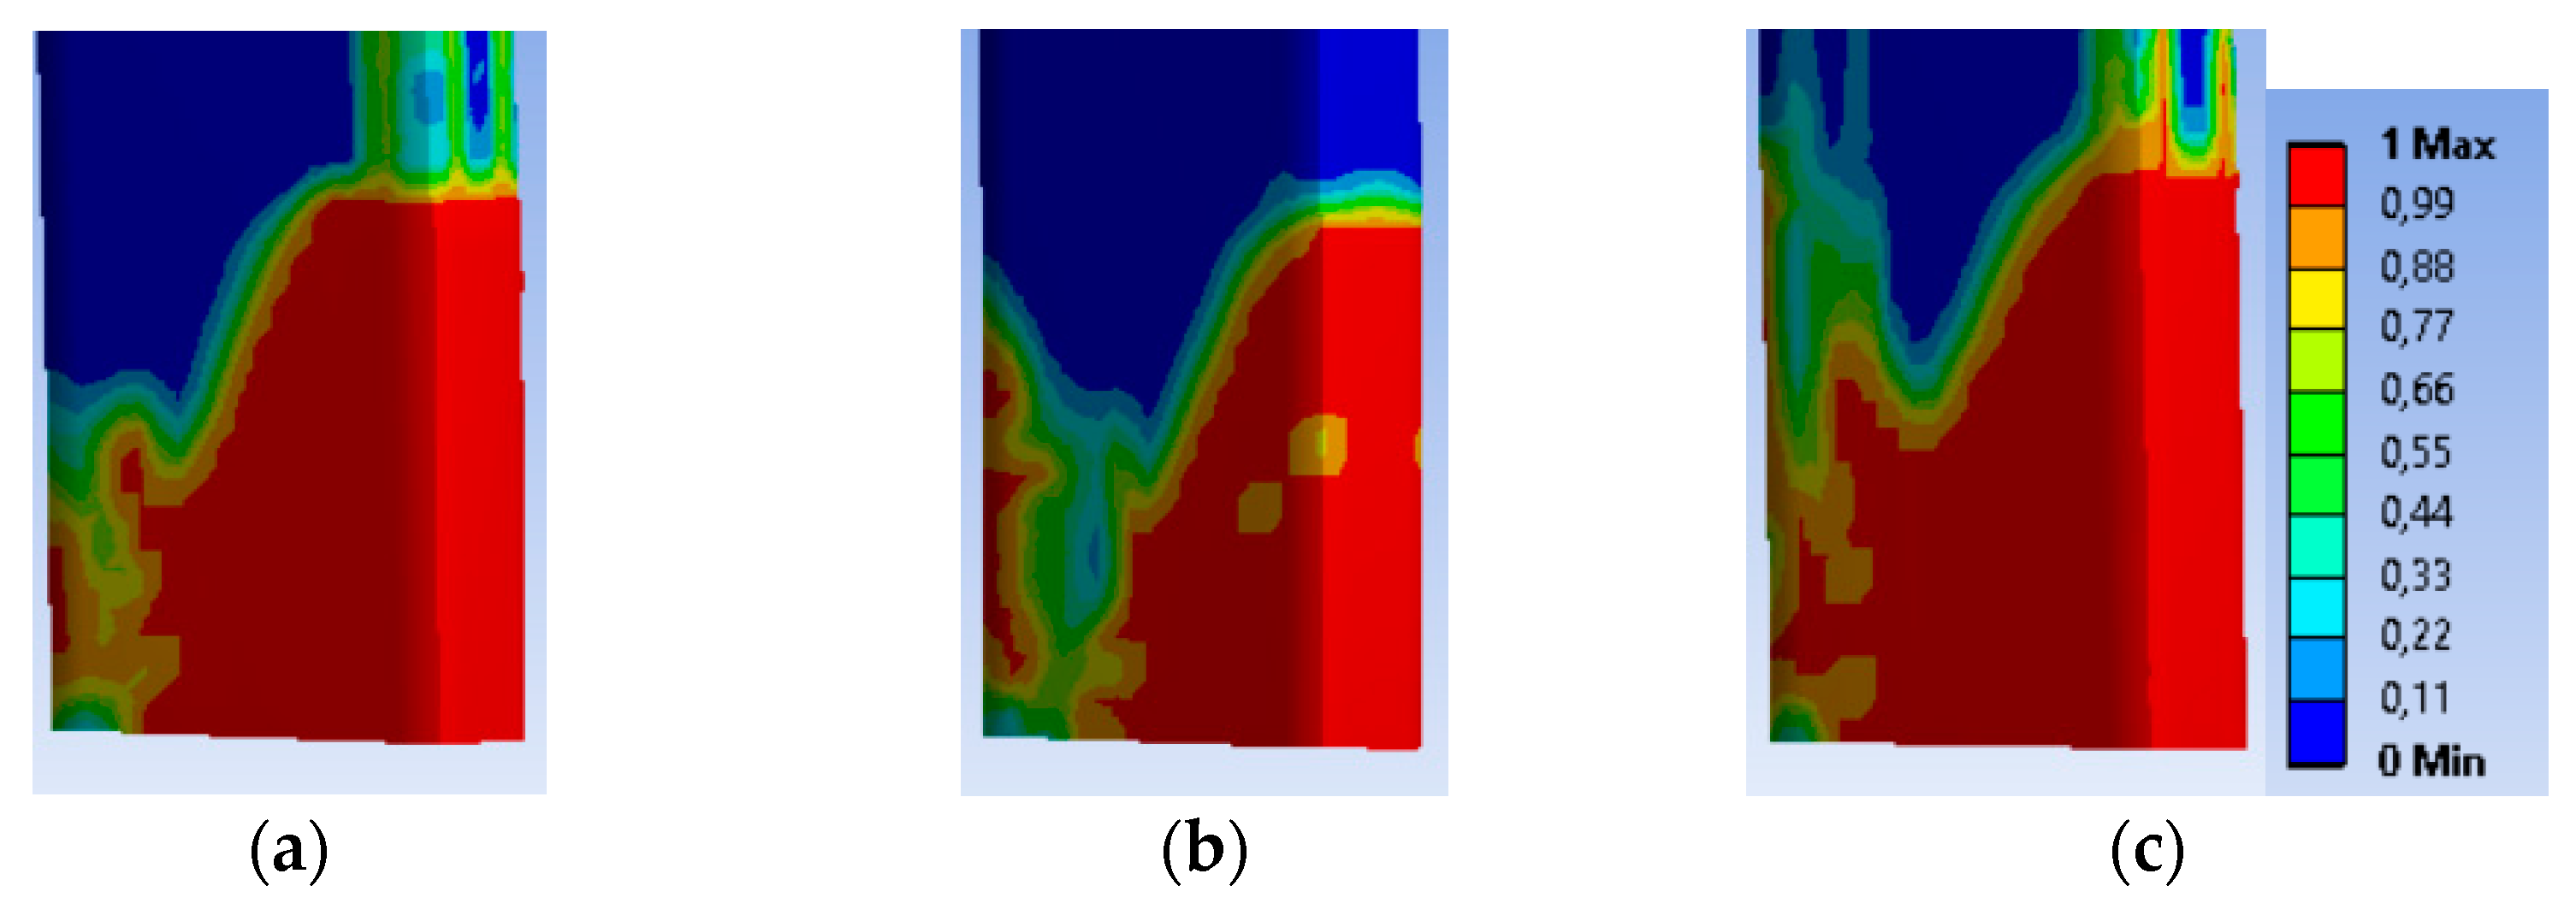
2. Explicit Dynamics Finite Element Modelling

This section presents the material models, elements and interactions considered in the development of suitable three-dimensional FE models for the numerical investigation of advanced material retrofits in RC columns and in infilled and bare RC-framed structures. The geometry of the RC columns and frames, as well as the detailing of the internal steel reinforcement (presented in Section 3), are accurately reproduced. In all cases, columns are supported at their base under a fixed boundary condition, while they are loaded at the top with constant axial load and horizontal increasing displacement.

2.1. Concrete

For concrete, this study utilizes the unique potential of the Riedel–Hiermaier–Thoma (RHT) [40,41,42] model (ANSYS, Autodyn [43]), which is suitable for similar geological materials under dynamic loading situations. The RHT model is a constitutive model for brittle materials and a combined plasticity and shear damage model, in which the deviatoric stress in the material is limited by a generalized failure surface of the form (Equation (1)):
f ( P , σ eq , θ , ε . ) = σ eq Y XTC ( P ) F CAP ( P ) R 3 ( θ ) ( F ) RATE ( ε . )
where σeq is the uniaxial compressive strength, YTXC(P) is the fracture surface and FCAP(P) is a dimensionless cap function that activates the elastic strength surface within the RHT material model at high pressures. R3(θ) is the third invariant dependence term, and (F)RATE(ε) is the strain rate effect represented through fracture strength with plastic strain rate.

2.2. Longitudinal Steel Bars and Steel Stirrups

In explicit dynamics analyses, plastic deformation of steel is computed by reference to the Huber–Mises yield criterion. This states that the local yield condition is (Equation (2)):
( σ 1 σ 2 ) 2 + ( σ 2 σ 3 ) 2 + ( σ 3 σ 1 ) 2 = 2 Y 2
where σ1, σ2 and σ3 are the first, second and third principal stresses, and Y is the yield stress of steel reinforcement under tension.
For the elastic part of the response of the longitudinal and transverse steel, the “isotropic elasticity” model was chosen. The “bilinear isotropic hardening” model was used to define the yield stress (Y) as a linear function of plastic strain, εp (Equation (3)):
Y = Y 0 + A ε p
where Y0 is the yield strength and A is the tangent modulus.

2.3. Brick Infill

Brick was modeled with Young’s modulus equal to 3.8 GPa and Poisson’s Ratio equal to 0.25. The orthotropic elasticity material properties with tensile strength in X, Y and Z directions were 1.49 Mpa, 3.89 Mpa and 1.49 Mpa, respectively.

2.4. Carbon Fiber Reinforced Polymers (CFRP)

Τhe thickness of one layer of CFRP was tf = 0.13 mm, the elastic modulus was Ef = 230 Gpa, and the failure strain was εuf = 0.015. FRP jacket was modelled as an orthotropic elastic material. The elastic modulus along the direction of carbon fibers used for the analyses was equal to 59.16 GPa, when also including the effects of the impregnation epoxy resin. Therefore, the thickness of the jacket was suitably increased so that the elastic modulus multiplied by the thickness of the jacket, in both cases, gives the same axial rigidity value. This approach enables more accurate reproduction of global behavior and local failure effects in the FRP jacket [38].

2.5. Polyurethane Flexible Joints (PUFJ)

The brick-infilled RC frame included polymer joints 2 cm thick at 3 sides, simulating application to existing buildings. The 3-sided gap was filled in with PUFJ polymer by injection. Polymer for PUFJ was Sika PM. The elastic modulus, strength and ultimate elongation of the polymer were 4 MPa, 1.4 MPa and 110%, respectively, in a tensile test. The Poisson ratio was 0.47. Polyurethane in this study was modeled as an isotropic elasticity material.

2.6. Element Types

Concrete and bricks were eight-node elements referred to as “hexahedral solid elements”. The parts for PUFJs were solid bodies (eight-node hexahedral solid elements) with a 20 mm thickness, surrounding the 3 sides of the brick infill–RC frame interface for the type B infill. The internal steel reinforcement were two-node elements referred to as “beam (line) elements” with the ability to develop large axial deformations. More details on the FE modelling and analysis procedure can be found in [38,39]. The FE lap splices of the longitudinal bars were constructed based on the real position of the centerlines of the starter and main steel bars. The FE-corroded longitudinal bars and transverse stirrups were constructed based on the remaining diameter (area of the section) of the bars according to their estimated mass loss.

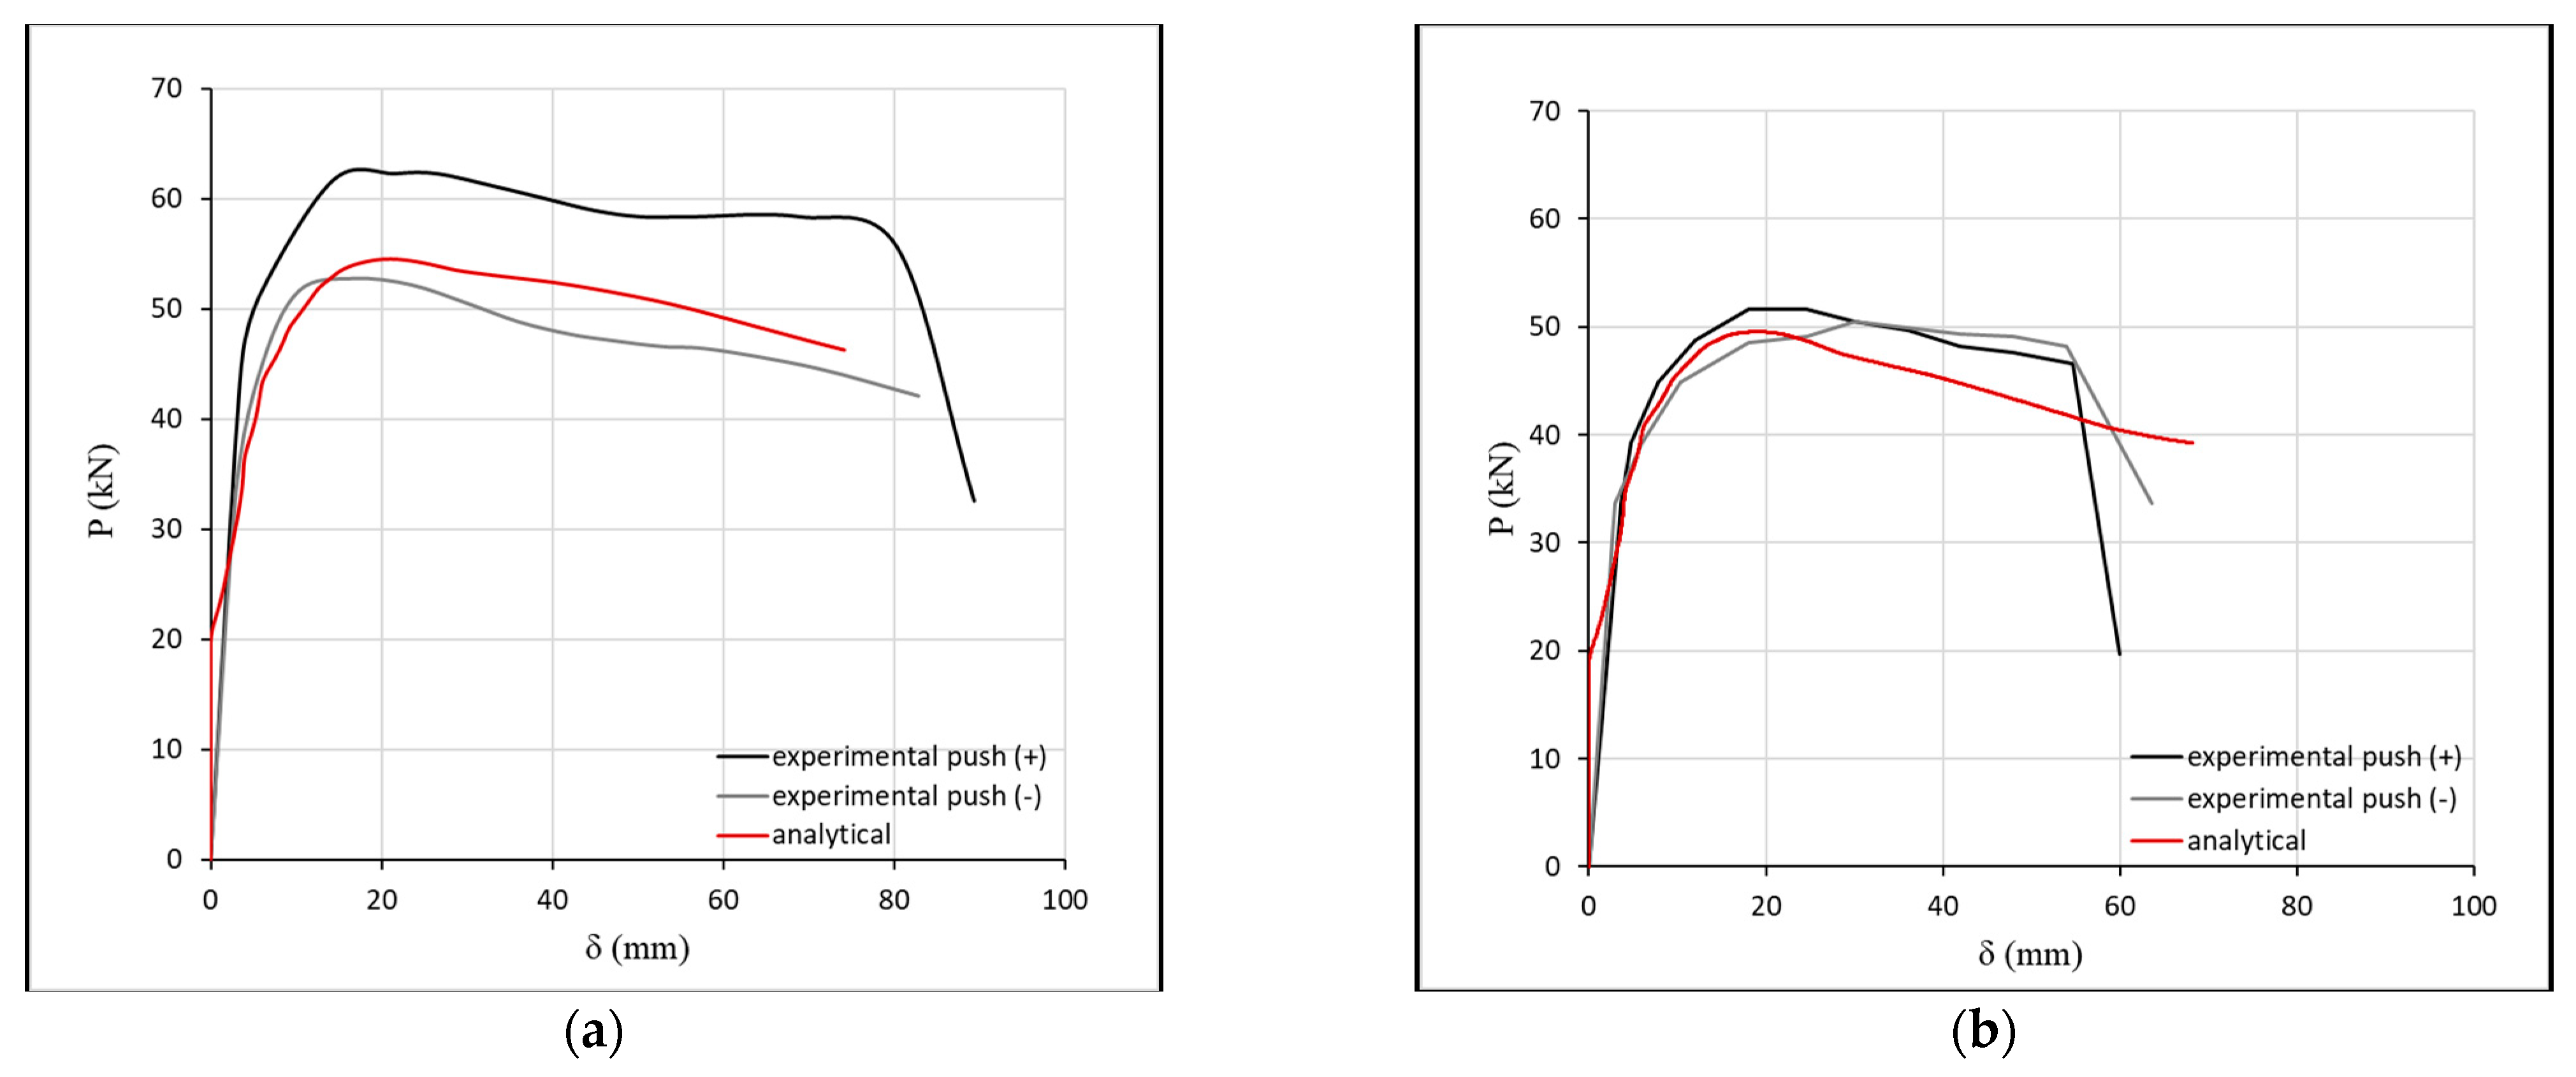
3. FE Models of Published RC Columns and Frames Tests

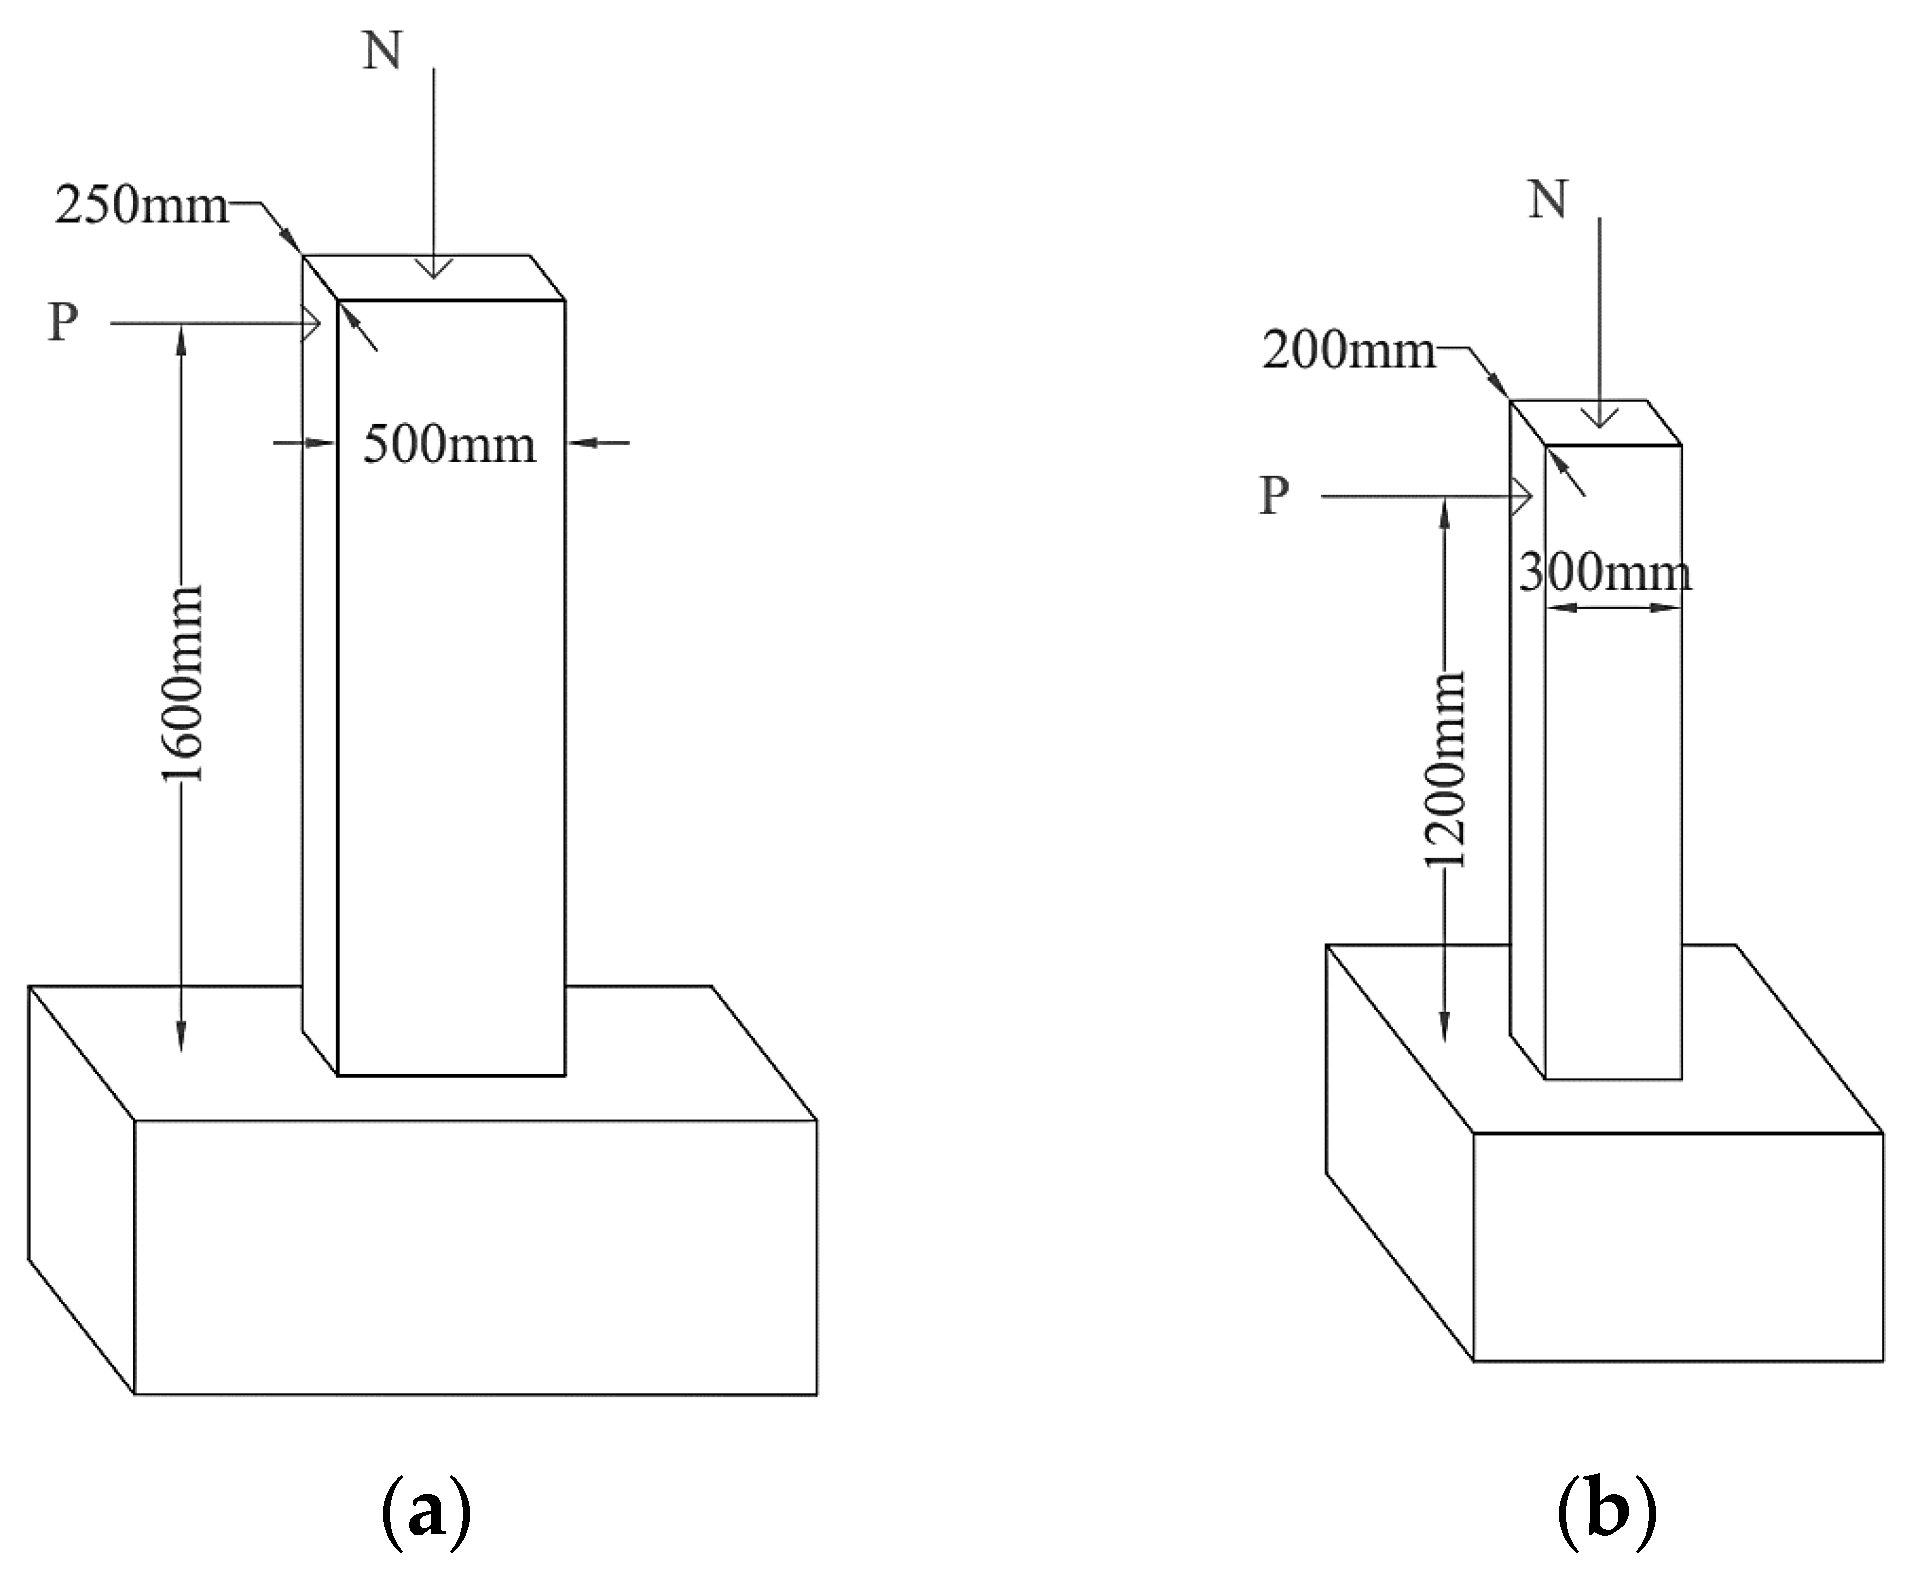
3.1. RC Columns with Lap Splices

This section presents the geometric and mechanical characteristics of the 3D FE models of columns with lap-spliced longitudinal bars, based on the experiments performed by [1]. The cantilever columns (with foundation) had section dimensions 25 cm × 50 cm and height 160 cm (Figure 1a). They were reinforced with 4Φ18 longitudinal rebars (with or without lap splices) and Φ8/200 mm closed stirrups (peripheral). The concrete strength (fc) varied among different columns from 26.9 MPa to 32.9 MPa, while their steel yield stress (fyL) was 514 MPa. The normalized axial load (v) of the column was 0.26–0.30. The columns differed in lap-splice length, which was 15 times the diameter of the longitudinal bar (15 dbL), 30 dbL or 45 dbL. The thickness of one layer of CFRP jacket was tf = 0.13 mm, the elastic modulus was Ef = 230 GPa, and the failure strain was εuf = 0.015. The corners of the section were rounded with a radius of r = 30 mm. The FRP confinement was applied at a height of hf = 600 mm at the base of the column. Herein, the columns R-P2L0, R-P2L1 and R-P2L3 with no lap splices, 15 dbL lap length and 30 dbL lap length and externally confined with 2 layers of CFRP are presented.
The 3D FE pseudodynamic analysis approach may reproduce any random load or displacement history over time. While the experimental columns were subjected to successive cycles of top horizontal displacements of increasing value, the FE analyses followed a monotonically increasing top horizontal displacement. This approach saved valuable analysis time while maintaining high reliability. Figure 2a–c presents the validation of the pseudodynamic monotonic analytical base shear force–displacement curves when compared against the experimental ones (the envelope P-δ curves of the original experimental response for push (+) and push (−) directions) of columns R-P2L0, R-P2L1 and R-P2L3 with no lap splices, 15 dbL lap length and 30 dbL lap length, respectively. The experimental values for push (+) and push (−) direction and the analytical values are indicated as “experimental push (+)”, “experimental push (−)” and “analytical”, respectively. Figure 2d presents the analytical curves comparatively. The dashed lines mark the 20% drop in the maximum values of the analytical and experimental base shear (for both directions, push + and −), considered as the lowest acceptable threshold of base shear at failure according to several seismic codes. In particular (see Table 1), for column R-P2L0 without lap splices, these experimental limit values for push (+) and (−) are 0.8 × 240 = 192 kN (black dashed line) and 0.8 × 194 = 155.2 kN (grey dashed line), respectively. The analytical prediction is 0.8 × 217.7 = 174.2 kN (red dashed line), being around the average of experimental values per cycle.
Table 1 cites the analytical (derived from FE analyses) and experimental results of columns without lap splices or with bar lap lengths of 15 dbL and 30 dbL, externally confined with CFRP jackets. It presents and compares the maximum and ultimate lateral force (Pmax, Pu = 0.80 Pmax) and the corresponding displacements (δPmax, δPu). The parameter used to compare the analytical with the experimental values in this study is absolute divergence (AD), also known as absolute error (AE), and it is defined in Equation (4).
AD = | α anal . α exp . | α exp .
AD requires the experimental values (αexp.) to be subtracted from the analytical ones (αanal.) and then take the absolute values and divide it by the experimental ones (αexp.).
Column R-P2L3 shows the best convergence between analytical and experimental values. Regarding the maximum base shear, the AD for push (+) direction is 2.74% and for push (−) direction is 0.53%, while the ultimate displacement is 11.10% and 2.85%, respectively. All comparisons, for all three columns, of analytical and experimental loads (P) and displacements (δ) at characteristic states (Pmax, Pu) suggest that the analytical predictions are very close to the experiments both qualitatively and based on the AD (%) values (Figure 2 and Table 1). This allows for extensive analytical elaborations of the global performance of the bars at the lap-splice region, their local slip and stress development, and other characteristics.
The application of CFRP jacket on the column without lap splices (R-P2L0) results in an increment in shear strength and ductility of 12% and 100%, respectively, compared to the unretrofitted column without lap splices (R-0L0). Herein, both the experimental and analytical results reveal the column with 15 dbL lap splices (R-P2L1) shows a significantly reduced base shear (a mean reduction of about 20%) and reduced deformation capacity compared with the column without lap splices (R-P2L0). The column with 30 dbL (R-P2L3) achieves ultimate displacement similar to that of R-P2L0 but at marginally lower base shear (around 4%).
Similarly, the analytical maximum axial force developed on the bars under tension at the lap region at the base of column R-P2L3 is 134.63 kN. This force is 9% lower than the axial force of 147.89 kN in R-P2L0. For the column R-P2L1, the corresponding axial force is only 85.49 kN, being 57% of the force on column R-P2L0. Therefore, the steel bars in the lap do not yield (analytical yield tensile force on the bar is 130.8 kN), despite the fact the column is confined with CFRP jacket. Figure 3a presents the undeformed lap length region of 15 dbL (R-P2L1), while Figure 3b,c presents the slippage of the bars of columns R-P2L1 and R-P2L3 at ultimate displacement.
Figure 4 presents the concrete damage of the specimens R-P2L0, R-P2L1 and R-P2L3, which occurred at the bottom of the columns at ultimate displacement. The column without laps and the one with marginally adequate lap-splice design present similar damage variation, leading to severely damaged concrete under tension or compression. However, R-P2L1 with inadequate lap-spliced bar design shows severely damaged concrete at the failed lap-splice region and a lower degree of damage at the compression side, as the tensioned bars slip relative to each other.

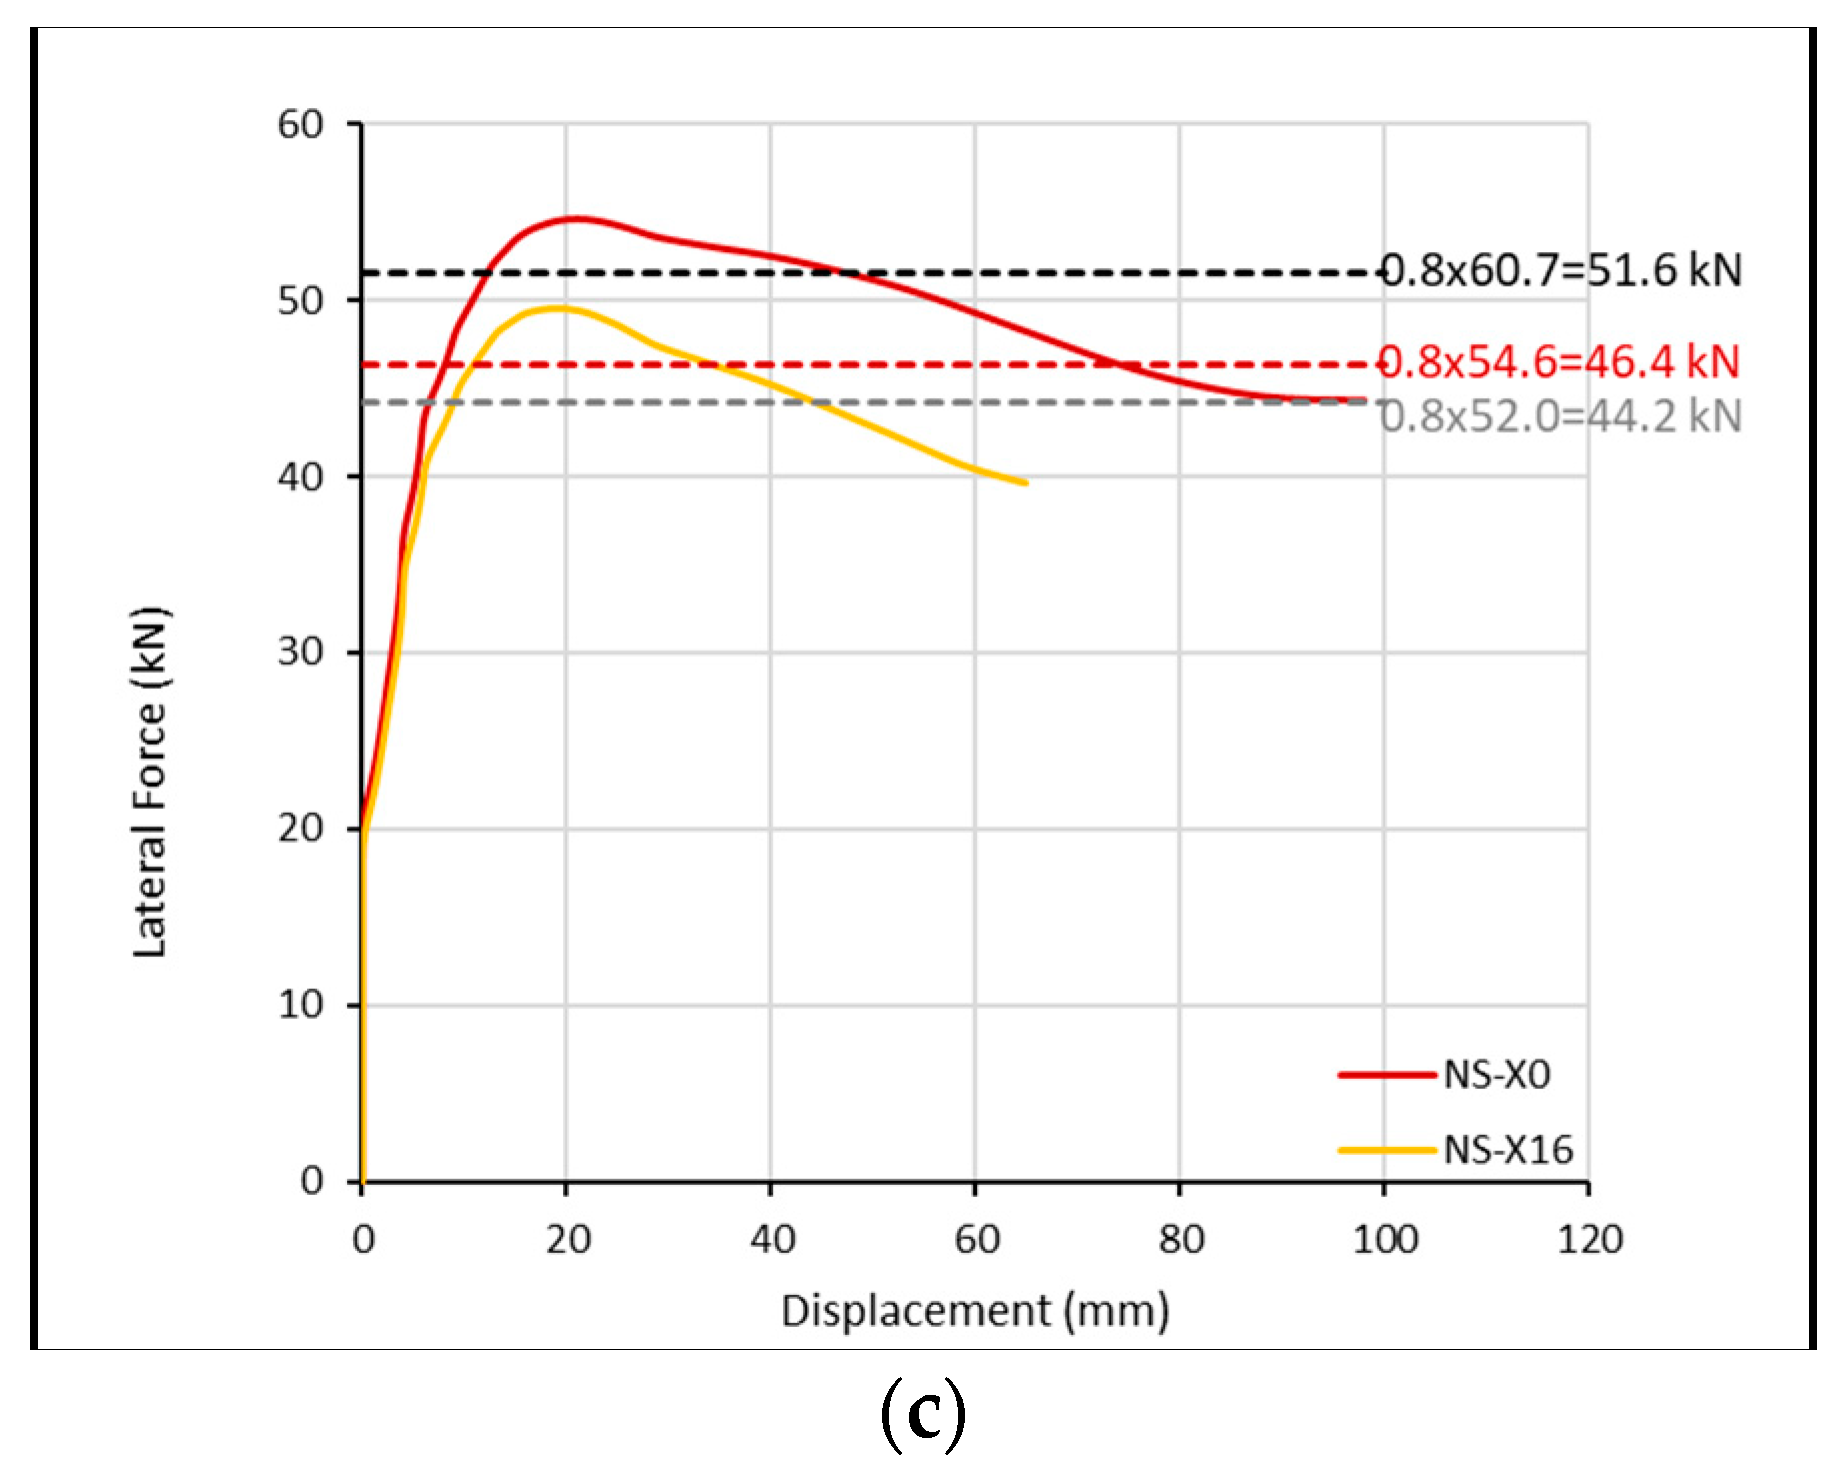
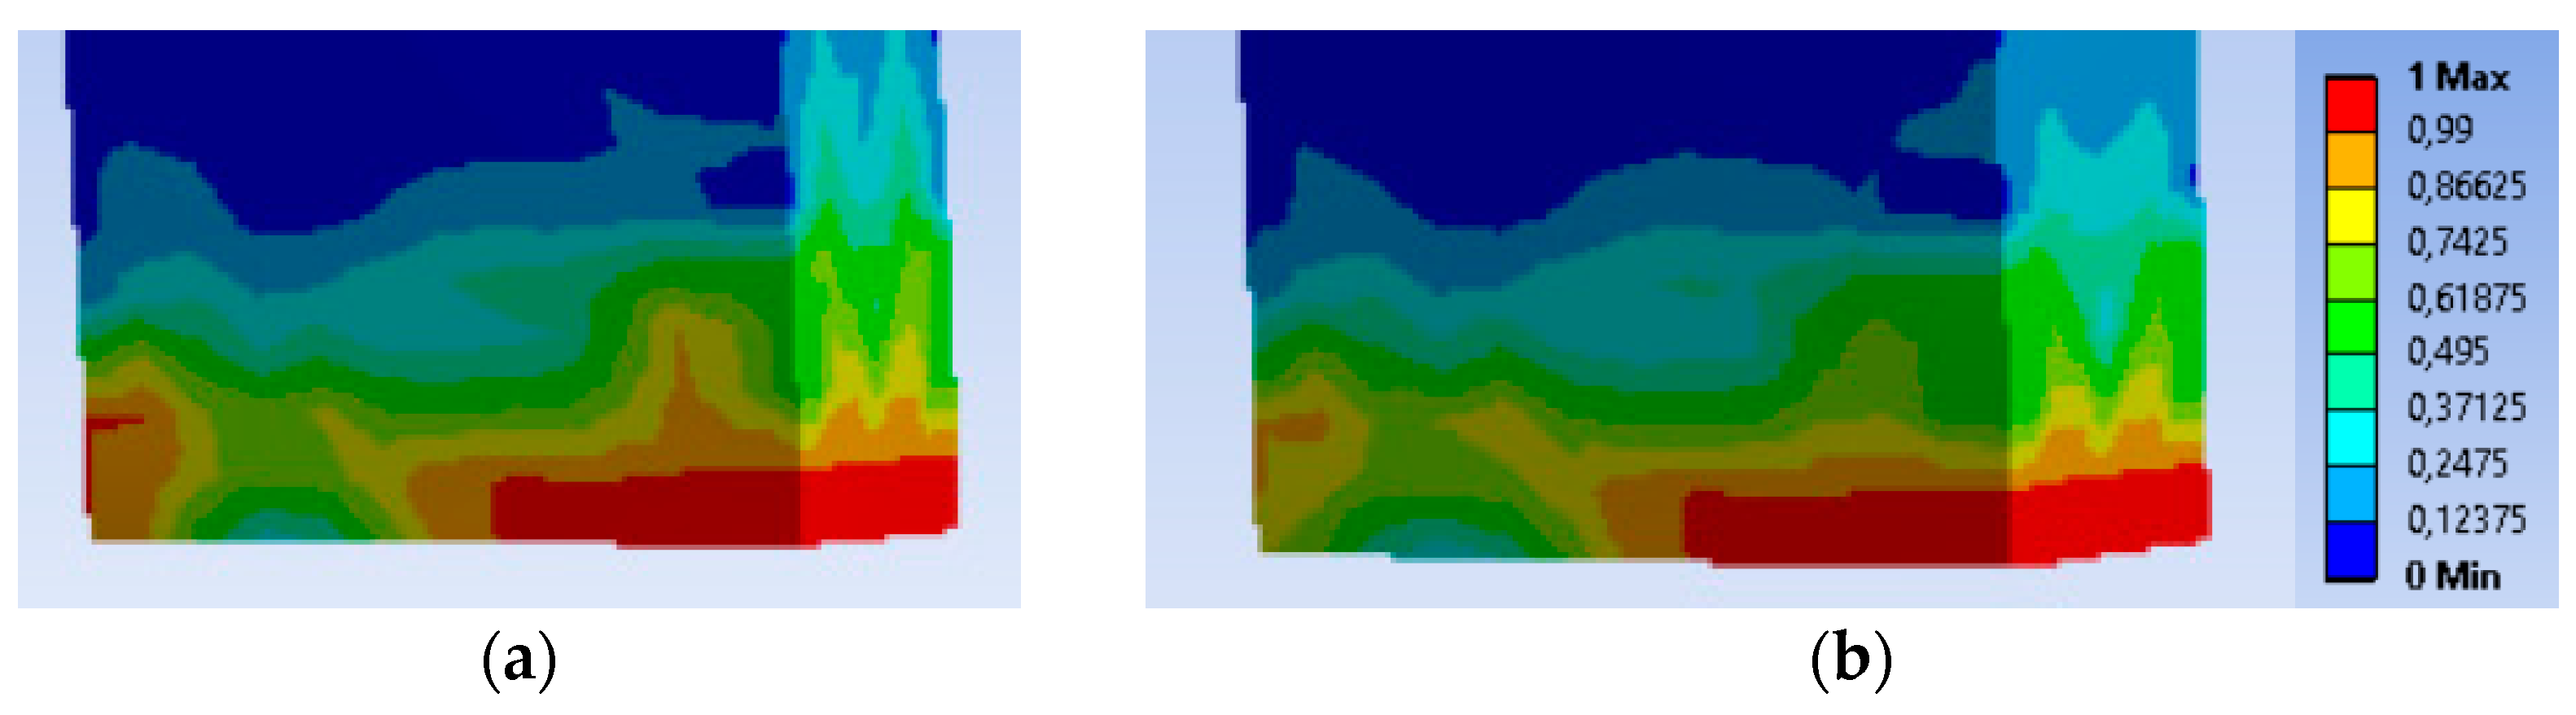
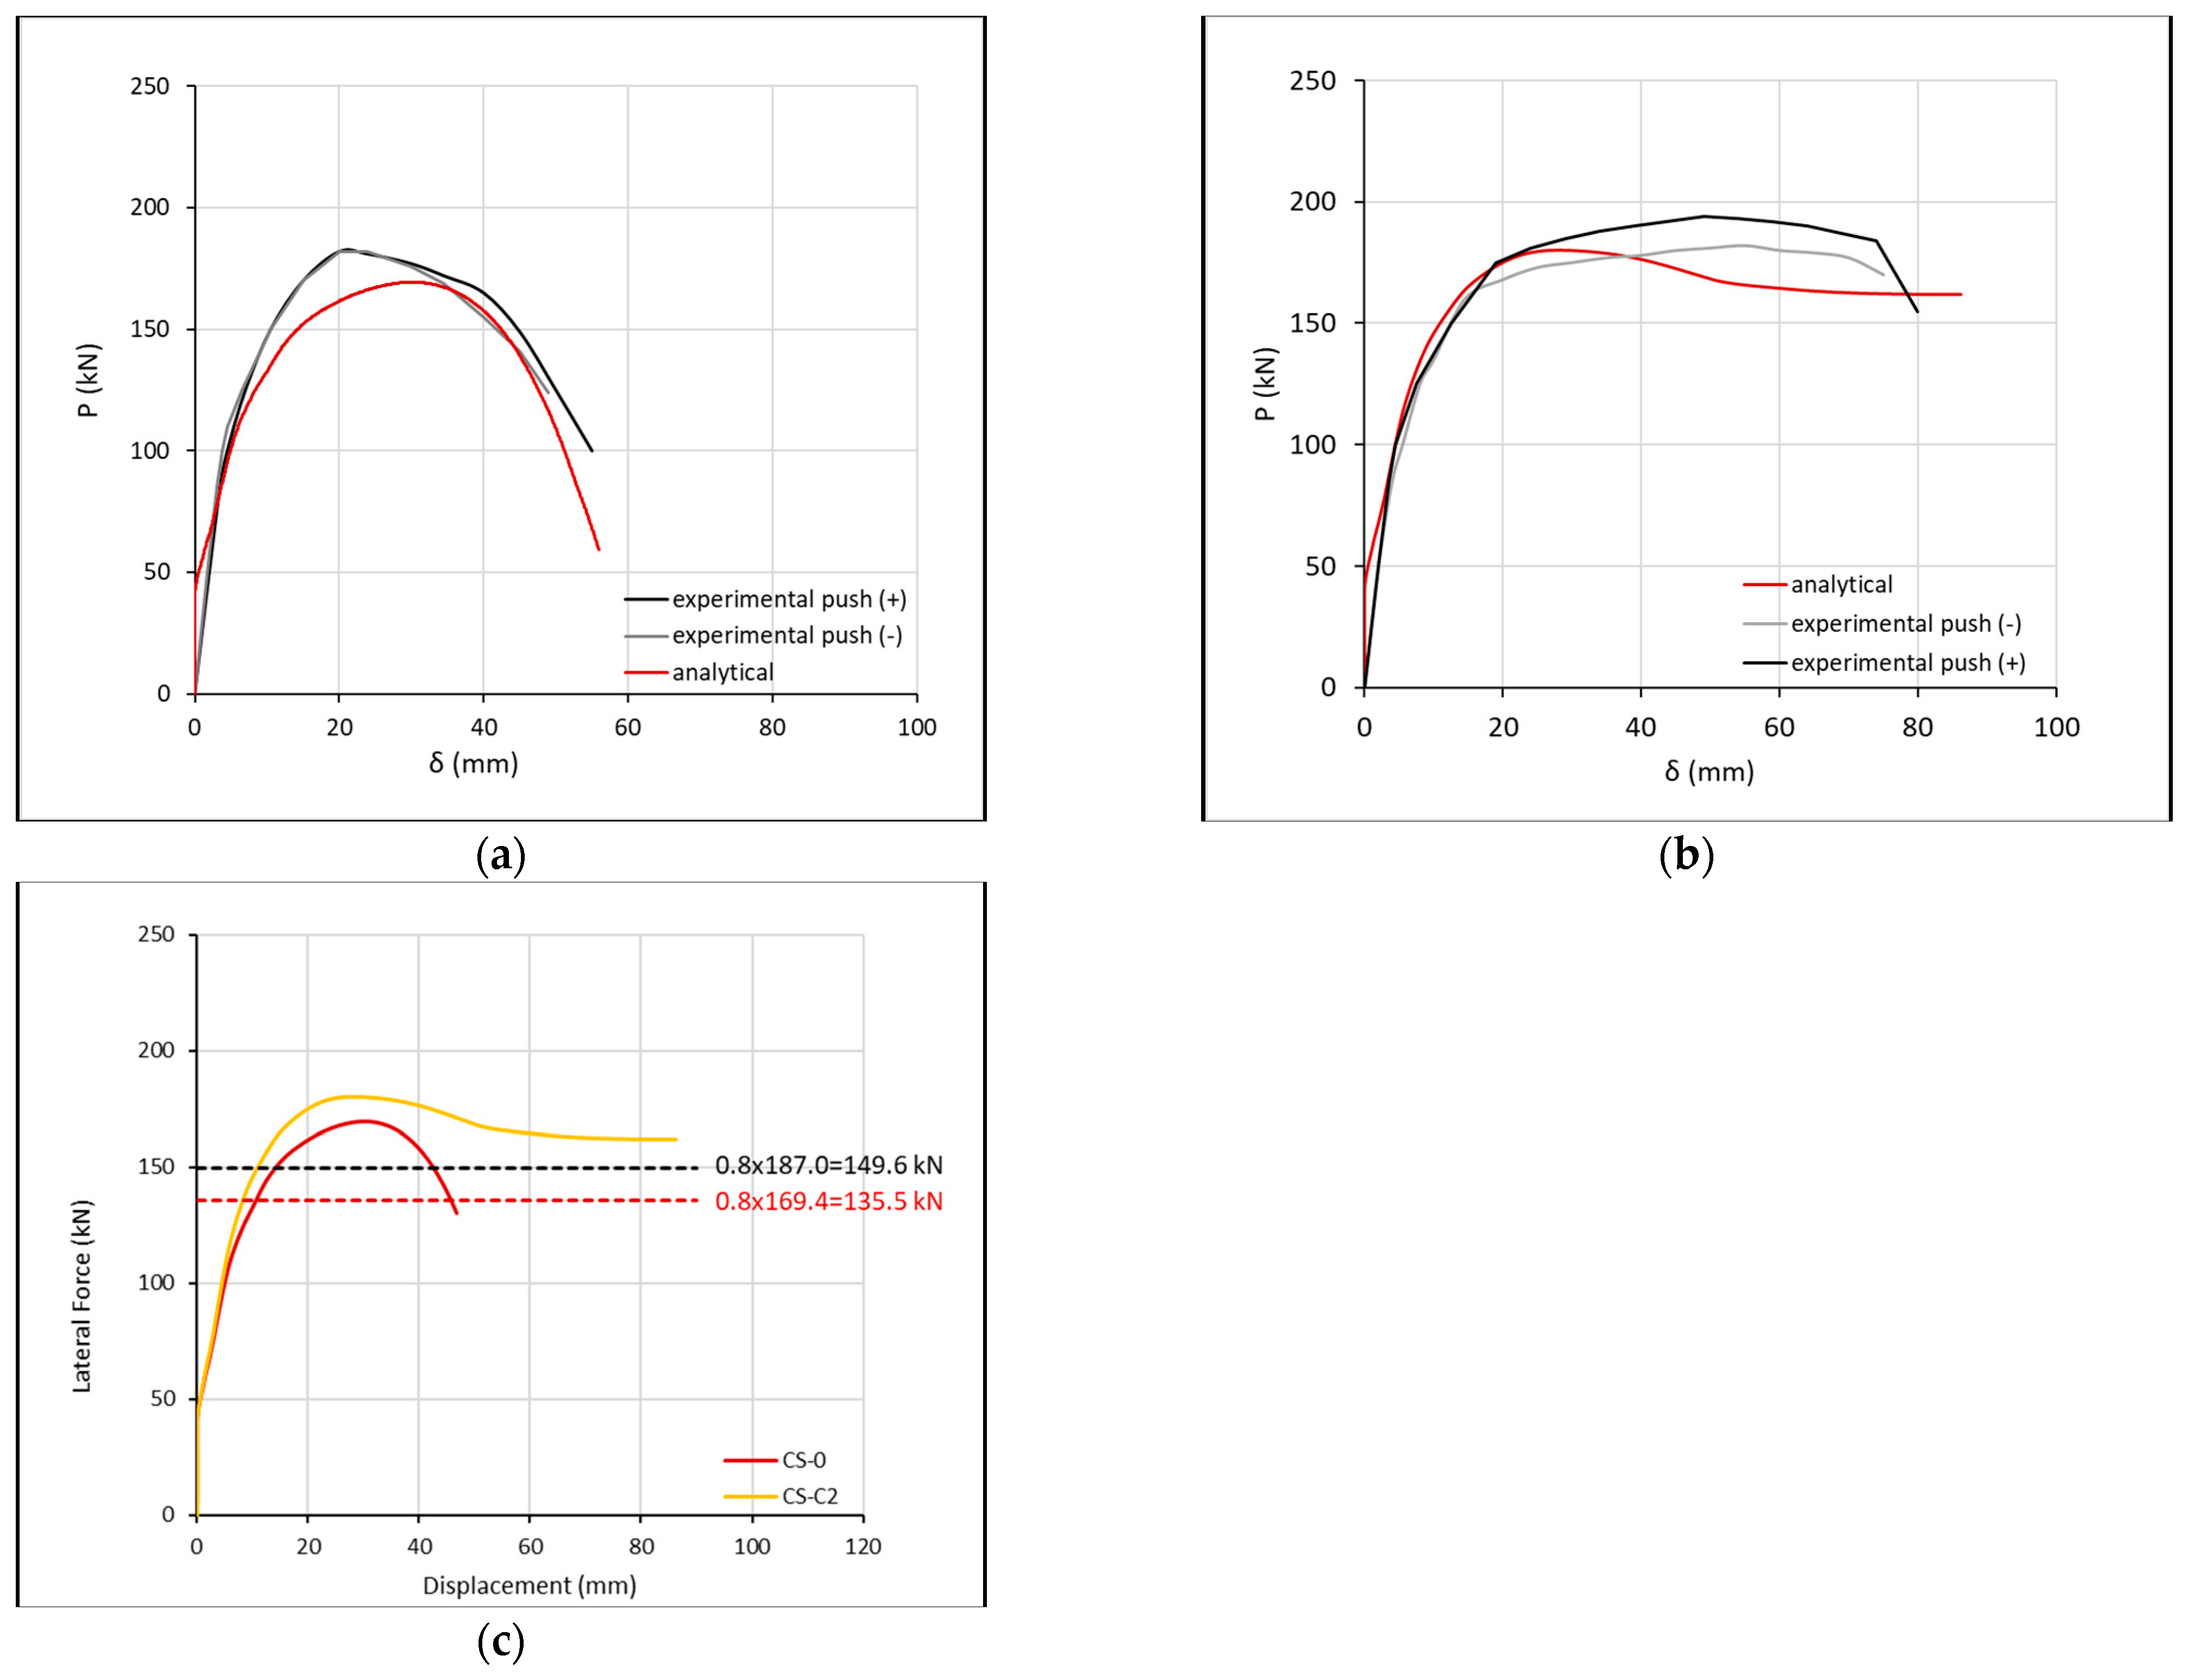
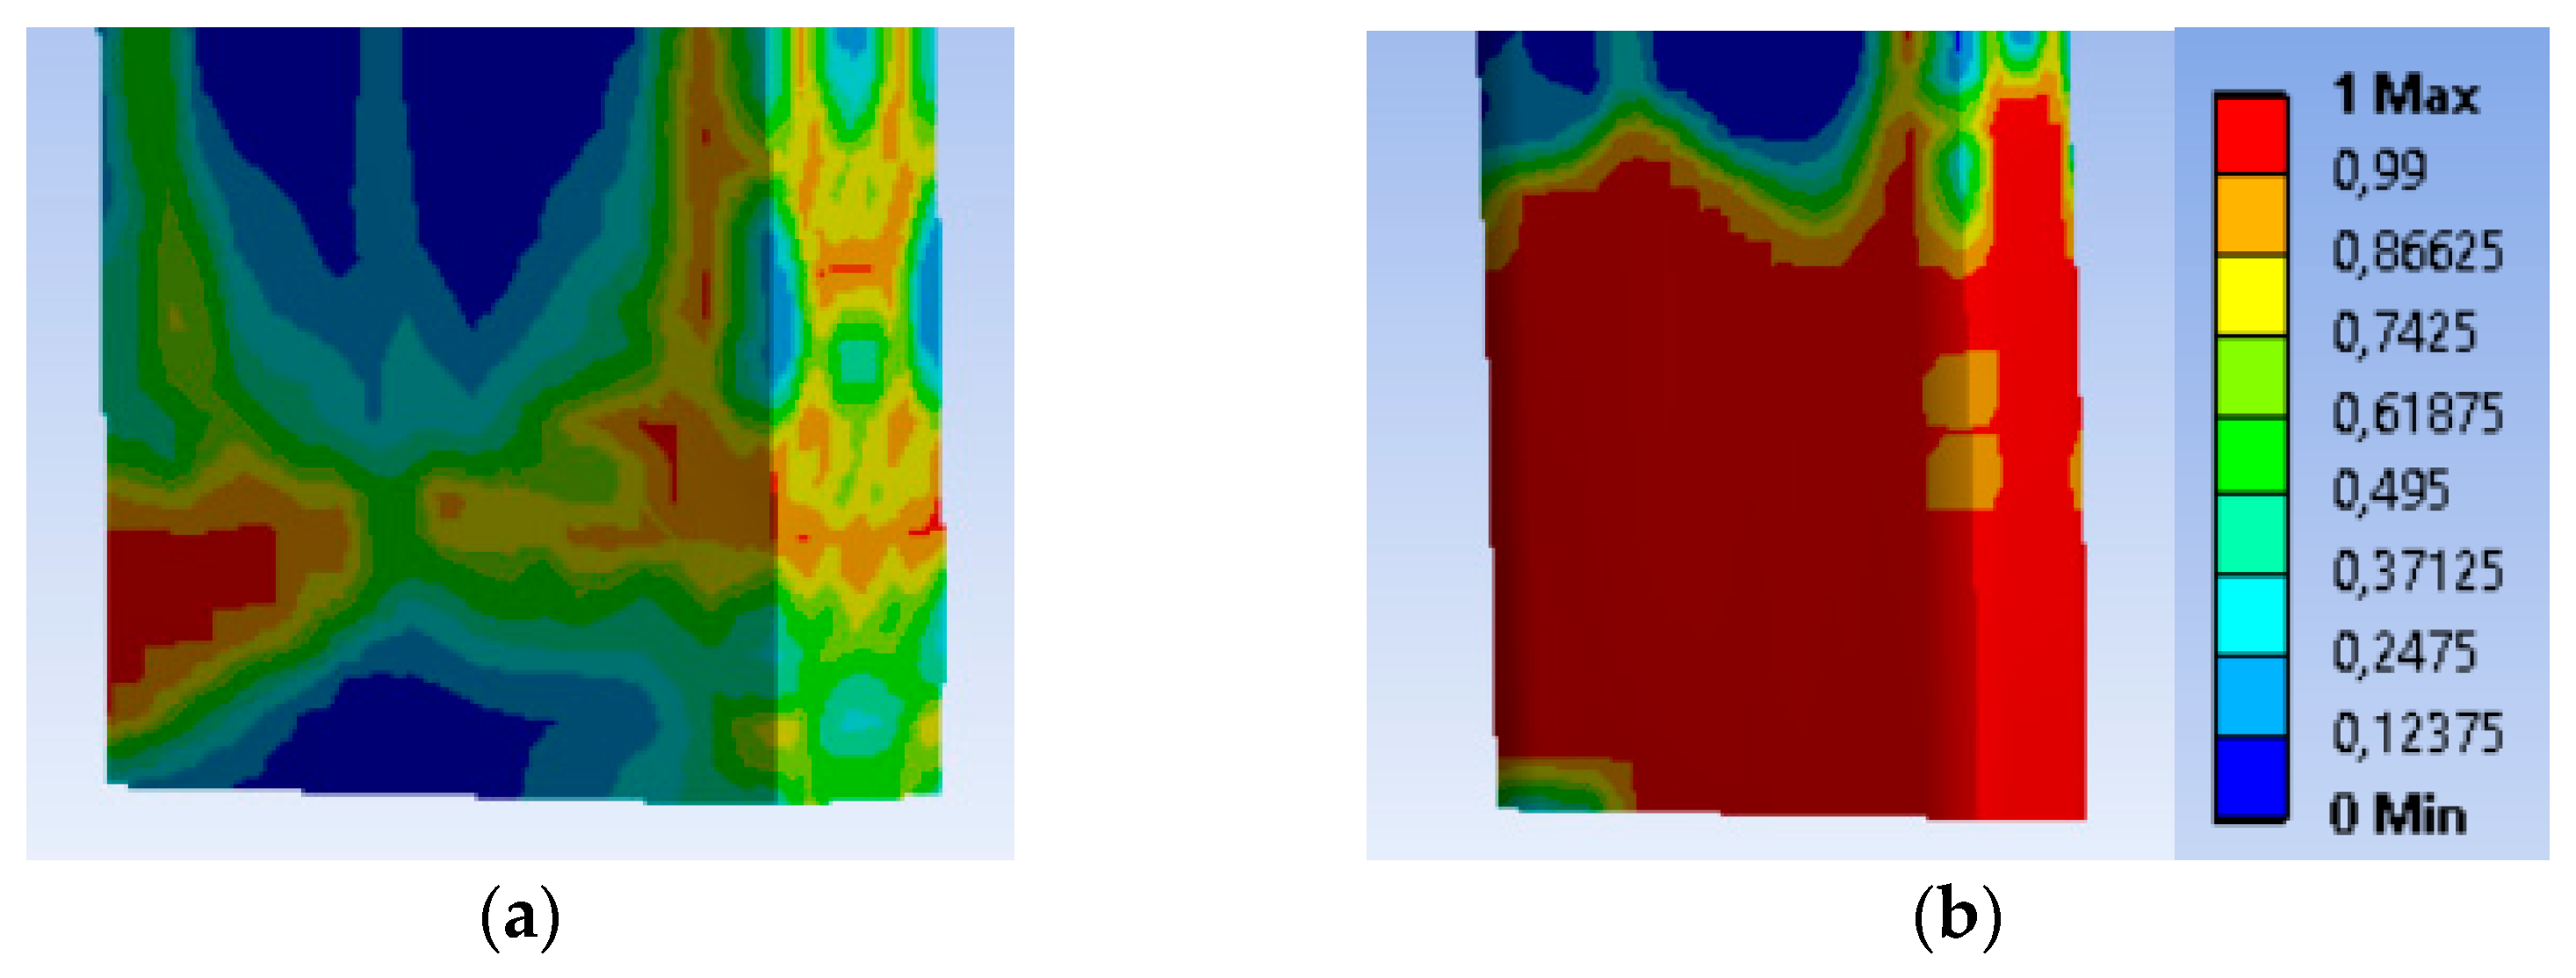
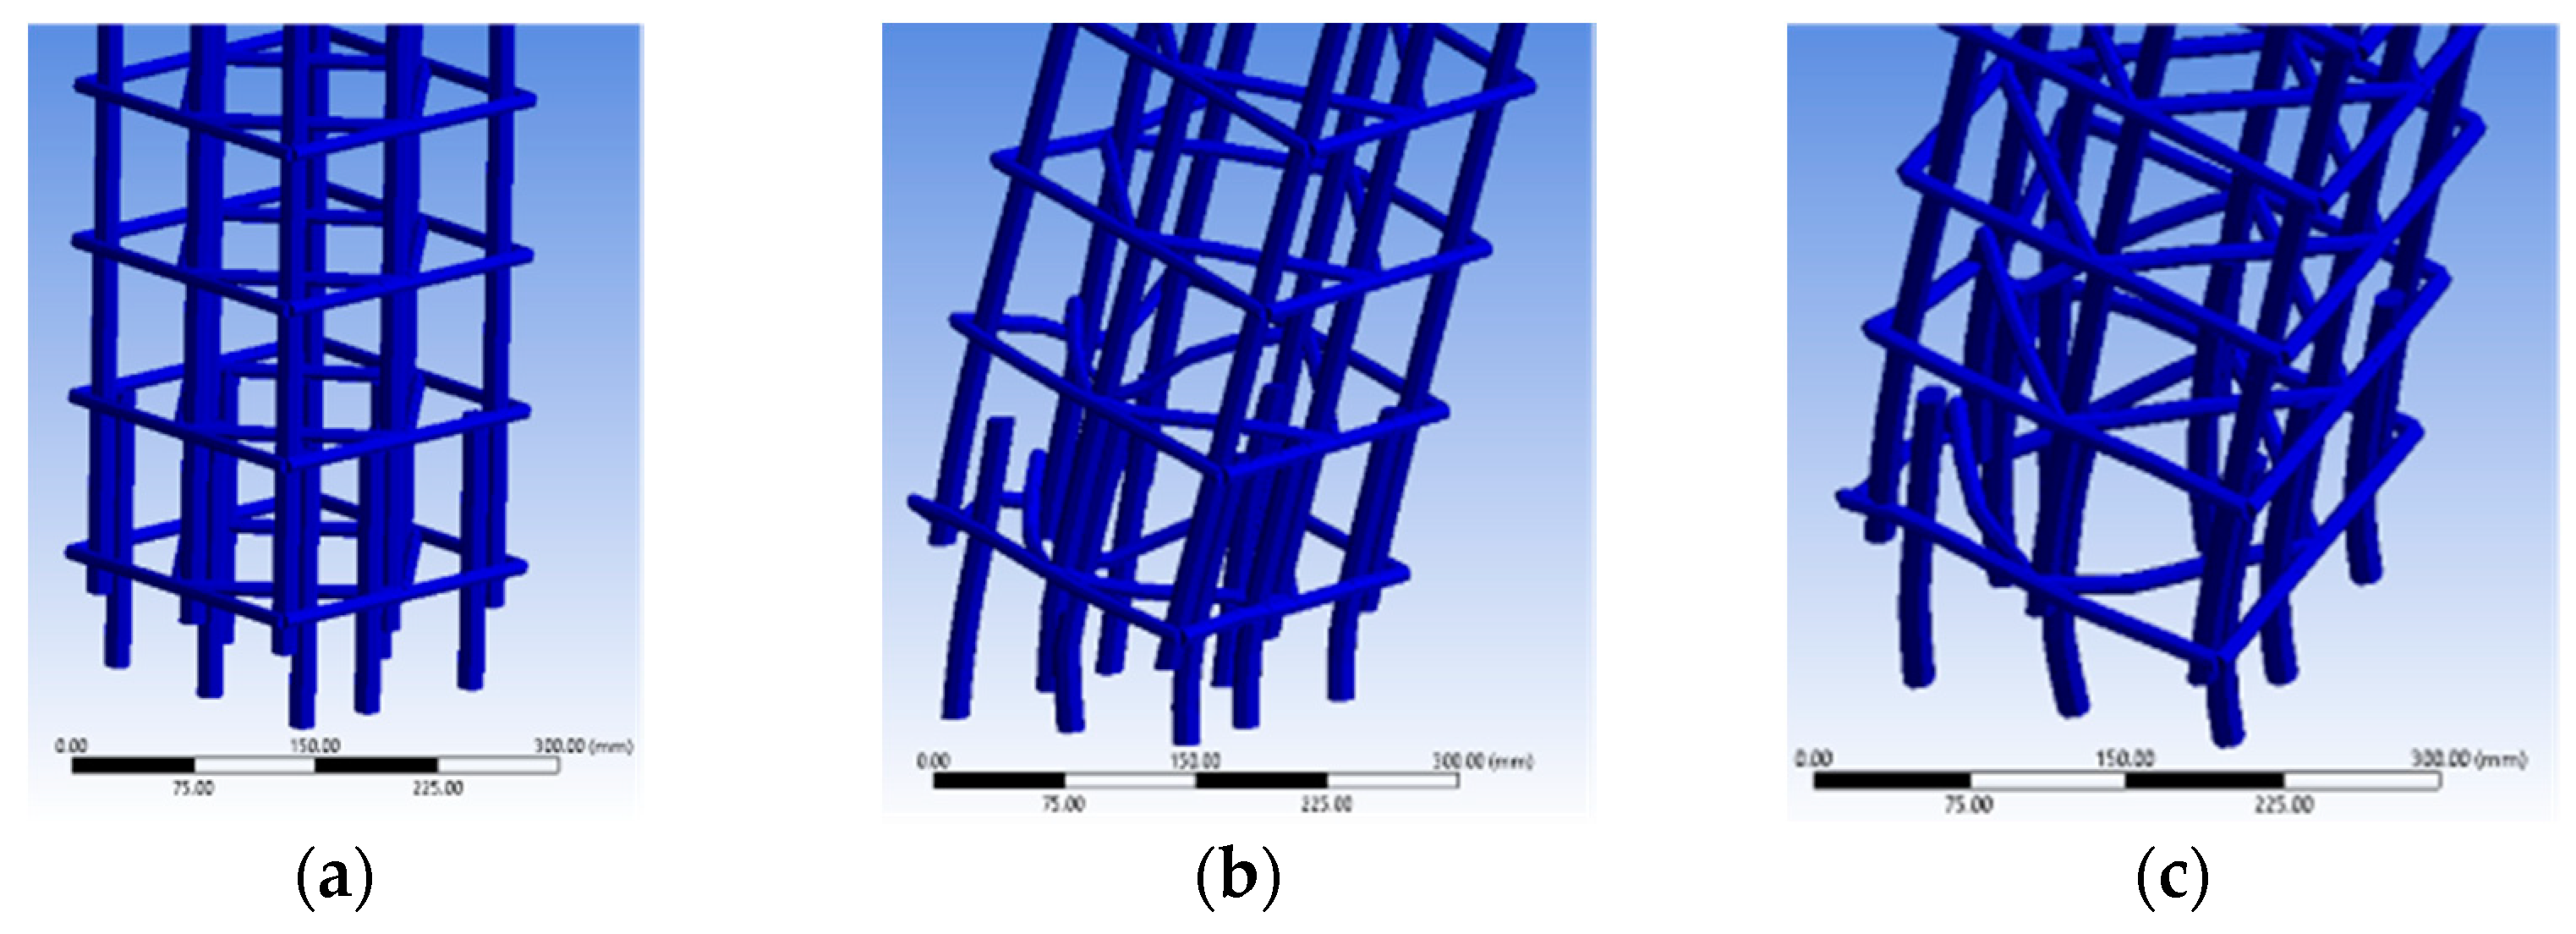
3.2. RC Columns with Corroded Steel Reinforcement
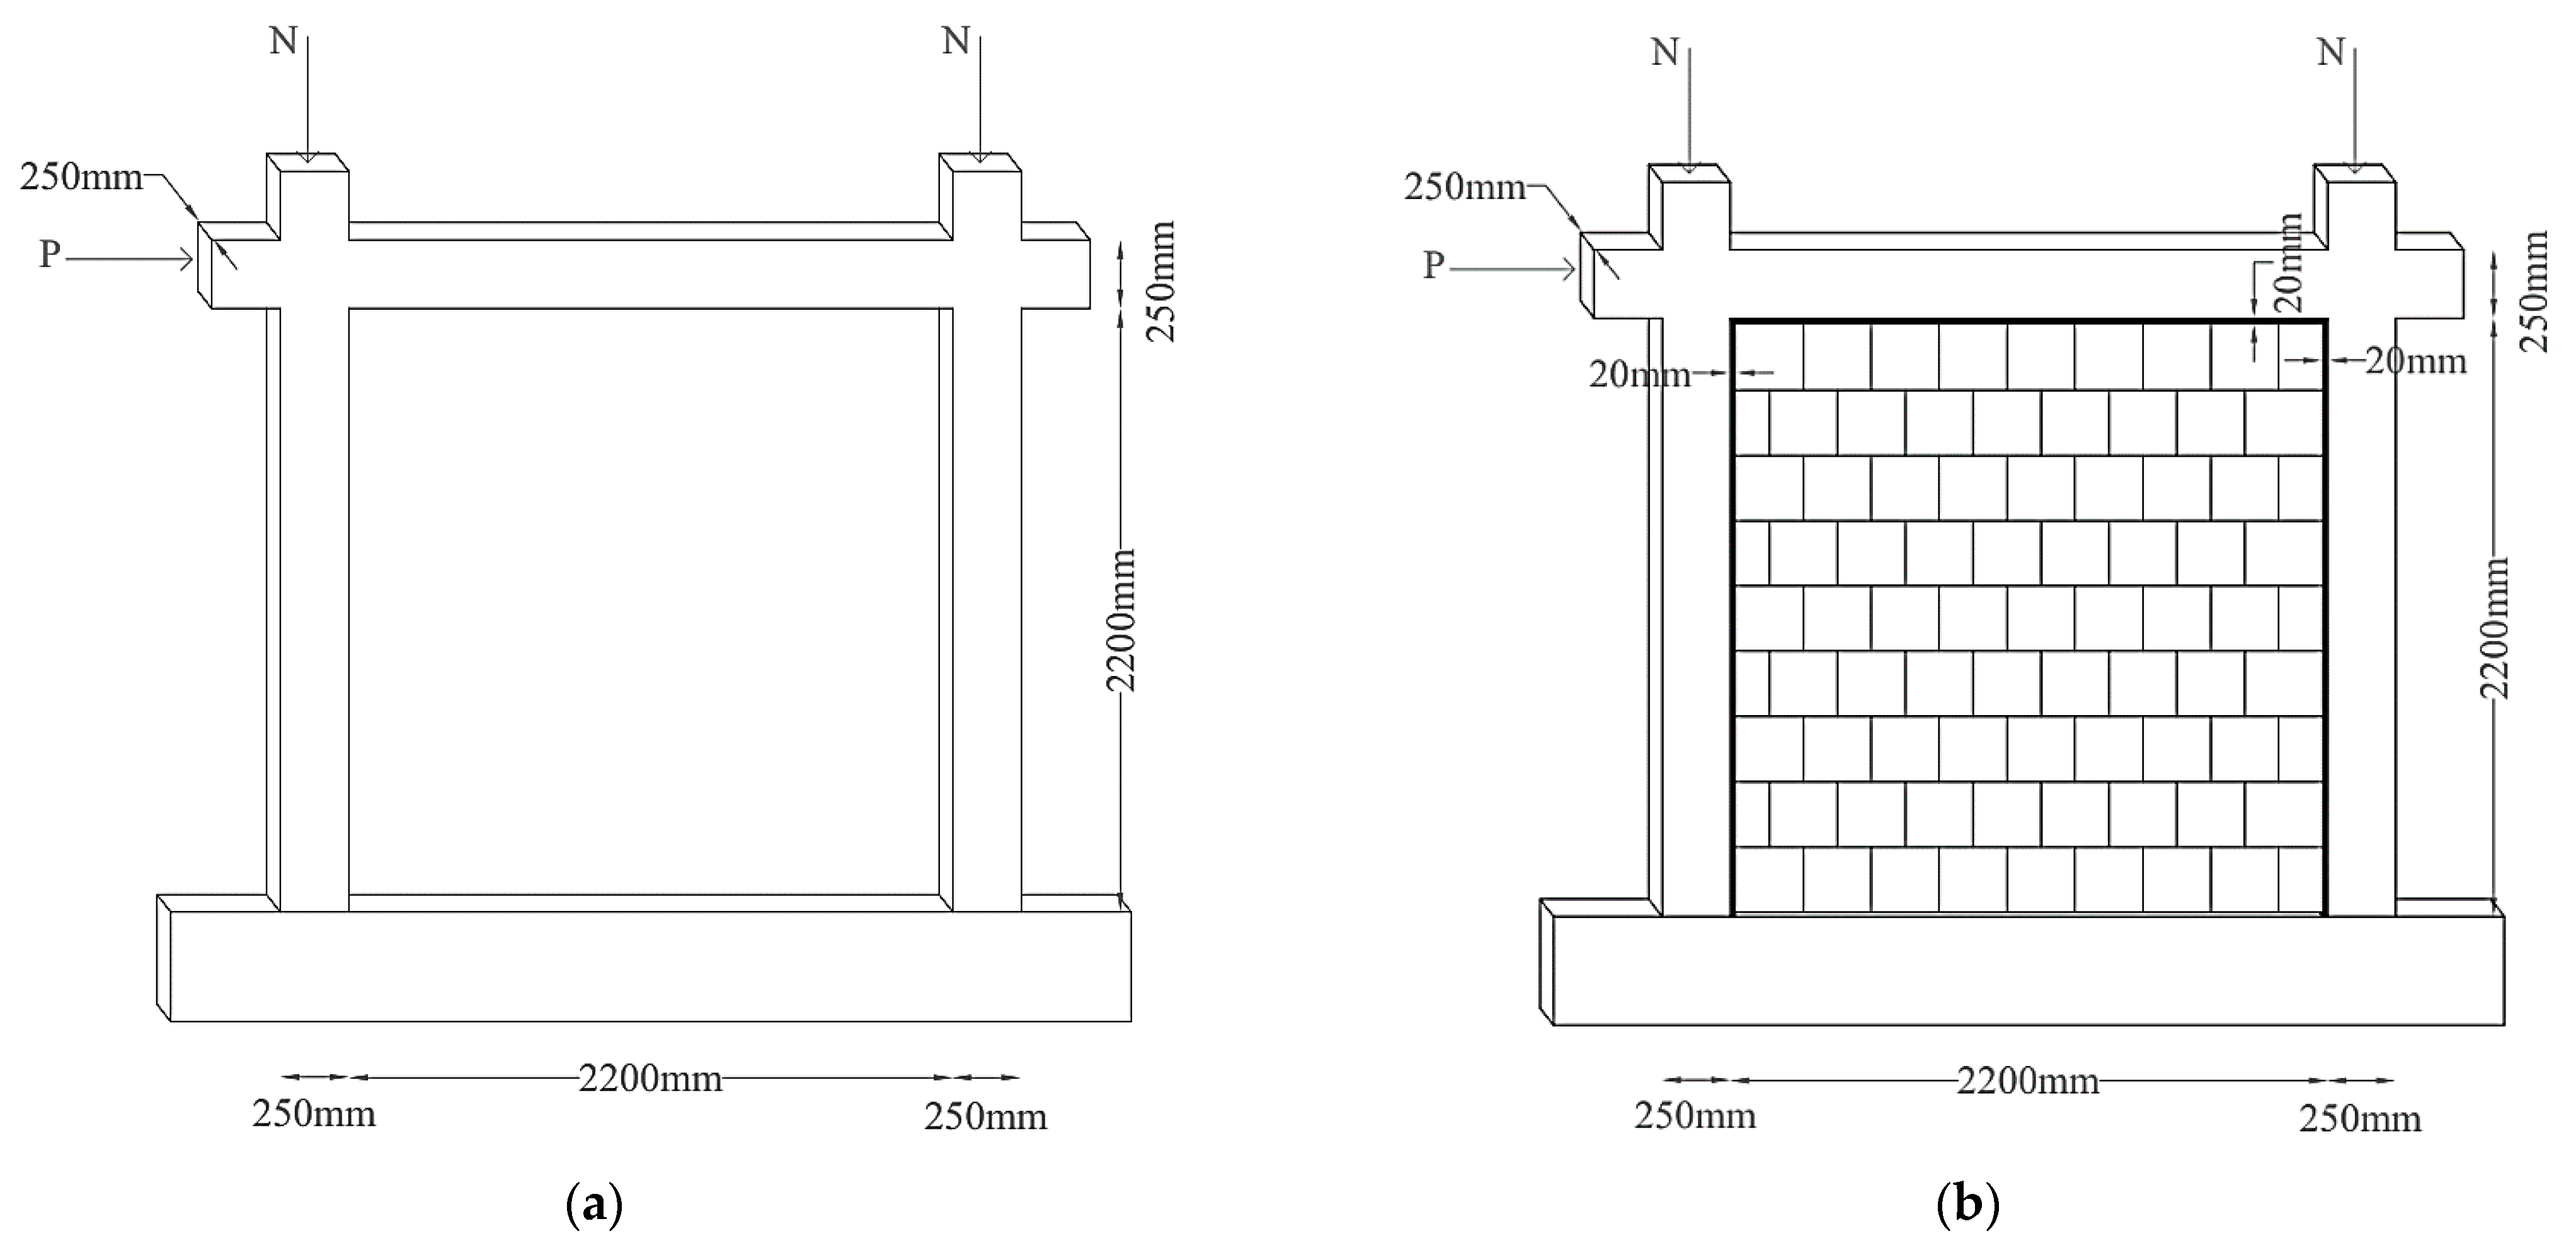
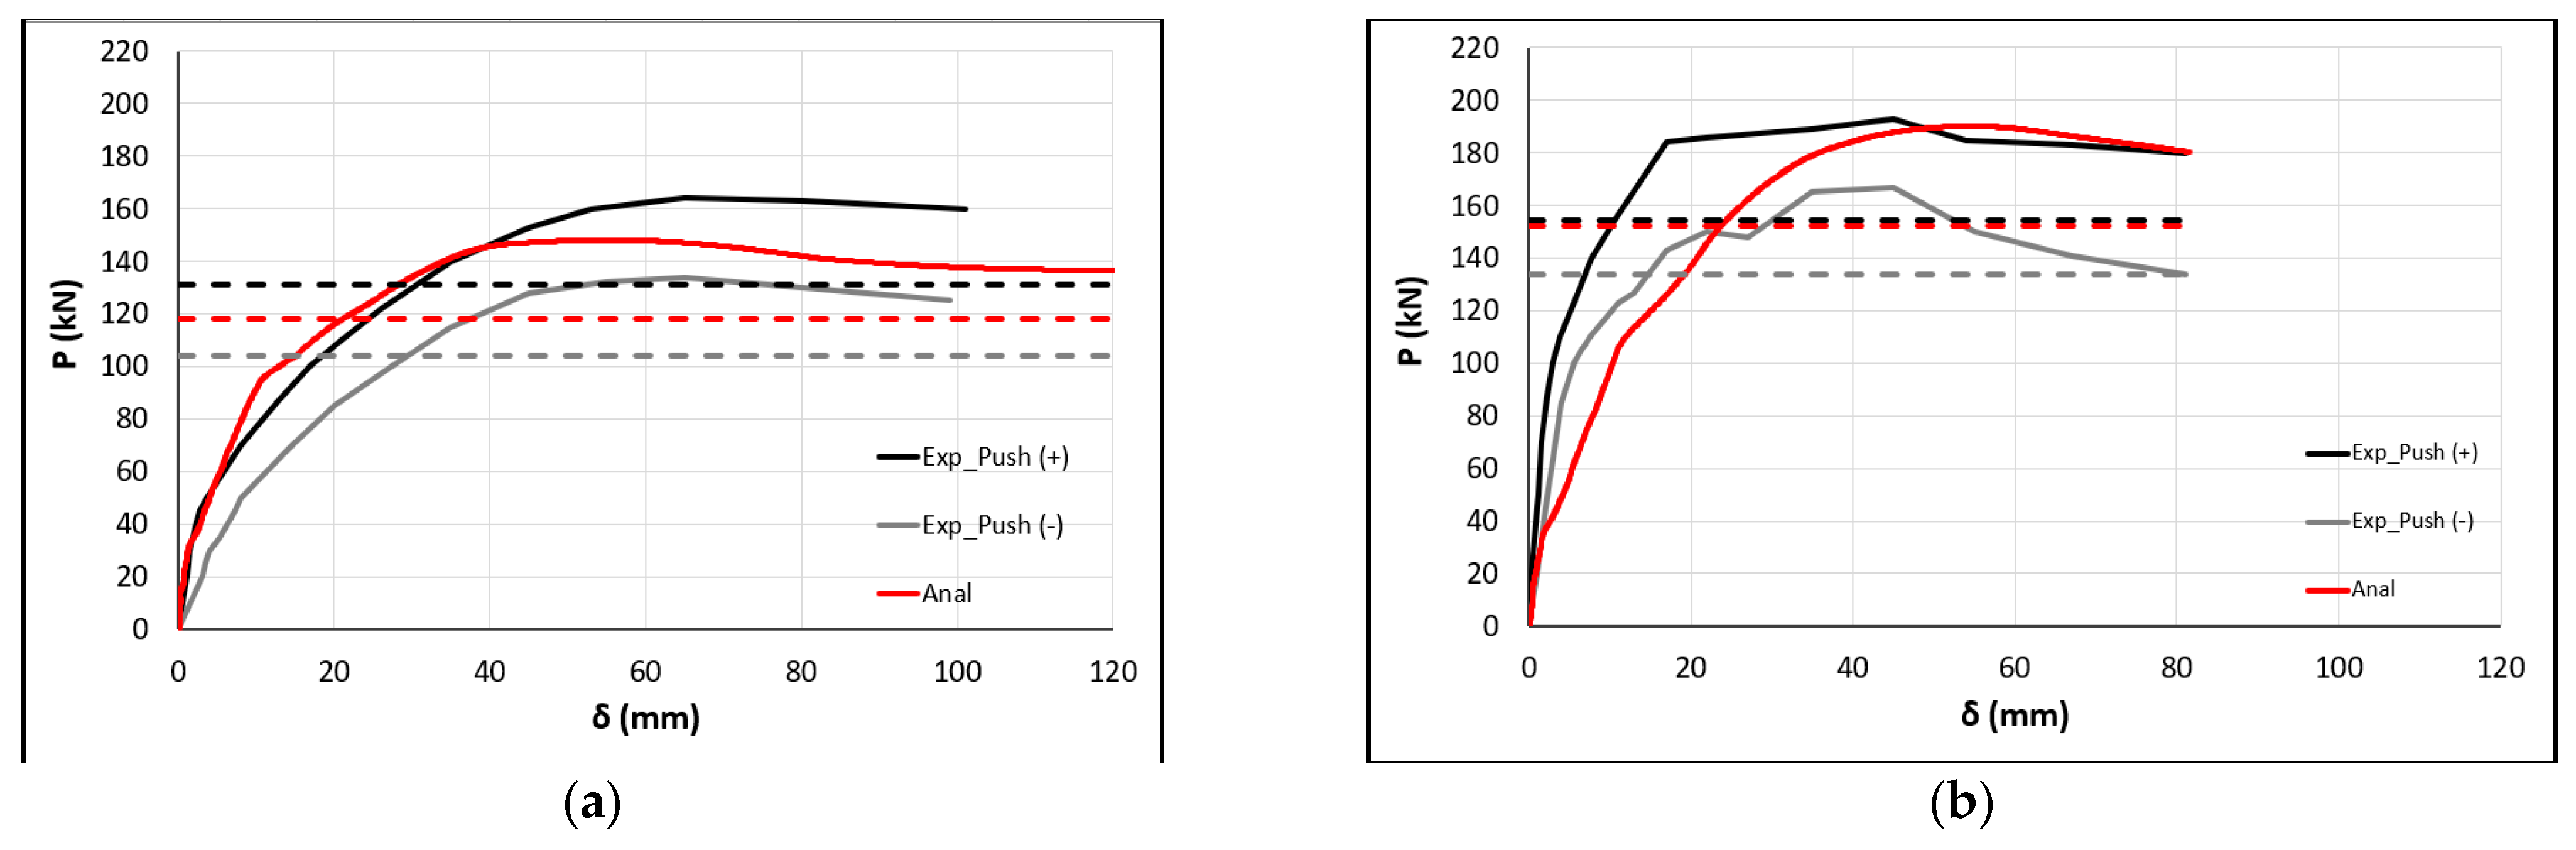
This section presents the geometric and mechanical characteristics of the 3D FE models of RC columns with corroded steel bars of varying degree of mass loss, based on the experiments by [3]. The columns had section dimensions 20 cm × 30 cm and height 120 cm (Figure 1b). They were reinforced with 4Φ14 longitudinal lap-spliced rebars (a lap length of 40 dbL) and Φ8/100 mm closed stirrups (peripheral). They had concrete strength and steel yield stress of fc = 25.5 MPa and fyL = 460 MPa, respectively. The normalized axial load on the column was v = 0.18. Four different degrees of corrosion, 9%, 16%, 22% and 54% corresponding to the columns NS-X9, NS-X16, NS-X22 and NS-X54, were investigated experimentally (NS-X0 being the non-corroded column).
The FE modelling of the corroded bars suggests that the force received by the longitudinal bars under tension is reduced according to the cross-sectional area loss of the steel bars. The experimental results suggest that the strength and the ductility of RC column decrease with the degree of corrosion and the reduction of strain in corroded steel bars may be significant. Finally, for a high degree of corrosion, fracture of steel longitudinal bars is expected.
Figure 5a,b present the analytical base shear force–displacement curves of columns NS-X0 and NS-X16 with no corrosion and 16% corrosion degree (in terms of cross-sectional area loss of steel bars), respectively, compared against the experimental ones (the envelope P-δ curves of the original experimental response). Figure 5c presents the comparison of the analytical curves. The dashed lines mark the 20% drop in the maximum values of the analytical and experimental base shears (for both directions, push + and −), considered as the lowest acceptable threshold of base shear at failure according to several seismic codes. For the uncorroded column NS-X0 (Table 2), these experimental limit values for push (+) and (−) are 0.8 × 60.7 = 51.6 kN (black dashed line) and 0.8 × 52.0 = 44.2 kN (grey dashed line), respectively. The analytical prediction is 0.8 × 54.6 = 46.4 kN (red dashed line).
A cross-sectional area loss of corroded bars of about 10% results in negligible reduction to the ultimate chord rotation [3]. A mass loss higher than 20% leads to a dramatic reduction in yielding and ultimate strength [45]. The column NS-X16 presented a reduction in experimental ultimate displacement of about 28% and in strength of about 10%, compared to the uncorroded column. This corrosion level is considered in this study the limit for a column satisfying the seismic code requirements (EC8 and Greek Seismic Code).
Figure 6a,b present the concrete damage of the specimens NS-X0 and NS-X16 at the bottom of the columns.
Furthermore, the FE approach was validated against experiments by [44] concerning corroded columns externally confined with FRPs (CS-0 without FRP confinement and CS-C2 confined with two layers of FRP). The half-column specimens had dimensions 25 cm × 50 cm × 160 cm (Figure 1a) as well as fc = 18.1–20.4 MPa, fyL = 560 MPa and v = 0.34–0.38. They were reinforced with 4Φ18 longitudinal continuous rebars and Φ8/200 mm closed stirrups (peripheral). For one layer of CFRP, tf = 0.13 mm, Ef = 230 GPa and εuf = 0.015, while r = 30 mm and hf = 600 mm. The cross-sectional area loss of corroded bars was estimated at about 10%. For a low corrosion degree, FRP confinement could reverse the negative effects of corrosion. For the 10% corroded specimen CS-C2 externally confined with FRPs, the base shear force increased by 6% compared to the unretrofitted specimen CS-0.
Figure 7a,b compare the analytical base shear force–displacement curves of columns with 10% corrosion degree, having no FRP confinement (CS-0) or two layers of CFRP confinement (CS-C2), respectively, against the experimental ones (the envelope P-δ curves of the original experimental response). Figure 7c presents the comparison of the analytical curves. Similarly, the dashed lines mark the 20% drop in the maximum values of the analytical and experimental base shears (for both directions, push + and −). In particular (see Table 2), for column CS-0 without FRP confinement, these experimental limit values for push (+) and (−) are 0.8 × 187.0 = 149.6 kN (black dashed line), while the analytical prediction is 0.8 × 169.4 = 135.5 kN (red dashed line).
The analytical and experimental results (for both directions, push + and push −) of specimens NS-X0 and NS-X16 (0 and 16% cross-sectional area loss of steel bars, respectively) and specimens CS-0 and CS-C2 (zero and two layers CFRP, respectively) for the maximum and ultimate lateral force (Pmax, Pu) and the corresponding displacements (δPmax, δPu) are presented in Table 2. Column NS-X16 has the lowest AD of maximum base shear in s(+) and (−) directions, which are 2.64% and 0.88%, respectively. The lowest AD of ultimate displacement is 2.08% for column CS-0. All comparisons of analytical loads and displacements at characteristic states against the experimental ones suggest that the analytical predictions are satisfactory in most of the cases.
Figure 8 presents the concrete damage of the specimens CS-0 and CS-C2 at the bottom of the columns at ultimate lateral force. FRP confinement engages a higher volume of concrete within the critical region, which is placed under higher stresses in CS-C2 than in CS-0. Therefore, it results in higher-damage accumulation of concrete (up to full damage) within the critical region as the column reaches extremely high top displacement ductility levels.

3.3. RC Frames

Herein, the experimental results of two selected real-scale RC frames from the study by [26,27] are considered. Specimen A1F is the bare RC frame and has plane dimensions of 270 cm long beam with extensions of 30 cm in both sides and height of 245 cm (245 cm to the level of the diaphragm). The columns have cross-section dimensions of 25 cm × 25 cm and 8Φ16 longitudinal continuous rebars (without lap splices) and Φ10/100 mm closed stirrups (one peripheral and one rhombic per 100 mm). The columns have two top extensions of 30 cm as well as a common foundation beam with dimensions 30 cm × 40 cm × 355 cm. The top beam has cross-section dimensions of 25 cm × 25 cm and is reinforced with 8Φ14 longitudinal rebars and Φ10/100 mm closed stirrups (peripheral). The dimensions of the RC frame are presented in Figure 9a. Specimen B2 is identical to the A1F RC bare frame, but it further includes an infill wall with special thermal insulating clay bricks (orthoblocks with vertical direction of holes). At the boundary interface of the infill with the RC frame, there is an advanced seismic joint made of a highly deformable polymer. The polyurethane joint is 2 cm thick and placed at three sides (at two vertical interfaces and at top interface, Figure 9b). The two columns of the frame received a constant concentric axial load of 375 kN each. The horizontal actuator imposed successive pseudostatic cycles of gradually increased displacements at the top beam. More details on the materials used, the experimental setup, the instrumentation and test results of the A1F and B2 frames can be found in [26,27].
Figure 10a,b show in black and black-grey curves the experimental envelope base shear–top displacement curves of A1F and B2 for (+) and (−) push, respectively. The application of the innovative orthoblock infill with the PUFJ seismic joint increased the elastic stiffness of the bare frame as well as the maximum base shear of the bare frame from 164 kN (A1F frame push +) and 134 kN (A1F frame push −) to 192.8 kN (B2 frame push +) and 167 kN (B2 frame push −). Further, the top displacement ductility of the infilled frame B2 was remarkable, with negligible base shear reduction up to 3.5% drift for push (+).
The analytical predictions of the FE analyses are in red color and compare well with the experimental ones in terms of maximum and ultimate base shear, as well as in terms of top displacement at maximum and ultimate bearing load (see Figure 10).

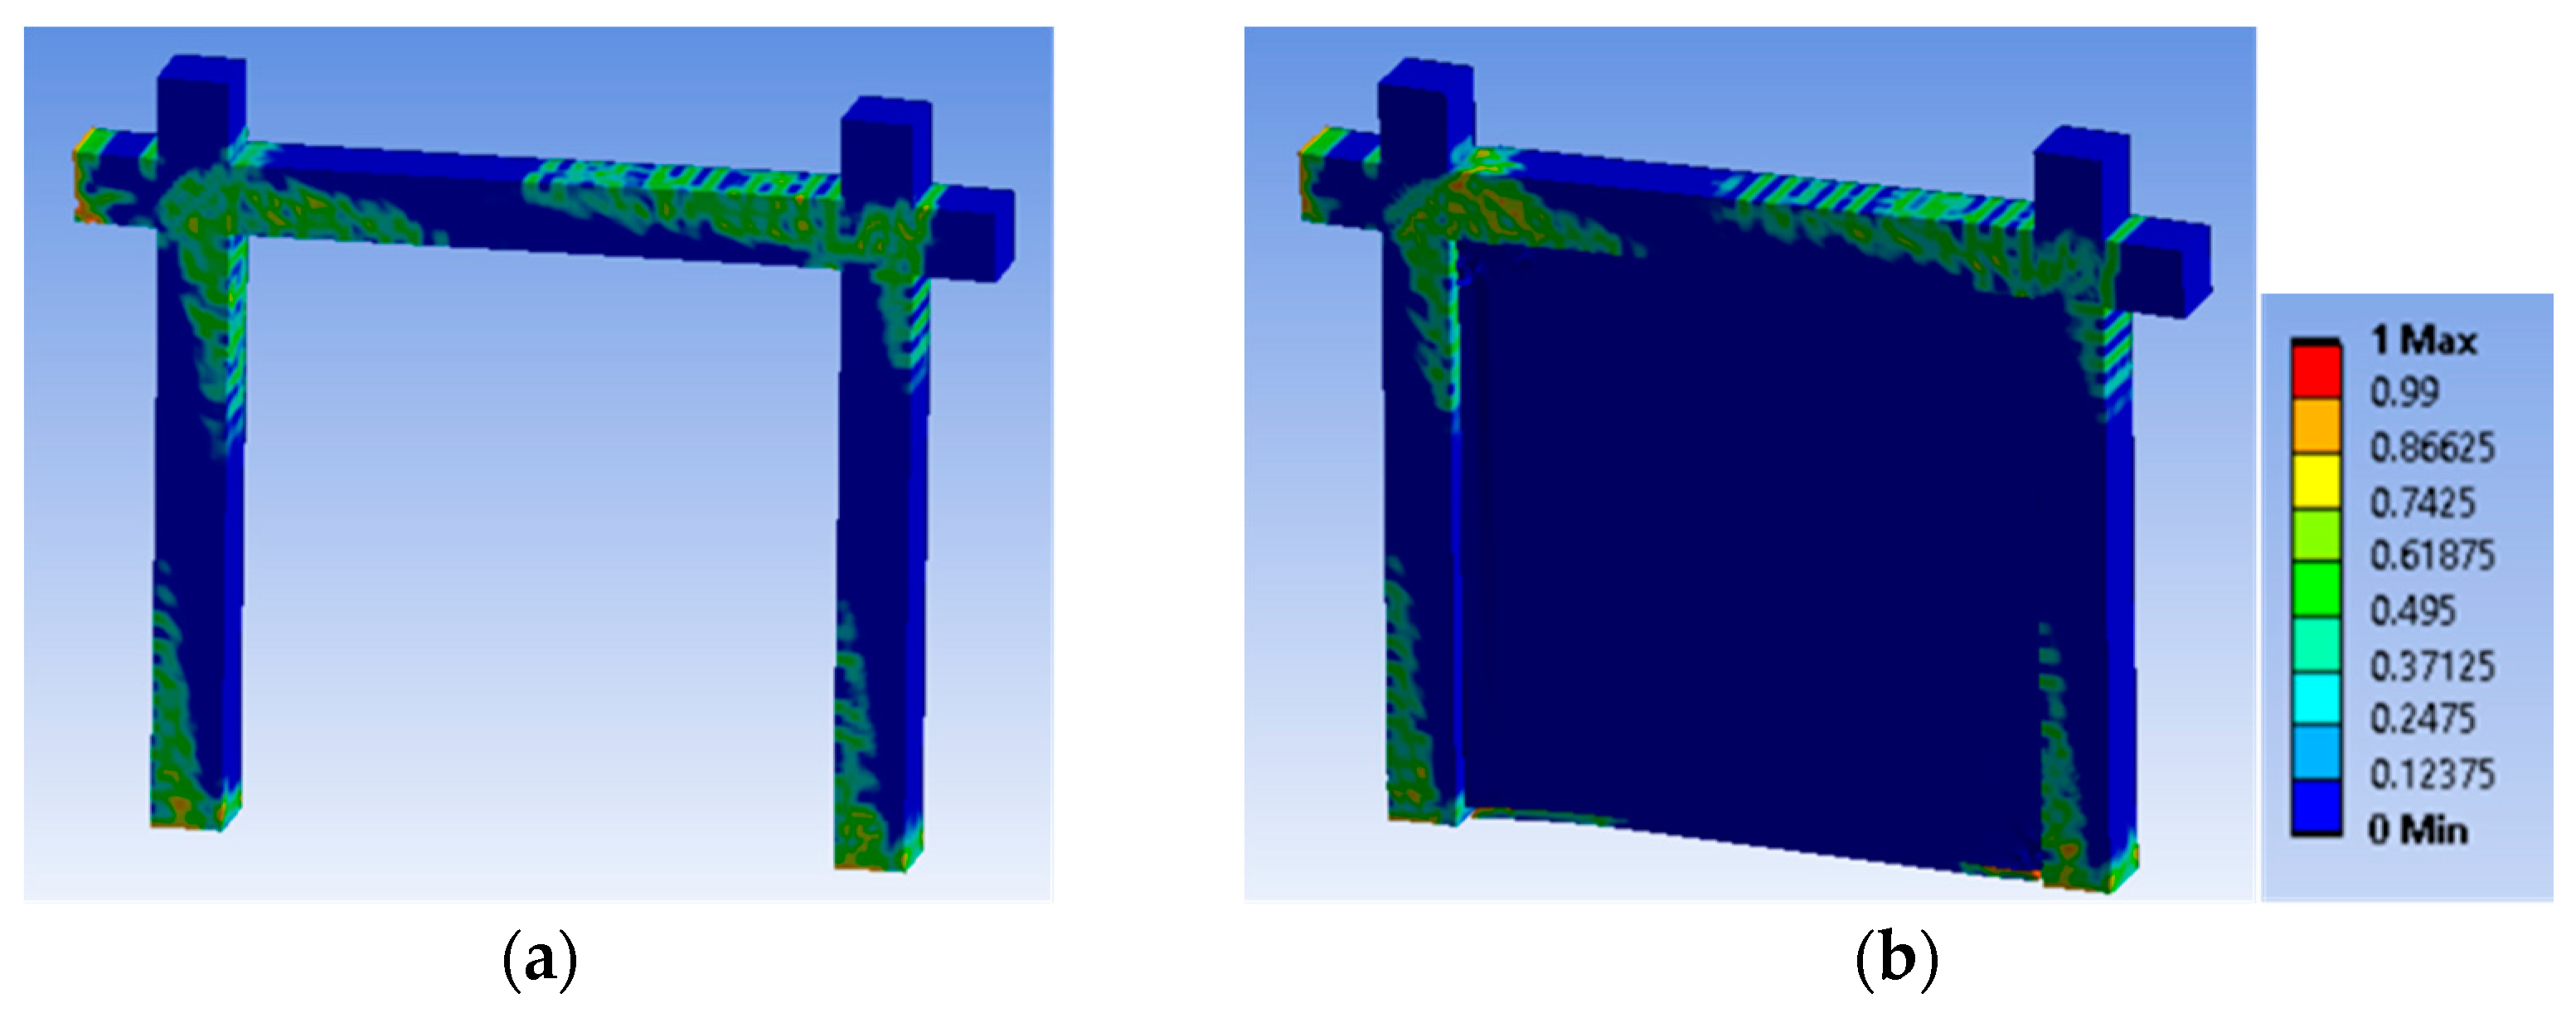
4. Parametric FE Analytical Investigation of Damaged RC Frames

In the previous sections, the 3D FE modelling approach was developed and validated for RC columns with lap-spliced steel bars or with corroded reinforcements. Herein, different lap-splice lengths and corrosion degree scenarios are explored for A1F and B2 RC frames. Further, the study focuses on the effects of the implementation of orthoblock infill with seismic PUFJ (as retrofit system) on the P-δ performance of deficient frames.

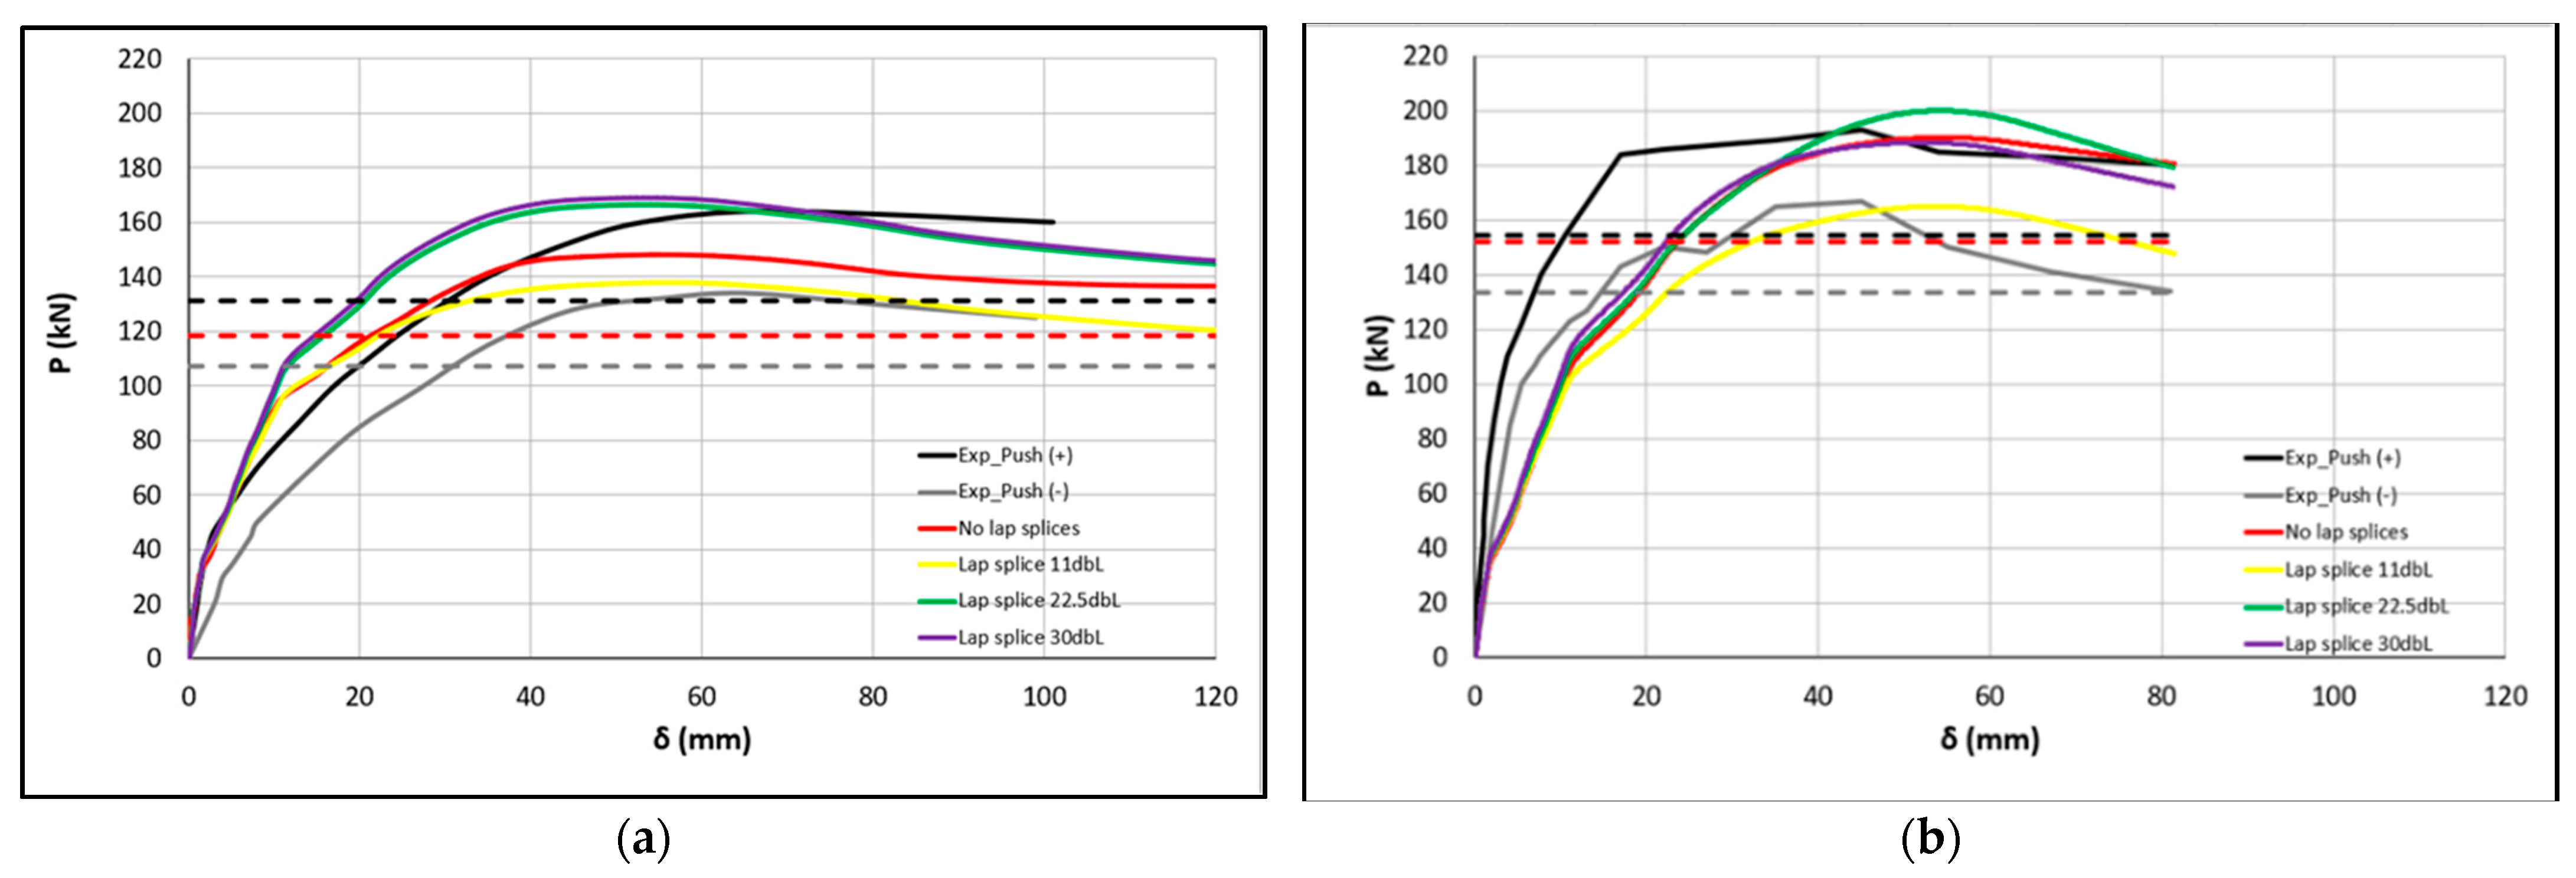
4.1. RC Frames with Lap-Spliced Longitudinal Bars

This scenario concerns the insufficient lap-splice case of 15 dbL. However, this lap length is further reduced to 11 dbL, as the concrete strength of the frames is higher (C30 quality) and corresponds to higher bond strength of the bars inside concrete than in the columns used by [1] (C20 quality). Figure 11a presents the analytical base shear force–displacement curve of frame A1F with 11 dbL, 22.5 dbL or 30 dbL lap length, while Figure 11b presents the corresponding curves for frame B2.
Analysis of A1F with 22.5 dbL or 30 dbL lap lengths provides P-δ response better than for the frame without lap splices in terms of maximum base shear (similar to the upper-bound experimental one). The ultimate base shear is similar to the frame without lap splices. Analysis of A1F with 11 dbL lap length reveals a maximum base shear of 139.67 kN, which is only 5.63% lower than the analytical value at maximum for the frame without lap splices (148 kN). The corresponding ultimate base shear is 131 kN (only 11.4% lower than 148 kN, correspondingly). The ultimate base shear in A1F with lap splices is higher than all limit values at the 20% drop (experimental or analytical), being sufficient globally, despite insufficient bottom lap splices. It seems that the base shear degradation at ultimate because of insufficient lap splices is higher in half-column specimens of rectangular cross-section with only four longitudinal bars and deficient stirrup detailing (e.g., too sparse). Indeed, the shear force is only 141.49 kN in R-P2L1, while the corresponding maximum base shear in half-column without lap splices is 217.13 kN (in R-P2L0), denoting a drop of 34.8% (three times higher in half-column specimens than in the RC frame). Besides the difference in steel detailing, the main reason for this divergence in performance may be the engagement of the sections on the top of the columns of the frame to a higher extent to compensate for the insufficiency of the bottom sections and potential redistribution effects. In half-column specimens, only the lap-spliced critical region is available and fully engaged up to column collapse (no redistribution potential).
Analysis of B2 with 22.5 dbL or 30 dbL lap lengths provides P-δ response similar to the frame without lap splices in terms of maximum base shear and ultimate base shear. Analysis of B2 with 11 dbL lap length reveals a maximum base shear of 165.04 kN, which is 14.4% lower than the analytical value at maximum for frame B2 without lap splices. The ultimate base shear in B2 with lap splices is 147.76 kN (22.3% lower, correspondingly). This value is around the analytical limit value at the 20% drop for frame B2 without lap splices (152.2 kN), being only marginally insufficient globally, despite heavily insufficient lap splices. The 3D FE analyses suggest there is a higher effect on the lap-spliced bars’ performance, as the infill interacts both horizontally and vertically with the RC frame through the seismic joint. Further, if the B2 frame is considered in the retrofitting scenario for the A1F bare frame with lap splices, then the analytical behavior of lap-spliced A1F retrofitted with orthoblock infills and PUFJ (lap-spliced B2) is far better than the analytical behavior of A1F without lap splices. Indeed, the maximum base shear of B2 with lap splices is 165.04 kN (higher than 148 kN in A1F without lap splices). Moreover, the ultimate base shear is 147.76 kN, compared with 139.14 kN in A1F without lap splices. In this case, orthoblock-PUFJ emergency retrofit [26,27,28] could enable the lap-spliced frame to sustain P-δ demands higher than the A1F frame without lap splices.
Figure 12a presents the undeformed lap length region of 11 dbL while Figure 12b,c reveal the slippage of the bars of frames A1F and B2 at ultimate. In both cases, the analyses suggest that the lap-spliced bars reach the yielding force under tension (96.5 kN) despite the slip.
In Figure 13a,b, frames A1F and B2 with 11 dbL lap splices present similar damage accumulation at the final step (at ultimate) of the analytical procedure. Damage occurs mostly at the bottom and the top of the columns (critical regions) and inside the joints. Specimen B2 with 11 dbL lap splices presents damage of higher severity than in A1F, observed at the upper left beam-column joint region and at the bottom of the right column. However, the maximum shear force does not drop below 80% of the maximum experimental and analytical values.

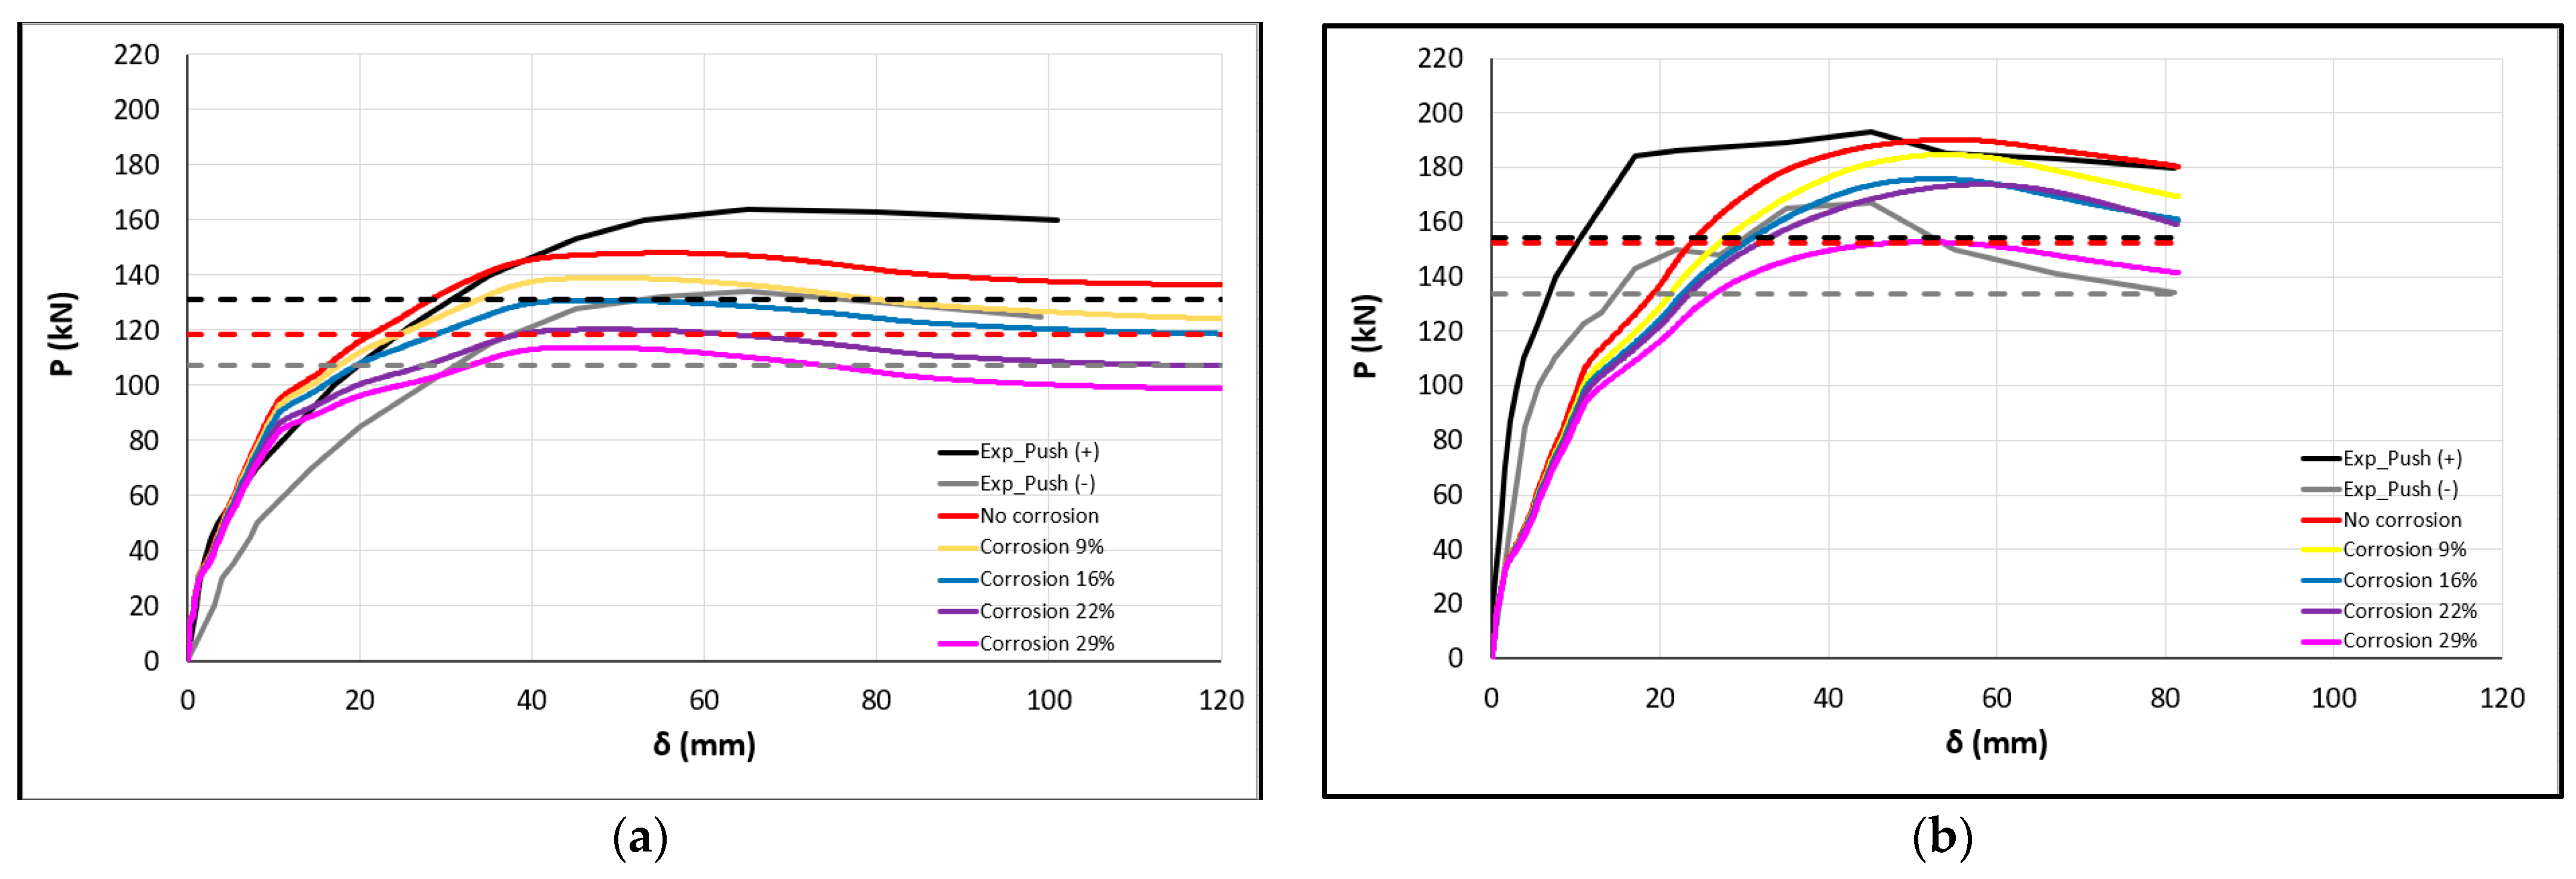
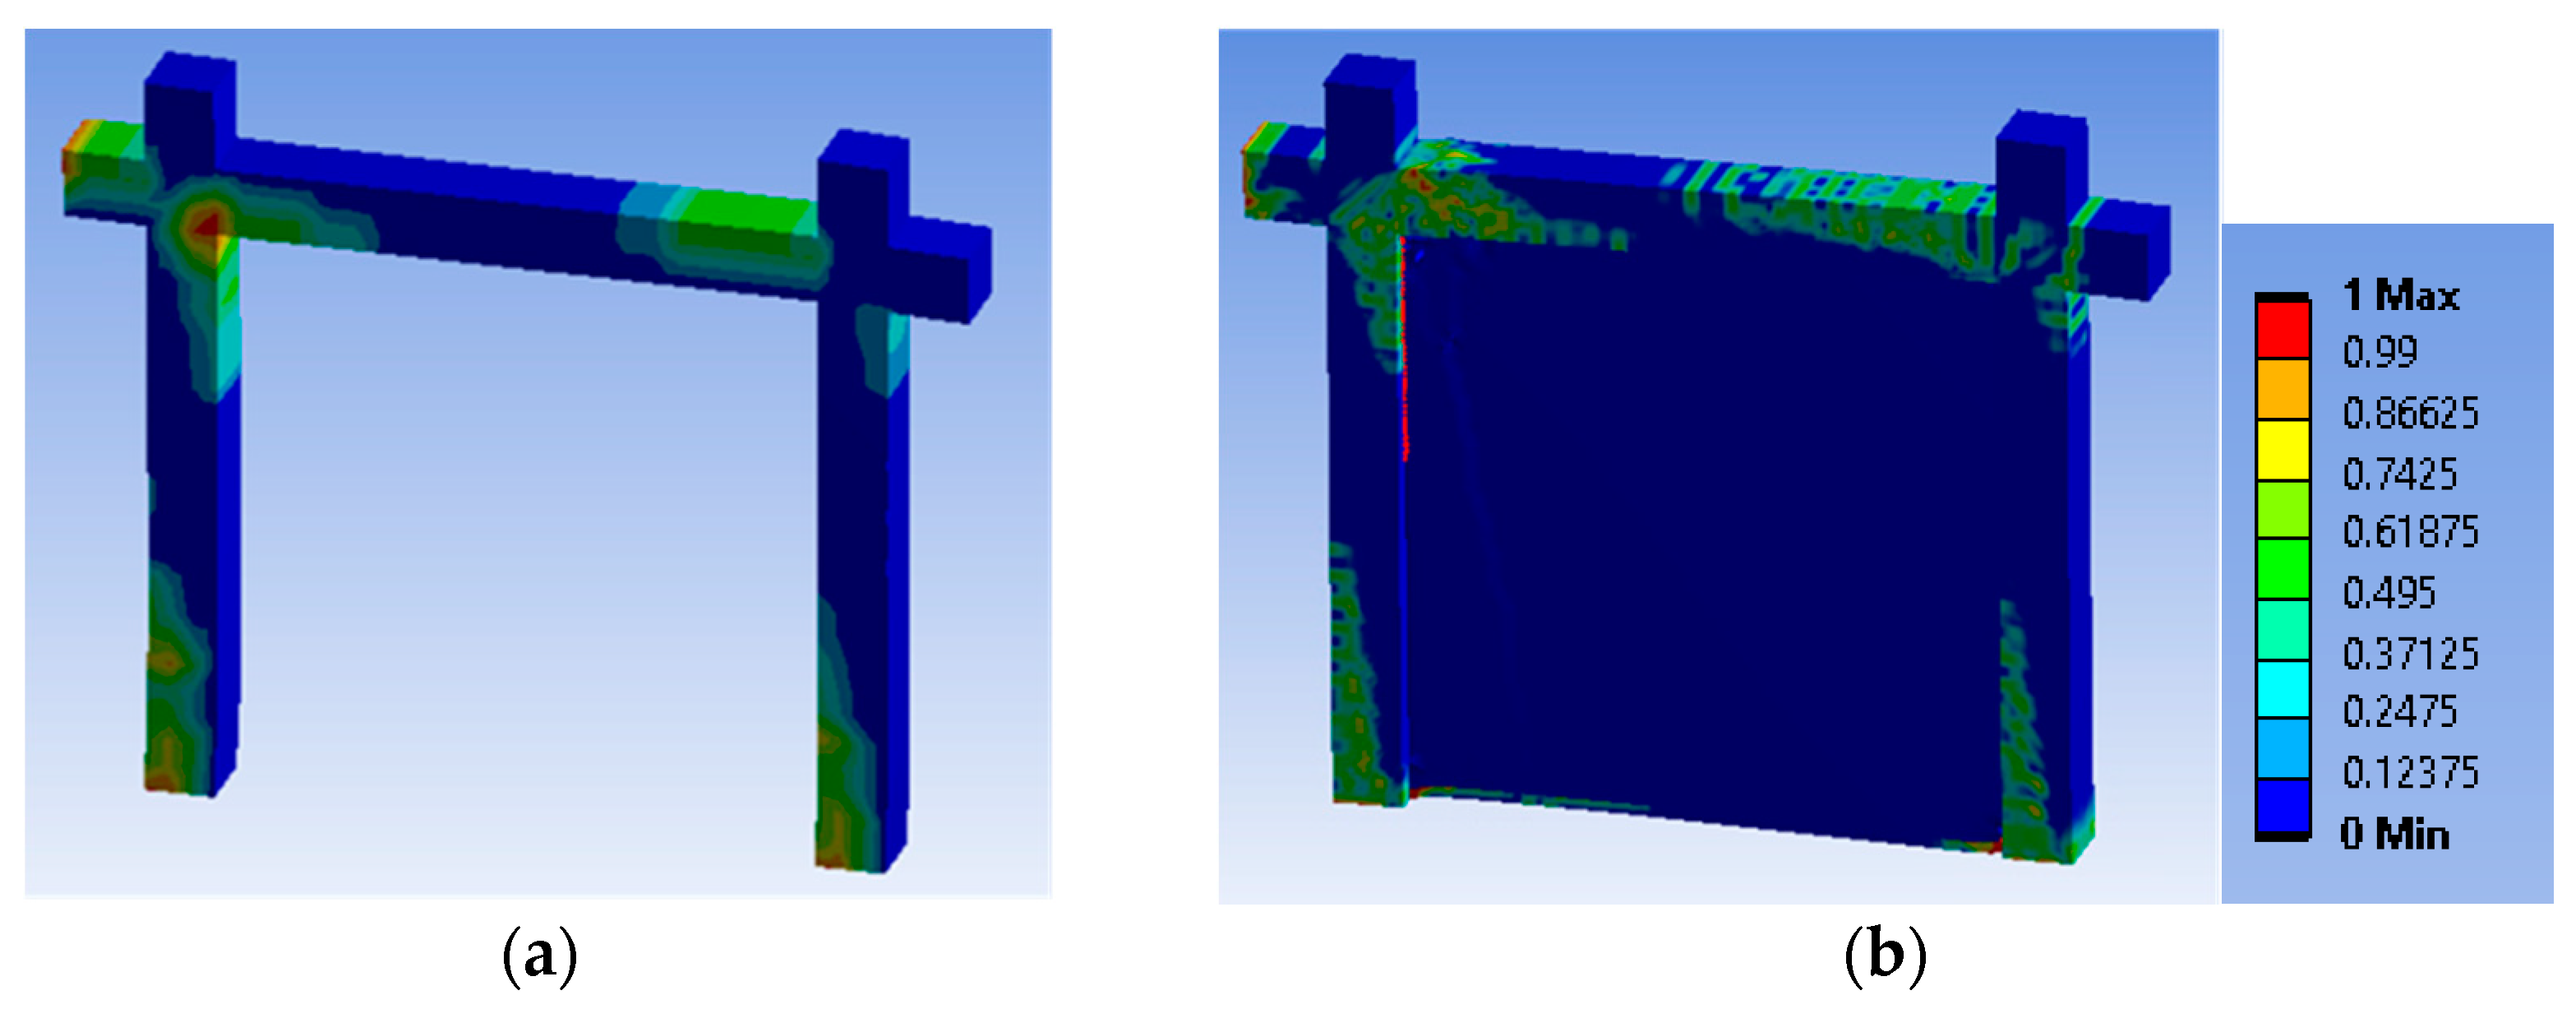
4.2. Corrosion of Steel Reinforcement

The critical scenario concerns 16% mass loss due to corrosion for all the steel bars and stirrups—including the two columns and the beam—at the limit value based on isolated RC columns. Figure 14a presents the analytical base shear force–displacement curve of frame A1F with 9%, 16%, 22% and 29% degree of corrosion, while Figure 14b presents the corresponding analyses for frame B2.
The dashed lines mark the 20% drop in the maximum values of the analytical and experimental base shears (for both directions, push + and −), considered as the lowest acceptable threshold of base shear at failure according to several seismic codes. In particular, for frame A1F without corrosion, these experimental limit values for push (+) and (−) are 0.8 × 164 = 131.2 kN and 0.8 × 134 = 107.2 kN, respectively. The analytical prediction is 0.8 × 148 = 118.4 kN, being around the average of experimental ones.
Analysis of A1F with 16% corrosion reveals a maximum base shear of 130.8 kN, which is higher than the analytical value at failure for the uncorroded frame (118.4 kN). Further, the ultimate base shear is 118.7 kN, similar to the experimental limits and analytical failure limits (118.4 kN). For the bare frame A1F with 16% steel corrosion, the base shear force degradation at ultimate is around 20% (from 148.0 kN to 118.7 kN), leading to an acceptable loss of its bearing capacity. This load drop is somewhat higher than in isolated columns (15.6%) as all steel reinforcements of the frame are considered corroded.
Analysis for A1F with 29% corrosion reveals a maximum base shear of 113.4 kN which is around the analytical 80% value at failure for uncorroded frame. Further, the ultimate base shear is 103.26 kN, lower than the experimental limits and far lower than the analytical failure limit of 118.4 kN. For the bare 29% corroded frame A1F, the base shear force degradation at ultimate is 30.2% (from 148 kN to 103.26 kN), leading to an important loss of its bearing capacity. For higher corrosion levels there is no intersection of the analytical P-δ curves even with the 20% load drop from the inferior push (−) experimental envelope curve.
For frame B2 without corrosion, the corresponding experimental limit values for push (+) and (−) are 0.8 × 192.8 = 154.2 kN and 0.8 × 167 = 133.6 kN respectively. The corresponding analytical prediction is 0.8 × 190.25 = 152.2 kN, being around the experimental push (+) value. Analysis for B2 with 16% corrosion reveals a maximum base shear of 175.9 kN which is higher than the analytical value at failure for the uncorroded frame.
The 16% corroded B2 has base shear force degradation at ultimate from 190.3 kN to 175.9 kN (around 7.5% loss), indicating the corroded frame is sufficient and has similar stiffness and ductility to the non-corroded one. Interestingly, if the B2 frame is considered the retrofitting scenario for the A1F corroded bare frame, then the analytical behavior of corroded A1F retrofitted with orthoblock infills and PUFJ (corroded B2) is far better than the analytical behavior of uncorroded A1F for comparable displacement ductility levels. Indeed, the maximum base shear of corroded B2 is 175.9 kN (higher than 148 kN in A1F uncorroded).
This remark is also valid for the scenario of 29% corroded A1F. If the B2 frame is considered the retrofitting scenario for the A1F corroded bare frame, then the analytical behavior of corroded A1F retrofitted with orthoblock infills and PUFJ (corroded B2) is somewhat better than the analytical behavior of uncorroded A1F. Indeed, the maximum base shear of corroded B2 is 152.7 kN (higher than 148 kN in A1F uncorroded). Further, the ultimate base shear is also higher (141.5 kN is higher than 136.6 kN).
Given the unique characteristics of PUFJ for emergency retrofits, providing a short curing period of some hours [26,27,28], this innovative retrofit could enable the corroded frame to sustain P-δ demands equivalent to the uncorroded one for a limited degree of corrosion. Further, it should be noted that steel corrosion should always be taken care of, in order to enhance the service life of concrete structures. A common approach for inhibiting corrosion involves the formation of a coating that prevents access of the corrosive substance to the metal, after suitable removal of cracked concrete and of rust from the steel reinforcements and before concrete repair (see i.e., [13,14] among others). Finally, it should be noted that a high corrosion degree reduces considerably the strain at failure of steel reinforcement.
Figure 15 and Figure 16 present the concrete damage of the specimens A1F and B2 for 29% corrosion and no corrosion. Frame A1F with 29% corrosion and uncorroded presents similar damage accumulation. Damage occurs mostly at the bottom and the top of the columns (critical regions) and inside the joints. Specimen B2 with 29% corrosion presents damage in columns at similar regions but of lower severity than in specimen A1F. This is the case because the damage in B2 corroded is smoothly distributed inside the orthoblock infill because of the seismic joint PUFJ.

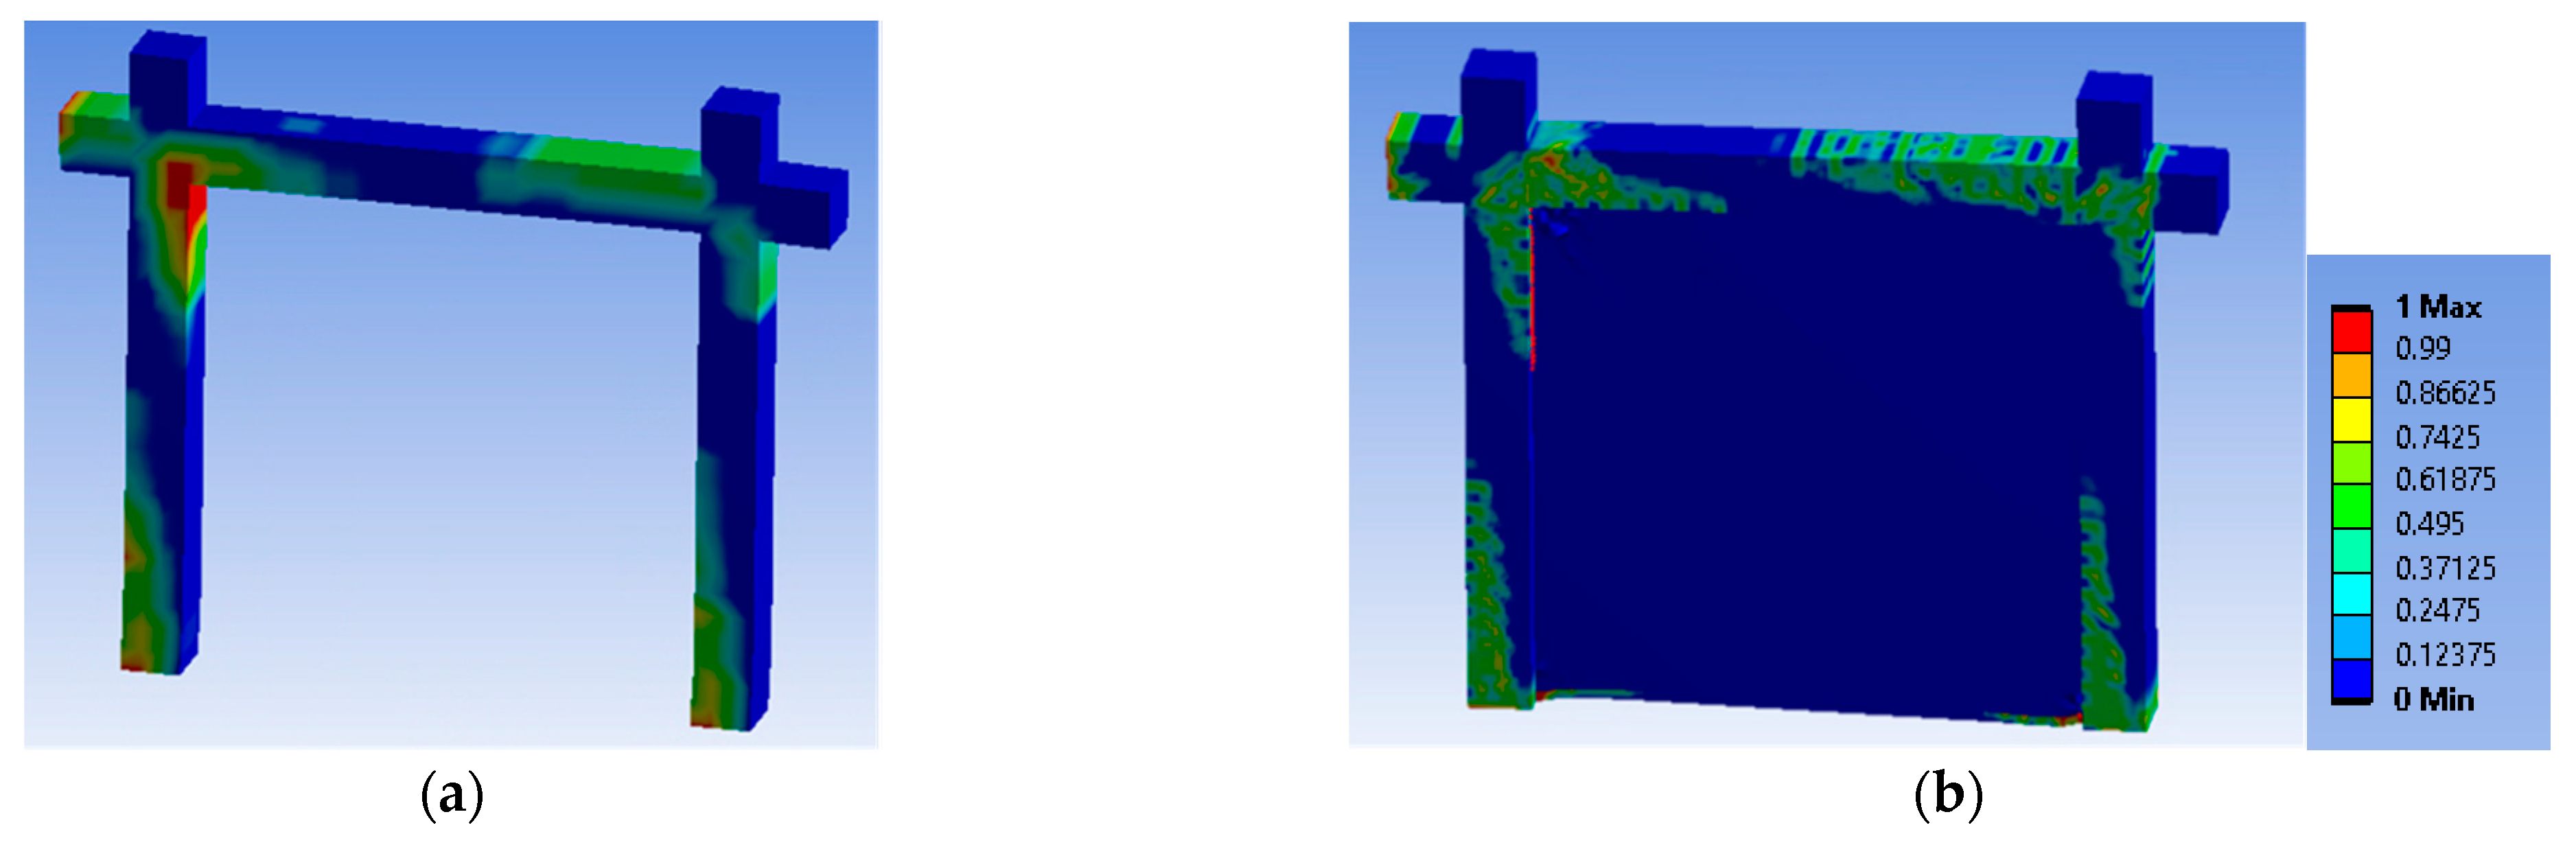
4.3. Performance of the Seismic Joint

The analyses reveal there is ever-increasing stress in the seismic joint boundary region up to around 52–58 mm top horizontal displacement of the B2 frames with or without lap splices or corrosion. At that level of displacement, higher stresses are developed for the B2 frame with or without 29% corrosion (the stresses are 8% lower in B2 frame with lap splices of 11 dbL). At 81.4 mm top horizontal displacement, the stresses are 23% lower in B2 frames with or without corrosion and 13% lower in B2 frames with inadequate lap splices. Figure 17 presents the variation of stresses within the seismic joint (red color for the highest stresses) at different top horizontal displacements of the frame B2 with inadequate lap splices. For 0.5 mm frame top displacement, the upper left boundary with the top beam and the middle height boundary with the right column are highly activated (however, at only 1% of the maximum stress). For 23 mm frame top displacement, the joint starts to accumulate damage at the top of the left column (at around 67% of maximum stress). For 42 mm displacement, the damage is extended over a greater region at the top of the left column, while high stresses are developed at the nearby boundary with the top beam (at around 67% of the maximum). For 53.7 mm displacement (at maximum stress value), the damage is extended over the left corner with the top beam. For 81.4 mm displacement, the variation in the stresses over the boundary interface seems unchanged but for 13% lower peak stresses. These values seem to be in agreement with the base shear load drops in the frame. The performance of the remaining B2 frames with or without corrosion is similar.
The infill (and correspondingly, the frame) seems to be fully protected up to 1% top drift of the frame based on the 20 mm design of the thickness of the seismic joint. Then, as the top drift of the frame increases from 1% and up to 2.5%, the infill seems to be rather efficiently protected despite damage accumulation in the seismic joint (the damage is extending progressively from the left-corner region over the column and then over the beam). The ever-increasing base shear of the frame further supports this assessment. After this drift, damage accumulation within the infill increases, and while the damaged region of the seismic joint remains unchanged, the developed peak stress is reduced. The highly deformable seismic joint maintains contact with the infill all over its non-damaged region.

5. Proposed Modifications of Existing Design Relations

EC8.3 and KANEPE (Greek Retrofit Code) [46,47] provide the equation for calculating the chord rotation at failure (Equation (5)), in which (ω’) is the mechanical ratio of compression reinforcement, (ω) is the mechanical ratio of tension reinforcement, (αs) is the shear ratio, (α) is the confinement effectiveness factor, (ρs) is the geometric ratio of transverse reinforcement parallel to the direction of loading, (fyw) is the yield strength of transverse reinforcement and (ρd) is the geometric ratio of any crosswise diagonal reinforcement. It is applied for columns with deformed longitudinal bars and designed and constructed based on modern seismic codes (after 1985). For columns designed and constructed before 1985 using deformed longitudinal bars, (Equation (5)) needs to be multiplied by 1/1.2.
θ u = 0.016 · ( 0.3 v ) · [ max ( 0.01 ; ω ) max ( 0.01 ; ω ) · f c ] 0.225 · ( a s ) 0.35 · 25 ( α · ρ s · f yw f c ) · ( 1.25 100 · ρ d )
In addition, the columns in this research fail after the yielding of the longitudinal bars (VR > VMu), according to EC8.3 and KANEPE. Therefore, the value of the shear force during flexural yielding could be calculated as the ratio of yield moment to shear span (VMu = My/Ls). The following Equation (6) (KANEPE) is used to calculate the yield moment (My), in which (b) is the height of compression zone, (d) is the effective depth of member section, (Ec) is the modulus of elasticity of concrete, (ξy) is the height of compression zone at yield, (d’) is the distance from the center of the compression reinforcement up to the extreme compression fiber, (δ’) is equal to d’/d, (ρ) is the ratio of the tension reinforcement, (ρ’) is the ratio of the compression reinforcement, (ρv) is the ratio of the intermediate reinforcement and (Es) is the modulus of elasticity of steel.
M y = b · d 3 · ( 1 / r ) y · { E c · ξ y 2 2 ( 0.5 · ( 1 + δ ) ξ y 3 ) + [ ( 1 ξ y ) · ρ + ( ξ y δ ) · ρ + ρ ν 6 · ( 1 δ ) ] · ( 1 δ ) · E S 2 }

5.1. Lap-Spliced Longitudinal Bars

For an inadequate lap-splice length, the maximum developed stress (lower than the yield stress) needs to be determined. Based on the results of the 3D finite element analyses performed on the columns tested by [1], the following relation c (Equation (7)) is provided for RC columns externally confined with FRPs and insufficient lap-splice length (lb < lb,min):
c = ( 4 · α + 6.2 ) · l b l b , min + ( 4.5 · α 5.95 )
where lb is the lap length, lb,min is the minimum necessary lap-splice length for the development of ultimate bending moment equal to 0.3·dbL·fy/√fc and α is the term 25 ( α · ρ w · f yw f c + α j · ρ j · f fe f c ) of Equation (5) to take into account confinement effects.
Relation c takes values between 0.5 and 1 (0.5 ≤ c ≤ 1) and results in a reduced stress on the lap-spliced steel bar. In addition, for c = 1, fs is multiplied by 1.25 (fs = fy·c·1.25) in order to take into account the stress at hardening of the internal steel bars (see also [45]).
The experimental and the analytical values of θu and VR for the examined column specimens with lap splices as well as the divergence of their values are gathered in Table 3. The design approach provides fairly accurate predictions and can be used in RC frames as well.
As already discussed above, the design criteria for the frames with prior damages or deficiencies are related to the lower bound level of bearing base shear at ultimate of the frame without damages. This approach enables the design of such frames by utilizing the advanced pseudodynamic analyses framework, developed in this paper. It indicates that the case with lap splice of 11 dbL is the lower-limit acceptable one.
Further, the design equations for columns can be utilized to roughly estimate the critical design values of RC frames with lap splices. Based on the developed moments at the top and at the bottom of the columns, the corresponding base shear strength is calculated. For the B2 frame, the additional shear force (V) of the infill wall is calculated according to Greek Retrofit Code (KANEPE §7.4) [47]. The infill wall is roughly considered as an equivalent diagonal strut. The parameters involved are:
  • the thickness t of the diagonal strut;
  • the width b of the diagonal strut ( b 0.15   L ); and
  • the mean compressive strength of the infill wall along the direction of the diagonal f wc , s ¯ .
    N = ( t b ) f wc , s ¯
    V = N cos a
In this equation:
cos a = l L
where l is the horizontal length of the wall and L is the length of the diagonal strut. For this infill wall, V is calculated to be equal to 78.2 kN.
Finally, based on simple mechanics from Greek Retrofit Code, the horizontal deformation of the infill wall (s) is
( s / h ) G = V / t l
where h is the height of the infill wall, l is the horizontal length of the wall, t is the thickness of the wall, V is the shear strength and G is the shear modulus:
G l E b sin a cos 2 a
where E is the elastic modulus of the infill wall. For frame B2, deformation s is calculated to be equal to 29.3 mm. The joint thickness of 20 mm is added to the above value. This corresponds to 49.3 mm/220 mm = 2.25% drift, which is very close to the values discussed in Section 4.3 for the full exploitation of the infill contribution and the development of significant cracking. A 15% drop in the infill wall contribution is assumed based on the damage accumulation for drift higher than 2.25% and up to 3.7%.
In this example, relations (5–12) provide top displacement δPu for the frame B2 with 11 dbL lap length equal to 71.3 mm, which is close to the one provided by ANSYS analyses 80 mm (AD of 10.1%). The corresponding base shear strength is 193.9 kN, which is close to the analytical value of 165 kN by FE analysis (AD of 17.5%).

5.2. Corrosion of Steel Reinforcement

The 3D FE analyses of the specimens tested by [3] in Section 3 verified that a reduced diameter for the corroded steel bars is a reasonable approach.
Table 4 shows the analytical values for chord rotation at failure (θu) and base shear strength (VR) according to the equations of EC8.3, taking into account the reduced cross-section of the corroded bars. The corresponding AD (%) against the experimental results is also tabulated. The design approach provides fairly accurate predictions, especially for corrosion degrees of 16% and 22%, which are characteristic limit cases. This approach can be used in RC frames as well.
Again, the design criteria for the frames with corroded steel reinforcements are related to the lower bound level of bearing base shear at ultimate of the frame without damages. Then, the approach utilizes the advanced pseudodynamic analyses framework. It indicates that the corrosion case with mass loss of 16% is the lower limit acceptable one.
Based on the developments presented in 5.1, relations (5–6 and 8–10) provide top displacement δu for the frame A1F with 16% mass loss equal to 116.8 mm, which is close enough to the one provided by ANSYS analyses 120 mm (AD of only 3.3%). The corresponding base shear strength is 120.7 kN, which is close to the analytical result of 130.8 kN by FE analysis (AD of 7.8%).

6. Discussion

The advanced analyses suggest that in RC columns confined with FRP jackets, the maximum axial tensile force developed on the bars with inadequate lap splices of 15 dbL length is only 57% of the tensile force at yielding of the bars in columns without laps. Therefore, the bars do not yield, and relative slip is recorded during analysis despite CFRP jacketing. The column shows a significantly reduced ultimate base shear (reduction of 34.8%) when compared with the maximum base shear of the column without lap splices (R-P2L0) as well as reduced deformation capacity. For 30 dbL lap length, the P-δ response of the FRP jacketed columns is very close to the one without laps, and bars’ yielding is recorded.
The advanced analyses of RC columns with 16% steel corrosion degree reveal a reduction of 10% in lateral force and 28% reduction in ultimate displacement. Cases of corroded columns with FRP jacketing are also validated. The shear strength and ductility of RC columns decrease with the degree of corrosion. Finally, for a high degree of corrosion, earlier fracture of steel longitudinal bars is expected.
The pseudodynamic analyses of RC frames include cases with or without innovative brick wall infill, having a PUFJ seismic joint at the boundary interface with the RC frame. The results reveal the potential to extend the contribution of the infills at higher displacement ductility levels of the frames with limited infill damages. The innovative intervention increased the elastic stiffness of the bare frame as well as the maximum base shear of the frame up to 3.5% horizontal drift.
The analyses show that for different reinforcement detailing of RC columns, the effects of inadequate lap-spliced bars may be more detrimental in isolated RC columns than in RC frames (34.8% reduced ultimate base shear compared with only 11.4% in bare frame and 22.3% in infilled one). It seems that in frames, additional critical regions without lap-spliced bars are engaged, and redistribution of damage is observed.
The effects of corroded steel bars (16% mass loss) may be marginally higher in bare RC frames than in isolated RC columns, as all reinforcements in the frame are considered corroded (15.6% reduced ultimate base shear in isolated columns compared with only 20% in bare frame). However, in infilled frames, the interaction through the seismic joint leads to only 7.5% ultimate base shear reduction.
Further, all critical cases of RC frames with damages, such as inadequate lap-splices or corroded reinforcements in risk of collapse, may receive the innovative composite retrofit and achieve higher base shear load than the original bare RC frame without corroded or lap-spliced bars, at comparable top displacement ductility. The infill (and correspondingly the frame) seems to be fully protected up to 1% top drift of the frame, based on the 2 cm design of the thickness of the seismic joint. Then, as the top drift of the frame increases from 1% and up to 2.5%, the infill seems to be rather efficiently protected despite damage accumulation in the seismic joint. After this drift, damage accumulation within the infill increases, and while the damaged region of the seismic joint remains unchanged, the developed stress is reduced. The highly deformable seismic joint (PUFJ) maintains the contact with the infill all over its non-damaged region.

7. Conclusions

This study provides a 3D FE model that helps address gaps in analyses and the design of demanding seismic-resistant applications. It develops and validates suitable 3D FE models of composite retrofits in deficient RC columns and frames. It investigates critical cases of RC columns with inadequate lap-splices of bars or corroded steel reinforcements and the beneficial effects of external FRP jacketing to avoid their premature failure.
The analytical results are mainly assessed based on the lowest acceptable threshold at the 20% drop for the base shear at failure when compared with the maximum base shear of the column or frame (according to several seismic codes) without damages or deficiencies. Such design criteria allow for the full utilization of the potential of pseudodynamic analyses for columns and frames. Limit cases of columns and frames with damaged members are identified and examined in detail.
The advanced FE analyses allow for the thorough investigation of the RC frame–PUFJ–infill interaction. It seems that the orthoblock infill wall with the 2 cm thick PUFJ at the frame–infill interface provides the desirable infill–frame interaction that allows for redistribution phenomena, prolonging the beneficial contribution of the infill. Therefore, it can be considered an efficient retrofit in terms of frame P-δ response leading to limited infill damages. The use of this retrofit technique may prevent in-plane and out-of-plane infill collapses as well as the associated detrimental effects for the whole structure. The application of PUFJ is straightforward (injected or prefabricated), without any special prior treatment of the substrates and cures within hours [31].
Based on the results of the reliable 3D FE analyses of RC columns with lap splices or corroded steel reinforcement, suitable modifications of the existing design models have been proposed in order to predict characteristic values of their seismic P-δ response in terms of shear strength and ultimate chord rotation. The analytical predictions of the modified models are compared against the corresponding experimental ones and provide fairly accurate predictions. The proposed design relations are extended to RC frames with or without infill walls. The 3D FE approaches presented herein may help minimize valuable testing time, conserve resources and, most importantly, contribute to saving human lives by improving our understanding and avoiding premature structural collapse.

Author Contributions

Conceptualization, T.R.; investigation, T.R., T.F. and E.A.; writing—review and editing, T.R., T.F. and E.A.; supervision, T.R.; project administration, T.R.; funding acquisition, T.R., T.F. and E.A. All authors have read and agreed to the published version of the manuscript.

Funding

This research was co-financed by Greece and the European Union (European Social Fund-ESF) through the Operational Programme «Human Resources Development, Education and Lifelong Learning 2014–2020» in the context of the project “Advanced Material Retrofits of Infilled Framed Reinforced Concrete Structures with Predamages Against Collapse” (MIS 5050146).

Conflicts of Interest

The authors declare no conflict of interest.

References

  1. Bousias, S.N.; Fardis, M.N.; Spathis, A.L.; Biskinis, D. Concrete or FRP jacketing of concrete columns for seismic retrofitting. In NATO Science Series: IV: Earth and Environmental Sciences; Wasti, S.T., Ozcebe, G., Eds.; Springer: Dordrecht, The Netherlands, 2006; Volume 66, pp. 33–46. [Google Scholar]
  2. Kalogeropoulos, G.I.; Tsonos, A.-D.G. Cyclic performance of RC Columns with inadequate lap splices strengthened with CFRP jackets. Fibers 2020, 8, 39. [Google Scholar] [CrossRef]
  3. Goksu, C.; Ilki, A. Seismic Behavior of Reinforced Concrete Columns with Corroded Deformed Reinforcing Bars. ACI Struct. J. 2016, 113, 1053–1064. [Google Scholar] [CrossRef]
  4. Rousakis, T.C.; Panagiotakis, G.D.; Archontaki, E.E.; Kostopoulos, A.K. Prismatic RC columns externally confined with FRP sheets and pre-tensioned basalt fiber ropes under cyclic axial load. Compos. Part B Eng. 2019, 163, 96–106. [Google Scholar] [CrossRef]
  5. Karantzikis, M.; Papanicolaou, C.G.; Antonopoulos, C.P.; Triantafillou, T.C. Experimental investigation of nonconventional confinement for concrete using FRP. J. Compos. Constr. 2005, 9, 480–487. [Google Scholar] [CrossRef]
  6. Triantafillou, T.C.; Papanicolaou, C.G.; Zissimopoulos, P.; Laourdekis, T. Concrete confinement with textile-reinforced mortar jackets. ACI Struct. J. 2006, 103, 28–37. [Google Scholar] [CrossRef]
  7. Ilki, A.; Peker, O.; Karamuk, E.; Demir, C.; Kumbasar, N. FRP retrofit of low and medium strength circular and rectangular reinforced concrete columns. J. Mater. Civ. Eng. 2008, 20, 169–188. [Google Scholar] [CrossRef]
  8. Yu, T.T.; Teng, J.G.; Wong, Y.L.; Dong, S.L. Finite element modeling of confined concrete-I: Drucker–Prager type plasticity model. Eng. Struct. 2010, 32, 665–679. [Google Scholar] [CrossRef]
  9. Ilki, A.; Kumbasar, N. Compressive behaviour of carbon fibre composite jacketed concrete with circular and non-circular cross-sections. J. Earthq. Eng. 2003, 7, 381–406. [Google Scholar] [CrossRef]
  10. Nistico, N.R.C. Square Sections Confined by FRP: A numerical procedure for predicting stress strain relationship. Compos. Part B 2014, 59, 238–247. [Google Scholar] [CrossRef]
  11. Wang, Z.Y.; Wang, D.Y.; Smith, S.T.; Lu, D.G. CFRP-confined square RC columns. I: Experimental investigation. J. Compos. Constr. 2012, 16, 150–160. [Google Scholar] [CrossRef]
  12. Wu, Y.F.; Wei, Y.Y. Effect of cross-sectional aspect ratio on the strength of CFRP-confined rectangular concrete columns. Eng. Struct. 2010, 32, 32–45. [Google Scholar] [CrossRef]
  13. Triantafyllou, G.G.; Rousakis, T.C.; Karabinis, A.I. Corroded RC beams patch repaired and strengthened in flexure with fiber-reinforced polymer laminates. Compos. Part B Eng. 2017, 112, 125–136. [Google Scholar] [CrossRef]
  14. Triantafyllou, G.G.; Rousakis, T.C.; Karabinis, A.I. Analytical assessment of the bearing capacity of RC beams with corroded steel bars beyond concrete cover cracking. Compos. Part B Eng. 2017, 119, 132–140. [Google Scholar] [CrossRef]
  15. Triantafyllou, G.; Rousakis, T.; Karabinis, A. Corroded RC beams at service load before and after patch repair and strengthening with NSM CFRP strips. Buildings 2019, 9, 67. [Google Scholar] [CrossRef] [Green Version]
  16. Jiang, C.; Wu, Y.F.; Wu, G. Plastic hinge length of FRP-confined square RC columns. J. Compos. Constr. 2014, 18, 04014003. [Google Scholar] [CrossRef]
  17. Rousakis, T.C. Inherent seismic resilience of RC columns externally confined with nonbonded composite ropes. Compos. Part B Eng. 2018, 135, 142–148. [Google Scholar] [CrossRef]
  18. Belardi, V.G.; Fanelli, P.; Vivio, F. Structural analysis and optimization of anisogrid composite lattice cylindrical shells. Compos. Part B Eng. 2018, 139, 203–215. [Google Scholar] [CrossRef]
  19. Ye, G.; Bi, H.; Hu, Y. Compression behaviors of 3D printed pyramidal lattice truss composite structures. Compos. Struct. 2020, 233, 111706. [Google Scholar] [CrossRef]
  20. Chalioris, C.E.; Kytinou, V.K.; Voutetaki, M.E.; Karayannis, C.G. Flexural Damage Diagnosis in Reinforced Concrete Beams Using a Wireless Admittance Monitoring System—Tests and Finite Element Analysis. Sensors 2021, 21, 679. [Google Scholar] [CrossRef] [PubMed]
  21. Karayannis, C.G.; Golias, E. Full scale tests of RC joints with minor to moderate seismic damage repaired using C-FRP sheets. Earthq. Struct. 2018, 15, 617–627. [Google Scholar] [CrossRef]
  22. Katakalos, K.; Manos, G.; Papakonstantinou, C. Seismic retrofit of R/C T-beams with steel fiber polymers under cyclic loading conditions. Buildings 2019, 9, 101. [Google Scholar] [CrossRef] [Green Version]
  23. Triantafyllou, G.G.; Rousakis, T.C.; Karabinis, A.I. Effect of patch repair and strengthening with EBR and NSM CFRP laminates for RC beams with low, medium and heavy corrosion. Compos. Part B Eng. 2018, 133, 101–111. [Google Scholar] [CrossRef]
  24. Anagnostou, E.; Rousakis, T.C.; Karabinis, A.I. Seismic retrofitting of damaged RC columns with lap-spliced bars using FRP sheets. Compos. Part B Eng. 2019, 166, 598–612. [Google Scholar] [CrossRef]
  25. Kwiecień, A. Highly deformable polymers for repair and strengthening of cracked masonry structures. GSTF Int. J. Eng. Technol. (JET) 2013, 2, 182–196. [Google Scholar] [CrossRef]
  26. Akyildiz, A.; Kwiecień, A.; Zając, B.; Triller, P.; Bohinc, U.; Rousakis, T.; Viskovic, A. Preliminary in-plane shear test of infills protected by PUFJ interfaces. In Proceedings of the 17th International Brick and Block Masonry Conference from Historical to Sustainable Masonry (IB2MaC 2020), Krakow, Poland, 5–7 July 2020. [Google Scholar]
  27. Triller, P.; Kwiecien, A.; Bohinc, U.; Zajac, B.; Rousakis, T.; Viskovic, A. Preliminary in-plane shear test of damaged infill strengthened by FRPU. In Proceedings of the 10th International Conference on FRP Composites in Civil Engineering (CICE 2020/2021), Istanbul, Turkey, 8–10 December 2021. [Google Scholar]
  28. Rousakis, T.; Ilki, A.; Kwiecień, A.; Viskovic, A.; Triller, P.; Ghiassi, B.; Benedetti, A.; Gams, M.; Rakicevic, Z.; Halici, O.F.; et al. Quick Reparation of RC Infilled Frames after Seismic Damages—Experimental Tests on Shaking Table. In Proceedings of the 10th International Conference on FRP Composites in Civil Engineering (CICE 2020/2021), Istanbul, Turkey, 8–10 December 2021. [Google Scholar]
  29. Rousakis, T. Brick walls Interventions with FRPU or PUFJ and of RC columns with FR in Brick-Infilled RC Structures with the use of Pushover Beam-Column Element Analysis and Pseudo-Dynamic 3D Finite Element Analysis. In Proceedings of the 17th International Brick and Block Masonry Conference from Historical to Sustainable Masonry (IB2MaC 2020), Krakow, Poland, 5–7 July 2020. [Google Scholar]
  30. Rousakis, T.; Ilki, A.; Kwiecień, A.; Viskovic, A.; Gams, M.; Triller, P.; Ghiassi, B.; Benedetti, A.; Rakicevic, Z.; Colla, C.; et al. Deformable Polyurethane Joints and Fibre Grids for Resilient Seismic Performance of Reinforced Concrete Frames with Orthoblock Brick Infills. Polymers 2020, 12, 2869. [Google Scholar] [CrossRef] [PubMed]
  31. Rousakis, T.; Vanian, V.; Fanaradelli, T.; Anagnostou, E. 3D FEA of Infilled RC Framed Structures Protected by Seismic Joints and FRP Jackets. Appl. Sci. 2021, 11, 6403. [Google Scholar] [CrossRef]
  32. Zając, B.; Kwiecień, A. Thermal stress generated in masonries by stiff and flexible bonding materials. In Proceedings of the 9th International Masonry Conference (9th IMC), Guimarães, Portugal, 7–9 July 2014; Lourenço, P.B., Haseltine, B.A., Vasconcelos, G., Eds.; ISBN 978-972-8692-85-8. [Google Scholar]
  33. Koutas, L.; Triantafillou, T.C.; Bousias, S.N. Analytical modeling of masonry-infilled RC frames retrofitted with textile-reinforced mortar. J. Compos. Constr. 2014, 19, 04014082. [Google Scholar] [CrossRef]
  34. Rouka, D.; Kaloudaki, A.; Rousakis, T.; Fanaradelli, T.; Anagnostou, E.; Kwiecien, A.; Gams, M.; Viskovic, A.; Zajac, B. Response of RC buildings with Low-strength Infill Walls Retrofitted with FRP sheets with Highly Deformable Polymer—Effects of Infill Wall Strength. In Proceedings of the 25th International Conference on Composites/Nano Engineering (ICCE-25), Rome, Italy, 13–15 June 2012. [Google Scholar]
  35. Hany, N.F.; Hantouche, E.G.; Harajli, M.H. Finite element modeling of FRP-confined concrete using modified concrete damaged plasticity. Eng. Struct. 2016, 125, 1–14. [Google Scholar] [CrossRef]
  36. Youssf, O.; ElGawady, M.A.; Mills, J.E. Displacement and plastic hinge length of FRP confined circular reinforced concrete columns. Eng. Struct. 2015, 101, 465–476. [Google Scholar] [CrossRef]
  37. Yuan, F.; Wu, Y.F.; Li, C.Q. Modelling plastic hinge of FRP-confined RC columns. Eng. Struct. 2017, 131, 651–668. [Google Scholar] [CrossRef]
  38. Fanaradelli, T.D.; Rousakis, T.C. 3D Finite Element Pseudodynamic Analysis of Deficient RC Rectangular Columns Confined with Fiber Reinforced Polymers under Axial Compression. Polymers 2020, 12, 2546. [Google Scholar] [CrossRef] [PubMed]
  39. Anagnostou, E.; Rousakis, T.; Georgiadis, N. Finite element analysis of deficient RC columns with square and rectangular section under pseudoseismic load and comparison with retrofit code predictions. In Proceedings of the ICCE-26 Conference, Paris, France, 15–21 July 2018. [Google Scholar]
  40. Riedel, W. Beton unter Dynamischen Lasten: Meso- und makromechanische Modelle und ihre Parameter; Fraunhofer-Institut für Kurzzeitdynamik, Ernst-Mach-Institut EMI, Freiburg/Brsg., Eds.; Fraunhofer IRB Verlag: Stuttgart, Germany, 2004; ISBN 3-8167-6340-5. [Google Scholar]
  41. Riedel, W.; Thoma, K.; Hiermaier, S.; Schmolinske, E. Penetration of Reinforced Concrete by BETA-B-500, Numerical Analysis using a New Macroscopic Concrete Model for Hydrocodes. In Proceedings of the (CD-ROM) 9th Internationales Symposium, Interaction of the Effects of Munitions with Structures, Berlin Germany, 3–7 May 1999; pp. 315–322. [Google Scholar]
  42. Riedel, W.; Kawai, N.; Kondo, K. Numerical Assessment for Impact Strength Measurements in Concrete Materials. Int. J. Impact Eng. 2009, 36, 283–293. [Google Scholar] [CrossRef] [Green Version]
  43. ANSYS. Academic Research, Release 15.0; SAS IP, Inc.: Canonsburg, PA, USA, 2003. [Google Scholar]
  44. Bousias, S.N.; Triantafillou, T.C.; Fardis, M.N.; Spathis, L.; O’Regan, B.A. Fiber-reinforced polymer retrofitting of rectangular reinforced concrete columns with or without corrosion. Struct. J. 2004, 101, 512–520. [Google Scholar] [CrossRef]
  45. Meda, A.; Mostosi, S.; Rinaldi, Z.; Riva, P. Experimental evaluation of the corrosion influence on the cyclic behaviour of RC columns. Eng. Struct. 2014, 76, 112–123. [Google Scholar] [CrossRef]
  46. Code, P. Eurocode 8: Design of Structures for Earthquake Resistance—Part 3: Assessment and Retrofitting of Buildings; Incorporating corrigendum March 2010; European Committee for Standardization: Brussels, Belgium, 2005. [Google Scholar]
  47. Greek Retrofit Code (KANEPE), 2nd Revision. 2017. Available online: https://oasp.gr/node/92 (accessed on 25 May 2021).
Figure 1. Dimensions of the RC columns (a) of [1] and [44]; (b) of [3].
Fibers 09 00056 g001
Figure 2. Comparative experimental (the envelope P-δ curves of the original experimental response) and analytical base shear force–displacement curve for specimens (a) R-P2L0, (b) R-P2L1, (c) R-P2L3; (d) Comparison of the analytical P-δ curves.
Fibers 09 00056 g002
Figure 3. (a) Specimen R-P2L1 with 15 dbL lap length, undeformed; (b) Slippage of longitudinal steel bars of specimen R-P2L1 at ultimate displacement 58.46 mm; (c) Specimen R-P2L3 at ultimate displacement of 66.85 mm (magnification factor 5).
Fibers 09 00056 g003
Figure 4. Concrete damage of specimens (a) R-P2L0; (b) R-P2L1; (c) R-P2L3.
Fibers 09 00056 g004
Figure 5. Comparative experimental (the envelope P-δ curve of the original experimental response) and analytical base shear force–displacement curve for specimens (a) NS-X0, (b) NS-X16; (c) The comparison of their analytical P-δ curves.
Fibers 09 00056 g005aFibers 09 00056 g005b
Figure 6. Concrete damage of specimens (a) NS-X0; (b) NS-X16.
Fibers 09 00056 g006
Figure 7. Comparative experimental (the envelope P-δ curve of the original experimental response) and analytical base shear force–displacement curve for specimens (a) CS-0; (b) CS-C2; (c) The comparison of their analytical P-δ curves.
Fibers 09 00056 g007
Figure 8. Concrete damage of specimens (a) CS-0; (b) CS-C2.
Fibers 09 00056 g008
Figure 9. (a) Dimensions of the RC frame; (b) Specimen B2 with polymer joint applied on the 3 interfaces of the existing infill with the 2 concrete columns and the top beam.
Fibers 09 00056 g009
Figure 10. Analytical base shear force–displacement curve for (a) A1F and (b) B2, compared against the experimental ones.
Fibers 09 00056 g010
Figure 11. Analytical base shear force–displacement curve for (a) A1F (without infill) and (b) B2 (with infill), with different lap lengths, compared against the experimental ones.
Fibers 09 00056 g011
Figure 12. (a) Specimen A1F with 11 dbL lap length undeformed; (b) Slippage of longitudinal steel bars of specimen A1F at ultimate displacement 101.5 mm; (c) Specimen B2 at ultimate displacement 81.4 mm (magnification factor 5).
Fibers 09 00056 g012
Figure 13. Concrete damage of specimens with 11 dbL lap length of (a) A1F; (b) B2.
Fibers 09 00056 g013
Figure 14. Analytical base shear force–displacement curve for (a) A1F and (b) B2 with different corrosion levels, compared against the experimental ones.
Fibers 09 00056 g014
Figure 15. Concrete damage of (a) specimen A1F with 29% corrosion at total displacement 101.50 mm and specimen B2 with (b) 29% corrosion at total displacement 81.40 mm.
Fibers 09 00056 g015
Figure 16. Concrete damage of (a) specimen A1F with no corrosion/no lap splices and (b) specimen B2 with no corrosion/no lap splices.
Fibers 09 00056 g016
Figure 17. Stress concentration on the seismic joint for different levels of horizontal displacement for B2 frame with 11 dbL lap-splice length: (a) 0.5 mm, (b) 23 mm, (c) 42 mm, (d) 53.7 mm, (e) 81.4 mm.
Fibers 09 00056 g017
Table 1. Comparative results for specimens R-P2L0, R-P2L1 and R-P2L3 with different lap lengths.
R-P2L0R-P2L1R-P2L3Average AD (%)
ExpAnalExpAnalExpAnal
Pmax (+) (kN)240.00217.73175.00176.86215.00209.114.36
δPmax (+) (mm)48.5034.8419.5027.7748.5038.1330.65
Pmax (−) (kN)194.00217.73168.00176.86208.00209.116.01
δPmax (−) (mm)38.5034.8419.0027.7734.5038.1322.06
Pu (+) (kN)192.00174.18140.00141.49172.00167.294.36
δPu (+) (mm)70.4075.3754.4058.4675.2066.858.54
Pu (−) (kN)155.20174.18134.40141.49166.40167.296.01
δPu (−) (mm)64.0075.3750.0058.4665.0066.8512.51
Table 2. Comparative results for specimens NS-X0, NS-X16, CS-0 and CS-C2 with different corrosion levels.
NS-X0
(without Corrosion)
NS-X16
(16% Corrosion)
CS-0
(10% Corrosion)
CS-C2
(10% Corrosion and FRP Jacket)
Average AD (%)
ExpAnalExpAnalExpAnalExpAnal
Pmax (+) (kN)60.7054.5650.9049.56187.00169.35192.00180.087.10
δPmax (+) (mm)20.0020.8718.0042.1224.0030.3954.0027.6953.43
Pmax (−) (kN)52.0054.5650.0049.56187.00169.35183.00180.084.21
δPmax (−) (mm)15.0020.8730.0042.1224.0030.3945.0027.6936.16
Pu (+) (kN)51.6046.3843.2742.13149.60135.48153.60161.896.90
δPu (+) (mm)81.1073.7555.1052.8644.8045.7380.0086.215.74
Pu (−) (kN)44.2046.3842.5042.13149.60135.48146.40161.896.46
δPu (−) (mm)70.0073.7555.0052.8644.8045.7375.0086.216.57
Table 3. Comparison of analytical and experimental values of θu and VR.
Column SpecimenLap Length
(dbL)
Layers CFRPθu,expθu,anal
(Proposed)
AD
(%)
VR,exp
(kN)
VR,anal (kN)
(Proposed)
AD(%)
R-P2L0020.0440.04194.8217.0200.97.4
R-P2L11520.0340.03523.5171.5154.69.8
R-P2L33020.0470.04425.9211.5205.23.0
Average AD (%) 4.73 6.73
Table 4. Comparison of analytical and experimental values of θu and VR.
Column SpecimenCorrosion Degree (%)θu,expθu,anal
(Proposed)
AD
(%)
VR,exp
(kN)
VR,anal (kN)
(Proposed)
AD
(%)
NS-X000.06760.045532.660.755.38.8
NS-X990.08040.043845.559.153.110.2
NS-X16160.04590.04257.450.951.20.6
NS-X22220.04620.041410.351.949.74.3
NS-X54540.02730.035529.944.341.27.0
Average AD (%) 25.14 6.18
Publisher’s Note: MDPI stays neutral with regard to jurisdictional claims in published maps and institutional affiliations.

