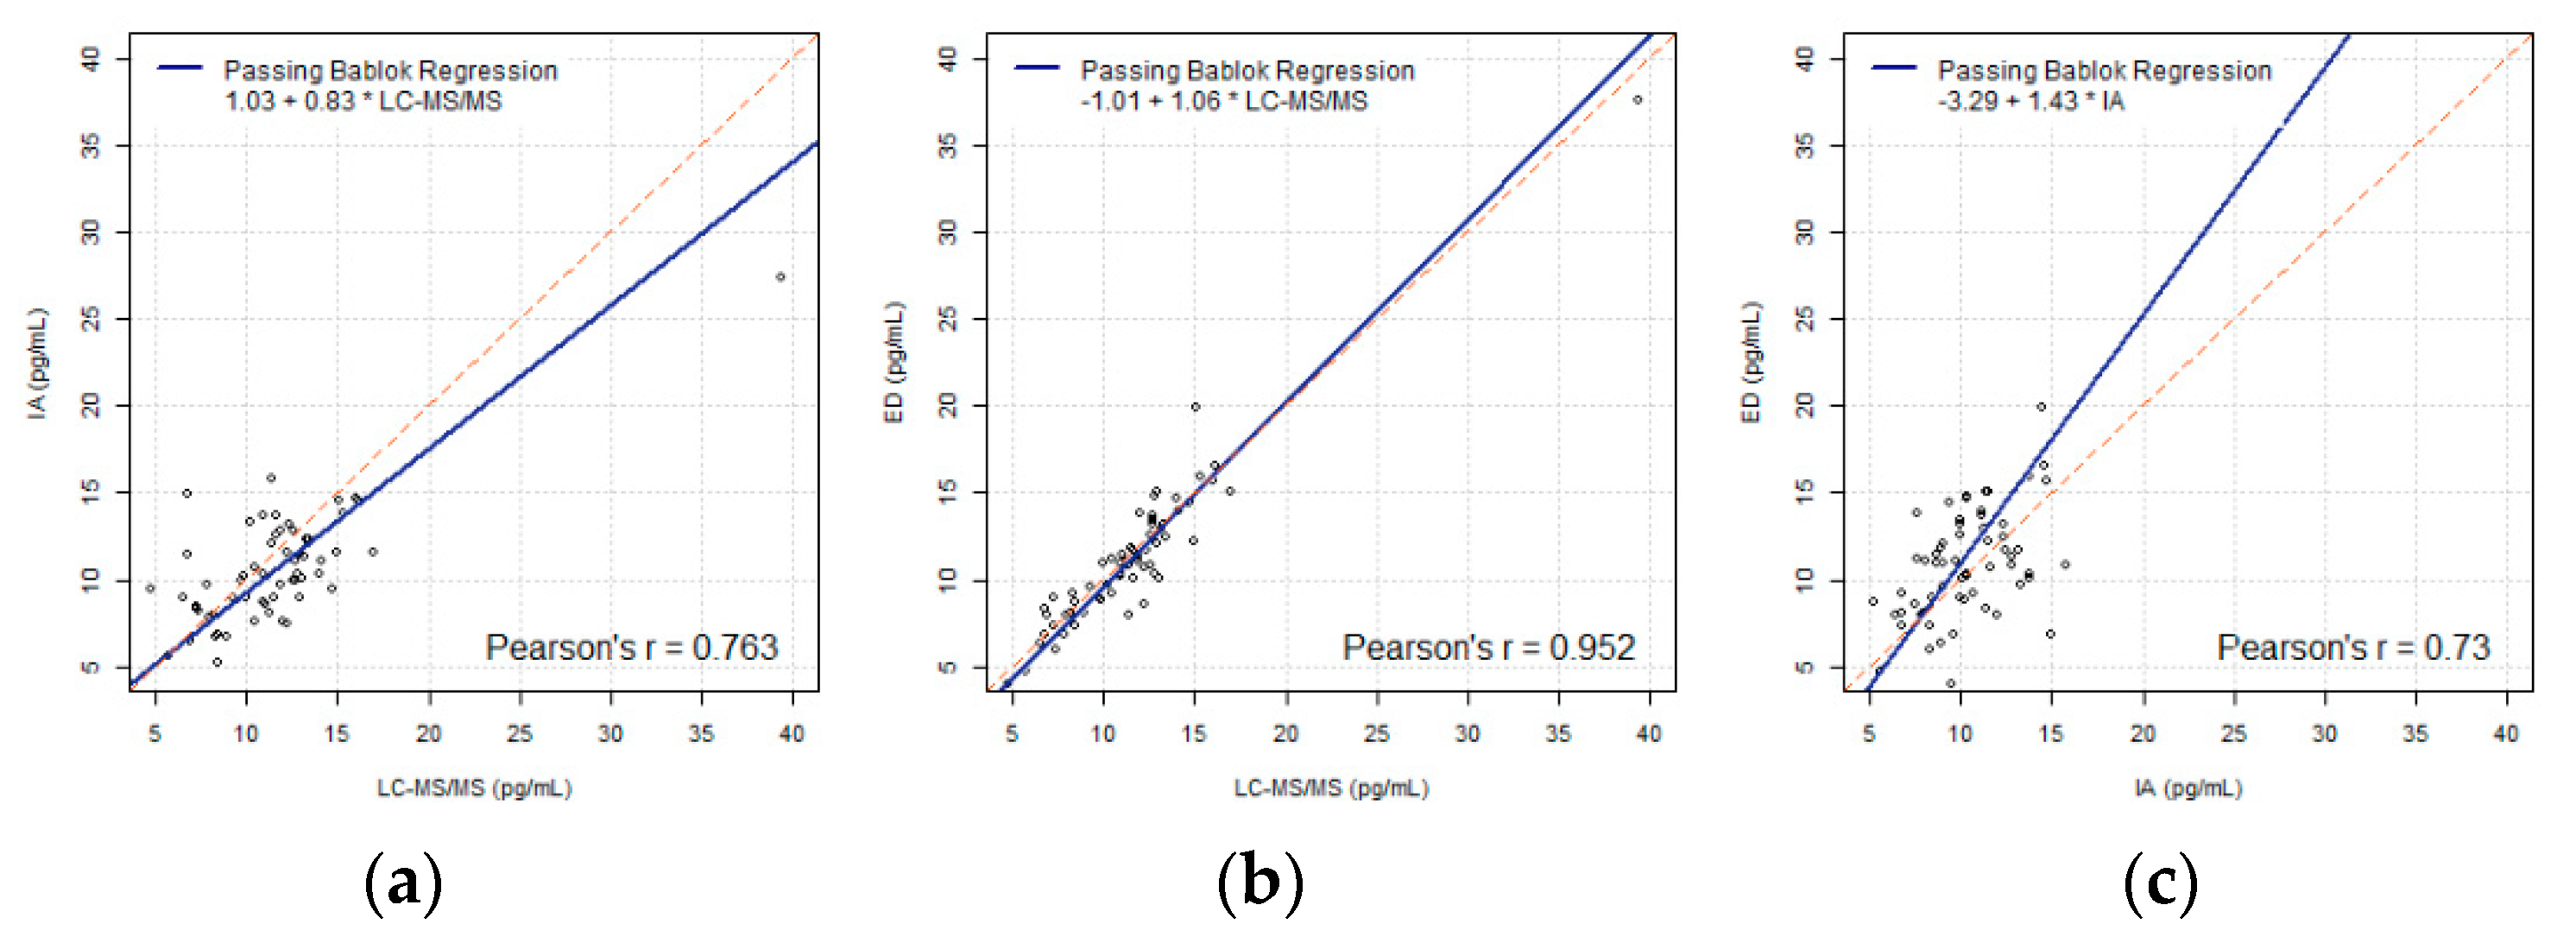
Figure 1.
(a–c) Passing-Bablok regressions of FT4 (LC-MS/MS, IA, ED) using the FT4 data including outliers (N = 62), compared pairwise.
Figure 1.
(a–c) Passing-Bablok regressions of FT4 (LC-MS/MS, IA, ED) using the FT4 data including outliers (N = 62), compared pairwise.
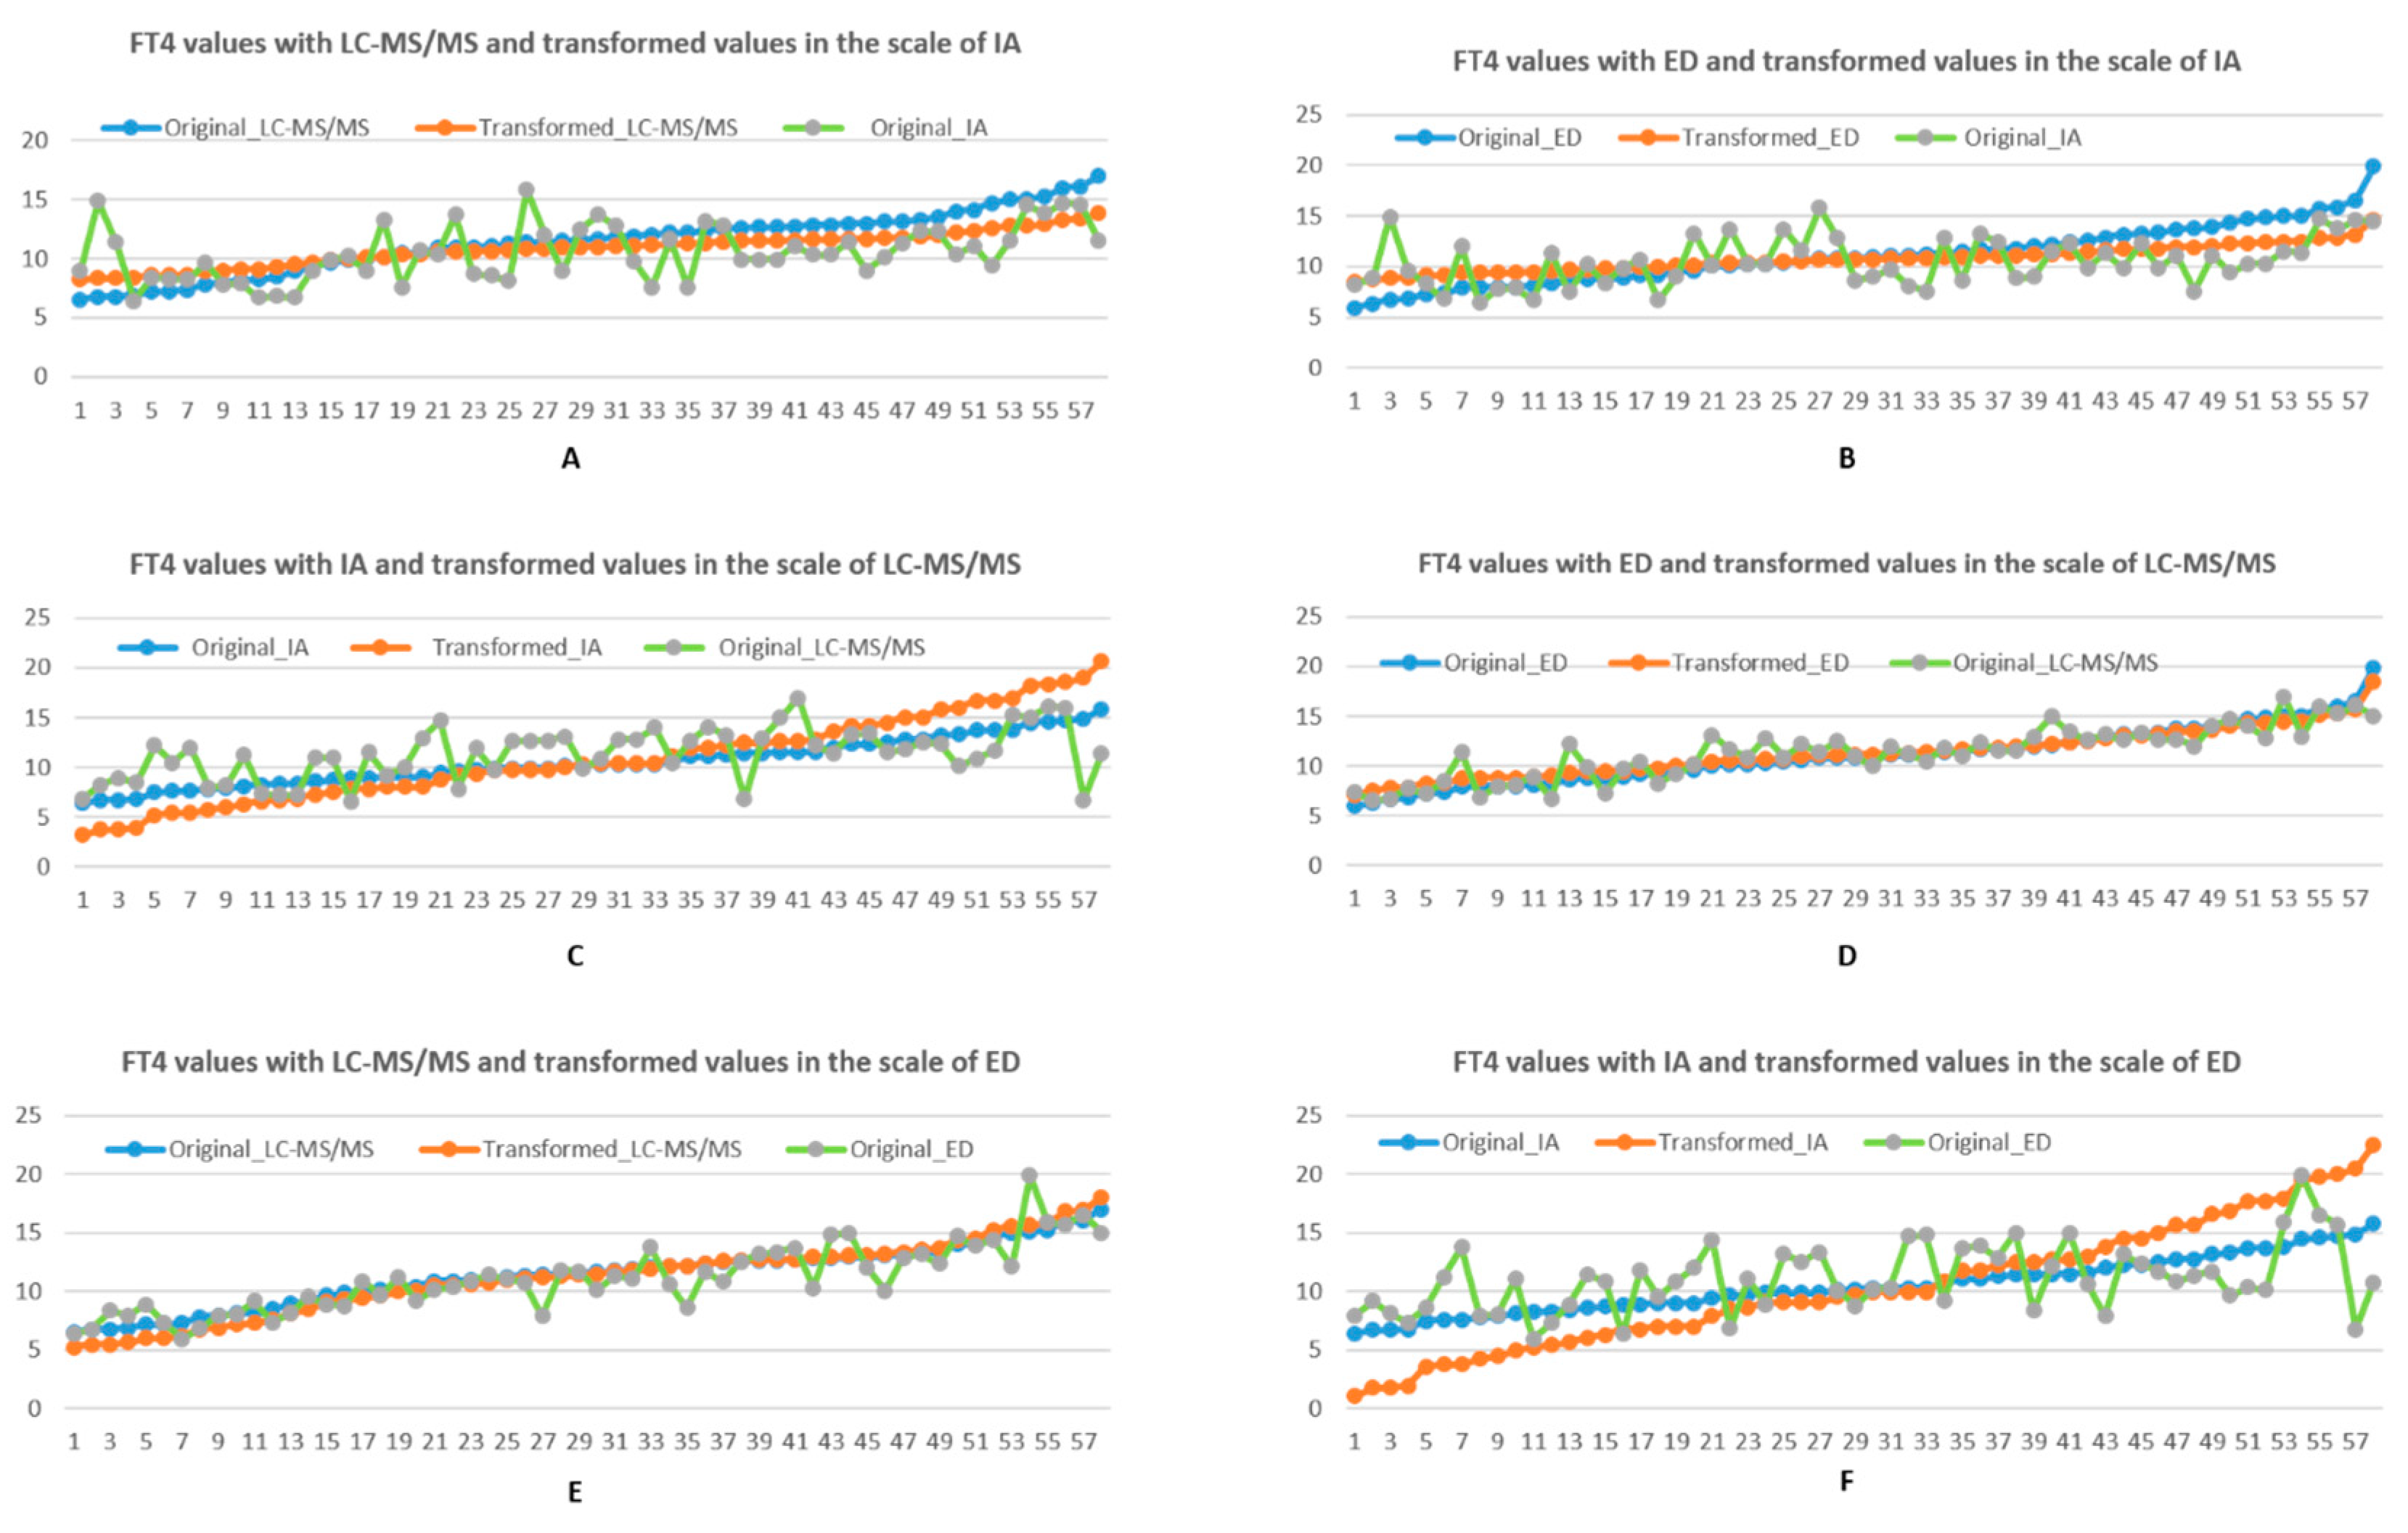
Figure 2.
(A,B top row). Comparison FT4 values and their transformations in the reference interval scale (9, 16) of IA, with respect to LC-MS/MS and ED, using linear transformation. (C,D middle row). Comparison FT4 values and their transformations in the reference interval scale (8, 21) of LC-MS/MS, with respect to IA and ED respectively, using linear transformation. (E,F bottom row). Comparison FT4 values and their transformations in the reference interval scale (7, 23) of ED, with respect to LC-MS/MS and IA, using linear transformation. Blue represents original FT4 result, orange represents the transformed scale (from the blue line) to the scale of interest, while green represents the original untransformed results in the scale of interest.
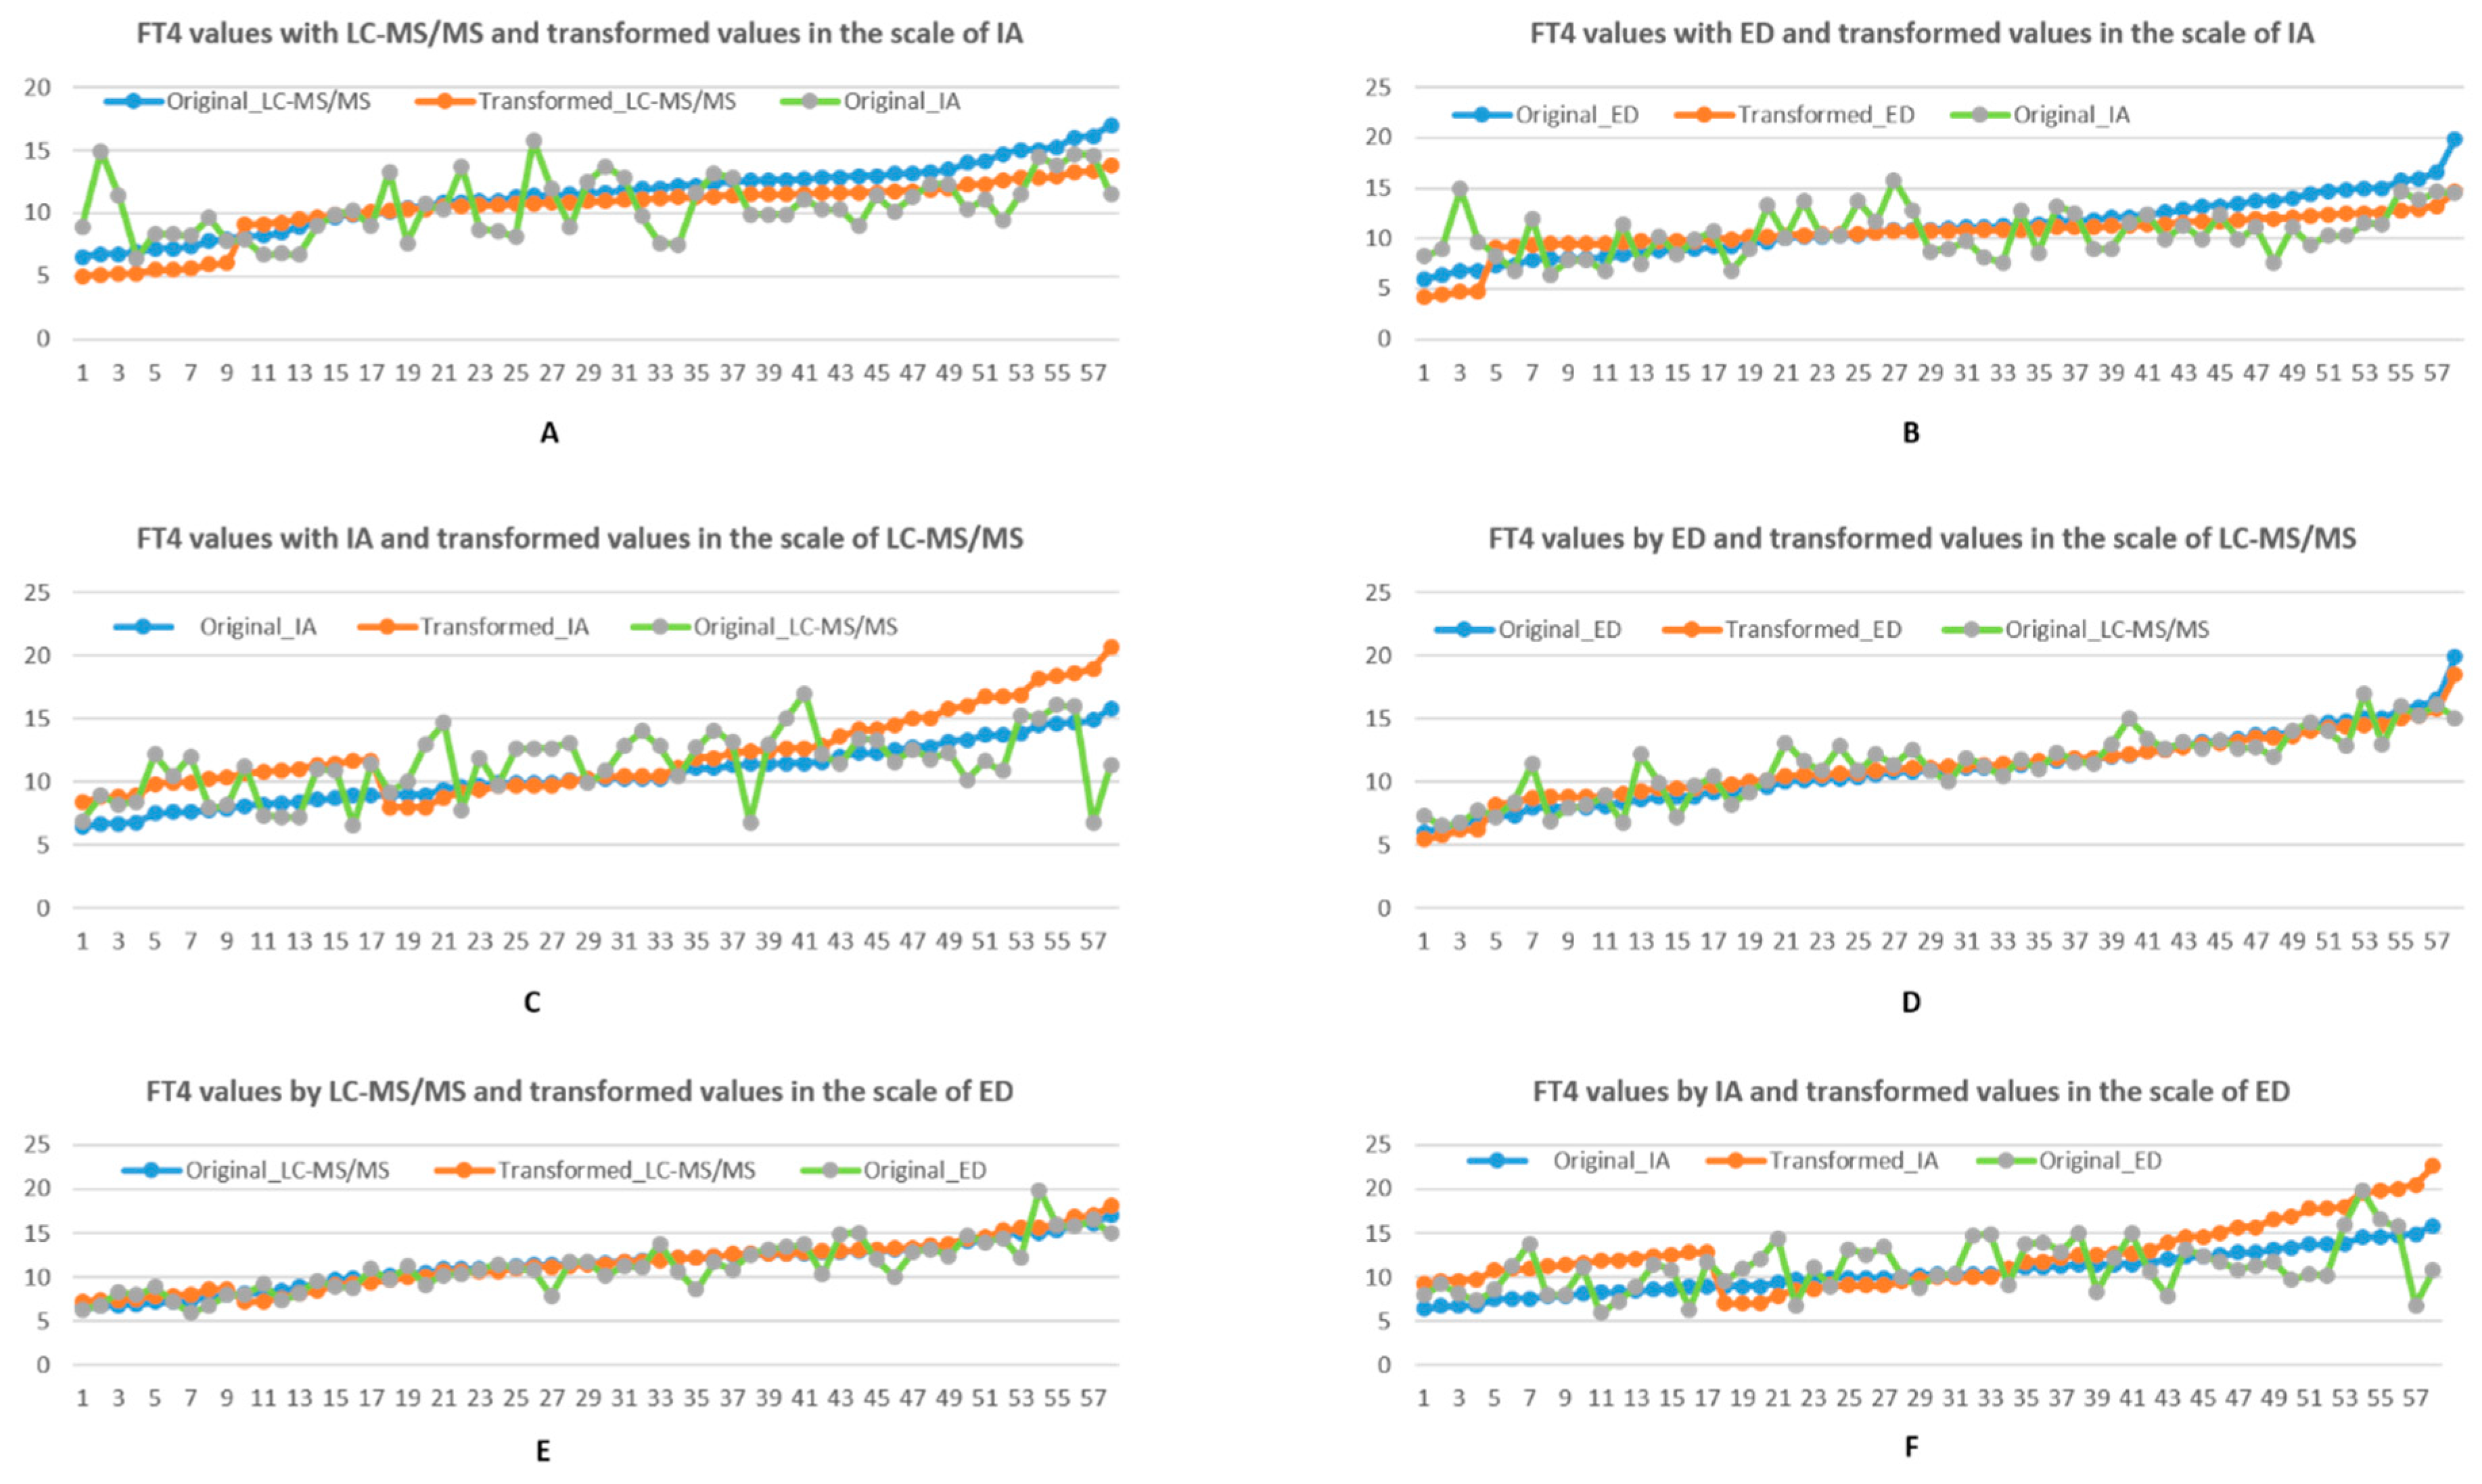
Figure 3.
(A,B top row). Comparison between FT4 values and their transformations in the reference interval scale (9, 16) of IA, with respect to LC-MS/MS and ED, using piecewise linear transformation. (C,D middle row). FT4 values and their transformations in the reference interval scale (8, 21) of LC-MS/MS, with respect to IA and ED, using piecewise linear transformation. (E,F bottom row). Comparison between FT4 values and their transformations in the reference interval scale (7, 23) of ED, with respect to LC-MS/MS and ED, using piecewise linear transformation. Blue represents original FT4 result, orange represents the transformed scale (from the blue line) to the scale of interest, while green represents the original untransformed results in the scale of interest.
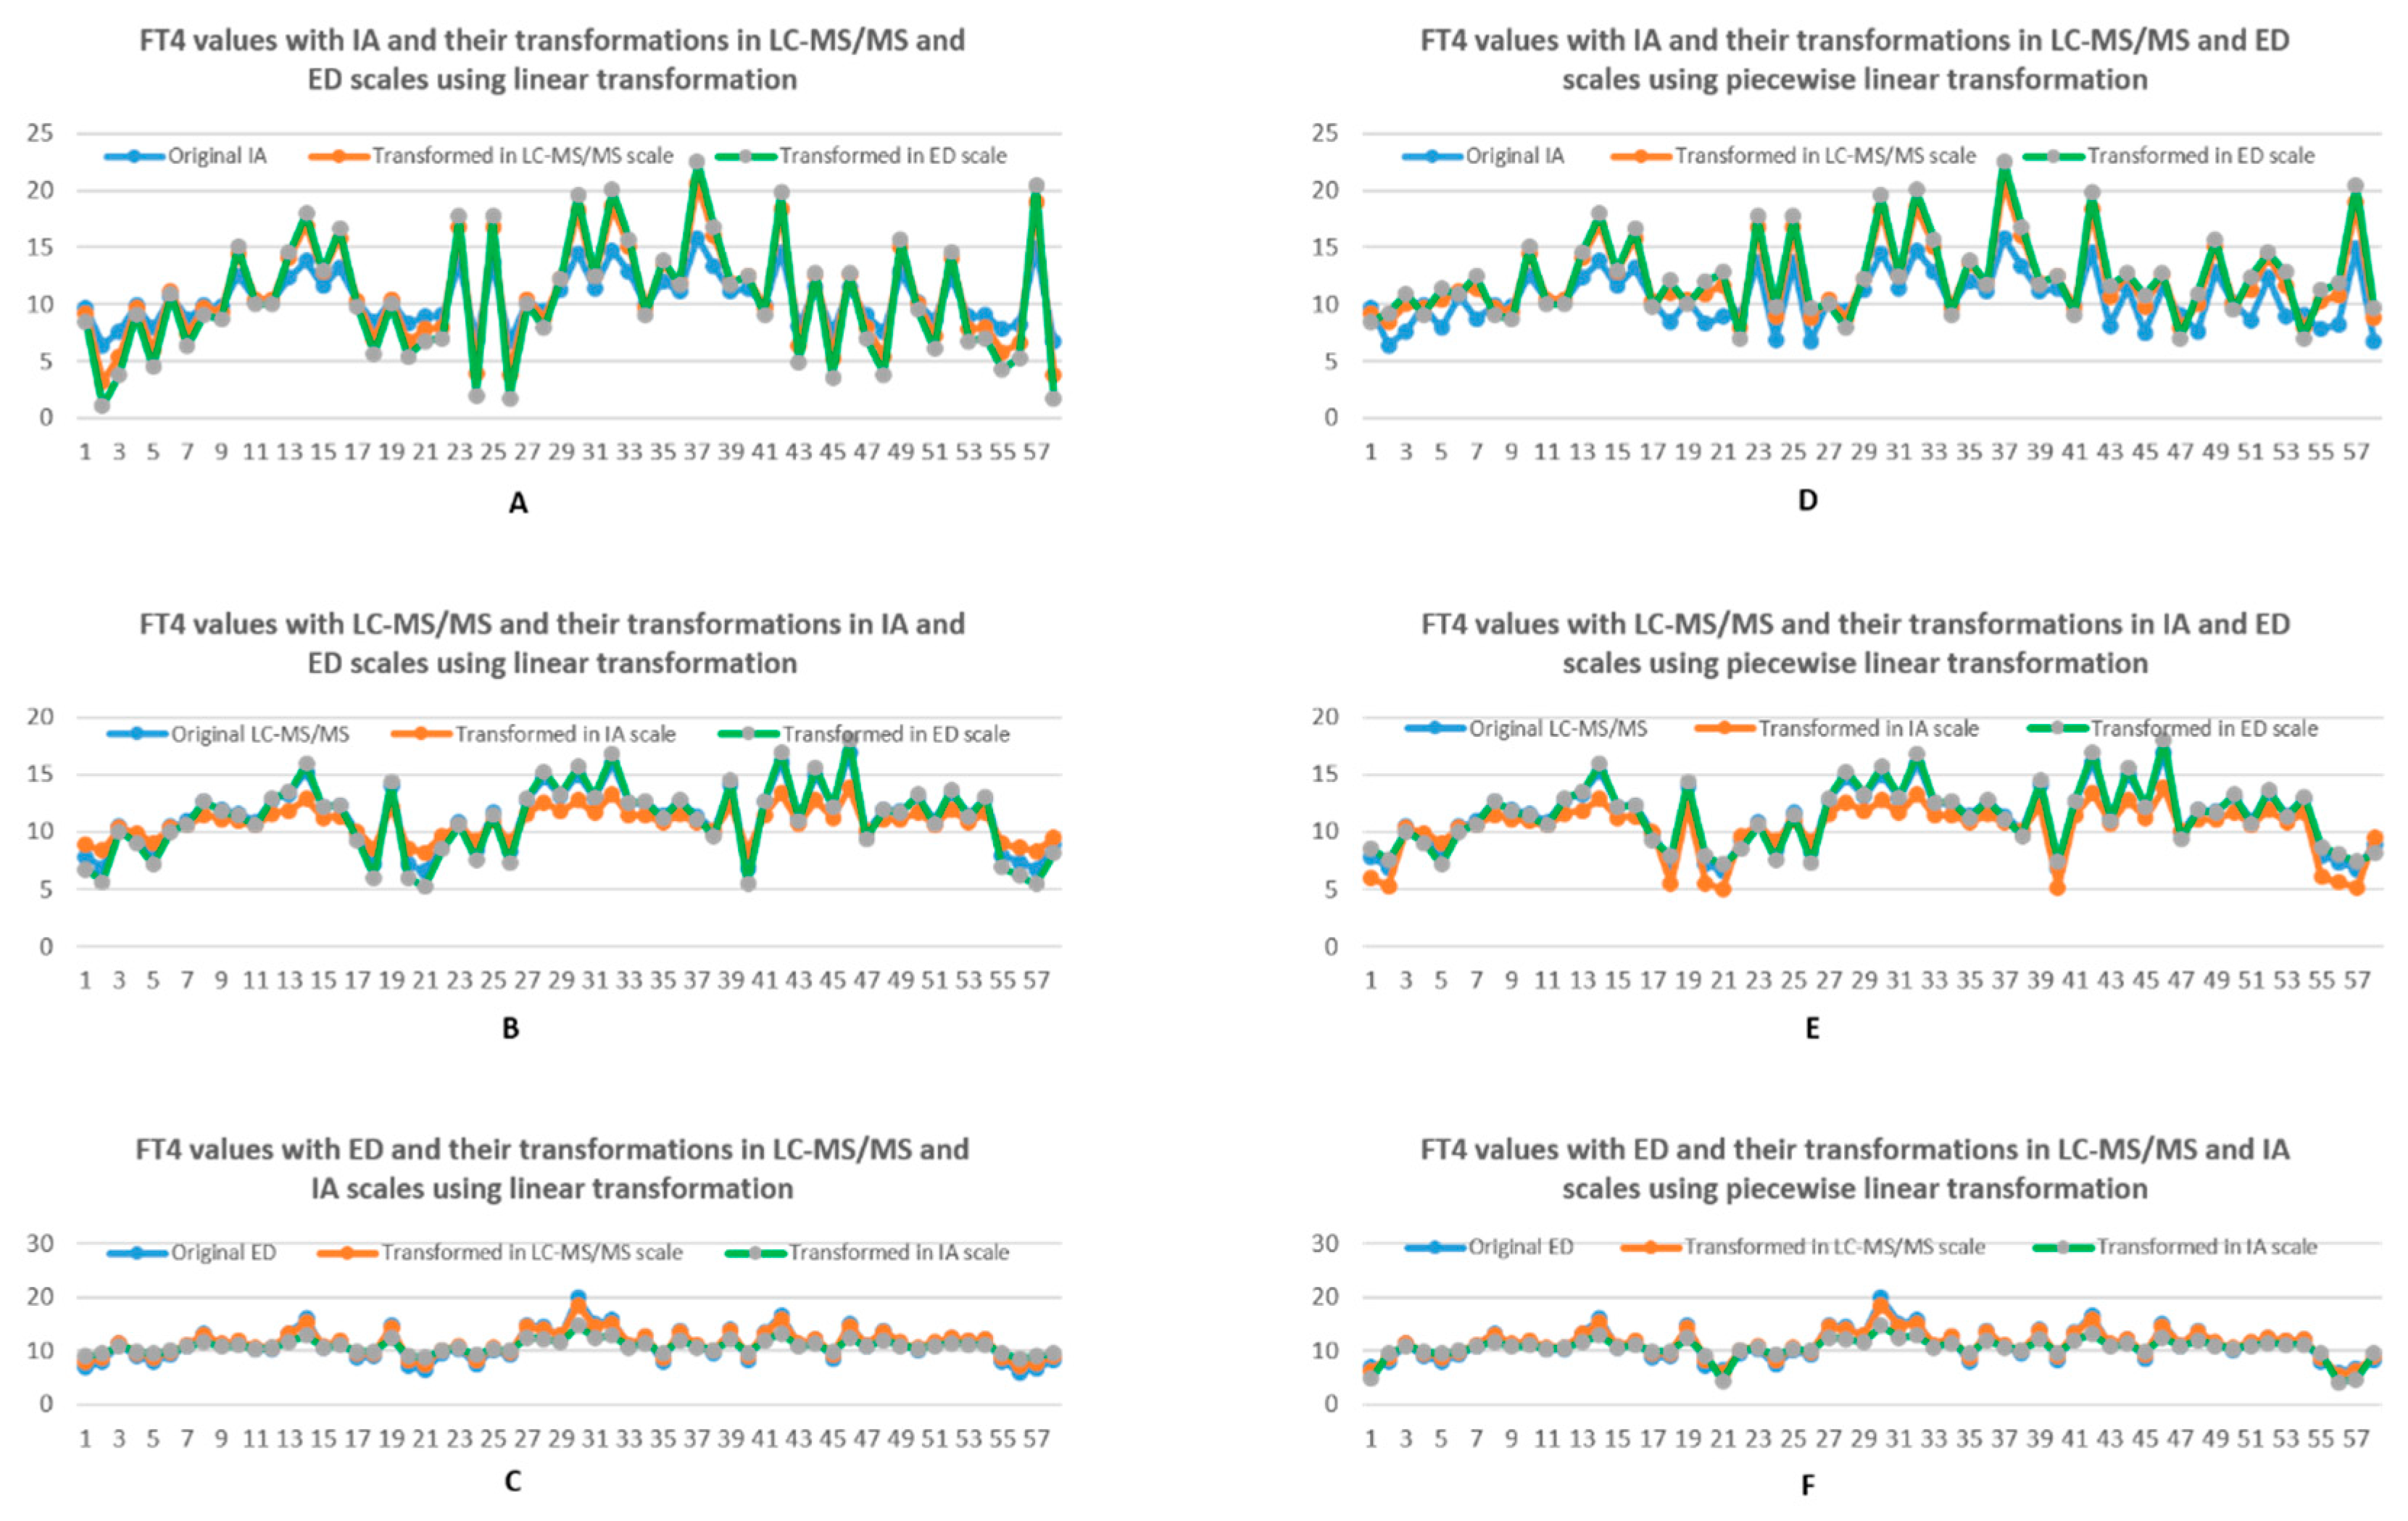
Figure 4.
(A–C) Comparison between FT4 values with one method being the scale of reference and the transformed FT4 values from another two methods, using linear transformation. (D–F) Comparison between FT4 values with one method being the scale of interest and the transformed FT4 values with another two methods, using piecewise linear transformation. Blue represents the original data, while orange and grey represents corresponding data from two other methods transformed into the scale of the original using piece-wise linear transformation.
Table 1.
Basic statistics of FT4 data (pg/mL) inclusive of outliers (N = 62) using 3 methods.
Table 1.
Basic statistics of FT4 data (pg/mL) inclusive of outliers (N = 62) using 3 methods.
| Method | LC-MS/MS | IA | ED |
|---|
| Mean (SD) | 11.55 (4.55) | 10.58 (3.28) | 11.26 (4.57) |
| CV | 0.39 | 0.31 | 0.41 |
95% Reference
limit | (2.64, 20.46) | (4.16, 17) | (2.31, 20.22) |
90% Confidence
interval of limits | (1.02, 4.26) | (18.84, 22.09) | (2.99, 5.33) | (15.84, 18.17) | (0.68, 3.94) | (18.59, 21.85) |
Table 2.
Population reference intervals (pg/mL) for FT4 with three methods.
Table 2.
Population reference intervals (pg/mL) for FT4 with three methods.
| Method | LC-MS/MS | IA | ED |
|---|
| Reference interval | (8, 21) | (9, 16) | (7, 23) |
Table 3.
Mean, SD and CV of FT4 transformations into IA scale by linear transformation.
Table 3.
Mean, SD and CV of FT4 transformations into IA scale by linear transformation.
| Method | LC-MS/MS | ED |
|---|
| Original | New | Change% | Original | New | Change% |
|---|
| Mean | 11.34 | 10.80 | −4.76% | 11.09 | 10.79 | −2.71% |
| SD | 2.61 | 1.41 | −46.08% | 2.88 | 1.26 | −56.19% |
| CV | 0.23 | 0.13 | −43.34% | 0.26 | 0.12 | −55.03% |
Table 4.
Mean, SD and CV of FT4 transformations into LC-MS/MS scale by linear transformation.
Table 4.
Mean, SD and CV of FT4 transformations into LC-MS/MS scale by linear transformation.
| Method | IA | ED |
|---|
| Original | New | Change% | Original | New | Change% |
|---|
| Mean | 10.49 | 10.77 | 2.67% | 11.09 | 11.32 | 2.11% |
| SD | 2.36 | 4.38 | 85.40% | 2.88 | 2.34 | −18.65% |
| CV | 0.22 | 0.41 | 84.66% | 0.26 | 0.21 | −20.42% |
Table 5.
Mean, SD and CV of FT4 transformations into ED scale by linear transformation.
Table 5.
Mean, SD and CV of FT4 transformations into ED scale by linear transformation.
| Method | LC-MS/MS | IA |
|---|
| Original | New | Change% | Original | New | Change% |
|---|
| Mean | 11.34 | 11.11 | −1.99% | 10.49 | 10.41 | −0.77% |
| SD | 2.61 | 3.22 | 23.26% | 2.36 | 5.39 | 128.19% |
| CV | 0.23 | 0.29 | 25.85% | 0.22 | 0.52 | 135.15% |
Table 6.
Mean, SD and CV of FT4 transformations into the IA scale by piecewise linear transformation.
Table 6.
Mean, SD and CV of FT4 transformations into the IA scale by piecewise linear transformation.
| Method | LC-MS/MS | ED |
|---|
| Original | New | Change% | Original | New | Change% |
|---|
| Mean | 11.34 | 10.32 | −8.99% | 11.09 | 10.50 | −5.36% |
| SD | 2.61 | 2.34 | −10.41% | 2.88 | 2.00 | −30.62% |
| CV | 0.23 | 0.227 | −1.49% | 0.26 | 0.19 | −26.78% |
Table 7.
Mean, SD and CV of FT4 transformations into the LC-MS/MS scale by piecewise linear transformation.
Table 7.
Mean, SD and CV of FT4 transformations into the LC-MS/MS scale by piecewise linear transformation.
| Method | IA | ED |
|---|
| Original | New | Change% | Original | New | Change% |
|---|
| Mean | 10.49 | 12.07 | 15.10% | 11.09 | 11.21 | 1.07% |
| SD | 2.36 | 3.15 | 33.30% | 2.88 | 2.56 | −11.16% |
| CV | 0.22 | 0.26 | 18.43% | 0.26 | 0.23 | −12.21% |
Table 8.
Mean, SD and CV of FT4 transformations into the ED scale by piecewise linear transformation.
Table 8.
Mean, SD and CV of FT4 transformations into the ED scale by piecewise linear transformation.
| Method | LC-MS/MS | IA |
|---|
| Original | New | Change% | Original | New | Change% |
|---|
| Mean | 11.34 | 11.41 | 0.58% | 10.49 | 12.44 | 18.59% |
| SD | 2.61 | 2.79 | 6.71% | 2.36 | 3.66 | 55.24% |
| CV | 0.23 | 0.24 | 6.17% | 0.22 | 0.29 | 33.87% |
Table 9.
An example of FT4 values (pg/mL) measured by IA and transformations in LC-MS/MS and ED scales using linear transformation.
Table 9.
An example of FT4 values (pg/mL) measured by IA and transformations in LC-MS/MS and ED scales using linear transformation.
| Subject S/N | Original IA | LC-MS/MS to IA | ED to IA | Original LC-MS/MS | Original ED |
|---|
| 2 | 6.40 | 8.40 | 9.42 | 6.89 | 7.97 |
| 58 | 7.80 | 8.97 | 9.42 | 7.94 | 7.97 |
| 59 | 8.24 | 8.64 | 8.55 | 7.33 | 5.96 |
| 22 | 8.30 | 8.57 | 9.12 | 7.21 | 7.29 |
| 20 | 8.40 | 8.56 | 9.82 | 7.19 | 8.88 |
| 23 | 8.90 | 8.22 | 8.71 | 6.55 | 6.35 |
| 1 | 9.65 | 8.90 | 8.92 | 7.81 | 6.82 |
| 52 | 10.10 | 11.75 | 10.34 | 13.10 | 10.07 |
| 42 | 11.40 | 8.34 | 9.59 | 6.77 | 8.35 |
| 60 | 14.90 | 8.32 | 8.90 | 6.75 | 6.77 |
Table 10.
An example of FT4 values (pg/mL) measured by IA and their transformations in LC-MS/MS and ED scales using piecewise linear transformation.
Table 10.
An example of FT4 values (pg/mL) measured by IA and their transformations in LC-MS/MS and ED scales using piecewise linear transformation.
| Subject S/N | Original IA | LC-MS/MS to IA | ED to IA | Original LC-MS/MS | Original ED |
|---|
| 2 | 6.40 | 5.25 | 9.42 | 6.89 | 7.97 |
| 58 | 7.80 | 6.05 | 9.42 | 7.94 | 7.97 |
| 59 | 8.24 | 5.58 | 4.15 | 7.33 | 5.96 |
| 22 | 8.30 | 5.49 | 9.12 | 7.21 | 7.29 |
| 20 | 8.40 | 5.48 | 9.82 | 7.19 | 8.88 |
| 23 | 8.90 | 4.99 | 4.42 | 6.55 | 6.35 |
| 1 | 9.65 | 5.95 | 4.74 | 7.81 | 6.82 |
| 52 | 10.10 | 11.75 | 10.34 | 13.10 | 10.07 |
| 42 | 11.40 | 5.16 | 9.59 | 6.77 | 8.35 |
| 60 | 14.90 | 5.14 | 4.71 | 6.75 | 6.77 |


