Review

Microscopy Methods for Biofilm Imaging: Focus on SEM and VP-SEM Pros and Cons

1
Department of Anatomy, Histology, Forensic Medicine and Orthopedics, Sapienza University of Rome, Via Alfonso Borelli 50, 00161 Rome, Italy
2
Department of Clinical and Molecular Medicine, Unit of Vascular Surgery, Sant’Andrea Hospital, Sapienza University of Rome, Via di Grottarossa 1039, 00189 Rome, Italy
3
Key Laboratory of Environmental Medicine Engineering, Ministry of Education, School of Public Health, Southeast University, Nanjing 210096, China
4
Department of Public Health and Infectious Diseases, Sapienza University of Rome, P.le Aldo Moro 5, 00185 Rome, Italy
*
Author to whom correspondence should be addressed.
Submission received: 10 December 2020 / Revised: 30 December 2020 / Accepted: 7 January 2021 / Published: 12 January 2021

Abstract

:

Simple Summary

Bacterial biofilms cause infections that are often resistant to antibiotic treatments. Research about the formation and elimination of biofilms cannot be undertaken without detailed imaging techniques. In this review, traditional and cutting-edge microscopy methods to study biofilm structure, ultrastructure, and 3-D architecture, with particular emphasis on conventional scanning electron microscopy and variable pressure scanning electron microscopy, are addressed, with the respective advantages and disadvantages. When ultrastructural characterization of biofilm matrix and its embedded bacterial cells is needed, as in studies on the effects of drug treatments on biofilm, scanning electron microscopy with customized protocols such as the osmium tetroxide (OsO4), ruthenium red (RR), tannic acid (TA), and ionic liquid (IL) must be preferred over other methods for the following: unparalleled image quality, magnification and resolution, minimal sample loss, and actual sample structure preservation. The first step to make a morphological assessment of the effect of the various pharmacological treatments on clinical biofilms is the production of images that faithfully reflect the structure of the sample. The extraction of quantitative parameters from images, possible using specific software, will allow for the scanning electron microscopy morphological evaluation to no longer be considered as an accessory technique, but a quantitative method to all effects.

Abstract

Several imaging methodologies have been used in biofilm studies, contributing to deepening the knowledge on their structure. This review illustrates the most widely used microscopy techniques in biofilm investigations, focusing on traditional and innovative scanning electron microscopy techniques such as scanning electron microscopy (SEM), variable pressure SEM (VP-SEM), environmental SEM (ESEM), and the more recent ambiental SEM (ASEM), ending with the cutting edge Cryo-SEM and focused ion beam SEM (FIB SEM), highlighting the pros and cons of several methods with particular emphasis on conventional SEM and VP-SEM. As each technique has its own advantages and disadvantages, the choice of the most appropriate method must be done carefully, based on the specific aim of the study. The evaluation of the drug effects on biofilm requires imaging methods that show the most detailed ultrastructural features of the biofilm. In this kind of research, the use of scanning electron microscopy with customized protocols such as osmium tetroxide (OsO4), ruthenium red (RR), tannic acid (TA) staining, and ionic liquid (IL) treatment is unrivalled for its image quality, magnification, resolution, minimal sample loss, and actual sample structure preservation. The combined use of innovative SEM protocols and 3-D image analysis software will allow for quantitative data from SEM images to be extracted; in this way, data from images of samples that have undergone different antibiofilm treatments can be compared.

1. Introduction

Surface-attached microbial agglomerations were for the first time named as a “biofilm” by William J. Costerton in 1978 [1]. In the following years, he perfected this definition by also considering the host role and the three-dimensional (3-D) architecture. The definition of biofilm was thus implemented, expanding the concept toward a complex community of microorganisms living attached to a surface or interface, being enclosed in an exopolysaccharide matrix (Eps) of microbial and host origin arranged in a three-dimensional (3-D) architecture [2]. Bacterial species in biofilms exhibit cooperation [3], behaving as complex multi-cellular organisms [4]. Eps composition is complex and it may contain polysaccharides, proteins, nucleic acid, lipids, and metals. [5]. The complex array of chemically and functionally diverse biomolecules in the Eps has been termed the matrixome [6], which contributes to the peculiar characteristics of biofilm behavior. According to the National Institutes of Health (NIH), bacterial biofilms are responsible for up to 75% of infectious diseases in humans, as implant-related infections and/or tissue-associated infections [7]. In the European Union and European Economic Area, 8.9 million healthcare-associated infection episodes per year are due to biofilms [8]. These infections are often recurrent and resistant to antibiotic treatments [9,10] due to the particular characteristics of Eps that protect the resident microorganisms from the effects of host immunity or administered antimicrobial drugs [11]. It is of crucial importance nowadays to design or screen anti-biofilm molecules that can effectively minimize and eradicate biofilm-related infections. In this kind of investigation, the use of different microscopy techniques is required to better understand the intimate details of the biofilms’ ultrastructure, their 3-D organization, cell population behavior, and reactions after drug treatments [12]. The development of novel morphological investigation approaches is therefore crucial.

2. Microscopy Techniques Applied to Biofilm Imaging

2.1. Light Microscopy (LM)

Light microscopy (LM) is a basic imaging technique that is useful for providing the visual identification of biofilm presence and also has significant prognostic value [13]. It can be used for quantitative assessment of biofilm biomass, being easy and low cost to perform [14,15]. However, light microscopy has limited magnification and resolution, so it cannot be applied to describe the finest details of biofilm cell morphology or Eps architecture, but it can be coupled with Scanning electron microscopy (SEM) and Transmission electron microscopy (TEM) in correlative studies as in [16]. In this study on teeth microflora, light microscopy observation of semi-thin sections from demineralized teeth provided the best overall perspective of the root canal, enabling larger areas to be observed at low magnification. Samples observed with SEM did not show bacteria in dentine tubules, in contrast, when the same samples were demineralized and included in resin, their semi-thin section LM images revealed the presence of bacteria, then TEM images confirmed the LM findings [16].

2.2. Confocal Laser Scanning Microscopy (CLSM)

Confocal laser scanning microscopy (CLSM) allows for the quantitative evaluation of structural parameters as biovolume (cells overall volume in the observation field), thickness, and roughness. Sample 3-D architecture representation and its time-dependent variation (real-time 4-D) can also be achieved [17]. CLSM was used in combination with a fluorescent stain and was successfully applied on different biofilms species [18,19,20,21]. The CLSM resolution level is singe cell dimension and using pathogen-specific probes labeled with different fluorescent dyes (FISH followed by CLSM) as described in [22], identification of a single species in multispecies samples is allowed. With the same approach, interspecies competition assessment as well as interference in-between species were analyzed [23]. In studies assessing drug antimicrobial effects, CLSM was used, together with specific fluorophores, to discriminate between live or dead bacterial cells, localizing also their spatial distribution [24,25,26,27,28]. CLSM is a method of choice for biofilm visualization and quantification. Unfortunately, CLSM biofilm analysis has limitations due to the use of fluorophores, the existence of a limited number of reporter molecules, and the signal of interest might be hidden by the interference of intrinsic biofilm fluorescence with that of the probe.

2.3. Atomic Force Microscopy (AFM)

Bacteria respond to different mechanical signals [29] like adhesion forces originating during adhesion processes. During these events, bacterial surfaces deform [30], modifying the intra-bilayer pressure profile [31], which, in turn, changes bacterial gene expressions, transforming a planktonically growing cell into a biofilm growing one. Atomic force microscopy (AFM) allows for the quantification of adhesion forces existing among living cells, and between cells and surfaces [32,33]. The knowledge of how adhesion and viscoelasticity can modulate biofilm development may be important in the design of biofilm control strategies. Viscoelastic properties of biofilms influence antimicrobial penetration and removal of biofilm from surfaces and therefore performs a role in their protection against mechanical and chemical challenges [34]. This approach was recently used to demonstrate how amyloid protein production dramatically increases the stiffness of Pseudomonas biofilms [35]. AFM has been applied to obtain insights into biofilm 3-D developmental patterns [36,37,38,39,40,41]. Atomic force microscopy (AFM) allows for the quantification of biofilm biomass in terms of thickness and Eps amount based on height and roughness analyses from AFM images [42,43,44,45,46,47,48,49]. Vantages, disadvantages and application fields of non-electron microscopic techniques are summarized in Table 1.

3. Scanning Electron Microscopy Techniques Applied to Biofilm Study

In studies connecting differences in biofilm composition with function, the visualization of microbial biofilms in their finest details is mandatory, and to accomplish this task, electron microscopy has no rivals. However, to avoid artifact formation, sample preparation protocols, instrument selection, and acquisition parameters must be finely tuned and customized to the specific sample. The following will discuss the electron microscopy techniques that have been used in studying biofilms: conventional SEM, field emission SEM (FESEM), variable pressure SEM (VP-SEM), environmental SEM (ESEM), and the more recent ambiental SEM (ASEM), ending with the cutting edge cryo-SEM and focused ion beam SEM (FIB SEM).

3.1. Conventional Scanning Electron Microscope (SEM)

Conventional SEM and FESEM are the best methods for biofilm visualization if high magnification and high-resolution images are needed to accurately describe biofilm morphology [50,51,52]. In comparative analyses, like the evaluation of the anti-biofilm effects of a drug/treatment, it appears as an extremely useful tool [11], since the results of SEM imaging are highly correlated with those from other analytical methods [53,54,55,56,57,58,59]. The use of dedicated SEM imaging software for biofilm image analysis has allowed for the quantitative morphological analysis of biofilm by several authors [56,60,61,62,63]. The undisputed advantages of SEM and FESEM consist of the combined ability to image with a wide range of magnifications (20 to 30,000×) coupled with high resolution (from 50 to 100 nm) and depth of field. Furthermore, 3D image analysis software allows for data extraction and quantification of detailed morphological findings. In biofilm study, however, some inconveniences may occur. Dehydration and coating with a conductive material can cause Eps collapse and overall biofilm shrinkage [64]. During a critical point drying procedure, ethanol flow could cause possible extraction of the sample material [65], so hexamethyldisilazane (HDMS) drying can be used as a valuable, time-saving, and inexpensive option [53,66,67]. Conventional SEM and FESEM limitations can be overcome using highly tailored protocols for biofilm or using alternative SEM modalities such as VP-SEM, cryo-SEM, and environmental-SEM (ESEM).

3.2. Variable Pressure Scanning Electron Microscopy (VP-SEM)

High-resolution imaging in challenging experimental conditions is made possible by VP-SEM, as this technique allows for the visualization of fully hydrated and out-gassing samples with little or no sample preparation procedures [68,69,70]. In studies focusing on biofilm properties, the characterization of hydrated biofilm is fundamental, and conventional high-vacuum SEM (requiring dehydration and drying) causes matrix Eps collapse, giving a deformed biofilm appearance and disfigured architecture. VP-SEM, instead, requires no dehydration and drying, and, if coupled with appropriate fixation, followed by heavy metal staining that enhances contrast and resolution, can be used in bacterial [71,72,73,74] and fungal [75] biofilm characterization. The primary and secondary most used fixatives are aldehydes (glutaraldehyde or paraformaldehyde cross-links proteins), osmium tetroxide (OsO4), which binds specifically to lipids [76], allowing for excellent preservation of fine features. It is used both as a fixative both and as a contrasting agent in studies of hydrated fungal biofilms [75] where lipid droplet inclusion is highlighted. Heavy metal staining is a “trusted” method that has been used since the dawn of electron microscopy. Ruthenium Red was recently used to provide contrast in the VP-SEM imaging of bacterial [71] and fungal biofilms [75]. It is a cation, and specifically binds to Eps polyanionic constituents [77,78,79], but also phospholipid membranes and Ca2+-binding proteins, and these abilities make it an excellent stain for both biofilm ECM and hyphal components. Ruthenium Red staining can be used in combination with OsO4 staining [71,75]. Ruthenium tetroxide (RuO4) staining is less toxic than OsO4, it binds with greater strength to polar lipids and, at the same time, stains proteins, monosaccharides, and glycogen [80,81]. Recently, it has been used for hydrated specimens in VP-SEM imaging [75]. Other “historical” stains used in transmission electron microscopy and useful in VPSEM are Alcian Blue, Safranin O, L-lysine, [82,83], uranyl acetate, [84,85,86] phosphotungstic acid, and tannic acid [87,88,89].

3.3. Comparing Conventional SEM and VP-SEM on S. mutans Samples

Few interesting papers have compared biofilm observation by conventional SEM, VPSEM, and different protocols for each technique. An S. mutans biofilm was analyzed by conventional SEM, the SEM protocol with Ruthenium Red, and VP-SEM by [72]. They suggested that VPSEM is the most accurate technique to observe the S. mutans biofilms’ Eps matrix topography as the SEM dehydration steps and high vacuum conditions are noxious for Eps integrity, even if RR is used. Different results were obtained in [50], where in this study, the authors observed the S. mutans biofilm (S. mutans CCUG 35176, obtained from the Culture Collection University of Göteborg, CCUG, grown at 37 °C under aerobic conditions on aluminum discs) by SEM and VP-SEM. The S. mutans biofilm was prepared with different protocols: the conventional SEM sample preparation procedure; VP-SEM protocol, and new protocols adopting osmium tetroxide (OsO4), ruthenium red (RR), tannic acid (TA) impregnation, and ionic liquid (IL) drop-casting, which replaced the sputter coating procedure and were discussed above for the RR properties. Concerning tannic acid, it reacts with osmium tetroxide and increases lipid retention, forming complexes that link to proteins and carbohydrates [90]. Consequently, their combined use enhanced extracellular matrix resistance to mechanical damage during sample preparation (specimen hardening, [91,92,93,94]). The sample acquires intrinsic conductive properties into the bulk, not only on the surface (as it happens with sputter coating), but enhanced image contrast without charging phenomena, and 3-D observation of sub-surface structures under higher voltages are allowed [95]. At room temperature, ionic liquids are molten salts, they have high electronic conductivity, and extremely low vapor pressure [96,97]. Recently, they have been used in SEM as a substitute for metal coating [98]. An IL covering keeps the biofilm hydrated under high vacuum SEM conditions (IL resists evaporation), so the Eps is preserved, thus avoiding dehydration steps and critical point drying procedures. The protocols used in [50] are summarized in Table 2.

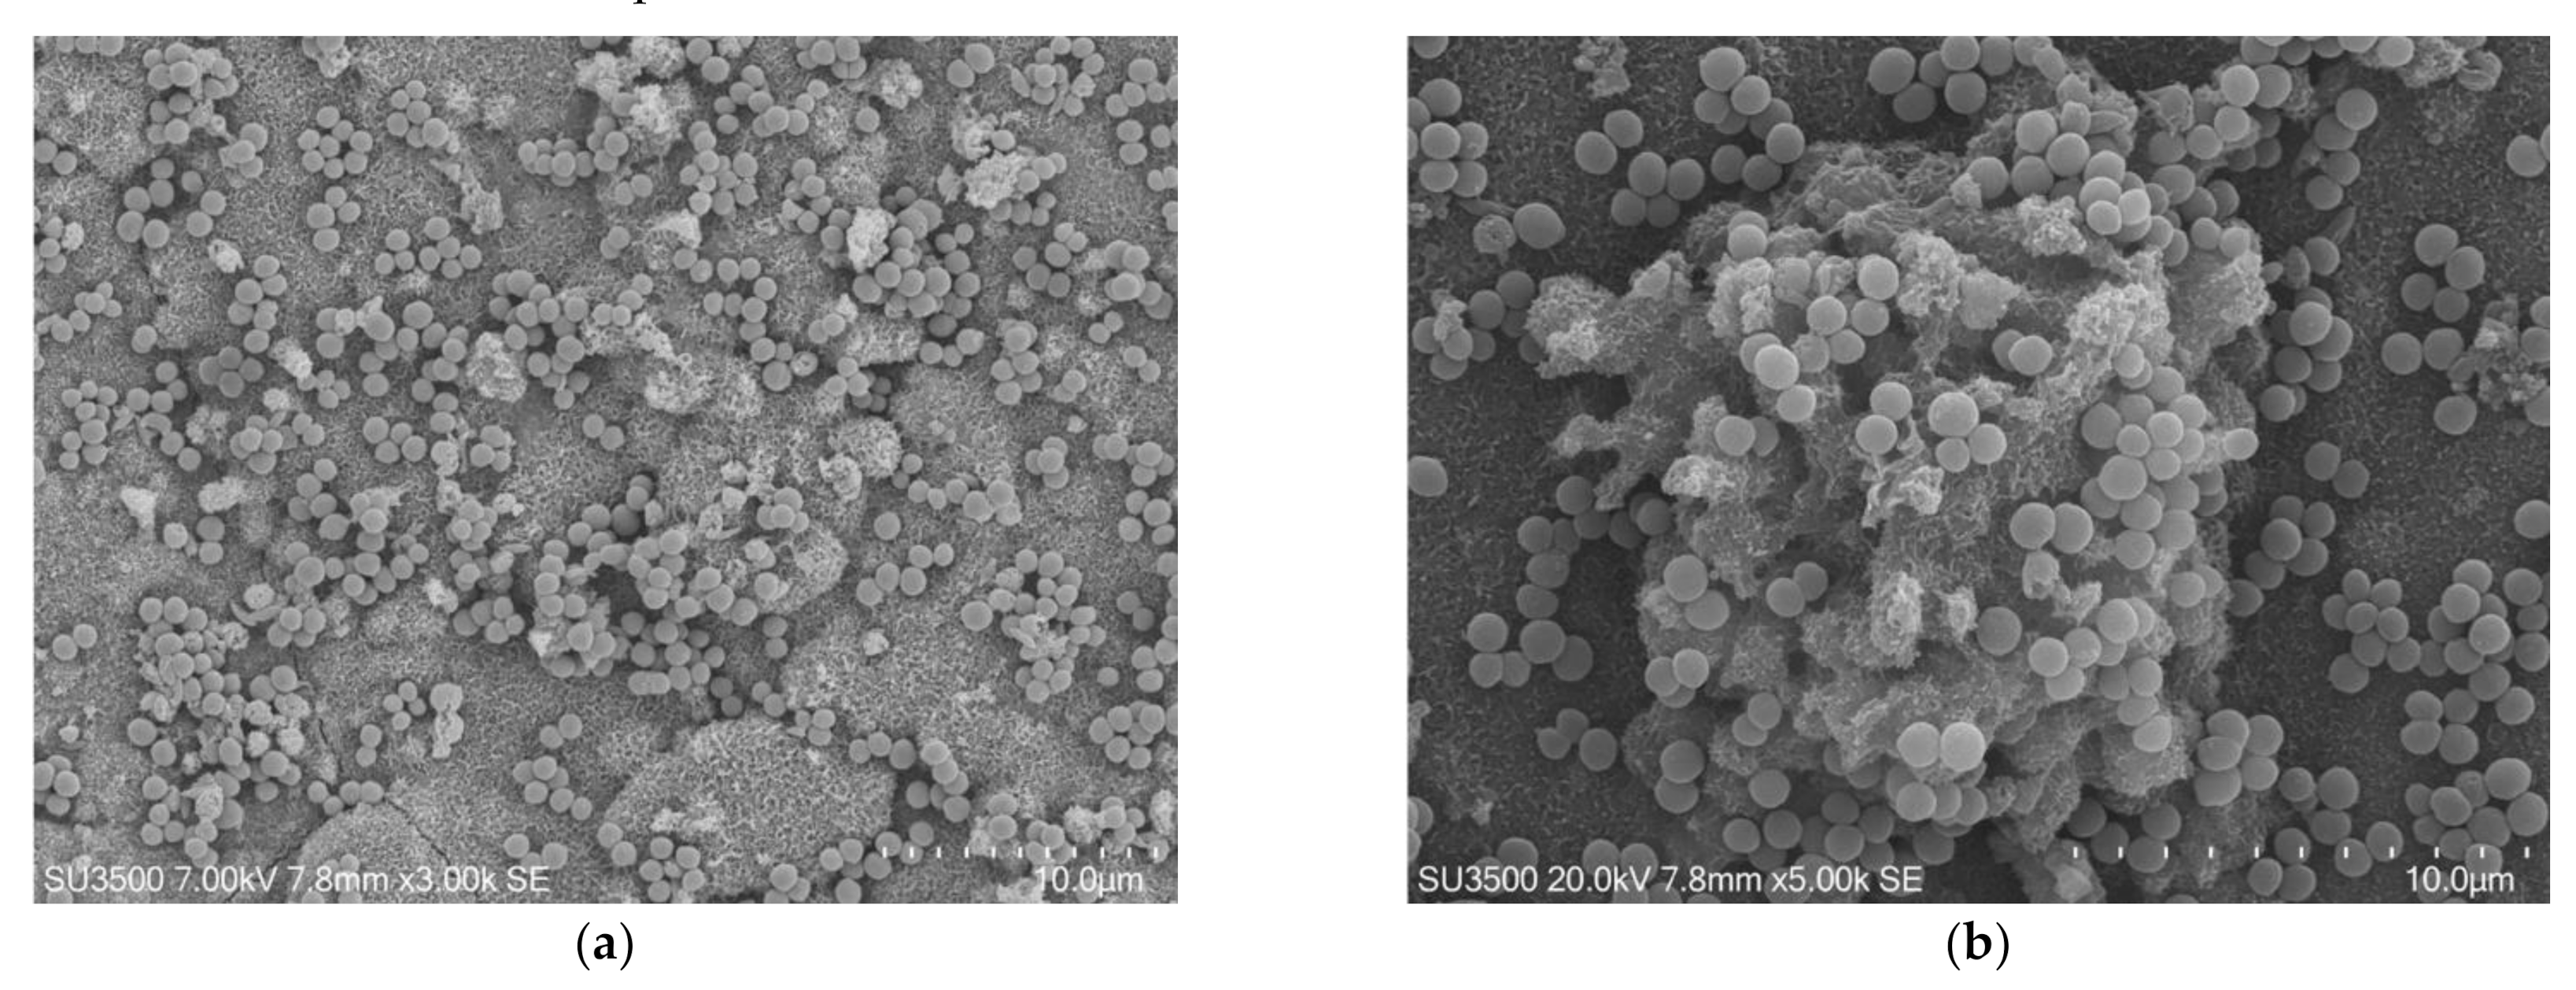
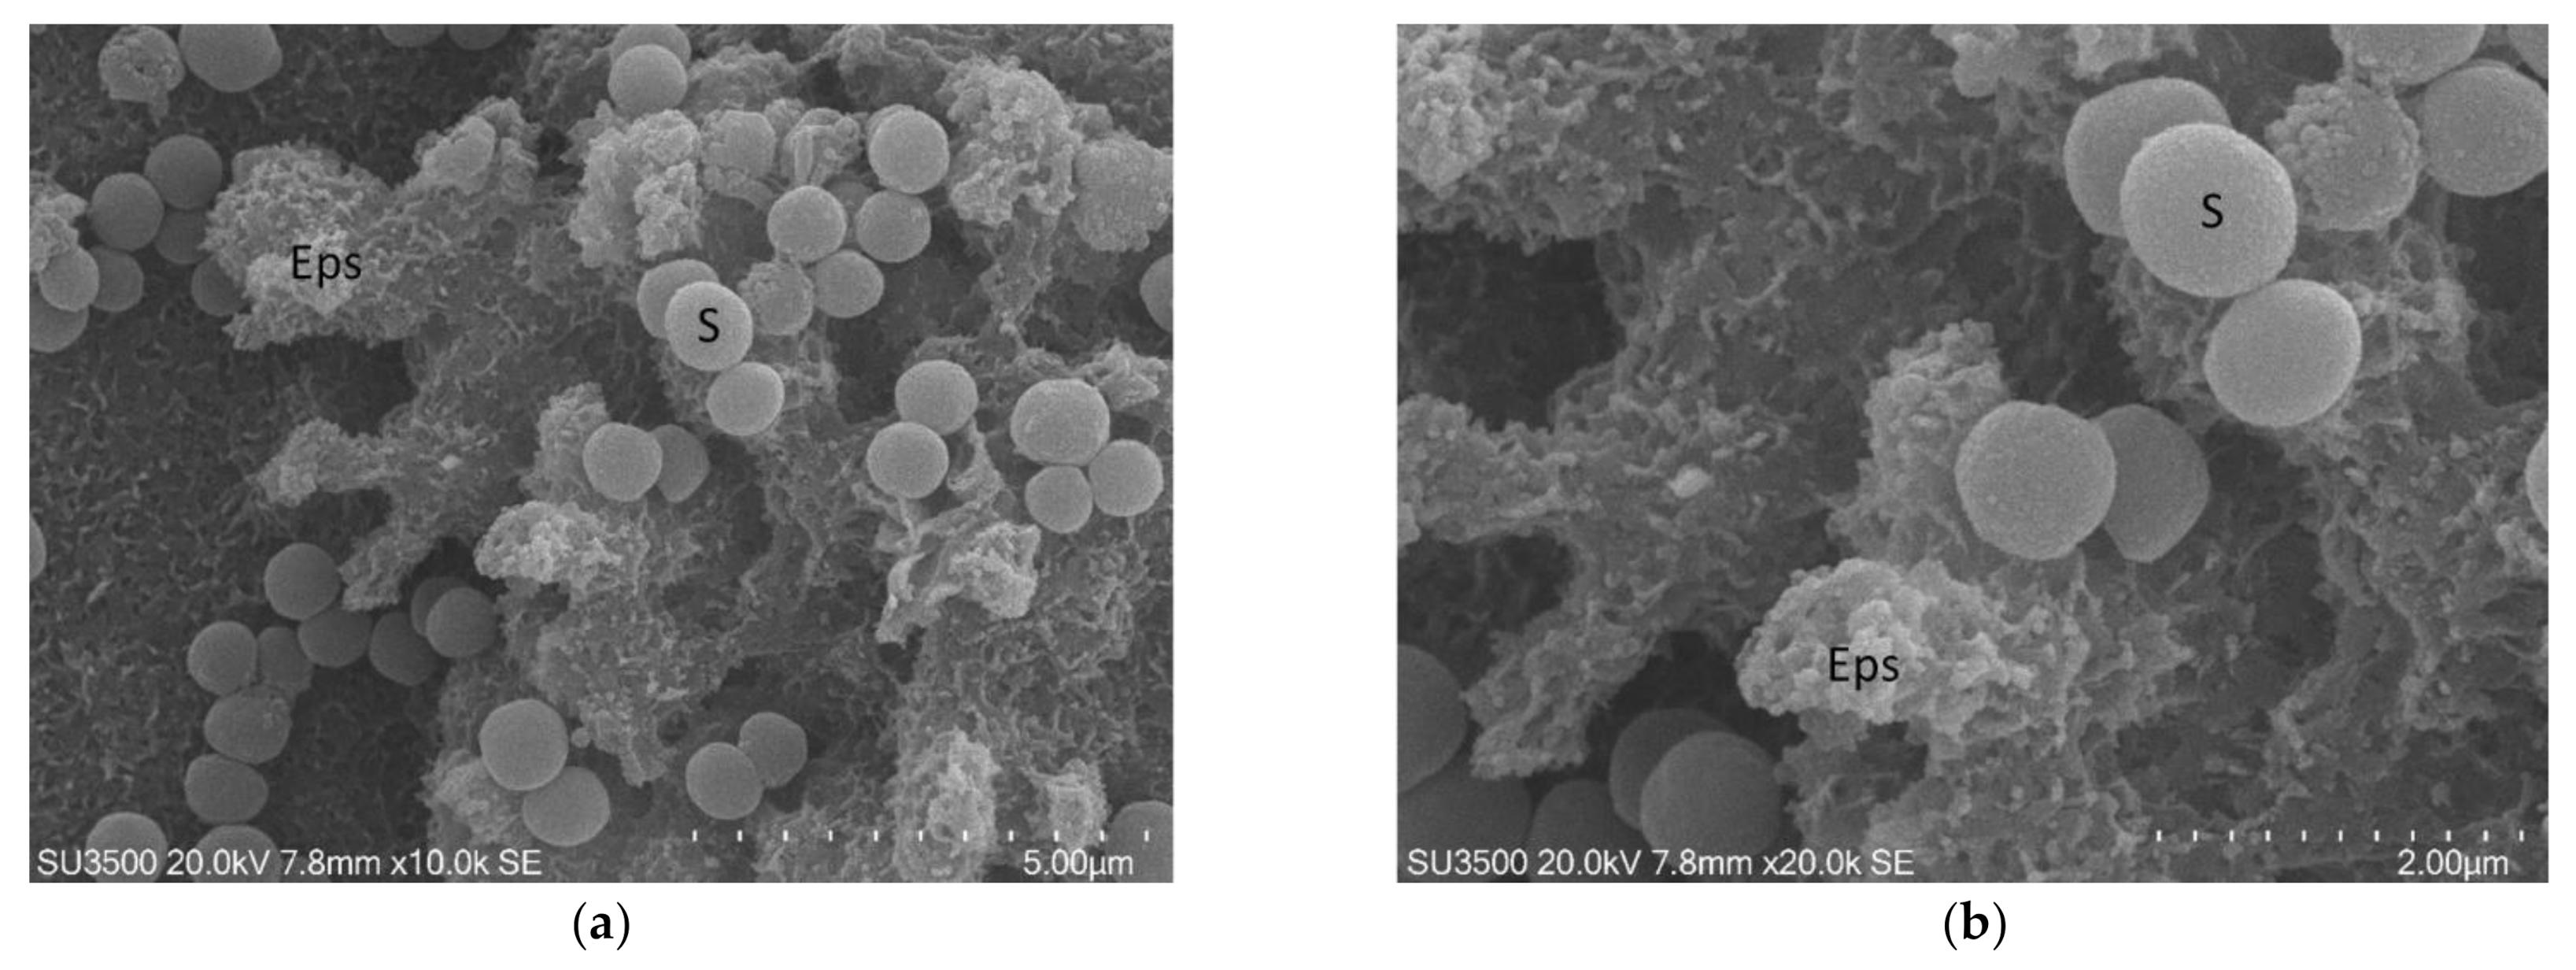
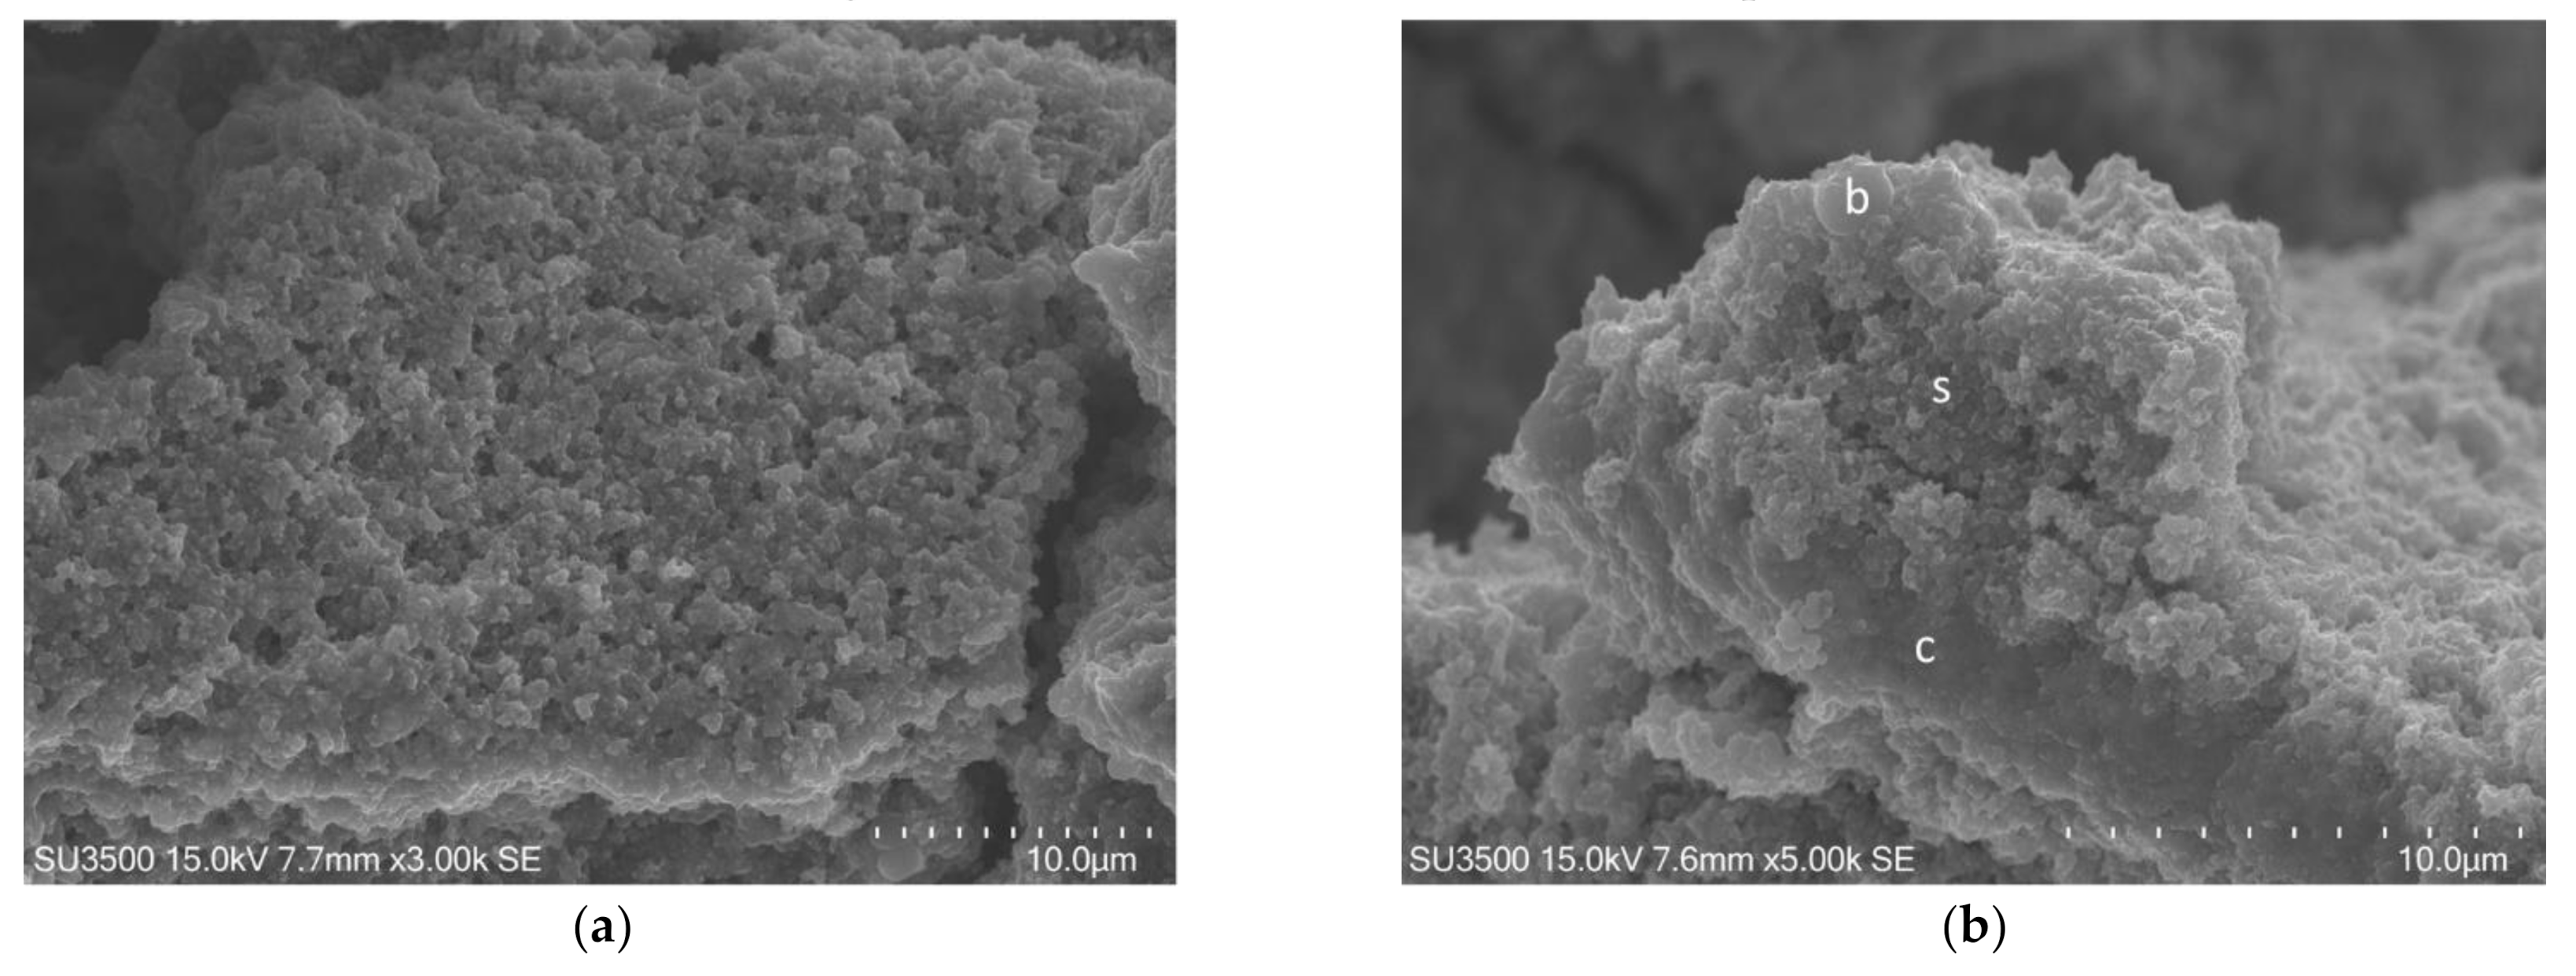
3.3.1. S. mutans Observed by Conventional SEM

The conventional SEM protocol consists of (a) fixation in glutaraldehyde 2.5% in PB pH 7.4 and post-fixation in OsO4 1% solution in H2O; (b) dehydration steps in ascending alcohol series; (c) critical point drying by CO2 substitution; and (d) platinum sputter coating. According to the specific characteristics of the biological sample to be examined, every single step can be modified [99,100,101]. The typical structure of a biofilm is a delicate three-dimensional network, easily damageable during preparation procedures. To avoid network disruption due to ethanol flow during critical point drying, we dried our samples in ascending hexamethyldisilazane (HDMS) series.
The images, as shown in Figure 1 and Figure 2, belong to samples prepared with the conventional SEM protocol. These pictures have high resolution, depth of field, and a wide magnification range. The conventional SEM protocol allowed samples to resist for a long time under high vacuum conditions and the action of an electron beam with 20 kV voltage. Carefully observing the images in Figure 2, captured at magnifications 10 k, the downsides of conventional SEM emerge clearly. The shape of the bacterial cells was irregular, and the Eps looked like a dense and shrunken mass with a rough surface. In samples prepared with this protocol, Eps appeared more as a mass dotted with holes rather than a structure within which an intricate and well-developed micro canalicular system developed.

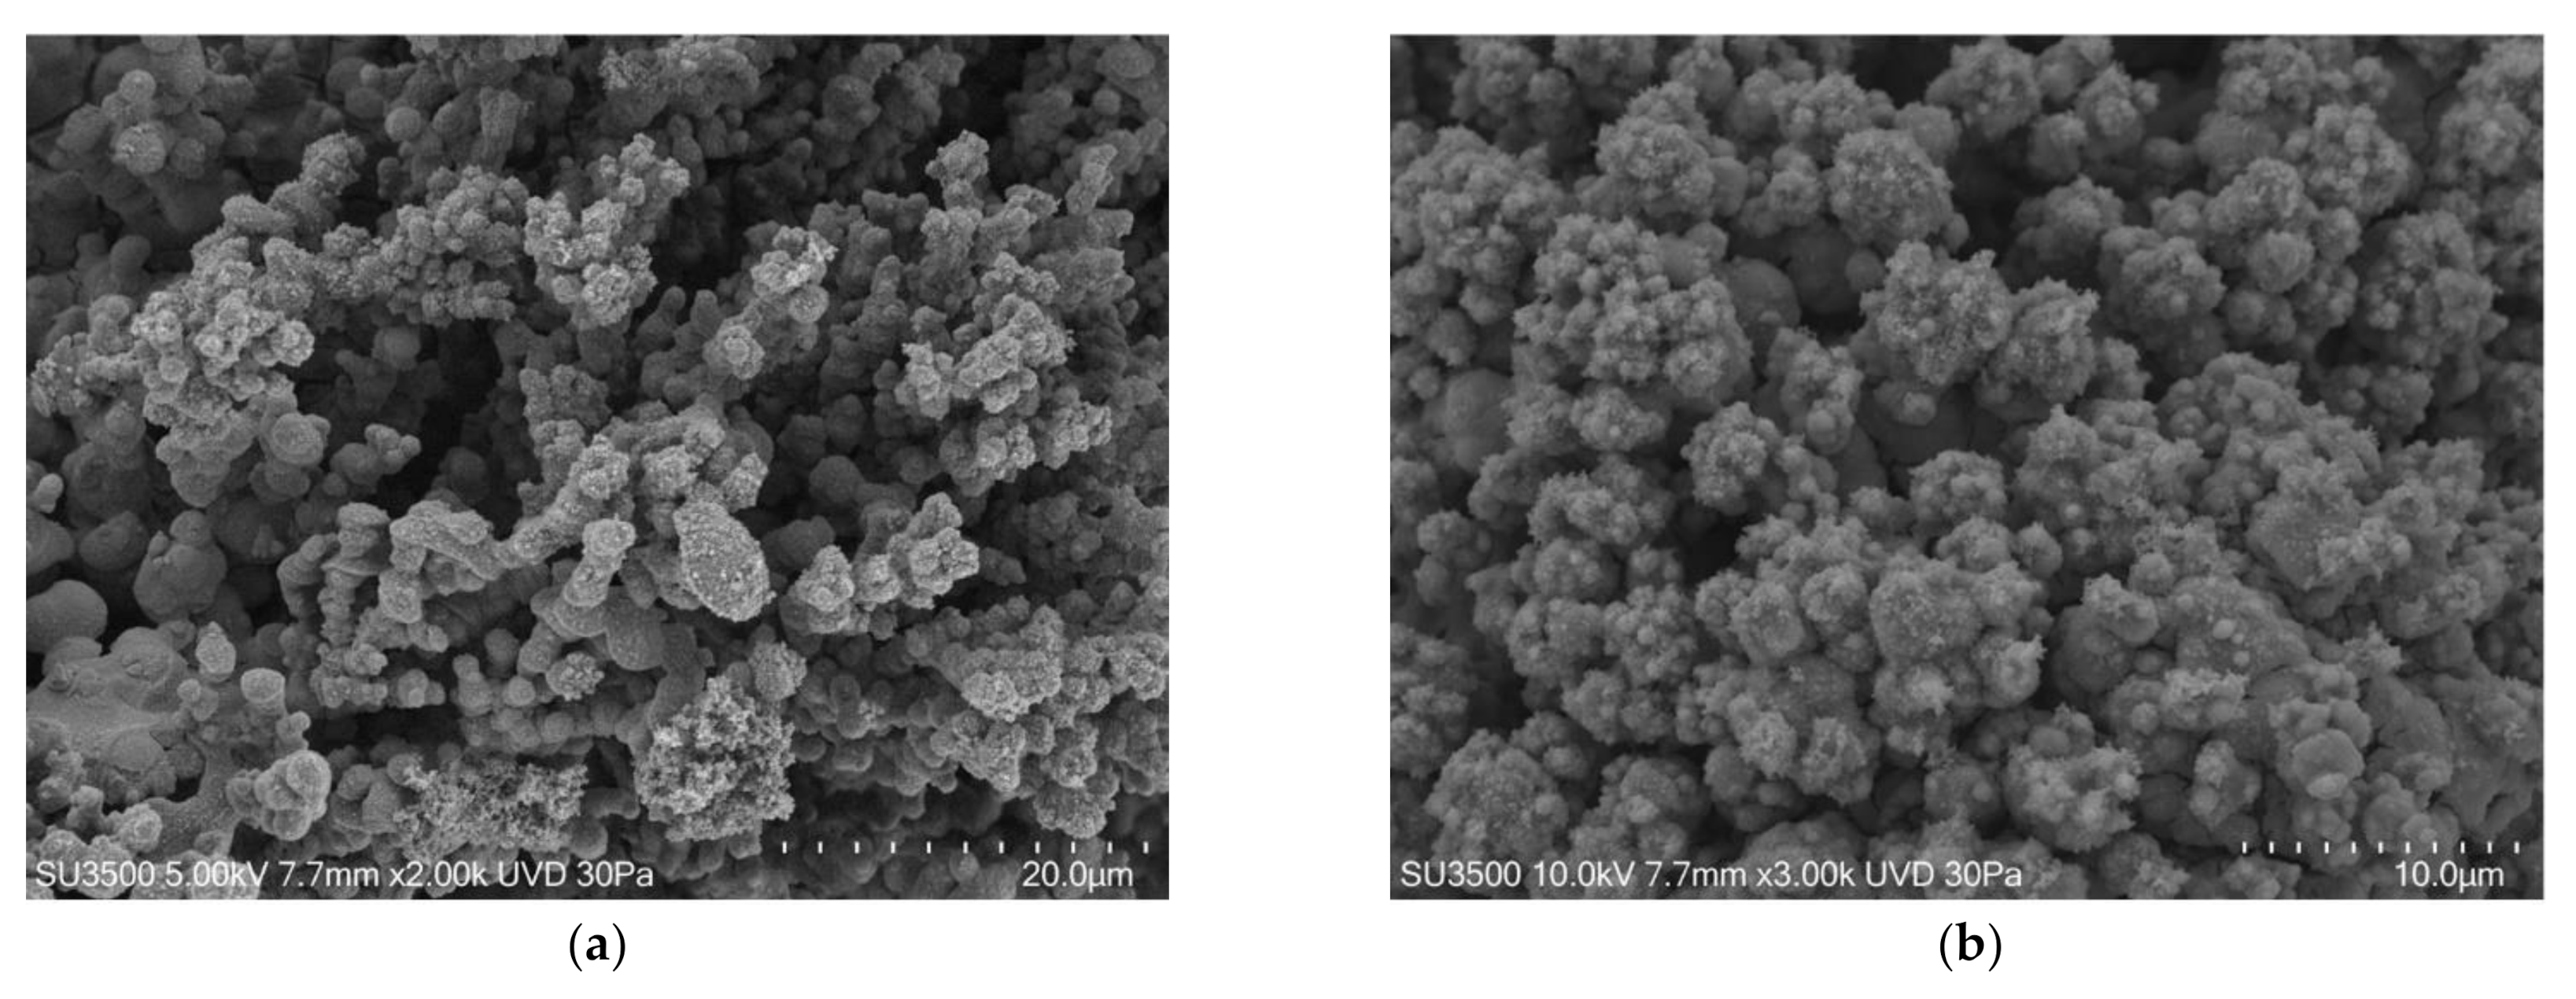
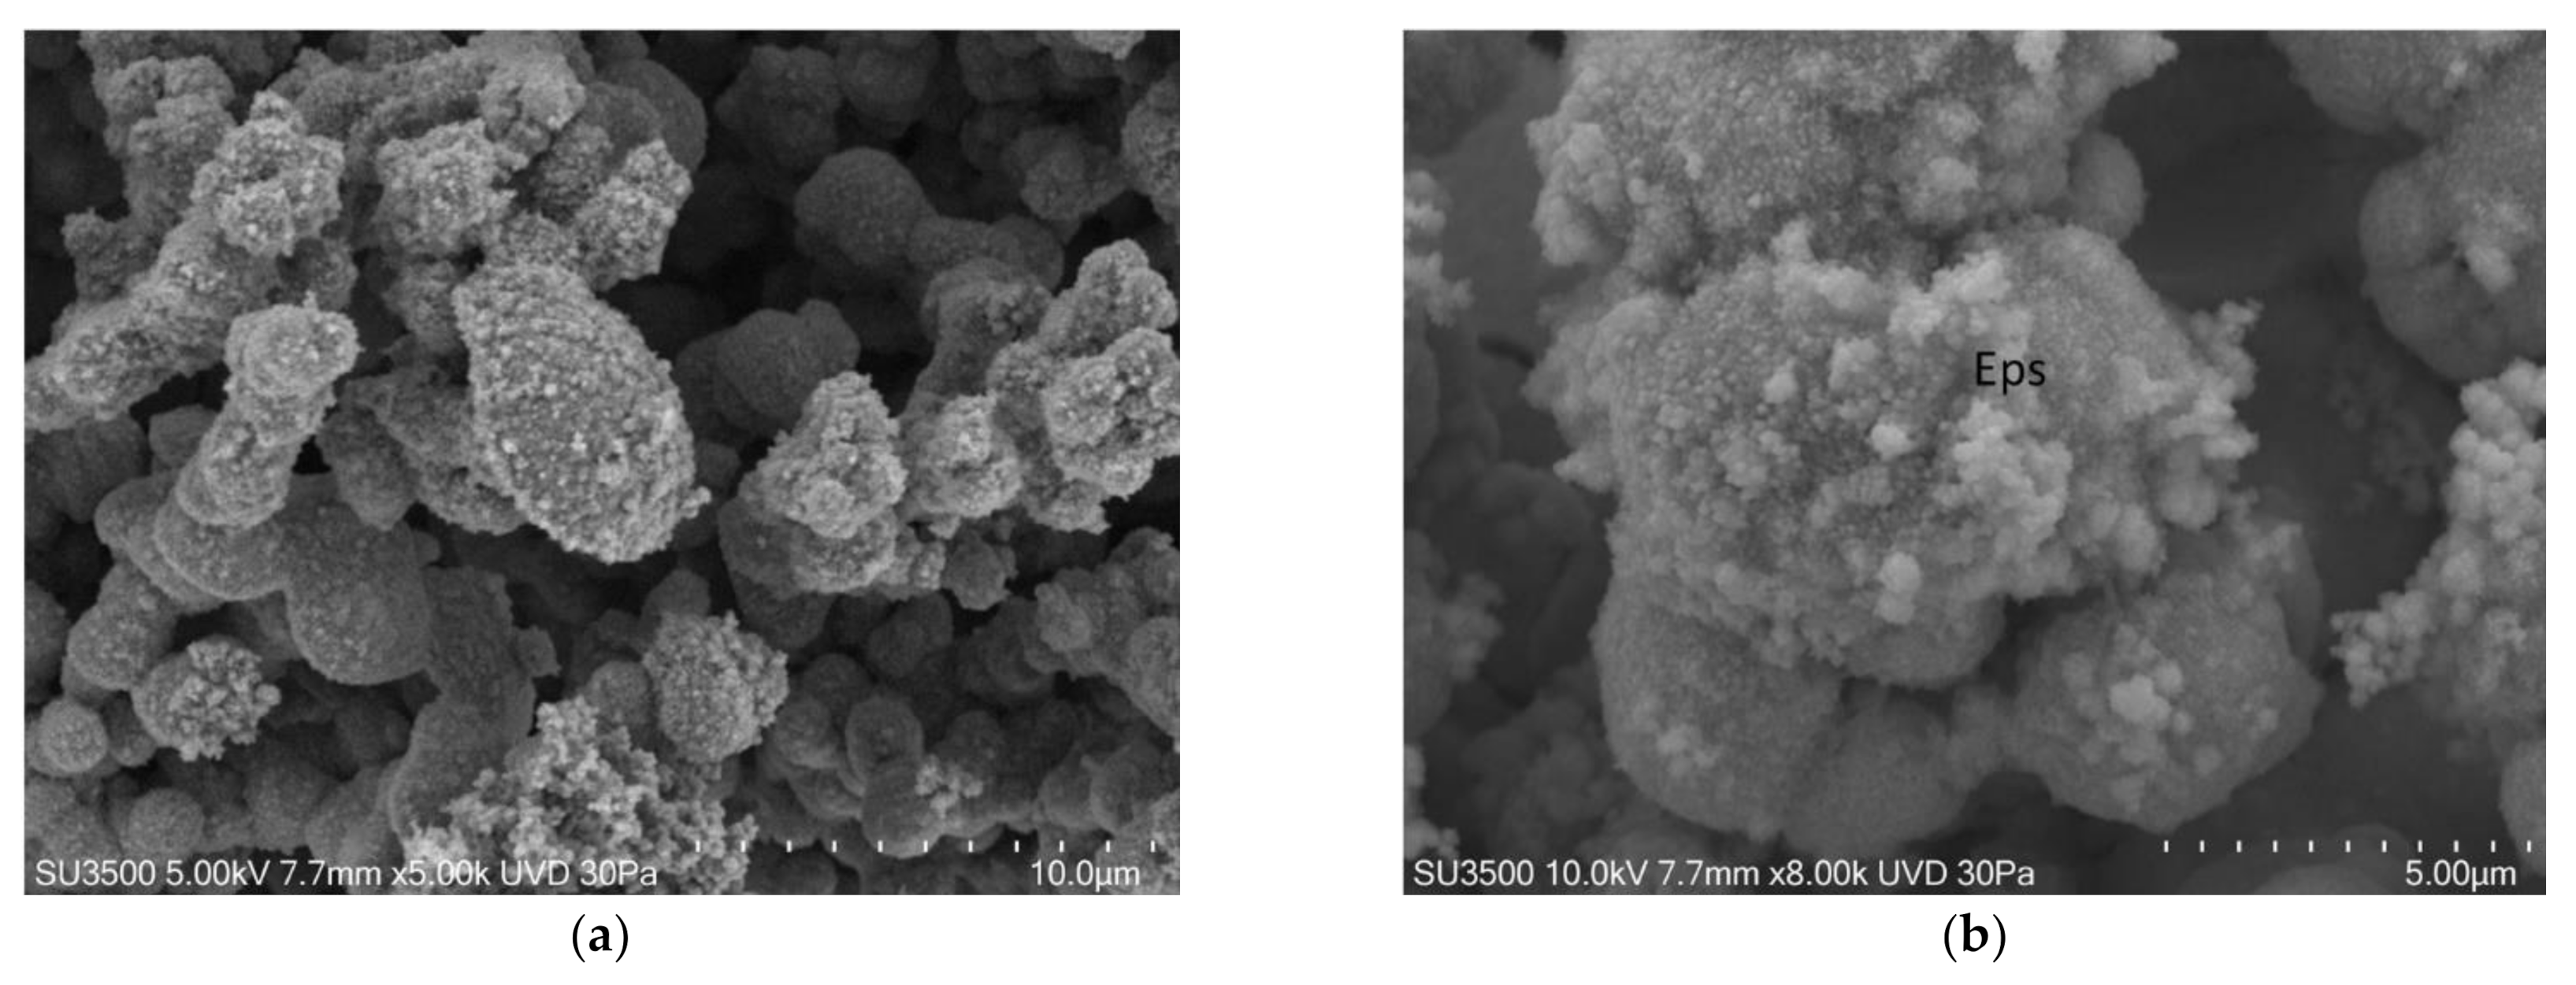
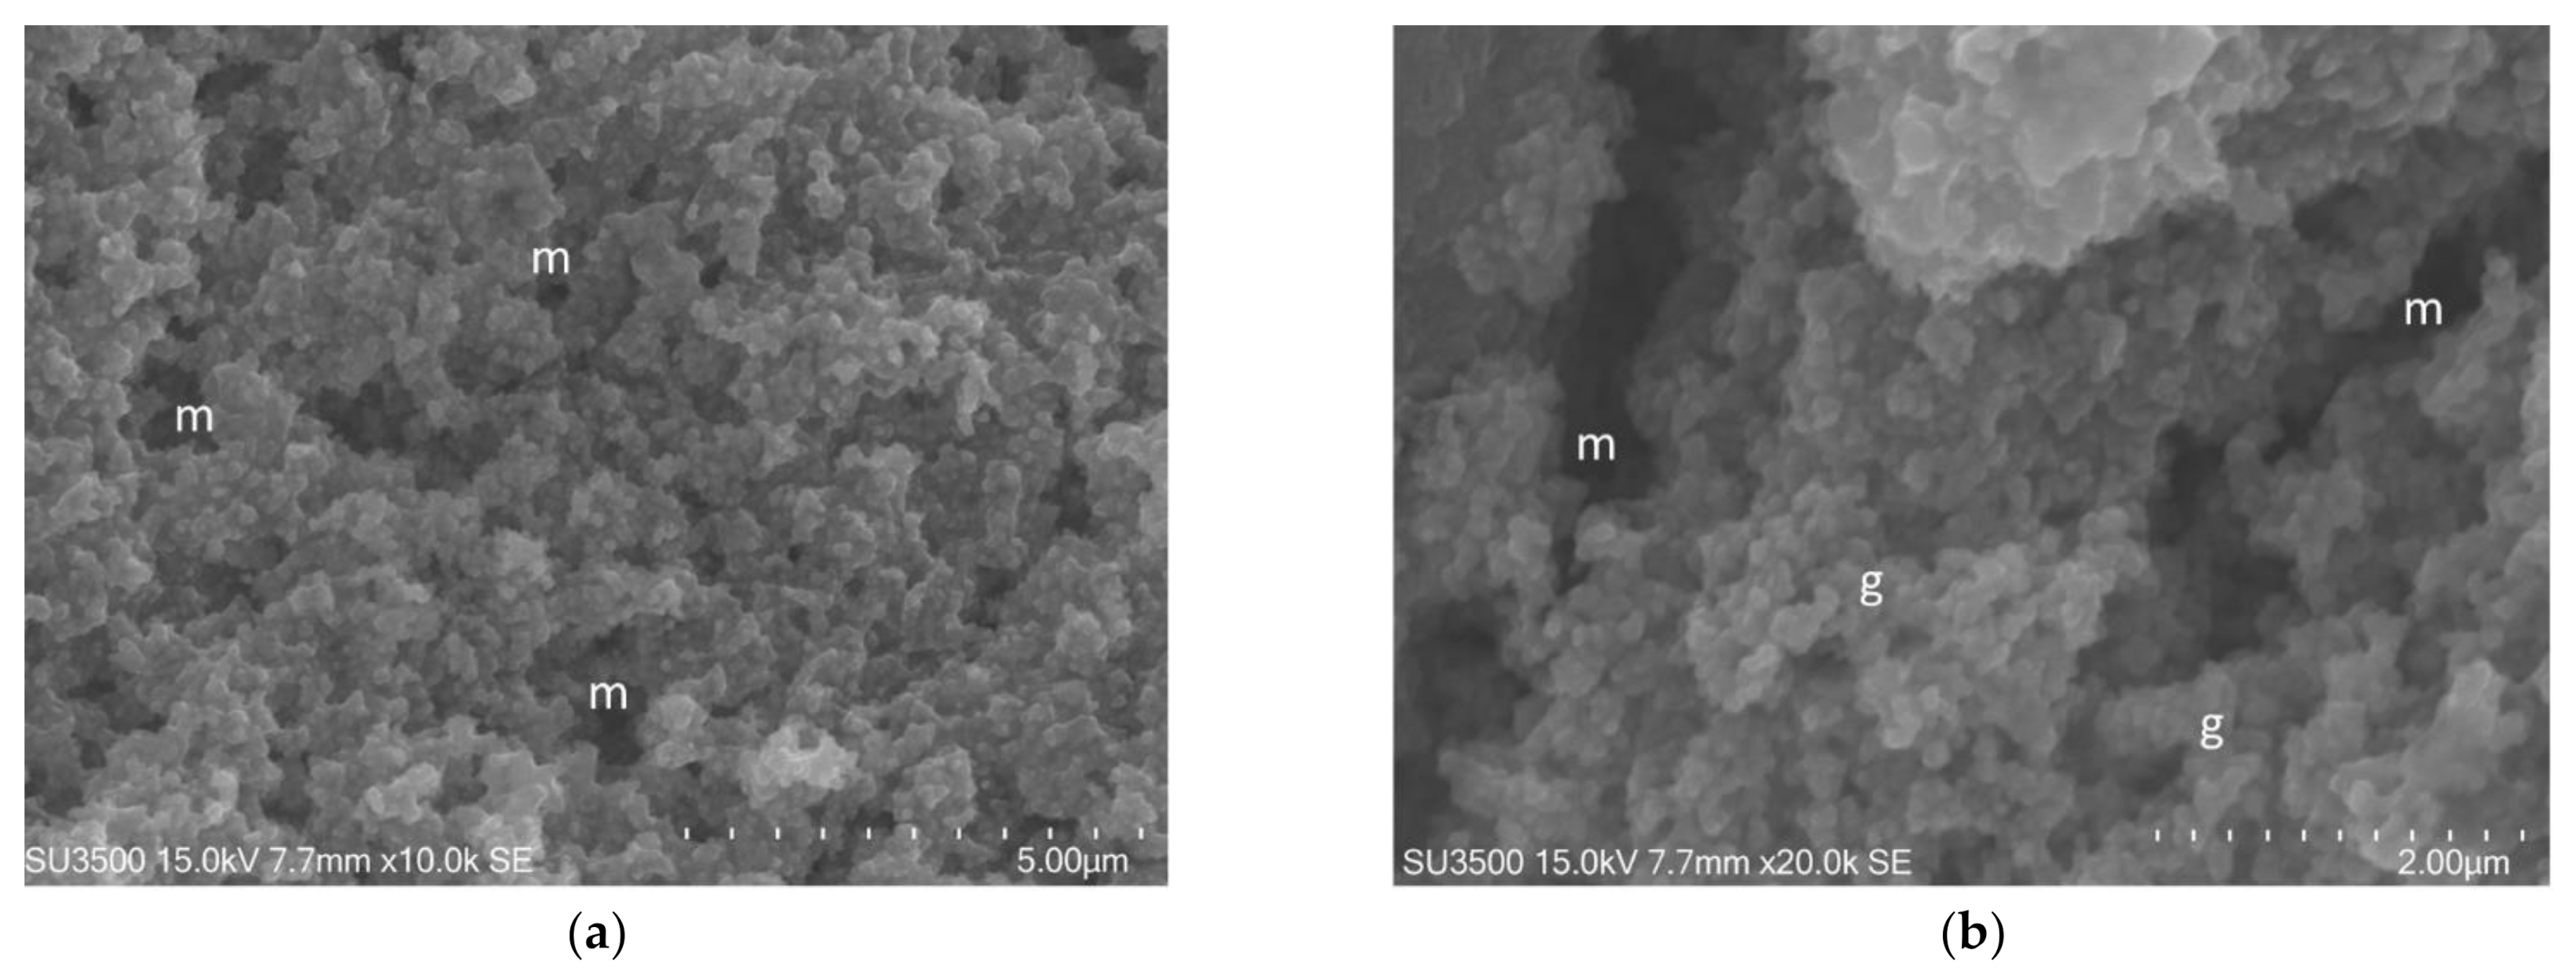
3.3.2. S. mutans Observed by VP-SEM

We can state that using the VP-SEM technique safeguards Eps better than conventional SEM, and the images in Figure 3 clearly show that bacterial towers and the intricate micro-channels system that characterize biofilms had a well-preserved topography. However, Eps appeared in some areas to be compact while in others, it was spongier. Cells were regularly shaped. In Figure 4, the images at higher magnifications showed the fine graininess of freshly secreted Eps components on the bacterial cell surface. Good quality and very informative pictures were obtained up to 10 k, but at higher magnifications, the overall image quality dropped significantly due to signal-to-noise ratio lowering. The resolution of VP-SEM images was lower than the SEM ones, and the sample resistance time at an operating condition of vacuum 30 Pa and electron beam of 5 kV was short (about 1 h before cracking phenomena appearance).

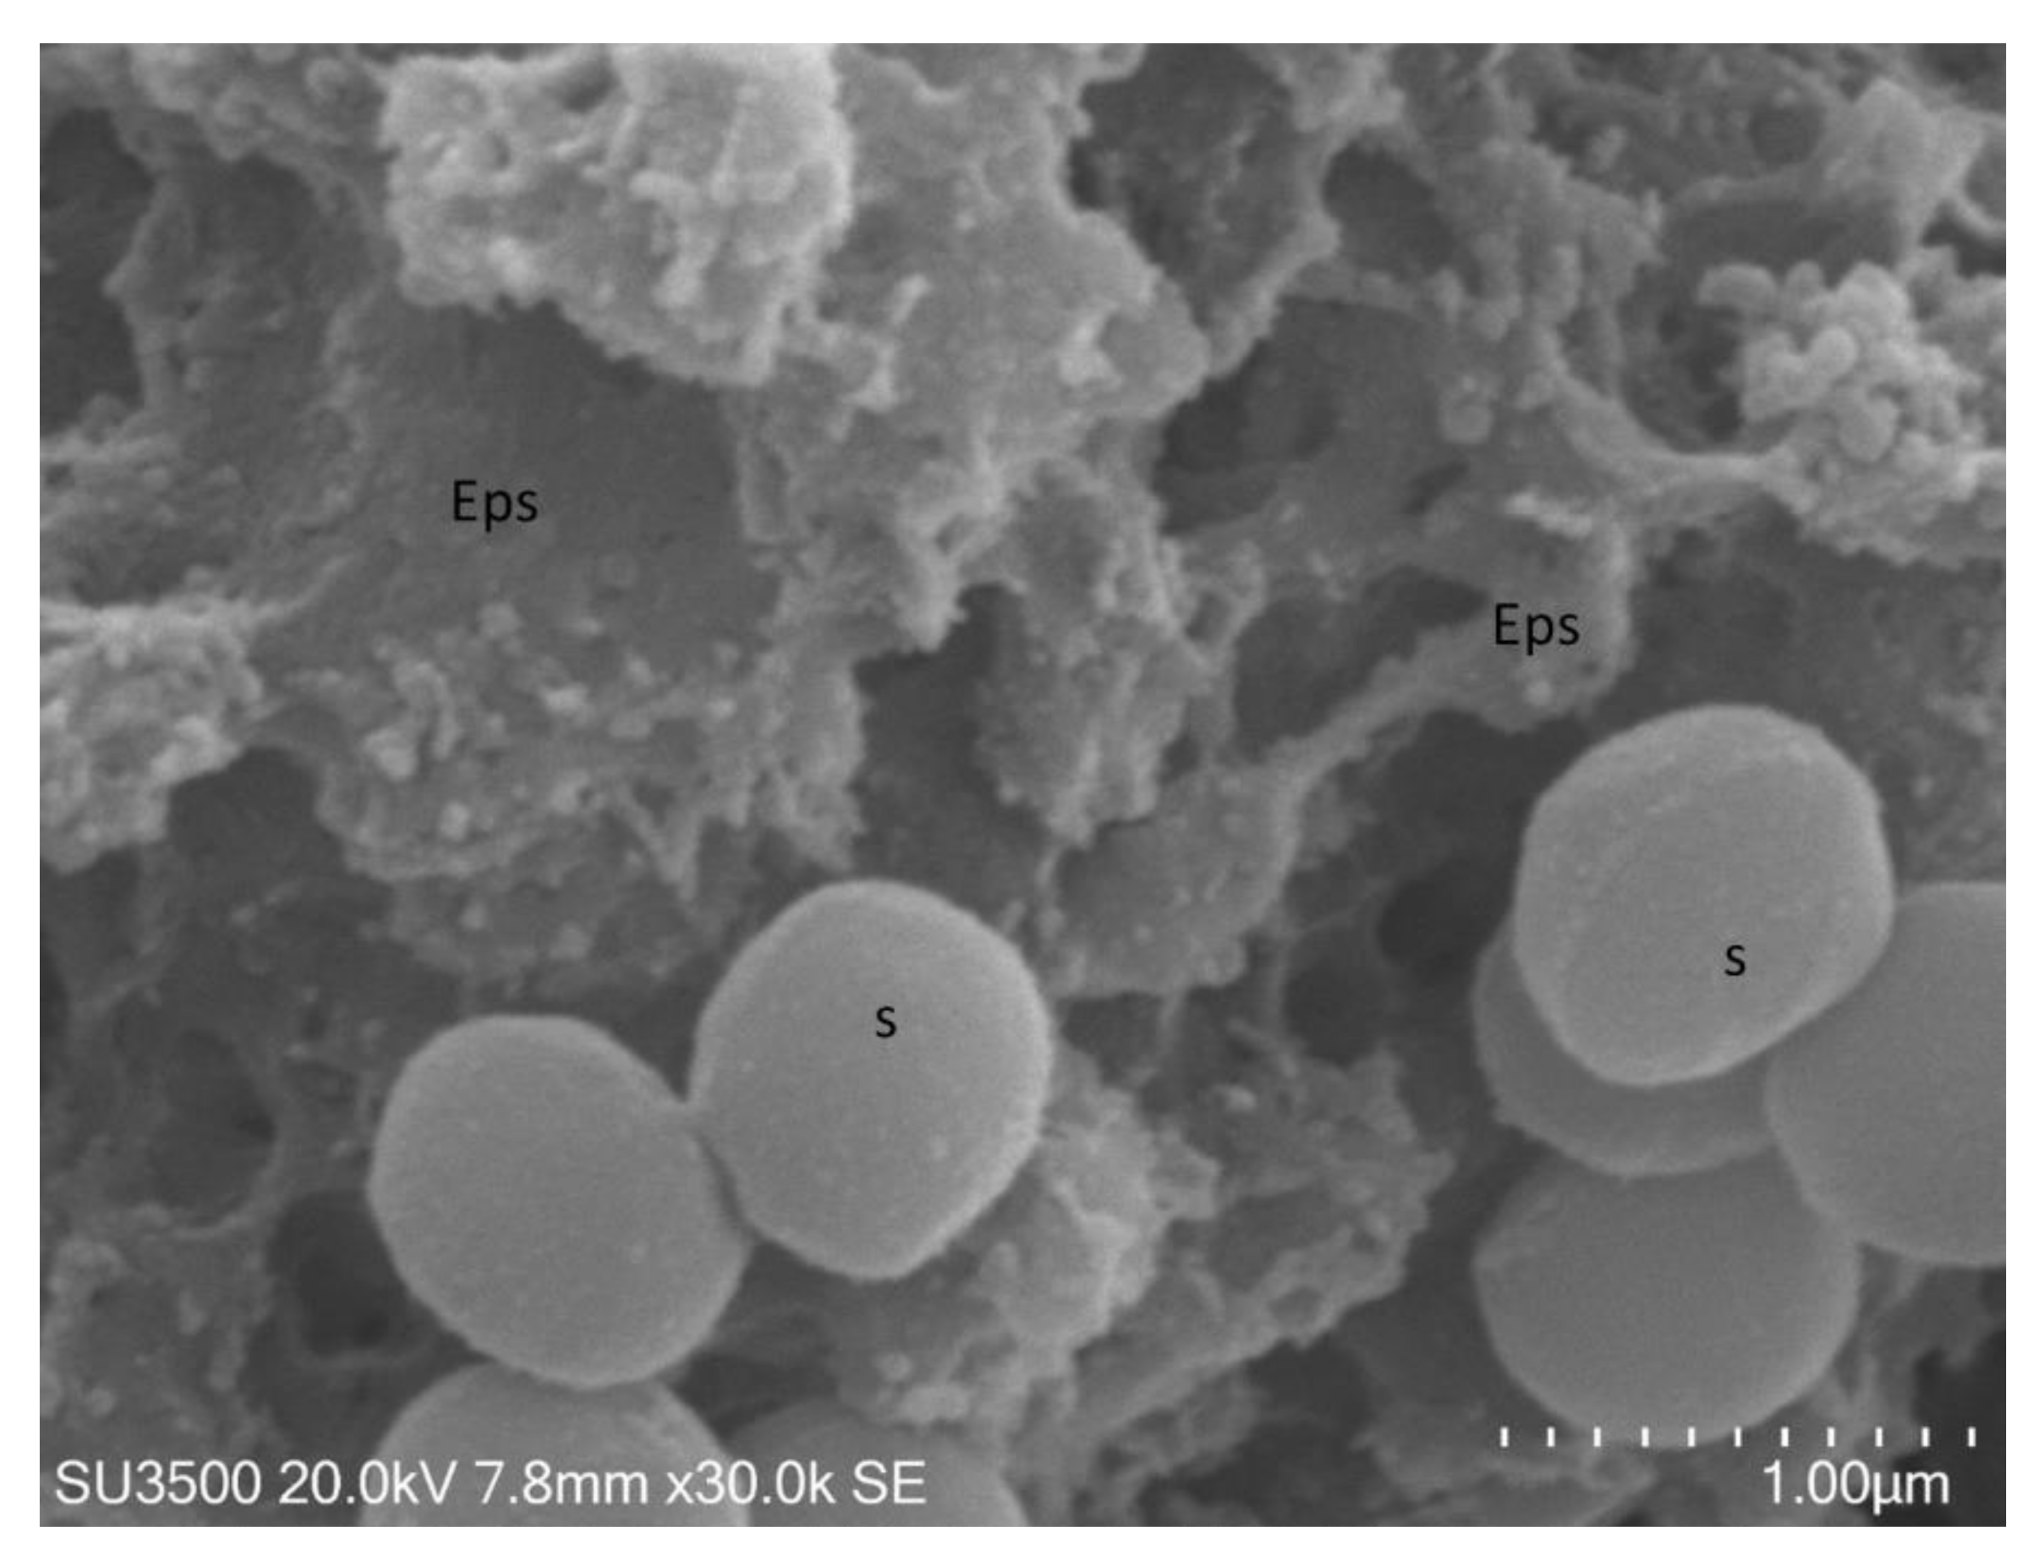
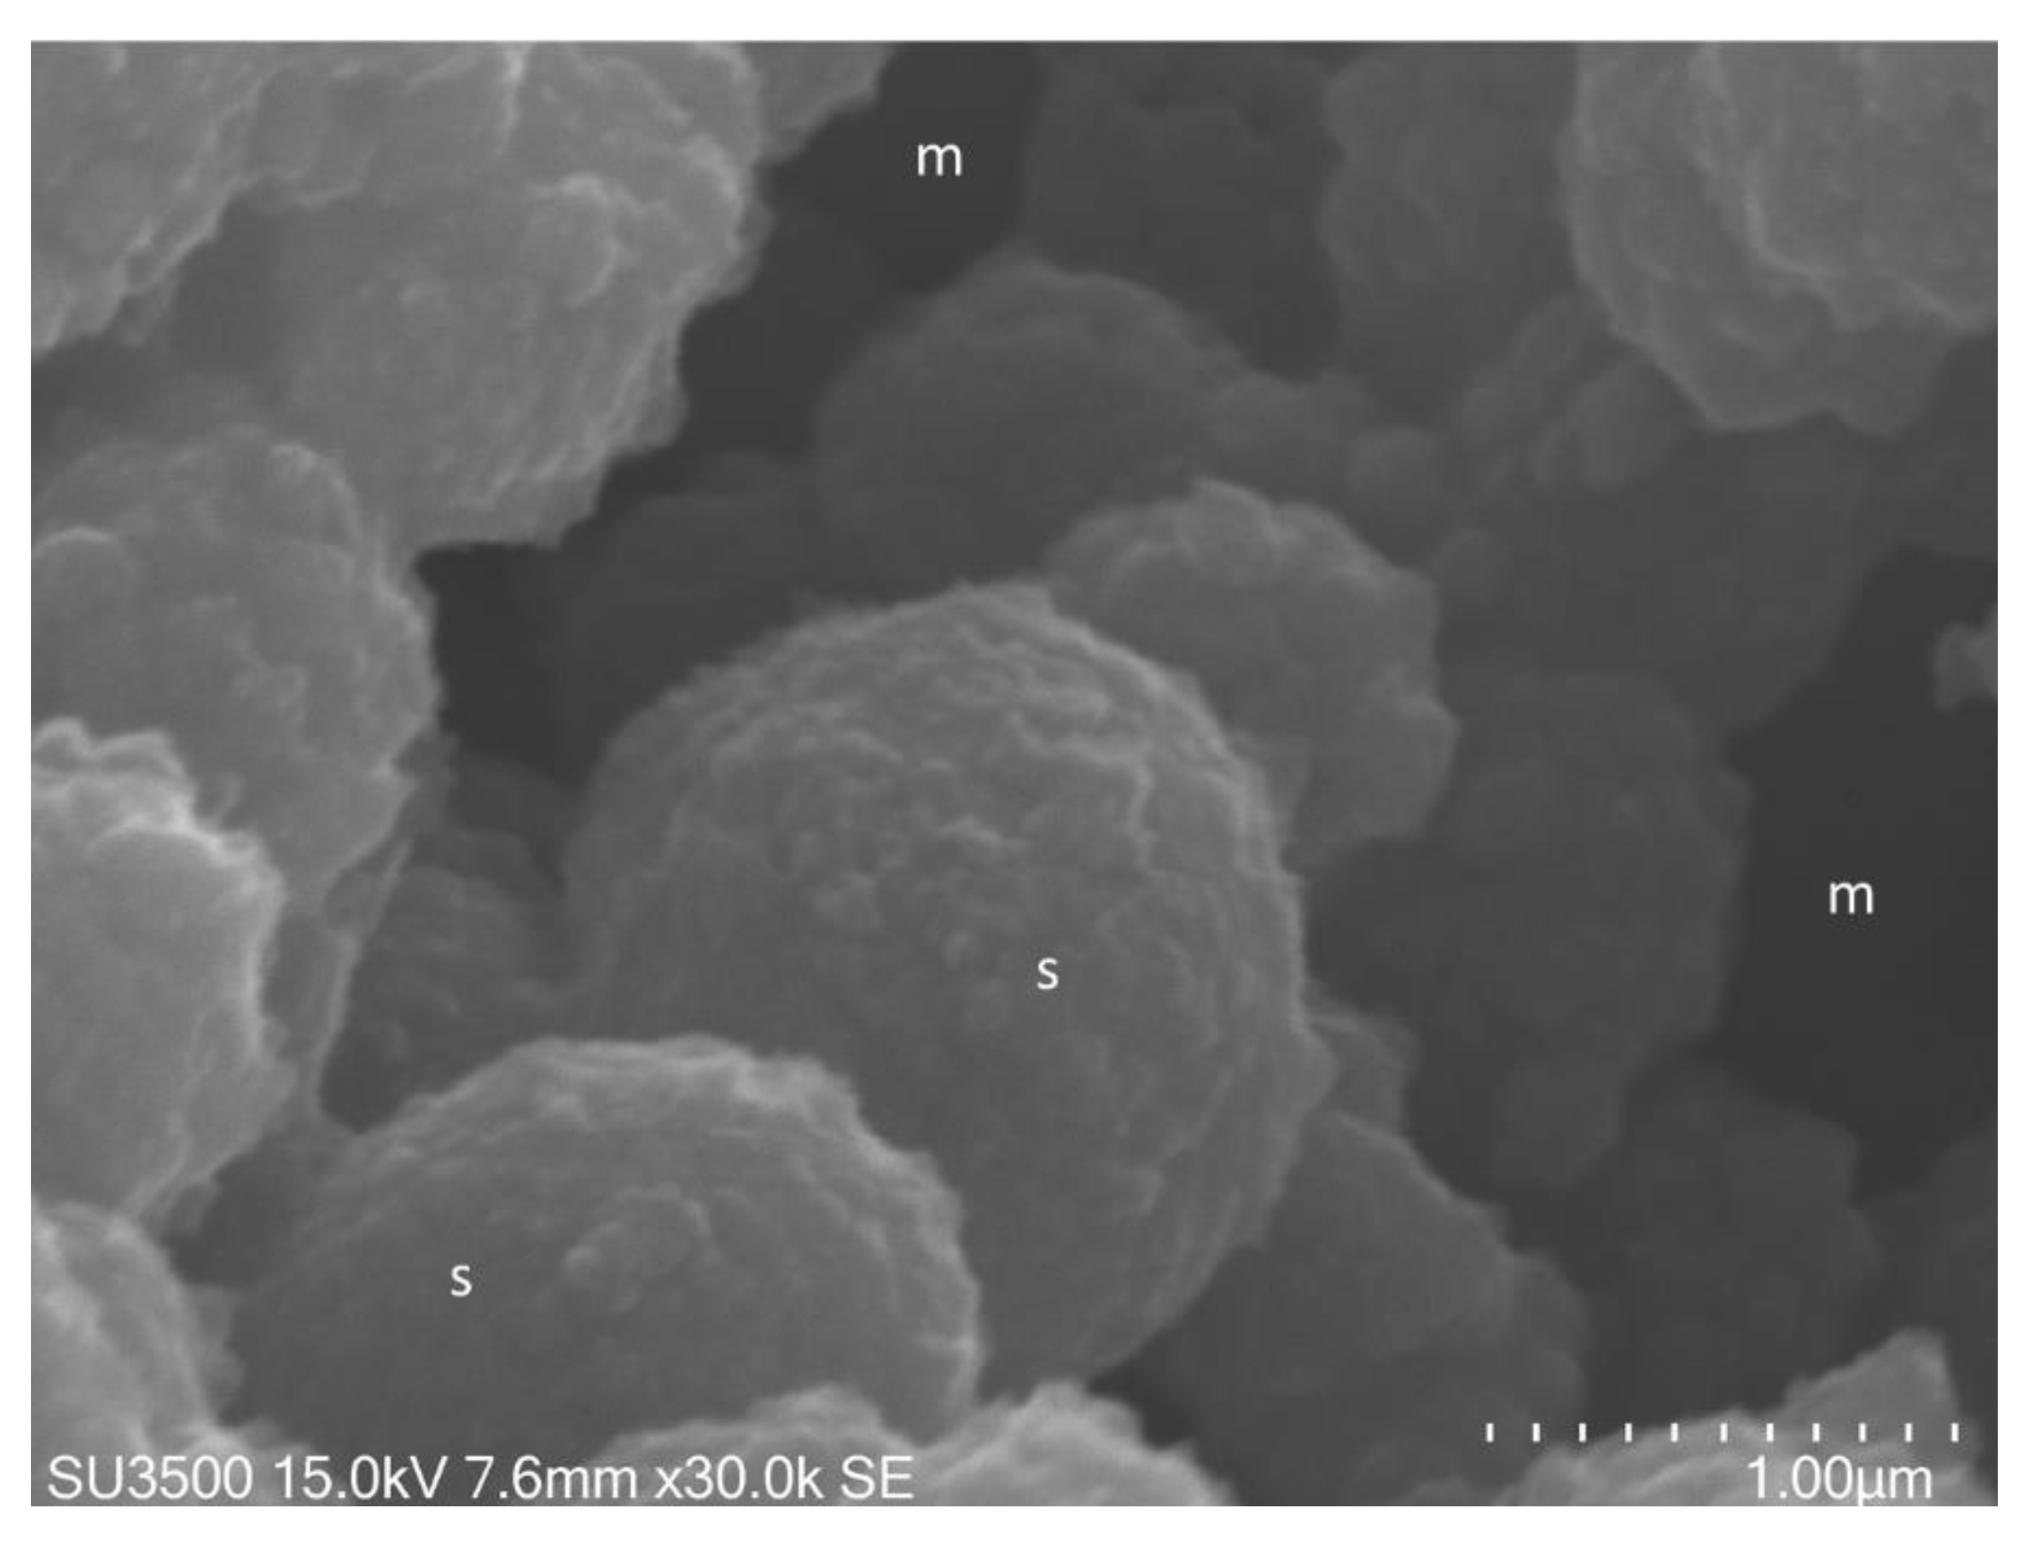
3.3.3. S. mutans OsO4-RR-TA-IL Procedure Observed by SEM (High Vacuum, High Voltage Conditions)

In studies on the effects of drug treatments on biofilm, ultrastructural characterization of the biofilm matrix and its embedded bacterial cells are needed. In such cases, scanning electron microscopy may be the best choice for its high image quality, magnification, and resolution, but only if protocols are carefully customized to allow imaging of a hydrated sample under high vacuum and high voltage conditions. In the paper [50], an innovative protocol (OsO4-RR-TA-IL) was tested. The use of the OsO4-RR solution (Table 2) in a post-fixation step was discussed above [78,79,102,103,104]. Tannic acid impregnation was used to harden Eps and to render the sample itself conductive without the appearance of charging phenomena [89,90,91]. Sputter coating allows only the surface to be conductive, so the combined use of OsO4-RR in the post-fixation step, followed by tannic acid impregnation, improved observation, allowing visualization of the sub-surface structures like bacterial cell embedded in the biofilm matrix [94]. Finally, to maintain the biofilm in a hydrated state, but to observe it under high vacuum and high voltage conditions, ionic liquid drop-casting was used. In Figure 5 and Figure 6, images of S. mutans treated with the OsO4-RR-TA-IL procedure are shown. In Figure 7 and Figure 8, images at very high magnification of S. mutans prepared with conventional SEM procedure (Figure 7) and OsO4-RR-TA-IL method (Figure 8) are shown. The biofilm surface appeared to be compact in some areas and spongy in others (Figure 5a,b), but the overall topography was well preserved. The biofilm matrix was perforated by a developed and intricate system of microchannels (Figure 6a,b). The biofilm topography was perfectly preserved, and even at the nanometric level, Eps appeared as an intricate 3D network in which no sign of deformation was apparent (Figure 6a,b). The shape of the S. mutans cells was smooth and spherical. Bacterial cell emerged from Eps in some areas (Figure 5b), while in others, they were partially embedded in it. In Figure 7 Eps consists in a network of collapsed filaments, in Figure 8 Eps keeps a fine “fluffy cloud” appearance, covering bacterial cell surface. Together with the achievement of high-quality images, the use of the OsO4-RR-TA-IL protocol under 30 k in high vacuum conditions allowed a longer observation time than the VP-SEM protocol.

3.4. Candida Albicans OsO4-RR-TA-IL Procedure Observed at SEM (High Vacuum, High Voltage Conditions)

Not only bacterial biofilms, but also fungal biofilms, were recently investigated [75] by comparing the SEM, FESEM, and VP-SEM techniques and various experimental producers, also considering Ruthenium Red as an ionic liquid. Results in [75] reached comparable results with those in [50]. They stated that VP-SEM is a superb modality when the visualization of the hydrated 3D biofilm structure is the most important, rather than the finest ultrastructural surface features of single cells (or hyphae in A. fumigatus). Thus, when ultrastructural features of cellular and ECM components are desired, high-resolution SEM and FESEM techniques are superior. However, sample preparation parameters should be optimized for any new biofilm sample as the maintenance of the biofilm ultrastructure during SEM analysis is dependent on the sample fixative and fixing time, and drying methods (critical point drying vs. HDMS). In particular, to correctly visualize A. fumigatus biofilms by SEM, the authors of [75] suggested using a short primary fixation time (up to 1 h) with a post-fixation with OsO4 to enhance the staining of lipids and improve the contrast between cells and ECM. Staining with other heavy-metal reagents such as Ruthenium Red and RuO4 may provide more specific contrasting of ECM components. As stated in [50], they also confirmed that sample drying using HDMS was a valuable and rapid alternative to conventional chemical fixation and drying. We tested the OsO4-RR-TA-IL protocol on a Candida albicans biofilm from an ex vivo sample (unpublished results) and also analyzed the images obtained with a four-quadrant method [100] by Hitachi 3D Mountains Map software (Digital surf, France). The use of this protocol allows for the imaging of the finest details of the Candida albicans biofilm, allowing 3D reconstruction and quantification of its actual morphological parameters, measured on the hydrated sample (Figure 9 and Figure 10a,b).

3.5. Pros and Cons of Different SEM Protocols

Different SEM protocols can be used to carry out an ultrastructural characterization of a biofilm. To evaluate the advantages and disadvantages of each protocol, the parameters shown in Table 3 were considered, together with the overall informative value given by image magnification and resolution. In our opinion, OsO4-RR-TA-IL was revealed as the best protocol for the following reasons: (1) it is a fast procedure (timing comparable with that of VP-SEM protocol, despite having more steps than VP-SEM protocol); (2) modest sample loss during preparation procedures; (3) sample hardening, induced by the conductive staining protocol, increased the resistance of Eps to mechanical damage throughout protocol steps; (4) lacking dehydration and drying steps preserves high Eps water content and Eps actual 3-D structure; (5) high-quality images at magnifications up to 30 K are achieved; and (6) sample resists under operating conditions for a long time (even for 2 h in high vacuum conditions). If an ultrastructural characterization of Eps and the bacterial cells of the biofilm has to be carried out, the OsO4-RR-TA-IL protocol has to be preferred over conventional SEM and VP-SEM procedures because it combines the best of both techniques, giving the possibility of achieving images of high quality, at high magnification, and resolution (typical of conventional SEM) in a short time, with a protocol of a few steps, minimal sample loss, and actual sample structure preservation (advantages of VP-SEM).

4. Cryo-SEM

Biofilm cryo-fixation is a fast procedure that allows “frozen in time” specimen observation [105]. A frozen biofilm can be freeze-fractured to expose its inner structure, observe bacterial cell, and their interconnections [64,67]. Cryo-SEM can be associated with high-pressure freezing. Combining these two cutting edge techniques for biofilm analysis allows for a detailed visualization of the relationships among the microbial cells and Eps ultrastructure. An innovative method for the preparation of fully hydrated samples of microbial biofilms (Staphylococcus epidermidis, Candida parapsilosis and Candida albicans) was presented in [106]. Cryo-SEM requires very expensive and highly specialized equipment as well as highly skilled technicians, which is why it has had limited use in biofilm studies. Furthermore, it has lower image resolution compared with conventional SEM and, at high magnifications, the heat generated by the focused electron beam may induce melting and cracking of the frozen surface [64].

5. Environmental Scanning Electron Microscopy (ESEM)

Environmental SEM allows for the observation of biofilms without any pretreatment, thus saving their integrity, as they were in the natural state. The sample is directly put into the microscope chamber, whose pressure values are near the environmental value, instead of the very low-pressure values (high vacuum) of a conventional SEM. Hydrated and non-conductive living bacterial biofilms can be visualized, without dehydration artifacts and loss of mass [64,68]. However, the lack of conductivity lowers resolution, and as the sample is wet, a fast image capture setting is required. The sample can easily be damaged under the focused electron beam when a magnification around 10 kX is reached, as a conductive metal coating is absent.

6. Atmospheric Scanning Electron Microscopy (ASEM)

Atmospheric scanning electron microscopy (ASEM) allows an inverted SEM to observe a wet sample from below, while an OM simultaneously observes it from above [107]. Biofilms can be cultured, fixed, and imaged in the specialized sample dish (ASEM dish) at atmospheric pressure [108,109]. ASEM, using 30 kV acceleration voltage, allows observation of 2–3 μ m-thick biofilms with 8 nm resolution. An important advantage is that time-consuming sample protocols (usually required for immuno-EM) are not required for immuno-ASEM [108,110]. Additionally, in this technique, heavy metal stains should apply to thick biofilms. In [111], the ability of osmic acid (OA), uranyl acetate (UA), and lead citrate (LC) was tested to stain 24-h biofilms of a clinically isolated strain of methicillin-resistant S. aureus. ASEM imaging at 30 kV revealed that sequential staining with OA, UA, and LC drastically improved image contrast. Using this method, biofilm development was visualized over an aqueous environment, revealing that bacterial cells did not align near each other at the bottom of biofilms, but that there were cell-free regions, probably so-called water channels. Thus, imaging of bacterial behavior in multicellular biofilms in liquid state, can be achieved by atmospheric scanning electron microscopy.

7. Focused Ion Beam-SEM (FIB-SEM)

Focused ion beam-SEM is a cutting-edge sophisticated technique for the subsurface structure of biofilm imaging. A standard SEM viewing is coupled with FIB milling to obtain 3-D reconstructions by a process termed “slice and view”. The image slices obtained in succession are then stacked by software to reconstruct the 3-D volume [64,112]. Focused-ion-beam (FIB) tomography was used in [112] to study the morphology of early-stage biofilms of S. aureus grown on different surfaces to evaluate the role of stress-induced membrane thinning in the planktonic-to-biofilm transition associated with bacterial adhesion. The resolution afforded by FIB allowed changes to be revealed in the cell-envelope thickness, thus relating them with planktonic-to-biofilm transition. Reducing bacterial growth on implant materials is a challenging purpose, and recently, nanostructures that cause contact-dependent cell death by mechanical rupture of bacterial cell membranes were tested on S. epidermidis [113]. Using FIB-SEM and CLFM, recalcitrance toward Staphylococcus epidermidis biofilm formation by the nanostructured titanium surfaces was demonstrated.

8. Conclusions

The ultrastructural characterization of a biofilm can be carried out by different microscopy methods, however, SEM methods provide the most detailed images at the highest magnifications. Each protocol has its advantages and disadvantages. When high-resolution images, reflecting the actual biofilm ultrastructure, are needed, it is not mandatory the conventional SEM, but an innovative protocol (OsO4-RR-TA-IL) is suggested. Using this protocol, the biofilm extracellular matrix becomes conductive and resistant under the electron beam, allowing subsurface structure characterization and observation of bacterial cells as if they were embedded in the matrix. Avoiding dehydration and drying, Eps showed off its actual three-dimensional structure. The combination of innovative SEM protocols with 3-D image analysis software allows for a quantitative evaluation of the 3-D ultrastructure biofilm matrix. In this way, a morphological evaluation takes on the same value as other analytical methods and can be used to compare differences between several anti-biofilm treatments.

Author Contributions

Conceptualization, M.R. and G.F.; Methodology, O.D.; Software, M.R.; validation, M.T., X.L., and R.C.; Formal analysis, O.D.; Investigation, M.R., R.P., M.A., and L.S.; Resources, M.A., R.P., and L.S.; Data curation, O.D.; Writing—original draft preparation, M.R.; Writing—review and editing, M.R., G.F., O.D., M.T., X.L., R.C.; M.A., R.P., and L.S.; Visualization, M.T.; Supervision, L.S. and G.F.; Project administration, G.F.; funding acquisition, M.R. and G.F. All authors have read and agreed to the published version of the manuscript.

Funding

This research was funded by grant from the Italian Ministry of Foreign Affairs and International Cooperation PGR01023 CUP B84I20001860005; Sapienza University grant.

Institutional Review Board Statement

Not applicable.

Informed Consent Statement

Not applicable.

Data Availability Statement

The data presented in this study are available on request from the corresponding author.

Acknowledgments

Special thanks are due to Ezio Battaglione for his skillful technical assistance.

Conflicts of Interest

The authors declare no conflict of interest.

References

  1. Costerton, J.W.; Geesey, G.G.; Cheng, K.-J. How Bacteria Stick. Sci. Am. 1978, 238, 86–95. [Google Scholar] [CrossRef] [PubMed]
  2. Costerton, J.W.; Lewandowski, Z.; Caldwell, D.E.; Korber, D.R.; Lappin-Scott, H.M. Microbial Biofilms. Annu. Rev. Microbiol. 1995, 49, 711–745. [Google Scholar] [CrossRef] [PubMed]
  3. Kolenbrander, P.E. Oral Microbial Communities: Biofilms, Interactions, and Genetic Systems. Annu. Rev. Microbiol. 2000, 54, 413–437. [Google Scholar] [CrossRef] [PubMed]
  4. Shapiro, J.A. Thinking about bacterial populations as multicellular organisms. Annu. Rev. Microbiol. 1998, 52, 81–104. [Google Scholar] [CrossRef] [Green Version]
  5. Di Martino, P. Extracellular polymeric substances, a key element in understanding biofilm phenotype. AIMS Microbiol. 2018, 4, 274–288. [Google Scholar] [CrossRef]
  6. Karygianni, L.; Ren, Z.; Koo, H.; Thurnheer, T. Biofilm Matrixome: Extracellular Components in Structured Microbial Communities. Trends Microbiol. 2020, 28, 668–681. [Google Scholar] [CrossRef]
  7. Yadav, M.K.; Song, J.-J.; Singh, B.P.; Vidal, J.E. Chapter 1—Microbial biofilms and human disease: A concise review. In New and Future Developments in Microbial-l Biotechnology and Bioengineering; Current Research and Future Trends in Microbial Biofilms; Yadav, M.K., Singh, B.P., Eds.; Elsevier: Amsterdam, The Netherlands, 2020; pp. 1–13. [Google Scholar]
  8. Suetens, C.; Latour, K.; Kärki, T.; Ricchizzi, E.; Kinross, P.; Moro, M.L.; Jans, B.; Hopkins, S.; Hansen, S.; Lyytikäinen, O.; et al. Prevalence of healthcare-associated infections, estimated incidence and composite antimicrobial resistance index in acute care hospitals and long-term care facilities: Results from two European point prevalence surveys, 2016 to 2017. Eurosurveillance 2018, 23, 1800516. [Google Scholar] [CrossRef] [Green Version]
  9. Breidenstein, E.B.; De La Fuente-Nunez, C.; Hancock, R.E. Pseudomonas aeruginosa: All roads lead to resistance. Trends Microbiol. 2011, 19, 419–426. [Google Scholar] [CrossRef]
  10. Vestby, L.K.; Grønseth, T.; Simm, R.; Nesse, L.L. Bacterial Biofilm and its Role in the Pathogenesis of Disease. Antibiotics 2020, 9, 59. [Google Scholar] [CrossRef] [Green Version]
  11. Li, Y.; Xiao, P.; Wang, Y.; Hao, Y. Mechanisms and Control Measures of Mature Biofilm Resistance to Antimicrobial Agents in the Clinical Context. ACS Omega 2020, 5, 22684–22690. [Google Scholar] [CrossRef]
  12. Papa, R.; Garzoli, S.; Vrenna, G.; Sabatino, M.; Sapienza, F.; Relucenti, M.; Donfrancesco, O.; Fiscarelli, E.V.; Artini, M.; Selan, L.; et al. Essential Oils Biofilm Modulation Activity, Chemical and Machine Learning Analysis. Application on Staphylococcus aureus Isolates from Cystic Fibrosis Patients. Int. J. Mol. Sci. 2020, 21, 9258. [Google Scholar] [CrossRef] [PubMed]
  13. Hong, S.D.; Dhong, H.-J.; Chung, S.-K.; Kim, H.Y.; Park, J.; Ha, S.Y. Hematoxylin and Eosin Staining for Detecting Biofilms: Practical and Cost-Effective Methods for Predicting Worse Outcomes After Endoscopic Sinus Surgery. Clin. Exp. Otorhinolaryngol. 2014, 7, 193–197. [Google Scholar] [CrossRef] [PubMed]
  14. Bulut, F.; Meric, F.; Yorgancilar, E.; Nergiz, Y.; Akkus, M.; Nergiz, S.; Nasir, Y. Effects of N-acetyl-cysteine and acetylsalicylic acid on the tonsil bacterial biofilm tissues by light and electron microscopy. Eur. Rev. Med. Pharmacol. Sci. 2014, 18, 3720–3725. [Google Scholar] [PubMed]
  15. De Carvalho, C.C.C.R.; Da Fonseca, M.M.R.; Da Fonseca, M.M.R. Assessment of three-dimensional biofilm structure using an optical microscope. BioTechniques 2007, 42, 616–620. [Google Scholar] [CrossRef] [Green Version]
  16. Richardson, N.; Mordan, N.J.; Figueiredo, J.A.P.; Ng, Y.; Gulabivala, K. Microflora in teeth associated with apical periodontitis: A methodological observational study comparing two protocols and three microscopy techniques. Int. Endod. J. 2009, 42, 908–921. [Google Scholar] [CrossRef]
  17. Klausen, M.; Heydorn, A.; Ragas, P.; Lambertsen, L.; Aaes-Jørgensen, A.; Molin, S.; Tolker-Nielsen, T. Biofilm formation by Pseudomonas aeruginosa wild type, flagella and type IV pili mutants. Mol. Microbiol. 2003, 48, 1511–1524. [Google Scholar] [CrossRef]
  18. Bridier, A.; Dubois-Brissonnet, F.; Boubetra, A.; Thomas, V.; Briandet, R. The biofilm architecture of sixty opportunistic pathogens deciphered using a high throughput CLSM method. J. Microbiol. Methods 2010, 82, 64–70. [Google Scholar] [CrossRef]
  19. Guilbaud, M.; Piveteau, P.; Desvaux, M.; Brisse, S.; Briandet, R. Exploring the Diversity of Listeria monocytogenes Biofilm Architecture by High-Throughput Confocal Laser Scanning Microscopy and the Predominance of the Honeycomb-Like Morphotype. Appl. Environ. Microbiol. 2014, 81, 1813–1819. [Google Scholar] [CrossRef] [Green Version]
  20. Sun, L.; Liao, K.; Wang, D. Effects of Magnolol and Honokiol on Adhesion, Yeast-Hyphal Transition, and Formation of Biofilm by Candida albicans. PLoS ONE 2015, 10, e0117695. [Google Scholar] [CrossRef] [Green Version]
  21. Villacorte, L.O.; Ekowati, Y.; Neu, T.R.; Kleijn, J.M.; Winters, H.; Amy, G.; Schippers, J.; Kennedy, M. Characterisation of algal organic matter produced by bloom-forming marine and freshwater algae. Water Res. 2015, 73, 216–230. [Google Scholar] [CrossRef]
  22. Thornton, R.B.; Rigby, P.J.; Wiertsema, S.P.; Filion, P.; Langlands, J.; Coates, H.; Vijayasekaran, S.; Keil, A.D.; Richmond, P.C. Multi-species bacterial biofilm and intracellular infection in otitis media. BMC Pediatr. 2011, 11, 94. [Google Scholar] [CrossRef] [PubMed] [Green Version]
  23. Bridier, A.; Briandet, R.; Bouchez, T.; Jabot, F. A model-based approach to detect interspecific interactions during biofilm development. Biofouling 2014, 30, 761–771. [Google Scholar] [CrossRef] [PubMed]
  24. Bridier, A.; Sanchez-Vizuete, M.D.P.; Le Coq, D.; Aymerich, S.; Meylheuc, T.; Maillard, J.-Y.; Thomas, V.; Dubois-Brissonnet, F.; Briandet, R. Biofilms of a Bacillus subtilis Hospital Isolate Protect Staphylococcus aureus from Biocide Action. PLoS ONE 2012, 7, e44506. [Google Scholar] [CrossRef] [PubMed]
  25. Doroshenko, N.; Tseng, B.S.; Howlin, R.P.; Deacon, J.; Wharton, J.A.; Thurner, P.J.; Gilmore, B.F.; Parsek, M.R.; Stoodley, P. Extracellular DNA Impedes the Transport of Vancomycin in Staphylococcus epidermidis Biofilms Preexposed to Subinhibitory Concentrations of Vancomycin. Antimicrob. Agents Chemother. 2014, 58, 7273–7282. [Google Scholar] [CrossRef] [Green Version]
  26. Marchal, M.; Briandet, R.; Halter, D.; Koechler, S.; Dubow, M.S.; Lett, M.-C.; Bertin, P.N. Subinhibitory Arsenite Concentrations Lead to Population Dispersal in Thiomonas sp. PLoS ONE 2011, 6, e23181. [Google Scholar] [CrossRef]
  27. Verma, V.; Harjai, K.; Chhibber, S. Structural changes induced by a lytic bacteriophage make ciprofloxacin effective against older biofilm ofKlebsiella pneumoniae. Biofouling 2010, 26, 729–737. [Google Scholar] [CrossRef]
  28. Hope, C.K.; Clements, D.; Wilson, M. Determining the spatial distribution of viable and nonviable bacteria in hydrated microcosm dental plaques by viability profiling. J. Appl. Microbiol. 2002, 93, 448–455. [Google Scholar] [CrossRef] [Green Version]
  29. Dufrêne, Y.F.; Persat, A. Mechanomicrobiology: How bacteria sense and respond to forces. Nat. Rev. Microbiol. 2020, 18, 227–240. [Google Scholar] [CrossRef]
  30. Li, J.; Busscher, H.J.; Swartjes, J.J.T.M.; Chen, Y.; Harapanahalli, A.K.; Norde, W.; Van Der Mei, H.C.; Sjollema, J. Residence-time dependent cell wall deformation of different Staphylococcus aureus strains on gold measured using surface-enhanced-fluorescence. Soft Matter 2014, 10, 7638–7646. [Google Scholar] [CrossRef]
  31. Perozo, E.; Kloda, A.; Cortes, D.M.; Martinac, B. Physical principles underlying the transduction of bilayer defor-mation forces during mechanosensitive channel gating. Nat. Struct. Biol. 2002, 9, 696–703. [Google Scholar] [CrossRef]
  32. Baro, A.M.; Reifenberger, R.G. Atomic Force Microscopy in Liquid: Biological Applications; Wiley-VCH: Weinheim, Germany, 2012. [Google Scholar]
  33. Beaussart, A.; El-Kirat-Chatel, S.; Sullan, R.M.A.; Alsteens, D.; Herman, P.; Derclaye, S.; Dufrêne, Y.F. Quantifying the forces guiding microbial cell adhesion using single-cell force spectroscopy. Nat. Protoc. 2014, 9, 1049–1055. [Google Scholar] [CrossRef] [PubMed]
  34. Peterson, B.W.; He, Y.; Ren, Y.; Zerdoum, A.; Libera, M.R.; Sharma, P.K.; Van Winkelhoff, A.-J.; Neut, D.; Stoodley, P.; Van Der Mei, H.C.; et al. Viscoelasticity of biofilms and their recalcitrance to mechanical and chemical challenges. FEMS Microbiol. Rev. 2015, 39, 234–245. [Google Scholar] [CrossRef] [PubMed] [Green Version]
  35. Zeng, G.; Müller, T.; Meyer, R.L. Single-Cell Force Spectroscopy of Bacteria Enabled by Naturally Derived Proteins. Langmuir 2014, 30, 4019–4025. [Google Scholar] [CrossRef] [PubMed]
  36. Tarafdar, A.; Lee, J.-U.; Jeong, J.-E.; Lee, H.; Jung, Y.; Oh, H.-B.; Woo, H.Y.; Kwon, J.-H. Biofilm development of Bacillus siamensis ATKU1 on pristine short chain low-density polyethylene: A case study on microbe-microplastics interaction. J. Hazard. Mater. 2020, 124516. [Google Scholar] [CrossRef] [PubMed]
  37. Boyd, C.D.; Smith, T.J.; El-Kirat-Chatel, S.; Newell, P.D.; Dufrêne, Y.F.; O’Toole, G.A. Structural Features of the Pseudomonas fluorescens Biofilm Adhesin LapA Required for LapG-Dependent Cleavage, Biofilm Formation, and Cell Surface Localization. J. Bacteriol. 2014, 196, 2775–2788. [Google Scholar] [CrossRef] [PubMed] [Green Version]
  38. Cabral, V.; Znaidi, S.; Walker, L.A.; Martin-Yken, H.; Dague, E.; Legrand, M.; Lee, K.; Chauvel, M.; Firon, A.; Rossignol, T.; et al. Targeted Changes of the Cell Wall Proteome Influence Candida albicans Ability to Form Single- and Multi-strain Biofilms. PLOS Pathog. 2014, 10, e1004542. [Google Scholar] [CrossRef] [Green Version]
  39. Lim, J.; Cui, Y.; Oh, Y.J.; Park, J.R.; Jo, W.; Cho, Y.-H.; Park, S. Studying the effect of alginate overproduction on Pseudomonas aeruginosa biofilm by atomic force microscopy. J. Nanosci. Nanotechnol. 2011, 11, 5676–5681. [Google Scholar] [CrossRef]
  40. Ovchinnikova, E.S.; Krom, B.P.; Harapanahalli, A.K.; Busscher, H.J.; Van Der Mei, H.C. Surface Thermodynamic and Adhesion Force Evaluation of the Role of Chitin-Binding Protein in the Physical Interaction between Pseudomonas aeruginosaand Candida albicans. Langmuir 2013, 29, 4823–4829. [Google Scholar] [CrossRef]
  41. Potthoff, E.; Ossola, D.; Zambelli, T.; Vorholt, J.A. Bacterial adhesion force quantification by fluidic force microscopy. Nanoscale 2015, 7, 4070–4079. [Google Scholar] [CrossRef]
  42. Ansari, M.J.; Al-Ghamdi, A.; Usmani, S.; Al-Waili, N.; Sharma, D.; Nuru, A.; Al-Attal, Y. Effect of Jujube Honey on Candida albicans Growth and Biofilm Formation. Arch. Med. Res. 2013, 44, 352–360. [Google Scholar] [CrossRef]
  43. Chatterjee, S.; Biswas, N.; Datta, A.; Dey, R.; Maiti, P. Atomic force microscopy in biofilm study. Microscopy (Oxf. Engl.) 2014, 63, 269–278. [Google Scholar] [CrossRef] [PubMed]
  44. Li, L.; Mendis, N.; Trigui, H.; Oliver, J.D.; Faucher, S.P. The importance of the viable but non-culturable state in human bacterial pathogens. Front. Microbiol. 2014, 5, 258. [Google Scholar] [CrossRef] [PubMed] [Green Version]
  45. Danin, P.-. Éric; Girou, E.; Legrand, P.; Louis, B.; Fodil, R.; Christov, C.; Devaquet, J.; Isabey, D.; Brochard, L. Description and Microbiology of Endotracheal Tube Biofilm in Mechanically Ventilated Subjects. Respir. Care 2014, 60, 21–29. [Google Scholar] [CrossRef] [PubMed] [Green Version]
  46. Mangalappalli-Illathu, A.K.; Vidovicć, S.; Korber, D. Differential Adaptive Response and Survival of Salmonella enterica Serovar Enteritidis Planktonic and Biofilm Cells Exposed to Benzalkonium Chloride. Antimicrob. Agents Chemother. 2008, 52, 3669–3680. [Google Scholar] [CrossRef] [Green Version]
  47. Nandakumar, K.; Obika, H.; Utsumi, A.; Ooie, T.; Yano, T. In vitro laser ablation of laboratory developed biofilms using an Nd:YAG laser of 532 nm wavelength. Biotechnol. Bioeng. 2004, 86, 729–736. [Google Scholar] [CrossRef]
  48. Qin, Z.; Zhang, J.; Hu, Y.; Chi, Q.; Mortensen, N.P.; Qu, D.; Molin, S.; Ulstrup, J. Organic compounds inhibiting S. epidermidis adhesion and biofilm formation. Ultramicroscopy 2009, 109, 881–888. [Google Scholar] [CrossRef]
  49. Sharma, S.; Cross, S.E.; Hsueh, C.; Wali, R.P.; Stieg, A.Z.; Gimzewski, J.K. Nanocharacterization in Dentistry. Int. J. Mol. Sci. 2010, 11, 2523–2545. [Google Scholar] [CrossRef]
  50. Bossù, M.; Selan, L.; Artini, M.; Relucenti, M.; Familiari, G.; Papa, R.; Vrenna, G.; Spigaglia, P.; Barbanti, F.; Salucci, A.; et al. Characterization of Scardovia wiggsiae Biofilm by Original Scanning Electron Microscopy Protocol. Microorganisms 2020, 8, 807. [Google Scholar] [CrossRef]
  51. Hung, C.; Zhou, Y.; Pinkner, J.S.; Dodson, K.W.; Crowley, J.R.; Heuser, J.; Chapman, M.R.; Hadjifrangiskou, M.; Henderson, J.P.; Hultgren, S.J. Escherichia coli Biofilms Have an Organized and Complex Extracellular Matrix Structure. mBio 2013, 4, e00645-13. [Google Scholar] [CrossRef] [Green Version]
  52. Rodrigues, D.A.F.; Bañobre-López, M.; Espiña, B.; Rivas, J.; Azeredo, J. Effect of magnetic hyperthermia on the structure of biofilm and cellular viability of a food spoilage bacterium. Biofouling 2013, 29, 1225–1232. [Google Scholar] [CrossRef]
  53. Di Bonaventura, G.; Piccolomini, R.; Paludi, D.; D’Orio, V.; Vergara, A.; Conter, M.; Ianieri, A. Influence of temperature on biofilm formation by Listeria monocytogenes on various food-contact surfaces: Relationship with motility and cell surface hydrophobicity. J. Appl. Microbiol. 2008, 104, 1552–1561. [Google Scholar] [CrossRef] [PubMed]
  54. Di Bonaventura, G.; Pompilio, A.; Picciani, C.; Iezzi, M.; D’Antonio, D.; Piccolomini, R. Biofilm Formation by the Emerging Fungal Pathogen Trichosporon asahii: Development, Architecture, and Antifungal Resistance. Antimicrob. Agents Chemother. 2006, 50, 3269–3276. [Google Scholar] [CrossRef] [PubMed] [Green Version]
  55. Hasan, S.; Danishuddin, M.; Khan, A.U. Inhibitory effect of zingiber officinale towards Streptococcus mutans virulence and caries development: In vitro and in vivo studies. BMC Microbiol. 2015, 15, 1. [Google Scholar] [CrossRef] [PubMed] [Green Version]
  56. Sun, H.W.; Li, Y.F.; Gao, R.; Liu, K.Y.; Zhang, H.Q.; Fu, Q.H.; Guo, G.; Zou, Q.M.; Qing, S.L. Inhibited biofilm formation and improved antibacterial activity of a novel nanoemulsion against cariogenic Streptococcus mutans in vitro and in vivo. Int. J. Nanomed. 2015, 10, 447–462. [Google Scholar] [CrossRef] [PubMed]
  57. Orsinger-Jacobsen, S.J.; Patel, S.S.; Vellozzi, E.M.; Gialanella, P.; Nimrichter, L.; Miranda, K.; Martinez, L.R. Use of a stainless steel washer platform to study Acinetobacter baumannii adhesion and biofilm formation on abiotic surfaces. Microbiology (Read. Engl.) 2013, 159, 2594–2604. [Google Scholar] [CrossRef] [Green Version]
  58. Samaranayake, Y.H.; Cheung, B.P.K.; Yau, J.Y.Y.; Yeung, S.K.W.; Samaranayake, Y.H. Human Serum Promotes Candida albicans Biofilm Growth and Virulence Gene Expression on Silicone Biomaterial. PLoS ONE 2013, 8, e62902. [Google Scholar] [CrossRef] [Green Version]
  59. Van Laar, T.A.; Chen, T.; You, T.; Leung, K.P. Sublethal Concentrations of Carbapenems Alter Cell Morphology and Genomic Expression of Klebsiella pneumoniae Biofilms. Antimicrob. Agents Chemother. 2015, 59, 1707–1717. [Google Scholar] [CrossRef] [Green Version]
  60. Bressan, E.; Tessarolo, F.; Sbricoli, L.; Caola, I.; Nollo, G.; Di Fiore, A. Effect of Chlorhexidine in Preventing Plaque Biofilm on Healing Abutment: A crossover controlled study. Implant. Dent. 2014, 23, 64–68. [Google Scholar] [CrossRef]
  61. Ceresa, C.; Tessarolo, F.; Caola, I.; Nollo, G.; Cavallo, M.; Rinaldi, M.; Fracchia, L. Inhibition of Candida albicans adhesion on medical-grade silicone by a Lactobacillus -derived biosurfactant. J. Appl. Microbiol. 2015, 118, 1116–1125. [Google Scholar] [CrossRef]
  62. Garcez, A.S.; Núñez, S.C.; Azambuja, N., Jr.; Fregnani, E.R.; Rodriguez, H.M.; Hamblin, M.R.; Suzuki, H.; Ribeiro, M.S. Effects of Photodynamic Therapy on Gram-Positive and Gram-Negative Bacterial Biofilms by Bioluminescence Imaging and Scanning Electron Microscopic Analysis. Photomed. Laser Surg. 2013, 31, 519–525. [Google Scholar] [CrossRef]
  63. Nishitani, K.; Sutipornpalangkul, W.; Bentley, K.L.D.M.; Varrone, J.J.; Bello-Irizarry, S.N.; Ito, H.; Matsuda, S.; Kates, S.L.; Daiss, J.L.; Schwarz, E.M. Quantifying the natural history of biofilm formation in vivo during the establishment of chronic implant-associated Staphylococcus aureus osteomyelitis in mice to identify critical pathogen and host factors. J. Orthop. Res. 2015, 33, 1311–1319. [Google Scholar] [CrossRef] [PubMed] [Green Version]
  64. Alhede, M.; Qvortrup, K.; Liebrechts, R.; Høiby, N.; Givskov, M.; Bjarnsholt, T. Combination of microscopic techniques reveals a comprehensive visual impression of biofilm structure and composition. FEMS Immunol. Med. Microbiol. 2012, 65, 335–342. [Google Scholar] [CrossRef] [Green Version]
  65. Timp, W.; Matsudaira, P. Chapter 14 Electron Microscopy of Hydrated Samples. Methods Cell Biol. 2008, 89, 391–407. [Google Scholar] [CrossRef] [PubMed]
  66. De Araujo, J.C.; Téran, F.C.; Oliveira, R.A.; Nour, E.A.A.; Montenegro, M.A.P.; Campos, J.R.; Vazoller, R.F. Comparison of hexamethyldisilazane and critical point drying treatments for SEM analysis of anaerobic biofilms and granular sludge. QJM Int. J. Med. 2003, 52, 429–433. [Google Scholar] [CrossRef] [PubMed]
  67. Karcz, J.; Bernas, T.; Nowak, A.; Talik, E.; Woznica, A. Application of lyophilization to prepare the nitrifying bacterial biofilm for imaging with scanning electron microscopy. Scanning 2011, 34, 26–36. [Google Scholar] [CrossRef] [PubMed]
  68. Bossù, M.; Matassa, R.; Relucenti, M.; Iaculli, F.; Salucci, A.; Di Giorgio, G.; Familiari, G.; Polimeni, A.; Di Carlo, S. Morpho-Chemical Observations of Human Deciduous Teeth Enamel in Response to Biomimetic Toothpastes Treatment. Materials 2020, 13, 1803. [Google Scholar] [CrossRef] [Green Version]
  69. Bossù, M.; Saccucci, M.; Salucci, A.; Di Giorgio, G.; Bruni, E.; Uccelletti, D.; Sarto, M.S.; Familiari, G.; Relucenti, M.; Polimeni, A. Enamel remineralization and repair results of Biomimetic Hydroxyapatite toothpaste on deciduous teeth: An effective option to fluoride toothpaste. J. Nanobiotechnol. 2019, 17, 17. [Google Scholar] [CrossRef]
  70. Redler, A.; Miglietta, S.; Monaco, E.; Matassa, R.; Relucenti, M.; Daggett, M.; Ferretti, A.; Familiari, G. Ultrastructural Assessment of the Anterolateral Ligament. Orthop. J. Sports Med. 2019, 7, 2325967119887920. [Google Scholar] [CrossRef] [Green Version]
  71. Priester, J.H.; Horst, A.M.; Van De Werfhorst, L.C.; Saleta, J.L.; Mertes, L.A.; Holden, P.A. Enhanced visualization of microbial biofilms by staining and environmental scanning electron microscopy. J. Microbiol. Methods 2007, 68, 577–587. [Google Scholar] [CrossRef]
  72. Weber, K.; Delben, J.; Bromage, T.G.; Duarte, S. Comparison of SEM and VPSEM imaging techniques with respect toStreptococcus mutansbiofilm topography. FEMS Microbiol. Lett. 2013, 350, 175–179. [Google Scholar] [CrossRef] [Green Version]
  73. Ishii, S.; Koki, J.; Unno, H.; Hori, K. Two Morphological Types of Cell Appendages on a Strongly Adhesive Bacterium, Acinetobacter sp. Strain Tol 5. Appl. Environ. Microbiol. 2004, 70, 5026–5029. [Google Scholar] [CrossRef] [Green Version]
  74. Weimer, P.J.; Price, N.P.J.; Kroukamp, O.; Joubert, L.-M.; Wolfaardt, G.M.; Van Zyl, W.H. Studies of the Extracellular Glycocalyx of the Anaerobic Cellulolytic Bacterium Ruminococcus albus 7. Appl. Environ. Microbiol. 2006, 72, 7559–7566. [Google Scholar] [CrossRef] [PubMed] [Green Version]
  75. Joubert, L.-M.; Ferreira, J.A.; A Stevens, D.; Nazik, H.; Cegelski, L. Visualization of Aspergillus fumigatus biofilms with Scanning Electron Microscopy and Variable Pressure-Scanning Electron Microscopy: A comparison of processing techniques. J. Microbiol. Methods 2017, 132, 46–55. [Google Scholar] [CrossRef] [PubMed]
  76. Bozzola, J.J.; Russell, L.D. Electron. Microscopy: Principles and Techniques for Biologists; Jones & Bartlett Learning: Burlington, MA, USA, 1999. [Google Scholar]
  77. Fassel, T.A.; Edmiston, C.E., Jr. Ruthenium Red and the Bacterial Glycocalyx. Biotech. Histochem. 1999, 74, 194–212. [Google Scholar] [CrossRef] [PubMed]
  78. Sutherland, I.W. Biofilm exopolysaccharides: A strong and sticky framework. Microbiology 2001, 147, 3–9. [Google Scholar] [CrossRef] [PubMed] [Green Version]
  79. Erlandsen, S.L.; Kristich, C.J.; Dunny, G.M.; Wells, C.L. High-resolution Visualization of the Microbial Glycocalyx with Low-voltage Scanning Electron Microscopy: Dependence on Cationic Dyes. J. Histochem. Cytochem. 2004, 52, 1427–1435. [Google Scholar] [CrossRef] [PubMed]
  80. Reichhardt, C.; Ferreira, J.A.G.; Joubert, L.-M.; Clemons, K.V.; Stevens, D.A.; Cegelski, L. Analysis of the Aspergillus fumigatus Biofilm Extracellular Matrix by Solid-State Nuclear Magnetic Resonance Spectroscopy. Eukaryot. Cell 2015, 14, 1064–1072. [Google Scholar] [CrossRef] [Green Version]
  81. Trent, J.S.; Scheinbeim, J.I.; Couchman, P.R. Ruthenium tetraoxide staining of polymers for electron micros-copy. Macromolecules 1983, 16, 589–598. [Google Scholar] [CrossRef]
  82. Behnke, O.; Zelander, T. Preservation of intercellular substances by the cationic dye alcian blue in preparative procedures for electron microscopy. J. Ultrastruct. Res. 1970, 31, 424–438. [Google Scholar] [CrossRef]
  83. Fassel, T.A.; Mozdziak, P.E.; Sanger, J.R.; Edmiston, C.E. Paraformaldehyde effect on ruthenium red and ly-sine preservation and staining of the staphylococcal glycocalyx. Microsc. Res. Tech. 1997, 36, 422–427. [Google Scholar] [CrossRef]
  84. Forte, M.; Bianchi, F.; Cotugno, M.; Marchitti, S.; De Falco, E.; Raffa, S.; Stanzione, R.; Di Nonno, F.; Chimenti, I.; Palmerio, S.; et al. Pharmacological restoration of autophagy reduces hypertension-related stroke occurrence. Autophagy 2020, 16, 1468–1481. [Google Scholar] [CrossRef] [PubMed]
  85. Grimaldi, A.; Serpe, C.; Chece, G.; Nigro, V.; Sarra, A.; Ruzicka, B.; Relucenti, M.; Familiari, G.; Ruocco, G.; Pascucci, G.R.; et al. Microglia-Derived Microvesicles Affect Microglia Phenotype in Glioma. Front. Cell. Neurosci. 2019, 13, 41. [Google Scholar] [CrossRef] [PubMed] [Green Version]
  86. Nardoni, M.; Della Valle, E.; Liberti, M.; Relucenti, M.; Casadei, M.A.; Paolicelli, P.; Apollonio, F.; Petralito, S. Can Pulsed Electromagnetic Fields Trigger On-Demand Drug Release from High-Tm Magnetoliposomes? Nanomaterials 2018, 8, 196. [Google Scholar] [CrossRef] [PubMed] [Green Version]
  87. Hayat, M.A. Stains and Cytochemical Methods; Hayat, M.A., Ed.; Plenum Press: New York, NY, USA, 1993; Volume 1, pp. 336–347. [Google Scholar]
  88. Tapia, J.C.; Kasthuri, N.; Hayworth, K.J.; Schalek, R.; Lichtman, J.W.; Smith, S.J.; Buchanan, J. High-contrast en bloc staining of neuronal tissue for field emission scanning electron microscopy. Nat. Protoc. 2012, 7, 193–206. [Google Scholar] [CrossRef]
  89. Murakami, T.; Iida, N.; Taguchi, T.; Ohtani, O.; Kikuta, A.; Ohtsuka, A.; Itoshima, T. Conductive staining of biological specimens for scanning electron microscopy with special reference to ligand-mediated osmium impregnation. Scanning Electron. Microsc. 1983, 235–246. [Google Scholar]
  90. Murakami, T. A revised tannin-osmium method for non-coated SEM specimens. Arch. Histol. Jpn. 1974, 36, 189–193. [Google Scholar] [CrossRef] [Green Version]
  91. Murakami, T. A metal impregnation method of biological specimens for SEM. Arch. Histol. Jpn. 1973, 35, 323–326. [Google Scholar] [CrossRef] [Green Version]
  92. Murakami, T. Puncture perfusion of small tissue pieces for SEM. Arch. Histol. Jpn. 1976, 39, 99–103. [Google Scholar] [CrossRef] [Green Version]
  93. Murakami, T.; Yamamoto, K.; Itoshima, T.; Irino, S. Modified tannin osmium conductive staining method for non-coated SEM specimens. Its application to microdissection SEM of the spleen. Arch. Histol. Jpn. 1977, 40, 35–40. [Google Scholar] [CrossRef] [Green Version]
  94. Gunji, T.; Wakita, M.; Kobayashi, S. Conductive staining in SEM with especial reference to tissue transparency. Scanning 1980, 3, 227–232. [Google Scholar] [CrossRef]
  95. Arimoto, S.; Sugimura, M.; Kageyama, H.; Torimoto, T.; Kuwabata, S. Development of new techniques for scanning electron microscope observation using ionic liquid. Electrochim. Acta 2008, 53, 6228–6234. [Google Scholar] [CrossRef]
  96. Tsuda, T.; Nemoto, N.; Kawakami, K.; Mochizuki, E.; Kishida, S.; Tajiri, T.; Kushibiki, T.; Kuwabata, S. SEM Observation of Wet Biological Specimens Pretreated with Room-Temperature Ionic Liquid. ChemBioChem 2011, 12, 2547–2550. [Google Scholar] [CrossRef] [PubMed]
  97. Brodusch, N.; Waters, K.; Demers, H.; Gauvin, R. Ionic liquid-based observation technique for nonconductive materials in the scanning electron microscope: Application to the characterization of a rare earth ore. Microsc. Res. Tech. 2014, 77, 225–235. [Google Scholar] [CrossRef] [PubMed]
  98. Imashuku, S.; Kawakami, T.; Zea, L.; Kawai, J. Possibility of Scanning Electron Microscope Observation and Energy Dispersive X-Ray Analysis in Microscale Region of Insulating Samples Using Diluted Ionic Liquid. Microsc. Microanal. 2012, 18, 365–370. [Google Scholar] [CrossRef] [PubMed] [Green Version]
  99. Torto, F.L.; Relucenti, M.; Familiari, G.; Vaia, N.; Casella, D.; Matassa, R.; Miglietta, S.; Marinozzi, F.; Bini, F.; Fratoddi, I.; et al. The Effect of Postmastectomy Radiation Therapy on Breast Implants: Material Analysis on Silicone and Polyurethane Prosthesis. Ann. Plast. Surg. 2018, 81, 228–234. [Google Scholar] [CrossRef]
  100. Relucenti, M.; Miglietta, S.; Bove, G.; Donfrancesco, O.; Battaglione, E.; Familiari, P.; Barbaranelli, C.; Covelli, E.; Barbara, M.; Familiari, G. SEM BSE 3D Image Analysis of Human Incus Bone Affected by Cholesteatoma Ascribes to Osteoclasts the Bone Erosion and VpSEM dEDX Analysis Reveals New Bone Formation. Scanning 2020, 2020, 1–9. [Google Scholar] [CrossRef] [Green Version]
  101. Relucenti, M.; Miglietta, S.; Covelli, E.; Familiari, P.; Battaglione, E.; Familiari, G.; Barbara, M. Ciliated cell observation by SEM on the surface of human incudo-malleolar-joint articular cartilage: Are they a new chondrocyte phenotype? Acta Oto-Laryngol. 2019, 139, 439–443. [Google Scholar] [CrossRef]
  102. Fulcher, T.P.; Dart, J.K.; McLaughlin-Borlace, L.; Howes, R.; Matheson, M.; Cree, I. Demonstration of biofilm in infectious crystalline keratopathy using ruthenium red and electron microscopy. Ophthalmology 2001, 108, 1088–1092. [Google Scholar] [CrossRef]
  103. Luft, J.H. Electron microscopy of cell extraneous coats as revealed by ruthenium red staining. J. Cell Biol. 1964, 23, 54A–55A. [Google Scholar]
  104. Fassel, T.A.; Schaller, M.J.; Remsen, C.C. Comparison of Alcian blue and ruthenium red effects on preservation of outer envelope ultrastructure in methanotrophic bacteria. Microsc. Res. Tech. 1992, 20, 87–94. [Google Scholar] [CrossRef]
  105. Bleck, C.; Merz, A.; Gutierrez, M.G.; Walther, P.; Dubochet, J.; Zuber, B.; Griffiths, G. Comparison of different methods for thin section EM analysis of Mycobacterium smegmatis. J. Microsc. 2009, 237, 23–38. [Google Scholar] [CrossRef] [PubMed]
  106. Hrubanova, K.; Nebesarova, J.; Růžička, F.; Krzyzanek, V. The innovation of cryo-SEM freeze-fracturing methodology demonstrated on high pressure frozen biofilm. Micron 2018, 110, 28–35. [Google Scholar] [CrossRef] [PubMed]
  107. Nishiyama, H.; Koizumi, M.; Ogawa, K.; Kitamura, S.; Konyuba, Y.; Watanabe, Y.; Ohbayashi, N.; Fukuda, M.; Suga, M.; Sato, C. Atmospheric scanning electron microscope system with an open sample chamber: Configuration and applications. Ultramicroscopy 2014, 147, 86–97. [Google Scholar] [CrossRef] [PubMed]
  108. Maruyama, Y.; Ebihara, T.; Nishiyama, H.; Suga, M.; Sato, C. Immuno EM–OM correlative microscopy in solution by atmospheric scanning electron microscopy (ASEM). J. Struct. Biol. 2012, 180, 259–270. [Google Scholar] [CrossRef]
  109. Hirano, K.; Kinoshita, T.; Uemura, T.; Motohashi, H.; Watanabe, Y.; Ebihara, T.; Nishiyama, H.; Sato, M.; Suga, M.; Maruyama, Y.; et al. Electron microscopy of primary cell cultures in solution and correlative optical microscopy using ASEM. Ultramicroscopy 2014, 143, 52–66. [Google Scholar] [CrossRef]
  110. Sato, C.; Manaka, S.; Nakane, D.; Nishiyama, H.; Suga, M.; Nishizaka, T.; Miyata, M.; Maruyama, Y. Rapid imaging of mycoplasma in solution using Atmospheric Scanning Electron Microscopy (ASEM). Biochem. Biophys. Res. Commun. 2012, 417, 1213–1218. [Google Scholar] [CrossRef]
  111. Sugimoto, S.; Okuda, K.-I.; Miyakawa, R.; Sato, M.; Arita-Morioka, K.-I.; Chiba, A.; Yamanaka, K.; Ogura, T.; Mizunoe, Y.; Sato, C. Imaging of bacterial multicellular behaviour in biofilms in liquid by atmospheric scanning electron microscopy. Sci. Rep. 2016, 6, 25889. [Google Scholar] [CrossRef] [Green Version]
  112. Gu, J.; Valdevit, A.; Chou, T.-M.; Libera, M.R. Substrate effects on cell-envelope deformation during early-stage Staphylococcus aureus biofilm formation. Soft Matter 2017, 13, 2967–2976. [Google Scholar] [CrossRef]
  113. Cao, Y.; Su, B.; Chinnaraj, S.; Jana, S.; Bowen, L.; Charlton, S.; Duan, P.; Jakubovics, N.S.; Chen, J. Nanostructured titanium surfaces exhibit recalcitrance towards Staphylococcus epidermidis biofilm formation. Sci. Rep. 2018, 8, 1071. [Google Scholar] [CrossRef]
Figure 1. S. mutans prepared by conventional scanning electron microscope (SEM) protocol. (a) SEM, 3000×. S. mutans spherical bacterial cells were scattered on biofilm matrix compact surface. Image was captured from the same sample observed in Figure 1a from [50]; (b) SEM, 5000×. Increasing magnification S. mutans spherical bacterial cells appeared clustered in small groups on the surface of a rough and dense extracellular matrix (Eps).
Biology 10 00051 g001
Figure 2. S. mutans prepared by conventional SEM procedure. (a) SEM, 10,000×. Eps forms a canalicular system of compact trabeculae with spiny surface. Bacterial cells, S, are adherent to the Eps surface. Eps: extracellular polymeric substance. Image was captured from the same sample observed in [50] Figure 1d; (b) SEM, 20,000×. Bacterial cells appear irregular, Eps micro-canalicular system is not developed, only superficial holes are visible. Bacterial cells lay down on the Eps surface, and they appear naked, without a matrix covering. Bacterial cells are sometimes fragmented or indented; Eps showed a compact aspect due to the collapse of its fine structure. Bacterial cells, uncovered by the matrix, rest on the Eps surface. Eps: extracellular polymeric substance, S: S. mutans. Image was captured from the same sample observed in [50]. Figure 1f.
Biology 10 00051 g002
Figure 3. S. mutans prepared by conventional VP-SEM procedure. (a) VP-SEM 2000×. An intricate micro-canalicular system develops among bacterial towers. Image was captured from the same sample observed in [50] Fig. (b) VP-SEM 3000×. Hydration preservation confers biofilm a spongy aspect, without shrinking or any sign of collapse. Image was captured from the same sample observed in [50] Figure 2d.
Biology 10 00051 g003
Figure 4. S. mutans prepared by conventional variable pressure SEM (VP-SEM) procedure. (a) VP-SEM 5000×. Bacterial towers are lined by a superficial granulation representing Eps secretion. Image was captured from the same sample observed in [50] Figure 2f. (b) VP-SEM 8000×. On S. mutans cells surface is clearly visible the fine graininess of freshly secreted Eps components. Image is the same of [50] Figure 2e.
Biology 10 00051 g004
Figure 5. S. mutans prepared by the OsO4-RR-TA-IL procedure. (a) 3000×. The biofilm topography showed a spongy appearance. (b) 5000×. The biofilm topography showed both compact, c, and spongy, s, appearance, a single bacterial cell, b, was partially embedded in Eps.
Biology 10 00051 g005
Figure 6. S. mutans prepared by the OsO4-RR-TA-IL procedure. (a) At high magnification, a well-developed micro-canalicular system, m, is visible in the spongy Eps, 10,000×. Image was captured from the same sample observed in Figure 3b from [50]. (b). High voltage, high magnification, and high-resolution image of microcanalicular system, m. Fully hydrated Eps appears as a spongy structure formed by globular aggregate, g, at nanometric level, no filaments or collapsed network are visible, 20,000×. Image was captured from the same sample observed in [50] Figure 3f.
Biology 10 00051 g006
Figure 7. S. mutans prepared by the conventional SEM protocol. At high magnification, 30,000×, Eps appeared as a collapsed network of filaments, cell surface, s, was naked, and not covered by Eps.
Biology 10 00051 g007
Figure 8. S. mutans prepared by the OsO4-RR-TA-IL procedure. At high magnification, 30,000×, and high voltage, 15 kV, a globular Eps formed trabeculae of a microcanalicular system, m, and lines the bacterial cells’ surface, s. This high magnification and high-resolution image confirms the value of this protocol in terms of biofilm three-dimensional structure preservation up to the nanometric level.
Biology 10 00051 g008
Figure 9. Candida albicans hyphae with conidia and spores, SEM OsO4-RR-TA-IL protocol 3000×, image artificially colored by software 3D Hitachi Mountains Map (Digital Surf, France).
Biology 10 00051 g009
Figure 10. (a) 3-D reconstruction from picture in Figure 9 by 3D Hitachi Mountains 7 software. (b) Conidium length measure.
Biology 10 00051 g010
Table 1. Most widely used non-electron microscopic techniques for biofilm study.
Light MicroscopyCLSMAFM
ProsSimple protocols
Cheap and easy to perform
Large investigation area
Allows single cell visualization and 3-D imagingNondestructive technique that works under physiological-like conditions, allowing living biofilms qualitative and quantitative assessment with few treatments, sample 3-D structure reconstruction at nanometer scale.
ConsLow resolution and magnification power, need for sample staining, gross morphological differentiation, finest details not visibleUse of fluorophores, limited number of reporter molecules, intrinsic biofilm fluorescence can interfere with probes fluorescenceSmall scan area (max 150 × 150 µm), no image of bacterial cells sidewalls, possible surface damage during imaging due to tip interactions.
ApplicationsVisualization of biofilm formation and quantitative assessment of its biomassAssessment of biofilm structural parameters, Biofilm 3D structure, identification and localization of living and death cellsQuantitative biofilm analysis, determination of adhesion forces, biofilm topography, in situ imaging.
Table 2. S. mutans processing procedures and operating conditions from [50].
Protocols
StepsConventional SEMVP-SEMOsO4-RR-TA-IL
FixationGlutaraldehyde 2.5% in PB 0.1 M pH 7.4 at least 48 h
Washing10 min × 2 times in PB 0.1 M pH 7.4
Post-fixationOsO4 2% 1 hOsO4 2% in 1 hOsO4 2% + RR 0.2% 1:1 solution, 1 h
Washing10 min × 2 times in dH20
ImpregnationNoneNoneTannic Acid 1% in d H20 30 min
Washing--10 min × 2 times in dH20
DehydrationAscending ethanol seriesNoneNone
DryingAscending HMDS 1 seriesNoneNone
Pt Sputter coating15 mA, 2 minNoneReplaced by IL
Operating conditions15–20 kV, high vacuum5–10 kV 30 Pa15–20 kV, high vacuum
1 HMDS: Hexamethyldisilazane, HN[Si(CH3)3]2T.
Table 3. Parameters for the protocol evaluation (from [50]).
Protocols
ParametersConventional SEMVP-SEMOsO4-RR-TA-IL
Procedure time2 days1 h and 30 min2 h and 10 min
Sample lossSteps produce sample loss of about 60%about 20%about 20%
Dehydration and dryingyesNoneNone
Pt Sputter coatingyesNoneReplaced by IL
Resistance in vacuum Excellent, it is possible to observe for hoursGood for 1 hExcellent, it is possible to observe for hours
Operating conditions15–20 kV, high vacuum5–10 kV 30 Pa15–20 kV, high vacuum
Image magnificationGood up to 40 kGood up to 10 kGood up to 30 k
Image quality Excellent up to 30 kGood up to 8 kExcellent up to 30 k
Publisher’s Note: MDPI stays neutral with regard to jurisdictional claims in published maps and institutional affiliations.

