Metabolic Signatures of Cryptosporidium parvum-Infected HCT-8 Cells and Impact of Selected Metabolic Inhibitors on C. parvum Infection under Physioxia and Hyperoxia

 , , , and
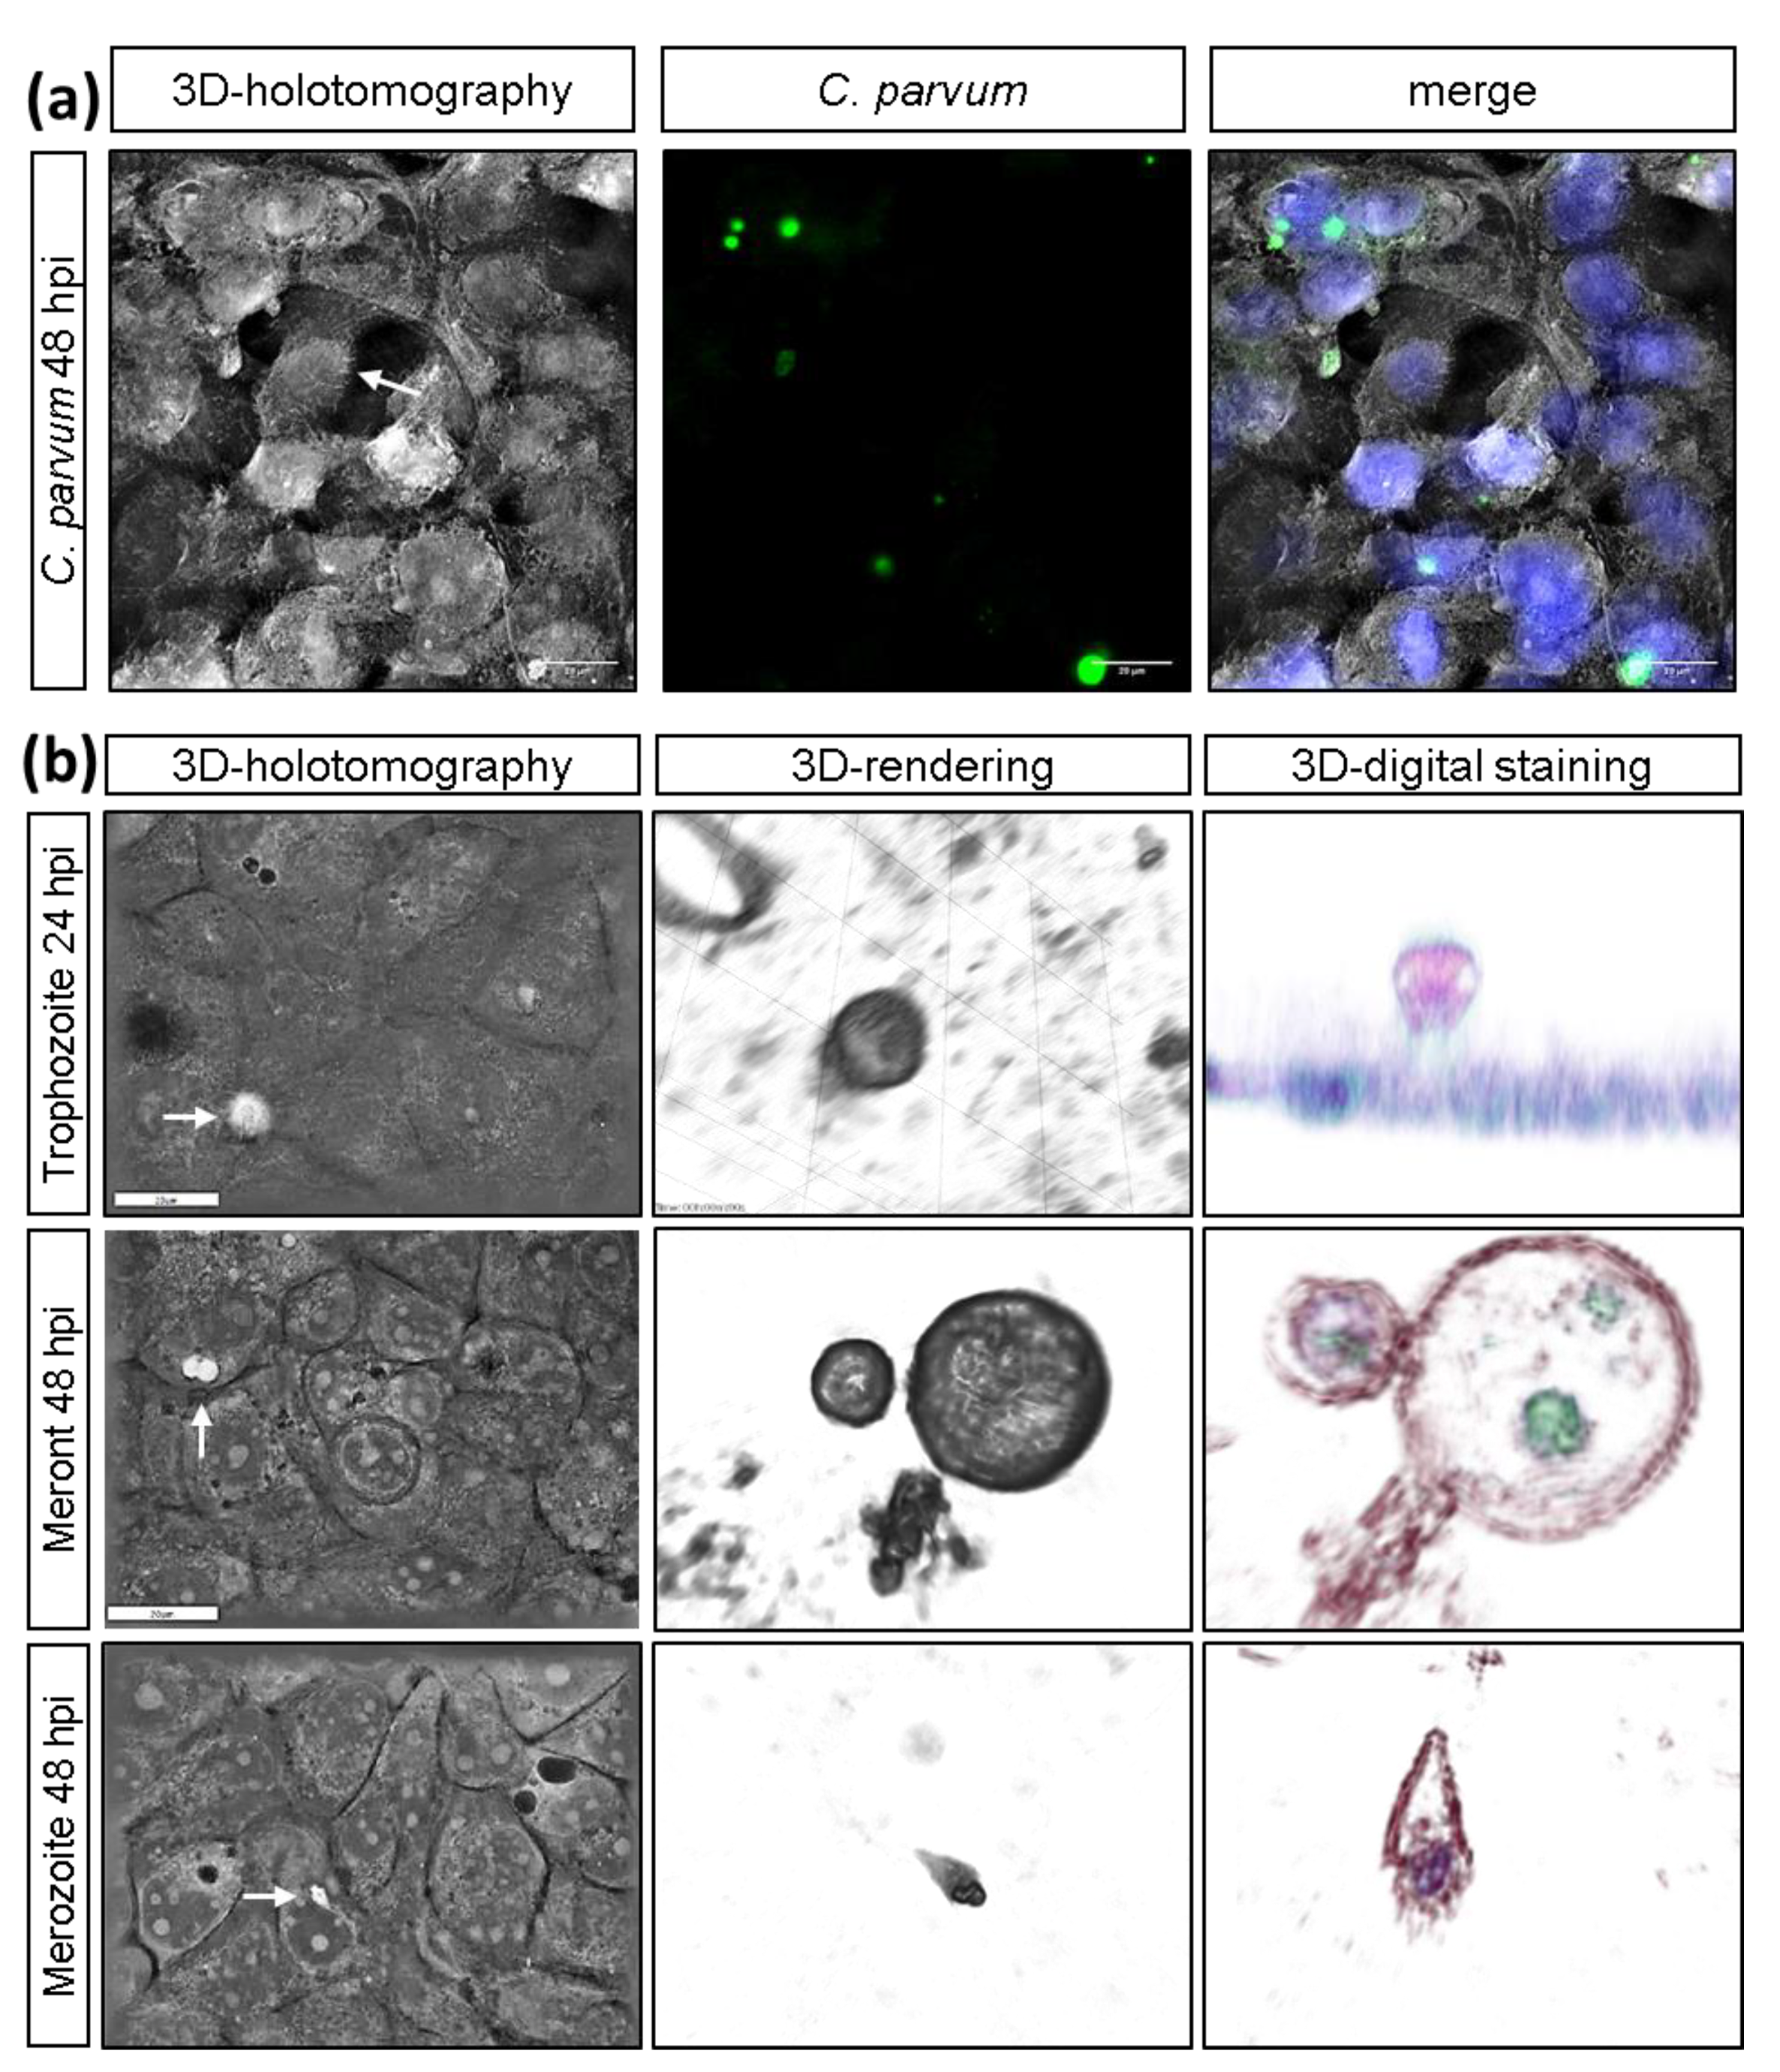
Abstract
:Simple Summary
Abstract
1. Introduction
2. Materials and Methods
2.1. Host Cell Culture
2.2. Parasites
2.3. Host Cell Infection
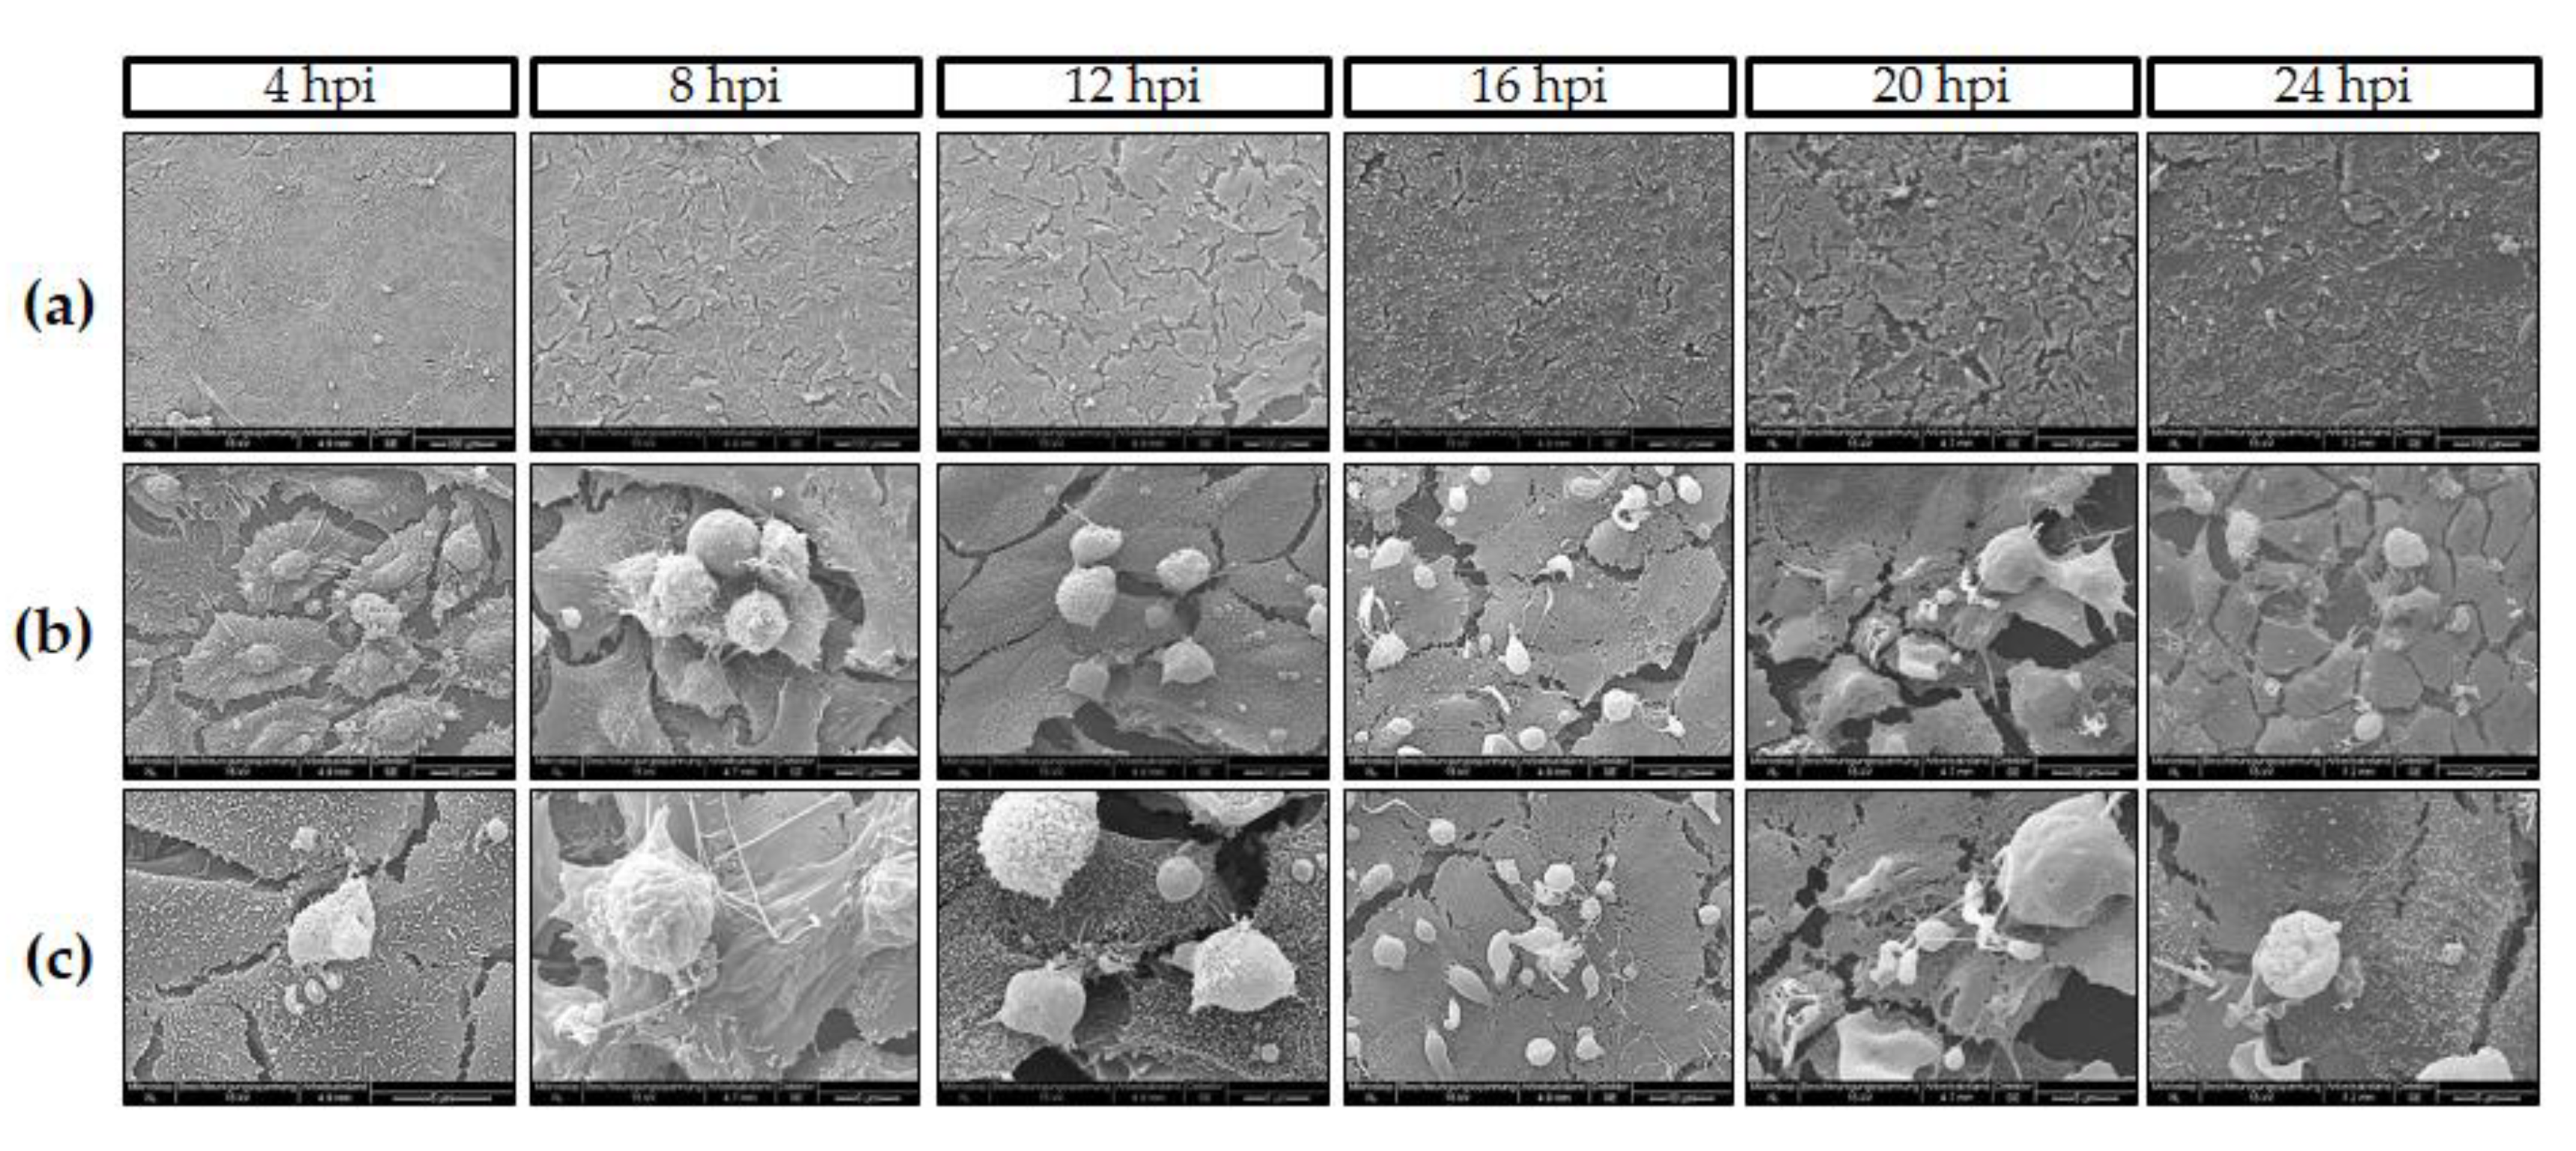
2.4. Live Cell 3D-Holotomography and Scanning Electron Microscopy (SEM) Analyses of C. parvum-Infected Host Cells
2.5. Vicia Villosa Lectin-Based Detection of C. parvum Infections
2.6. Quantification of Metabolic Conversion Rates in C. parvum-Infected Host Cell Culture Supernatants
2.7. Host Cell Toxicity Assays
2.8. Inhibition Assays
2.9. Analysis of Glycolytic Responses via Seahorse Technology
2.10. Statistical Analysis
3. Results
3.1. C. parvum Infective Stages and Infection Development in HCT-8 Cells Depend on Oxygen Pressure
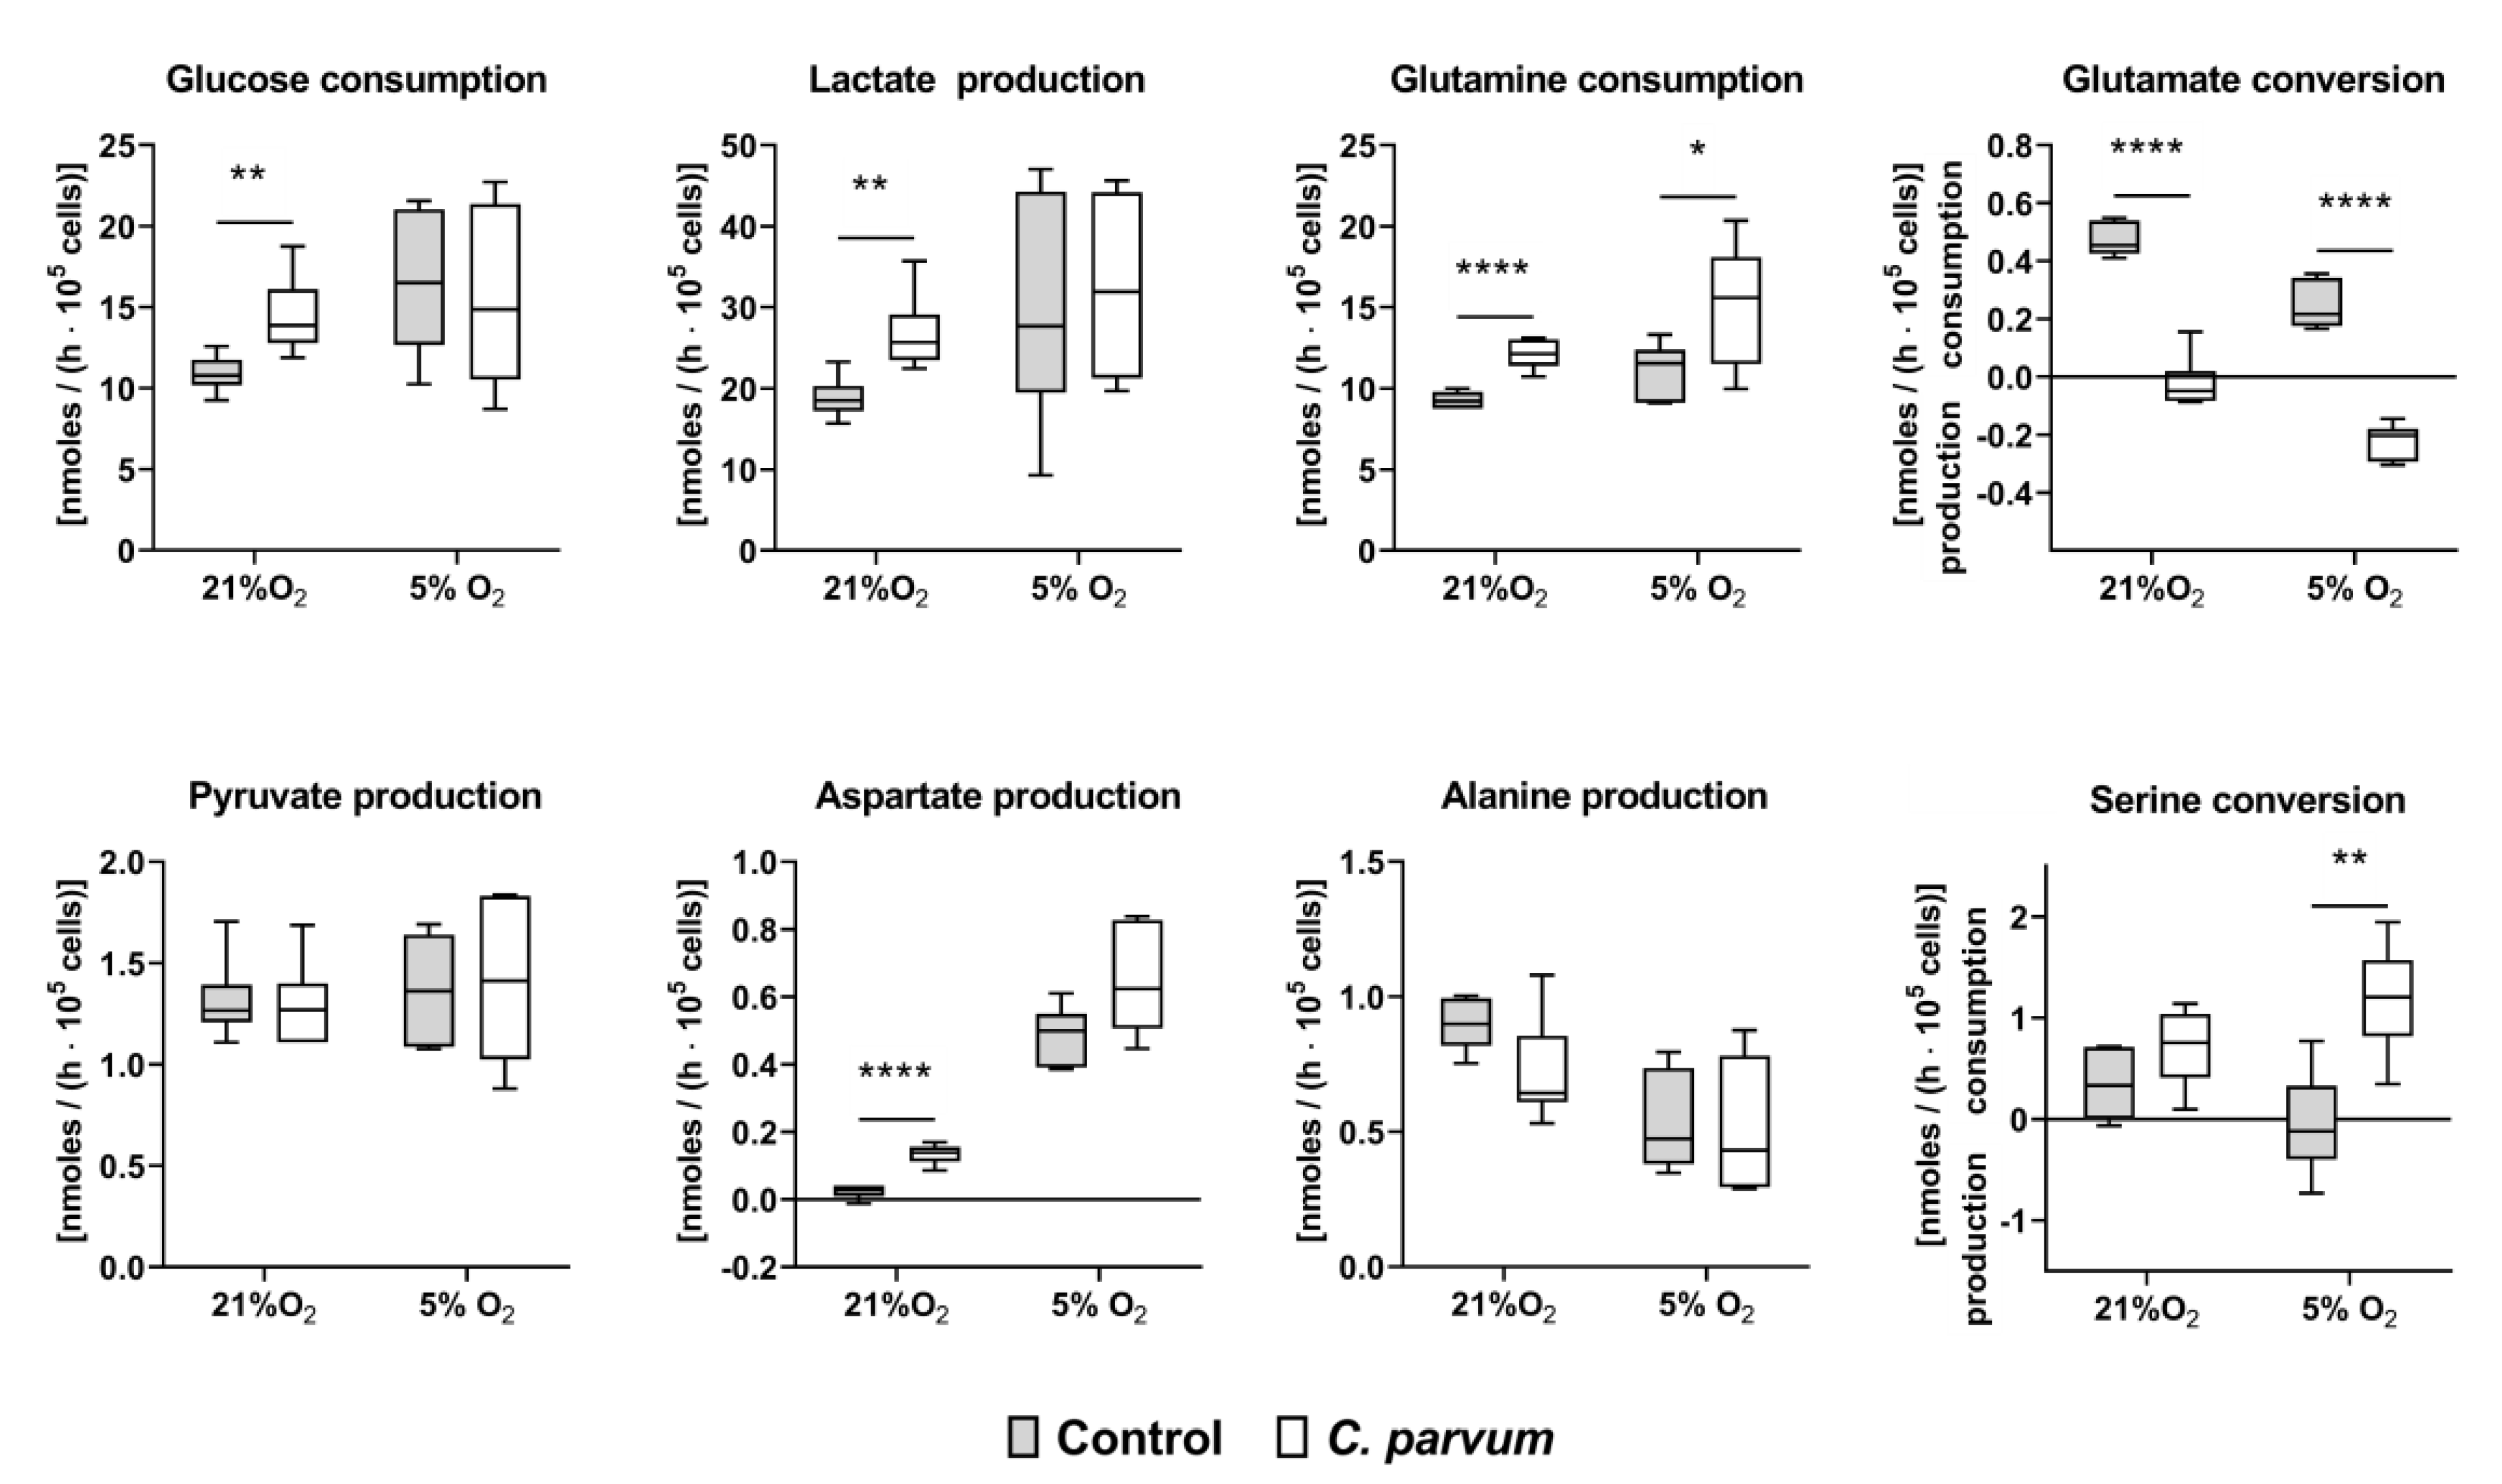
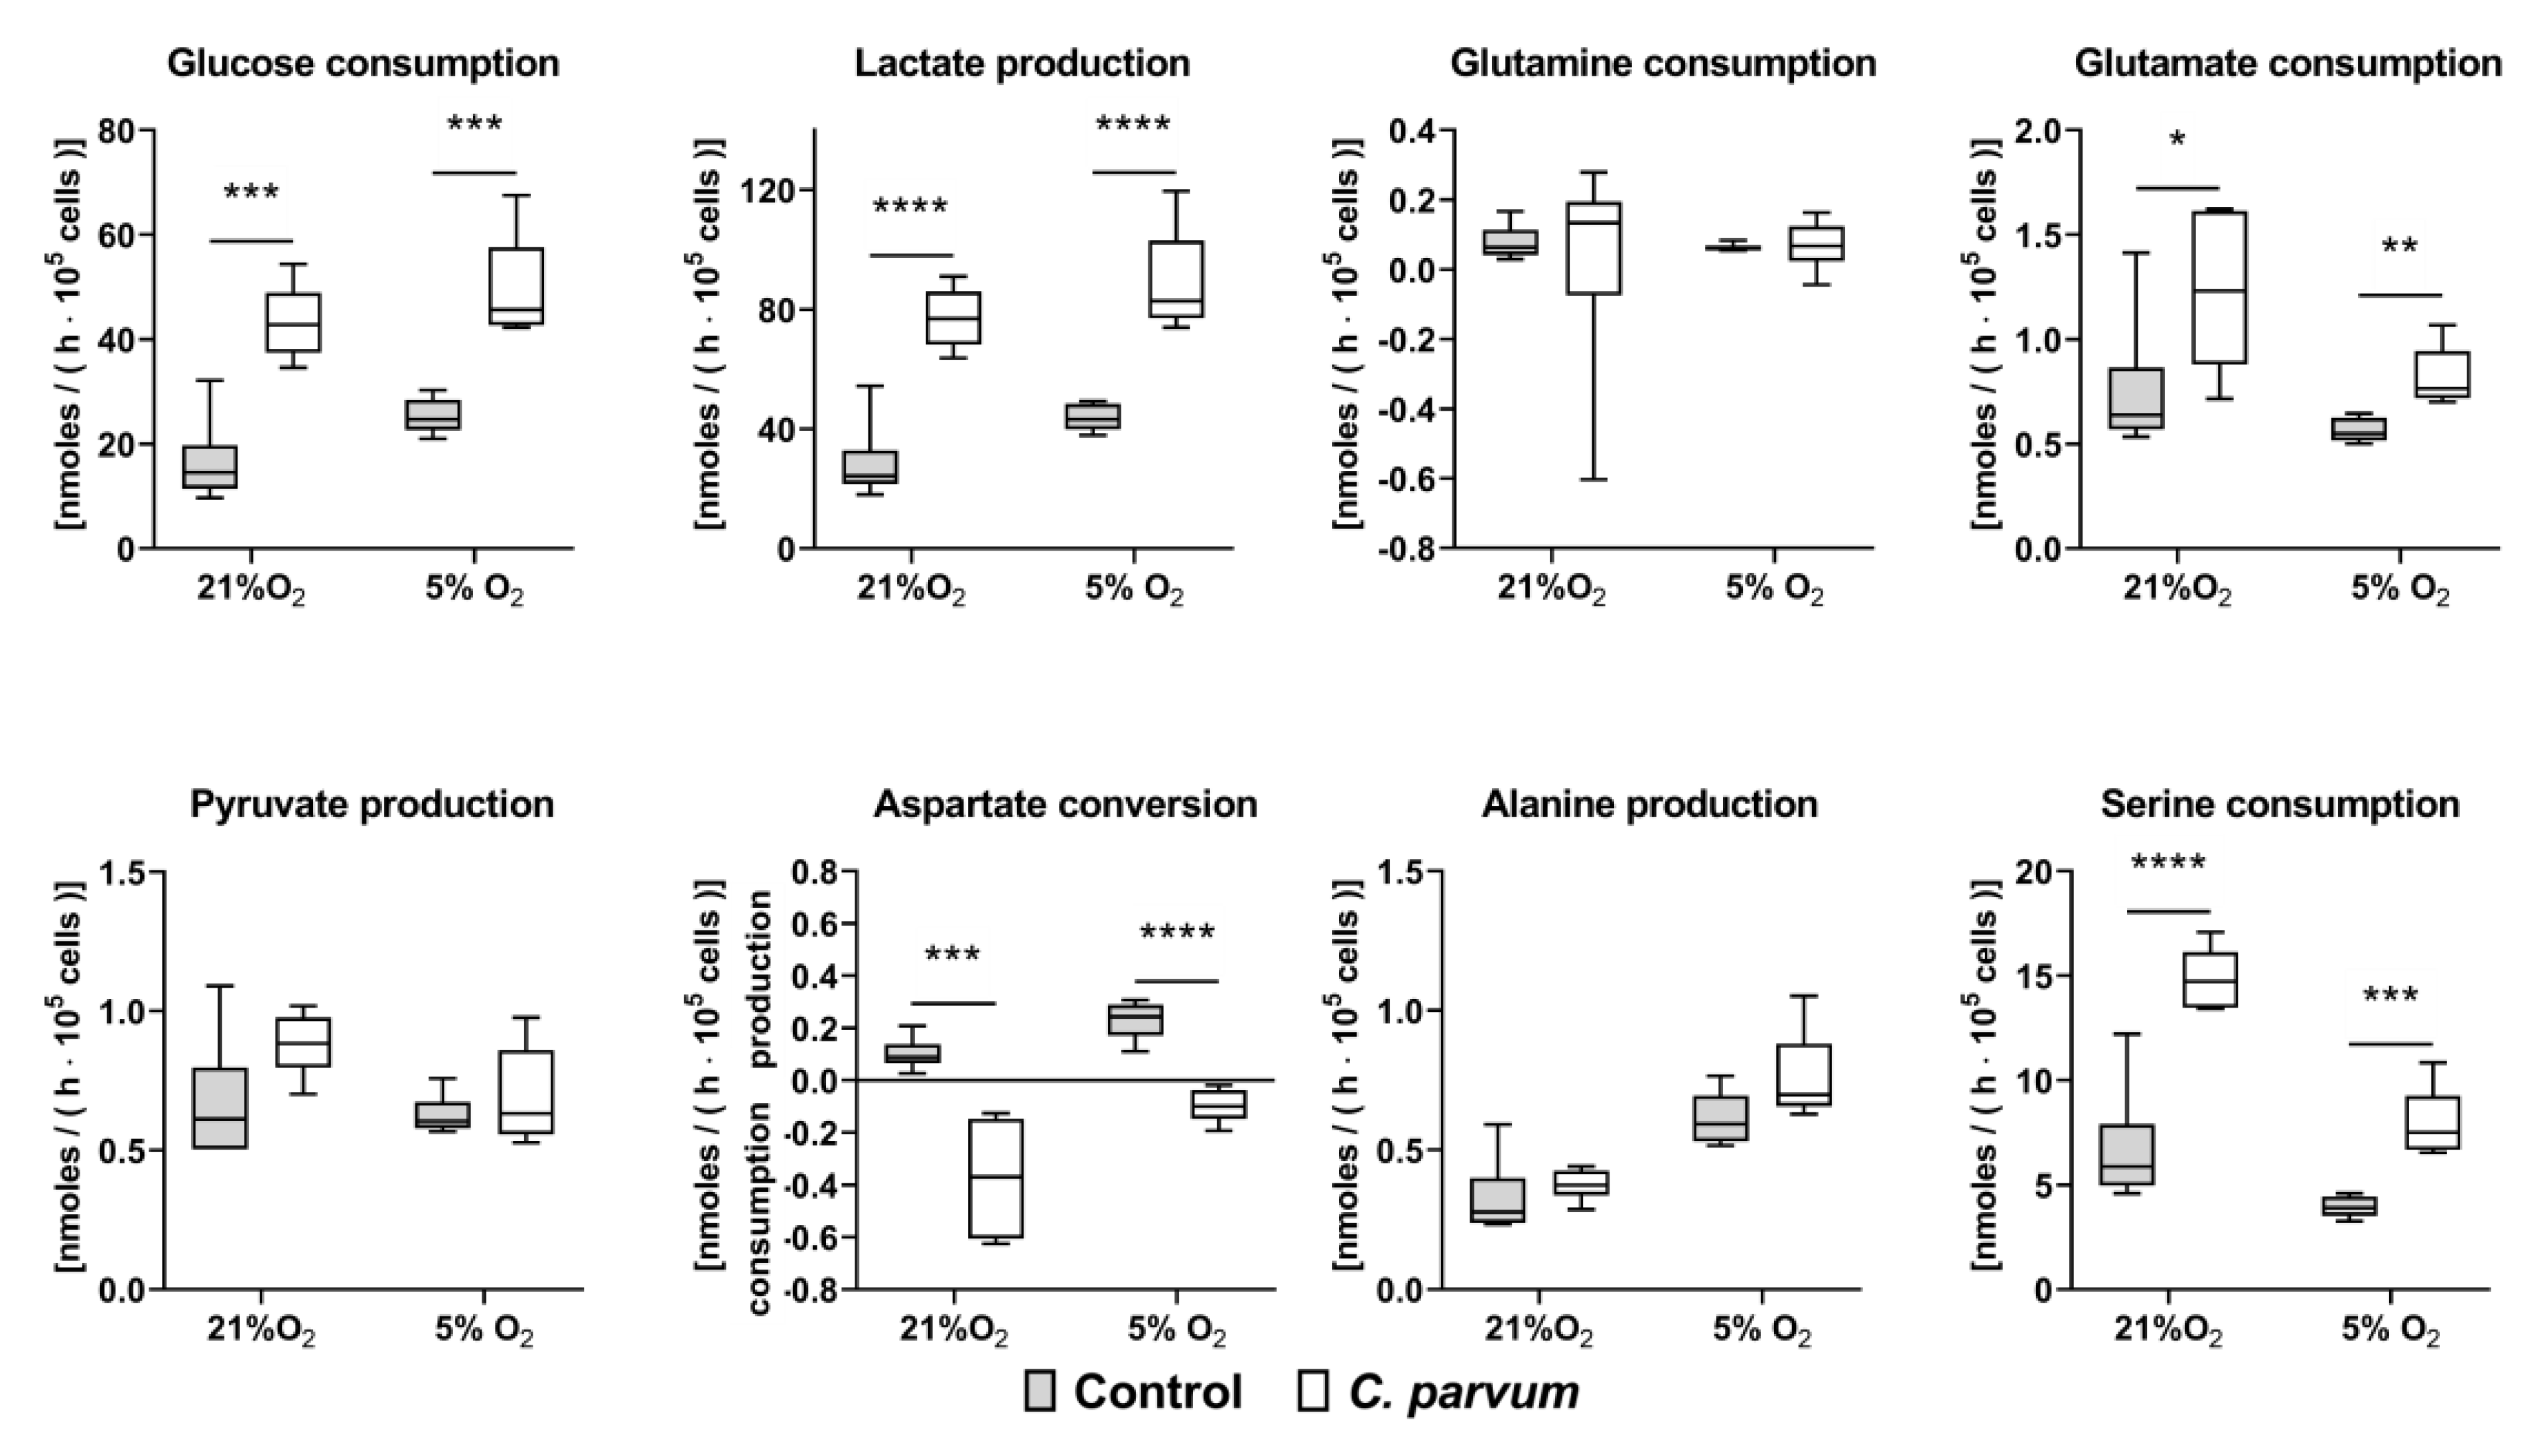
3.2. Metabolic Signatures of C. parvum-Infected HCT-8 Cells Depend on Oxygen and Glutamine Supply
3.3. Effects of Selected Metabolic Inhibitors on C. parvum Infection at 5% and 21% O2 Conditions
4. Discussion
5. Conclusions
Supplementary Materials
Author Contributions
Funding
Informed Consent Statement
Acknowledgments
Conflicts of Interest
References
- Raccurt, C.P. Worldwide human zoonotic cryptosporidiosis caused by Cryptosporidium felis. Parasite 2007, 14, 15–20. [Google Scholar] [CrossRef] [PubMed] [Green Version]
- Baydoun, M.; Vanneste, S.B.; Creusy, C.; Guyot, K.; Gantois, N.; Chabe, M.; Delaire, B.; Mouray, A.; Baydoun, A.; Forzy, G.; et al. Three-dimensional (3D) culture of adult murine colon as an in vitro model of cryptosporidiosis: Proof of concept. Sci. Rep. 2017, 7, 17288. [Google Scholar] [CrossRef] [PubMed] [Green Version]
- O’Connor, R.M.; Shaffie, R.; Kang, G.; Ward, H.D. Cryptosporidiosis in patients with HIV/AIDS. AIDS 2011, 25, 549. [Google Scholar] [CrossRef]
- Liu, L.; Johnson, H.L.; Cousens, S.; Perin, J.; Scott, S.; Lawn, J.E.; Rudan, I.; Campbell, H.; Cibulskis, R.; Li, M.; et al. Global, regional, and national causes of child mortality: An updated systematic analysis for 2010 with time trends since 2000. Lancet 2012, 379, 2151–2161. [Google Scholar] [CrossRef]
- Hedstrom, L. Cryptosporidium: A first step toward tractability. Trends Parasitol. 2015, 31, 401–402. [Google Scholar] [CrossRef] [Green Version]
- Kotloff, K.L.; Nataro, J.P.; Blackwelder, W.C.; Nasrin, D.; Farag, T.H.; Panchalingam, S.; Wu, Y.; Sow, S.O.; Sur, D.; Breiman, R.F.; et al. Burden and aetiology of diarrhoeal disease in infants and young children in developing countries (the Global Enteric Multicenter Study, GEMS): A prospective, case-control study. Lancet 2013, 382, 209–222. [Google Scholar] [CrossRef]
- Striepen, B. Parasitic infections: Time to tackle cryptosporidiosis. Nature 2013, 503, 189. [Google Scholar] [CrossRef] [Green Version]
- Manjunatha, U.H.; Vinayak, S.; Zambriski, J.A.; Chao, A.T.; Sy, T.; Noble, C.G.; Bonamy, G.M.C.; Kondreddi, R.R.; Zou, B.; Gedeck, P.; et al. A Cryptosporidium PI(4)K inhibitor is a drug candidate for cryptosporidiosis. Nature 2017, 546, 376–380. [Google Scholar] [CrossRef]
- Ryan, U.; Hijjawi, N.; Xiao, L. Foodborne cryptosporidiosis. Int. J. Parasitol. 2018, 48, 1–12. [Google Scholar] [CrossRef] [Green Version]
- Gibson, A.R.; Striepen, B. Cryptosporidium. Curr. Biol. 2018, 28, R193–R194. [Google Scholar] [CrossRef] [Green Version]
- Amadi, B.; Mwiya, M.; Sianongo, S.; Payne, L.; Watuka, A.; Katubulushi, M.; Kelly, P. High dose prolonged treatment with nitazoxanide is not effective for cryptosporidiosis in HIV positive Zambian children: A randomised controlled trial. BMC Infect. Dis. 2009, 9, 195. [Google Scholar] [CrossRef] [PubMed] [Green Version]
- Bessoff, K.; Sateriale, A.; Lee, K.K.; Huston, C.D. Drug Repurposing Screen Reveals FDA-Approved Inhibitors of Human HMG-CoA Reductase and Isoprenoid Synthesis That Block Cryptosporidium parvum Growth. Antimicrob. Agents Chemother. 2013, 57, 1804–1814. [Google Scholar] [CrossRef] [PubMed] [Green Version]
- Abrahamsen, M.S.; Templeton, T.J.; Enomoto, S.; Abrahante, J.E.; Zhu, G.; Lancto, C.A.; Deng, M.; Liu, C.; Widmer, G.; Tzipori, S.; et al. Complete Genome Sequence of the Apicomplexan, Cryptosporidium parvum. Science 2004, 304, 441–445. [Google Scholar] [CrossRef] [Green Version]
- Mauzy, M.J.; Enomoto, S.; Lancto, C.A.; Abrahamsen, M.S.; Rutherford, M.S. The Cryptosporidium parvum Transcriptome during In Vitro Development. PLoS ONE 2012, 7, e31715. [Google Scholar] [CrossRef] [PubMed] [Green Version]
- Clode, P.L.; Koh, W.H.; Thompson, R.C.A. Life without a Host Cell: What is Cryptosporidium? Trends Parasitol. 2015, 31, 614–624. [Google Scholar] [CrossRef]
- Liu, S.; Roellig, D.M.; Guo, Y.; Li, N.; Frace, M.A.; Tang, K.; Zhang, L.; Feng, Y.; Xiao, L. Evolution of mitosome metabolism and invasion-related proteins in Cryptosporidium. BMC Genom. 2016, 17, 1006. [Google Scholar] [CrossRef] [Green Version]
- Morada, M.; Lee, S.; Gunther-Cummins, L.; Weiss, L.M.; Widmer, G.; Tzipori, S.; Yarlett, N. Continuous culture of Cryptosporidium parvum using hollow fiber technology. Int. J. Parasitol. 2016, 46, 21–29. [Google Scholar] [CrossRef]
- Xu, Z.; Guo, Y.; Roellig, D.M.; Feng, Y.; Xiao, L. Comparative analysis reveals conservation in genome organization among intestinal Cryptosporidium species and sequence divergence in potential secreted pathogenesis determinants among major human-infecting species. BMC Genom. 2019, 20, 406. [Google Scholar] [CrossRef]
- Schnepf, E.; Deichgräber, G. “Myzocytosis”, a kind of endocytosis with implications to compartmentation in endosymbiosis. Naturwissenschaften 1984, 71, 218–219. [Google Scholar] [CrossRef]
- Barta, J.R.; Thompson, R.C.A. What is Cryptosporidium? Reappraising its biology and phylogenetic affinities. Trends Parasitol. 2006, 22, 463–468. [Google Scholar] [CrossRef]
- Leander, B.S.; Keeling, P.J. Morphostasis in alveolate evolution. Trends Ecol. Evol. 2003, 18, 395–402. [Google Scholar] [CrossRef] [Green Version]
- Cavalier-Smith, T. Gregarine site-heterogeneous 18S rDNA trees, revision of gregarine higher classification, and the evolutionary diversification of Sporozoa. Eur. J. Protistol. 2014, 50, 472–495. [Google Scholar] [CrossRef]
- Xu, T.; Ping, J.; Yu, Y.; Yu, F.; Yu, Y.; Hao, P.; Li, X. Revealing parasite influence in metabolic pathways in Apicomplexa infected patients. BMC Bioinform. 2010, 11, S13. [Google Scholar] [CrossRef] [Green Version]
- Ng, J.S.Y.; Ryan, U.; Trengove, R.D.; Maker, G.L. Development of an untargeted metabolomics method for the analysis of human faecal samples using Cryptosporidium-infected samples. Mol. Biochem. Parasitol. 2012, 185, 145–150. [Google Scholar] [CrossRef]
- Hublin, J.S.Y.N.; Ryan, U.; Trengove, R.; Maker, G. Metabolomic Profiling of Faecal Extracts from Cryptosporidium parvum Infection in Experimental Mouse Models. PLoS ONE 2013, 8, e77803. [Google Scholar] [CrossRef]
- Miller, C.N.; Panagos, C.G.; Mosedale, W.R.T.; Kváč, M.; Howard, M.J.; Tsaousis, A.D. NMR metabolomics reveals effects of Cryptosporidium infections on host cell metabolome. Gut Pathog. 2019, 11, 13. [Google Scholar] [CrossRef] [Green Version]
- Zhang, H.; Guo, F.; Zhu, G. Cryptosporidium Lactate Dehydrogenase Is Associated with the Parasitophorous Vacuole Membrane and Is a Potential Target for Developing Therapeutics. PLoS Pathog. 2015, 11, e1005250. [Google Scholar] [CrossRef]
- Yu, Y.; Zhang, H.; Guo, F.; Sun, M.; Zhu, G. A unique hexokinase in Cryptosporidium parvum, an apicomplexan pathogen lacking the Krebs cycle and oxidative phosphorylation. Protist 2014, 165, 701–714. [Google Scholar] [CrossRef] [Green Version]
- Cook, W.J.; Senkovich, O.; Hernandez, A.; Speed, H.; Chattopadhyay, D. Biochemical and structural characterization of Cryptosporidium parvum Lactate dehydrogenase. Int. J. Biol. Macromol. 2015, 74, 608–619. [Google Scholar] [CrossRef] [Green Version]
- Li, K.; Nader, S.M.; Zhang, X.; Ray, B.C.; Kim, C.Y.; Das, A.; Witola, W.H. Novel lactate dehydrogenase inhibitors with in vivo efficacy against Cryptosporidium parvum. PLoS Pathog. 2019, 15, e1007953. [Google Scholar] [CrossRef] [Green Version]
- Blume, M.; Rodriguez-Contreras, D.; Landfear, S.; Fleige, T.; Soldati-Favre, D.; Lucius, R.; Gupta, N. Host-derived glucose and its transporter in the obligate intracellular pathogen Toxoplasma gondii are dispensable by glutaminolysis. Proc. Natl. Acad. Sci. USA 2009, 106, 12998–13003. [Google Scholar] [CrossRef] [PubMed] [Green Version]
- Nitzsche, R.; Zagoriy, V.; Lucius, R.; Gupta, N. Metabolic Cooperation of Glucose and Glutamine Is Essential for the Lytic Cycle of Obligate Intracellular Parasite Toxoplasma gondii. J. Biol. Chem. 2016, 291, 126–141. [Google Scholar] [CrossRef] [PubMed] [Green Version]
- Taubert, A.; Hermosilla, C.; Silva, L.M.R.; Wieck, A.; Failing, K.; Mazurek, S. Metabolic signatures of Besnoitia besnoiti-infected endothelial host cells and blockage of key metabolic pathways indicate high glycolytic and glutaminolytic needs of the parasite. Parasitol. Res. 2016, 115, 2023–2034. [Google Scholar] [CrossRef]
- Makiuchi, T.; Nozaki, T. Highly divergent mitochondrion-related organelles in anaerobic parasitic protozoa. Biochimie 2014, 100, 3–17. [Google Scholar] [CrossRef] [Green Version]
- Ryan, U.; Paparini, A.; Monis, P.; Hijjawi, N. It’s official—Cryptosporidium is a gregarine: What are the implications for the water industry? Water Res. 2016, 105, 305–313. [Google Scholar] [CrossRef] [Green Version]
- Borowski, H.; Clode, P.L.; Thompson, R.C.A. Active invasion and/or encapsulation? A reappraisal of host-cell parasitism by Cryptosporidium. Trends Parasitol. 2008, 24, 509–516. [Google Scholar] [CrossRef]
- Borowski, H.; Thompson, R.C.A.; Armstrong, T.; Clode, P.L. Morphological characterization of Cryptosporidium parvum life-cycle stages in an in vitro model system. Parasitology 2010, 137, 13–26. [Google Scholar] [CrossRef] [Green Version]
- Helander, H.F.; Fändriks, L. Surface area of the digestive tract-revisited. Scand. J. Gastroenterol. 2014, 49, 681–689. [Google Scholar] [CrossRef]
- Carreau, A.; Hafny-Rahbi, B.E.; Matejuk, A.; Grillon, C.; Kieda, C. Why is the partial oxygen pressure of human tissues a crucial parameter? Small molecules and hypoxia. J. Cell. Mol. Med. 2011, 15, 1239–1253. [Google Scholar] [CrossRef] [Green Version]
- Zheng, L.; Kelly, C.J.; Colgan, S.P. Physiologic hypoxia and oxygen homeostasis in the healthy intestine. A Review in the Theme: Cellular Responses to Hypoxia. Am. J. Physiol. Cell Physiol. 2015, 309, C350–C360. [Google Scholar] [CrossRef] [Green Version]
- Semenza, G.L. Oxygen Sensing, Homeostasis, and Disease. N. Engl. J. Med. 2011, 365, 537–547. [Google Scholar] [CrossRef] [PubMed] [Green Version]
- Bartrons, R.; Caro, J. Hypoxia, glucose metabolism and the Warburg’s effect. J. Bioenerg. Biomembr. 2007, 39, 223–229. [Google Scholar] [CrossRef] [PubMed]
- Jin, L.; Alesi, G.N.; Kang, S. Glutaminolysis as a target for cancer therapy. Oncogene 2016, 35, 3619–3625. [Google Scholar] [CrossRef] [Green Version]
- Matés, J.M.; Di Paola, F.J.; Campos-Sandoval, J.A.; Mazurek, S.; Márquez, J. Therapeutic targeting of glutaminolysis as an essential strategy to combat cancer. Semin. Cell Dev. Biol. 2020, 98, 34–43. [Google Scholar] [CrossRef] [PubMed]
- Unterluggauer, H.; Mazurek, S.; Lener, B.; Hütter, E.; Eigenbrodt, E.; Zwerschke, W.; Jansen-Dürr, P. Premature senescence of human endothelial cells induced by inhibition of glutaminase. Biogerontology 2008, 9, 247–259. [Google Scholar] [CrossRef]
- Papandreou, I.; Cairns, R.A.; Fontana, L.; Lim, A.L.; Denko, N.C. HIF-1 mediates adaptation to hypoxia by actively downregulating mitochondrial oxygen consumption. Cell Metab. 2006, 3, 187–197. [Google Scholar] [CrossRef] [Green Version]
- Shahiduzzaman, M.; Dyachenko, V.; Obwaller, A.; Unglaube, S.; Daugschies, A. Combination of cell culture and quantitative PCR for screening of drugs against Cryptosporidium parvum. Vet. Parasitol. 2009, 162, 271–277. [Google Scholar] [CrossRef]
- Holzhausen, I.; Lendner, M.; Göhring, F.; Steinhöfel, I.; Daugschies, A. Distribution of Cryptosporidium parvum gp60 subtypes in calf herds of Saxony, Germany. Parasitol. Res. 2019, 118, 1549–1558. [Google Scholar] [CrossRef]
- Vélez, J.; Lange, M.K.; Zieger, P.; Yoon, I.; Failing, K.; Bauer, C. Long-term use of yeast fermentation products in comparison to halofuginone for the control of cryptosporidiosis in neonatal calves. Vet. Parasitol. 2019, 269, 57–64. [Google Scholar] [CrossRef]
- Broglia, A.; Reckinger, S.; Cacció, S.M.; Nöckler, K. Distribution of Cryptosporidium parvum subtypes in calves in Germany. Vet. Parasitol. 2008, 154, 8–13. [Google Scholar] [CrossRef]
- Nichols, G.L.; Chalmers, R.M.; Hadfield, S.J. Molecular Epidemiology of Human Cryptosporidiosis. In Cryptosporidium: Parasite and Disease; Cacciò, S.M., Widmer, G., Eds.; Springer: Vienna, Austria, 2014; pp. 81–147. [Google Scholar]
- Varughese, E.A.; Bennett-Stamper, C.L.; Wymer, L.J.; Yadav, J.S. A new in vitro model using small intestinal epithelial cells to enhance infection of Cryptosporidium parvum. J. Microbiol. Methods 2014, 106, 47–54. [Google Scholar] [CrossRef] [PubMed]
- Fichtner, T.; Kotarski, F.; Gärtner, U.; Conejeros, I.; Hermosilla, C.; Wrenzycki, C.; Taubert, A. Bovine sperm samples induce different NET phenotypes in a NADPH oxidase-, PAD4-, and Ca++-dependent process. Biol. Reprod. 2020, 102, 902–914. [Google Scholar] [CrossRef] [PubMed]
- Eigenbrodt, E.; Kallinowski, F.; Ott, M.; Mazurek, S.; Vaupel, P. Pyruvate kinase and the interaction of amino acid and carbohydrate metabolism in solid tumors. Anticancer Res. 1998, 18, 3267–3274. [Google Scholar] [PubMed]
- Mazurek, S.; Eigenbrodt, E.; Failing, K.; Steinberg, P. Alterations in the glycolytic and glutaminolytic pathways after malignant transformation of rat liver oval cells. J. Cell. Physiol. 1999, 181, 136–146. [Google Scholar] [CrossRef]
- Mazurek, S.; Zwerschke, W.; Jansen-Dürr, P.; Eigenbrodt, E. Effects of the human papilloma virus HPV-16 E7 oncoprotein on glycolysis and glutaminolysis: Role of pyruvate kinase type M2 and the glycolytic-enzyme complex. Biochem. J. 2001, 356, 247–256. [Google Scholar] [CrossRef] [PubMed]
- Ammon, H.P.T. Methoden der Enzymatischen Analyse; Von, H.U., Ed.; Verlag Chemie GmbH: Weinheim/Bergstraße, Germany, 1974; pp. 92–93. [Google Scholar]
- Divakaruni, A.S.; Paradyse, A.; Ferrick, D.A.; Murphy, A.N.; Jastroch, M. Analysis and interpretation of microplate-based oxygen consumption and pH data. Methods Enzymol. 2014, 547, 309–354. [Google Scholar] [CrossRef]
- Medina, M.A.; Ignacio, N.; Castro, D. Glutaminolysis and glycolysis interactions in proliferant cells. Int. J. Biochem. 1990, 22, 681–683. [Google Scholar] [CrossRef]
- Jacot, D.; Waller, R.F.; Soldati-Favre, D.; MacPherson, D.A.; MacRae, J.I. Apicomplexan Energy Metabolism: Carbon Source Promiscuity and the Quiescence Hyperbole. Trends Parasitol. 2016, 32, 56–70. [Google Scholar] [CrossRef]
- Bhattacharya, B.; Omar, M.F.M.; Soong, R. The Warburg effect and drug resistance. Br. J. Pharmacol. 2016, 173, 970–979. [Google Scholar] [CrossRef]
- Dixon, W.J. BMDP Statistical Software Manual: To Accompany BMDP/Dynamic Release 8.1; University of California Press: Berkeley, CA, USA, 1993; Volume 1–2. [Google Scholar]
- Farabegoli, F.; Vettraino, M.; Manerba, M.; Fiume, L.; Roberti, M.; Di Stefano, G. Galloflavin, a new lactate dehydrogenase inhibitor, induces the death of human breast cancer cells with different glycolytic attitude by affecting distinct signaling pathways. Eur. J. Pharm. Sci. 2012, 47, 729–738. [Google Scholar] [CrossRef]
- Penna-Coutinho, J.; Cortopassi, W.A.; Oliveira, A.A.; França, T.C.C.; Krettli, A.U. Antimalarial Activity of Potential Inhibitors of Plasmodium falciparum Lactate Dehydrogenase Enzyme Selected by Docking Studies. PLoS ONE 2011, 6, e21237. [Google Scholar] [CrossRef] [Green Version]
- Nath, K.; Guo, L.; Nancolas, B.; Nelson, D.S.; Shestov, A.A.; Lee, S.-C.; Roman, J.; Zhou, R.; Leeper, D.B.; Halestrap, A.P.; et al. Mechanism of antineoplastic activity of lonidamine. Biochim. Biophys. Rev. Cancer 2016, 1866, 151–162. [Google Scholar] [CrossRef] [Green Version]
- Guo, L.; Shestov, A.A.; Worth, A.J.; Nath, K.; Nelson, D.S.; Leeper, D.B.; Glickson, J.D.; Blair, I.A. Inhibition of Mitochondrial Complex II by the Anticancer Agent Lonidamine. J. Biol. Chem. 2016, 291, 42–57. [Google Scholar] [CrossRef] [PubMed] [Green Version]
- Benjamin, D.; Robay, D.; Hindupur, S.K.; Pohlmann, J.; Colombi, M.; El-Shemerly, M.Y.; Maira, S.-M.; Moroni, C.; Lane, H.A.; Hall, M.N. Dual Inhibition of the Lactate Transporters MCT1 and MCT4 Is Synthetic Lethal with Metformin due to NAD+ Depletion in Cancer Cells. Cell Rep. 2018, 25, 3047–3058. [Google Scholar] [CrossRef] [PubMed] [Green Version]
- Benjamin, D.; Colombi, M.; Hindupur, S.K.; Betz, C.; Lane, H.A.; El-Shemerly, M.Y.M.; Lu, M.; Quagliata, L.; Terracciano, L.; Moes, S.; et al. Syrosingopine sensitizes cancer cells to killing by metformin. Sci. Adv. 2016, 2, e1601756. [Google Scholar] [CrossRef] [Green Version]
- Lu, W.; Pelicano, H.; Huang, P. Cancer metabolism: Is glutamine sweeter than glucose? Cancer Cell 2010, 18, 199–200. [Google Scholar] [CrossRef] [Green Version]
- Leander, B.S.; Lloyd, S.A.J.; Marshall, W.; Landers, S.C. Phylogeny of Marine Gregarines (Apicomplexa)—Pterospora, Lithocystis and Lankesteria—and the Origin(s) of Coelomic Parasitism. Protist 2006, 157, 45–60. [Google Scholar] [CrossRef]
- Cavalier-Smith, T.; Chao, E.E. Protalveolate phylogeny and systematics and the origins of Sporozoa and dinoflagellates (phylum Myzozoa nom. nov.). Eur. J. Protistol. 2004, 40, 185–212. [Google Scholar] [CrossRef]
- Gentile, A.; Sconza, S.; Lorenz, I.; Otranto, G.; Rademacher, G.; Famigli-Bergamini, P.; Klee, W. d-Lactic Acidosis in Calves as a Consequence of Experimentally Induced Ruminal Acidosis. J. Vet. Med. 2004, 51, 64–70. [Google Scholar] [CrossRef]
- Lorenz, I.; Gentile, A. d-Lactic Acidosis in Neonatal Ruminants. Vet. Clin. Food Anim. Pract. 2014, 30, 317–331. [Google Scholar] [CrossRef]
- Boza, J.J.; Moënnoz, D.; Bournot, C.E.; Blum, S.; Zbinden, I.; Finot, P.A.; Ballèvre, O. Role of glutamine on the de novo purine nucleotide synthesis in Caco-2 cells. Eur. J. Nutr. 2000, 39, 38–46. [Google Scholar] [CrossRef] [PubMed] [Green Version]
- Mazurek, S.; Boschek, C.B.; Hugo, F.; Eigenbrodt, E. Pyruvate kinase type M2 and its role in tumor growth and spreading. Semin. Cancer Biol. 2005, 15, 300–308. [Google Scholar] [CrossRef] [PubMed]
- Zielke, H.R.; Sumbilla, C.M.; Sevdalian, D.A.; Hawkins, R.L.; Ozand, P.T. Lactate: A major product of glutamine metabolism by human diploid fibroblasts. J. Cell. Physiol. 1980, 104, 433–441. [Google Scholar] [CrossRef] [PubMed]
- Zielke, H.R.; Ozand, P.T.; Tildon, J.T.; Sevdalian, D.A.; Cornblath, M. Reciprocal regulation of glucose and glutamine utilization by cultured human diploid fibroblasts. J. Cell. Physiol. 1978, 95, 41–48. [Google Scholar] [CrossRef] [PubMed]
- Ardawi, M.S.M. Glutamine and glucose metabolism in human peripheral lymphocytes. Metabolism 1988, 37, 99–103. [Google Scholar] [CrossRef]
- Wu, G. Intestinal Mucosal Amino Acid Catabolism. J. Nutr. 1998, 128, 1249–1252. [Google Scholar] [CrossRef] [Green Version]
- Rhoads, J.M.; Argenzio, R.A.; Chen, W.; Rippe, R.A.; Westwick, J.K.; Cox, A.D.; Berschneider, H.M.; Brenner, D.A. L-glutamine stimulates intestinal cell proliferation and activates mitogen-activated protein kinases. Am. J. Physiol. Gastroint. Liver Physiol. 1997, 272, G943–G953. [Google Scholar] [CrossRef]
- Scheppach, W.; Loges, C.; Bartram, P.; Christl, S.U.; Richter, F.; Dusel, G.; Stehle, P.; Fuerst, P.; Kasper, H. Effect of free glutamine and alanyl-glutamine dipeptide on mucosal proliferation of the human ileum and colon. Gastroenterology 1994, 107, 429–434. [Google Scholar] [CrossRef]
- Li, N.; Lewis, P.; Samuelson, D.; Liboni, K.; Neu, J. Glutamine regulates Caco-2 cell tight junction proteins. Am. J. Physiol. Gastroint. Liver Physiol. 2004, 287, G726–G733. [Google Scholar] [CrossRef] [Green Version]
- DeMarco, V.G.; Li, N.; Thomas, J.; West, C.M.; Neu, J. Glutamine and Barrier Function in Cultured Caco-2 Epithelial Cell Monolayers. J. Nutr. 2003, 133, 2176–2179. [Google Scholar] [CrossRef] [Green Version]
- Alverdy, J.C. Effects of Glutamine-Supplemented Diets on Immunology of the Gut. J. Parenter. Enter. Nutr. 1990, 14, 109S–113S. [Google Scholar] [CrossRef]
- Li, P.; Yin, Y.-L.; Li, D.; Kim, S.W.; Wu, G. Amino acids and immune function. Br. J. Nutr. 2007, 98, 237–252. [Google Scholar] [CrossRef] [Green Version]
- Lima, A.A.M.; Brito, L.F.B.; Ribeiro, H.B.; Martins, M.C.V.; Lustosa, A.P.; Rocha, E.M.; Lima, N.L.; Monte, C.M.G.; Guerrant, R.L. Intestinal Barrier Function and Weight Gain in Malnourished Children Taking Glutamine Supplemented Enteral Formula. J. Pediatr. Gastroenterol. Nutr. 2005, 40, 28–35. [Google Scholar] [CrossRef] [PubMed]
- Alarcón, P.; Manosalva, C.; Conejeros, I.; Carretta, M.D.; Muñoz-Caro, T.; Silva, L.M.R.; Taubert, A.; Hermosilla, C.; Hidalgo, M.A.; Burgos, R.A. d(−) Lactic Acid-Induced Adhesion of Bovine Neutrophils onto Endothelial Cells Is Dependent on Neutrophils Extracellular Traps Formation and CD11b Expression. Front. Immunol. 2017, 8, 975. [Google Scholar] [CrossRef] [PubMed] [Green Version]
- Hidalgo, A.I.; Carretta, M.D.; Alarcón, P.; Manosalva, C.; Müller, A.; Navarro, M.; Hidalgo, M.A.; Kaehne, T.; Taubert, A.; Hermosilla, C.R.; et al. Pro-inflammatory mediators and neutrophils are increased in synovial fluid from heifers with acute ruminal acidosis. BMC Vet. Res. 2019, 15, 225. [Google Scholar] [CrossRef] [PubMed]
- Brinkmann, V.; Zychlinsky, A. Neutrophil extracellular traps: Is immunity the second function of chromatin? J. Cell Biol. 2012, 198, 773–783. [Google Scholar] [CrossRef] [Green Version]
- Hermosilla, C.; Caro, T.M.; Silva, L.M.R.; Ruiz, A.; Taubert, A. The intriguing host innate immune response: Novel anti-parasitic defence by neutrophil extracellular traps. Parasitology 2014, 141, 1489–1498. [Google Scholar] [CrossRef]
- Muñoz-Caro, T.; Lendner, M.; Daugschies, A.; Hermosilla, C.; Taubert, A. NADPH oxidase, MPO, NE, ERK1/2, p38 MAPK and Ca2+ influx are essential for Cryptosporidium parvum-induced NET formation. Dev. Comp. Immunol. 2015, 52, 245–254. [Google Scholar] [CrossRef]
- dos Santos, R.D.G.C.; Viana, M.L.; Generoso, S.V.; Arantes, R.E.; Davisson Correia, M.I.T.; Cardoso, V.N. Glutamine Supplementation Decreases Intestinal Permeability and Preserves Gut Mucosa Integrity in an Experimental Mouse Model. J. Parenter. Enter. Nutr. 2010, 34, 408–413. [Google Scholar] [CrossRef] [Green Version]
- De-Souza, D.A.; Greene, L.J. Intestinal permeability and systemic infections in critically ill patients: Effect of glutamine. Crit. Care Med. 2005, 33, 1125–1135. [Google Scholar] [CrossRef] [Green Version]
- Conejero, R.; Bonet, A.; Grau, T.; Esteban, A.; Mesejo, A.; Montejo, J.C.; López, J.; Acosta, J.A. Effect of a glutamine-enriched enteral diet on intestinal permeability and infectious morbidity at 28 days in critically ill patients with Systemic Inflammatory Response Syndrome: A randomized, single-blind, prospective, multicenter study. Nutrition 2002, 18, 716–721. [Google Scholar] [CrossRef]
- Gao, P.; Tchernyshyov, I.; Chang, T.-C.; Lee, Y.-S.; Kita, K.; Ochi, T.; Zeller, K.I.; De Marzo, A.M.; Van Eyk, J.E.; Mendell, J.T.; et al. c-Myc suppression of miR-23a/b enhances mitochondrial glutaminase expression and glutamine metabolism. Nature 2009, 458, 762–765. [Google Scholar] [CrossRef] [PubMed] [Green Version]
- Wang, J.-B.; Erickson, J.W.; Fuji, R.; Ramachandran, S.; Gao, P.; Dinavahi, R.; Wilson, K.F.; Ambrosio, A.L.B.; Dias, S.M.G.; Dang, C.V.; et al. Targeting mitochondrial glutaminase activity inhibits oncogenic transformation. Cancer Cell 2010, 18, 207–219. [Google Scholar] [CrossRef] [PubMed] [Green Version]
- Weiser, M.M. Intestinal Epithelial Cell Surface Membrane Glycoprotein Synthesis I. An indicator of cellular differentiation. J. Biol. Chem. 1973, 248, 2536–2541. [Google Scholar] [CrossRef]
- Eigenbrodt, E.; Glossmann, H. Glycolysis—one of the keys to cancer? Trends Pharmacol. Sci. 1980, 1, 240–245. [Google Scholar] [CrossRef]
- Yang, Z.; Wei, Z.; Hermosilla, C.; Taubert, A.; He, X.; Wang, X.; Gong, P.; Li, J.; Zhang, X. Caprine monocytes release extracellular traps against Neospora caninum in vitro. Front. Immunol. 2018, 8, 2016. [Google Scholar] [CrossRef]
- Peixoto, R.; Silva, L.M.; López-Osório, S.; Zhou, E.; Gärtner, U.; Conejeros, I.; Taubert, A.; Hermosilla, C. Fasciola hepatica induces weak NETosis and low production of intra- and extracellular ROS in exposed bovine polymorphonuclear neutrophils. Dev. Comp. Immunol. 2020, 114, 103787. [Google Scholar] [CrossRef]
- Pinheiro, C.; Longatto-Filho, A.; Azevedo-Silva, J.; Casal, M.; Schmitt, F.C.; Baltazar, F. Role of monocarboxylate transporters in human cancers: State of the art. J. Bioenerg. Biomembr. 2012, 44, 127–139. [Google Scholar] [CrossRef]
- Park, Y.; Diez-Silva, M.; Popescu, G.; Lykotrafitis, G.; Choi, W.; Feld, M.S.; Suresh, S. Refractive index maps and membrane dynamics of human red blood cells parasitized by Plasmodium falciparum. Proc. Natl. Acad. Sci. USA 2008, 105, 13730–13735. [Google Scholar] [CrossRef] [Green Version]
- Charrière, F.; Pavillon, N.; Colomb, T.; Depeursinge, C.; Heger, T.J.; Mitchell, E.A.D.; Marquet, P.; Rappaz, B. Living specimen tomography by digital holographic microscopy: Morphometry of testate amoeba. Opt. Express 2006, 14, 7005–7013. [Google Scholar] [CrossRef] [Green Version]
- Yakimovich, A.; Witte, R.; Andriasyan, V.; Georgi, F.; Greber, U.F. Label-Free Digital Holo-tomographic Microscopy Reveals Virus-Induced Cytopathic Effects in Live Cells. MSphere 2018, 3, e00599-18. [Google Scholar] [CrossRef] [PubMed] [Green Version]


Publisher’s Note: MDPI stays neutral with regard to jurisdictional claims in published maps and institutional affiliations. |
© 2021 by the authors. Licensee MDPI, Basel, Switzerland. This article is an open access article distributed under the terms and conditions of the Creative Commons Attribution (CC BY) license (http://creativecommons.org/licenses/by/4.0/).
Share and Cite
Vélez, J.; Velasquez, Z.; Silva, L.M.R.; Gärtner, U.; Failing, K.; Daugschies, A.; Mazurek, S.; Hermosilla, C.; Taubert, A. Metabolic Signatures of Cryptosporidium parvum-Infected HCT-8 Cells and Impact of Selected Metabolic Inhibitors on C. parvum Infection under Physioxia and Hyperoxia. Biology 2021, 10, 60. https://0-doi-org.brum.beds.ac.uk/10.3390/biology10010060
Vélez J, Velasquez Z, Silva LMR, Gärtner U, Failing K, Daugschies A, Mazurek S, Hermosilla C, Taubert A. Metabolic Signatures of Cryptosporidium parvum-Infected HCT-8 Cells and Impact of Selected Metabolic Inhibitors on C. parvum Infection under Physioxia and Hyperoxia. Biology. 2021; 10(1):60. https://0-doi-org.brum.beds.ac.uk/10.3390/biology10010060
Chicago/Turabian StyleVélez, Juan, Zahady Velasquez, Liliana M. R. Silva, Ulrich Gärtner, Klaus Failing, Arwid Daugschies, Sybille Mazurek, Carlos Hermosilla, and Anja Taubert. 2021. "Metabolic Signatures of Cryptosporidium parvum-Infected HCT-8 Cells and Impact of Selected Metabolic Inhibitors on C. parvum Infection under Physioxia and Hyperoxia" Biology 10, no. 1: 60. https://0-doi-org.brum.beds.ac.uk/10.3390/biology10010060