
Predicting Hotspots and Prioritizing Protected Areas for Endangered Primate Species in Indonesia under Changing Climate

 ,
,  ,
, 
Abstract
:Simple Summary
Abstract
1. Introduction
2. Methods
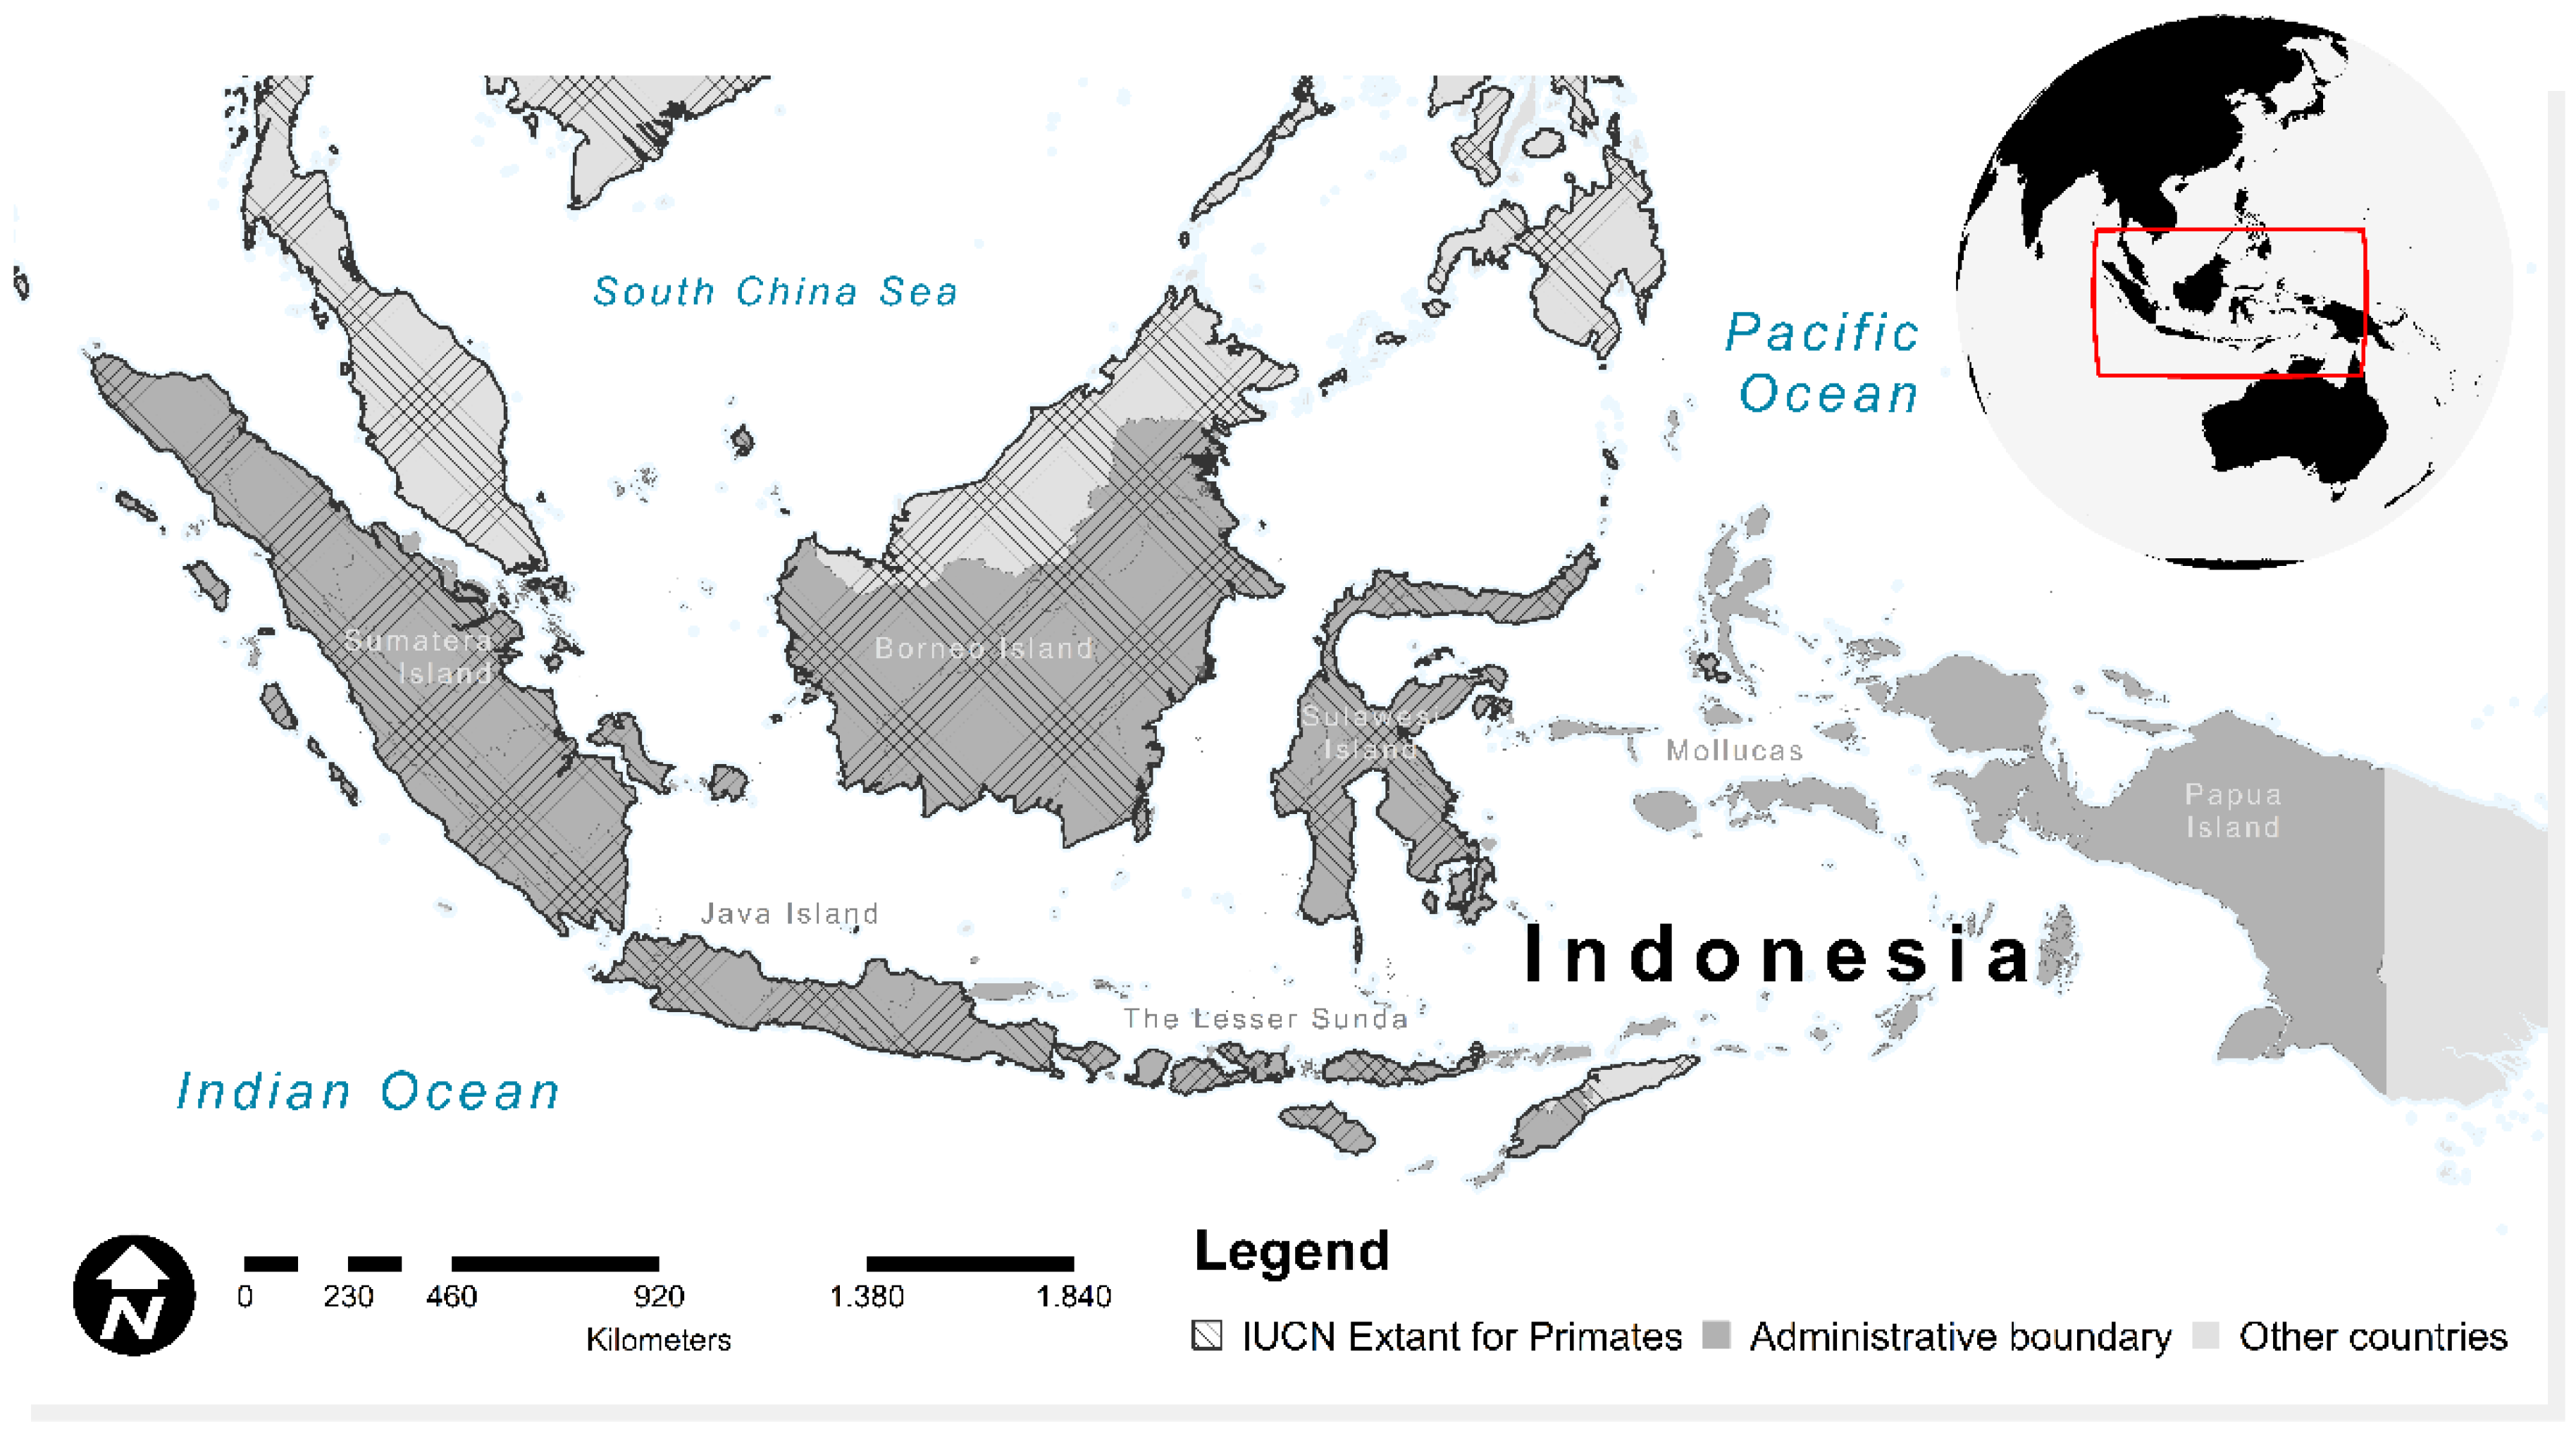
2.1. Study Area
2.2. Occurrence Data
2.3. Environmental Covariates
2.4. Model Calibration and Evaluation
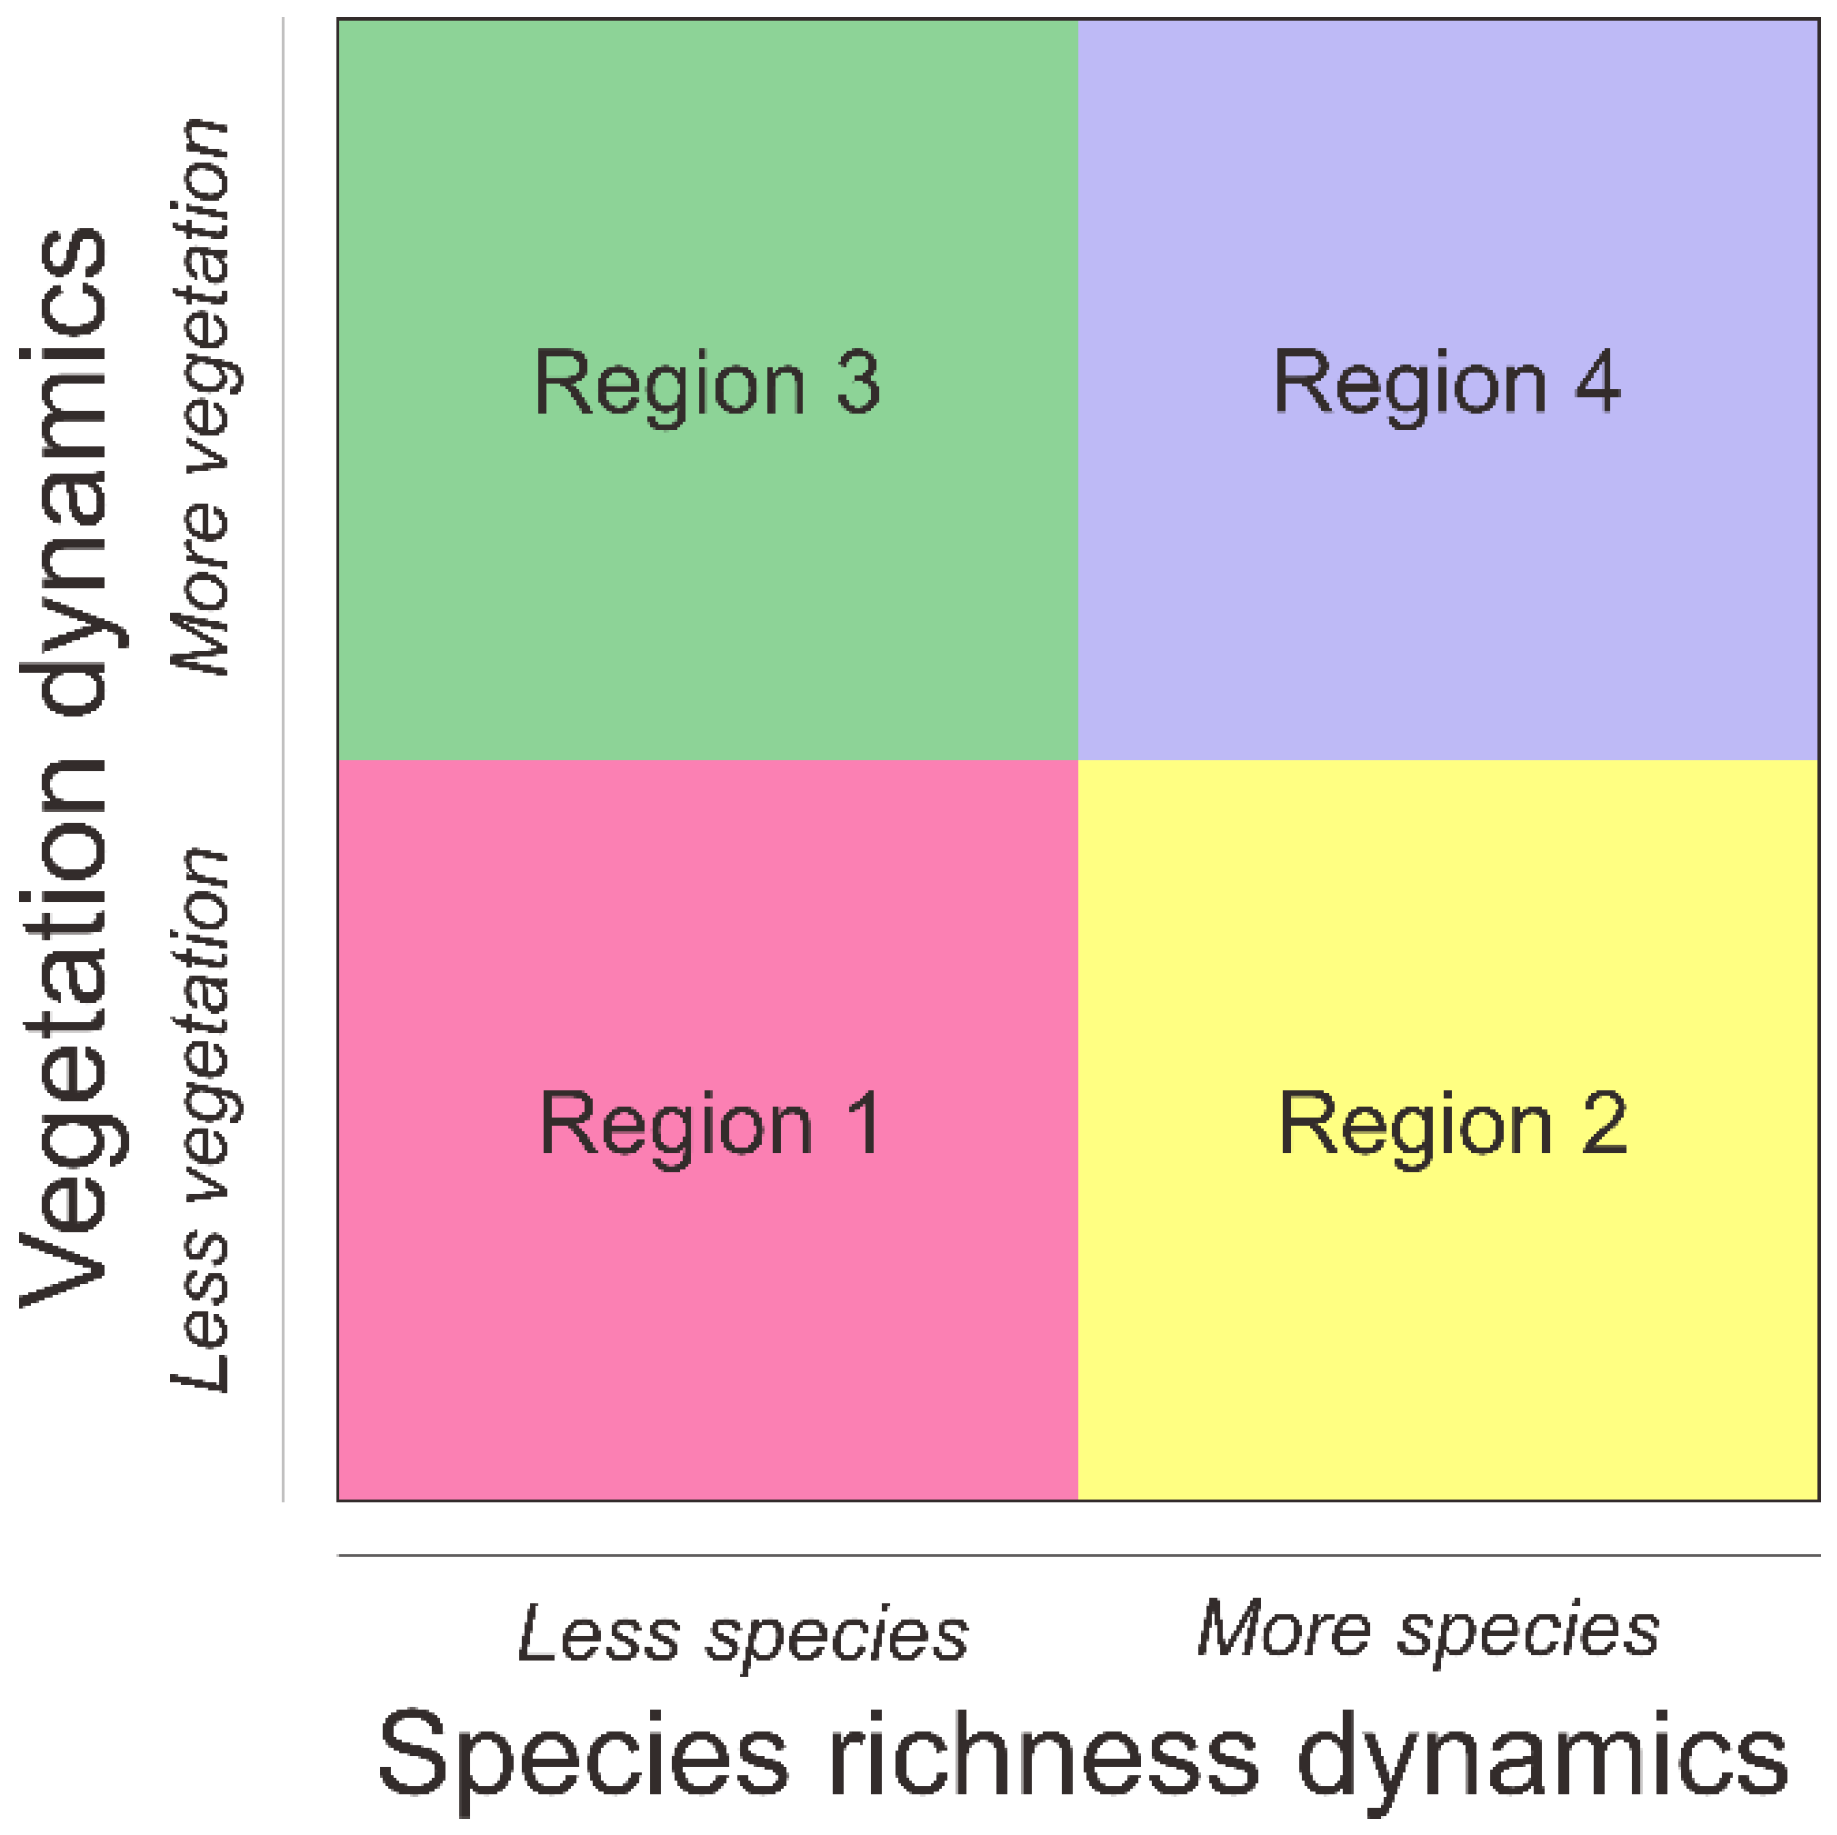
2.5. Biodiversity Redistribution and Protected-Area Prioritization
3. Results
3.1. Model Evaluation
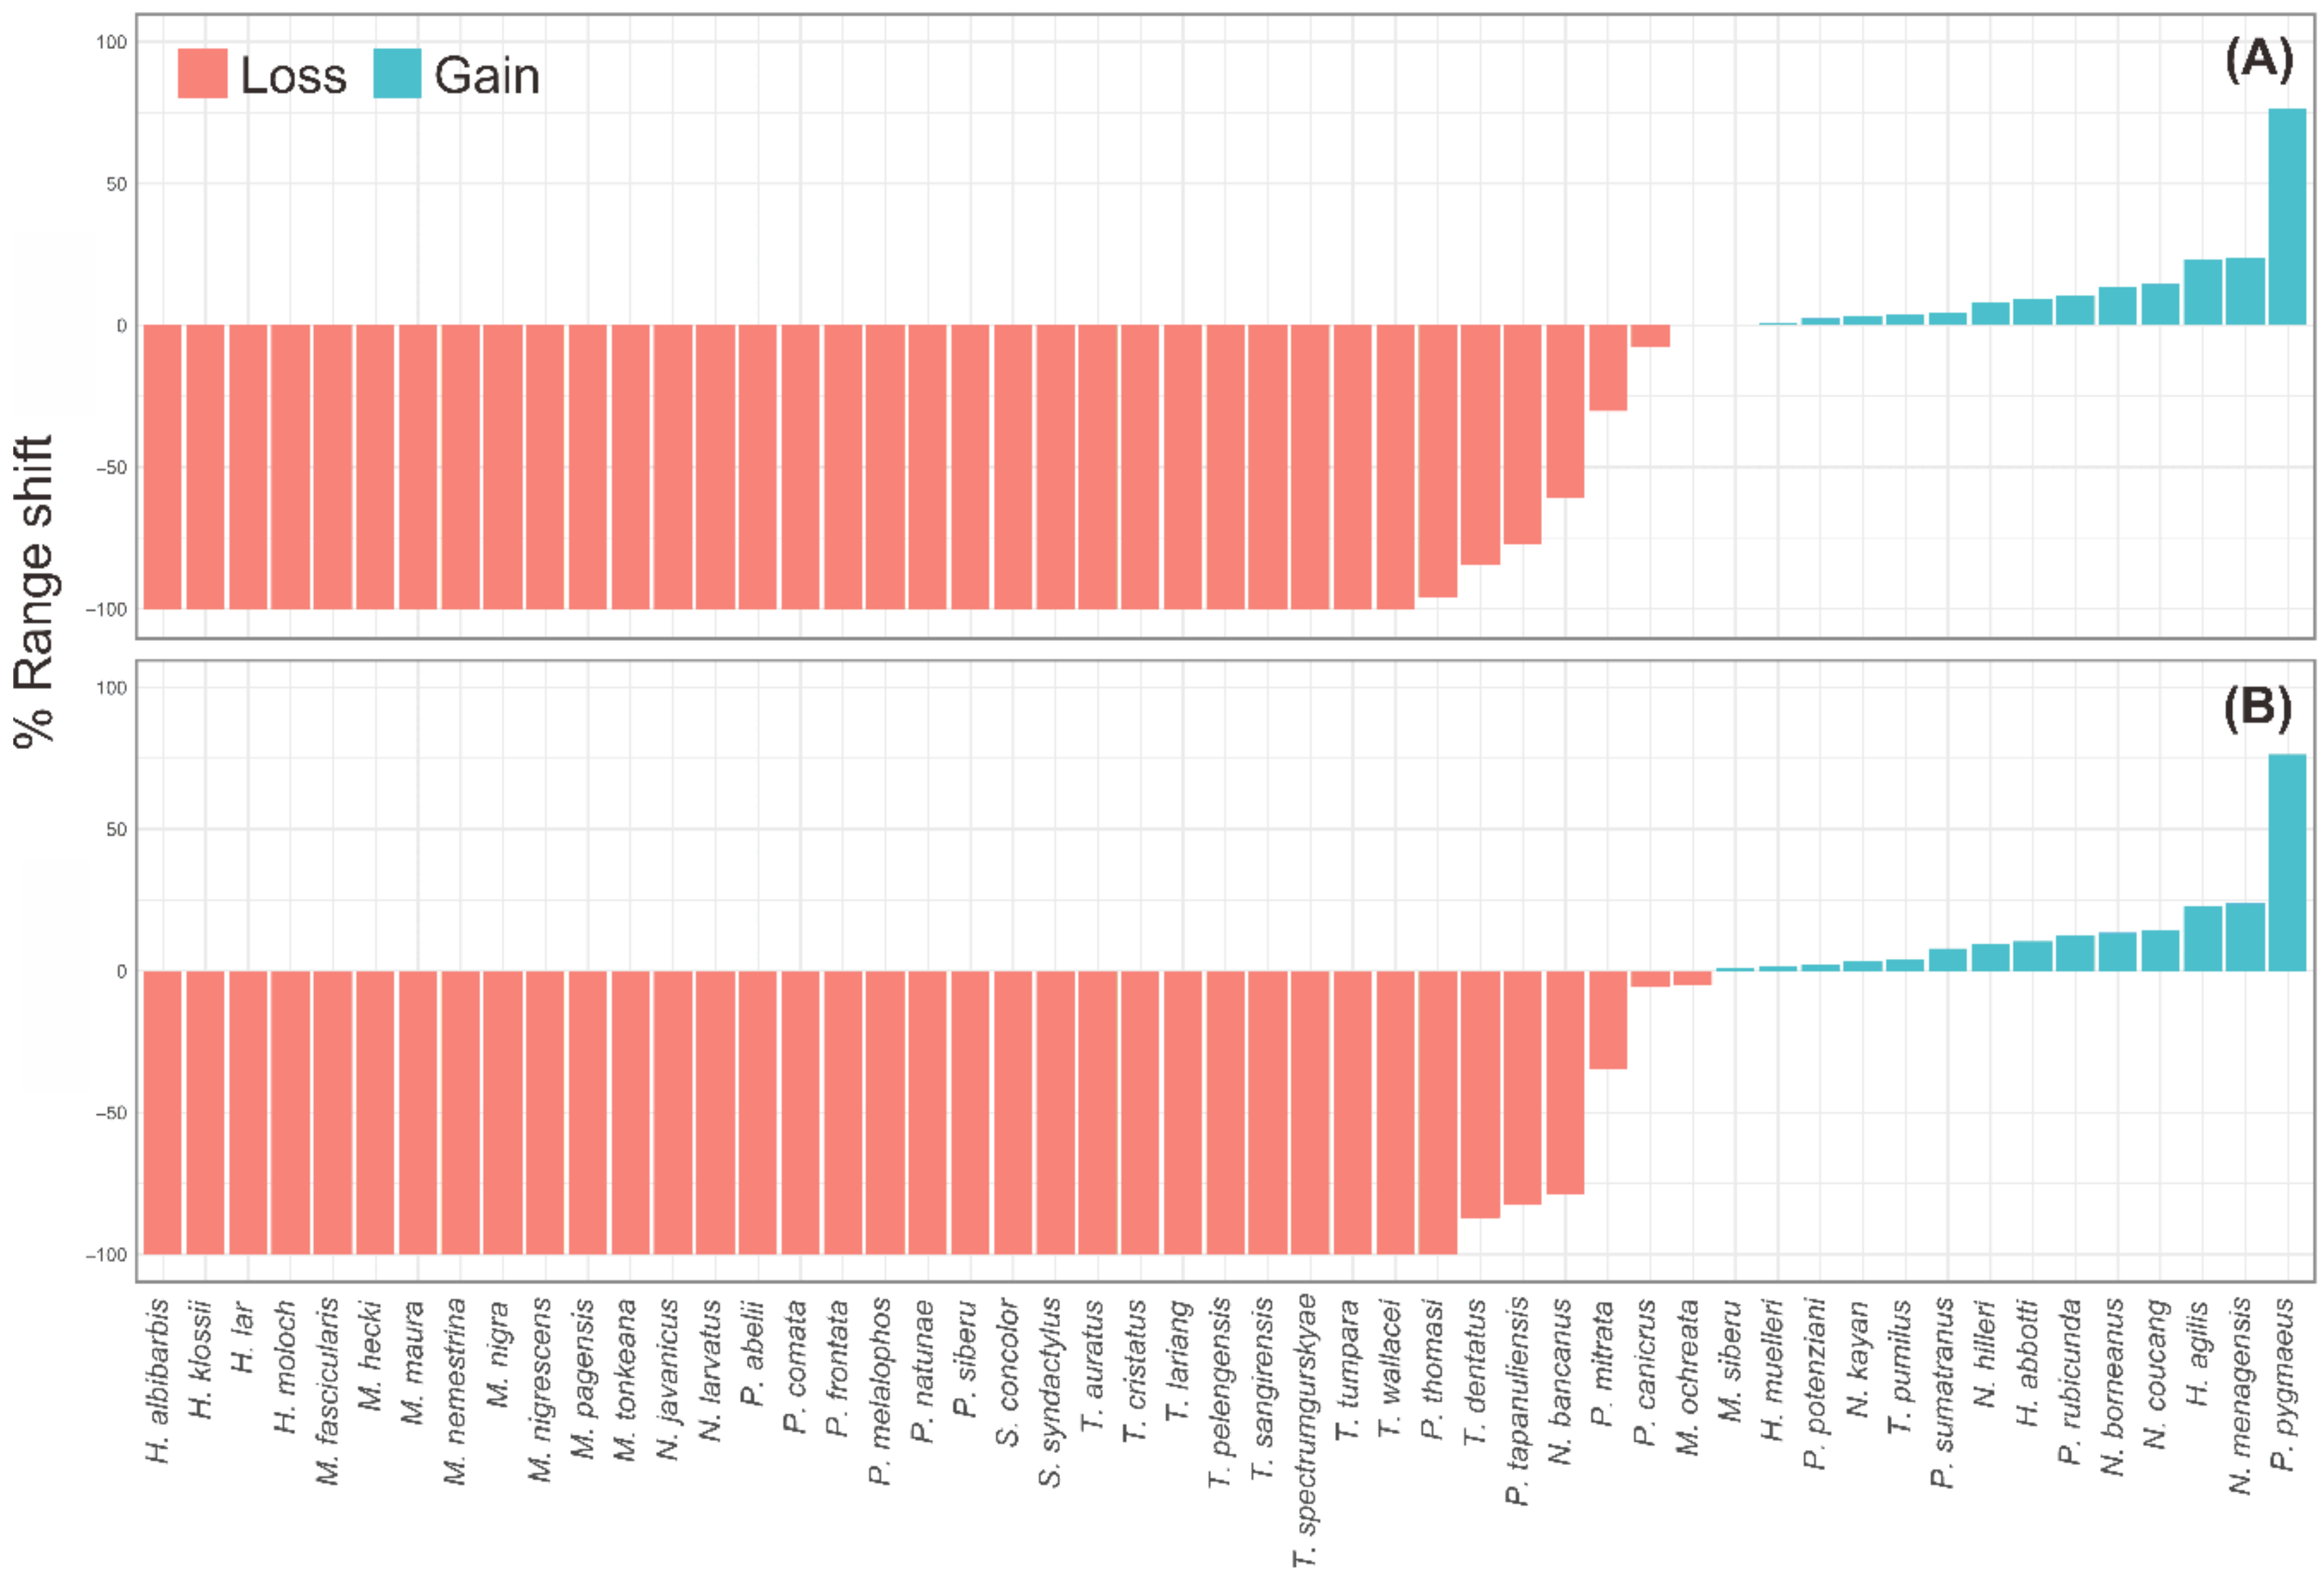
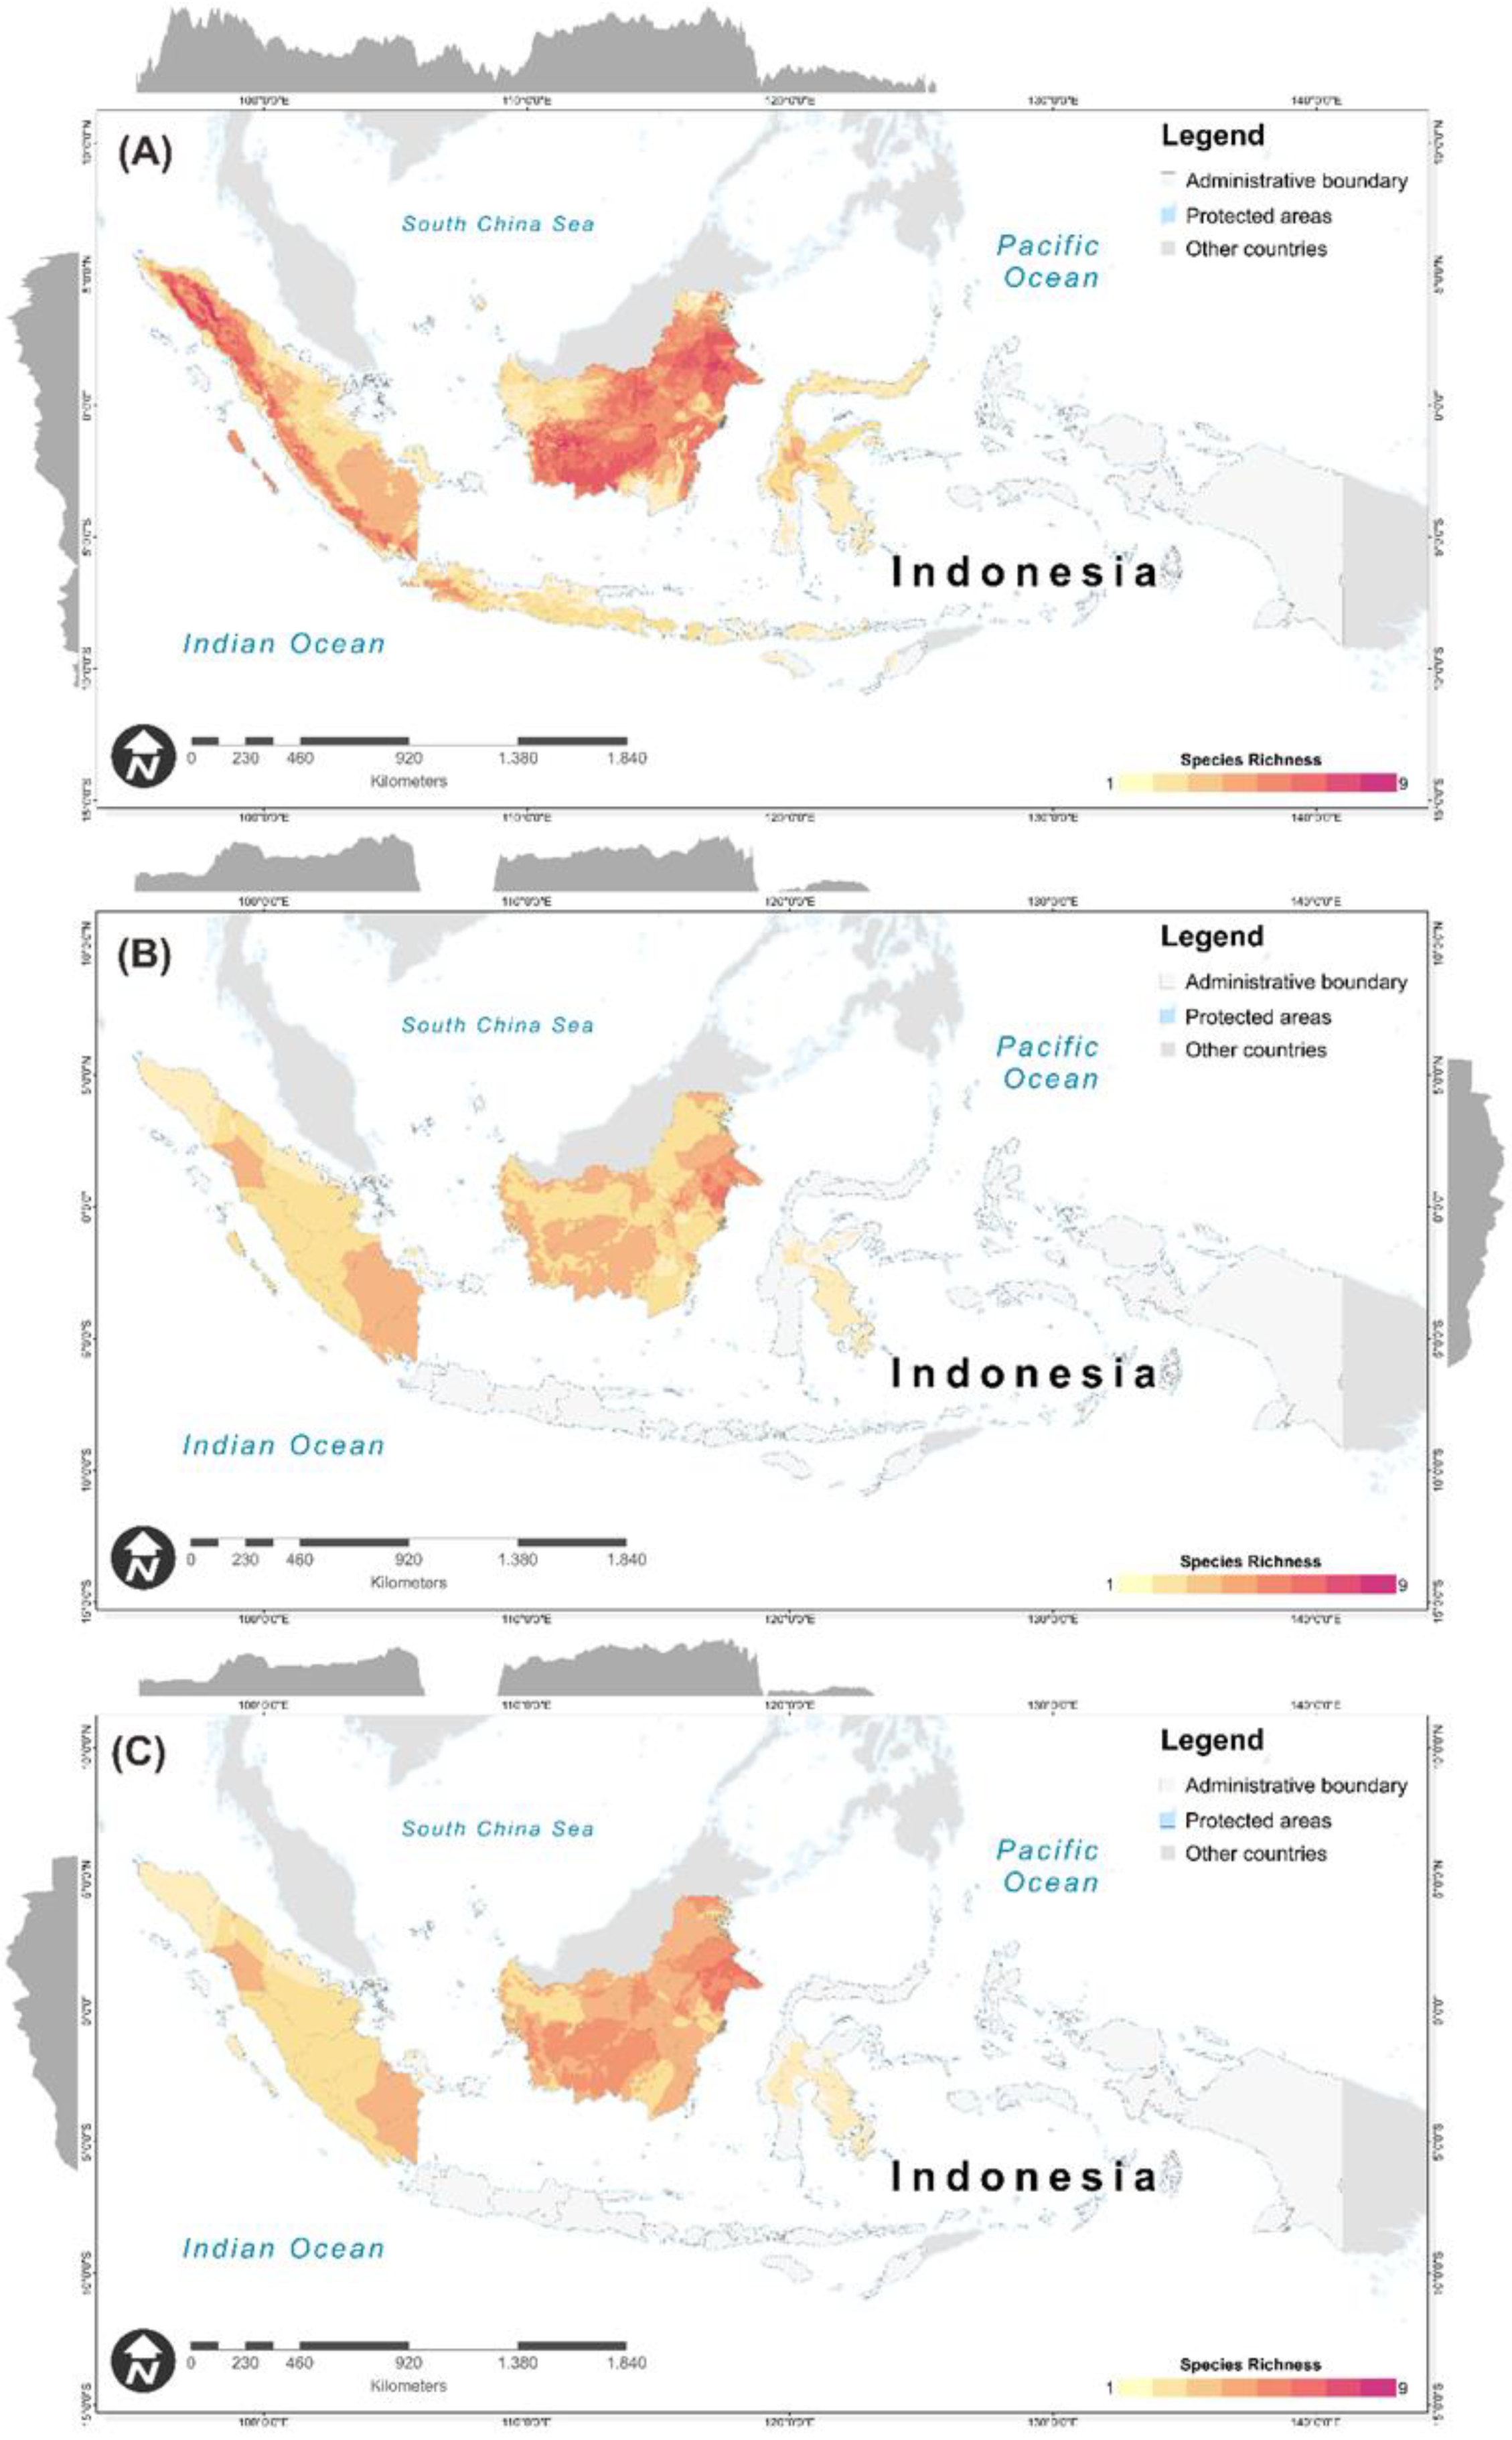
3.2. Range Shifts of Primate Distribution under Climate Change
3.3. Protected-Areas Prioritization for Primates under Worst-Case Scenario
4. Discussion
5. Conclusions
Supplementary Materials
Author Contributions
Funding
Institutional Review Board Statement
Informed Consent Statement
Data Availability Statement
Conflicts of Interest
References
- Estrada, A.; Garber, P.A.; Rylands, A.B.; Roos, C.; Fernandez-Duque, E.; Di Fiore, A.; Anne-Isola Nekaris, K.; Nijman, V.; Heymann, E.W.; Lambert, J.E.; et al. Impending extinction crisis of the world’s primates: Why primates matter. Sci. Adv. 2017, 3. [Google Scholar] [CrossRef] [Green Version]
- Grow, N.; Gursky-Doyen, S.; Supriatna, J. Introduction. In Indonesian Primates; Gursky-Doyen, S., Supriatna, J., Eds.; Springer: New York, NY, USA, 2010; pp. 1–6. [Google Scholar] [CrossRef]
- IUCN Red List Categories and Criteria: Version 3.1; IUCN: Gland, Switzerland, 2012; ISBN 2831707862.
- Estrada, A.; Garber, P.A.; Mittermeier, R.A.; Wich, S.; Gouveia, S.; Dobrovolski, R.; Nekaris, K.A.I.; Nijman, V.; Rylands, A.B.; Maisels, F.; et al. Primates in peril: The significance of Brazil, Madagascar, Indonesia and the Democratic Republic of the Congo for global primate conservation. PeerJ 2018, 2018, 1–57. [Google Scholar] [CrossRef] [PubMed] [Green Version]
- Nekaris, K.A.I.; Miard, P. Nycticebus kayan, Kayan Slow Loris. In IUCN Red List of Threatened Species; IUCN: Gland, Switzerland, 2020; Volume 8235. [Google Scholar] [CrossRef]
- Quinten, M.; Setiawan, A.; Cheyne, S.; Traeholt, C.; Whittaker, D. Simias concolor, Pig-tailed Snub-nosed Langur. In IUCN Red List of Threatened Species; IUCN: Gland, Switzerland, 2020; Volume 8235. [Google Scholar] [CrossRef]
- Cheyne, S.; Setiawan, A.; Traeholt, C. Presbytis canicrus, Miller’s Grizzled Langur. In IUCN Red List of Threatened Species; IUCN: Gland, Switzerland, 2020; Volume 8235. [Google Scholar] [CrossRef]
- Nowak, M.G.; Rianti, P.; Wich, S.A.; Meijaard, E.; Fredriksson, G. Pongo tapanuliensis, Tapanuli Orangutan. In IUCN Red List of Threatened Species; IUCN: Gland, Switzerland, 2020; Volume 8235. [Google Scholar] [CrossRef]
- Wich, S.A.; Singleton, I.; Nowak, M.G.; Atmoko, S.S.U.; Nisam, G.; Arif, S.M.; Putra, R.H.; Ardi, R.; Fredriksson, G.; Usher, G.; et al. Land-cover changes predict steep declines for the Sumatran orangutan (Pongo abelii). Sci. Adv. 2016, 2, 1–9. [Google Scholar] [CrossRef] [PubMed] [Green Version]
- Sales, L.P.; Ribeiro, B.R.; Pires, M.M.; Chapman, C.A.; Loyola, R. Recalculating route: Dispersal constraints will drive the redistribution of Amazon primates in the Anthropocene. Ecography 2019, 42, 1789–1801. [Google Scholar] [CrossRef] [Green Version]
- Chapman, C.A.; Bonnell, T.R.; Gogarten, J.F.; Lambert, J.E.; Omeja, P.A.; Twinomugisha, D.; Wasserman, M.D.; Rothman, J.M. Are Primates Ecosystem Engineers? Int. J. Primatol. 2013, 34, 1–14. [Google Scholar] [CrossRef]
- Olival, K.J.; Hosseini, P.R.; Zambrana-Torrelio, C.; Ross, N.; Bogich, T.L.; Daszak, P. Host and viral traits predict zoonotic spillover from mammals. Nature 2017, 546, 646–650. [Google Scholar] [CrossRef] [PubMed]
- Razafindratsima, O.H.; Sato, H.; Tsuji, Y.; Culot, L. Advances and Frontiers in Primate Seed Dispersal. Int. J. Primatol. 2018, 39, 315–320. [Google Scholar] [CrossRef] [Green Version]
- Buse, J.; Boch, S.; Hilgers, J.; Griebeler, E.M. Conservation of threatened habitat types under future climate change—Lessons from plant-distribution models and current extinction trends in southern Germany. J. Nat. Conserv. 2015, 27, 18–25. [Google Scholar] [CrossRef]
- Chen, I.C.; Hill, J.K.; Ohlemüller, R.; Roy, D.B.; Thomas, C.D. Rapid range shifts of species associated with high levels of climate warming. Science 2011, 333, 1024–1026. [Google Scholar] [CrossRef]
- Struebig, M.J.; Fischer, M.; Gaveau, D.L.A.; Meijaard, E.; Wich, S.A.; Gonner, C.; Sykes, R.; Wilting, A.; Kramer-Schadt, S. Anticipated climate and land-cover changes reveal refuge areas for Borneo’s orang-utans. Glob. Chang. Biol. 2015, 21, 2891–2904. [Google Scholar] [CrossRef]
- Gouveia, S.F.; Souza-Alves, J.P.; Rattis, L.; Dobrovolski, R.; Jerusalinsky, L.; Beltrão-Mendes, R.; Ferrari, S.F. Climate and land use changes will degrade the configuration of the landscape for titi monkeys in eastern Brazil. Glob. Chang. Biol. 2016, 22, 2003–2012. [Google Scholar] [CrossRef]
- Sales, L.; Ribeiro, B.R.; Chapman, C.A.; Loyola, R. Multiple dimensions of climate change on the distribution of Amazon primates. Perspect. Ecol. Conserv. 2020, 1–7. [Google Scholar] [CrossRef]
- Barrett, M.A.; Brown, J.L.; Junge, R.E.; Yoder, A.D. Climate change, predictive modeling and lemur health: Assessing impacts of changing climate on health and conservation in Madagascar. Biol. Conserv. 2013, 157, 409–422. [Google Scholar] [CrossRef]
- De Grammont, P.C.; Cuarón, A.D. An evaluation of threatened species categorization systems used on the american continent. Conserv. Biol. 2006, 20, 14–27. [Google Scholar] [CrossRef]
- Ribeiro, B.R.; Sales, L.P.; De Marco, P.; Loyola, R. Assessing mammal exposure to climate change in the Brazilian Amazon. PLoS ONE 2016, 11, e0165073. [Google Scholar] [CrossRef] [Green Version]
- Lehmann, J.; Korstjens, A.H.; Dunbar, R.I.M. Apes in a changing world—the effects of global warming on the behaviour and distribution of African apes. J. Biogeogr. 2010, 37, 2217–2231. [Google Scholar] [CrossRef]
- Garcia, R.A.; Cabeza, M.; Rahbek, C.; Araújo, M.B. Multiple dimensions of climate change and their implications for biodiversity. Science 2014, 344, 1247579. [Google Scholar] [CrossRef] [Green Version]
- Beaumont, L.J.; Hughes, L.; Poulsen, M. Predicting species distributions: Use of climatic parameters in BIOCLIM and its impact on predictions of species’ current and future distributions. Ecol. Model. 2005, 186, 251–270. [Google Scholar] [CrossRef]
- Feng, X.; Park, D.S.; Walker, C.; Peterson, A.T.; Merow, C.; Papeş, M. A checklist for maximizing reproducibility of ecological niche models. Nat. Ecol. Evol. 2019, 3, 1382–1395. [Google Scholar] [CrossRef] [PubMed] [Green Version]
- Franklin, J. Mapping Species Distributions: Spatial Inference and Prediction; Cambridge University Press: New York, NY, USA, 2010; ISBN 978-0-511-77006-7. [Google Scholar]
- Guisan, A.; Zimmermann, N.E. Predictive habitat distribution models in ecology. Ecol. Model. 2000, 135, 147–186. [Google Scholar] [CrossRef]
- Peterson, A.T.; Soberón, J. Species distribution modeling and ecological niche modeling: Getting the Concepts Right. Nat. Conserv. 2012. [Google Scholar] [CrossRef]
- Werkowska, W.; Márquez, A.L.; Real, R.; Acevedo, P. A practical overview of transferability in species distribution modeling. Environ. Rev. 2017, 25, 127–133. [Google Scholar] [CrossRef]
- Araújo, M.B.; Anderson, R.P.; Barbosa, A.M.; Beale, C.M.; Dormann, C.F.; Early, R.; Garcia, R.A.; Guisan, A.; Maiorano, L.; Naimi, B.; et al. Standards for distribution models in biodiversity assessments. Sci. Adv. 2019, 5, 1–12. [Google Scholar] [CrossRef] [PubMed] [Green Version]
- Kremen, C.; Cameron, A.; Moilanen, A.; Phillips, S.J.; Thomas, C.D.; Beentje, H.; Dransfield, J.; Fisher, B.L.; Glaw, F.; Good, T.C.; et al. Aligning conservation priorities across taxa in Madagascar with high-resolution planning tools. Science 2008, 320, 222–226. [Google Scholar] [CrossRef] [Green Version]
- Faleiro, F.V.; Machado, R.B.; Loyola, R.D. Defining spatial conservation priorities in the face of land-use and climate change. Biol. Conserv. 2013, 158, 248–257. [Google Scholar] [CrossRef]
- Araújo, M.B.; Alagador, D.; Cabeza, M.; Nogués-Bravo, D.; Thuiller, W. Climate change threatens European conservation areas. Ecol. Lett. 2011, 14, 484–492. [Google Scholar] [CrossRef] [Green Version]
- Sales, L.P.; Ribeiro, B.R.; Hayward, M.W.; Paglia, A.; Passamani, M.; Loyola, R. Niche conservatism and the invasive potential of the wild boar. J. Anim. Ecol. 2017, 86, 1214–1223. [Google Scholar] [CrossRef] [Green Version]
- Tingley, R.; Vallinoto, M.; Sequeira, F.; Kearney, M.R. Realized niche shift during a global biological invasion. Proc. Natl. Acad. Sci. USA 2014, 111, 10233–10238. [Google Scholar] [CrossRef] [Green Version]
- Broennimann, O.; Treier, U.A.; Müller-Schärer, H.; Thuiller, W.; Peterson, A.T.; Guisan, A. Evidence of climatic niche shift during biological invasion. Ecol. Lett. 2007, 10, 701–709. [Google Scholar] [CrossRef] [Green Version]
- Melo-Merino, S.M.; Reyes-Bonilla, H.; Lira-Noriega, A. Ecological niche models and species distribution models in marine environments: A literature review and spatial analysis of evidence. Ecol. Model. 2020, 415, 108837. [Google Scholar] [CrossRef]
- Graham, T.L.; Matthews, H.D.; Turner, S.E. A Global-Scale Evaluation of Primate Exposure and Vulnerability to Climate Change. Int. J. Primatol. 2016, 37, 158–174. [Google Scholar] [CrossRef]
- Saarimaa, M.; Aapala, K.; Tuominen, S.; Karhu, J.; Parkkari, M.; Tolvanen, A. Predicting Hotspots for Threatened Plant Species in Boreal Peatlands. Biodivers. Conserv. 2019, 28, 1173–1204. [Google Scholar] [CrossRef] [Green Version]
- Ribeiro, B.R.; Sales, L.P.; Loyola, R. Strategies for mammal conservation under climate change in the Amazon. Biodivers. Conserv. 2018. [Google Scholar] [CrossRef]
- Fuller, C.; Ondei, S.; Brook, B.W.; Buettel, J.C. Protected-area planning in the Brazilian Amazon should prioritize additionality and permanence, not leakage mitigation. Biol. Conserv. 2020, 248, 108673. [Google Scholar] [CrossRef]
- Jovanovic, T.; Arnold, R.; Booth, T. Determining the climatic suitability of Eucalyptus dunnii for plantations in Australia, China and Central and South America. New For. 2000, 19, 215–226. [Google Scholar] [CrossRef]
- Calabrese, J.M.; Certain, G.; Kraan, C.; Dormann, C.F. Stacking species distribution models and adjusting bias by linking them to macroecological models. Glob. Ecol. Biogeogr. 2014, 23, 99–112. [Google Scholar] [CrossRef]
- Koch, R.; Almeida-Cortez, J.S.; Kleinschmit, B. Revealing areas of high nature conservation importance in a seasonally dry tropical forest in Brazil: Combination of modelled plant diversity hot spots and threat patterns. J. Nat. Conserv. 2017, 35, 24–39. [Google Scholar] [CrossRef]
- Fleishman, E.; Noss, R.F.; Noon, B.R. Utility and limitations of species richness metrics for conservation planning. Ecol. Indic. 2006, 6, 543–553. [Google Scholar] [CrossRef]
- Thorn, J.S.; Nijman, V.; Smith, D.; Nekaris, K.A.I. Ecological niche modelling as a technique for assessing threats and setting conservation priorities for Asian slow lorises (Primates: Nycticebus). Divers. Distrib. 2009, 15, 289–298. [Google Scholar] [CrossRef]
- Chape, S.; Harrison, J.; Spalding, M.; Lysenko, I. Measuring the extent and effectiveness of protected areas as an indicator for meeting global biodiversity targets. Philos. Trans. R. Soc. B Biol. Sci. 2005, 360, 443–455. [Google Scholar] [CrossRef] [Green Version]
- Cleary, D.F.R.; De Vantier, L. Indonesia: Threats to the Country’s Biodiversity, 2nd ed.; Elsevier: Amsterdam, The Netherlands, 2019; Volume 3, ISBN 9780444639523. [Google Scholar]
- Mitchell, T.D.; Jones, P.D. An improved method of constructing a database of monthly climate observations and associated high-resolution grids. Int. J. Climatol. 2005. [Google Scholar] [CrossRef]
- Peel, M.C.; Finlayson, B.L.; McMahon, T.A. Updated world map of the Köppen-Geiger climate classification. Hydrol. Earth Syst. Sci. 2007. [Google Scholar] [CrossRef] [Green Version]
- GBIF Global Biodiversity Information Facility. Available online: https://www.gbif.org/ (accessed on 18 November 2020).
- Singleton, I.; Wich, S.A.; Nowak, M.; Usher, G.; Utami-Atmoko, S.S. Pongo abelii, Sumatran Orangutan. In IUCN Red List of Threatened Species; IUCN: Gland, Switzerland, 2017; Volume 8235. [Google Scholar] [CrossRef]
- Setiawan, A.; Traeholt, C. Presbytis thomasi, Thomas Langur. In IUCN Red List of Threatened Species; IUCN: Gland, Switzerland, 2020; Volume 8235. [Google Scholar] [CrossRef]
- Nijman, V. Hylobates moloch, Silvery Gibbon. In IUCN Red List of Threatened Species; IUCN: Gland, Switzerland, 2020; Volume 8235. [Google Scholar] [CrossRef]
- Aiello-Lammens, M.E.; Boria, R.A.; Radosavljevic, A.; Vilela, B.; Anderson, R.P. spThin: An R package for spatial thinning of species occurrence records for use in ecological niche models. Ecography 2015, 38, 541–545. [Google Scholar] [CrossRef]
- Fielding, A.H.; Bell, J.F. A review of methods for the assessment of prediction errors in conservation presence/absence models. Environ. Conserv. 1997, 24, 38–49. [Google Scholar] [CrossRef]
- Lehman, S.M.; Fleagle, J.G. Primate Biogeography: A Review. In Primate Biogeography; Lehman, S.M., Fleagle, J.G., Eds.; Springer: New York, NY, USA, 2006; pp. 1–58. ISBN 0387317104. [Google Scholar]
- Soberon, J.; Peterson, A.T. Interpretation of Models of Fundamental Ecological Niches and Species’ Distributional Areas. Biodivers. Inform. 2005, 2, 1–10. [Google Scholar] [CrossRef] [Green Version]
- Soberón, J.; Nakamura, M. Niches and distributional areas: Concepts, methods, and assumptions. Proc. Natl. Acad. Sci. USA 2009, 106, 19644–19650. [Google Scholar] [CrossRef] [PubMed] [Green Version]
- Willis, K.J.; Whittaker, R.J. Species diversity—Scale matters. Science 2002, 295, 1245–1248. [Google Scholar] [CrossRef]
- Condro, A.A.; Prasetyo, L.B.; Rushayati, S.B. Short-term projection of Bornean orangutan spatial distribution based on climate and land cover change scenario. In Proceedings of the Sixth International Symposium on LAPAN-IPB Satellite, Bogor, Indonesia, 24 December 2019; p. 113721B. [Google Scholar] [CrossRef]
- Fick, S.E.; Hijmans, R.J. WorldClim 2: New 1-km spatial resolution climate surfaces for global land areas. Int. J. Climatol. 2017. [Google Scholar] [CrossRef]
- Hijmans, R.J.; Cameron, S.E.; Parra, J.L.; Jones, P.G.; Jarvis, A. Very high resolution interpolated climate surfaces for global land areas. Int. J. Climatol. 2005, 25, 1965–1978. [Google Scholar] [CrossRef]
- Escobar, L.E.; Lira-Noriega, A.; Medina-Vogel, G.; Townsend Peterson, A. Potential for spread of the white-nose fungus (Pseudogymnoascus destructans) in the Americas: Use of Maxent and NicheA to assure strict model transference. Geospat. Health 2014, 9, 221–229. [Google Scholar] [CrossRef]
- Marques, R.; Krüger, R.F.; Peterson, A.T.; De Melo, L.F.; Vicenzi, N.; Jiménez-García, D. Climate change implications for the distribution of the babesiosis and anaplasmosis tick vector, Rhipicephalus (Boophilus) microplus. Vet. Res. 2020, 51, 1–10. [Google Scholar] [CrossRef] [PubMed]
- Navarro-Racines, C.; Tarapues, J.; Thornton, P.; Jarvis, A.; Ramirez-Villegas, J. High-resolution and bias-corrected CMIP5 projections for climate change impact assessments. Sci. Data 2020, 7, 1–14. [Google Scholar] [CrossRef] [Green Version]
- van Vuuren, D.P.; Edmonds, J.; Kainuma, M.; Riahi, K.; Thomson, A.; Hibbard, K.; Hurtt, G.C.; Kram, T.; Krey, V.; Lamarque, J.F.; et al. The representative concentration pathways: An overview. Clim. Chang. 2011, 109, 5–31. [Google Scholar] [CrossRef]
- Buisson, L.; Thuiller, W.; Casajus, N.; Lek, S.; Grenouillet, G. Uncertainty in ensemble forecasting of species distribution. Glob. Chang. Biol. 2010, 16, 1145–1157. [Google Scholar] [CrossRef]
- Feng, X.; Park, D.S.; Liang, Y.; Pandey, R.; Papeş, M. Collinearity in ecological niche modeling: Confusions and challenges. Ecol. Evol. 2019, 9, 10365–10376. [Google Scholar] [CrossRef] [Green Version]
- Dormann, C.F.; Elith, J.; Bacher, S.; Buchmann, C.; Carl, G.; Carré, G.; Marquéz, J.R.G.; Gruber, B.; Lafourcade, B.; Leitão, P.J.; et al. Collinearity: A review of methods to deal with it and a simulation study evaluating their performance. Ecography 2013, 36, 27–46. [Google Scholar] [CrossRef]
- Elith, J.; Phillips, S.J.; Hastie, T.; Dudík, M.; Chee, Y.E.; Yates, C.J. A statistical explanation of MaxEnt for ecologists. Divers. Distrib. 2011, 17, 43–57. [Google Scholar] [CrossRef]
- Phillips, S. Maxnet: Fitting ‘Maxent’ Species Distribution Models with “glmnet”. Available online: https://rdrr.io/cran/maxnet/ (accessed on 29 November 2020).
- Phillips, S.J.; Anderson, R.P.; Dudík, M.; Schapire, R.E.; Blair, M.E. Opening the black box: An open-source release of Maxent. Ecography 2017, 40, 887–893. [Google Scholar] [CrossRef]
- Barve, N.; Barve, V.; Jiménez-Valverde, A.; Lira-Noriega, A.; Maher, S.P.; Peterson, A.T.; Soberón, J.; Villalobos, F. The crucial role of the accessible area in ecological niche modeling and species distribution modeling. Ecol. Model. 2011, 222, 1810–1819. [Google Scholar] [CrossRef]
- Fitzpatrick, M.C.; Blois, J.L.; Williams, J.W.; Nieto-Lugilde, D.; Maguire, K.C.; Lorenz, D.J. How will climate novelty influence ecological forecasts? Using the Quaternary to assess future reliability. Glob. Chang. Biol. 2018, 24, 3575–3586. [Google Scholar] [CrossRef]
- Owens, H.L.; Campbell, L.P.; Dornak, L.L.; Saupe, E.E.; Barve, N.; Soberón, J.; Ingenloff, K.; Lira-Noriega, A.; Hensz, C.M.; Myers, C.E.; et al. Constraints on interpretation of ecological niche models by limited environmental ranges on calibration areas. Ecol. Model. 2013, 263, 10–18. [Google Scholar] [CrossRef]
- Mendes, P.; Velazco, S.J.E.; de Andrade, A.F.A.; De Marco, P. Dealing with overprediction in species distribution models: How adding distance constraints can improve model accuracy. Ecol. Model. 2020, 431, 109180. [Google Scholar] [CrossRef]
- Cohen, J. A Coefficient of Agreement for Nominal Scales. Educ. Psychol. Meas. 1960. [Google Scholar] [CrossRef]
- Allouche, O.; Tsoar, A.; Kadmon, R. Assessing the accuracy of species distribution models: Prevalence, kappa and the true skill statistic (TSS). J. Appl. Ecol. 2006. [Google Scholar] [CrossRef]
- Leroy, B.; Delsol, R.; Hugueny, B.; Meynard, C.N.; Barhoumi, C.; Barbet-Massin, M.; Bellard, C. Without quality presence–absence data, discrimination metrics such as TSS can be misleading measures of model performance. J. Biogeogr. 2018, 45, 1994–2002. [Google Scholar] [CrossRef]
- Alaniz, A.J.; Carvajal, M.A.; Vergara, P.M.; Fierro, A.; Moreira-Arce, D.; Rojas-Osorio, A.; Soto, G.E.; Rodewald, A.D. Trophic behavior of specialist predators from a macroecological approach: The case of the magellanic woodpecker in south American temperate forests. Glob. Ecol. Conserv. 2020, 24, e01285. [Google Scholar] [CrossRef]
- Mateo, R.G.; Felicísimo, Á.M.; Pottier, J.; Guisan, A.; Muñoz, J. Do stacked species distribution models reflect altitudinal diversity patterns? PLoS ONE 2012, 7, e0032586. [Google Scholar] [CrossRef] [Green Version]
- UNEP The World Database of Protected Areas. Available online: https://www.protectedplanet.net/country/IDN (accessed on 18 October 2020).
- Rahman, D.A.; Condro, A.A.; Rianti, P.; Masy’ud, B.; Aulagnier, S.; Semiadi, G. Geographical analysis of the Javan deer distribution in Indonesia and priorities for landscape conservation. J. Nat. Conserv. 2020, 54, 125795. [Google Scholar] [CrossRef]
- Haight, J.; Hammill, E. Protected areas as potential refugia for biodiversity under climatic change. Biol. Conserv. 2020, 241. [Google Scholar] [CrossRef]
- Borges, F.J.A.; Loyola, R. Climate and land-use change refugia for Brazilian Cerrado birds. Perspect. Ecol. Conserv. 2020. [Google Scholar] [CrossRef]
- Verburg, P.H.; Soepboer, W.; Veldkamp, A.; Limpiada, R.; Espaldon, V.; Mastura, S.S.A. Modeling the spatial dynamics of regional land use: The CLUE-S model. Environ. Manag. 2002, 30, 391–405. [Google Scholar] [CrossRef]
- Verburg, P.H.; Overmars, K.P. Combining top-down and bottom-up dynamics in land use modeling: Exploring the future of abandoned farmlands in Europe with the Dyna-CLUE model. Landsc. Ecol. 2009, 24, 1167–1181. [Google Scholar] [CrossRef]
- MoEF Land Cover Maps of Indonesia. Available online: http://webgis.menlhk.go.id:8080/pl/pl.htm (accessed on 27 January 2021).
- Farr, T.G.; Rosen, P.A.; Caro, E.; Crippen, R.; Duren, R.; Hensley, S.; Kobrick, M.; Paller, M.; Rodriguez, E.; Roth, L.; et al. The shuttle radar topography mission. Rev. Geophys. 2007. [Google Scholar] [CrossRef] [Green Version]
- Weiss, D.J.; Nelson, A.; Gibson, H.S.; Temperley, W.; Peedell, S.; Lieber, A.; Hancher, M.; Poyart, E.; Belchior, S.; Fullman, N.; et al. A global map of travel time to cities to assess inequalities in accessibility in 2015. Nature 2018, 553, 333–336. [Google Scholar] [CrossRef]
- Verburg, P.H.; Ritsema van Eck, J.R.; de Nijs, T.C.M.; Dijst, M.J.; Schot, P. Determinants of land-use change patterns in the Netherlands. Environ. Plan. B Plan. Des. 2004, 31, 125–150. [Google Scholar] [CrossRef] [Green Version]
- Cabral Rezende, G.; Sobral-Souza, T.; Culot, L. Integrating climate and landscape models to prioritize areas and conservation strategies for an endangered arboreal primate. Am. J. Primatol. 2020, 82, 1–9. [Google Scholar] [CrossRef]
- Hodgson, J.A.; Wallis, D.W.; Krishna, R.; Cornell, S.J. How to manipulate landscapes to improve the potential for range expansion. Methods Ecol. Evol. 2016, 7, 1558–1566. [Google Scholar] [CrossRef] [Green Version]
- Graham, V.; Baumgartner, J.B.; Beaumont, L.J.; Esperón-Rodríguez, M.; Grech, A. Prioritizing the protection of climate refugia: Designing a climate-ready protected area network. J. Environ. Plan. Manag. 2019, 62, 2588–2606. [Google Scholar] [CrossRef] [Green Version]
- Carvalho, J.S.; Graham, B.; Rebelo, H.; Bocksberger, G.; Meyer, C.F.J.; Wich, S.; Kühl, H.S. A global risk assessment of primates under climate and land use/cover scenarios. Glob. Chang. Biol. 2019, 25, 3163–3178. [Google Scholar] [CrossRef] [PubMed]
- Zellmer, A.J.; Claisse, J.T.; Williams, C.M.; Schwab, S.; Pondella, D.J. Predicting optimal sites for ecosystem restoration using stacked-species distribution modeling. Front. Mar. Sci. 2019, 6, 1–12. [Google Scholar] [CrossRef] [Green Version]
- Pearson, R.G.; Raxworthy, C.J.; Nakamura, M.; Townsend Peterson, A. Predicting species distributions from small numbers of occurrence records: A test case using cryptic geckos in Madagascar. J. Biogeogr. 2007, 34, 102–117. [Google Scholar] [CrossRef]
- Iwanda, R.; Prasetyo, L.B.; Rinaldi, D.; Pairah, P.; Septiana, W.; Erlan, M.; Hilmy, Y. Priority restoration area mapping of Javan Gibbon Habitat (Hylobates moloch Audebert 1798) in Gunung Halimun Salak National Park as a result of global climate change. In Proceedings of the Sixth International Symposium on LAPAN-IPB Satellite, Bogor, Indonesia, 24 December 2019; p. 1137217. [Google Scholar]
- Wich, S.A.; Meijaard, E.; Marshall, A.J.; Husson, S.; Ancrenaz, M.; Lacy, R.C.; Van Schaik, C.P.; Sugardjito, J.; Simorangkir, T.; Traylor-Holzer, K.; et al. Distribution and conservation status of the orang-utan (Pongo spp.) on Borneo and Sumatra: How many remain? Oryx 2008, 42, 329–339. [Google Scholar] [CrossRef] [Green Version]
- Monroe, B.P.; Nakazawa, Y.J.; Reynolds, M.G.; Carroll, D.S. Estimating the geographic distribution of human Tanapox and potential reservoirs using ecological niche modeling. Int. J. Health Geogr. 2014, 13, 1–9. [Google Scholar] [CrossRef] [PubMed] [Green Version]
- Brandon-Jones, D. The Asian Colobinae (Mammalia: Cercopithecidae) as indicators of quaternary climatic change. Biol. J. Linn. Soc. 1996, 59, 327–350. [Google Scholar] [CrossRef]
- Pecl, G.T.; Araújo, M.B.; Bell, J.D.; Blanchard, J.; Bonebrake, T.C.; Chen, I.C.; Clark, T.D.; Colwell, R.K.; Danielsen, F.; Evengård, B.; et al. Biodiversity redistribution under climate change: Impacts on ecosystems and human well-being. Science 2017, 355. [Google Scholar] [CrossRef]
- Bennett, J.M.; Calosi, P.; Clusella-Trullas, S.; Martínez, B.; Sunday, J.; Algar, A.C.; Araújo, M.B.; Hawkins, B.A.; Keith, S.; Kühn, I.; et al. GlobTherm, a global database on thermal tolerances for aquatic and terrestrial organisms. Sci. Data 2018, 5, 1–7. [Google Scholar] [CrossRef] [PubMed]
- Khaliq, I.; Hof, C.; Prinzinger, R.; Böhning-Gaese, K.; Pfenninger, M. Global variation in thermal tolerances and vulnerability of endotherms to climate change. Proc. R. Soc. B Biol. Sci. 2014, 281. [Google Scholar] [CrossRef] [Green Version]
- Korstjens, A.H.; Hillyer, A. Primates and climate change: A review of current knowledge. In An Introduction to Primate Conservation; Wich, S.A., Marshall, A.J., Eds.; Oxford University Press: Oxford, UK, 2016; pp. 583–605. ISBN 9780199682676. [Google Scholar]
- Dirzo, R.; Young, H.S.; Galetti, M.; Ceballos, G.; Isaac, N.J.B.; Collen, B. Defaunation in the Anthropocene. Science 2014, 345, 401–406. [Google Scholar] [CrossRef]
- Urban, M.C. Accelerating extinction risk from climate change. Sci. Rep. 2015, 348, 571–573. [Google Scholar] [CrossRef] [Green Version]
- Dillon, M.E.; Wang, G.; Huey, R.B. Global metabolic impacts of recent climate warming. Nature 2010, 467, 704–706. [Google Scholar] [CrossRef]
- Marshall, A.J.; Lacy, R.; Ancrenaz, M.; Byers, O.; Husson, S.J.; Leighton, M.; Meijaard, E.; Rosen, N.; Singleton, I.; Stephens, S.; et al. Orangutan population biology, life history, and conservation: Perspectives from population viability analysis models. Orangutans Geogr. Var. Behav. Ecol. Conserv. 2009, 311–326. [Google Scholar] [CrossRef] [Green Version]
- Singleton, I.; Knott, C.D.; Morrogh-Bernard, H.C.; Wich, S.A.; Van Schaik, C.P. Ranging behavior of orangutan females and social organization. Orangutans Geogr. Var. Behav. Ecol. Conserv. 2009, 205–213. [Google Scholar] [CrossRef]
- Xavier da Silva, M.; Paviolo, A.; Tambosi, L.R.; Pardini, R. Effectiveness of Protected Areas for biodiversity conservation: Mammal occupancy patterns in the Iguaçu National Park, Brazil. J. Nat. Conserv. 2018, 41, 51–62. [Google Scholar] [CrossRef]
- International Bioversity. Conservation Outside Protected Areas. Available online: http://www.cropwildrelatives.org/resources/in-situ-conservation-manual/ (accessed on 29 November 2020).
- Margules, C.R.; Pressey, R.L. Systematic conservation planning. Nature 2000, 405, 243–253. [Google Scholar] [CrossRef] [PubMed]
- Game, E.T.; Lipsett-Moore, G.; Saxon, E.; Peterson, N.; Sheppard, S. Incorporating climate change adaptation into national conservation assessments. Glob. Chang. Biol. 2011, 17, 3150–3160. [Google Scholar] [CrossRef]
- Gaveau, D.L.A.A.; Wich, S.; Epting, J.; Juhn, D.; Kanninen, M.; Leader-williams, N. The future of forests and orangutans (Pongoabelii) in Sumatra: Predicting impacts of oil palm plantations, road construction, and mechanisms for reducing carbon emissions from deforestation. Environ. Res. Lett. 2009, 4. [Google Scholar] [CrossRef]
- Wich, S.A.; Fredriksson, G.M.; Usher, G.; Peters, H.H.; Priatna, D.; Basalamah, F.; Susanto, W.; Kühl, H. Hunting of Sumatran orang-utans and its importance in determining distribution and density. Biol. Conserv. 2012, 146, 163–169. [Google Scholar] [CrossRef] [Green Version]
- Hodgson, J.A.; Thomas, C.D.; Cinderby, S.; Cambridge, H.; Evans, P.; Hill, J.K. Habitat re-creation strategies for promoting adaptation of species to climate change. Conserv. Lett. 2011, 4, 289–297. [Google Scholar] [CrossRef]
- Williams, S.H.; Scriven, S.A.; Burslem, D.F.R.P.; Hill, J.K.; Reynolds, G.; Agama, A.L.; Kugan, F.; Maycock, C.R.; Khoo, E.; Hastie, A.Y.L.; et al. Incorporating connectivity into conservation planning for optimal representation of multiple species and ecosystem services. Conserv. Biol. 2019, 1–22. [Google Scholar] [CrossRef]


| Acronym | Description | Unit |
|---|---|---|
| Bio1 | Annual mean temperature | °C |
| Bio2 2 | Annual mean diurnal range | °C |
| Bio3 | Isothermality | % |
| Bio4 2 | Temperature seasonality | - |
| Bio5 | Max temperature of warmest month | °C |
| Bio6 2 | Min temperature of coldest month | °C |
| Bio7 2 | Annual temperature range | °C |
| Bio8 1 | Mean temperature of wettest quarter | °C |
| Bio9 1 | Mean temperature of driest quarter | °C |
| Bio10 | Mean temperature of warmest quarter | °C |
| Bio11 | Mean temperature of coldest quarter | °C |
| Bio12 | Annual precipitation | mm |
| Bio13 | Precipitation of wettest month | mm |
| Bio14 | Precipitation of driest month | mm |
| Bio15 | Precipitation seasonality | % |
| Bio16 2 | Precipitation of wettest quarter | mm |
| Bio17 2 | Precipitation of driest quarter | mm |
| Bio18 1 | Precipitation of warmest quarter | mm |
| Bio19 1 | Precipitation of coldest quarter | mm |
| Region | Recommendations for Habitat Restoration | Recommendations for Habitat Refugia |
|---|---|---|
| Kalimantan |
|
|
| Java and the Lesser Sunda |
| - |
| Sumatera |
|
|
| Sulawesi |
|
|
Publisher’s Note: MDPI stays neutral with regard to jurisdictional claims in published maps and institutional affiliations. |
© 2021 by the authors. Licensee MDPI, Basel, Switzerland. This article is an open access article distributed under the terms and conditions of the Creative Commons Attribution (CC BY) license (http://creativecommons.org/licenses/by/4.0/).
Share and Cite
Condro, A.A.; Prasetyo, L.B.; Rushayati, S.B.; Santikayasa, I.P.; Iskandar, E. Predicting Hotspots and Prioritizing Protected Areas for Endangered Primate Species in Indonesia under Changing Climate. Biology 2021, 10, 154. https://0-doi-org.brum.beds.ac.uk/10.3390/biology10020154
Condro AA, Prasetyo LB, Rushayati SB, Santikayasa IP, Iskandar E. Predicting Hotspots and Prioritizing Protected Areas for Endangered Primate Species in Indonesia under Changing Climate. Biology. 2021; 10(2):154. https://0-doi-org.brum.beds.ac.uk/10.3390/biology10020154
Chicago/Turabian StyleCondro, Aryo Adhi, Lilik Budi Prasetyo, Siti Badriyah Rushayati, I Putu Santikayasa, and Entang Iskandar. 2021. "Predicting Hotspots and Prioritizing Protected Areas for Endangered Primate Species in Indonesia under Changing Climate" Biology 10, no. 2: 154. https://0-doi-org.brum.beds.ac.uk/10.3390/biology10020154