Article

Comparative Transcriptome Analysis Revealed Genes Involved in Sexual and Polyploid Growth Dimorphisms in Loach (Misgurnus anguillicaudatus)

1
Key Lab of Freshwater Animal Breeding, Ministry of Agriculture, Key Lab of Agricultural Animal Genetics, Breeding and Reproduction of Ministry of Education, Engineering Research Center of Green Development for Conventional Aquatic Biological Industry in the Yangtze River Economic Belt, Ministry of Education, College of Fisheries, Huazhong Agricultural University, No. 1 Shizishan Street, Hongshan District, Wuhan 430070, China
2
Hubei Hongshan Laboratory, Wuhan 430070, China
3
Engineering Technology Research Center for Fish Breeding and Culture in Hubei Province, Wuhan 430070, China
*
Authors to whom correspondence should be addressed.
Submission received: 26 July 2021 / Revised: 5 September 2021 / Accepted: 13 September 2021 / Published: 18 September 2021
(This article belongs to the Special Issue Transcriptome and Genome Analyses Applied to Aquaculture Research)

Abstract

:

Simple Summary

Misgurnus anguillicaudatus not only exhibits sexual size dimorphism, but also shows polyploid size dimorphism. Here, we performed comparative transcriptome integration analysis of multiple tissues of diploid and tetraploid M. anguillicaudatus of both sexes. We found that differences in energy metabolism and steroid hormone synthesis levels may be the main causes of sexual and polyploidy growth dimorphisms of M. anguillicaudatus. Fast-growing M. anguillicaudatus (tetraploids, females) have higher levels of energy metabolism and lower steroid hormone synthesis and fatty acid degradation abilities than slow-growing M. anguillicaudatus (diploids, males).

Abstract

Sexual and polyploidy size dimorphisms are widespread phenomena in fish, but the molecular mechanisms remain unclear. Loach (Misgurnus anguillicaudatus) displays both sexual and polyploid growth dimorphism phenomena, and are therefore ideal models to study these two phenomena. In this study, RNA-seq was used for the first time to explore the differentially expressed genes (DEGs) between both sexes of diploid and tetraploid loaches in four tissues (brain, gonad, liver, and muscle). Results showed that 21,003, 17, and 1 DEGs were identified in gonad, liver, and muscle tissues, respectively, between females and males in both diploids and tetraploids. Regarding the ploidy levels, 4956, 1496, 2187, and 1726 DEGs were identified in the brain, gonad, liver, and muscle tissues, respectively, between tetraploids and diploids of the same sex. When both sexual and polyploid size dimorphisms were considered simultaneously in the four tissues, only 424 DEGs were found in the gonads, indicating that these gonadal DEGs may play an important regulatory role in regulating sexual and polyploid size dimorphisms. Regardless of the sex or ploidy comparison, the significant DEGs involved in glycolysis/gluconeogenesis and oxidative phosphorylation pathways were upregulated in faster-growing individuals, while steroid hormone biosynthesis-related genes and fatty acid degradation and elongation-related genes were downregulated. This suggests that fast-growing loaches (tetraploids, females) have higher energy metabolism levels and lower steroid hormone synthesis and fatty acid degradation abilities than slow-growing loaches (diploids, males). Our findings provide an archive for future systematic research on fish sexual and polyploid dimorphisms.

1. Introduction

Sexual size dimorphism, which is the relative difference in body size and growth rate between males and females of the same species, has been observed in many cultivable fish species, and this phenomenon varies widely across species. Some species, such as carp (Cyprinus carpio), rainbow trout (Oncorhynchus mykiss), Japanese flounder (Paralichthys olivaceus), and half-smooth tongue sole (Cynoglossus semilaevis), show sexual size dimorphism, with females being larger and growing faster than males. In contrast, some other species, such as Nile tilapia (Oreochromis niloticus), yellow catfish (Pelteobagrus fulvidraco), and channel catfish (Ictalurus punctatus), show that males have a faster growth rate and larger body size than females [1]. It is often assumed that the growth difference is mediated by differences in the expression of genes present in both sexes [2,3]. For example, growth hormone (gh) expression level of females was higher than that of males in C. semilaevis and spotted scat (Scatophagus argus linnaeus), in which females grow faster than males [4,5]. The sex phenotype is established by several genes that act together to form a complicated regulatory network [6]. Comparative transcriptome analysis can provide a basis for exploring the genetic and molecular mechanisms of sexual dimorphism. With the rapid development of next-generation sequencing (NGS) technologies, RNA-seq technology has become an attractive, low-cost, and highly accurate method that has revealed an increasing number of novel transcripts and sequence variations [7,8], and has also been used to analyze important trait-related gene pathways in organisms, even those without genomic information. Recently, RNA-Seq has been used to identify sex-biased genes in many fish species, such as platy fish (Xiphophorus maculatus) [9], O. mykiss [10], O. niloticus [11], rockfish (Sebastiscus marmoratus) [12], catfish (Ictalurus punctatus) [13], and turbot (Scophthalmus maximus) [14]. Such studies have provided some overview of sex-biased gene expression in fish and offer more useful information about sexual dimorphism.
Some fish not only exhibit sexual size dimorphism, but also show polyploid size dimorphism. Polyploids tend to be larger in size and grow faster than diploids in multiple fish species. For example, polyploids in the genus Barbus and the Japanese spined loach (Cobitis biwae) are larger than those in diploids [15]. Polyploidy in fish is also associated with improved longevity and better ecological adaptability compared to diploids [16]. Currently, most studies on different ploidy individuals in animals have focused on biological characteristics [17], genes related to sex differentiation [18], and comparison of genomic methylation [19]. There are only a few studies on polyploid growth dimorphism in fish, mainly focusing on the differential expression of growth axis-related genes and their regulatory hormone genes in fishes with different ploidy. By comparing the expression of GH/IGF axis genes of Carassius carp with different ploidy, it has been revealed that elevated expression of GH/IGF axis genes in triploids plays a crucial role in the faster growth rate of triploids [20]. Tao et al. carried out studies on cDNA cloning and expression of the cyp19a1a gene in Carassius carp with different ploidy [21]. Polyploids are generally known to have higher levels of genetic diversity than diploid species, owing to the larger total number of chromosome copies [22]. Although there have been some reports on the transcriptome of different ploidy fish [23,24], the molecular regulatory mechanisms of the growth difference between different ploidy fish are still unclear.
Individual growth traits in fish are an important economic characteristic, and is closely linked with fish farming production in aquatic products. In addition to being regulated by the well-known “hypothalamus-pituitary-liver” axis, the growth of vertebrates is also regulated by several energy metabolic processes, such as glycolysis/gluconeogenesis and oxidative phosphorylation. Glycolysis/gluconeogenesis plays an important role in biological synthesis and catabolism [25]. The main physiological functions of glycolysis and gluconeogenesis are the breakdown and synthesis of sugars, respectively. They are two major metabolic pathways that provide precursors and rapid energy sources for cell growth [26]. In Drosophila and zebrafish, glycolysis is located downstream of the GH/IGF axis and plays an important regulatory role in muscle development and animal growth [27]. Oxidative phosphorylation, like glycolysis, is the main source of cellular energy [28]. Oxidative phosphorylation not only supports the growth of tumor cells, but also plays an important role in the growth of normal differentiated somite cells [29,30]. In animals, glucose homeostasis is mutually controlled by catabolic glycolysis/oxidative phosphorylation and anabolic gluconeogenesis pathways [31], thus providing energy for growth.
To date, studies on the regulation of sexual and polyploid growth dimorphisms-related genes in fish are limited. Loach (Misgurnus anguillicaudatus), a small freshwater fish species widely distributed in eastern Asia, including China, Korea and Japan, possesses both sexual and polyploid growth dimorphisms [32]. In loach, females grow faster than males and tetraploids grow faster than diploids; therefore, this species is a suitable model to clarify whether fish sexual and polyploid growth dimorphisms are regulated through the same signaling pathways and genes. In this study, comparative transcriptome profiling of brain, gonad, liver, and muscle tissues of 18-month-old diploid and tetraploid males and females was performed to identify the DEGs related to the growth difference between male and female individuals of the same ploidy and between different ploidies of the same sex. Through comparative transcriptome integration analysis of multiple tissues of diploids and tetraploids of both sexes, the key genes and pathways that regulate sexual and polyploid growth dimorphisms of loach are revealed. Our study provides basic information for breeding loach strains with fast growth and uniform size.

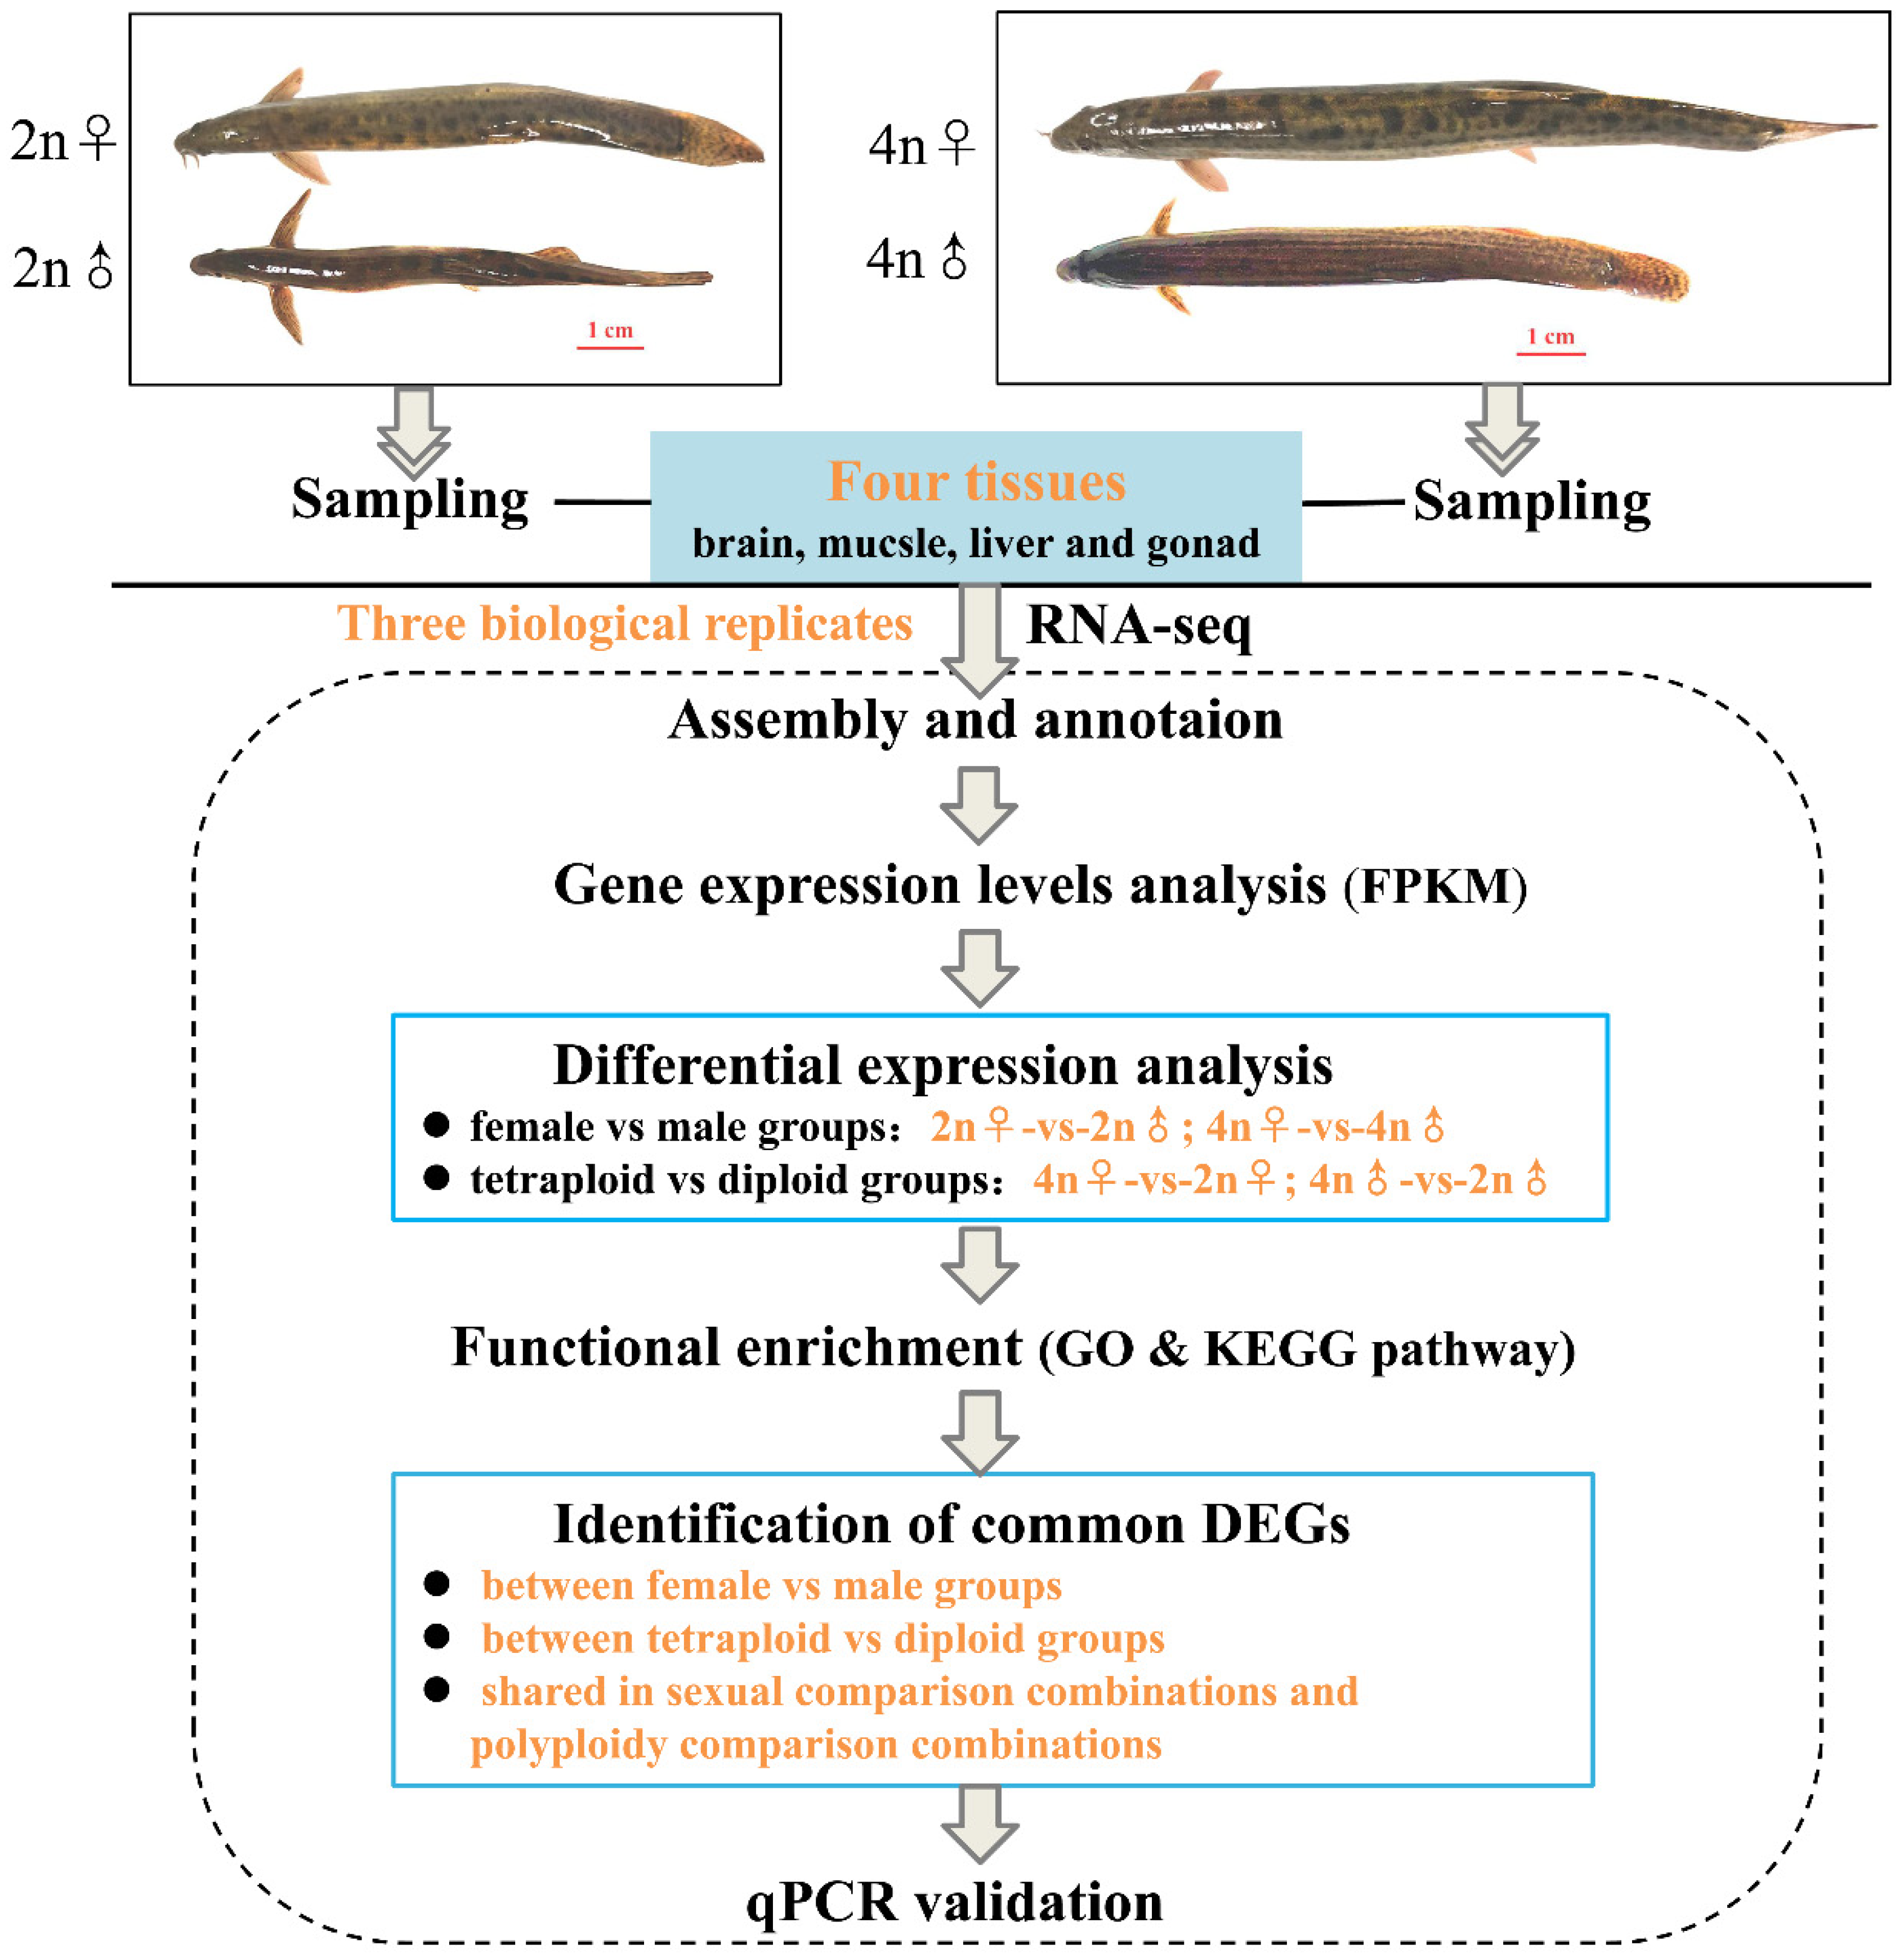
2. Materials and Methods

2.1. Ethic Statement

All experimental protocols were approved by the Animal Experimental Ethical Inspection of Laboratory Animal Center, Huazhong Agricultural University, Wuhan, China (HZAUDO-2016-005, 2016-10-26). All surgery was performed under MS-222 (Sigma, Saint Louis, MO, USA; 100 mg/L) anesthesia, and all efforts were made to minimize suffering. All experiments were performed in accordance with relevant guidelines and regulations.

2.2. Sampling and RNA Extraction

Loaches for sampling were collected from the Fisheries Experimental Station of Huazhong Agricultural University. A total of 100 loaches were separately selected from previously established 18-month-old diploid and tetraploid loach populations. The ploidy of fish was determined by flow cytometry analysis as previously described [33], and Paramisgurnus dabryanus, which is a known diploid, was used as a control (Figure S1). Forty-eight healthy loaches (24 diploids and 24 tetraploids, containing both females and males) were randomly selected and acclimatized in two tanks with adequate aeration at 24–26 °C for one week before processing. Four tissues (brain, gonad, liver and muscle) of female and male of diploid and tetraploid individuals were immediately sampled separately. Total RNA from each sample was isolated using RNAiso Plus (TaKaRa, Dalian, China) according to the manufacturer’s instructions. RNA quality and concentration were determined using an Agilent Bioanalyzer 2100 (Agilent Technologies, Santa Clara, CA, USA) and Qubit® RNA Assay Kit in Qubit® 2.0 Fluorometer (Life Technologies, Carlsbad, CA, USA), respectively. High-quality RNA was subjected to further libraries construction.

2.3. Library Construction and Sequencing

Equal amounts of RNA from four individual samples were mixed as one sequencing sample. A total of 1.5 µg RNA per sample was used as input material for the RNA sample preparations following the removal of possible genomic DNA. Sequencing libraries were generated using NEBNext® Ultra™ RNA Library Prep Kit for Illumina® (NEB, Ipswich, MA, USA) following the manufacturer’s recommendations and index codes were added to attribute sequences to each sample. Subsequently, the library preparations were sequenced on an Illumina HiSeq 2500 platform and 150 bp paired-end reads were generated. Library construction and sequencing were performed by Novogene (Beijing, China). In total, 48 sequencing libraries were constructed and transcriptome data were obtained in this study. All sequencing data were uploaded to the Sequence Read Archive (SRA) of the National Center for Biotechnology Information (NCBI accession number PRJNA678824).

2.4. Preliminary Analysis of the Transcriptome Data

Raw data (raw reads) in fastq format were first processed using in-house Perl scripts. At this step, clean data (clean reads) were obtained after filtering out reads with adapters and poly-N, as well as low-quality reads (<Q20) from the raw data. Simultaneously, Q20, Q30, GC-content and sequence duplication level of the clean data were calculated.
All subsequent analyses were based on high-quality clean data. The clean reads from the high-quality clean data were then de novo assembled using Trinity software with min_kmer_cov set to 2 as default and all other parameters set to default [34]. The expression level of each transcript was calculated by the expected number of fragments per kilobase of transcript sequence per million base pairs sequenced (FPKM) method [35].

2.5. Screening and Functional Analysis of Differentially Expressed Genes (DEGs)

Differential expression analysis of the samples was performed using DEGseq2 [36]. Genes with an adjusted p-value (padj) < 0.05 and |log2(fold-change)| > 1 were set as the threshold for significantly differential expression.
Gene ontology (GO) enrichment analysis of the differentially expressed genes (DEGs) was implemented in the GOseq R packages based on Wallenius non-central hyper-geometric distribution, which can adjust for gene length bias in DEGs. In GO enrichment analysis, only categories with a corrected p-value < 0.05 were considered as enriched in the network. The Kyoto Encyclopedia of Genes and Genomes (KEGG) pathway analysis was used to determine the location of the DEGs in the different pathways. In this study, KOBAS software was used to test the statistical enrichment of DEGs in the KEGG pathways [37]. Pathways with a corrected p-value < 0.05 were considered as the enriched items.

2.6. Validation of RNA-Seq Data by Quantitative Real-Time PCR

To confirm the reliability of the data obtained with RNA-Seq, four genes (pgk, gpi, ldh, and eno) involved in the glycolytic pathway, three estrogen receptor genes (erα, erβ1, and erβ2), and several reported growth-related genes (gh, igf1, igf2, igf1r, and igf2r) were selected for validation by quantitative real-time PCR (qPCR) using the primers listed in Table S1. qPCR was performed on the Applied Biosystems QuantStudio 6 Flex Real-time PCR System (Applied Biosystems, Carlsbad, CA, USA) with SYBR® Premix DimerEraser™ (TaKaRa, Shiga, Japan) according to the manufacturer’s instructions. Five biological replicates were performed, with β-actin serving as the reference for internal standardization. The PCR cycling conditions were as follows: 95 °C for 30 s, followed by 40 cycles of 95 °C for 5 s, 60 °C for 30 s, and 72 °C for 30 s. The qPCR results were analyzed using the 2−ΔΔCt method [38]. All data were expressed as mean ± standard deviation (S.D.) values of five replicates. Statistical significance was determined using one-way analysis of variance (ANOVA) followed by multiple comparison testing with the least significant distance (LSD) t-test using SPSS 17.0 software. Statistical significance was set at p-value < 0.05. The entire research scheme diagram is shown in Figure 1.

3. Results

3.1. De novo Transcriptome Assembly and Quality Evaluation

Before de novo transcriptome assembly, paired-end raw reads were processed to remove adapter fragments and low-quality bases, generating clean reads from raw reads. As shown in Table S2, the raw reads, clean reads, clean bases, Q20, Q30, and the GC content were recorded for 48 libraries. For all libraries, Q20 ≥ 90%, and Q30 ≥ 89%, showing the high-quality of the sequencing data and, thus, could be used for subsequent analyses. After using the Trinity software, de novo sequence assembly resulted in 351,696 unigenes with 956 bp N50 and an average length of 791 bp ranging from 301 bp to 42,939 bp (Tables S3 and S4). The number of unigenes and their length distribution indicated that 68,606 unigenes were >1000 bp in length (Table S3). The functions of unigenes were annotated using GO and KEGG databases. According to GO annotations, the unigenes were involved in 25 biological processes, 16 cell components, and 9 molecular functions (Figure 2A). These unigenes participated in 32 KEGG pathways (Figure 2B).

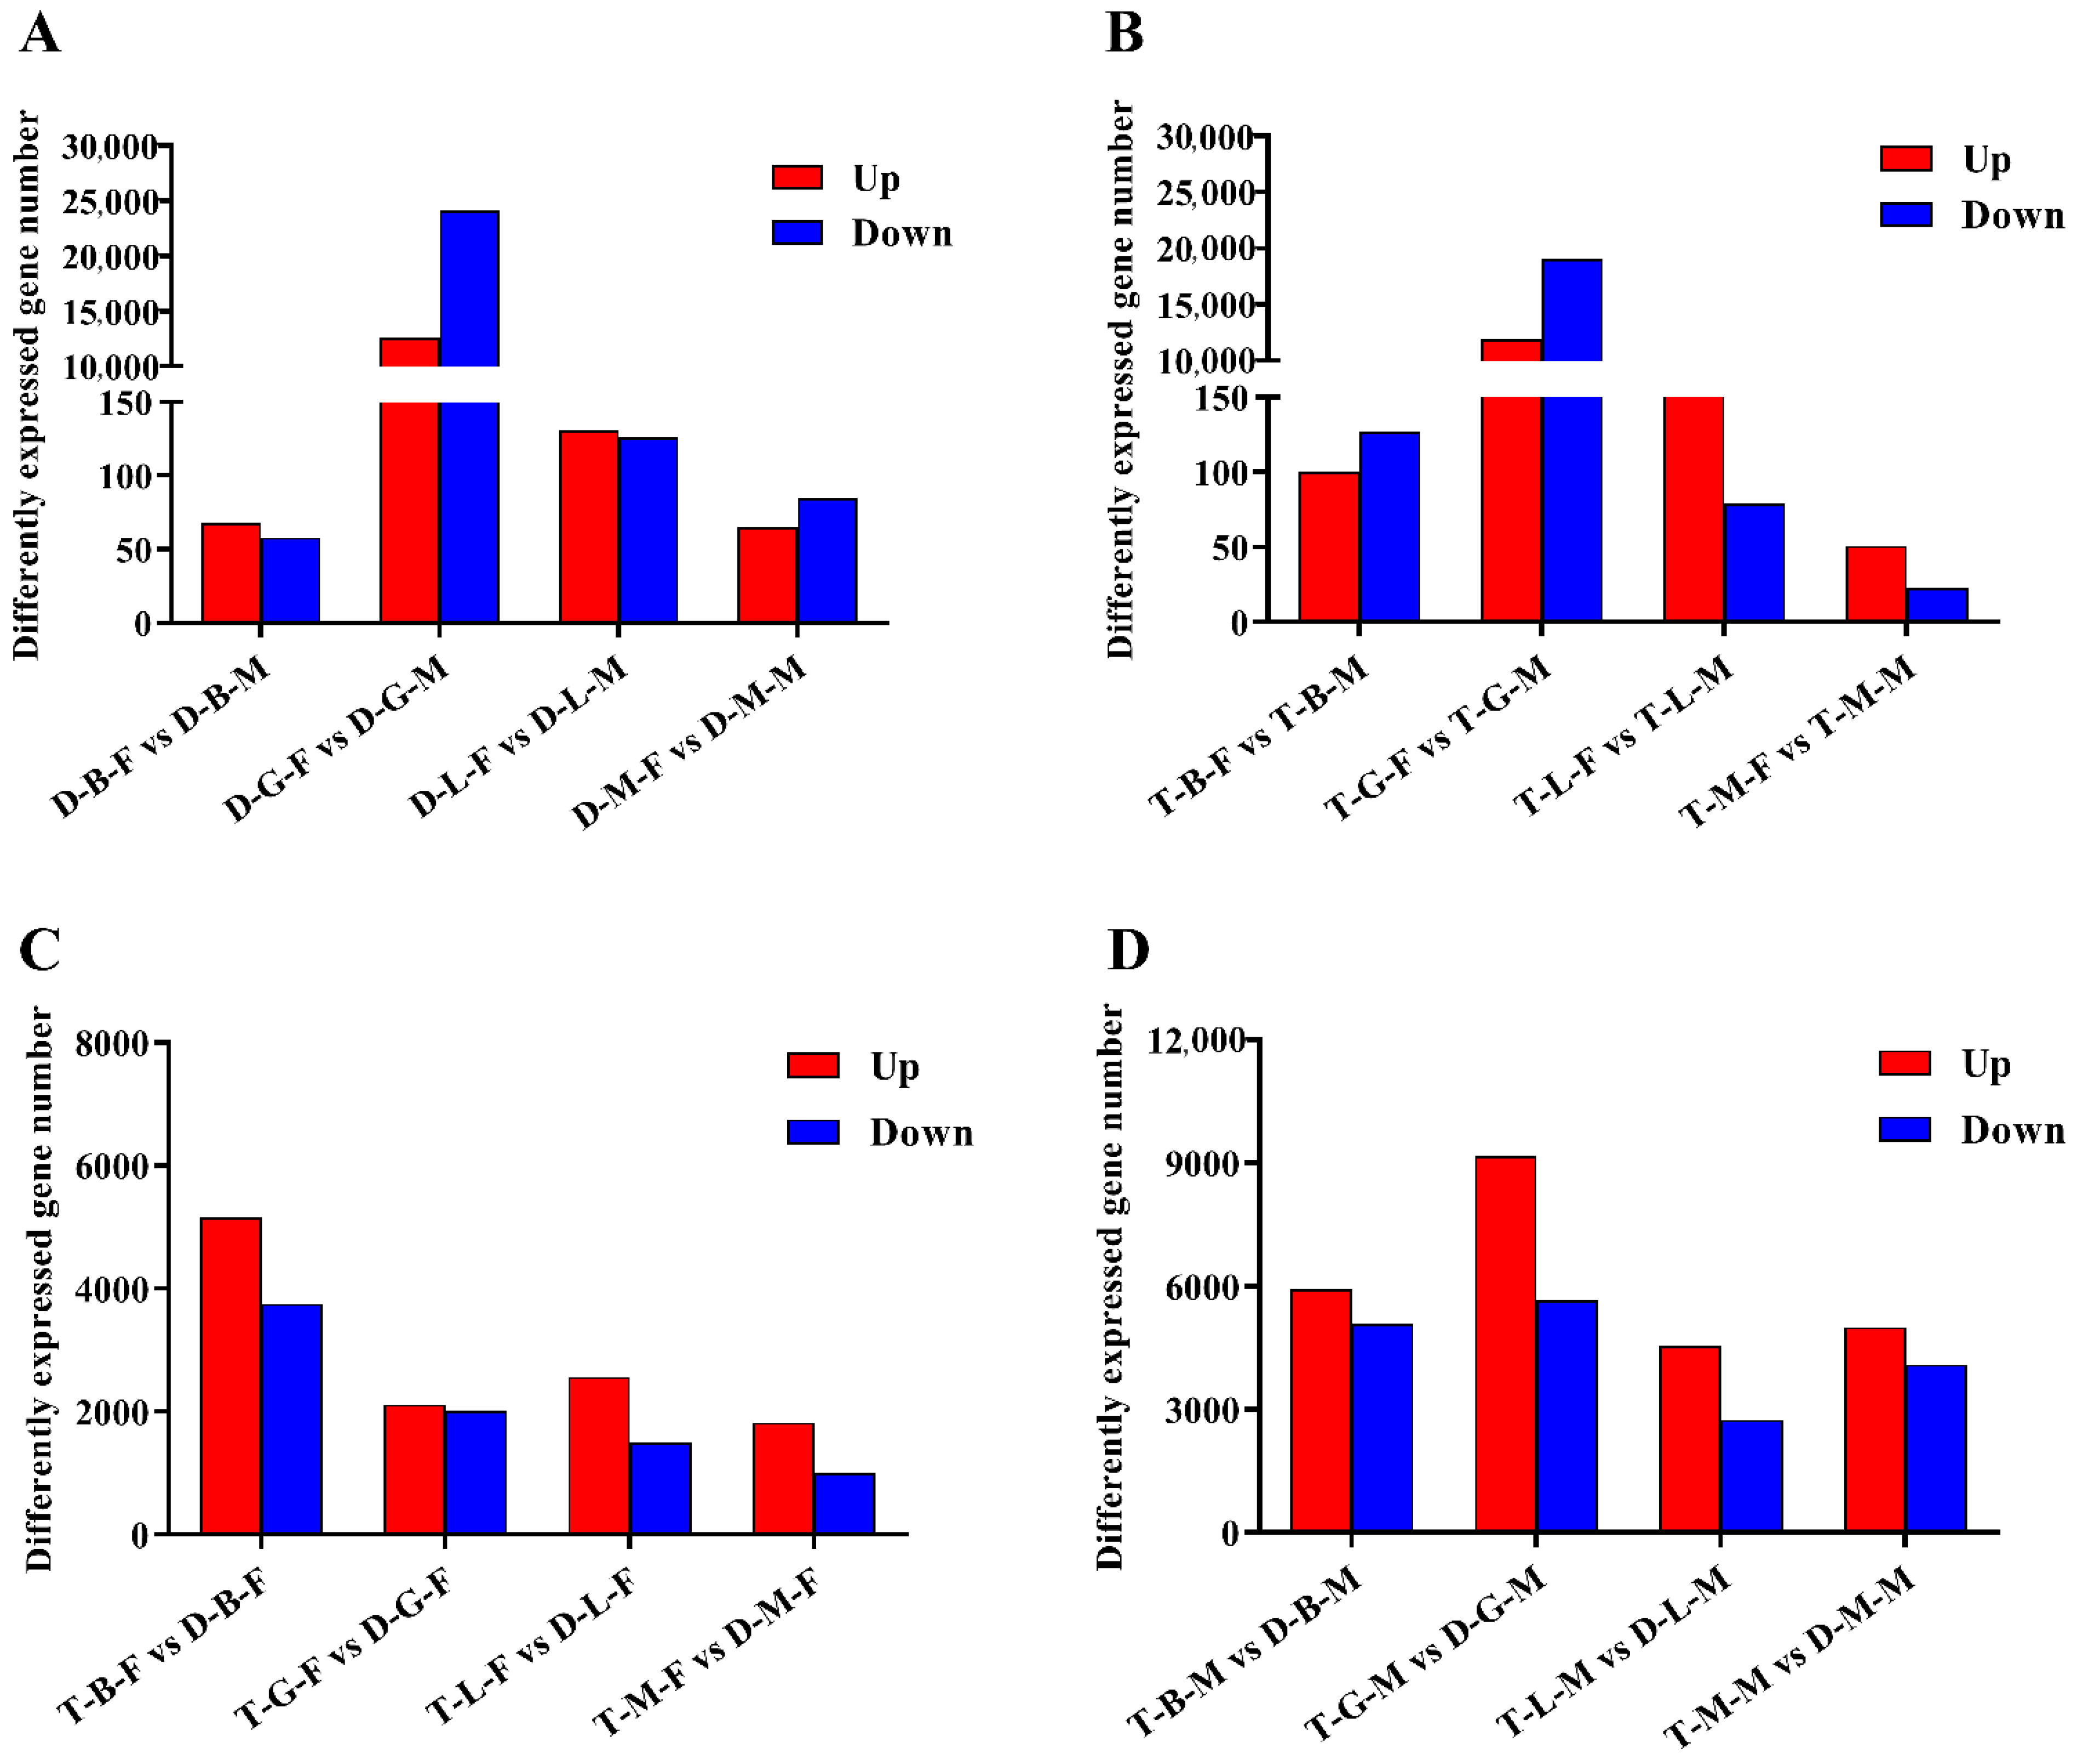
3.2. Analysis of DEGs between Female and Male Loaches

Genes were considered DEGs if they showed a padj value < 0.05 and |log2(fold-change)| > 1. Among the comparisons of diploid female and male loaches (brain, gonad, liver, and muscle samples from diploid females were compared with those from diploid males, comparisons were named D-B-F vs. D-B-M, D-G-F vs. D-G-M, D-L-F vs. D-L-M, and D-M-F vs. D-M-M), 126 (68 upregulated and 58 downregulated), 36,765 (12,622 upregulated and 24,143 downregulated), 257 (131 upregulated and 126 downregulated), and 150 (65 upregulated and 85 downregulated) DEGs were identified in brain, gonad, liver, and muscle tissues, respectively (Figure 3A). Based on the results of GO annotation, the DEGs in the brain were enriched in three molecular function items, including oxygen binding, heme binding, and tetrapyrrole binding (Table S5). In gonads, 305, 101, and 125 DEGs were enriched in biological processes, cell components, and molecular functions, respectively (Table S6), among which most of the DEGs were involved in protein binding, ion binding, oxidoreductase activity, protein-disulfide reductase activity, and cellular protein modification processes. In the liver, DEGs were significantly enriched in two biological processes and two cell components, which were mainly involved in lipid transport, lipid localization and substrate characteristic transport activity. The DEGs in the muscle were mainly enriched on four molecular functional related items, which were associated with oxidoreductase activity, phosphorylase activity, and glycogen phosphorylase activity (Table S5). Furthermore, according to the KEGG pathway analysis results, the DEGs identified in the brain were mainly involved in steroid hormone biosynthesis and a series of metabolic processes including porphyrin and chlorophyll, amino acids and arachidonic acid metabolism. Meanwhile, the DEGs in gonad, liver, and muscle were mainly associated with cell cycle and PI3K-Akt signaling pathway, phagosome and antigen processing and presentation, glycolysis/gluconeogenesis and HIF-1 signaling pathway, respectively (Table S7).
Among the comparisons of tetraploid female and male loaches (brain, gonad, liver and muscle samples from tetraploid females were compared with those from tetraploid males, and comparisons were named T-B-F vs. T-B-M, T-G-F vs. T-G-M, T-L-F vs. T-L-M, and T-M-F vs. T-M-M), a total of 227 (100 upregulated and 127 downregulated), 30,970 (11,896 upregulated and 19,074 downregulated), 253 (174 upregulated and 79 downregulated), and 74 (51 upregulated and 23 downregulated) DEGs were identified in brain, gonad, liver, and muscle tissues, respectively (Figure 3B). Further GO annotation results showed that there were no GO items in the brain. In gonads, 216, 82, and 116 DEGs were enriched in biological processes, cell components, and molecular functions, respectively (Table S8), among which most of the DEGs were involved in protein binding, ion binding, and oxidoreductase activity (Table S5). In the liver, similar to the GO items of DEGs identified in the D-L-F vs. D-L-M group, the DEGs identified in the T-L-F vs. T-L-M group were also mainly involved in lipid transport, lipid location and matrix characteristic transport activity. In the muscle, unlike the enriched items of DEGs identified in the D-M-F vs. D-M-M group, the DEGs identified in the T-M-F vs. T-M-M group were enriched in the biological processes related to cell cycle and the cell component related to skeletal muscle. The KEGG pathways mainly enriched in the brain, gonad, liver, and muscle were involved in some metabolic processes (protein digestion and absorption, taurine and hypotaurine metabolism), protein processing in endoplasmic reticulum, biosynthesis, and tight junction, respectively (Table S7).

3.3. Analysis of DEGs between Tetraploid and Diploid Loaches

To characterize the differences between tetraploid and diploid loaches, the transcriptional levels of the brain, gonad, liver, and muscle tissues of tetraploids and diploids of the same sex were compared. Among the comparisons of tetraploid and diploid female loaches (brain, gonad, liver, and muscle samples from tetraploid females were compared with those from diploid females, and comparisons were named T-B-F vs. D-B-F, T-G-F vs. D-G-F, T-L-F vs. D-L-F, and T-M-F vs. D-M-F, respectively), a total of 8913 (5156 upregulated and 3757 downregulated), 4136 (2114 upregulated and 2022 downregulated), 4069 (2563 upregulated and 1506 downregulated) and 2832 (1820 upregulated and 1012 downregulated) DEGs were identified in brain, gonad, liver, and muscle tissues, respectively (Figure 3C). Among the comparisons of tetraploid and diploid male loaches (T-B-M vs. D-B-M, T-G-M vs. D-G-M, T-L-M vs. D-L-M, and T-M-M vs. D-M-M represent the comparison of brain, gonad, liver, and muscle samples between tetraploid and diploid males, respectively), a total of 11,014 (5931 upregulated and 5083 downregulated), 14,868 (9173 upregulated and 5675 downregulated), 7307 (4559 upregulated and 2748 downregulated), and 9090 (5000 upregulated and 4090 downregulated) DEGs were identified in the brain, gonad, liver, and muscle tissues, respectively (Figure 3D).
GO annotation of the DEGs among the comparisons of tetraploids and diploids of both sexes indicated that the DEGs identified in the brain were associated with DNA integration, DNA metabolic process and oxidoreductase activity. In addition, the DEGs identified in the gonad mainly performed the molecular function of nickel cation binding; those in the liver participated in DNA integration, binding and metabolic processes. Meanwhile, the DEGs in the muscle were enriched in terms of cell components, among which microtubule and actin cytoskeleton were the most represented (Table S5). KEGG pathway analysis further indicated that DEGs between the tetraploids and diploids of both sexes were mainly involved in pathways related to a series of metabolic processes in the brain, cell cycle and oxidative phosphorylation in the gonad, and related to some bacterial infections and their phagocytosis in the liver (Table S7).

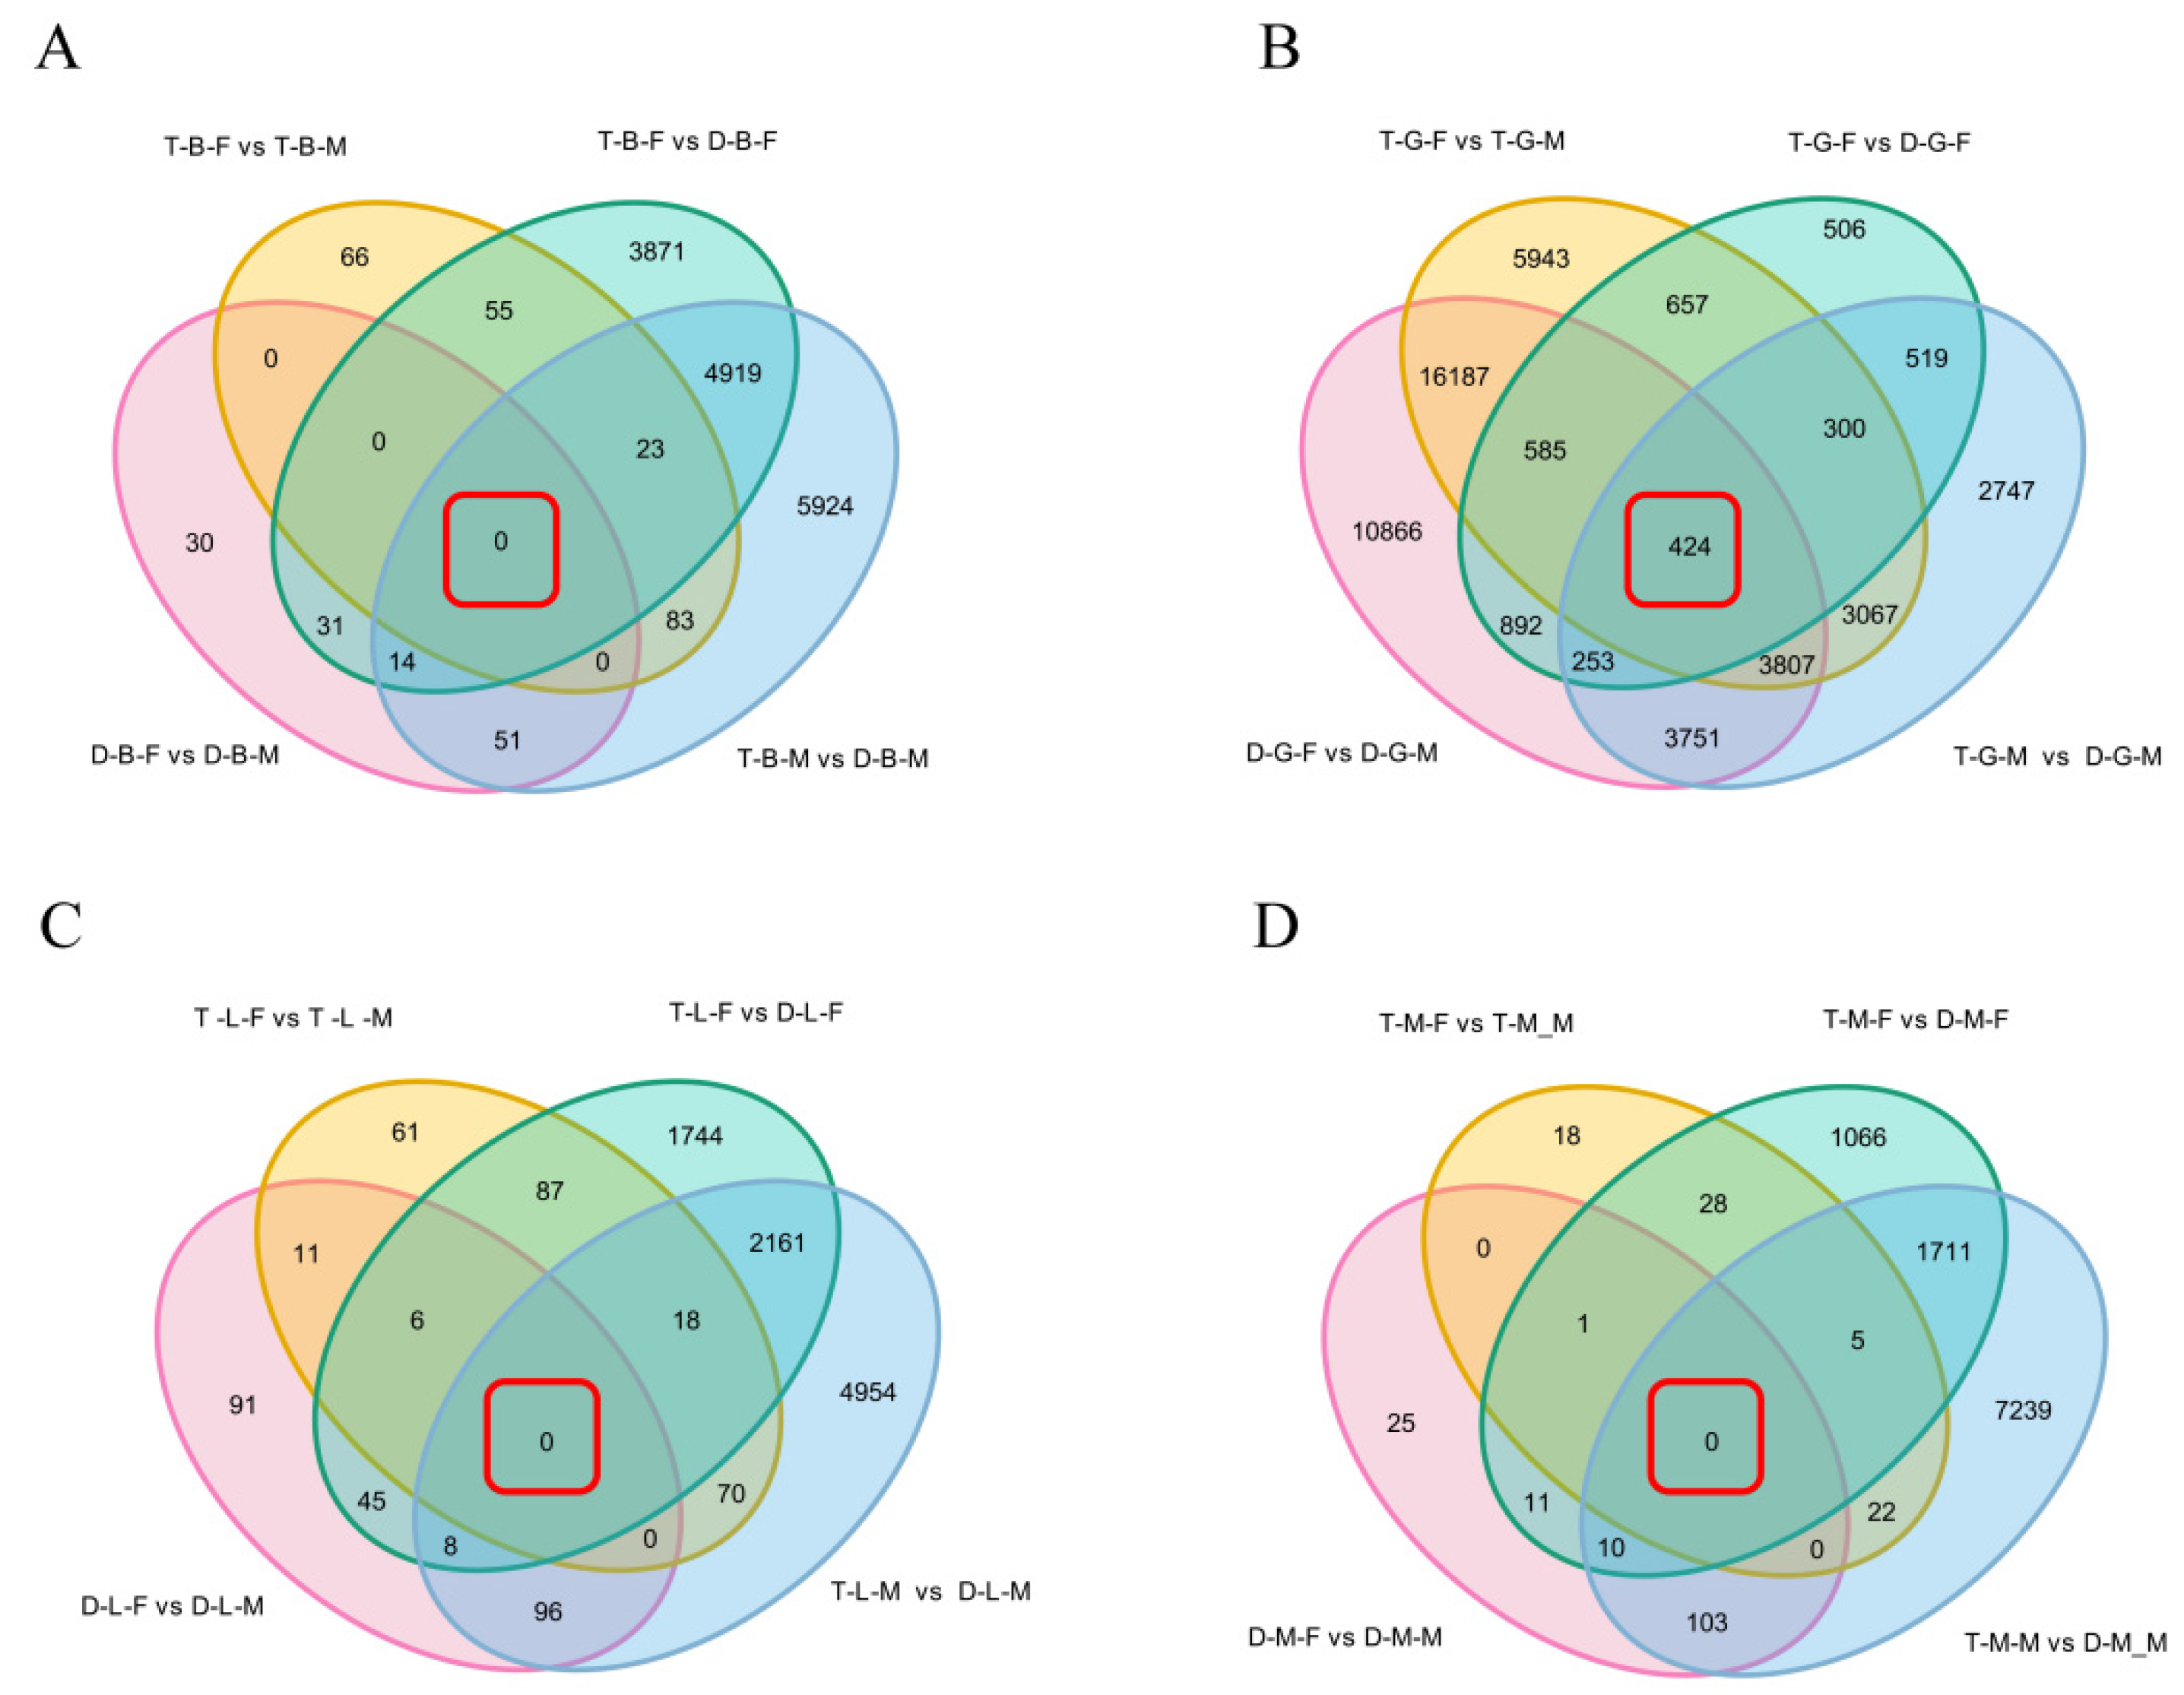
3.4. Identification of Common DEGs Shared in Different Comparison Groups in the Same Tissue

In order to obtain the common DEGs shared in different comparison combinations within the same tissue, the DEGs identified in four types of comparative combinations (diploid females vs. diploid males (D-B/G/L/M-F vs. D-B/G/L/M-M), tetraploid females vs. tetraploid males (T-B/G/L/M-F vs. T-B/G/L/M-M), tetraploid females vs. diploid females (T-B/G/L/M-F vs. D-B/G/L/M-F), and tetraploid males vs. diploid males (T-B/G/L/M-M vs. D-B/G/L/M-M) were comprehensively analyzed. When considering the common DEGs between D-B/G/L/M-F vs. D-B/G/L/M-M and T-B/G/L/M-F vs. T-B/G/L/M-M comparison combinations, Venn diagram showed that there were 21,003, 17, and 1 DEGs in the gonad, liver, and muscle, respectively (Figure 4), which were only related to sexes but not ploidy. Surprisingly, there were no common DEGs shared in the comparison combinations of brain (D-B-F vs. D-B-M and T-B-F vs. T-B-M). In addition, the overlapping DEGs in the comparison combinations of T-B/G/L/M-F vs. D-B/G/L/M-F and T-B/G/L/M-M vs. D-B/G/L/M-M were also identified. As shown in Figure 4, there were 4956, 1496, 2187, and 1726 common DEGs shared in the brain, gonad, liver, and muscle, respectively, which were only related to ploidy but not sex. According to KEGG enrichment result, whether it was only related to ploidy or only related to sexes, the DEGs were mainly enriched in the oxidative phosphorylation pathway, metabolic pathways, and cardiac muscle contraction process, among which most of the genes, such as cytochrome c oxidase subunit 2 (cox2), cox3, nd4, nd5, and ubiquinol-cytochrome c reductase cytochrome b (cytb), were upregulated genes, whereas cox1 was the most enriched downregulated gene.
Moreover, the overlapping DEGs in the four comparison combinations (D-B/G/L/M-F vs. D-B/G/L/M-M, T-B/G/L/M-F vs. T-B/G/L/M-M, T-B/G/L/M-F vs. D-B/G/L/M-F, and T-B/G/L/M-M vs. D-B/G/L/M-M) were genes related to sexual and polyploidy size dimorphisms of loaches. The Venn diagram showed that there were no common DEGs in the four comparison combinations of brain, liver, and muscle tissues, but there were 424 common DEGs in gonad tissue. KEGG pathway enrichment analysis showed that the common DEGs of different comparison combinations of gonads were mainly involved in transcriptional misregulation in cancer, EGFR tyrosine kinase inhibitor resistance, ErbB signaling pathway, endocrine resistance, and phospholipase D signaling pathway (Table S9), which were associated with a series of cellular processes, including growth, proliferation, and differentiation.

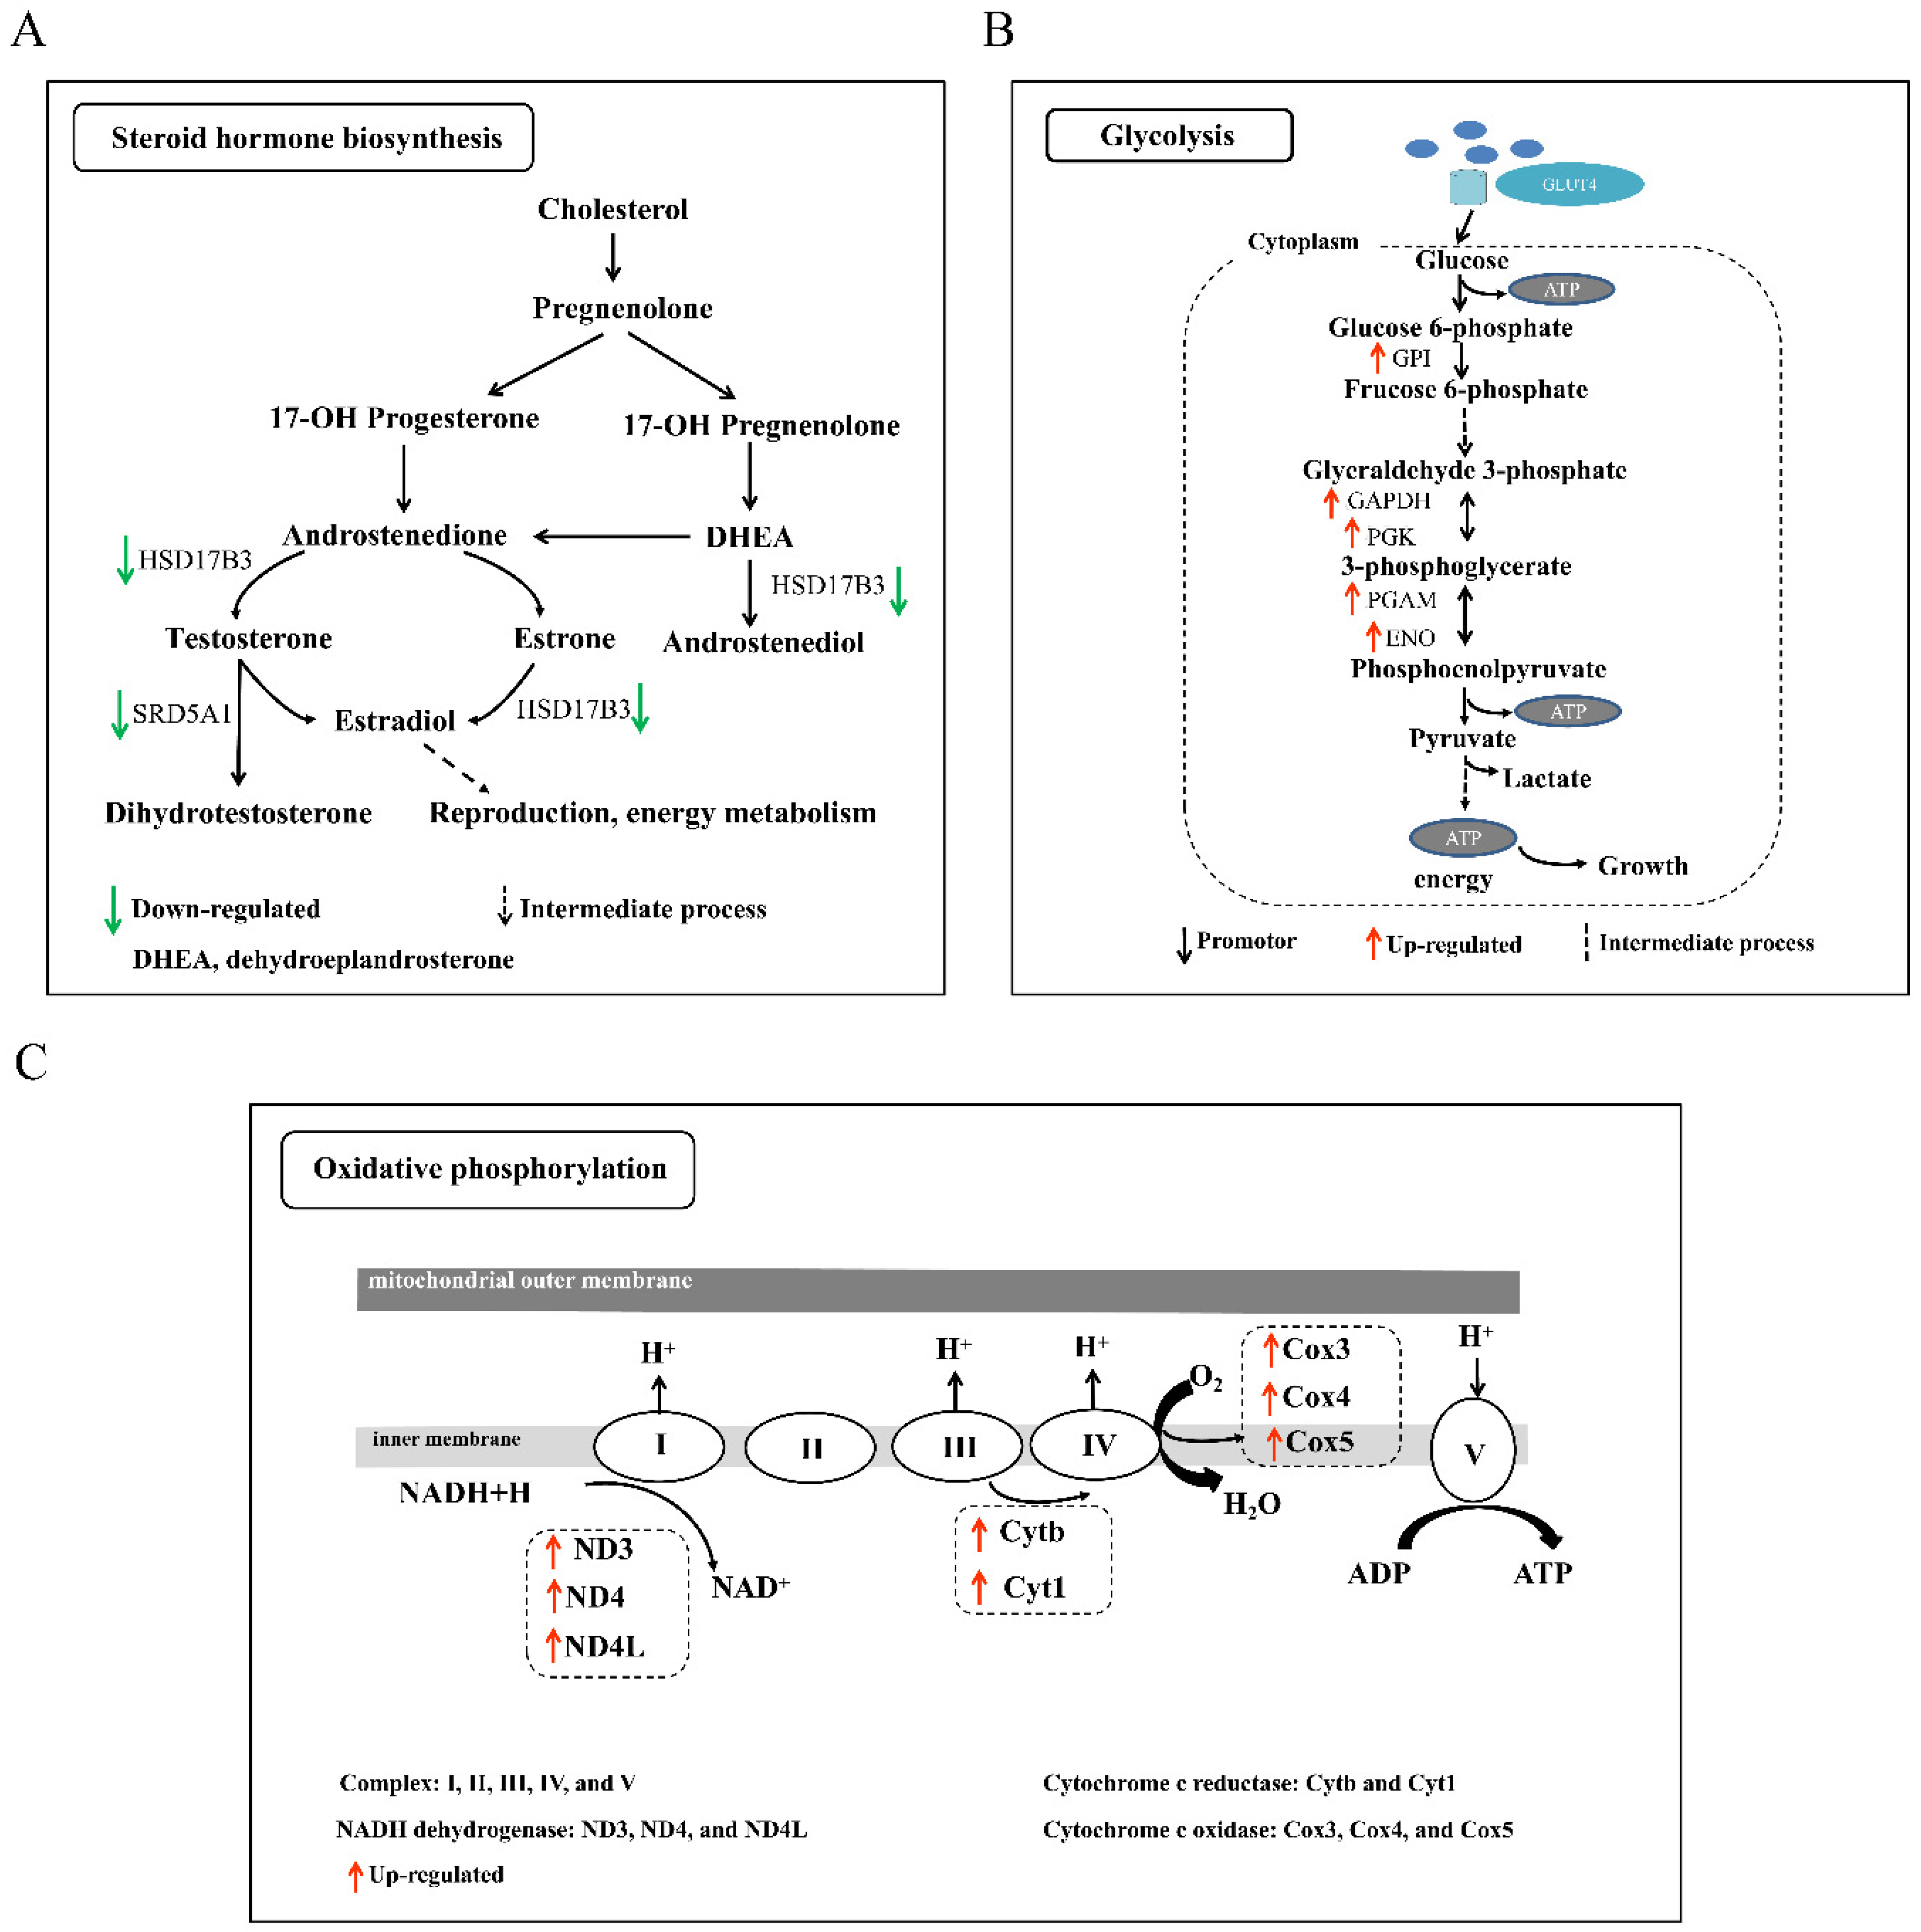
3.5. Analysis of KEGG Pathways Related to Sexual and Polyploid Growth Dimorphisms of Loaches

In order to understand the pathways involved in the regulation of sexual growth dimorphism, we focused on the growth-related pathways enriched by DEGs in two types of comparative combinations (D-B/G/L/M-F vs. D-B/G/L/M-M and T-B/G/L/M-F vs. T-B/G/L/M-M). Among the comparisons of diploid females and males (D-B/G/L/M-F vs. D-B/G/L/M-M), the growth-related pathways enriched by DEGs in the brain were steroid hormone biosynthesis and a series of metabolic processes including porphyrin and chlorophyll, amino acids and arachidonic acid metabolism (Table 1). Among them, metabolic pathway genes (E2.3.1.37, 5-aminolevulinate synthase and Alox5, arachidonate 5-lipoxygenase) and protein digestion and absorption-related genes (cola1 and cola2, collagen type I alpha 1/2 chain) were upregulated in females, whereas the steroid hormone biosynthesis-related genes hsd17b3 (hydroxysteroid 17-beta dehydrogenase 3) and srd5a1 (3-oxo-5-alpha-steroid 4-dehydrogenase 1) were downregulated in females (Figure 5A). In the gonads of diploid females and males, the DEGs related to growth were mainly enriched in the cell cycle and DNA replication pathways. Most of the genes involved in the cell cycle (such as cdc45, ccne, apc, orc1, and p53) and DNA replication (pcna, ssb, mcm2, and RNase-HI) were expressed at higher levels in females than in males. The DEGs between diploid females and males in the liver were not significantly enriched in any growth-related pathways, but were mainly enriched in pathogenic infection and immune-related pathways, whereas those in the muscle were mainly enriched in glycolysis/gluconeogenesis and glucagon signaling pathways. These pathways-related genes (gpi, pgk, pgam, eno, and gapdh) were all upregulated in females (Figure 5B and Figure 6A). In the comparison of tetraploid females and males (T-B/G/L/M-F vs. T-B/G/L/M-M), the DEGs involved in protein digestion and absorption and drug metabolism-cytochrome P450 pathways enriched in the brain were upregulated in females, while those involved in cardiac muscle contraction, insulin secretion, MAPK signaling pathway, and calcium signaling pathway were downregulated. Interestingly, in gonads, the mRNA expression levels of ribosome biogenesis in eukaryotes and protein processing in endoplasmic reticulum process-related genes (utp22, utp6, emg1, ssr1, eif2α, and ire1) were also upregulated in females. In the liver, the expression levels of the enriched ribosome-related genes (lp1, l11e, and l23e) and glycolysis/gluconeogenesis-related genes (pfk and pgk) were upregulated in females, while the biosynthesis of unsaturated fatty acids pathway gene scd and steroid hormone biosynthesis-related genes cyp7a1 and hsd11b2 were downregulated. In the muscle, the expression of the DEGs involved in tight junction (myl6, myh9, and myl12) and fatty acid degradation (cpt1) processes were higher in males than in females. However, the expression of genes related to glycolysis and linoleic acid metabolism was reversed, whereby it was higher in females than in males.
In addition, in order to reveal the pathways regulating polyploid growth dimorphism, we selected the growth-related pathways enriched by the DEGs in T-B/G/L/M-F vs. D-B/G/L/M-F and T-B/G/L/M-M vs. D-B/G/L/M-M for analysis. According to the results of KEGG pathway enrichment analysis, most of the DEGs identified in the four tissues in the comparison of tetraploid and diploid females (T-B/G/L/M-F vs. D-B/G/L/M-F) were significantly enriched in the oxidative phosphorylation pathway (Table 1). Most of the genes (NADH-ubiquinone oxidoreductase chain 3 (nd3), nd4, nd4l, cytb, cytochrome c oxidase subunit 3 (cox3), cox4, and cox5) exhibited higher expression in tetraploids than in diploids (Figure 5C and Figure 6B), whereas the expression of the DEGs related to steroid hormone biosynthesis and fatty acid degradation pathways was generally lower in tetraploids than in diploids. Similarly, in the comparison of tetraploid and diploid males (T-B/G/L/M-M vs. D-B/G/L/M-M) in multiple tissues, DEGs that were relatively highly expressed in tetraploid males were also significantly enriched in oxidative phosphorylation and glycolysis pathways, while those with lower expression in tetraploid males were mainly enriched in steroid hormone synthesis (Table 1). A heat-map was constructed by filtering some key genes related to glycolysis and oxidative phosphorylation pathways, and the results showed that genes related to glycolysis had high expression levels in both diploid and tetraploid muscle tissues, while most of the genes related to oxidative phosphorylation had high expression levels in multiple tissues (Figure 6).

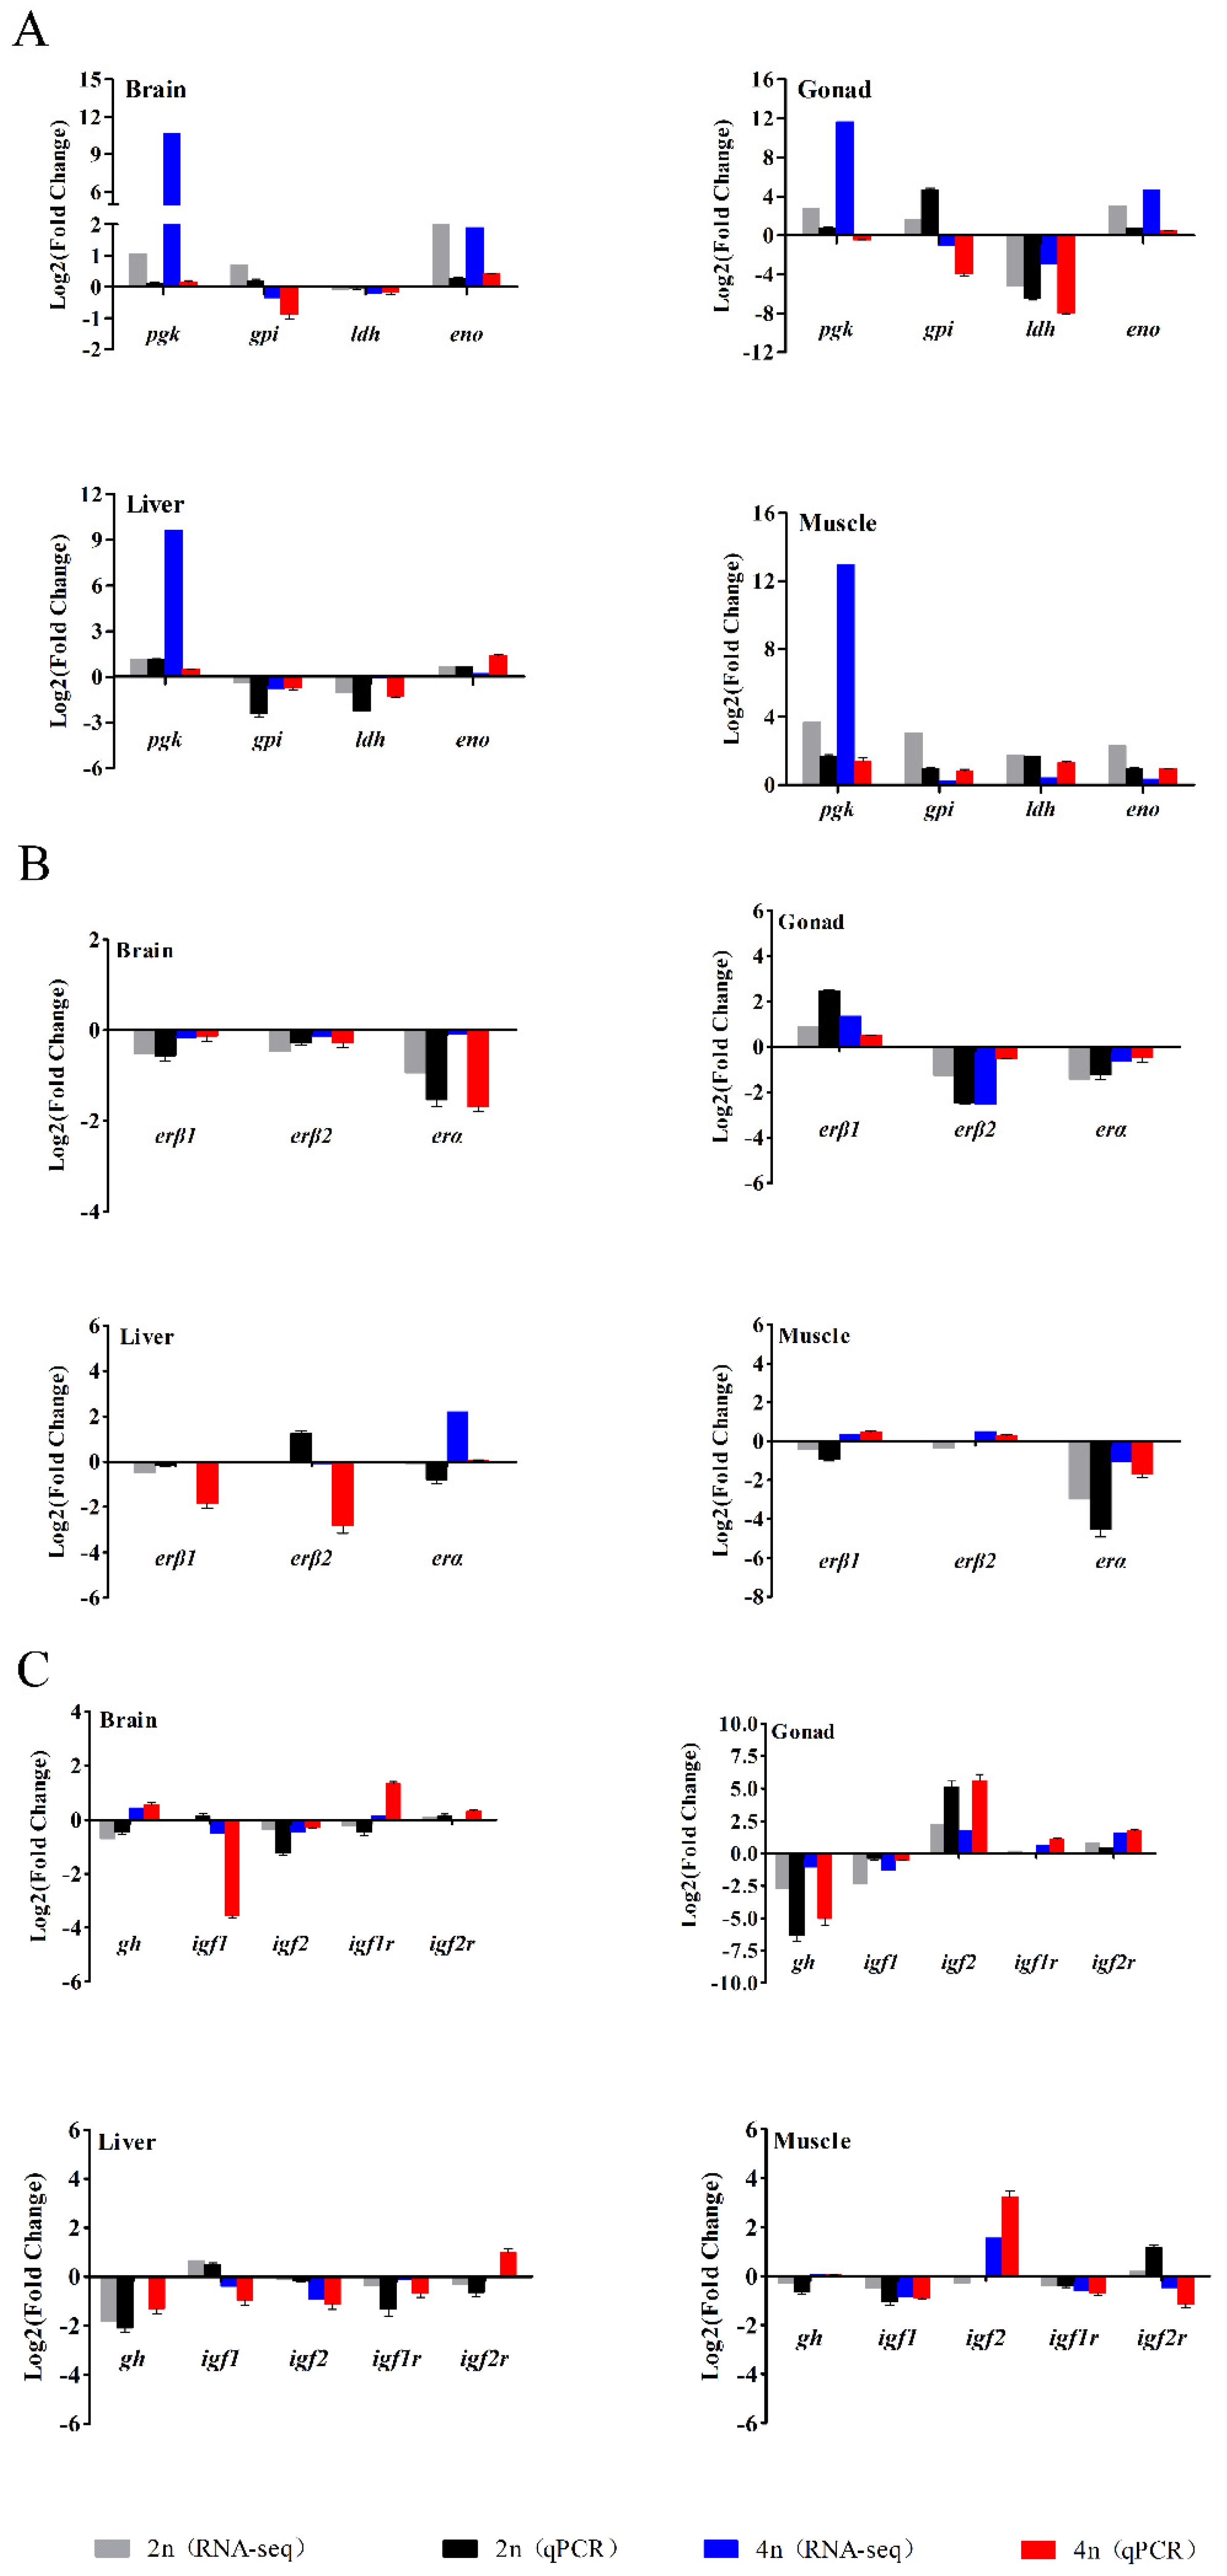
3.6. Verification of RNA-seq Data by qPCR

To confirm the reliability of the RNA-seq data, four genes (pgk, gpi, ldh, and eno) involved in the glycolytic pathway, three estrogen receptor genes (erα, erβ1, and erβ2) and several growth-related genes (gh, igf1, igf2, igf1r, and igf2r) were selected for qPCR analysis. The expression levels of these genes are shown in Figure 7. Overall, the differential expression patterns detected by the two methods showed good consistency, although the exact Log2 (fold-change) in the genes at several data points varied between the RNA-seq and qPCR analyses.

4. Discussion

Growth is one of the most important economic traits for aquaculture fish, and is of great significance to the development of the aquaculture industry [39]. Understanding the molecular mechanisms of sexual and polyploid growth dimorphisms will provide a theoretical basis for the cultivation of fast-growing populations with stable and uniform growth performance in aquaculture. So far, research on the growth differences between female and male fish has mainly focused on the aspects of feeding and digestion [5], growth, reproductive energy allocation [40], inheritance, genotypes and phenotypes [41], steroid hormone levels [42], and growth axis genes [43,44]. Moreover, past research on polyploid growth dimorphism has focused on the expression of a single gene [18]. Unlike most previous studies, we performed comparative transcriptome integration analysis of multiple tissues of diploids and tetraploids in both sexes. This is the first report of a combined analysis of sexual and polyploid growth dimorphisms in fish, and it will help us understand the regulatory mechanisms involved and provide basic information for breeding the loach strains with fast growth and uniform size.
In the comparison of male and female loach transcriptomes, our results demonstrated that the main pathways related to growth differences between diploid females and males were glycolysis, hormone synthesis, and cell cycle. Specifically, the expression levels of unigenes related to metabolism (gpi, pgk, pgam, etc.) and cell cycle (cdc45, cyce, apc, etc.) were higher in females than in males, while the expression level of hormone synthesis-related genes (such as hsd17b3) in females was lower than that in males. Similar to the male and female diploid comparison group, the male and female tetraploid comparison group was also significantly enriched in glycolysis/gluconeogenesis, and the glycolysis/gluconeogenesis level was also higher in females than in males. Glycolysis/gluconeogenesis is the central pathway of most organisms, providing energy in the form of ATP and reducing power, pyruvate to fuel for the tricarboxylic acid cycle, and precursors for secondary metabolism, amino acid and fatty acid biosynthesis [45]. PGK is a key enzyme for adenosine triphosphate (ATP) generation in glycolysis. Taken together, our results showed that female individuals had higher metabolic levels than male individuals, but lower levels of steroid hormone synthesis than males. On theoretical grounds, there is a link between growth rate and metabolic rate, with fast growth requiring fast metabolism to provide the growing organism with the necessary materials and energy [46]. Glycolysis has also been found upregulated in the muscle of domestic rainbow trout compared to their wild counterparts [47], and also in faster-growing fish of the same species; this up-regulation has been associated with an increased muscle energy demand in fast-growing fish [48,49]. Studies in humans have also shown that men grow faster than women and have higher metabolic levels [50]. However, in cows where males grow faster than females, the total glucose metabolism is two-fold higher in males than in females, but the activity of the pentose phosphate pathway is four times higher in females than in males [51]. The molecular mechanisms underlying these effects are unclear. The earlier view is that females may have increased metabolic levels to reduce the effects of oxygen free radicals, allowing them to grow faster and have higher viability [52]. In our study, we speculate that the higher metabolic levels of female individuals provide more energy for growth, and the reduction in hormone synthesis levels also saves energy. Therefore, female individuals grow faster than male individuals and are larger in size.
In addition, protein digestion and absorption-related genes were also significantly upregulated in females, among which cola1 and cola2 were the most enriched. COLA1 and COLA2 are members of the type I collagen family. Collagen is not only an important protein in animal connective tissue, but also the main component of the extracellular matrix (ECM), which can provide support for cell growth [53]. Other collagens have also been found to be closely related to the development of osteogenic cell [54,55]. Our results indicated that the expression level of type I collagen is higher in females with faster growth than in males with slower growth, which is consistent with the reported growth-promoting effect of collagens. However, among the DEGs, the most downregulated genes in females were cacna1c and cacna1d, which were involved in multiple pathways, including insulin secretion, calcium signaling pathway and MAPK signaling pathway. It has been reported that mice with cacna1c and cacna1d deficiencies often lack of exercise and social interaction skills [56]. Female individuals may reduce exercise and social skills by regulating the decreased expression of cacna1c and cacna1d in the body, thus reducing energy expenditure and maintaining a larger body size.
In the comparative analysis of brain, liver, muscle, and gonad tissues of male and female individuals, both DEGs in male and female brains of diploids and tetraploids were enriched in metabolic processes, such as amino acid metabolism, glycolysis/gluconeogenesis, and oxidative phosphorylation. The DEGs in the muscle were also significantly enriched in metabolic processes, whereas those in the liver were mainly related to Staphylococcus aureus infection. Growth is regulated by the growth axis “hypothalamic-pituitary-target organ” [57]. DEGs in both male and female brains and muscles were enriched in the same processes, suggesting that the hypothalamus mainly acts on the target organ of muscle to regulate the growth differences between male and female loaches. It is not surprising that the DEGs in the liver are enriched in immune-related processes, as the liver is an important immune organ [58]. Although gonads can regulate growth, they mainly play a role in reproduction.
The transcriptome integration analysis results of tetraploids and diploids showed that regardless of sex, oxidative phosphorylation was the most significantly enriched in multiple tissues. Genes related to this pathway (such as cox3, nd4, nd4l, cytb, qcr2, and qcr10) were upregulated in tetraploids. In Wistar rats and monkeys, where males have a growth advantage, the levels of oxidative phosphorylation were higher in females than in males [59,60]. Our results showed that oxidative phosphorylation levels were higher in fast-growing individuals, which is contrary to the results in mammals. The level of oxidative phosphorylation reflects the mitochondrial activity [61]. Oxidative phosphorylation provides most of the ATP for animals and plants to maintain homeostasis in life and energy metabolism [62]. Moreover, oxidative phosphorylation is an important form of energy metabolism. This suggests that the difference in growth of tetraploids and diploids is closely related to energy metabolism. Our results indicate that the mechanisms regulating energy metabolism and growth in fish may be different from those in mammals. Studies have shown that estrogen is involved in the regulation of mitochondrial activity in animals, including regulation of mitochondrial biogenesis, oxygen consumption, and energy production [63,64]. Estrogen receptor is the key to the physiological role of estrogen. There are two subtypes of estrogen receptor genes (erα and erβ) in mammals, while three subtypes of estrogen receptor genes (erα, erβ1, and erβ2) in teleost fish [65,66]. Therefore, we speculate that the different estrogen receptor gene types between mammals and fish may result in different ways in which they regulated energy metabolism.
In general, regardless of sexual or polyploidy growth dimorphisms, processes related to growth differences were significantly enriched in pathways related to energy metabolism, including glycolysis/gluconeogenesis, oxidative phosphorylation, hormone synthesis, and fat metabolism. Among them, glycolysis/gluconeogenesis and oxidative phosphorylation pathways were upregulated in fast-growing loach individuals (females, tetraploids), while hormone synthesis and fat metabolism pathways were upregulated in slow-growing loach individuals (males, diploids). Studies have demonstrated that glucose oxidative metabolism reduces the formation of free radicals, while fat metabolism promotes the formation of free radicals [67]. Free radicals play an important role in the entire process of life activities. Thus, it is suggested that the reduction of free radicals weakens the activity of the entire body and provides more energy for growth, while the increase in free radicals accelerates the body’s activities and increases energy consumption, leaving less energy for growth. Further research is needed to be undertaken to explore the molecular mechanisms by which females and males regulate energy metabolism balance and growth in fish.

5. Conclusions

In conclusion, by using comparative transcriptome analysis, we successfully identified the DEGs related to sexual and polyploid growth dimorphisms in M. anguillicaudatus. Based on transcriptome integration analysis, we found that regardless of the comparison of sexes or ploidy, the DEGs were mainly involved in glycolysis/gluconeogenesis, oxidative phosphorylation, steroid hormone biosynthesis, fatty acid degradation, and elongation. Our results suggest that the differences in energy metabolism levels, steroid hormone synthesis, and fatty acid degradation abilities might be important reasons for the sexual and polyploidy dimorphisms in loaches. Specifically, fast-growing loaches (tetraploids, females) have higher levels of energy metabolism and lower steroid hormone synthesis and fatty acid degradation abilities than slow-growing loaches (diploids, males). Our study not only indicates the direction for us to further investigate the molecular mechanisms of sexual and polyploidy growth dimorphisms of loaches, but also provides essential gene information for future functional studies.

Supplementary Materials

The following are available online at https://0-www-mdpi-com.brum.beds.ac.uk/article/10.3390/biology10090935/s1, Table S1: Primers sequences used in qPCR experiments, Table S2: Information and quality of RNA-seq. Table S3: Assembly statistics of the transcriptome data, Table S4: Assembly length distribution, Table S5: Top six enriched GO terms for the DEGs, Table S6: Significantly enriched GO annotations for DEGs between diploid female and male gonads, Table S7: Top six enriched KEGG terms for the DEGs, Table S8: Significantly enriched GO annotations for DEGs between tetraploid female and male gonads, Table S9: KEGG enrichment results of common DEGs in gonads, Figure S1: DNA content of diploid and tetraploid cells of loaches measured by flow cytometry. (A), Paramisgurnus dabryanus, a known diploid, was used as a control. (B), diploid M. anguillicaudatus, which have the same DNA content as the diploid control; (C), tetraploid M. anguillicaudatus, which have doubled DNA content compared with diploids.

Author Contributions

Z.-X.G. and X.-Y.Z. designed and supervised the study. L.-F.L., E.A.B.E.E., Z.-S.X., H.D., and D.-Y.L. performed the sample collection, RNA isolation, and qPCR validation experiments. L.-F.L. performed the data curation and prepared and wrote the original draft. Z.-X.G. and X.-Y.Z. revised the manuscript. All authors have read and agreed to the published version of the manuscript.

Funding

This work was financially supported by the National Key Research and Development Program (grant no. 2018YFD0900205), National Natural Science Foundation of China (grant no. 31872559), and the China Agriculture Research System of MOF and MARA (grant no. CARS-46-08).

Institutional Review Board Statement

Not applicable.

Informed Consent Statement

Not applicable.

Data Availability Statement

All sequencing data have been uploaded to the Sequence Read Archive (SRA) of the National Center for Biotechnology Information (NCBI accession number PRJNA678824).

Conflicts of Interest

The authors declare no conflict of interest.

References

  1. Mei, J.; Gui, J. Genetic basis and biotechnological manipulation of sexual dimorphism and sex determination in fish. Sci. China Life Sci. 2015, 58, 124–136. [Google Scholar] [CrossRef] [Green Version]
  2. Connallon, T.; Knowles, L. Intergenomic conflict revealed by patterns of sex-biased gene expression. Trends Genet. 2005, 21, 495–499. [Google Scholar] [CrossRef] [PubMed]
  3. Rinn, J.; Snyder, M. Sexual dimorphism in mammalian gene expression. Trends Genet. 2005, 21, 298–305. [Google Scholar] [CrossRef]
  4. Ji, X. Artificial Gynogenesis, Genetic Analysis and Differential Expression of Growth-Related Genes in Half-Smooth Tongue Sole; Shandong Agricultural University: Shandong, China, 2009. (In Chinese) [Google Scholar]
  5. Wu, B. Difference of Growth Performance, Digestive Enzyme Activities and Growth Hormone (GH) Expressions between Male and Female Scatophagus argus Linnaeus; Guangdong Ocean University: Guangdong, China, 2013. [Google Scholar]
  6. Cutting, A.; Chue, J.; Smith, C. Just how conserved is vertebrate sex determination? Dev. Dyn. 2013, 242, 380–387. [Google Scholar] [CrossRef]
  7. Wang, B.; Guo, G.; Wang, C.; Lin, Y.; Wang, X.; Zhao, M.; Guo, Y.; He, M.; Zhang, Y.; Pan, L. Survey of the transcriptome of Aspergillus oryzae via massively parallel mRNA sequencing. Nucleic Acids Res. 2010, 38, 5075–5087. [Google Scholar] [CrossRef] [Green Version]
  8. Li, Y.; Wang, G.; Tian, J.; Liu, H.; Yang, H.; Yi, Y.; Wang, J.; Shi, X.; Jiang, F.; Yao, B.; et al. Transcriptome analysis of the silkworm (Bombyx mori) by high-throughput RNA sequencing. PLoS ONE 2012, 7, e43713. [Google Scholar] [CrossRef] [PubMed] [Green Version]
  9. Zhang, Z.; Wang, Y.; Wang, S.; Liu, J.; Warren, W.; Mitreva, M.; Walter, R. Transcriptome analysis of female and male Xiphophorus maculatus Jp 163 A. PLoS ONE 2011, 6, e18379. [Google Scholar] [CrossRef] [PubMed]
  10. Salem, M.; Rexroad, C.; Wang, J.; Thorgaard, G.; Yao, J. Characterization of the rainbow trout transcriptome using Sanger and 454-pyrosequencing approaches. BMC Genom. 2010, 11, 564. [Google Scholar] [CrossRef] [PubMed] [Green Version]
  11. Tao, W.; Yuan, J.; Zhou, L.; Sun, L.; Sun, Y.; Yang, S.; Li, M.; Zeng, S.; Huang, B.; Wang, D. Characterization of gonadal transcriptomes from nile tilapia (Oreochromis niloticus) reveals differentially expressed genes. PLoS ONE 2013, 8, e63604. [Google Scholar] [CrossRef] [Green Version]
  12. Sun, L.; Wang, C.; Huang, L.; Wu, M.; Zuo, Z. Transcriptome analysis of male and female Sebastiscus marmoratus. PLoS ONE 2012, 7, e50676. [Google Scholar] [CrossRef] [PubMed] [Green Version]
  13. Sun, F.; Liu, S.; Gao, X.; Jiang, Y.; Perera, D.; Wang, X.; Li, C.; Sun, L.; Zhang, J.; Kaltenboeck, L.; et al. Male-biased genes in catfish as revealed by RNA-seq analysis of the testis transcriptome. PLoS ONE 2013, 8, e68452. [Google Scholar] [CrossRef] [Green Version]
  14. Ribas, L.; Pardo, B.; Fernandez, C.; Antonio Alvarez-Dios, J.; Gomez-Tato, A.; Isabel Quiroga, M.; Planas, J.; Sitja-Bobadilla, A.; Martinez, P.; Piferrer, F. A combined strategy involving Sanger and 454 pyrosequencing increases genomic resources to aid in the management of reproduction, disease control and genetic selection in the turbot (Scophthalmus maximus). BMC Genom. 2013, 14, 180. [Google Scholar] [CrossRef] [Green Version]
  15. Krysanov, E.; Golubtsov, A. Karyotypes of four fish species from the Nile and Omo-Turkana basins in Ethiopia. J. Ichthyol. 2014, 54, 889–892. [Google Scholar] [CrossRef]
  16. Comber, S.; Smith, C. Polyploidy in fishes: Patterns and processes. Biol. J. Linn. Soc. 2004, 82, 431–442. [Google Scholar] [CrossRef] [Green Version]
  17. Xiao, J.; Zou, T.; Chen, Y.; Chen, L.; Liu, S.; Tao, M.; Zhang, C.; Zhao, R.; Zhou, Y.; Long, Y.; et al. Coexistence of diploid, triploid and tetraploid crucian carp (Carassius auratus) in natural waters. BMC Genet. 2011, 12, 20. [Google Scholar] [CrossRef] [Green Version]
  18. Tao, M.; Liu, S.; Long, Y.; Zeng, C.; Liu, J.; Liu, L.; Zhang, C.; Duan, W.; Liu, Y. The cloning of Dmc1 cDNAs and a comparative study of its expression in different ploidy cyprinid fishes. Sci. China Ser. C Life Sci. 2008, 51, 38–46. [Google Scholar] [CrossRef] [PubMed]
  19. Zhou, H.; Ma, T.Y.; Zhang, R.; Xu, Q.; Shen, F.; Qin, Y.; Xu, W.; Wang, Y.; Li, Y. Analysis of different ploidy and parent-offspring genomic DNA methylation in the loach Misgurnus anguillicaudatus. Int. J. Mol. Sci. 2016, 17, 1299. [Google Scholar] [CrossRef] [Green Version]
  20. Zhong, H.; Yi, Z.; Liu, S.; Tao, M.; Long, Y.; Liu, Z.; Zhang, C.; Duan, W.; Hu, J.; Song, C.; et al. Elevated expressions of GH/IGF axis genes in triploid crucian carp. Gen Comp. Endocr. 2012, 178, 291–300. [Google Scholar] [CrossRef] [PubMed]
  21. Tao, M.; Liu, S.; Zhan, Z.; Chen, J.; Liu, W.; Liu, Y. Molecular cloning and comparative expression patterns of cyp19a1a of gene in different ploidy cyprinid fishes. J. Fish. China 2014, 38, 1201–1210. (In Chinese) [Google Scholar]
  22. Meirmans, P.; Liu, S.; Van Tienderen, P. The Analysis of Polyploid Genetic Data. J. Hered. 2018, 109, 283–296. [Google Scholar] [CrossRef] [PubMed]
  23. Odei, D.; Hagen, O.; Peruzzi, S.; Falk-Petersen, I.; Fernandes, J. Transcriptome sequencing and histology reveal dosage compensation in the liver of triploid pre-smolt Atlantic salmon. Sci. Rep. 2020, 10, 16836. [Google Scholar] [CrossRef] [PubMed]
  24. Zhou, R.; Wu, Y.; Tao, M.; Zhang, C.; Liu, S. MicroRNA profiles reveal female allotetraploid hybrid fertility. BMC Genet. 2015, 16, 119. [Google Scholar] [CrossRef] [Green Version]
  25. Michaeloudes, C.; Kuo, C.; Haji, G.; Finch, D.; Halayko, A.; Kirkham, P.; Chung, K.; Adcock, I. Metabolic re-patterning in COPD airway smooth muscle cells. Eur. Respir. J. 2017, 50, 1700202. [Google Scholar] [CrossRef] [PubMed] [Green Version]
  26. Roosterman, D.; Meyerhof, W.; Cottrell, G. Proton Transport Chains in Glucose Metabolism: Mind the Proton. Front. Neurosci. 2018, 12, 404. [Google Scholar] [CrossRef]
  27. Tixier, V.; Bataillé, L.; Etard, C.; Jagla, T.; Weger, M.; Daponte, J.; Strähle, U.; Dickmeis, T.; Jagla, K. Glycolysis supports embryonic muscle growth by promoting myoblast fusion. Proc. Natl. Acad. Sci. USA 2013, 110, 18982–18987. [Google Scholar] [CrossRef] [PubMed] [Green Version]
  28. Yuan, Q.; Miao, J.; Yang, Q.; Fang, L.; Fang, Y.; Ding, H.; Zhou, Y.; Jiang, L.; Dai, C.; Zen, K.; et al. Role of pyruvate kinase M2-mediated metabolic reprogramming during podocyte differentiation. Cell Death Dis. 2020, 11, 355. [Google Scholar] [CrossRef]
  29. Jiang, D.; LaGory, E.; Kenzelmann Brož, D.; Bieging, K.; Brady, C.; Link, N.; Abrams, J.; Giaccia, A.; Attardi, L. Analysis of p53 transactivation domain mutants reveals Acad11 as a metabolic target important for p53 pro-survival function. Cell Rep. 2015, 10, 1096–1109. [Google Scholar] [CrossRef] [PubMed] [Green Version]
  30. Lin, T.; Wu, S. Reprogramming with Small Molecules instead of Exogenous Transcription Factors. Stem Cells Int. 2015, 794632. [Google Scholar] [CrossRef] [Green Version]
  31. Dong, C.; Yuan, T.; Wu, Y.; Wang, Y.; Fan, T.; Miriyala, S.; Lin, Y.; Yao, J.; Shi, J.; Kang, T.; et al. Loss of FBP1 by Snail-mediated repression provides metabolic advantages in basal-like breast cancer. Cancer Cell 2013, 23, 316–331. [Google Scholar] [CrossRef] [Green Version]
  32. Feng, B.; Yi, S.; Li, R.; Zhou, X. Comparison of age and growth performance of diploid and tetraploid loach Misgurnus anguillicaudatus in the Yangtze River basin, China. Environ. Biol. Fish 2017, 100, 815–828. [Google Scholar] [CrossRef]
  33. Zhong, J.; Yi, S.; Ma, L.; Wang, W. Evolution and phylogeography analysis of diploid and polyploid Misgurnus anguillicaudatus populations across China. Proc. Biol. Sci. 2019, 286, 20190076. [Google Scholar] [CrossRef] [PubMed] [Green Version]
  34. Grabherr, M.; Haas, B.; Yassour, M.; Levin, J.; Thompson, D.; Amit, I.; Adiconis, X.; Fan, L.; Raychowdhury, R.; Zeng, Q.; et al. Full-length transcriptome assembly from RNA-Seq data without a reference genome. Nat. Biotechnol. 2011, 29, 644–652. [Google Scholar] [CrossRef] [Green Version]
  35. Trapnell, C.; Williams, B.; Pertea, G.; Mortazavi, A.; Kwan, G.; van Baren, M.; Salzberg, S.; Wold, B.; Pachter, L. Transcript assembly and quantification by RNA-seq reveals unannotated transcripts and isoform switching during cell differentiation. Nat. Biotechnol. 2010, 28, 511–515. [Google Scholar] [CrossRef] [Green Version]
  36. Love, M.; Huber, W.; Anders, S. Moderated estimation of fold change and dispersion for RNA-seq data with DESeq2. Genome Biol. 2014, 15, 550. [Google Scholar] [CrossRef] [PubMed] [Green Version]
  37. Kanehisa, M.; Araki, M.; Goto, S.; Hattori, M.; Hirakawa, M.; Itoh, M.; Katayama, T.; Kawashima, S.; Okuda, S.; Tokimatsu, T.; et al. KEGG for linking genomes to life and the environment. Nucleic Acids Res. 2008, 36, D480–D484. [Google Scholar] [CrossRef] [PubMed]
  38. Livak, K.; Schmittgen, T. Analysis of Relative Gene Expression Data Using Real-Time Quantitative PCR and the 2−ΔΔCT Method. Methods 2001, 25, 402–408. [Google Scholar] [CrossRef]
  39. Blay, C.; Haffray, P.; Bugeon, J.; D’Ambrosio, J.; Dechamp, N.; Collewet, G.; Enez, F.; Petit, V.; Cousin, X.; Corraze, G.; et al. Genetic parameters and genome-wide association studies of quality traits characterised using imaging technologies in rainbow trout, Oncorhynchus mykiss. Front. Genet. 2021, 12, 639223. [Google Scholar] [CrossRef]
  40. Wang, X.; Li, C.; Xie, Z.; Fan, W.; Zhang, J. Studies on the growth difference of the male and female Siniperca chuatsi. Freshw. Fish. 2006, 36, 34–37. [Google Scholar]
  41. Toguyeni, A.; Fauconneau, B.; Fostier, A.; Abucay, J.; Mair, G.; Baroiller, J. Influence of sexual phenotype and genotype, and sex ratio on growth performances in tilapia, Oreochromis niloticus. Aquaculture 2002, 207, 249–261. [Google Scholar] [CrossRef]
  42. Zhang, J.; Ma, W.; He, Y.; Wu, J.; Dawar, F.; Ren, F.; Zhao, X.; Mei, J. Sex biased expression of ghrelin and GHSR associated with sexual size dimorphism in yellow catfish. Gene 2016, 578, 169–176. [Google Scholar] [CrossRef]
  43. Chatchaiphan, S.; Srisapoome, P.; Kim, J.; Devlin, R.; Na-Nakorn, U. De novo transcriptome characterization and growth-related gene expression profiling of diploid and triploid bighead catfish (Clarias macrocephalus Gunther, 1864). Mar. Biotechnol. 2017, 19, 36–48. [Google Scholar] [CrossRef]
  44. Ma, W.; Wu, J.; Zhang, J.; He, Y.; Gui, J.; Mei, J. Sex differences in the expression of GH/IGF axis genes underlie sexual size dimorphism in the yellow catfish (Pelteobagrus fulvidraco). Sci. China-Life Sci. 2016, 59, 431–433. [Google Scholar] [CrossRef] [PubMed] [Green Version]
  45. Plaxton, W. The organization and regulation of plant glycolysis. Annu. Rev. Plant Physiol. 1996, 47, 185–214. [Google Scholar] [CrossRef] [PubMed] [Green Version]
  46. Montes, L.; Le Roy, N.; Perret, M.; de Buffrenil, V.; Castanet, J.; Cubo, J. Relationships between bone growth rate, body mass and resting metabolic rate in growing amniotes: A phylogenetic approach. Biol. J. Linn. Soc. 2007, 92, 63–76. [Google Scholar] [CrossRef] [Green Version]
  47. Tymchuk, W.; Sakhrani, D.; Devlin, R. Domestication causes large-scale effects on gene expression in rainbow trout: Analysis of muscle, liver and brain transcriptomes. Gen. Comp. Endocrinol. 2009, 164, 175–183. [Google Scholar] [CrossRef] [PubMed]
  48. Danzmann, R.; Kocmarek, A.; Norman, J.; Rexroad, C.; Palti, Y. Transcriptome profiling in fast versus slow-growing rainbow trout across seasonal gradients. BMC Genom. 2016, 17, 60. [Google Scholar] [CrossRef] [Green Version]
  49. Robledo, D.; Rubiolo, J.; Cabaleiro, S.; Martínez, P.; Bouza, C. Differential gene expression and SNP association between fast- and slow-growing turbot (Scophthalmus maximus). Sci. Rep. 2017, 7, 12105. [Google Scholar] [CrossRef] [Green Version]
  50. Ray, P.; Conaghan, J.; Winston, R.; Handyside, A. Increased number of cells and metabolic activity in male human preimplantation embryos following in vitro fertilization. J. Reprod. Fertil. 1995, 104, 165–171. [Google Scholar] [CrossRef] [Green Version]
  51. Tiffin, G.; Rieger, D.; Betteridge, K.; Yadav, B.; King, W. Glucose and glutamine metabolism in pre-attachment cattle embryos in relation to sex and stage of development. J. Reprod. Fertil. 1991, 93, 125–132. [Google Scholar] [CrossRef]
  52. Rieger, D. Relationships between energy metabolism and development of early mammalian embryos. Theriogenology 1992, 37, 75–93. [Google Scholar] [CrossRef]
  53. Sorushanova, A.; Delgado, L.; Wu, Z.; Shologu, N.; Kshirsagar, A.; Raghunath, R.; Mullen, A.; Bayon, Y.; Pandit, A.; Raghunath, M.; et al. The Collagen Suprafamily: From Biosynthesis to Advanced Biomaterial Development. Adv. Mater. 2019, 31, e1801651. [Google Scholar] [CrossRef] [Green Version]
  54. Izu, Y.; Ezura, Y.; Koch, M.; Birk, D.; Noda, M. Collagens VI and XII form complexes mediating osteoblast interactions during osteogenesis. Cell Tissue Res. 2016, 364, 623–635. [Google Scholar] [PubMed] [Green Version]
  55. Wen, Y.; Yang, H.; Wu, J.; Wang, A.; Chen, X.; Hu, S.; Zhang, Y.; Bai, D.; Jin, Z. COL4A2 in the tissue-specific extracellular matrix plays important role on osteogenic differentiation of periodontal ligament stem cells. Theranostics 2019, 9, 4265–4286. [Google Scholar] [CrossRef]
  56. Redecker, T.; Kisko, T.; Schwarting, R.; Wohr, M. Effects of Cacna1c haploinsufficiency on social interaction behavior and 50-kHz ultrasonic vocalizations in adult female rats. Behav. Brain Res. 2019, 367, 35–52. [Google Scholar] [CrossRef] [PubMed]
  57. Chen, J.; Cao, M.; Zhang, A.; Shi, M.; Tao, B.; Li, Y.; Wang, Y.; Zhu, Z.; Trudeau, V.L.; Hu, W. Growth Hormone Overexpression Disrupts Reproductive Status Through Actions on Leptin. Front. Endocrinol. 2018, 9, 131. [Google Scholar] [CrossRef] [Green Version]
  58. Wang, B.; Wangkahart, E.; Secombes, C.J.; Wang, T. Insights into the Evolution of the Suppressors of Cytokine Signaling (SOCS) Gene Family in Vertebrates. Mol. Biol. Evol. 2019, 36, 393–411. [Google Scholar] [CrossRef] [Green Version]
  59. Colom, B.; Oliver, J.; Roca, P.; Garcia-Palmer, F. Caloric restriction and gender modulate cardiac muscle mitochondrial H2O2 production and oxidative damage. Cardiovasc. Res. 2007, 74, 456–465. [Google Scholar] [CrossRef] [Green Version]
  60. Yan, L.; Ge, H.; Li, H.; Lieber, S.; Natividad, F.; Resuello, R.; Kim, S.; Akeju, S.; Sun, A.; Loo, K.; et al. Gender-specific proteomic alterations in glycolytic and mitochondrial pathways in aging monkey hearts. J. Mol. Cell. Cardiol. 2004, 37, 921–929. [Google Scholar] [CrossRef]
  61. Brand, S.; Ebner, K.; Mikoteit, T.; Lejri, I.; Gerber, M.; Beck, J.; Holsboer-Trachsler, E.; Eckert, A. Influence of Regular Physical Activity on Mitochondrial Activity and Symptoms of Burnout-An Interventional Pilot Study. J. Clin. Med. 2020, 9, 667. [Google Scholar] [CrossRef] [PubMed] [Green Version]
  62. Wilson, D. Oxidative phosphorylation: Unique regulatory mechanism and role in metabolic homeostasis. J. Appl. Physiol. 2017, 122, 611–619. [Google Scholar] [CrossRef]
  63. Klinge, C. Estrogenic control of mitochondrial function and biogenesis. J. Cell. Biochem. 2008, 105, 1342–1351. [Google Scholar] [CrossRef] [PubMed] [Green Version]
  64. Palmer, B.; Clegg, D. The sexual dimorphism of obesity. Mol. Cell. Endocrinol. 2015, 402, 113–119. [Google Scholar] [CrossRef] [PubMed] [Green Version]
  65. Meng, X.; Bartholomew, C.; Craft, J. Differential expression of vitellogenin and oestrogen receptor genes in the liver of zebrafish, Danio Rerio. Anal. Bioanal. Chem. 2010, 396, 625–630. [Google Scholar] [CrossRef] [PubMed]
  66. Zhang, Y.; Wang, H.; Qin, F.; Liu, S.; Wu, T.; Li, M.; Xu, P.; Zhang, X.; Wang, X.; Hu, G.; et al. Molecular characterization of estrogen receptor genes in loach Paramisgurnus dabryanus and their expression upon 17 alpha-ethinylestradiol exposure in juveniles. Gen. Comp. Endocr. 2012, 178, 194–205. [Google Scholar] [CrossRef]
  67. Speijer, D.; Manjeri, G.; Szklarczyk, R. How to deal with oxygen radicals stemming from mitochondrial fatty acid oxidation. Philos. Trans. R. Soc. Lond. B Biol. Sci. 2014, 369, 20130446. [Google Scholar] [CrossRef] [Green Version]
Figure 1. Flow chart of transcriptome sequencing analysis.
Biology 10 00935 g001
Figure 2. (A) GO categorization of the unigenes in the transcriptome of M. anguillicaudatus. (B) KEGG assignment of unigenes in the transcriptome of M. anguillicaudatus.
Biology 10 00935 g002
Figure 3. The number of DEGs in four tissues identified in the comparisons of: (A) diploid females and diploid males; (B) tetraploid females and tetraploid males; (C) tetraploid females and diploid females; and (D) tetraploid males and diploid males. The letters B, G, L, and M in the middle of each group represent brain, gonad, liver, and muscle, respectively.
Biology 10 00935 g003
Figure 4. Venn diagram of shared and unique DEGs in brain (A), gonad (B), liver (C), and muscle (D) of four comparison groups. The red box indicates the number of DEGs overlapping among the four comparison groups.
Biology 10 00935 g004
Figure 5. The schematic diagram of key pathways. (A) Steroid hormone biosynthesis. Note: HSD17B3, hydroxysteroid 17-beta dehydrogenase 3; SRD5A1, 3-oxo-5-alpha-steroid 4-dehydrogenase 1; DHEA, dehydroepiandrosterone. (B) Glycolysis. Note: GPI, glucose-6-phosphate isomerase; GAPDH, glyceraldehyde 3-phosphate dehydrogenase; PGK, phosphoglycerate kinase; PGAM, 2,3-bisphosph-oglycerate-dependent phosphoglycerate mutase; ENO, enolase. (C) Oxidative phosphorylation pathway. Note: I, II, III, IV, and V represent different complexes. ND3/4/4L, NADH-ubiquinone oxidoreductase chain 3/4/4L; Cytb/1, ubiquinol-cytochrome c reductase cytochrome b/1; Cox3/4/5, cytochrome c oxidase subunit 3/4/5. The green arrow represents the downregulated, and the dotted arrow represents the intermediate process. The black and red arrow represents the promotor and upregulated DEGs, respectively.
Biology 10 00935 g005
Figure 6. Heat-maps of the key genes related to growth regulation in M. anguillicaudatus. (A) The heat-map of the key genes related to glycolysis in each group. (B) The heat-map of the key genes related to oxidative phosphorylation pathway in each group.
Biology 10 00935 g006
Figure 7. Comparison of the expression profiles of genes involved in the glycolytic pathway. (A) Three estrogen receptor genes (B) and several reported growth-related genes (C) determined by RNA-seq and qPCR in four tissues of female loaches. Each bar represents the expression fold change in a gene compared to that in the male loaches.
Biology 10 00935 g007
Table 1. Growth-related KEGG pathways in each comparison group.
GroupKEGG TermsUpregulated GenesDownregulated GenesCorrected P-Value
D-B-F vs. D-B-MPorphyrin and chlorophyll metabolismE2.3.1.37(5-aminolevulinate synthase) 4.36 × 10⁻²
Glycine, serine and threonine metabolismE2.3.1.37(5-aminolevulinate synthase) 4.36 × 10⁻²
Arachidonic acid metabolismalox5 4.36 × 10⁻²
Protein digestion and absorptioncola1, cola2 8.82 × 10⁻²
Ovarian steroidogenesisalox5 4.36 × 10⁻²
Steroid hormone biosynthesis hsd17b3, srd5a14.36 × 10−2
D-G-F vs. D-G-MCell cyclecdc45, ccne, apc1, orc1, p53, mcm2 4.63 × 10⁻²
Spliceosomecdc5, cype, prp17, prp18, eif4a1 7.83 × 10⁻²
DNA replicationpcna, ssb, RNaseHI, mcm2, mcm4 8.47 × 10⁻²
D-L-F vs. D-L-MTaurine and hypotaurine metabolismcsad 3.39 × 10⁻¹
Arginine and proline metabolismprodh2aoc13.39 × 10−1
D-M-F vs. D-M-MGlycolysis/gluconeogenesisgpi, pgk, pgam, ldh 2.58 × 10⁻⁷
Glucagon signaling pathwaypgam, ldh 9.64 × 10⁻³
Starch and sucrose metabolismgpi 2.30 × 10⁻²
T-B-F vs. T-B-MGlycolysis/gluconeogenesispgk 4.88 × 10⁻¹
Protein digestion and absorptioncol1a, cola2 3.31 × 10⁻¹
Drug metabolism-cytochrome P450fmo 3.54 × 10⁻¹
Taurine and hypotaurine metabolismggt1-5 4.88 × 10⁻¹
Cardiac muscle contraction cacna1c, cacna1d4.94 × 10−1
GnRH signaling pathway cacna1c, cacna1f4.88 × 10−1
Insulin secretion cacna1c4.88 × 10−1
MAPK signaling pathway cacna1a5.77 × 10−1
Calcium signaling pathway cacna1c5.77 × 10-1
T-G-F vs. T-G-MRibosome biogenesis in eukaryotesutp22, utp6, imp3, ck2a, emg1 2.77 × 10⁻¹
Protein processing in endoplasmic reticulumatf6, ire1, eif2ak1, eif2α, ssr1 3.17 × 10⁻¹
T-L-F vs. T-L-MRibosomelp1, lp2, l11e, l23e 4.92 × 10⁻¹¹
Protein processing in endoplasmic reticulumssr1hsp708.01 × 10−2
Glycolysis/gluconeogenesispfka, pgk 2.93 × 10⁻¹
Biosynthesis of unsaturated fatty acids 9-desaturase2.26 × 10−2
Steroid hormone biosynthesis cyp7a1, hsd11b27.18 × 10−2
T-M-F vs. T-M-MTight junction myl6, myl12, myh93.85 × 10−2
DNA replicationrfc3/5 1.98 × 10⁻¹
Linoleic acid metabolismcyp2j 1.98 × 10⁻¹
Fatty acid degradation cpt12.16 × 10−1
T-B-F vs. D-B-FOxidative phosphorylationcox3, cox5b, cytb, nd3, nd4cox1, atpef0a1.04 × 10−4
Cell cyclepcna, cyca, cycb, apc/c 4.07 × 10⁻¹
PI3K-Akt signaling pathwaycreb, akt, pp2a, rasitga, pkc, bim7.58 × 10−1
PPAR signaling pathwaylpl, acs, scp 8.70 × 10⁻¹
Protein digestion and absorptionslc15a1, mme 1.20 × 10⁻¹
Regulation of actin cytoskeletonactb-g1, myl2, myl5egfr, fgfr2, fgfr39.99 × 10−1
Drug metabolism-cytochrome P450mao, ugt, gst 6.32 × 10⁻¹
GnRH signaling pathwayslc5a6, rft2cubn, abcc19.99 × 10−1
Estrogen signaling pathwaygper, mmp, creb1 7.58× 10⁻¹
Fatty acid degradation mecr, fada, acaa29.99 × 10−1
Fatty acid elongation elovl1, mecr, acaa2, ter8.70 × 10−1
Cardiac muscle contractionmyh6/7, myl2, myl3, atp1a, atp1b 3.82 × 10⁻¹
T-G-F vs. D-G-FOxidative phosphorylationcox3, nd4, nd4l, cytbcox1, sdhb6.35 × 10−1
Arachidonic acid metabolismprxl2b, cbr1, cbr2, ptgds, cyp4f, alox12 6.35 × 10⁻¹
p53 signaling pathwayigf, tsp, mdm2, cyclinb, casp8, perp 6.35 × 10⁻¹
Ascorbate and aldarate metabolism 6.35 × 10⁻¹
T-L-F vs. D-L-FOxidative phosphorylationcox3, nd4, nd4l, cytbcox11.77 × 10−6
Mineral absorptionzip4, atpase 1.04 × 10⁻⁵
Vitamin digestion and absorptionapob-48, lrat, rft2 1.64 × 10⁻⁴
T-M-F vs. D-M-FTight junctionactinmyl6, myl1, myh95.02 × 10−5
Cardiac muscle contractionactin, tpm1 4.64 × 10⁻¹³
Oxidative phosphorylationcox3, nd4, nd4l, cytb, qcr2, qcr10cox11.00 × 10−9
Protein digestion and absorptionslc8a, mmeslc3a26.82 × 10−5
T-B-M vs. D-B-MOxidative phosphorylationcox3, cox5, cytb, nd3, nd4cox1, atpef0a2.30 × 10−2
Glutathione metabolismgpx, anpep, rrm1gpx4, ggct1.45 × 10−2
Steroid hormone biosynthesis cyp11b1, cyp11b2, srd5a11.88 × 10−1
T-G-M vs. D-G-MCell cyclecdc45, ccne, apc1, orc1, p53, mcm2 3.50 × 10⁻⁶
DNA replicationpcna, mcm2, mcm4 4.25 × 10⁻⁷
Regulation of actin cytoskeletoniqgap, fak, rho, pak1, f-actin, drf3 1.04 × 10⁻¹
T-L-M vs. D-L-MMineral absorptionmt, fpn1hmox, znt11.51 × 10−3
Cardiac muscle contractionoplah, gpx, ggtggct, g6pd5.45 × 10−1
Steroid hormone biosynthesis cyp2r1, cyp51, dwf, fdft11.18 × 10−6
Fat digestion and absorptionabca1, apoa, dgat 2.44 × 10⁻³
Oxidative phosphorylationcox3, cox5, cytb, nd3, nd4 1.40 × 10⁻²
Glycolysis/gluconeogenesisfbp, tpi, eno, adh1, g6pc 1.93 × 10⁻¹
T-M-M vs. D-M-MGlycolysis/gluconeogenesisgpi, pgk, pgam, ldh, tpi 6.20 × 10⁻⁷
Tight junctionactin, lgl1claudin, pp2a, myl21.00 × 10−9
Cardiac muscle contractionactin, tpm, atptnt, tnc7.34 × 10−14
Oxidative phosphorylationcox3, nd4, nd4l, cytb, qcr2, qcr10cox17.34 × 10−14
Note: brain, gonad, liver, and muscle samples from diploid females were compared with those from diploid males, abbreviated as D-B-F vs. D-B-M, D-G-F vs. D-G-M, D-L-F vs. D-L-M, and D-M-F vs. D-M-M, respectively, and T-B-F vs. T-B-M, T-G-F vs. T-G-M, T-L-F vs. T-L-M, and T-M-F vs. T-M-M represent the comparisons of those samples between females and males in tetraploids. T-B-F vs. D-B-F, T-G-F vs. D-G-F, T-L-F vs. D-L-F, and T-M-F vs. D-M-F represent the comparison of brain, gonad, liver, and muscle samples of tetraploid and diploid females, respectively, and T-B-M vs. D-B-M, T-G-M vs. D-G-M, T-L-M vs. D-L-M, and T-M-M vs. D-M-M represent comparisons between tetraploid and diploid males.
Publisher’s Note: MDPI stays neutral with regard to jurisdictional claims in published maps and institutional affiliations.

