
In Situ Technological Innovation Diffusion Rate Accuracy Assessment


1
Edward E. Whitacre Jr. College of Engineering, Texas Tech University, Lubbock, TX 79409, USA
2
School of Engineering and Sciences, Tecnológico de Monterrey, Monterrey 64849, Mexico
*
Author to whom correspondence should be addressed.
Systems 2022, 10(2), 25; https://0-doi-org.brum.beds.ac.uk/10.3390/systems10020025
Submission received: 11 January 2022
/
Revised: 7 February 2022
/
Accepted: 19 February 2022
/
Published: 25 February 2022
Abstract
:At present, the accuracy of diffusion rate forecasting, at a macro-level, in the research literature, is nonexistent. This research reveals underlying macro-level trends of diffusion rate assessment using historical technological innovation diffusion data to explore the statistical characteristics of diffusion rate percent-error of the Bass and logistic model time stepped through its lifecycle. A quantitative exploratory data analysis (EDA) based approach was employed to uncover underlying macro-perspective patterns and insights on a technological innovation’s forecasted diffusion rate percent-error using the data of 42 matured U.S. consumer technological innovations. An objective of this effort is to determine the statistical characteristics (mean, median, variance, standard deviation, skewness, and kurtosis) of diffusion rate assessment using the Bass and logistic model at various points in a technological innovation’s lifecycle to reveal underlying directional and associative insights. Specifically, this effort explores the development of macro-perspective knowledge on quantifying the forecasting accuracy of a technological innovation’s diffusion rate using partial diffusion data. Developing such insights and a framework for accessing in situ (real-time) a technological innovation’s diffusion rate percent-error would benefit an organization’s decision makers in maximizing gains and minimizing losses. These insights include identifying whether the Bass and logistic models are more likely to overestimate or underestimate a technological innovation’s diffusion rate when assessed at various points in its diffusion lifecycle. Practitioners can use such information to set resource investment strategies and policies based on risk tolerance and the utility of the weighted outcomes via decision theory tools.
1. Introduction
There exists a healthy foundation of research knowledge on technological innovation and technology adoption in engineering management, but the area of the abandonment of technological innovation is far less developed and poses a common problem for decision makers [1,2]. Without knowledge and information, decision makers’ management and decision making of any kind are no more than guesswork [3]. This research effort is the third in a series, addressing the development of macro-level intelligence to aid resource decision makers in developing informed, proactive decisions on when to abandon a technological innovation. The first exploration in this series [4] examined the boundaries and likelihoods of the diffusion rates of technological innovations. The second endeavor [5] explored the impact of three factors on abandonment optimization, notably a technological innovation’s diffusion rate, a technological innovation’s probability of achieving a given diffusion rate, and the point of abandonment. Building from these efforts, a primary factor identified for abandonment optimization assessment is a technological innovation’s diffusion rate. Accordingly, knowledge on diffusion rate assessment accuracy is of value to decision makers.
What is this research effort trying to do? Diffusion rate assessment models (such as the Bass and logistic models) are commonly used to estimate technological innovation diffusion rates [6,7,8,9,10,11,12]. Decision makers accomplish this assessment by fitting the models to the observed diffusion data of a particular technological innovation. However, the error of diffusion rate estimates using such tools is largely unexplored at various points (time stepped) in a technological innovation’s lifecycle. As such, this research explores and identifies underlying macro-level trends of diffusion rate assessment, via percent-error examination, using the data of 42 matured technological innovations. This exploration includes identifying whether the Bass and logistic models are more likely to overestimate or underestimate a technological innovation’s diffusion rate when assessed at various points in its diffusion lifecycle. Such insights into the underlying macro-level trends of diffusion rate assessment directly benefit decision makers in proactively setting strategy, policy, and resource management.
How is it performed today? The accuracy of diffusion rate assessment, at a macro-level, in the research literature, is at present nonexistent. Traditionally, diffusion rate extraction and assessment have been accomplished by using resource-intensive micro-based investigations of factors affecting its diffusion [4,13]. Additionally, existing innovation abandonment assessment research concentrates on the micro-perspective evaluation (reactive external causes) of innovation and technology abandonment, termed triggers in the innovation and technology abandonment literature [1,14]. However, the inherent complexity and narrow focus of micro-perspective assessment tools can affect an organization’s use of time and other resources. Although helpful, these and other micro-based bodies of research on abandonment leave a knowledge gap in the assessment of abandonment, specifically at the macro-level.
What is the research gap? At present, there is no direct research addressing technological innovation abandonment assessment toward optimization from a macro-perspective. The development of such macro-based perspective knowledge is foundational for the creation of general system-level rules and guidelines. This research aims to support the development of such macro-based perspective knowledge to provide decision makers with general system-level intelligence toward assessing technological innovation abandonment. Specifically, this effort explores quantifying the forecasting accuracy of a technological innovation’s diffusion rate using partial diffusion data.
The development of insights and a framework for accessing in situ (real-time) a technological innovation’s diffusion rate percent-error would benefit an organization’s decision makers in assessing when to abandon a technological innovation. Such assessment would aid in maximizing gains and minimizing losses. For example, inaccurate abandonment assessment resulting in prematurely abandoning a technological innovation could result in losses (e.g., lost revenue); conversely, delaying abandonment could also result in losses (e.g., missed opportunity). For instance, if a decision maker determines that an incumbent technological innovation has captured 50% of its estimated maximum market (carry capacity), accuracy insights into the diffusion rate estimates at that point in its lifecycle would provide actionable intelligence toward a decision maker’s abandonment optimization efforts. As an illustrative embodiment, actionable intelligence is gained if a decision maker has macro-insights that a technological innovation diffusion rate is likely to have up to a +20% percent-error when assessed at the 50% point of its diffusion lifecycle. Currently, no such actionable macro-level intelligence on diffusion rate accuracy assessment exists in the research literature.
What is this research’s contribution to the field? The knowledge gained from this effort adds value to a decision maker’s ability to exercise systems thinking toward abandonment optimization. Two hierarchic components of systems thinking are identifying and recognizing trends and patterns and the generalization of complex situations and interrelationships [15,16,17]. The macro-perspective examination of diffusion rate assessment can provide decision makers with general rules (directional and associative patterns and trends) toward adding to the intelligence necessary for optimizing abandonment. Consequently, enabling decision makers to speed decision making and reduce complexity (reducing cognitive demand). At present, no contemporary research has focused on the macro-level characterization of the accuracy of diffusion rate extraction, time stepped through a technological innovation’s lifecycle. Building and developing such guidelines will aid resource decision makers as they consider proactive decisions and strategies to assess a technological innovation’s diffusion rate, a key factor in when to abandon a technological innovation.
Resource constraints limit the quantity and quality of information, including diffusion rate assessment, to decision makers. Actionable information can be attained from macro- and micro-based examinations; however, macro-based information generally requires less effort to understand, acquire, and interpret by decision makers. As a result, underlying directional and associative patterns (macro-perspective knowledge) of a decision area, such as those developed herein, are valuable tools for preventing a decision maker from just making a random guess.
Knowledge of diffusion rate assessment accuracy can enhance how decision makers consider and decide when to abandon a technological innovation. As an applicable example, if an incumbent technological innovation’s assessed diffusion rate accuracy boundaries are understood, a decision maker can better optimize abandonment decisions based on their risk level and the decision’s impact. Consequently, a potential implication of the knowledge gained herein is its application to a decision theory such as expected utility, which considers a decision maker’s risk tolerance and the perceived weighted utility of each possible decision outcome toward identifying an optimized decision. The revealed macro-level knowledge developed herein supports decision makers in making informed and proactive decisions toward achieving and assessing abandonment optimization.
The research area of macro-examination of technological innovation diffusion rate and abandonment assessment has no direct research or models that directly address the topic of interest. For this reason, this effort will use an exploratory data analysis (EDA) approach to uncover macro-perspective patterns and insights on a technological innovation’s forecasted diffusion rate percent-error. EDA is a starting point for scientific research, especially when there is limited scholarly work in a research area [18,19,20]. It provides a means to summarize and characterize data patterns and trends. Accordingly, EDA supports the development of new hypotheses, new model formation, new data collection, and new paths to advance a research area [20,21,22]. In addition, EDA mitigates the danger of blind confirmatory statistics [23]. Specifically, this research addresses and expands the following research question, reveals data patterns in the process, and generates a new exploratory hypothesis for future research.
Research Question: What are the statistical characteristics (mean, median, variance, standard deviation, skewness, and kurtosis) of diffusion rate percent-errors at various points in a technological innovation’s lifecycle?
2. Background
As mentioned in the introduction, this research endeavor is the third in a series addressing the exploration and development of macro-based knowledge to allow decision makers to make informed, proactive decisions on when to abandon a technological innovation. To avoid background redundancy, with the previous two efforts in this series, as they share a foundational explorational goal, only new background information concerning the focus of this effort is presented herein. As a review, the first research exploration in the series [4] contributed to the macro-level understanding of the boundaries and likelihood of achieving a range of technological innovation diffusion rates. These contributions included the determination that the frequency of diffusion rates is positively skewed when ordered from slowest to fastest and the identification and ranking of probability density functions that best represent the rates of technological innovation diffusion. The second endeavor [5] explored directional and associative patterns (macro-level knowledge) of three factors’ impact on abandonment optimization, notably a technological innovation’s diffusion rate, a technological innovation’s probability of achieving a given diffusion rate, and the point of abandonment. Consequently, to gain a deeper background on the macro-based examination of technological innovation abandonment, review of the first two explorations is recommended.
There is a healthy body of knowledge on technological innovation adoption in the research literature. However, the field of technological innovation abandonment is significantly less developed and poses a blind spot for practitioners [1,2]. The current innovation abandonment assessment research concentrates on the micro-perspective evaluation (reactive external causes) of innovation and technology abandonment, termed triggers in the innovation and technology abandonment literature [1,14]. One possible explanation for this blind spot is that many organizations view abandonment as a reactive lifecycle event (i.e., obsolescence), waiting and allowing a new innovation or technology to displace an older innovation or technology [24]. Conversely, technological innovation abandonment optimization assessment, when an innovation is purposefully abandoned (“phased-out”) to shift resources to new investment areas, is a proactive occurrence. In a proactive organizational environment, an organization has a higher potential to maximize profits/growth and minimize losses by managing its limited resources, for proactive organizations have a higher potential to surpass reactive organizations [25,26,27,28]. As mentioned in the introduction, although useful, the characteristic complexity and restrictive focalization of micro-based assessment tools leave a gap in the simplification and proactive assessment of abandonment.
2.1. Micro vs. Macro
Present-day forecasting tools are traditionally used to judge whether a technological innovation is worthy of adopting, but are not commonly used to signal when it should be abandoned [13]. Such forecasting tools commonly require resource-intensive micro-level examinations of factors affecting a technological innovation’s diffusion rate and, by definition, are narrowly focused on a specific technological innovation. As a result, these micro-based factors can be time consuming and challenging to develop, measure, and track accurately or at all. The inherent complexity of micro-based forecasting tools is a major drawback for decision makers, as it has been shown that as task complexity goes up, cognitive demand goes up, and as cognitive demand goes up, a decision maker is increasingly likely to justify not using a complex decision-making tool, especially when time is a factor [29,30]. As a simplified analogy used in this exploration series, it is easy to determine whether a cup of coffee is hot (macro-level), but it requires more effort to determine its exact temperature (micro-level). In practice, it requires significant effort to determine micro-based factors to gauge the diffusion rate of a technological innovation [31].
The current innovation abandonment assessment research concentrates on the micro-perspective evaluation (reactive external causes) of innovation and technology abandonment, termed triggers in the innovation and technology abandonment literature [1,14]. The inherent complexity and narrow focus of micro-perspective assessment tools can affect an organization’s use of time and other resources. Although useful, these and other micro-based bodies of research on abandonment leave a gap in the simplification and proactive assessment of abandonment. As such, the primary focus of this effort is the development of a framework for examining (patterns and trends) the forecasting accuracy of a technological innovation’s diffusion rate using partial diffusion data. The underlying usefulness of any tool used by decision makers is for it to be simple, easy to interpret, and low cost to implement.
2.2. Diffusion Model
In this effort to study the assessment of diffusion, empirical research has shown and supported that technological innovation diffusion characteristically follows an S-curve [9,32,33,34,35,36,37]. Frequently used S-curve models for innovation diffusion are the logistic and Bass models [6,7,8,9]. Multiple research efforts have compared and contrasted the logistic and Bass diffusion models (as well as other diffusion models) to ascertain which of these models best represents the real world and under what conditions; these include, but are not limited to, Grubler [38], Meade and Islam [39], Kim, et al. [40], Kim and Kim [41], Botelho and Pinto [42], and Adamuthe and Thampi [9]. Principally, selecting the best model for technological innovation diffusion depends on multiple conditions, and both the logistic and Bass models have been accepted to be suitable for the extraction of macro-level trends and patterns [43,44]. Although informative, a comparison of these models’ micro-accuracy is not essential to this endeavor, for one must remember that, at their best, models are informative but not exact. Therefore, the Bass and logistic models were selected for this research effort as they are two of the most frequently used models representing the diffusion of technological innovation [6,7,8,9].
2.3. Logistic Model
The logistic model (logistic law of growth) is the most frequently used formulation for the S-curve. The model adopts that systems under study grow exponentially until an upper limit (known as the system’s carrying capacity) is achieved, at which point the growth rate slows until saturation is reached, resulting in a characteristic S-shaped curve [45]. The logistic model growth curve and the term S-curve are often used interchangeably as synonyms in diffusion research [46]. The S-curve provides a visual representation of a system’s discrete distribution of diffusion growth. Conversely, the bell curve is commonly used to embody the growth rate of a system within a period of time. The cumulative number of data in a bell curve (at any given point in time) follows an S-curve pattern, representing cumulative growth [47]. The mathematical expression of the logistic model, used for innovation and technology growth, is represented by Equation (1) [45].
where the constant is known as the carrying capacity and represents the limit to growth by the potential market size or the maximum number of potential adopters (also known as the maximum diffusion ceiling), is the relative growth rate coefficient representing the speed or rate of diffusion (also known as the diffusion rate constant), is an initial condition constant representing initial penetration, and represents the time of the estimation (also known as the time-variable).
2.4. Bass Model
Frank Bass developed the Bass model in 1969 to forecast the diffusion of consumer durables goods and is based on concepts developed in Everett Rogers’ book, Diffusion of Innovation, first published in 1962. The model presents an explanation of how current and potential adopters of a new product respond over time. This interaction is demonstrated in the Bass model by introducing two coefficients representing the characteristics of current and potential adopters. The mathematical representation of the Bass model is shown in Equation (2).
where the constant is known as the carrying capacity and represents the limit to growth (also known as the maximum diffusion ceiling or the maximum number of potential adopters), p is the coefficient of innovation representing the probability that a consumer will adopt, q is the coefficient of imitation representing the probability of potential adopters, and represents the time of the estimation (also known as the time-variable).
3. Research Methodology
A quantitative EDA approach was selected and executed in four steps to address this endeavor’s research question. EDA is a statistical data analysis approach that supports the development of new hypotheses, new model formation, new data collection, and new paths to advance a research area [20,21,22]. Unlike Confirmatory Data Analysis (CDA) approaches, EDA is disposed toward answering questions such as what does the data tell the researcher about relationships for the generation of new hypotheses [48]. As such, EDA is a starting point for scientific research, especially when there is limited scholarly work in a research area, as is this case with the macro-examination of technological innovation diffusion rate and abandonment assessment. Thus, the use of EDA opens the opportunity to create new knowledge that can be utilized in future explorations and mitigates the danger of blind confirmatory statistics [23].
This effort leverages the framework outline in Parvin and Beruvides’ [49] pilot examination of diffusion rate forecasting. In the first step, technological innovation diffusion data used for this effort were identified and collected. The second step details the bounds for simulating in situ diffusion rate data (lifecycle diffusion percentages time stepped relative to full-scale). Next, in step three, the Bass and logistic models are fitted to the simulated in situ data and their resultant diffusion rates extracted. In the final step (step four), the percent-errors statistical characteristics were extracted from the data and examined for macro-level trends and patterns.
3.1. Step 1: Data Collection
The work reported here leverages previously gathered and validated diffusion data of matured technological innovations, spanning from the early 1900s to the early 2010s, collected in Parvin and Beruvides’ [4] research examining the macro-patterns and trends of U.S. consumer technological innovation diffusion rates. As a whole, technological innovation diffusion data is often difficult to attain because it often resides within private organizations’ sales and marketing data, much of which is not published or is considered proprietary. The collected data consist of annual market diffusion percentages of 42 matured technological innovations over their recorded lifecycle. It should be noted that the data used in this effort focus on U.S. consumer technological innovations only, and research has demonstrated that technological innovation diffusion can be affected by market region [50]. A reference list of the technological innovation data collected (used in this effort) and the full details on the data and their sources can be found in Parvin and Beruvides [4].
3.2. Step 2: Data Diffusion Step Bounds
In order to simulate in situ diffusion rate data (lifecycle diffusion percentages relative to full-scale), predefined stepped percentages of a technological innovation’s total lifecycle were defined. Through stochastic simulations, Parvin and Beruvides [5] macro-level exploration on optimizing technological innovation abandonment revealed that 61 to 95% of full-scale lifecycle maturation encompassed the optimal diffusion abandonment point range. Leveraging this diffusion range information, a conservative predefined lifecycle percentage range of 50 to 100% of the full-scale diffusion lifecycle maturation in stepped increments of 10% was used for this endeavor. As a conceptual execution illustration, if technological innovation X has a fully matured carrying capacity of 89%, then 50% of full-scale would mean that the adjusted dataset would have a carrying capacity of 44.5%. To simulate in situ forecasting at 50% of full-scale maturity, the technological innovations diffusion data above 44.5% would be ignored.
3.3. Step 3: Diffusion Model Fit and Diffusion Rate Extraction
Step 3 validated the Bass and logistic model to the collected technological innovation diffusion data and extracted each model’s maximum diffusion rates for technological innovations in the collected dataset. Each forecasting model was first fitted to each technological innovation’s diffusion data in the collected dataset using Microsoft Excel Solver. The model fit was accomplished by minimizing the root mean square error (RMSE), a widely used criterion for model fit analysis [51,52], of the collected data using the Generalized Reduced Gradient (GRG) nonlinear solver algorithm. While there is no unified standard for an acceptable RMSE range, as a generally accepted guide, the lower the value, the better the model fit [53]. The resulting model fit was accepted in this effort if the RMSE value was less than three standard deviations, a common technique for outlier identification [54].
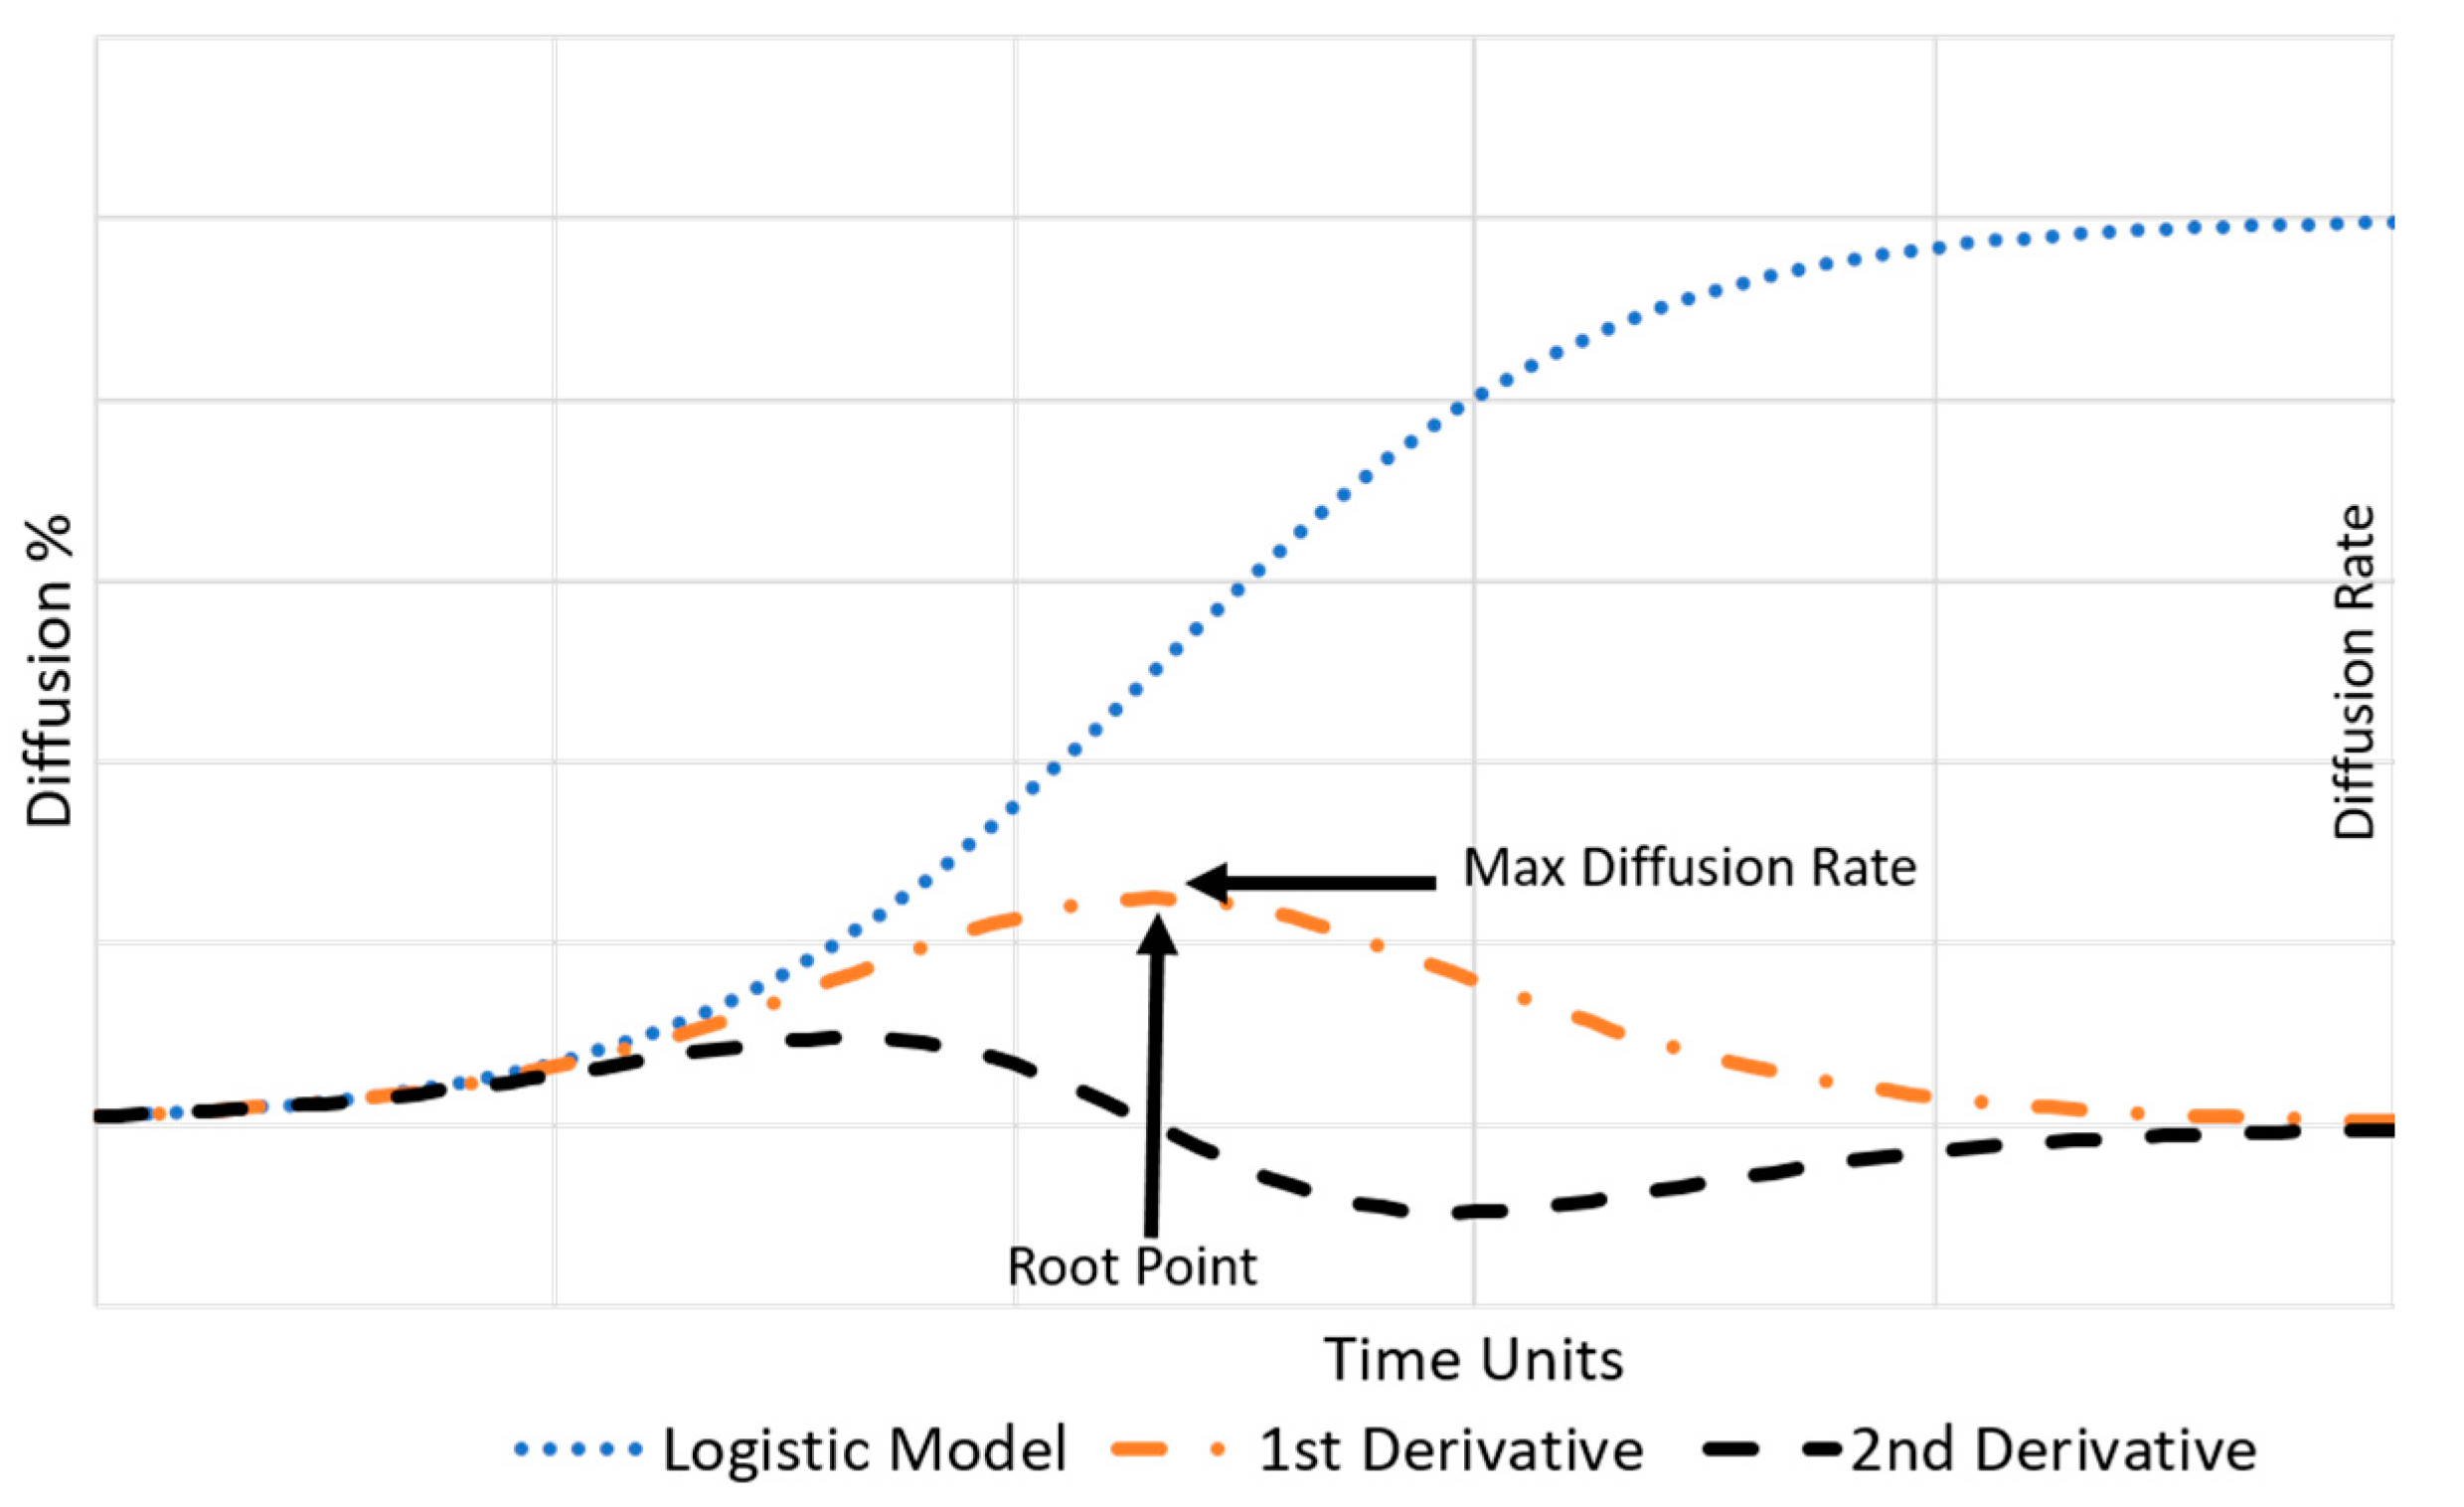
To ascertain the maximum diffusion rates of the technological innovation data collected, first, each dataset was fitted to each model under study. The maximum diffusion rate for each technological innovation dataset was then extracted via math-based analysis. The first derivative of the fitted base function gives the diffusion rate at any point in the curve as the slope of the resultant tangent line. Moreover, the second derivative yields the rate of change of the diffusion rate at any instant on the curve. Consequently, each fitted model’s maximum diffusion rate was extracted by determining the root point of the model’s second derivative, representing when a technological innovation’s diffusion rate has peaked, as graphically illustrated in Figure 1. The derivatives of the logistic model and Bass model are presented in Table 1 and Table 2, respectively, for reference.
3.4. Step 4: Percent-Error and Its Statistical Characteristics
In the final step, the percent-errors statistical characteristics of the assessed maximum diffusion rate were extracted from each fitted diffusion models dataset over each predefined lifecycle percentage range (identified in Step 2). By definition, percent-error is the difference between the estimated and the true values compared to the true value and is expressed as a percentage. Thus, the percent-error for this effort is the difference between the forecasted maximum diffusion rate at the predefined percentage and the maximum diffusion rate at full maturation compared to the maximum diffusion rate at full maturation, expressed as a percentage, as shown mathematically in Equation (3).
This exploratory effort identified the descriptive statistics for each percent-error distribution (as defined above) across the predefined lifecycle stepped percentage range. The percent-error distribution descriptive statistics included its central tendency (including the mean and median) and its spread (including the range and quartiles of the dataset and measures of dispersion such as the variance and standard deviation). In addition, shape indices such as skewness and kurtosis for each distribution were also examined. As part of the EDA, these descriptive characteristics were depicted graphically to help visualize and identify underlying macro-level patterns and trends for each predefined lifecycle percentage range. Scatter plots, box plots, and histograms were utilized for they are effective EDA graphical techniques for examining data patterns and trends [55,56,57,58,59].
4. Results
4.1. Diffusion Model Fit and Diffusion Rate Extraction Results
This effort used an RMSE analysis to validate if the logistic and Bass model fits were acceptable to represent each technological innovation diffusion dataset at full maturation. The subsequent RMSE descriptive statistics for each model are shown in Table 3 and Table 4, respectively, for reference. As noted previously, if the fitted technological innovation’s maximum RMSE value was less than three standard deviations from its mean value, the model fit was accepted. The maximum RSME values of the dataset were 1.086 and 1.011 for the logistic and Bass models, respectively, as shown in Table 3 and Table 4. As a result, each model’s maximum RMSE values fell within the established acceptance criteria of less than three standard deviations from their mean value and was accepted for inclusion in this exploration, thus resulting in the acceptance of 42 matured technological innovations for this research analysis.
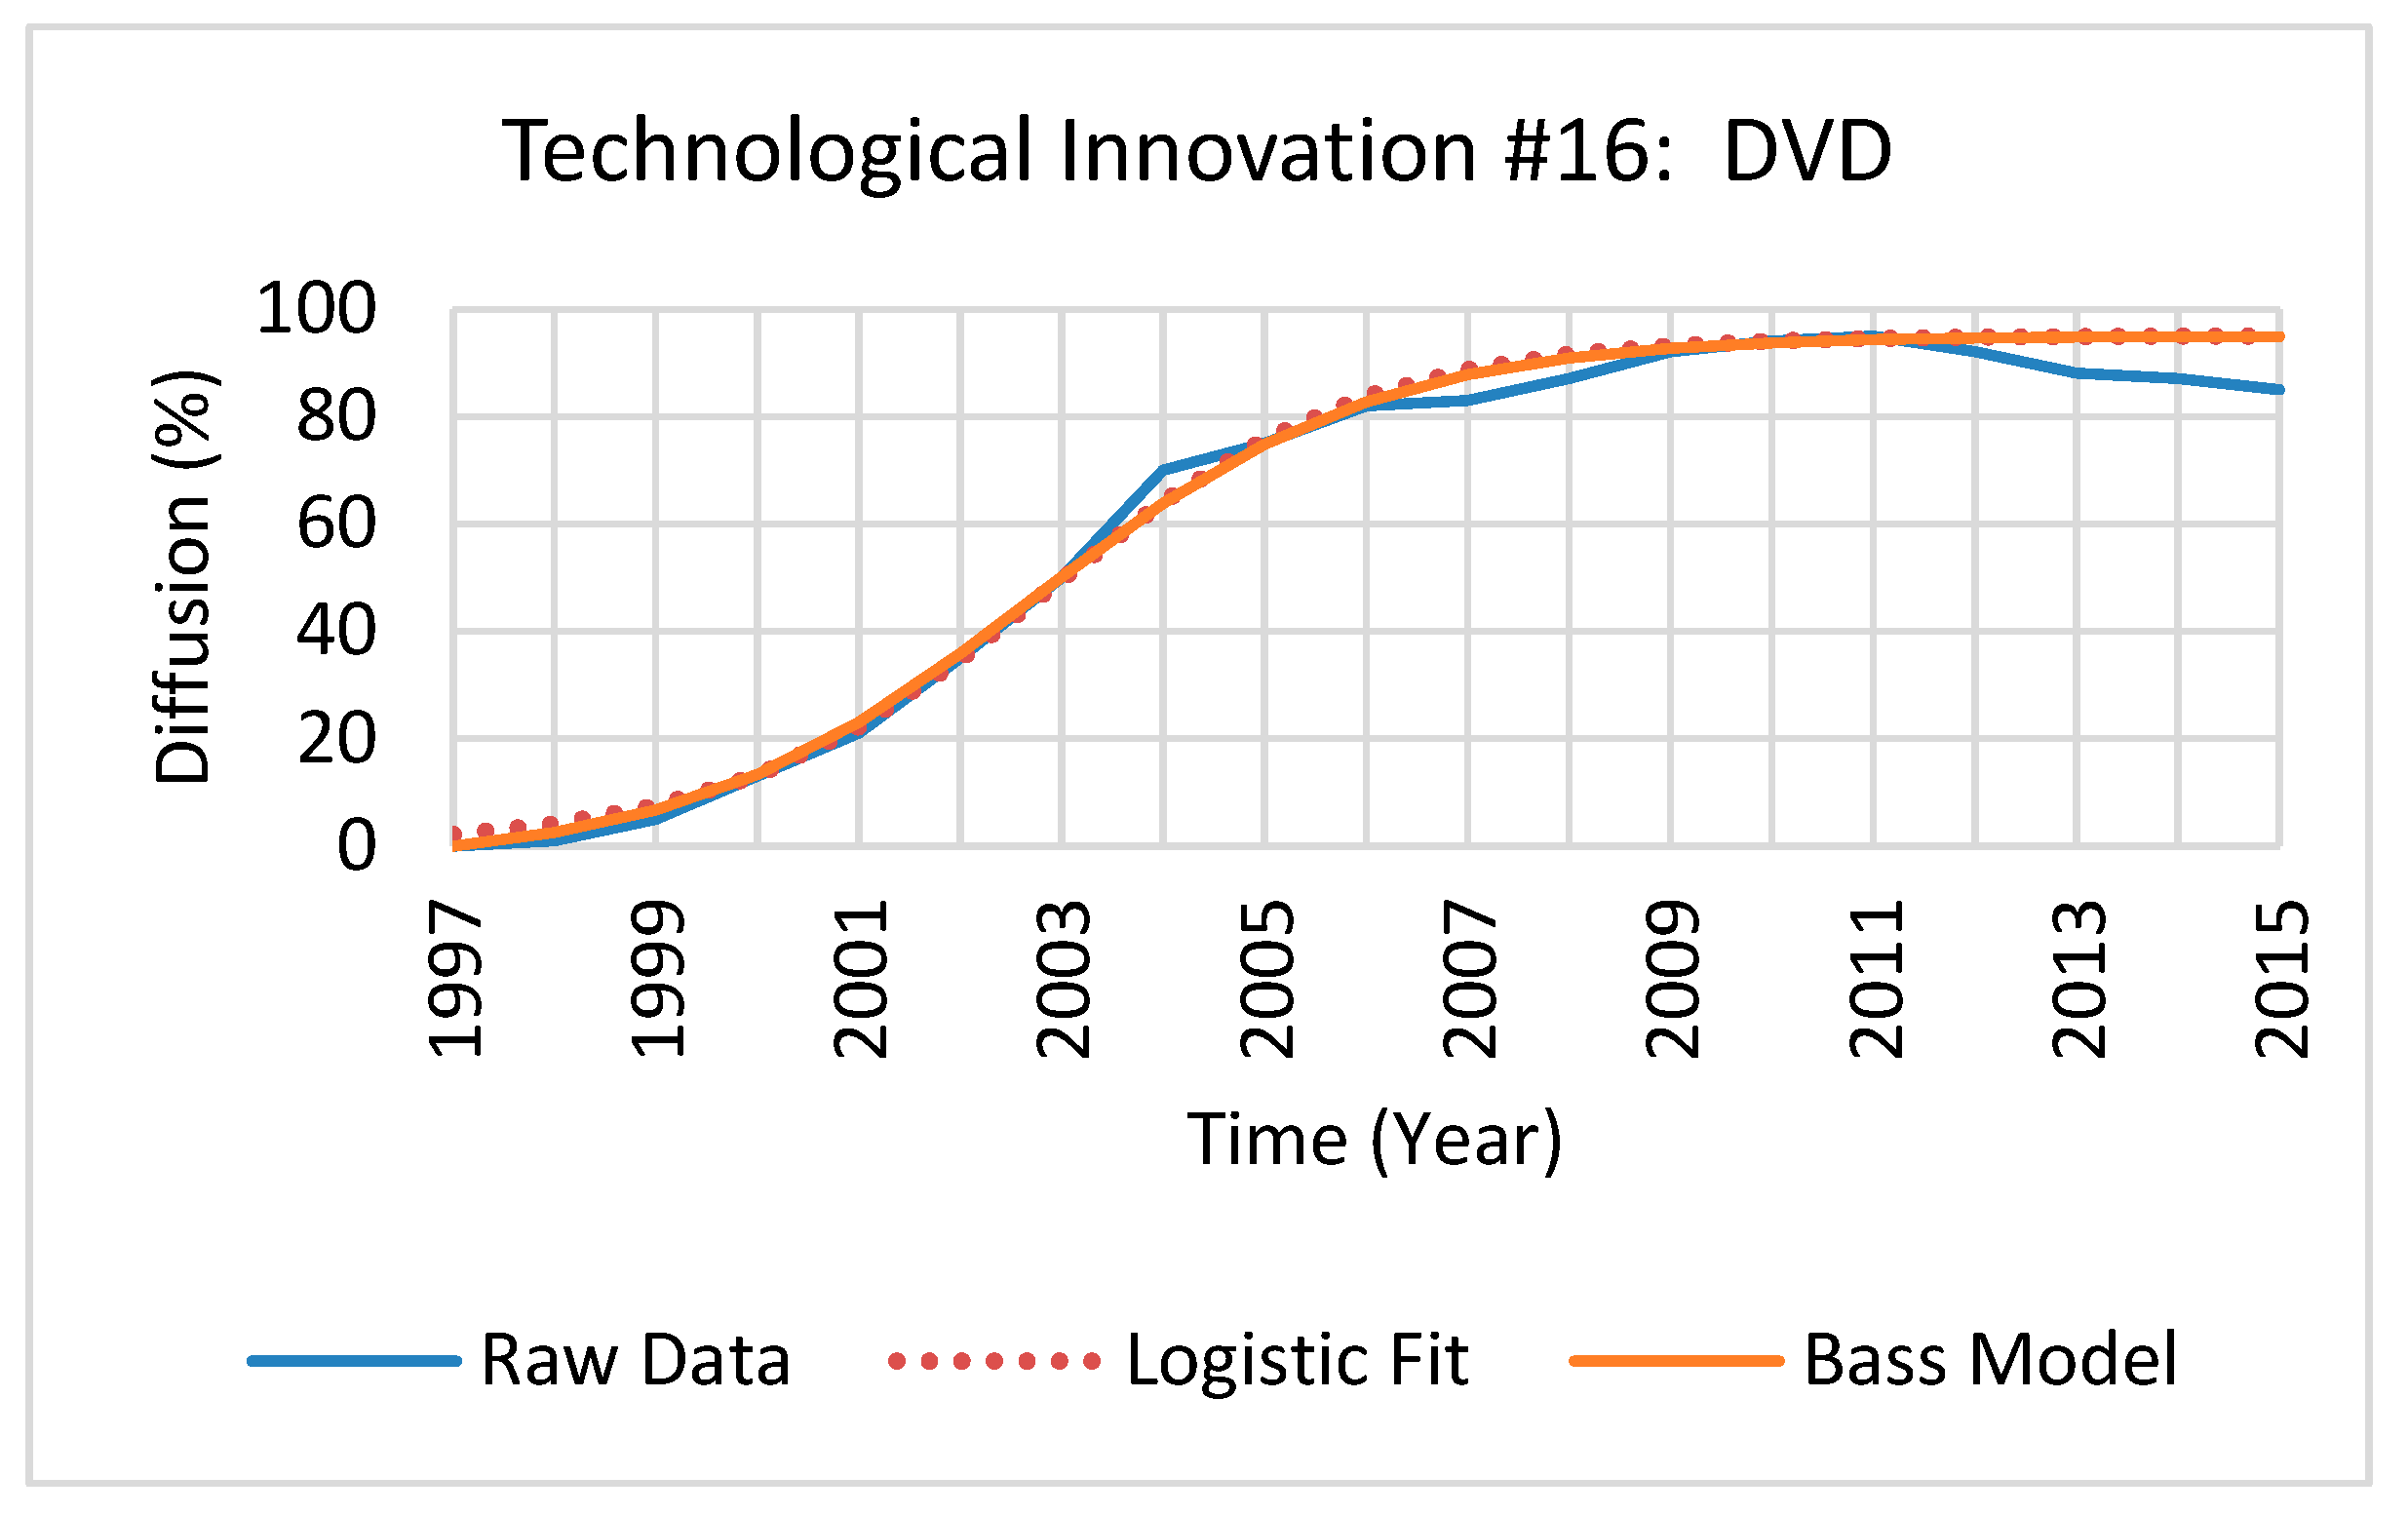
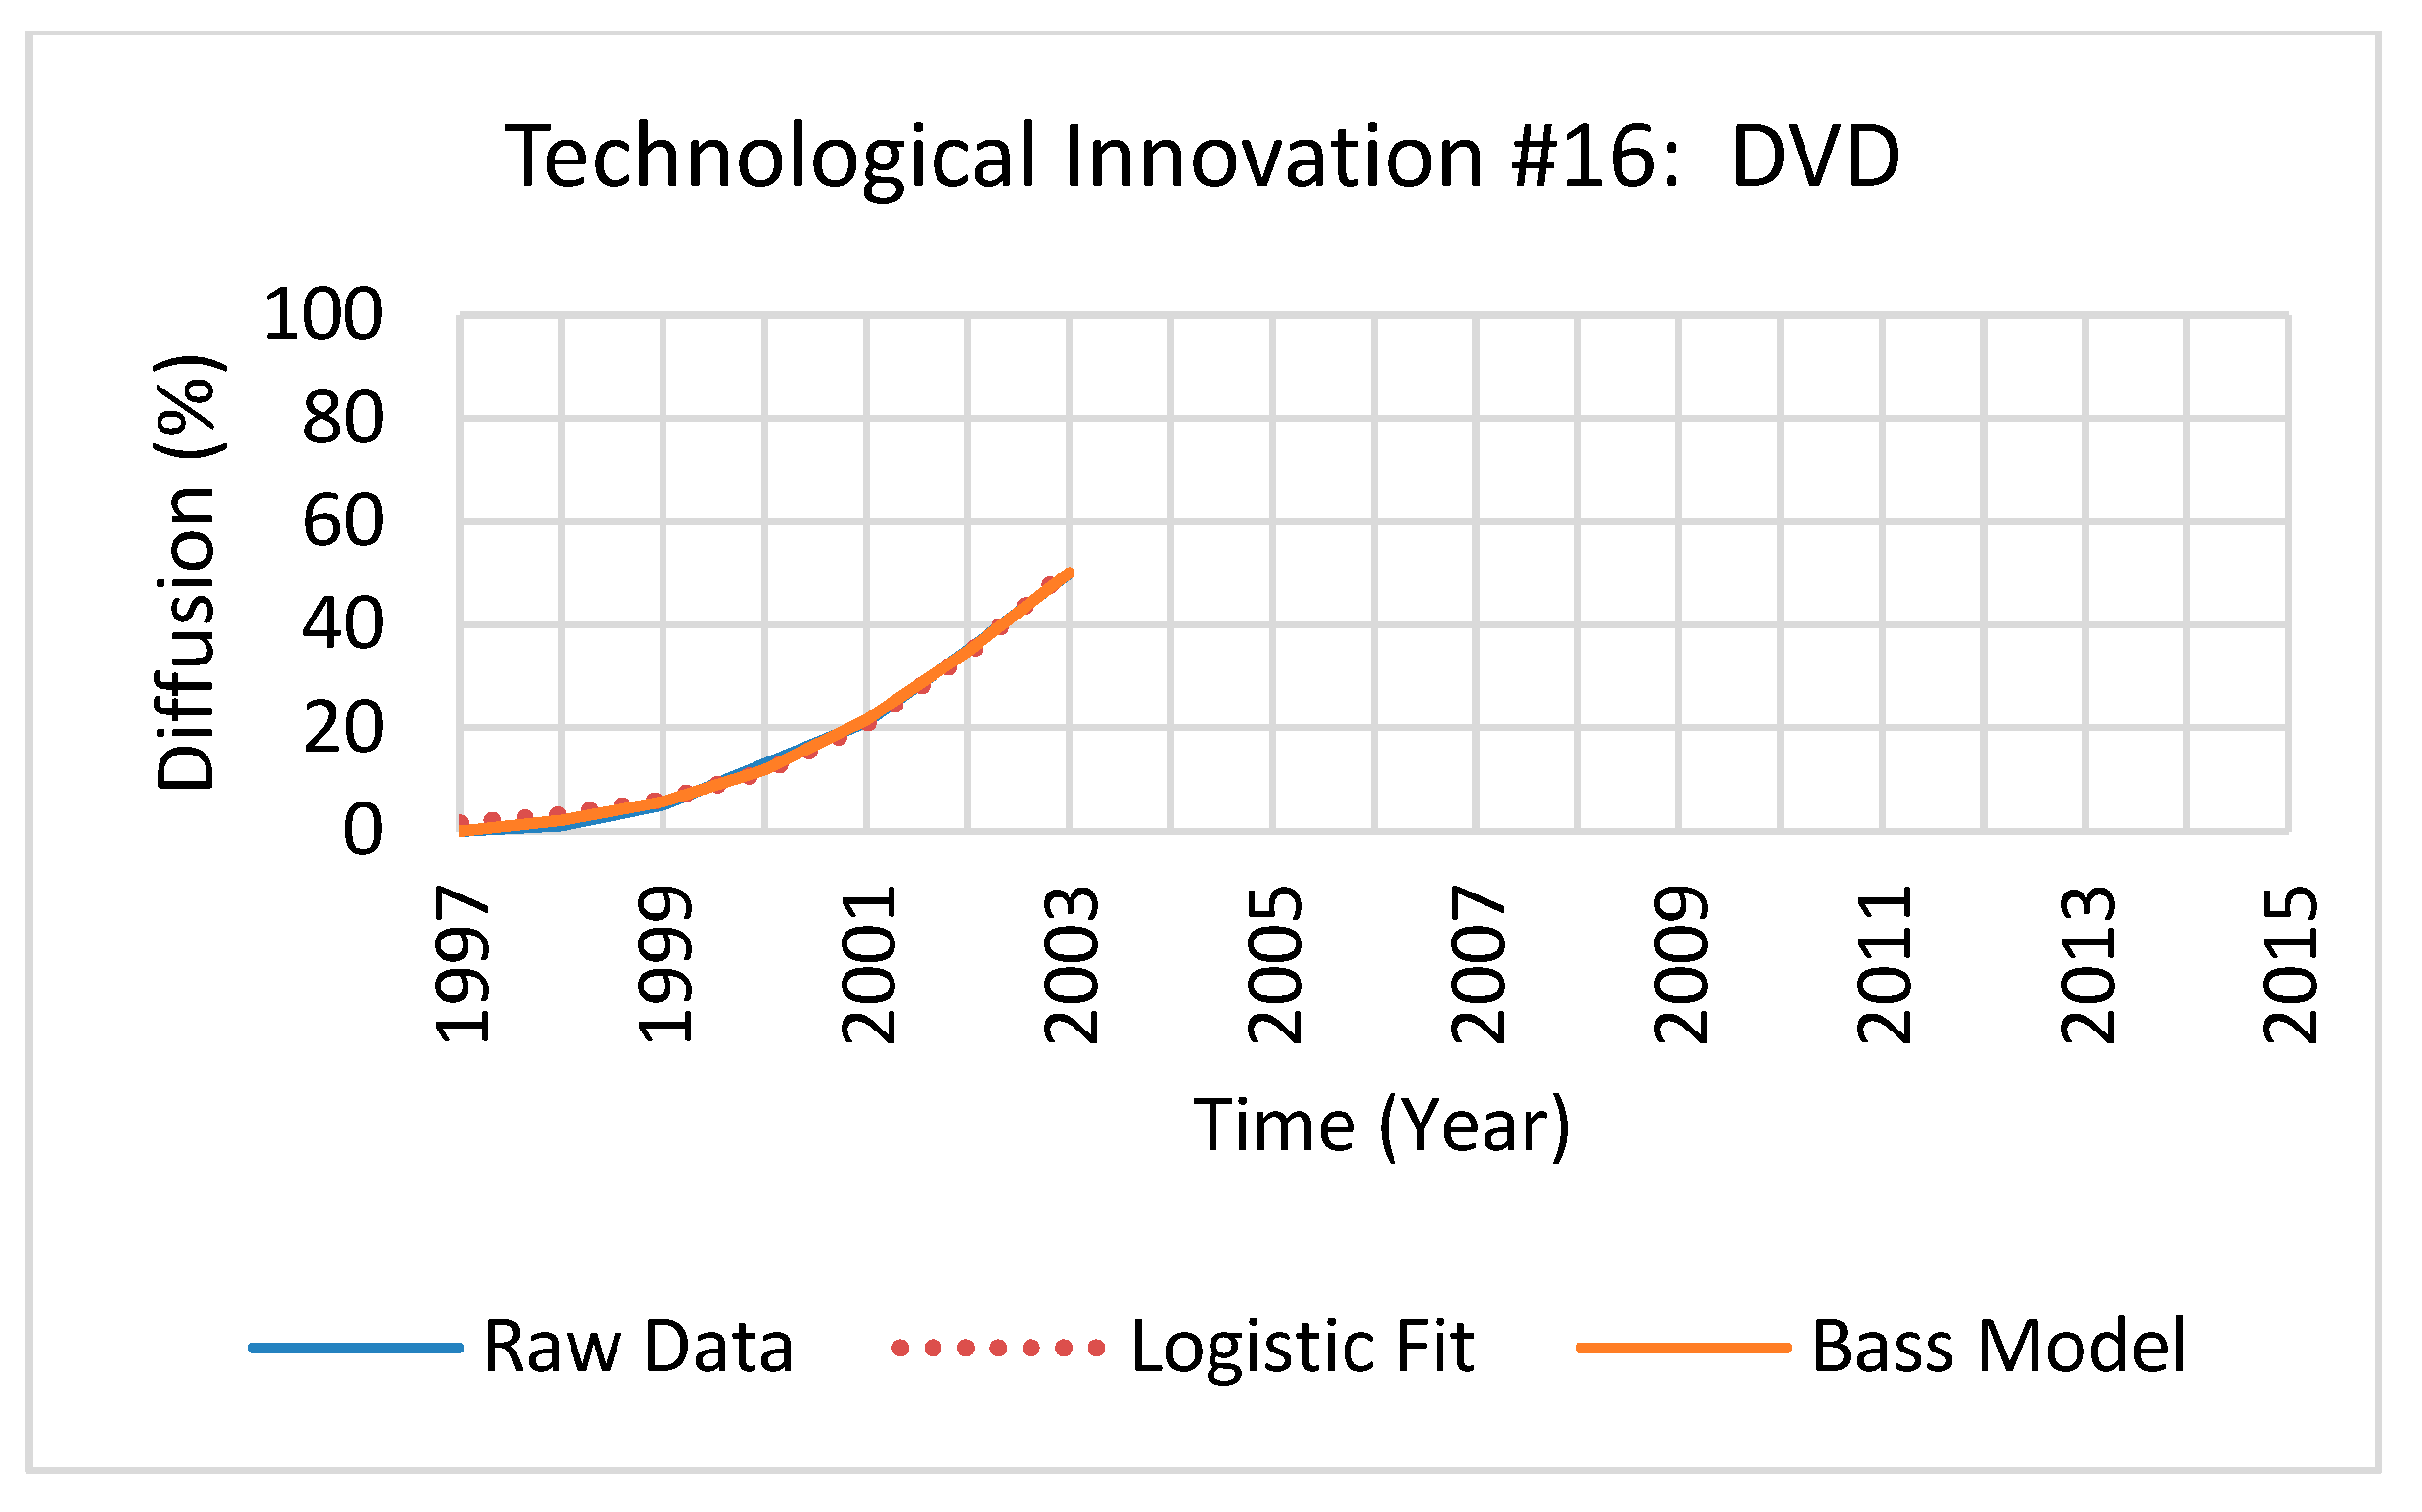
Each technological innovation maximum diffusion rate was solved by applying the model’s second derivatives root point to the model’s first derivative. The logistic and Bass models’ resultant maximum diffusion rates for each technological innovation examined are provided in Table 5 for reference. Additionally, the percent difference of the maximum diffusion rates between models (defined as the absolute value of the change in maximum diffusion rates, divided by the average of the two maximum diffusion rates, all multiplied by 100) of each technological innovation is shown in Table 5. As an illustration of the process of fitting each model to the diffusion steps, the raw diffusion data and fitted Bass and logistic models of a technological innovation at full maturation and at 50% of its lifecycle are shown in Figure 2 and Figure 3 for reference.
4.2. Percent-Error Results and Statistical Characteristics
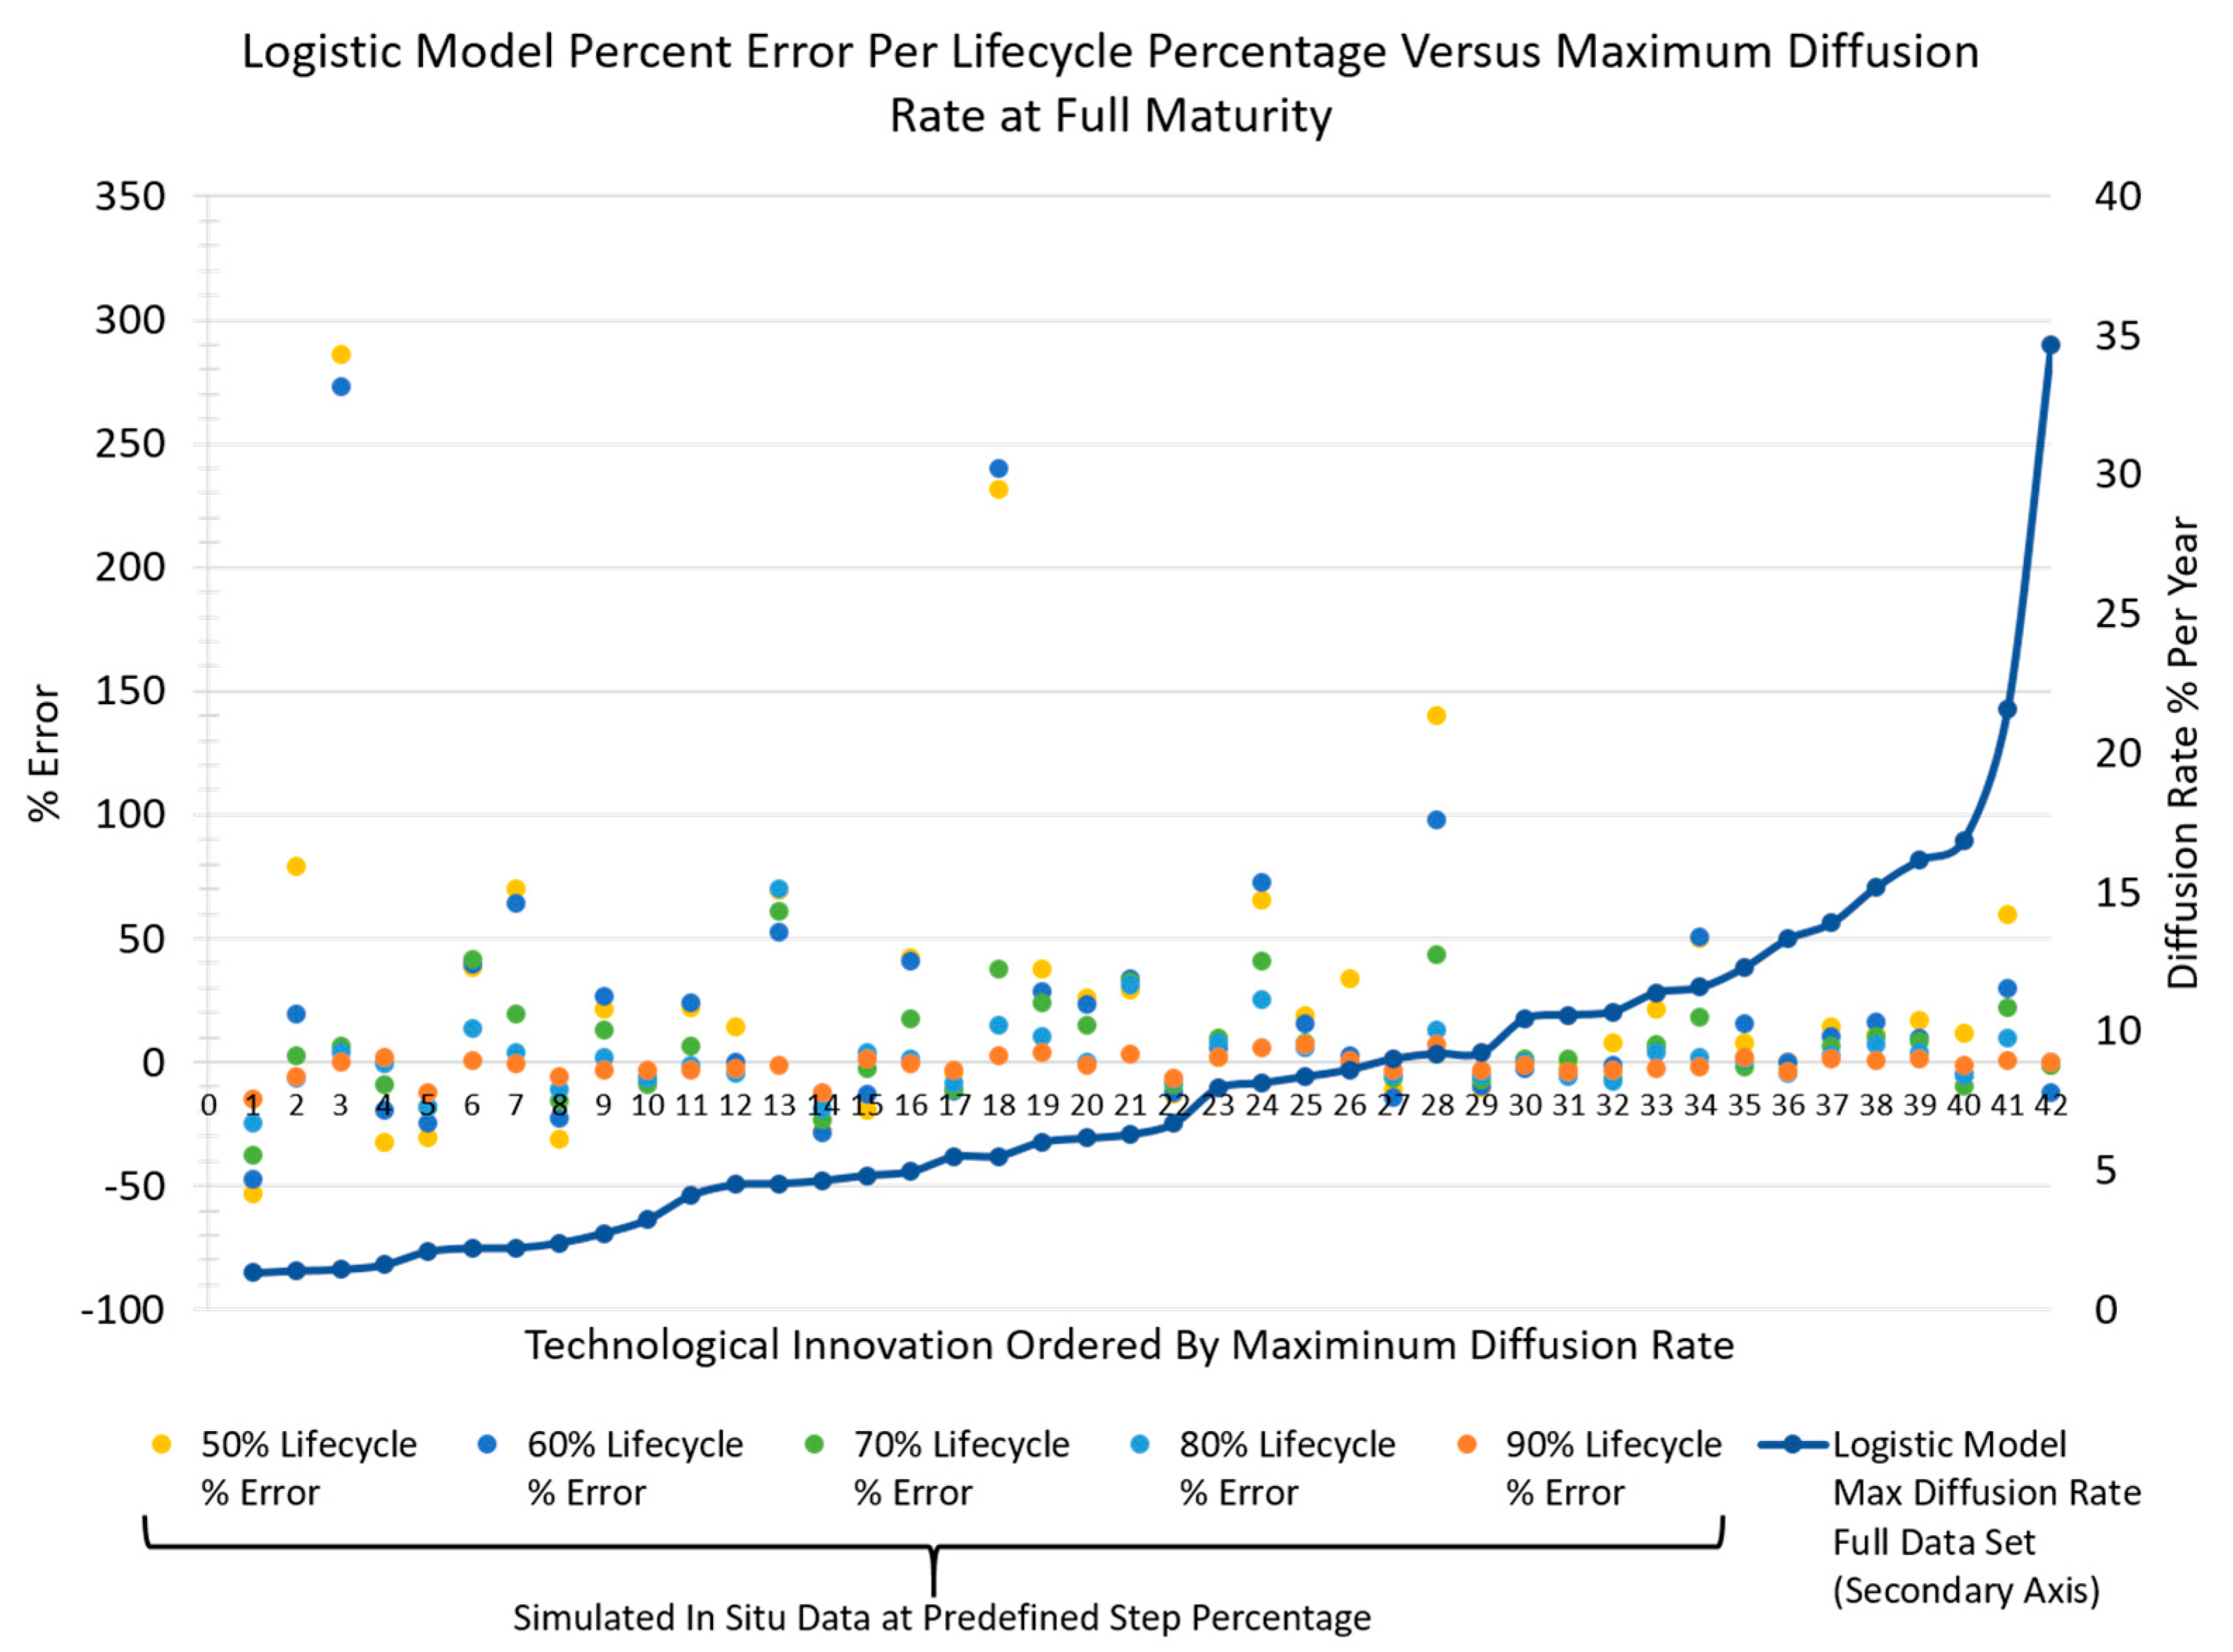
The resultant scatter plots of percent-errors at each simulated in situ lifecycle predefined percentage step bounds (defined in Section 3.2) for the Bass and logistic models are presented as the primary axes of Figure 4 and Figure 5 against each technological innovation (ordered by ascending maximum diffusion rate), respectively. As a result, each technological innovation column in the scatter plot reveals the percent-errors at each simulated in situ lifecycle predefined percentage step bounds for comparative context. Moreover, shown in the secondary axis in these figures are the maximum dif-fusion rates at full maturation for each technological innovation to provide relational context to its effect on percent-error. Statistical characteristics were extracted from the percent-error data for each lifecycle percentage step and are shown in Table 6 and Table 7 for the Bass and logistic model, respectively. As part of this EDA, to examine for un-derlying diffusion rate percent-error trends and patterns over a technological innova-tion’s lifecycle, inclusive quartile box plots of the resultant percent-errors at each lifecycle percentage step are exhibited in Figure 6 and Figure 7 for the Bass and logistic mod-els. In addition, histograms of the percent-error outcomes at each lifecycle percentage step are displayed relative to each other in Figure 8 to enable the identification of any trends over a technological innovation’s lifecycle.
5. Discussion of Results
The principal goal of this research was to explore, at a macro-level, the development of general evaluation guidelines for diffusion rate assessment. This research explores assessed diffusion rates using historical matured technological innovation diffusion data through an EDA approach to identify such directional and associative patterns and trends. Building and developing such guidelines will aid resource decision makers as they consider proactive decisions and strategies to assess a technological innovation’s diffusion rate, a key factor identified for abandonment optimization of a technological innovation [5]. The following sections discuss the trends and patterns of the results and provide discussions of their implications framed against the driving question of this effort. The findings presented are an initial step toward understanding the underlying percent-error ranges and bounds associated with assessing a technological innovation diffusion rate over its lifecycle. To shape the discussion and interpretation of the results of this EDA effort, led by the research question put forth, let us begin by examining the trends revealed through the resultant graphical percent-error data.
5.1. Percent-Error Trends and Patterns
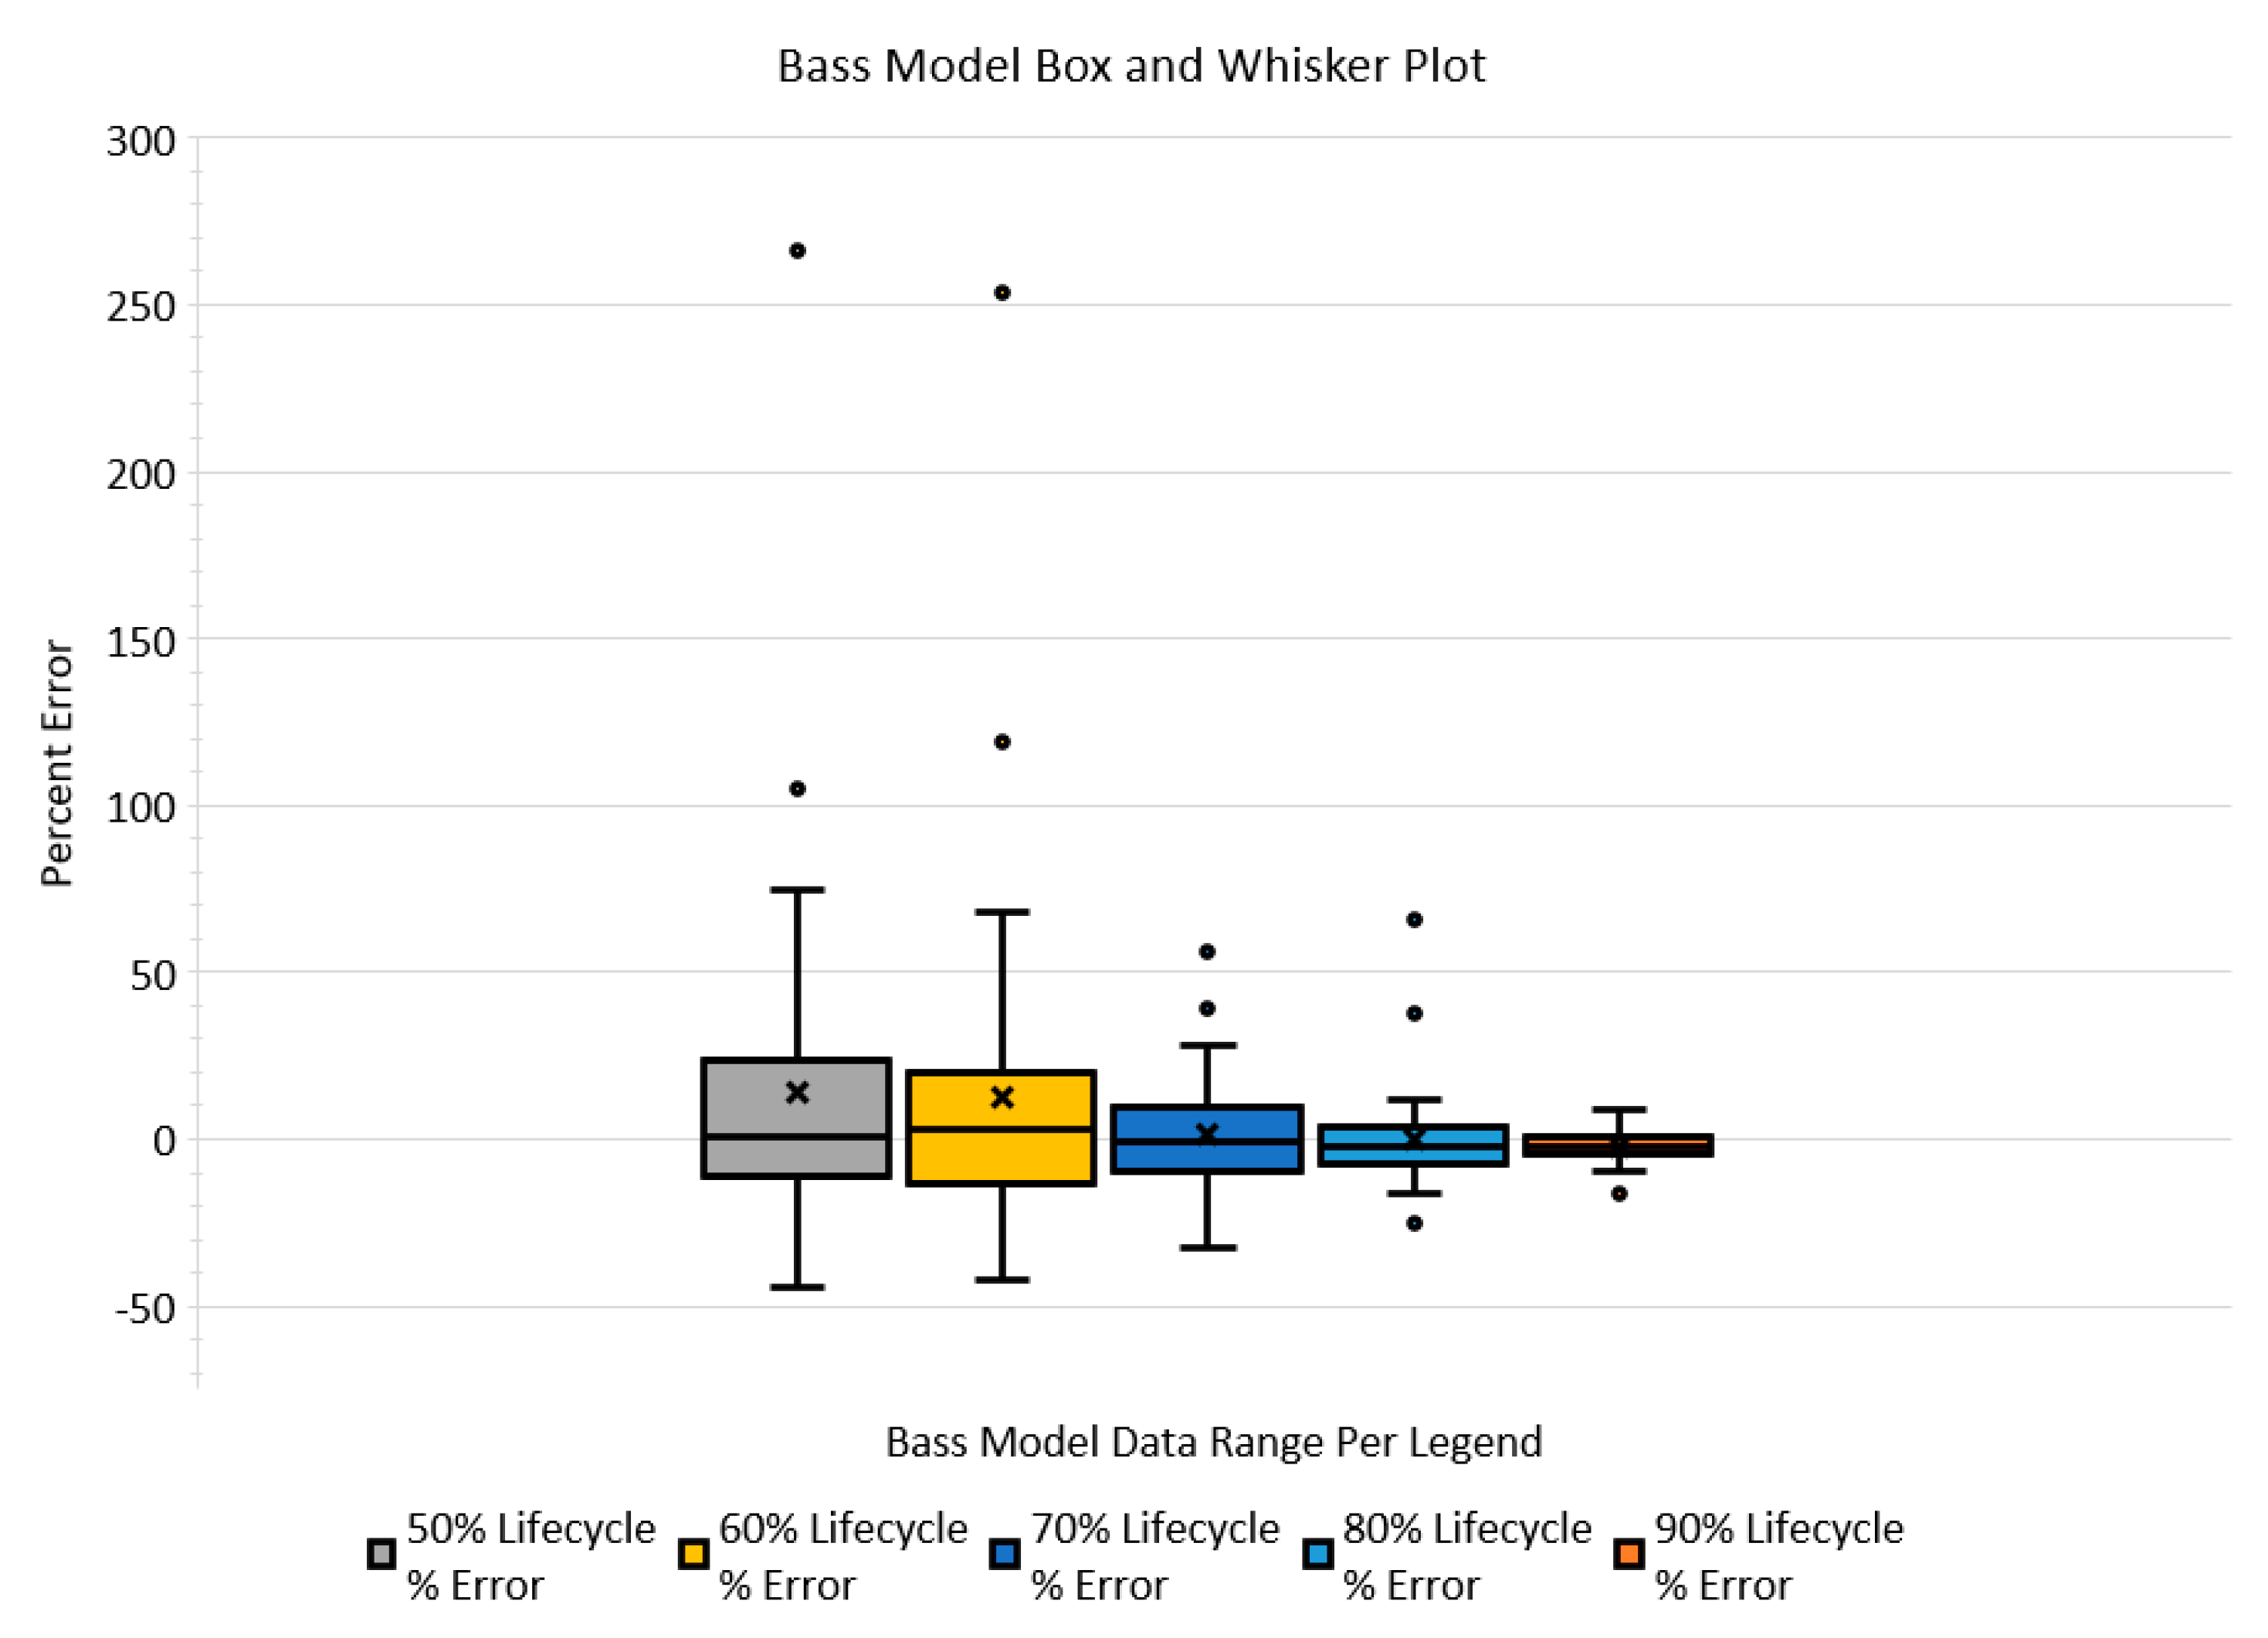
The resultant percent-error at each lifecycle percentage step, graphically illustrated in Figure 4 and Figure 5, shows a trend that as diffusion rate increases, the percent-error biases positive. In addition, another noticeable trend is that the percent-error outlier extremes also appear to be biased positive. This outlier bias is also recognized in the inclusive quartile box plots, shown in Figure 6 and Figure 7. These box plots also indicate that the percent-error outliers are more extreme when a technological innovation’s diffusion rate is assessed at 50 and 60% of its lifecycle. These revealed trends indicate that a decision maker is more likely to over-assess a technological innovation’s diffusion rate than under-assess. In addition, the box plots also reveal that diffusion rate percent-error outliers occur (in the worst case) in 3 out of the 42 diffusion rate assessments made (less than 8%) for each lifecycle percentage step explored. These data indicate that outlier occurrences, in general, are relatively low.
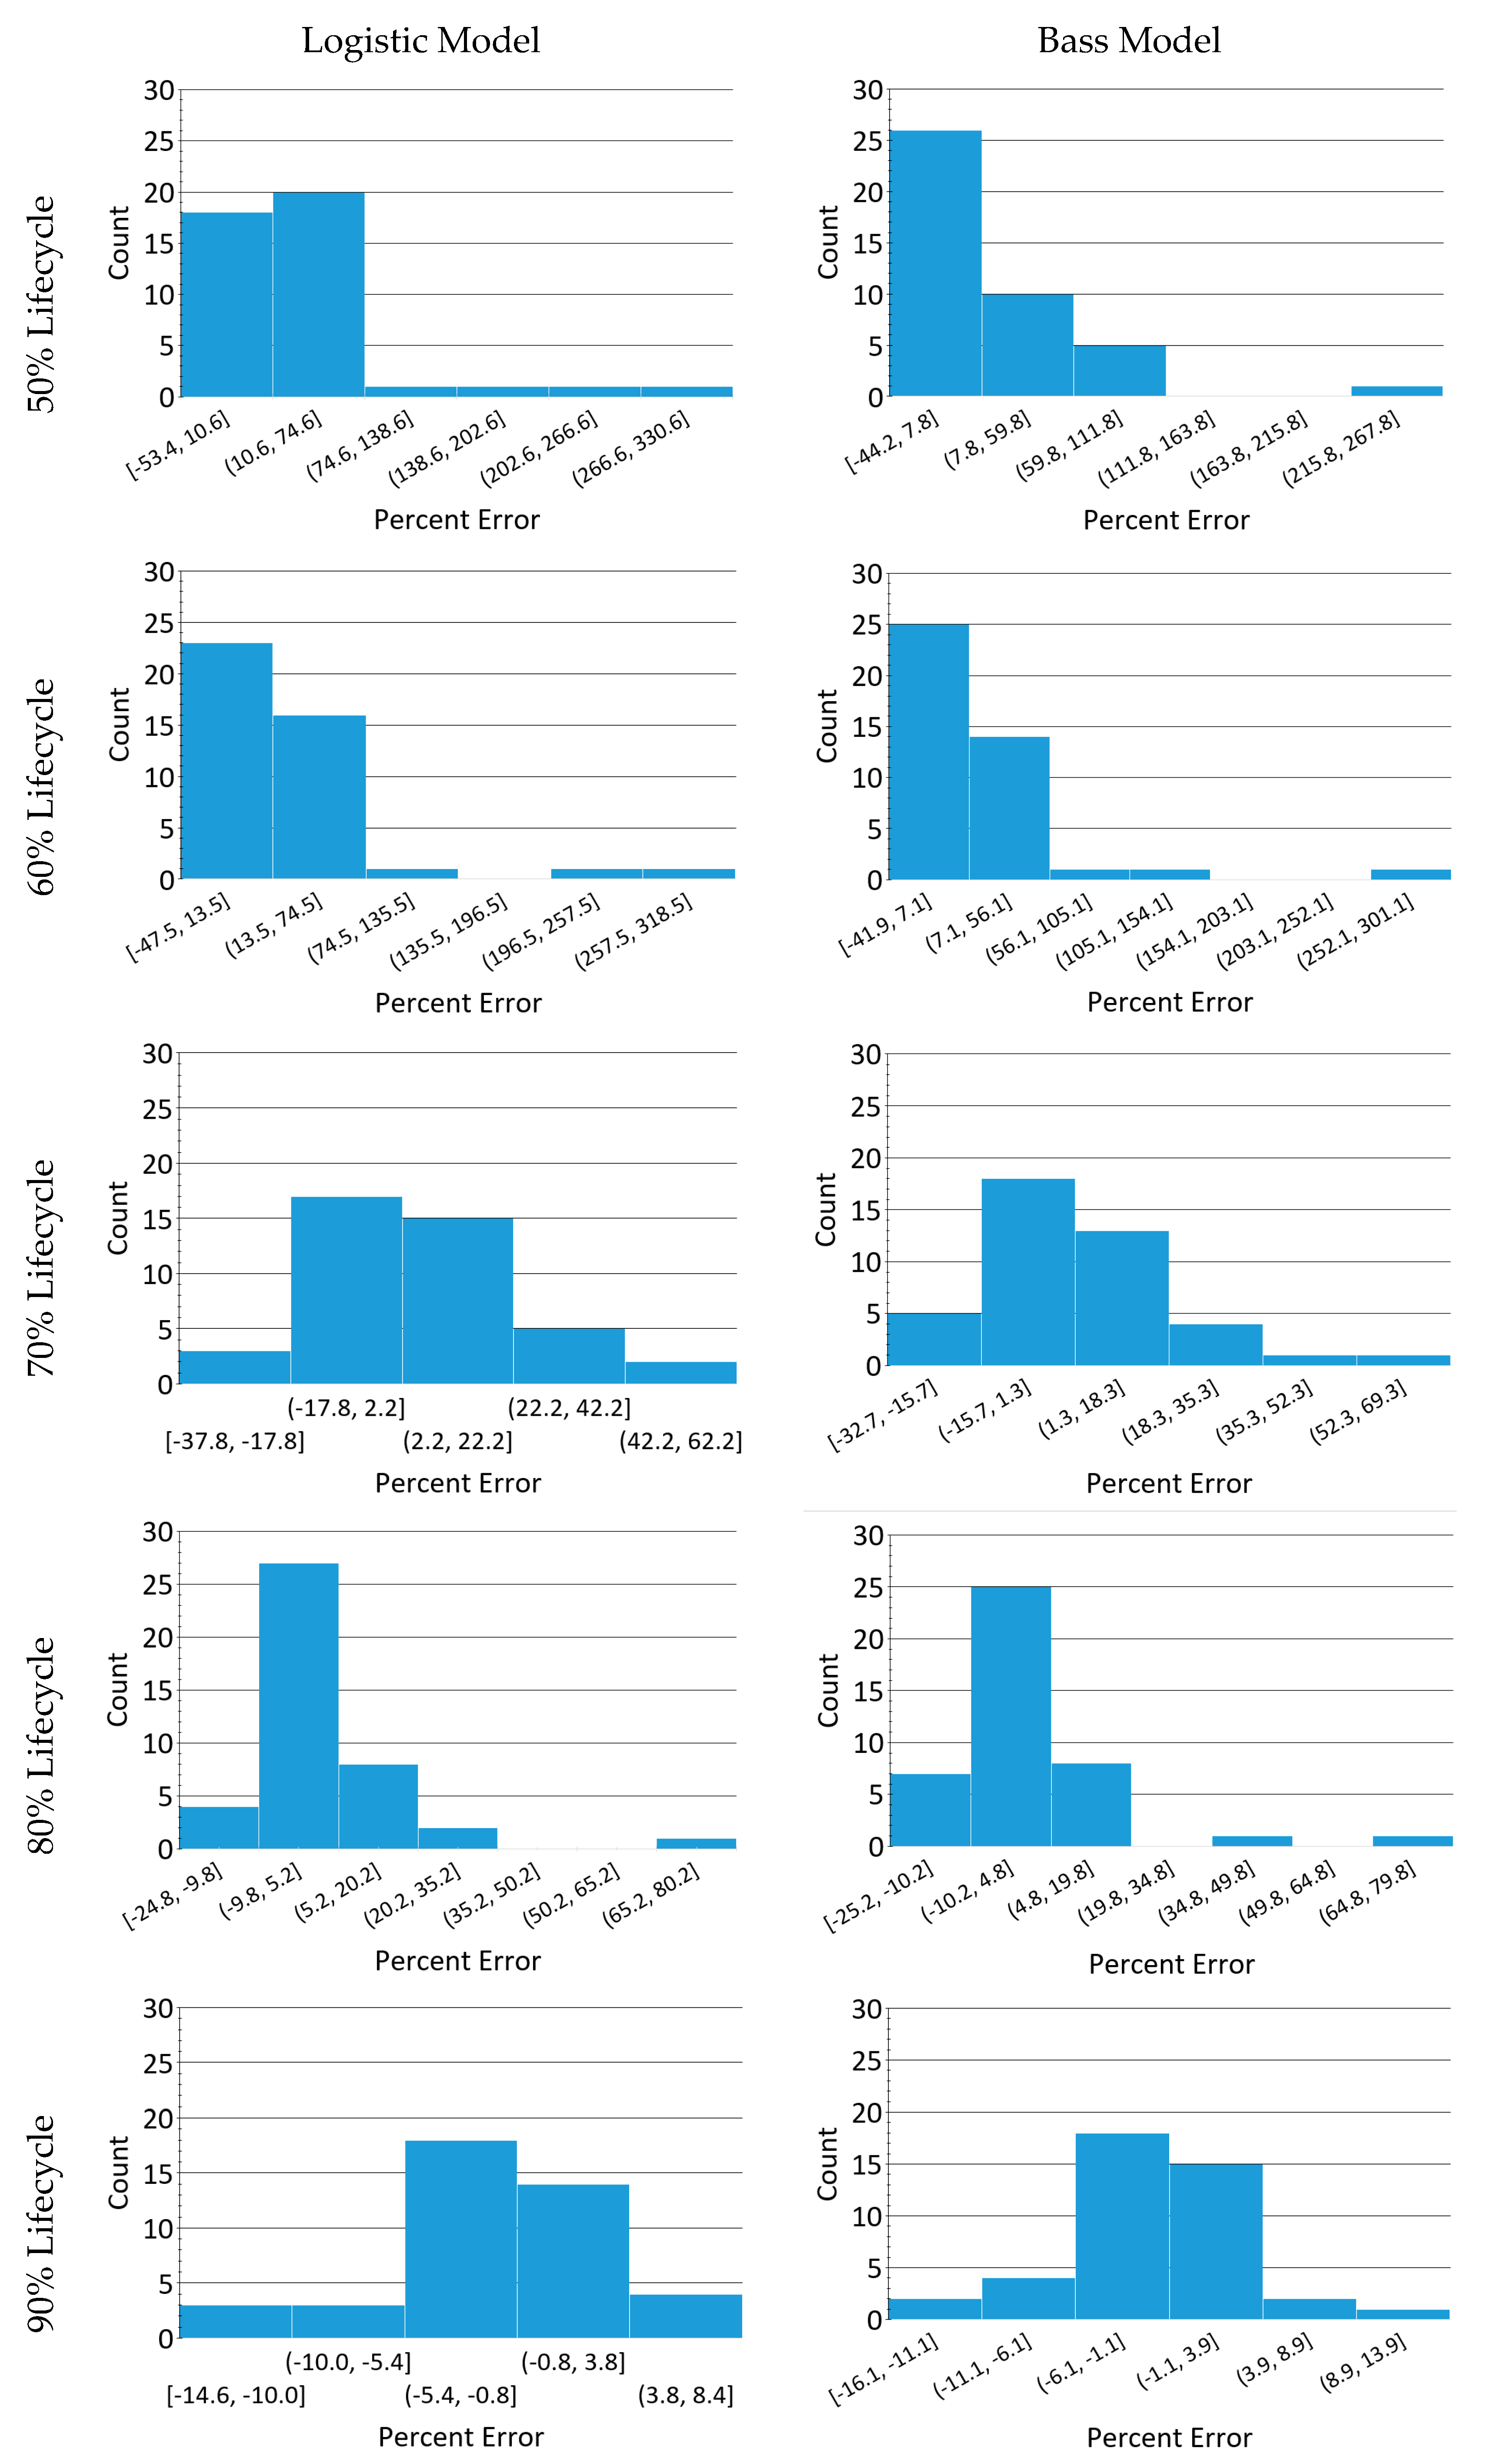
Furthermore, the skewness of the resultant percent-error data assessed at 50, 60, and 80% of the diffusion lifecycle shows a predominant positive skewness for both models, as exhibited in Table 6 and Table 7. The data also show this trend in the histograms presented in Figure 8. Visually, the percent-error data histograms appear to normalize as the assessed lifecycle percentage is increased, notably when the 80% lifecycle histogram outliers are excluded. Thus, the resultant trend indicates that both models are more disposed to extreme outliers when diffusion rate assessment is made early in a technological innovation lifecycle. Although outside the scope of this effort, a focused examination of outlier patterns and trends would expand and strengthen a decision maker’s diffusion rate assessment knowledge and deserves future examination. In addition, another important assessment trend is that percent-error distribution normalization about the mean begins to occur when diffusion rate assessment is made at a lifecycle percentage of 70% and greater. This normative pattern is also observable in the percent-error inclusive quartile box plots, shown in Figure 6 and Figure 7. In addition, the normative trend indicates a lack of randomness, signifying and supporting that there is likely an underlying pattern. Decision makers can leverage such patterns to simplify and make informed decisions on diffusion rate evaluation accuracy in situ.
The percent error statistical characteristic results shown in Table 6 and Table 7 indicate that the Bass model’s assessed diffusion rate percent-error first quartiles were skewed more negative than the logistic model as a trend. In contrast, the Bass model’s assessed diffusion rate percent-error third quartiles were skewed lower in the positive direction than the logistic model. To further explore these trends, the interquartile ranges (IQR) (representing the middle 50% of the resultant percent-error range; third quartile minus first quartile) is lower for the Bass model than the logistic model, for the diffusion rates assessed at 50, 60, and 70% of its lifecycle. Whereas, when assessed at 80 and 90% of its lifecycle, both models yield approximately equal results. Hence, decision makers should consider these results when using either of these models and, depending on their risk tolerance, may favor one model over the other. For example, the result trends suggest that if over-assessing diffusion rate is more desirable than under-assessing diffusion rate, a decision maker should favor the logistic model over the Bass model.
5.2. Diffusion Rate Assessment Model Comparision
Comparing the diffusion rate assessment models used in this effort, both models’ accumulated percent differences of each fully matured technological innovation diffusion rate baseline, as shown in Table 5, have a mean of 5.25%, standard error of 1.26, and a skewness of 3.11. The resultant percent difference between models indicates that both models provide similar diffusion rates at full lifecycle maturation. However, in terms of diffusion rate assessment at various lifecycle percentages, the mean percent error statistical characteristic is consistently lower for the Bass model than the logistic model, especially at lower diffusion lifecycle percentages. In general, the box plots for both models, Figure 6 and Figure 7, indicate a trend that percent-errors are more likely to be overestimated than underestimated, especially for diffusion rates assessed at 50 and 60%. Above 60%, percent-error appears to increasingly normalize and compress around the percent-error null point.
5.3. Assumptions and Limitations
Collectively, technological innovation market diffusion data are laborious and difficult to attain because they often reside within private organizations’ sales and marketing data, which are commonly not published or are considered proprietary [4]. As a context gauge, foundational research examining the diffusion of technological innovations have used sample populations as small as 7 to as much as 37. A sample representation of such research for reference includes Mansfield [60], Fisher and Pry [61], Bass [62], Olshavsky [63], Qualls, et al. [64], Clark, et al. [65], Takada and Jain [66], Rao and Yamada [67], Bayus [12], Kohli, et al. [68], Agarwal and Bayus [69], Goldenberg, et al. [70], Bass [71], Golder and Tellis [72], and McDade, et al. [73]. Nevertheless, the modest sample size used in this endeavor (n = 42) does, at a minimum, provide macro-based associations on diffusion rate assessment trends and directional patterns. A larger sample size would, of course, provide a more rigorous test of the validity and reliability of the herein-identified trends and warrants exploration in future research as more data become available.
Given this endeavor’s drive to develop directional and associative macro-level knowledge for decision makers to assess diffusion rate estimations in situ, this research recognizes the following central assumptions and limitations to give context to the endeavor’s boundaries. First, models representing real-world data (including the diffusion models used herein) are simplified reproductions. The power of a diffusion model lies in its proven ability to aid and enable the quick and easy generation of representative information to allow decision makers and researchers to quickly interpret data and identify trends and patterns [9,32,33,34,35,36,37]. However, raw diffusion data are rarely homogenous and fully connected; thus, decision makers must use sound judgment to determine if model results are representative and valid. Second, the technological innovation diffusion data used are U.S. market derived. Other research has demonstrated that technological innovation diffusion can be affected by market region [50]. The extension and validation of this research to other regions was out of the scope of this effort but warrants future research examination. Third, as the starting point to build macro-based knowledge, this effort focused on technological innovation as a whole and did not investigate technological innovation categorization grouping effects. Thus, the effect of such categorization is unexplored and was out of the scope of this current effort, but the foundation laid herein can be leveraged for future undertakings. Lastly, the results are macro-based and thus are not meant to be definitive but rather associative and directional in nature.
5.4. Practitioner Implications and Significance
Knowledge that can alter and enhance the way decision makers think, make choices, or conduct business, as a consequence of insights and intelligence gained, has managerial implications and significance [74]. For example, it has been shown that a technological innovation’s diffusion rate is an important factor to consider in abandonment optimization [5]; thus, understanding the accuracy of diffusion rate assessment at various points in a technological innovation’s lifecycle has value for decision making. As such, the results and insights produced by this research endeavor have significant and practical managerial implications in diffusion rate assessment and, by association, abandonment optimization.
In terms of risk, traditionally defined as a function of probability and impact, valuable actionable strategic information is gained on the accuracy of diffusion rate assessment. Decision makers commonly face evaluating trade-offs of uncertain outcomes and managing risk when assessing abandonment decisions. A decision maker’s tolerance to uncertainty (e.g., risk), per decision theory, is directly linked to their decision, especially when uncertainty is involved [75,76]. This endeavor bounded and reduced the uncertainty (via percent-error evaluation) of diffusion rate assessment along a technological innovation’s lifecycle.
Consequently, the resultant underlying diffusion rate percent-errors bounds and trends revealed in this effort can aid decision makers in making an informed decision and managing risk. Accordingly, if a decision maker has insights into the percent-error of an assessed diffusion rate, abandonment decision strategies can be created to factor in such intelligence. From the resultant diffusion rate percent-error statistical characteristics, shown in Table 3 and Table 4, percent-error bounds are determined for the diffusion lifecycle steps explored.
As an example, the percent-error bounds determined herein can be used to make informed choices based on the decision maker’s risk tolerance and decision impact. By way of illustration, abandonment optimization is affected by the assessed incumbent technological innovation diffusion rate as demonstrated by Parvin and Beruvides [5] research on optimization abandonment. Suppose an incumbent technological innovation’s assessed diffusion rate accuracy bounds are recognized. In that case, a decision maker can better optimize abandonment based on their risk tolerance and the weighted average of the utility of each of the bounds possible outcomes via a decision theory such as Expected Utility (EU) theory. EU is an extension of utility theory in which decisions have to be made with uncertainty and serves as a reference guide for assessing decisions [77,78].
The EU theory advises decision makers to choose the action or event with the maximum expected utility based on their tolerance for risk. One reason decision makers maximize expected utility is that it supports the maximization of outcomes in the long term [79]. A key benefit to the application of EU theory is that it provides a descriptive guide for a decision maker to choose options rationally when they are not sure which outcome will result from their decision in order to maximize utility [80]. Although in-depth exploration of EU analysis was out of the scope of this current research endeavor, its applications could provide decision makers with a methodology that factors in their risk tolerance toward diffusion rate forecasting accuracy (gain herein) for abandonment decisions. Furthermore, risk tolerance assessment can provide a means of evaluating the diversification of an organization’s technological innovation investment portfolio. Therefore, the application of a decision theory such as EU for risk tolerance assessment is identified as an area for future exploration.
5.5. Model Errors
Research has shown that in growth processes, the estimated parameter’s statistical uncertainty may be substantial [38]. Although out of the scope of this current effort, it is important to acknowledge the statistical uncertainty of the resultant diffusion model fits and their parameters. In this research effort’s case, this uncertainty stems from the regressed fit’s residuals not being independent of each other, a result of examining and comparing individual technological innovation’s time-series data. A practitioner needs to account for (or at a minimum acknowledge) these residual correlations (dependences) as they may affect prediction inferences. Thus, the impact of error in the estimated parameters on statistical uncertainty warrants future examination to improve inferences of the models developed herein.
5.6. Micro-Effects
This effort explores the macro-level trends of diffusion rate assessment for underlying behaviors. Such pattern identifications enable practitioners to simplify complex decisions and make informed, proactive predictions on decision outcomes relating to technological innovation’s growth and, by proxy, abandonment assessment. Although this effort focuses on exploring and identifying macro-level trends, it must be acknowledged that macro-behavior and patterns can be influenced and weighted by micro-based factors (i.e., events and decisions). Examples of micro-based factors include, but are not limited to, aggressive or weak competition, the health and size of the technology innovation’s market economy, and natural driven events such as severe weather. A practitioner’s use of the macro-based model inference developed herein should be weighted, as appropriate and available, with micro-based factors of the technology innovation’s environment.
6. Conclusions
This research explored the identification of general underlying macro-trends and patterns of diffusion rate assessment accuracy to build knowledge to aid decision makers in making informed and proactive decisions on when to abandon a technological innovation. This examination accomplished this by exploring the statistical characteristics of diffusion rate percent-error (the central research question), assessed as the difference between the diffusion rates at various points in its lifecycle and its actual fully achieved diffusion rate at full maturation. These macro-based insights and directional guidelines were revealed through the time-stepped exploration of extracted diffusion rates from 42 matured technological innovation lifecycles.
A supported outcome of an EDA is the development and forwarding of new exploratory hypotheses in a research area through the examination of patterns and trends. As such, this endeavor forwards one new exploratory hypothesis to be considered in the future for this research area. The data analysis revealed inferences, forwarding the hypothesis (H1), that the Bass and logistic models are more likely to overestimate a technological innovation’s diffusion rate when assessed between the 50% point and the 70% point of its diffusion lifecycle. As discussed previously, such underlying macro-trends provide practitioners with the knowledge to optimize abandonment decisions based on their risk tolerance (to diffusion rate forecasting accuracy) and the utility of the weighted outcomes via a decision theory.
The resultant underlying diffusion rate percent-error trends identified in this effort provide insights and directional guidelines toward creating a framework for assessing, in situ, a technological innovation’s assessed diffusion rate accuracy bounds. As previously mentioned, a determinative factor of the abandonment optimization of a technological innovation is its assessed diffusion rate [4]. Thus, the intelligence developed herein benefits an organization’s decision makers in proactively setting strategy, policy, and resource management toward optimizing abandonment.
Resource limitations commonly hinder the quantity and quality of information, including diffusion rate assessment, to decision makers. Macro-based information generally requires less effort to understand, obtain, and interpret; for this reason, it is a valuable tool for preventing a decision maker from just making a random guess, especially when resources are limited. Prior to this effort, no contemporary research has focused on the macro-level characterization of the accuracy of diffusion rate extraction, time stepped through its lifecycle. This EDA endeavor added new macro-perspective intelligence on the assessment of diffusion rate accuracy, enabling decision makers to make informed decisions toward diffusion rate assessment and, by proxy, abandonment optimization.
As with all research efforts, it is important to reflect and summarize resulting outcomes to provide context for its value and implications to practitioners. Therefore, the identified resulting macro-level findings of this research endeavor are summarized below to provide a foundation for future exploratory and confirmatory research efforts.
- The Bass and logistic models are more likely to overestimate a technological innovation’s diffusion rate when assessed between the 50% point and the 70% point of its diffusion lifecycle.
- Diffusion rate percent-errors have a positive bias as a technological innovation’s diffusion rate increases.
- The data analysis resultant trend indicates that the Bass and logistic models are more disposed to extreme outliers when diffusion rate assessment is made early in a technological innovation’s lifecycle.
- A normative pattern is observable in diffusion rate percent-error as lifecycle percentage increase, indicating a lack of randomness, signifying and supporting that there is likely an underlying predictable pattern. Decision makers can leverage this pattern to simplify decisions and be used to make informed predictions on diffusion rate outcomes.
- The result trends suggest that, if over-assessing diffusion rate is more desirable than under-assessing diffusion rate, a decision maker should favor the logistic model over the Bass model.
The accuracy of diffusion rate assessment at various points in a technological innovation’s lifecycle provides intelligence toward enhancing how decision makers think and make choices on abandonment. As a practical example, if an incumbent technological innovation’s assessed decision rate accuracy bounds are known, a decision maker can better optimize abandonment based on their risk tolerance and the decision’s impact. Furthermore, a potential implication is that the knowledge gained can be applied to a decision theory such as EU, which considers the decision maker’s risk tolerance and the perceived weighted utility of each possible outcome toward identifying an optimized decision.
In conclusion, the macro-perspective knowledge gained in this endeavor can be used by decision makers to make informed decisions on assessing the percent-error bounds of diffusion rate evaluation. Furthermore, the graphical outputs developed in this EDA effort reveals directional and associative trends that provide insights for decision makers seeking to assess a technological innovation’s diffusion rate. Consequently, this newfound perspective provides a basis for diffusion rate assessment, enabling decision makers to speed decision making and reduce complexity (reducing cognitive demand). Thus, the knowledge gained from this effort adds value to a decision maker’s ability to exercise two hierarchic components of systems thinking: the identification of, and the recognition of, trends and patterns and the generalization of complex situations [15,16,17].
Author Contributions
Conceptualization, A.J.P.J., M.G.B. and V.G.T.-G.; methodology, A.J.P.J., M.G.B. and V.G.T.-G.; software, A.J.P.J.; validation, A.J.P.J., M.G.B. and V.G.T.-G.; formal analysis, A.J.P.J.; investigation, A.J.P.J.; resources, A.J.P.J. and M.G.B.; data curation, A.J.P.J.; writing—original draft preparation, A.J.P.J.; writing—review and editing, A.J.P.J., M.G.B. and V.G.T.-G.; visualization, A.J.P.J.; supervision, M.G.B.; project administration, A.J.P.J. All authors have read and agreed to the published version of the manuscript.
Funding
This research received no external funding.
Institutional Review Board Statement
Not applicable.
Informed Consent Statement
Not applicable.
Data Availability Statement
The data presented in this study are openly available in FigShare at http://0-doi-org.brum.beds.ac.uk/10.6084/m9.figshare.16946113 (accessed on 7 November 2021).
Conflicts of Interest
The authors declare no conflict of interest.
References
- Greenwood, B.N.; Agarwal, R.; Agarwal, R.; Gopal, A. The When and Why of Abandonment: The Role of Organizational Differences in Medical Technology Life Cycles. Manag. Sci. 2016, 63, 2948–2966. [Google Scholar] [CrossRef] [Green Version]
- Parvin, A.J., Jr.; Beruvides, M.G. Forecasting Technology Obsolescence: Assessing The Existing Literature, A Systematic Review. In Proceedings of the International Annual Conferensce of the American Society for Engineering Management, Huntsville, AL, USA, 18–21 October 2017; pp. 1–13. [Google Scholar]
- Morlidge, S. Future Ready: How to Master Business Forecasting; Wiley: Hoboken, NJ, USA, 2010. [Google Scholar]
- Parvin, A.J.; Beruvides, M.G. Macro Patterns and Trends of U.S. Consumer Technological Innovation Diffusion Rates. Systems 2021, 9, 16. [Google Scholar] [CrossRef]
- Parvin, A.J.; Beruvides, M.G. Optimizing the Abandonment of a Technological Innovation. Systems 2021, 9, 27. [Google Scholar] [CrossRef]
- Meade, N.; Islam, T. Technological Forecasting—Model Selection, Model Stability, and Combining Models. Manag. Sci. 1998, 44, 1115–1130. [Google Scholar] [CrossRef]
- Teng, J.T.; Grover, V.; Guttler, W. Information Technology Innovations: General Diffusion Patterns and Its Relationships to Innovation Characteristics. IEEE Trans. Eng. Manag. 2002, 49, 13–27. [Google Scholar] [CrossRef] [Green Version]
- Michalakelis, C.; Dede, G.; Varoutas, D.; Sphicopoulos, T. Impact of Cross-National Diffusion Process in Telecommunications Demand Forecasting. Telecommun. Syst. 2008, 39, 51–60. [Google Scholar] [CrossRef]
- Adamuthe, A.C.; Thampi, G.T. Technology Forecasting: A Case Study of Computational Technologies. Technol. Forecast. Soc. Change 2019, 143, 181–189. [Google Scholar] [CrossRef]
- Yu, J.R.; Dong, Y.W.; Chang, Y.H.; Tseng, F.-M. Comparison of Innovation Diffusion Models: A Case Study on the Dram Industry. In Proceedings of the 2012 IEEE International Conference on Fuzzy Systems, Brisbane, Australia, 10–15 June 2012; IEEE: Piscataway, NJ, USA, 2012; pp. 1–7. [Google Scholar]
- Van den Bulte, C. New Product Diffusion Acceleration: Measurement and Analysis. Mark. Sci. 2000, 19, 366–380. [Google Scholar] [CrossRef] [Green Version]
- Bayus, B.L. Have diffusion rates been accelerating over time? Mark. Lett. 1992, 3, 215–226. [Google Scholar] [CrossRef]
- Parvin, A.J., Jr.; Beruvides, M.G. Technology Abandonment and the Time Value of Diffusion. In Proceedings of the 2019 IISE Annual Conference, Orlando, FL, USA, 18–21 May 2019; p. 10. [Google Scholar]
- Adner, R.; Kapoor, R. Innovation Ecosystems and the Pace of Substitution: Re-Examining Technology S-Curves. Strateg. Manag. J. 2016, 37, 625–648. [Google Scholar] [CrossRef] [Green Version]
- McNamara, C. Field Guide to Consulting and Organizational Development with Nonprofits; Authenticity Consulting: Minneapolis, MN, USA, 2017. [Google Scholar]
- Stalter, A.M.; Phillips, J.M.; Ruggiero, J.S.; Scardaville, D.L.; Merriam, D.; Dolansky, M.A.; Goldschmidt, K.A.; Wiggs, C.M.; Winegardner, S. A concept analysis of systems thinking. Nurs. Forum 2017, 52, 323–330. [Google Scholar] [CrossRef] [PubMed]
- Senge, P.M. The Fifth Discipline Fieldbook: Strategies and Tools for Building a Learning Organization; Currency: New York, NY, USA, 2014. [Google Scholar]
- Behrens, J.T. Principles and Procedures of Exploratory Data Analysis. Psychol. Methods 1997, 2, 131. [Google Scholar] [CrossRef]
- Kothari, C.R. Research Methodology: Methods and Techniques; New Age International: New Delhi, India, 2004. [Google Scholar]
- Tukey, J.W. Exploratory Data Analysis; Pearson North America: New York, NY, USA, 1977. [Google Scholar]
- de Mast, J.; Kemper, B.P. Principles of exploratory data analysis in problem solving: What can we learn from a well-known case? Qual. Eng. 2009, 21, 366–375. [Google Scholar] [CrossRef]
- Mosteller, F.; Tukey, J.W. Data Analysis and Regression: A Second Course in Statistics; Pearson: New York, NY, USA, 1977. [Google Scholar]
- Buja, A.; Cook, D.; Hofmann, H.; Lawrence, M.; Lee, E.-K.; Swayne, D.F.; Wickham, H. Statistical inference for exploratory data analysis and model diagnostics. Philos. Trans. R. Soc. A Math. Phys. Eng. Sci. 2009, 367, 4361–4383. [Google Scholar] [CrossRef] [PubMed]
- Barreca, S.L. Technology Life-Cycles and Technological Obsolescence; BCRI Inc.: Birmingham, UK, 2000. [Google Scholar]
- LaPorte, T.R.; Consolini, P.M. Working in Practice but Not in Theory: Theoretical Challenges of High-Reliability Organizations. Crisis Manag. 1991, 1, 57. [Google Scholar]
- Pauchant, T.C.; Mitroff, I.I.; Weldon, D.N.; Ventolo, G.F. The Ever-Expanding Scope of Industrial Crises: A Systemic Study of the Hinsdale Telecommunications Outage. Ind. Crisis Q. 1990, 4, 243–261. [Google Scholar] [CrossRef]
- Lin, Z.; Carley, K. Proactive or Reactive: An Analysis of the Effect of Agent Style on Organizational Decision-making Performance. Intell. Syst. Account. Financ. Manag. 1993, 2, 271–287. [Google Scholar] [CrossRef] [Green Version]
- Parvin, A.J., Jr.; Beruvides, M.G. The Relationship between a Technology’s Diffusion Rate (Time) and its Economical Impact (Money). In Proceedings of the 39th International Annual Conference of the American Society for Engineering Management, Coeur d’Alene, ID, USA, 17–20 October 2018; p. 8. [Google Scholar]
- Kahneman, D. Thinking, Fast and Slow; Farrar, Straus and Giroux: New York, NY, USA, 2011. [Google Scholar]
- Onken, J.; Hastie, R.; Revelle, W. Individual Differences in the Use of Simplification Strategies in a Complex Decision-Making Task. J. Exp. Psychol. Hum. Percept. Perform. 1985, 11, 14. [Google Scholar] [CrossRef]
- Choffray, J.M.; Lilien, G.L. A Decision-Support System for Evaluating Sales Prospects and Launch Strategies for New Products. Ind. Mark. Manag. 1986, 15, 75. [Google Scholar] [CrossRef]
- Geroski, P.A. Models of Technology Diffusion. Res. Policy 2000, 29, 603–625. [Google Scholar] [CrossRef]
- Griliches, Z. Hybrid Corn: An Exploration in the Economics of Technological Change. Econometrica 1957, 501–522. [Google Scholar] [CrossRef] [Green Version]
- Kemp, R.; Volpi, M. The Diffusion of Clean Technologies: A Review with Suggestions for Future Diffusion Analysis. J. Clean. Prod. 2008, 16, S14–S21. [Google Scholar] [CrossRef]
- Gort, M.; Klepper, S. Time Paths in the Diffusion of Product Innovations. Econ. J. 1982, 92, 630–653. [Google Scholar] [CrossRef]
- Nakicenovic, N. Growth to Limits: Long Waves and the Dynamics of Technology; International Institute for Applied Systems Analysis: Laxenburg, Austria, 1984. [Google Scholar]
- Bengisu, M.; Nekhili, R. Forecasting Emerging Technologies with the Aid of Science and Technology Databases. Technol. Forecast. Soc. Change 2006, 73, 835–844. [Google Scholar] [CrossRef]
- Grubler, A. The Rise and Fall of Infrastructures: Dynamics of Evolution and Technological Change in Transport; Physica-Verlag: Heidelberg, Germany, 1990. [Google Scholar]
- Meade, N.; Islam, T. Forecasting with Growth Curves: An Empirical Comparison. Int. J. Forecast. 1995, 11, 199–215. [Google Scholar] [CrossRef]
- Kim, N.; Chang, D.R.; Shocker, A.D. Modeling Intercategory and Generational Dynamics for a Growing Information Technology Industry. Manag. Sci. 2000, 46, 496–512. [Google Scholar] [CrossRef]
- Kim, M.-S.; Kim, H. Innovation Diffusion of Telecommunications: General Patterns, Diffusion Clusters and Differences by Technological Attribute. Int. J. Innov. Manag. 2004, 8, 223–241. [Google Scholar] [CrossRef]
- Botelho, A.; Pinto, L.g.C. The Diffusion of Cellular Phones in Portugal. Telecommun. Policy 2004, 28, 427–437. [Google Scholar] [CrossRef]
- Meade, N.; Islam, T. Modelling and forecasting the diffusion of innovation—A 25-year review. Int. J. Forecast. 2006, 22, 519–545. [Google Scholar] [CrossRef]
- Ostojic, I. Bass Innovation Diffusion Model and Its Application in Policy Analysis for Adoption of Renewable Energy Technologies; Swiss Federal Institute of Technology: Zürich, Switzerland, 2010. [Google Scholar]
- Meyer, P.S.; Yung, J.W.; Ausubel, J.H. A Primer on Logistic Growth and Substitution: The Mathematics of the Loglet Lab Software. Technol. Forecast. Soc. Change 1999, 61, 247–271. [Google Scholar] [CrossRef]
- Chen, Y.-H.; Chen, C.-Y.; Lee, S.-C. Technology Forecasting of New Clean Energy: The Example of Hydrogen Energy and Fuel Cell. Afr. J. Bus. Manag. 2010, 4, 1372–1380. [Google Scholar]
- Kucharavy, D.; De Guio, R. Application of S-shaped curves. Procedia Eng. 2011, 9, 559–572. [Google Scholar] [CrossRef] [Green Version]
- Martinez, W.L.; Martinez, A.R.; Solka, J. Exploratory Data Analysis with MATLAB; CRC Press LLC: Boca Raton, FL, USA, 2017. [Google Scholar]
- Parvin Jr, A.J. In-situ innovation diffusion rate forecasting. In Proceedings of the 41st International Annual Conference of the American Society for Engineering Management: Leading Organizations through Uncertain Times—Virtual, Online, 28–30 October 2020; pp. 1–7. Available online: https://scholars.ttu.edu/en/publications/in-situ-innovation-diffusion-rate-forecasting (accessed on 7 November 2021).
- Sundqvist, S.; Frank, L.; Puumalainen, K. The Effects of Country Characteristics, Cultural Similarity and Adoption Timing on the Diffusion of Wireless Communications. J. Bus. Res. 2005, 58, 107–110. [Google Scholar] [CrossRef]
- Salkind, N.J. Encyclopedia of Research Design; Sage: Thousand Oaks, CA, USA, 2010. [Google Scholar] [CrossRef]
- Kelley, K.; Lai, K. Accuracy in Parameter Estimation for the Root Mean Square Error of Approximation: Sample Size Planning for Narrow Confidence Intervals. Multivar. Behav. Res. 2011, 46, 1–32. [Google Scholar] [CrossRef] [PubMed]
- Khemlani, S.; Trafton, G. Percentile Analysis for Goodness-of-Fit Comparisons of Models to Data. Proc. Annu. Meet. Cogn. Sci. Soc. 2014, 36, 737–742. [Google Scholar]
- Bain, L.J.; Engelhardt, M. Introduction to Probability and Mathematical Statistics; Brooks/Cole: Belmont, CA, USA, 1987. [Google Scholar]
- Komorowski, M.; Marshall, D.C.; Salciccioli, J.D.; Crutain, Y. Exploratory Data Analysis. In Secondary Analysis of Electronic Health Records; Springer International Publishing: Cham, Germany, 2016; pp. 185–203. [Google Scholar] [CrossRef] [Green Version]
- Seltman, H.J. Experimental Design and Analysis; Carnegie Mellon University: Pittsburgh, PA, USA, 2018. [Google Scholar]
- Heckert, N.A.; Filliben, J.J.; Croarkin, C.M.; Hembree, B.; Guthrie, W.F.; Tobias, P.; Prinz, J. Handbook 151: NIST/SEMATECH e-Handbook of Statistical Methods; National Institute of Standards and Technology: Gaithersburg, MD, USA, 2002. [Google Scholar]
- DuToit, S.H.; Steyn, A.G.W.; Stumpf, R.H. Graphical Exploratory Data Analysis; Springer Science & Business Media: Berlin/Heidelberg, Germany, 2012. [Google Scholar]
- Jebb, A.T.; Parrigon, S.; Woo, S.E. Exploratory data analysis as a foundation of inductive research. Hum. Resour. Manag. Rev. 2017, 27, 265–276. [Google Scholar] [CrossRef]
- Mansfield, E. Technical change and the rate of imitation. Econometrica 1961, 29, 741–766. [Google Scholar] [CrossRef] [Green Version]
- Fisher, J.C.; Pry, R.H. A simple substitution model of technological change. Technol. Forecast. Soc. Change 1971, 3, 75–88. [Google Scholar] [CrossRef]
- Bass, F.M. The Relationship between Diffusion Rates, Experience Curves, and Demand Elasticities for Consumer Durable Technological Innovations. J. Bus. 1980, 53, S51–S67. [Google Scholar] [CrossRef]
- Olshavsky, R.W. Time and the Rate of Adoption of Innovations. J. Consum. Res. 1980, 6, 425–428. [Google Scholar] [CrossRef]
- Qualls, W.; Olshavsky, R.W.; Michaels, R.E. Shortening of the PLC: An empirical test. J. Mark. 1981, 45, 76–80. [Google Scholar]
- Clark, W.A.; Freeman, H.E.; Hanssens, D.M. Opportunities for revitalizing stagnant markets: An analysis of household appliances. J. Prod. Innov. Manag. 1984, 1, 242–254. [Google Scholar] [CrossRef]
- Takada, H.; Jain, D. Cross-National Analysis of Diffusion of Consumer Durables in Pacific Rim Countries. J. Mark. 1988, 55, 48–54. [Google Scholar] [CrossRef]
- Rao, A.G.; Yamada, M. Forecasting with a Repeat Purchase Diffusion Model. Manag. Sci. 1988, 34, 734–752. [Google Scholar] [CrossRef]
- Kohli, R.; Lehmann, D.R.; Pae, J. Extent and impact of incubation time in new product diffusion. J. Prod. Innov. Manag. Int. Publ. Prod. Dev. Manag. Assoc. 1999, 16, 134–144. [Google Scholar] [CrossRef]
- Agarwal, R.; Bayus, B.L. The Market Evolution and Sales Takeoff of Product Innovations. Manag. Sci. 2002, 48, 1024–1041. [Google Scholar] [CrossRef] [Green Version]
- Goldenberg, J.; Libai, B.; Muller, E. Riding the Saddle: How Cross-Market Communications Can Create a Major Slump in Sales. J. Mark. 2002, 66, 1–16. [Google Scholar] [CrossRef]
- Bass, F.M. Comments on “a New Product Growth for Model Consumer Durables”. Manag. Sci. 2004, 50, 1833–1840. [Google Scholar] [CrossRef] [Green Version]
- Golder, P.N.; Tellis, G.J. Growing, Growing, Gone: Cascades, Diffusion, and Turning Points in the Product Life Cycle. Mark. Sci. 2004, 23, 207–218. [Google Scholar] [CrossRef] [Green Version]
- McDade, S.; Oliva, T.A.; Thomas, E. Forecasting Organizational Adoption of High-Technology Product Innovations Separated by Impact: Are Traditional Macro-Level Diffusion Models Appropriate? Ind. Mark. Manag. 2010, 39, 298–307. [Google Scholar] [CrossRef]
- Kohli, A.K. From the Editor: Reflections on the Review Process. J. Mark. 2011, 75, 1–4. [Google Scholar] [CrossRef]
- Dow, J.; da Costa Werlang, S.R. Uncertainty aversion, risk aversion, and the optimal choice of portfolio. Econom. J. Econom. Soc. 1992, 197–204. [Google Scholar] [CrossRef]
- Rabin, M. Risk aversion and expected-utility theory: A calibration theorem. In Handbook of the Fundamentals of Financial Decision Making: Part I; World Scientific: Singapore, 2013; pp. 241–252. [Google Scholar]
- Baranoff, E.; Brockett, P.; Kahane, Y. Risk Management for Enterprises and Individuals; Saylor Academy: Washington, DC, USA, 2012. [Google Scholar]
- Schoemaker, P.J.H. Experiments on Decisions under Risk: The Expected Utility Hypothesis; Springer: Dordrecht, The Netherlands, 1980. [Google Scholar]
- Feller, W. An Introduction to Probability Theory and Its Applications; John Wiley: New York, NY, USA; London, UK; Sydney, Australia, 1978. [Google Scholar]
- Briggs, R. Normative Theories of Rational Choice: Expected Utility. In The Stanford Encyclopedia of Philosophy, Fall 2019 ed.; Stanford University: Stanford, CA, USA, 2019; Available online: https://plato.stanford.edu/archives/fall2019/entries/rationality-normative-utility/ (accessed on 7 November 2021).
Figure 1.
Graphical representation of the model derivatives adapted from Parvin and Beruvides [49].
Figure 1.
Graphical representation of the model derivatives adapted from Parvin and Beruvides [49].

Figure 2.
Example of a technological innovation’s fitted raw diffusion data and fitted Bass and logistic models, at full maturation.
Figure 2.
Example of a technological innovation’s fitted raw diffusion data and fitted Bass and logistic models, at full maturation.

Figure 3.
Example of a technological innovation’s fitted raw diffusion data and fitted Bass and logistic models, at 50% of its lifecycle (respective to full lifecycle maturation).
Figure 3.
Example of a technological innovation’s fitted raw diffusion data and fitted Bass and logistic models, at 50% of its lifecycle (respective to full lifecycle maturation).

Figure 4.
Bass model percent-error at each lifecycle percentage bound (defined in Section 3.2), shown in relation to maximum diffusion rate at full maturation for each technological innovation.
Figure 4.
Bass model percent-error at each lifecycle percentage bound (defined in Section 3.2), shown in relation to maximum diffusion rate at full maturation for each technological innovation.

Figure 5.
Logistic model percent-error at each lifecycle percentage bound (defined in Section 3.2), shown in relation to maximum diffusion rate at full maturation for each technological innovation.
Figure 5.
Logistic model percent-error at each lifecycle percentage bound (defined in Section 3.2), shown in relation to maximum diffusion rate at full maturation for each technological innovation.

Figure 6.
Bass model percent-error inclusive quartile box plot, shown with outliers represented as •. Mean represented by x.
Figure 6.
Bass model percent-error inclusive quartile box plot, shown with outliers represented as •. Mean represented by x.

Figure 7.
Logistic model percent-error inclusive quartile box plot, shown with outliers represented as •. Mean represented by x.
Figure 7.
Logistic model percent-error inclusive quartile box plot, shown with outliers represented as •. Mean represented by x.

Figure 8.
Histograms of the logistic and Bass model’s percent-error at each percentage step.


Table 1.
Logistic model derivatives.
| Logistic model equation | |
| 1st derivative | |
| 2nd derivative |
Table 2.
Bass model derivatives.
| Bass model equation | |
| 1st derivative | |
| 2nd derivative |
Table 3.
Resultant logistic model RMSE descriptive statistics, established and adopted from Parvin and Beruvides [4].
Table 3.
Resultant logistic model RMSE descriptive statistics, established and adopted from Parvin and Beruvides [4].
| Count | Mean RMSE | Standard Deviation | Median RMSE | Min RMSE | Max RMSE | RMSE Skewness | RMSE Kurtosis |
|---|---|---|---|---|---|---|---|
| 42 | 0.786 | 0.145 | 0.802 | 0.450 | 1.086 | –0.250 | –0.574 |
Table 4.
Resultant Bass model RMSE descriptive statistics.
| Count | Mean RMSE | Standard Deviation | Median RMSE | Min RMSE | Max RMSE | RMSE Skewness | RMSE Kurtosis |
|---|---|---|---|---|---|---|---|
| 42 | 0.778 | 0.148 | 0.768 | 0.425 | 1.011 | –0.375 | –0.774 |
Table 5.
Resultant maximum diffusion rates of model fit, fully matured dataset, expanded and adapted from Parvin and Beruvides [4].
Table 5.
Resultant maximum diffusion rates of model fit, fully matured dataset, expanded and adapted from Parvin and Beruvides [4].
| # | Technological Innovation | Logistic Model Max Diffusion Rate | Bass Model Max Diffusion Rate | Percent Difference |
|---|---|---|---|---|
| 1 | Air Conditioning | 2.22 | 2.10 | 5.56 |
| 2 | Automatic Transmission | 4.53 | 4.63 | 2.18 |
| 3 | Automobile | 1.44 | 1.49 | 3.41 |
| 4 | Automobile Air Conditioning | 7.94 | 7.90 | 0.51 |
| 5 | Automobile Disk Brakes | 16.14 | 15.64 | 3.15 |
| 6 | Automobile Electronic Ignition | 34.67 | 34.74 | 0.20 |
| 7 | Automobile Fuel Injection | 13.31 | 13.30 | 0.08 |
| 8 | Blast Oxygen Furnace | 11.39 | 11.09 | 2.67 |
| 9 | Broadband Internet | 8.37 | 8.05 | 3.90 |
| 10 | Cellular Phone | 6.16 | 6.49 | 5.22 |
| 11 | Chlorine-Free Paper Production | 10.70 | 10.52 | 1.70 |
| 12 | Color Television | 6.03 | 5.68 | 5.98 |
| 13 | Diesel Locomotive | 9.22 | 9.24 | 0.22 |
| 14 | Digital Camera | 10.45 | 10.26 | 1.83 |
| 15 | Digital Computer | 4.82 | 4.77 | 1.04 |
| 16 | DVD | 15.17 | 14.49 | 4.59 |
| 17 | DVR | 13.89 | 13.80 | 0.65 |
| 18 | Electric Clothes Dryer | 2.21 | 2.18 | 1.37 |
| 19 | Electric Clothes Washer | 1.60 | 1.63 | 1.86 |
| 20 | Electric Dishwasher | 1.40 | 1.36 | 2.90 |
| 21 | Front Wheel Drive | 8.62 | 8.33 | 3.42 |
| 22 | Gas Range/Stove | 2.09 | 2.16 | 3.29 |
| 23 | HDTV | 16.85 | 17.00 | 0.89 |
| 24 | Internet | 4.96 | 5.23 | 5.30 |
| 25 | Lockup Automatic Transmission | 5.52 | 8.35 | 40.81 |
| 26 | Medical MRI Units | 3.23 | 3.10 | 4.11 |
| 27 | Microwave Oven | 6.29 | 5.89 | 6.57 |
| 28 | Mobile PC | 4.64 | 4.64 | 0.00 |
| 29 | MP3 Player | 12.29 | 11.74 | 4.58 |
| 30 | Multi-Valve Engine (% of cars equipped) | 4.11 | 5.55 | 29.81 |
| 31 | Power Steering | 5.49 | 5.48 | 0.18 |
| 32 | Radial Tire | 21.55 | 20.43 | 5.34 |
| 33 | Refrigerator | 4.49 | 4.37 | 2.71 |
| 34 | Residential Electric power | 2.74 | 2.98 | 8.39 |
| 35 | Smart Meter | 9.01 | 9.09 | 0.88 |
| 36 | Smartphone | 10.59 | 10.46 | 1.24 |
| 37 | Tablet | 11.57 | 11.21 | 3.16 |
| 38 | Telephone (Landline) | 1.32 | 1.51 | 13.43 |
| 39 | TV | 9.20 | 11.83 | 25.01 |
| 40 | Vacuum Cleaner | 2.39 | 2.44 | 2.07 |
| 41 | Variable Valve Timing Automobile | 6.69 | 6.64 | 0.75 |
| 42 | VCR | 8.14 | 9.01 | 10.15 |
Table 6.
Bass model percent-error statistical characteristic per lifecycle percentage used.
| 50% Lifecycle | 60% Lifecycle | 70% Lifecycle | 80% Lifecycle | 90% Lifecycle | |
|---|---|---|---|---|---|
| Mean | 13.74 | 12.30 | 1.44 | −0.11 | −2.15 |
| Standard Error | 8.03 | 7.54 | 2.67 | 2.29 | 0.76 |
| Median | 0.73 | 2.93 | −0.55 | −2.15 | −1.97 |
| Standard Deviation | 52.04 | 48.86 | 17.31 | 14.83 | 4.92 |
| Sample Variance | 2708.58 | 2387.19 | 299.70 | 219.81 | 24.24 |
| Kurtosis | 12.95 | 14.50 | 1.51 | 9.64 | 1.87 |
| Skewness | 3.01 | 3.28 | 0.81 | 2.40 | −0.66 |
| Range | 310.14 | 295.81 | 88.55 | 91.05 | 25.01 |
| Minimum | −44.17 | −41.93 | −32.70 | −25.16 | −16.09 |
| Maximum | 265.97 | 253.88 | 55.85 | 65.90 | 8.92 |
| Sum | 577.27 | 516.73 | 60.42 | −4.49 | −90.17 |
| Count | 42 | 42 | 42 | 42 | 42 |
| First Quartile | −11.13 | −13.32 | −9.32 | −7.40 | −4.40 |
| Second Quartile | 0.73 | 2.93 | −0.55 | −2.15 | −1.97 |
| Third Quartile | 23.86 | 19.61 | 9.48 | 3.59 | 0.94 |
Table 7.
Logistic model percent-error statistical characteristic per lifecycle percentage used.
| 50% Lifecycle | 60% Lifecycle | 70% Lifecycle | 80% Lifecycle | 90% Lifecycle | |
|---|---|---|---|---|---|
| Mean | 28.17 | 23.05 | 6.65 | 2.31 | −1.36 |
| Standard Error | 9.82 | 9.31 | 3.03 | 2.30 | 0.71 |
| Median | 14.21 | 7.99 | 4.48 | 0.68 | −1.08 |
| Standard Deviation | 63.61 | 60.32 | 19.66 | 14.92 | 4.57 |
| Sample Variance | 4046.19 | 3638.17 | 386.53 | 222.52 | 20.92 |
| Kurtosis | 7.88 | 10.03 | 0.73 | 9.88 | 1.77 |
| Skewness | 2.54 | 2.96 | 0.62 | 2.35 | −0.85 |
| Range | 339.76 | 320.26 | 99.04 | 94.74 | 22.08 |
| Minimum | −53.43 | −47.48 | −37.84 | −24.76 | −14.64 |
| Maximum | 286.33 | 272.79 | 61.20 | 69.98 | 7.45 |
| Sum | 1183.23 | 967.93 | 279.47 | 96.83 | −57.21 |
| Count | 42 | 42 | 42 | 42 | 42 |
| First Quartile | −3.54 | −8.69 | −6.41 | −5.33 | −3.11 |
| Second Quartile | 14.21 | 7.99 | 4.48 | 0.68 | −1.08 |
| Third Quartile | 38.32 | 29.78 | 17.19 | 5.42 | 1.23 |
Publisher’s Note: MDPI stays neutral with regard to jurisdictional claims in published maps and institutional affiliations. |
© 2022 by the authors. Licensee MDPI, Basel, Switzerland. This article is an open access article distributed under the terms and conditions of the Creative Commons Attribution (CC BY) license (https://creativecommons.org/licenses/by/4.0/).
Share and Cite
MDPI and ACS Style
Parvin, A.J., Jr.; Beruvides, M.G.; Tercero-Gómez, V.G. In Situ Technological Innovation Diffusion Rate Accuracy Assessment. Systems 2022, 10, 25. https://0-doi-org.brum.beds.ac.uk/10.3390/systems10020025
AMA Style
Parvin AJ Jr., Beruvides MG, Tercero-Gómez VG. In Situ Technological Innovation Diffusion Rate Accuracy Assessment. Systems. 2022; 10(2):25. https://0-doi-org.brum.beds.ac.uk/10.3390/systems10020025
Chicago/Turabian StyleParvin, Albert Joseph, Jr., Mario G. Beruvides, and Víctor Gustavo Tercero-Gómez. 2022. "In Situ Technological Innovation Diffusion Rate Accuracy Assessment" Systems 10, no. 2: 25. https://0-doi-org.brum.beds.ac.uk/10.3390/systems10020025
Note that from the first issue of 2016, this journal uses article numbers instead of page numbers. See further details here.