
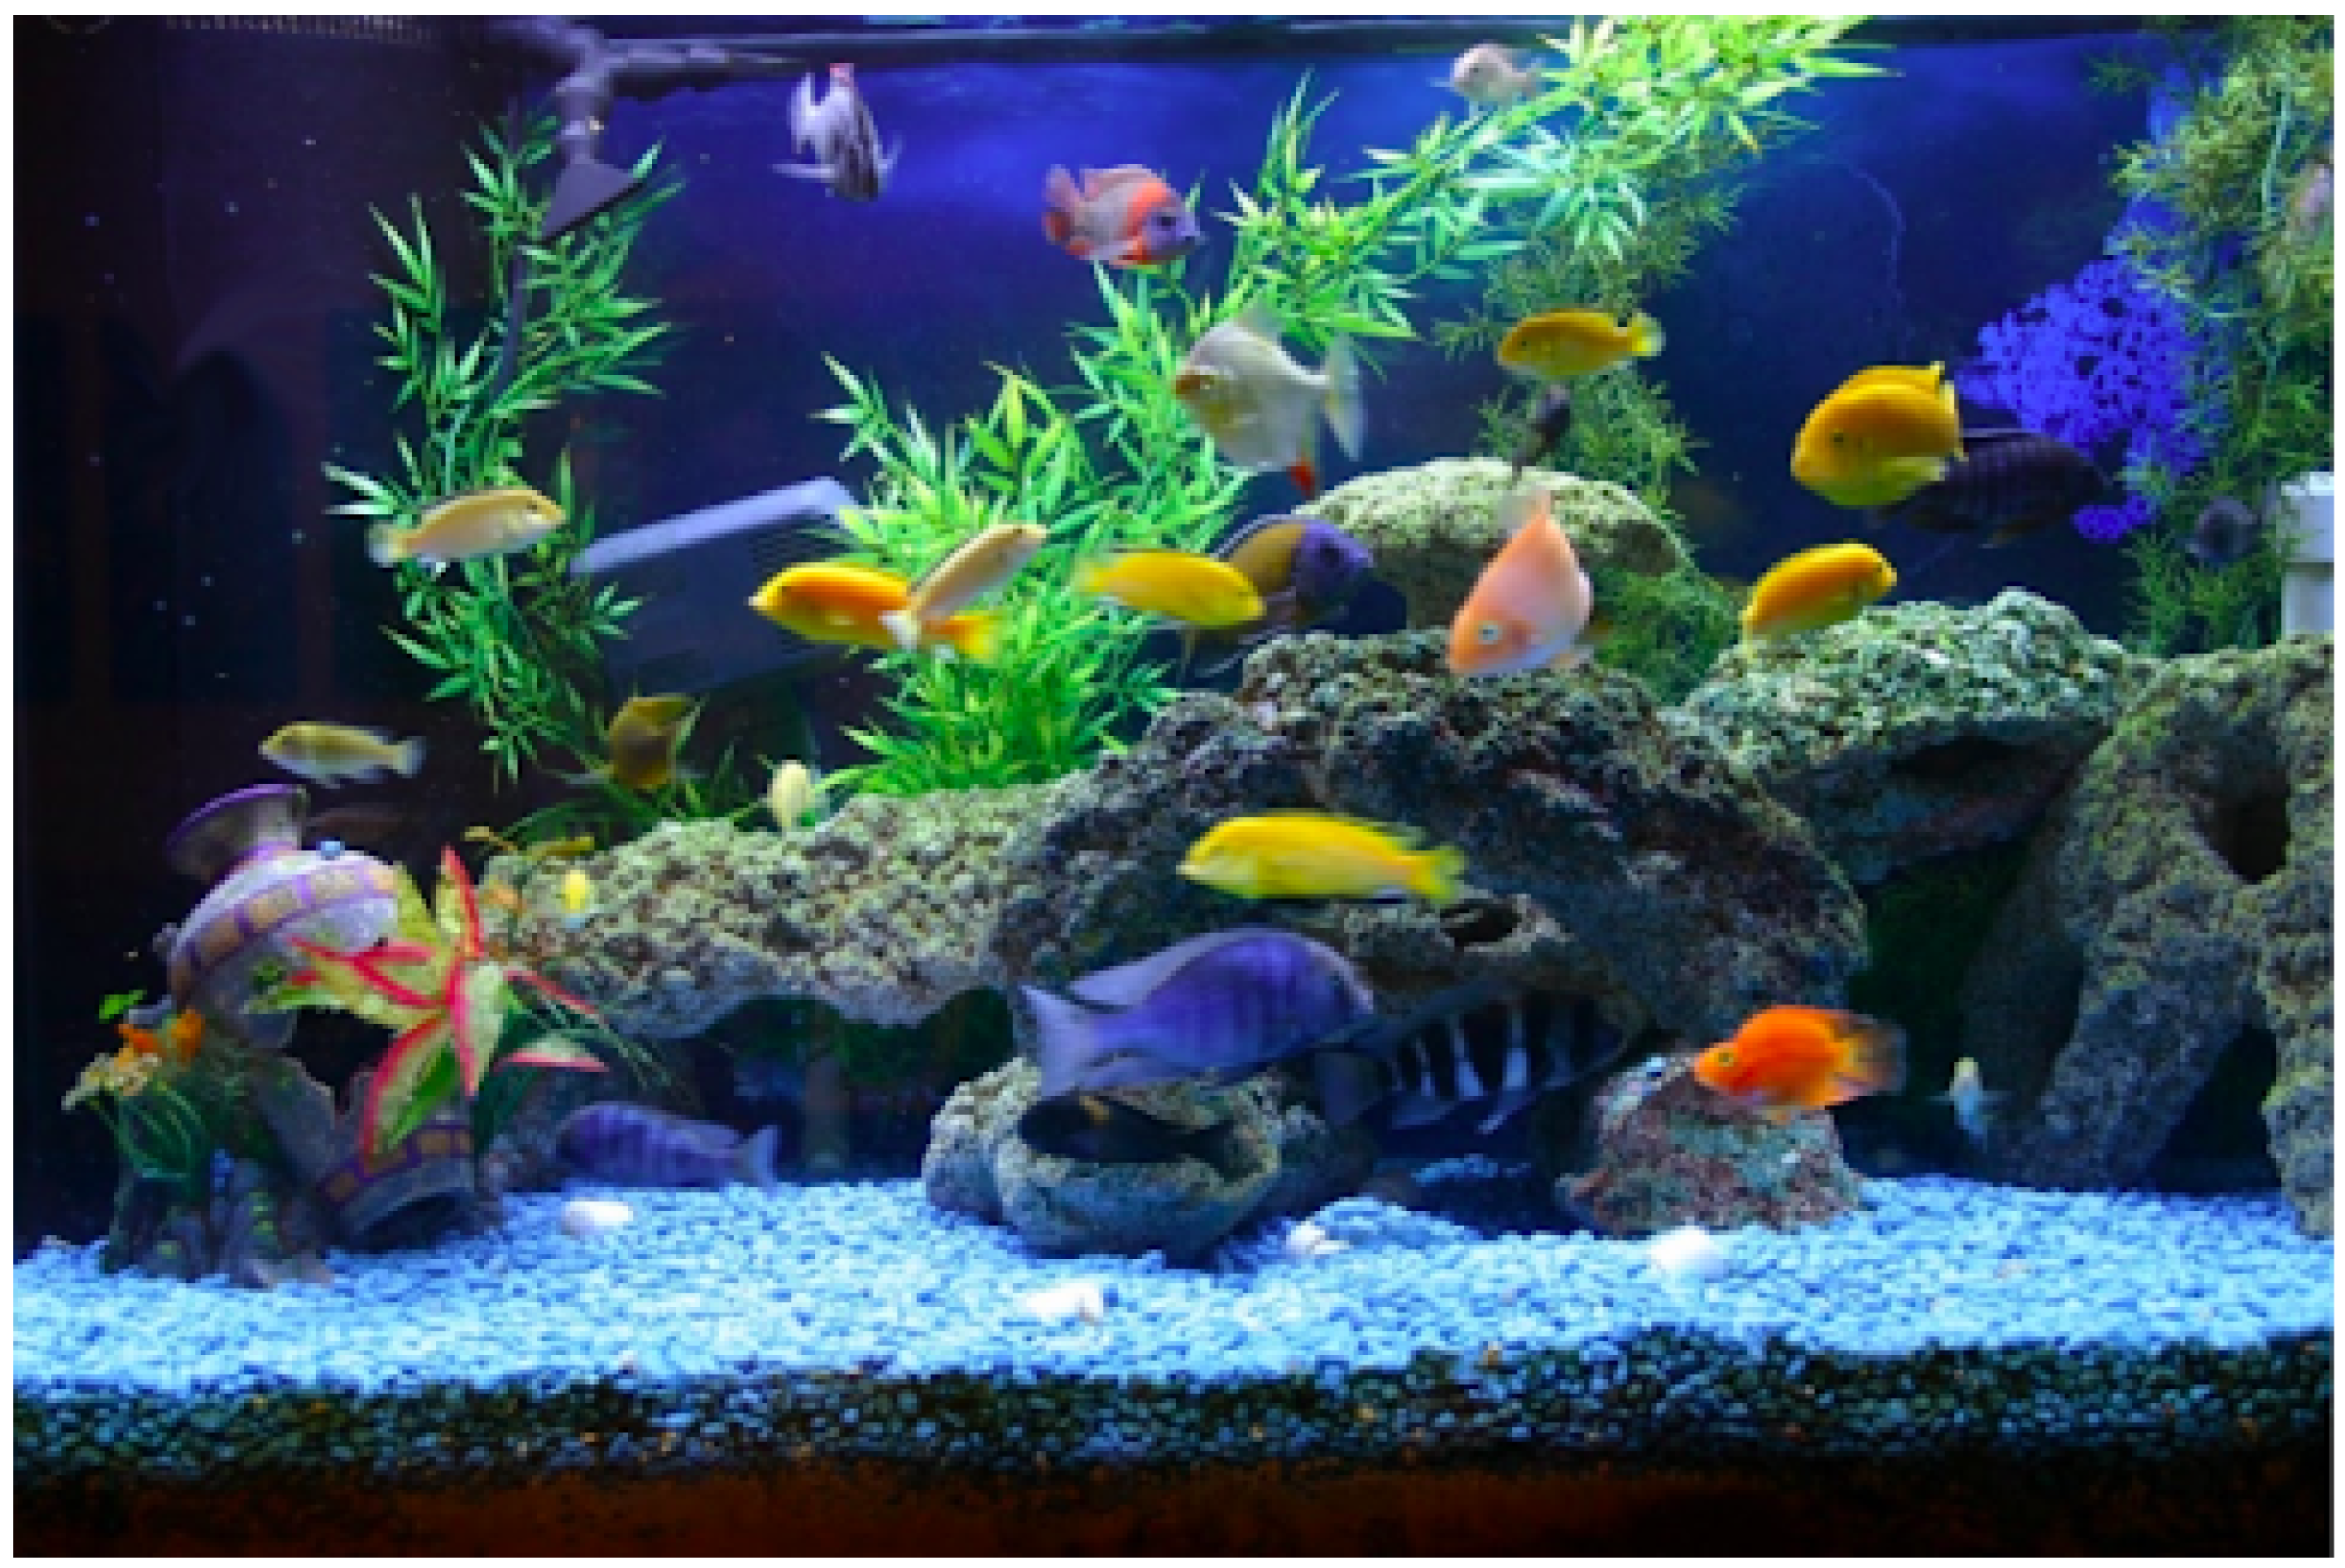
The “Fish Tank” Experiments: Metacognitive Awareness of Distinctions, Systems, Relationships, and Perspectives (DSRP) Significantly Increases Cognitive Complexity


Abstract
:1. Introduction
| “the ways is/is not , , and from determines and .” |
Since Cabrera’s first writings, we now have the benefit of over 20 years of hindsight on the possible start of a fourth wave (which is as long as the gap between the first and second waves, and twice as long as the gap between the second and third waves). During those years, we have seen considerable testing of Cabrera’s DSRP Theory, including: (1) a burgeoning amount of empirical evidence (at least as much as has been offered in the previous waves); (2) substantial private sector funding to develop tools for systems thinking; (3) substantial public funding for research; (4) a substantial peer review and publication history, sizeable citation histories, including several special issues dedicated to DSRP; (5) considerable public exposure and critique; (6) public adoption; (7) high attendance annual conferences; institutional recognition and support; and (9) as yet, few competitor theories (at least, none that have been explicated and communicated to the same degree).
The Importance of Metacognition in Systems Thinking
“According to Georghiades (2004), being aware of one’s cognition was already been mentioned by Plato. Likewise, Aristotle pointed out that mind used a different power above and beyond seeing and hearing and thus laid the foundations for thinking about metacognition long before (Sandí-Ureña, 2008) [159].”
2. Methods
3. Results
“We found support for both hypotheses”.
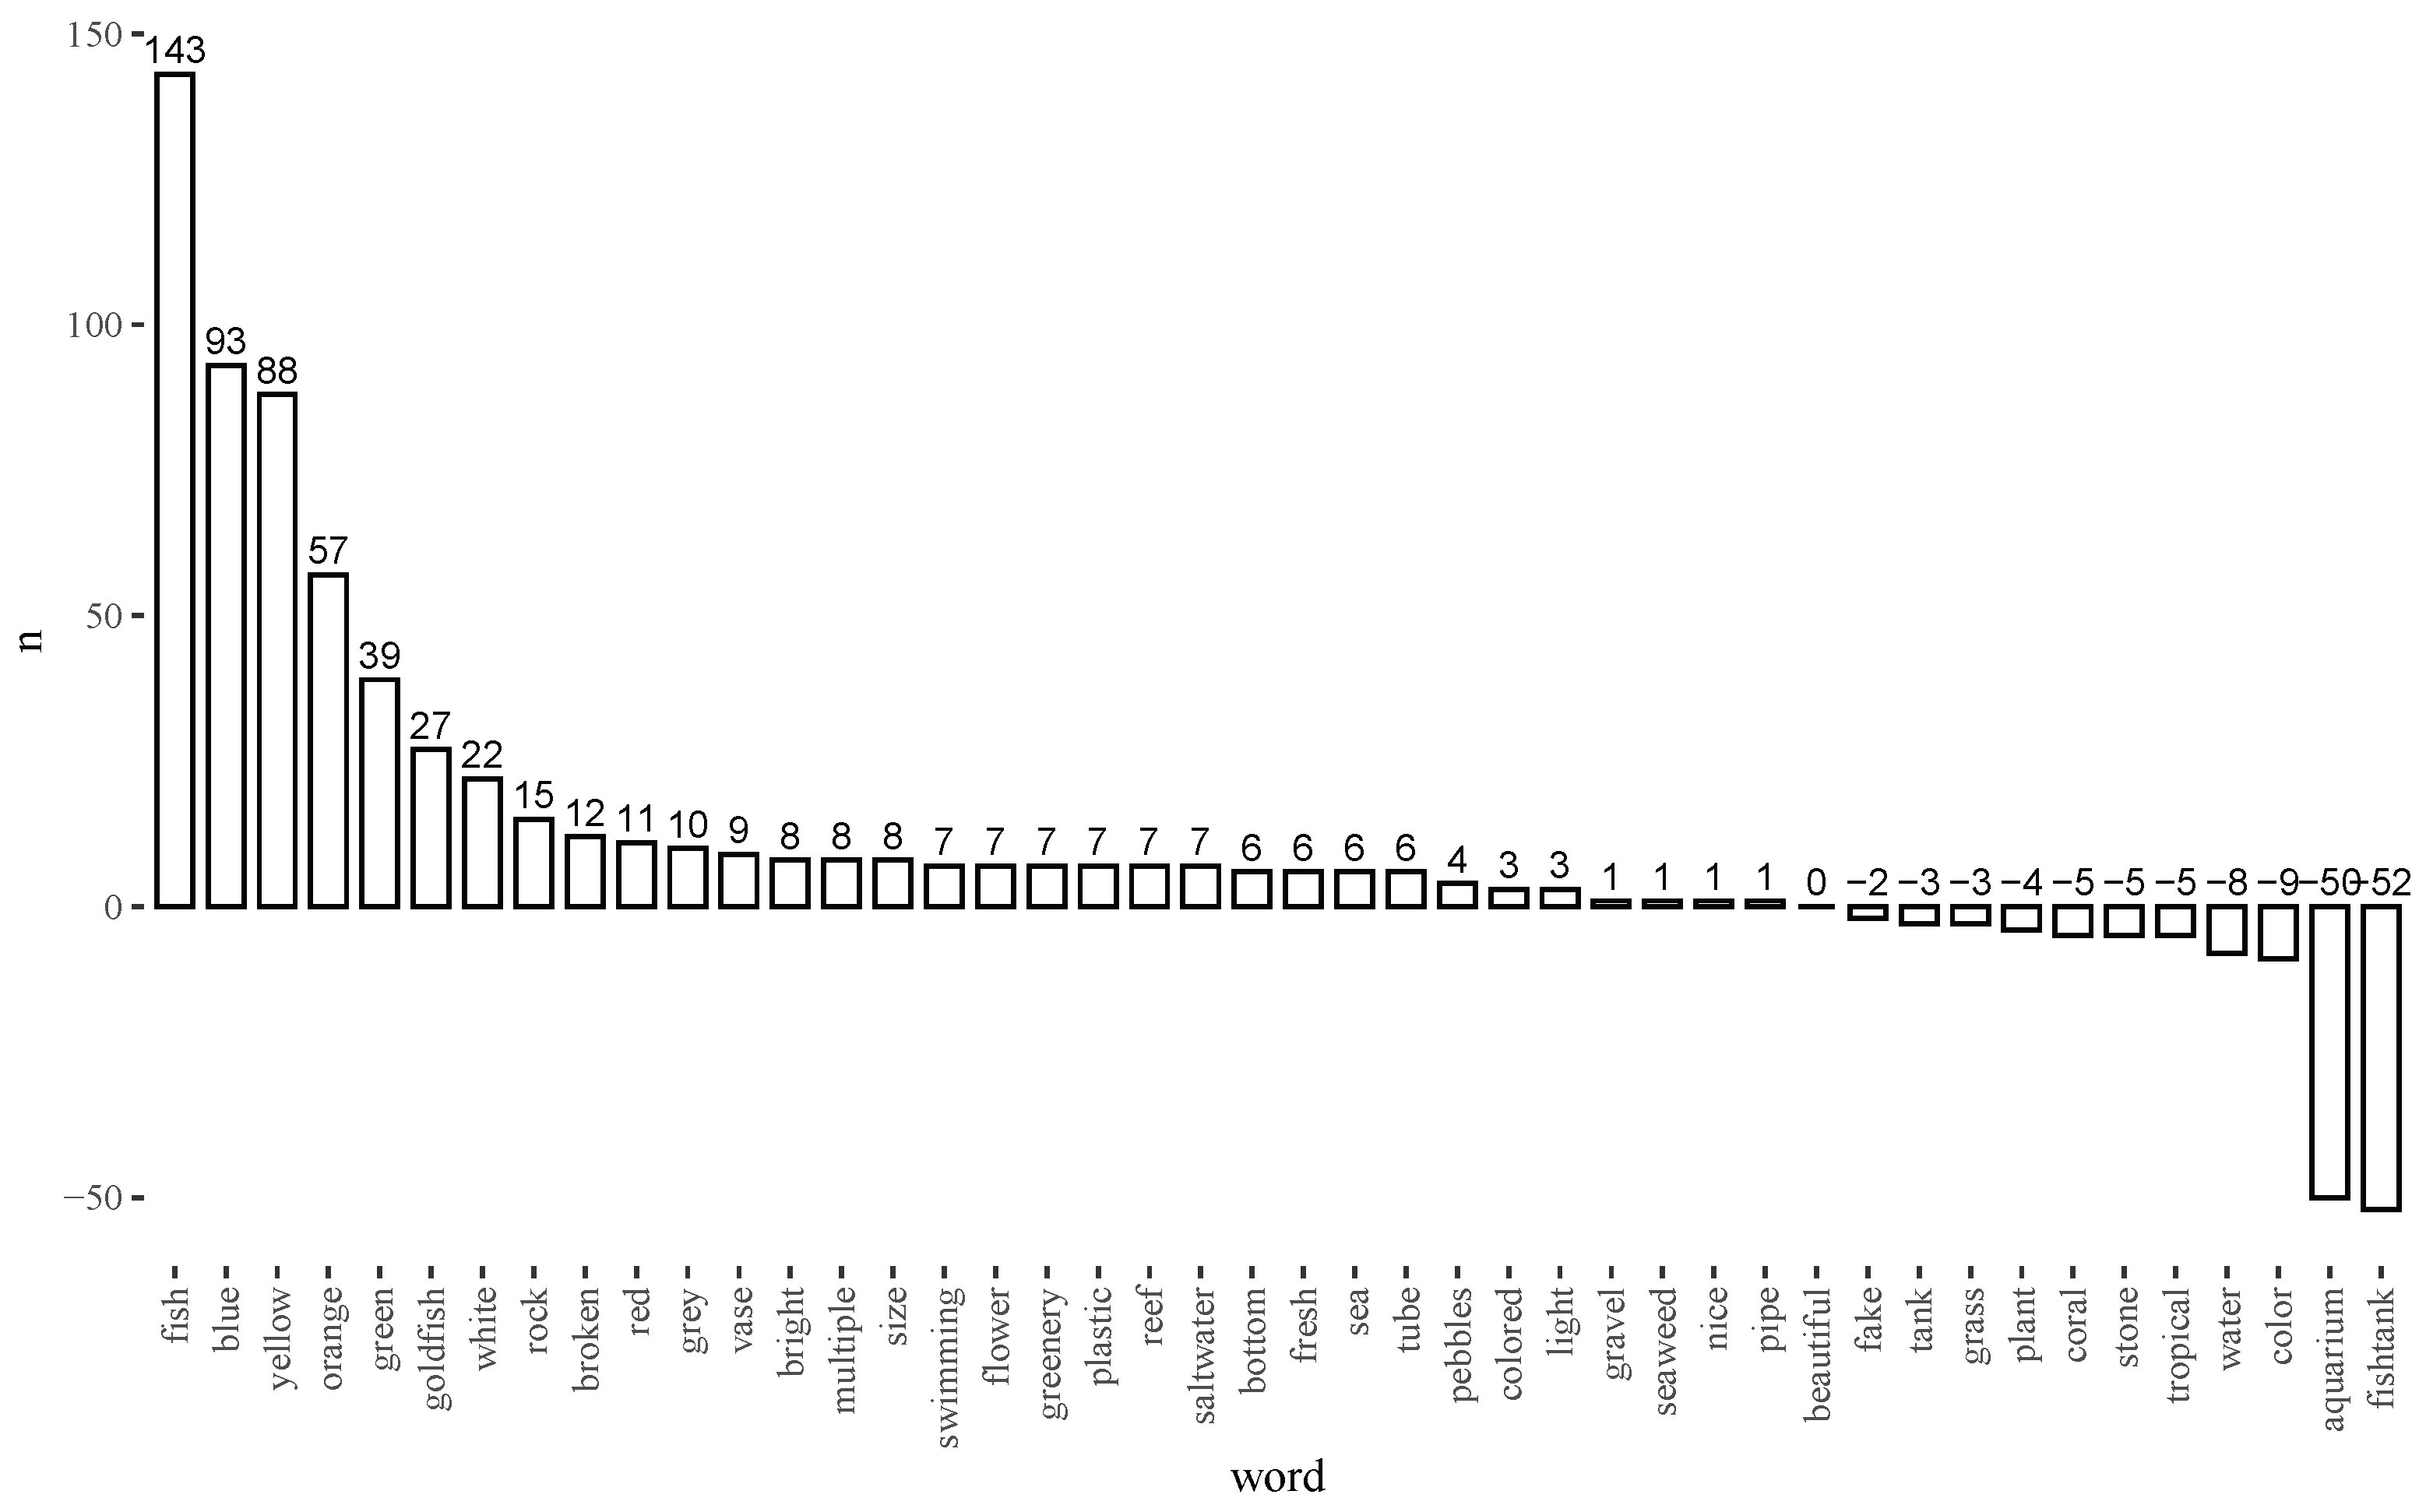
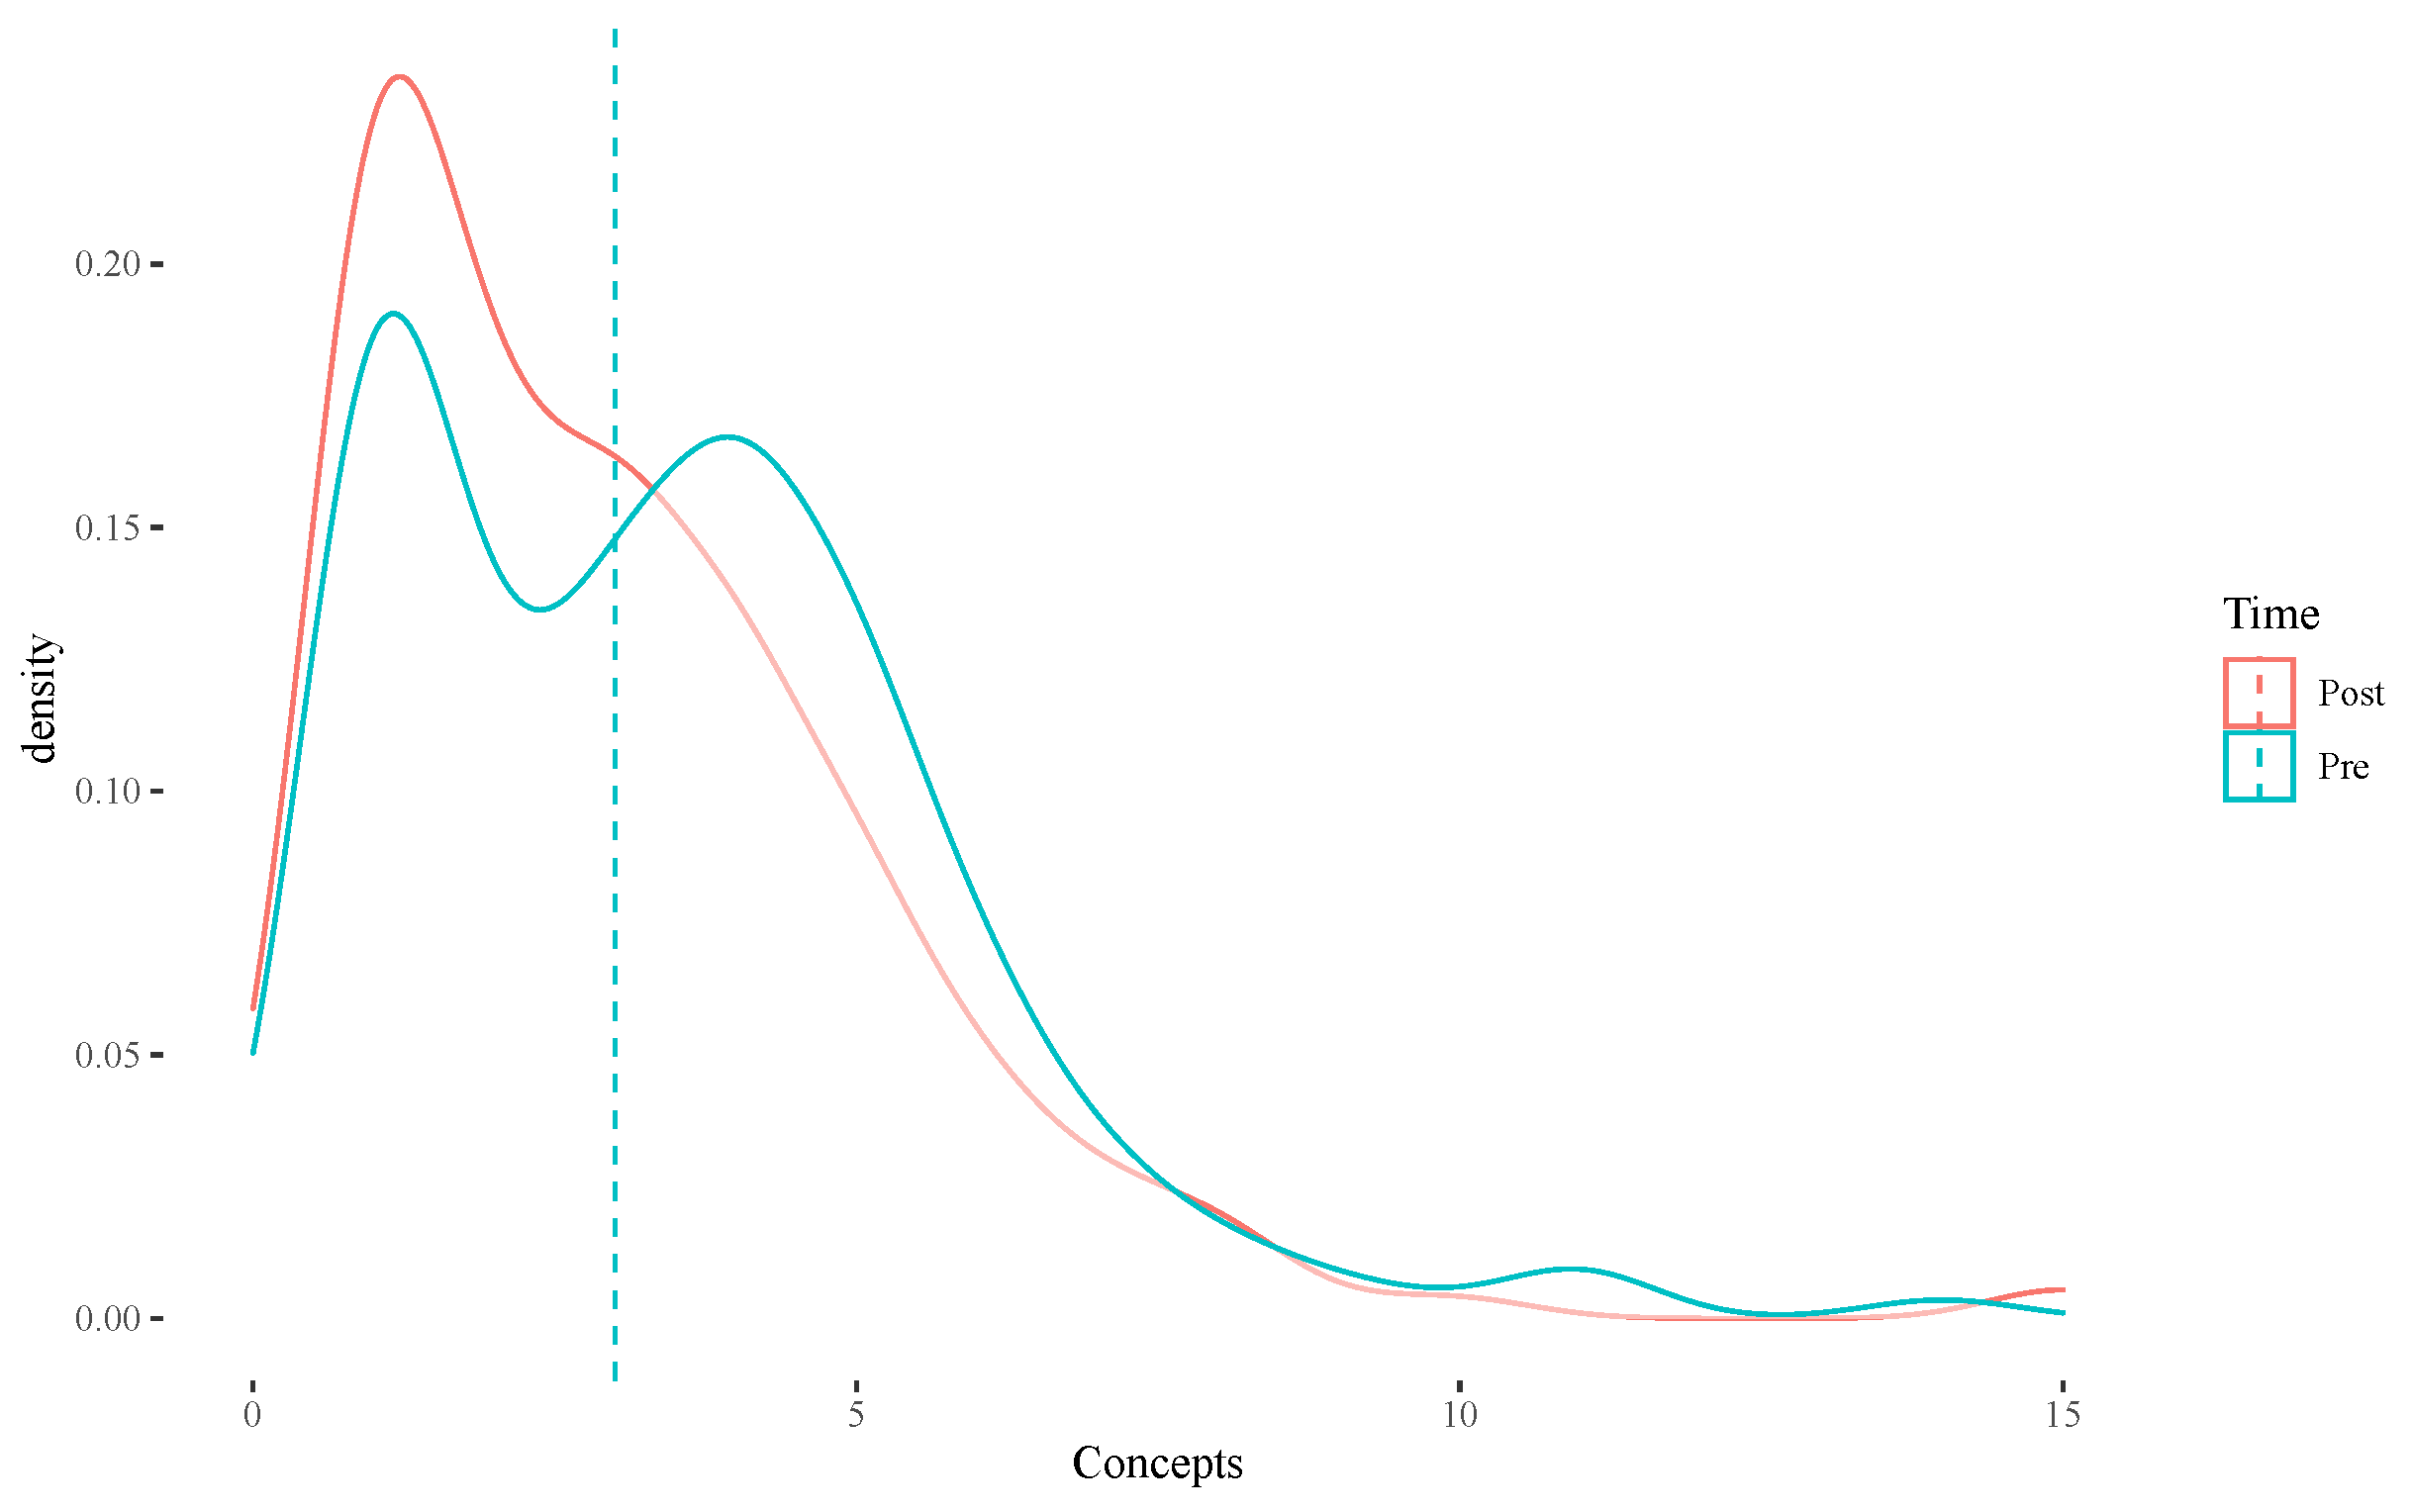
3.1. Distinctions
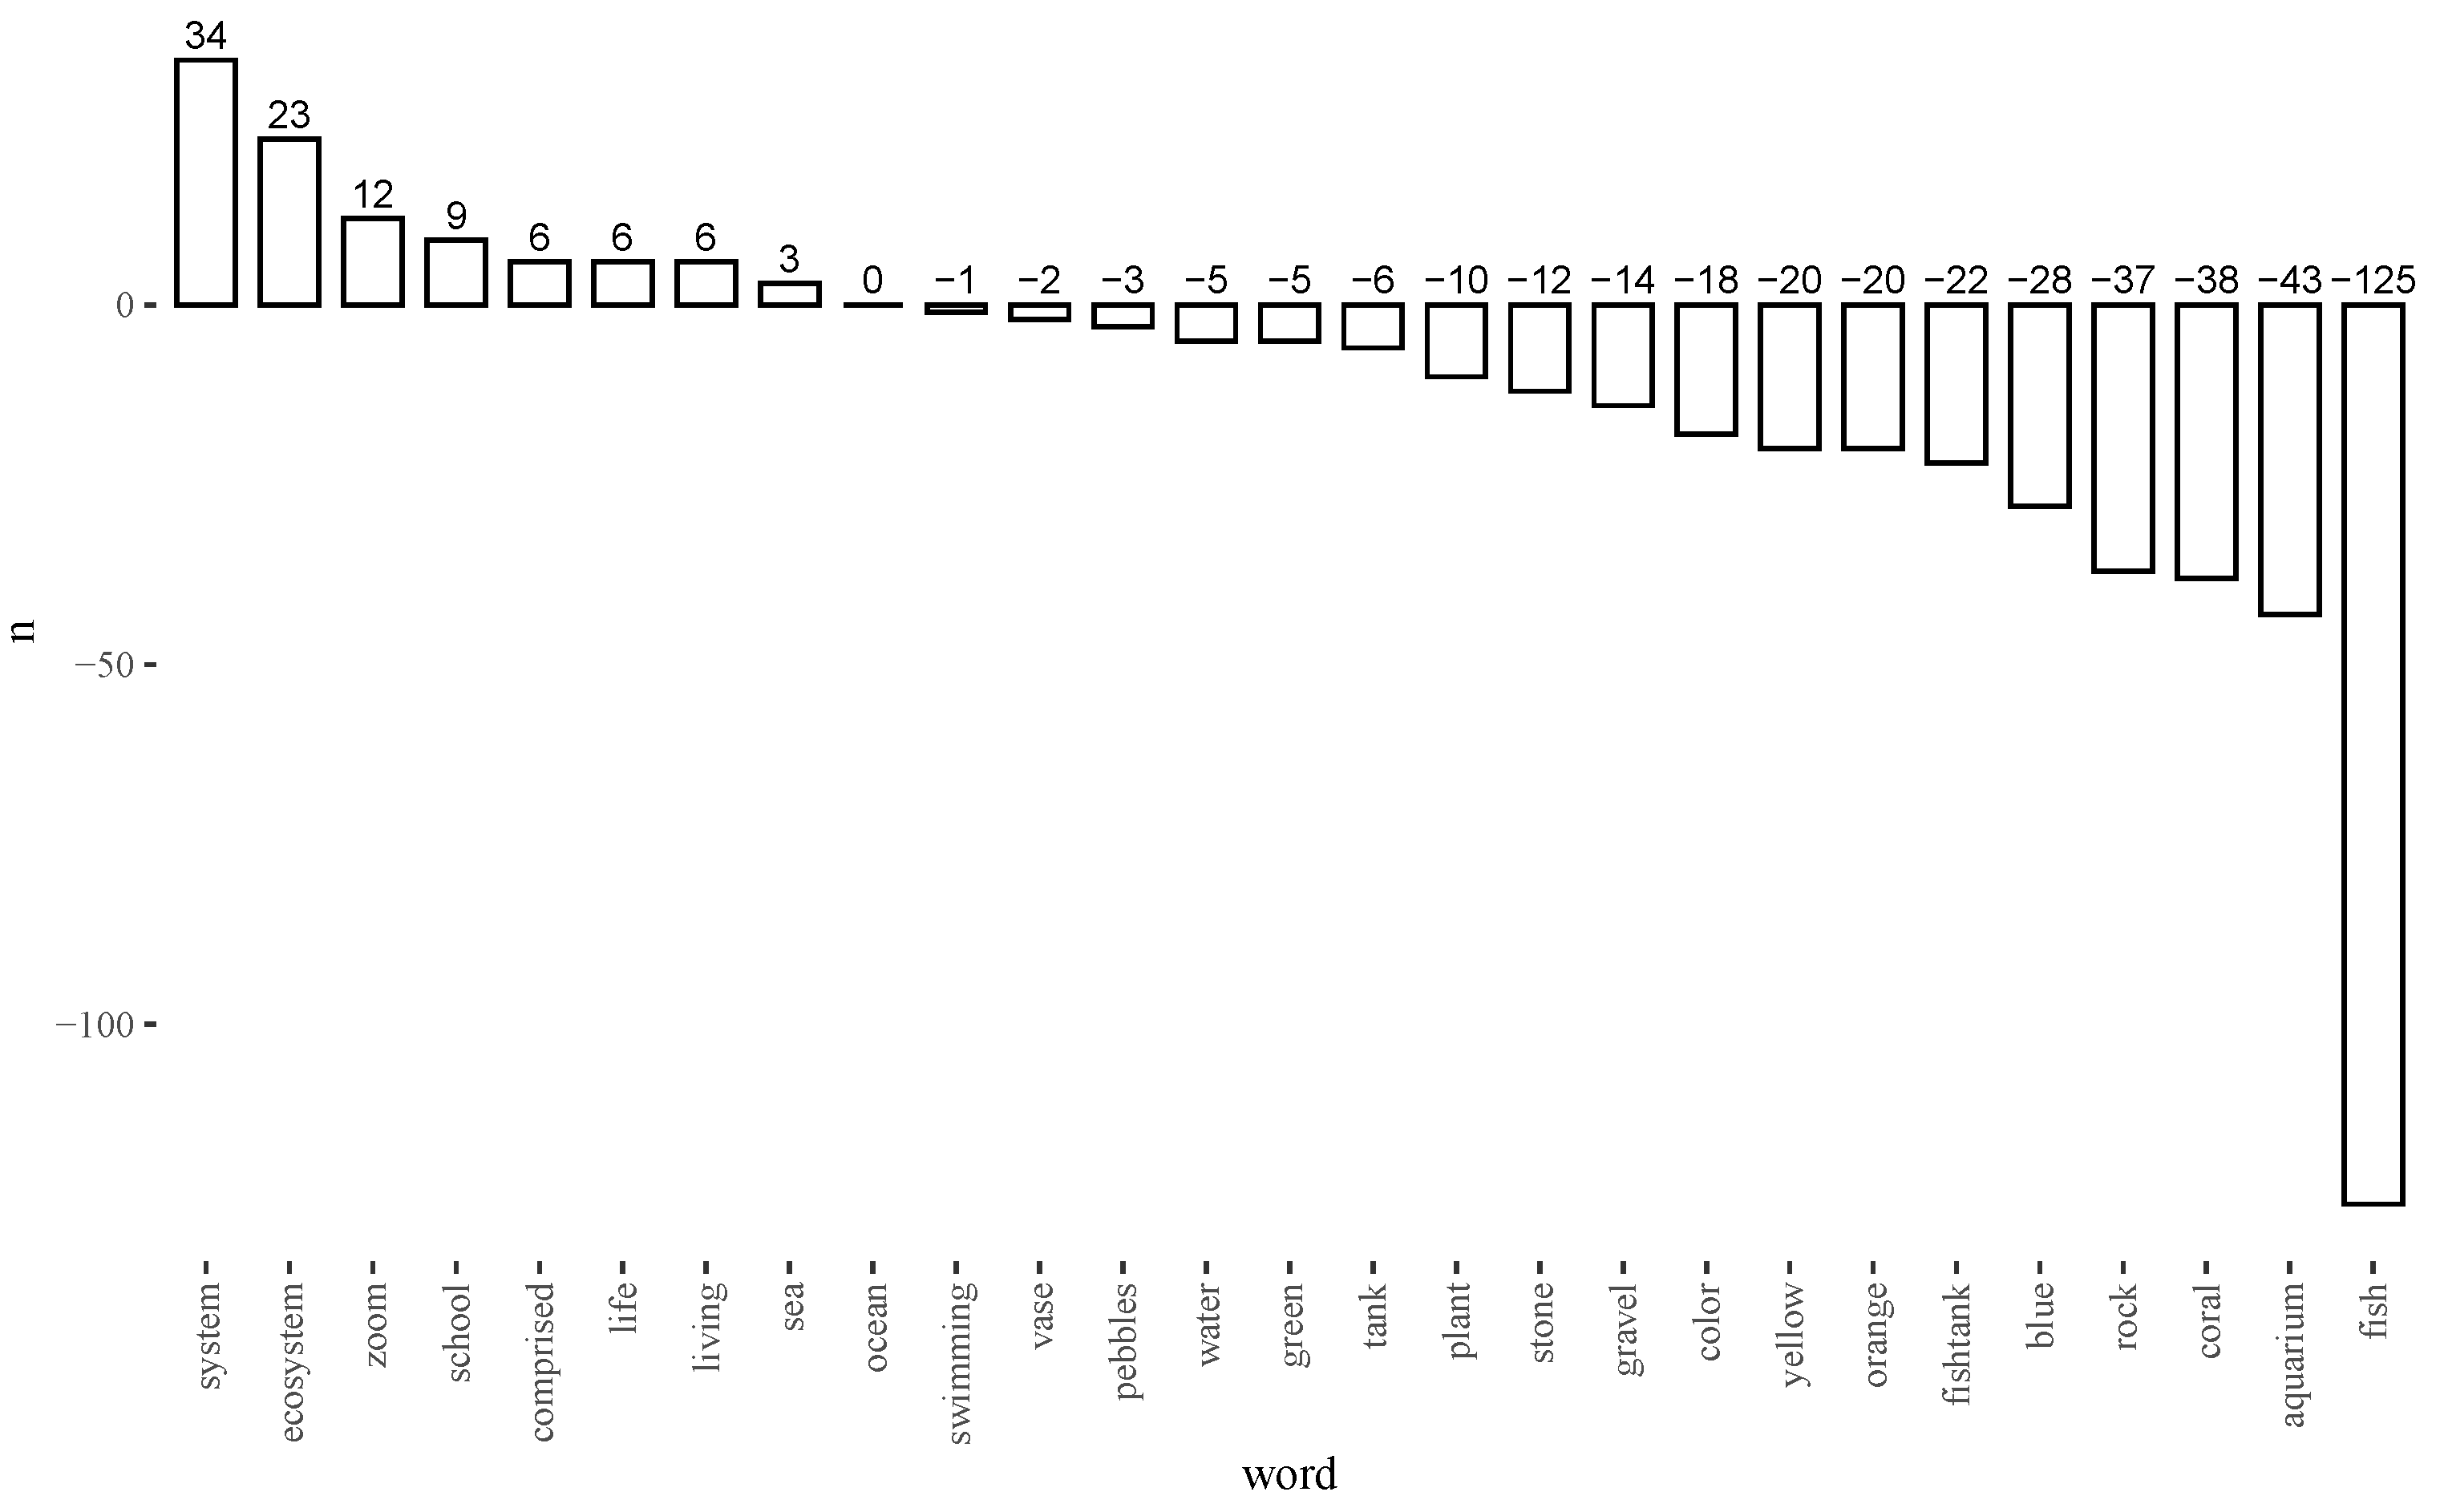
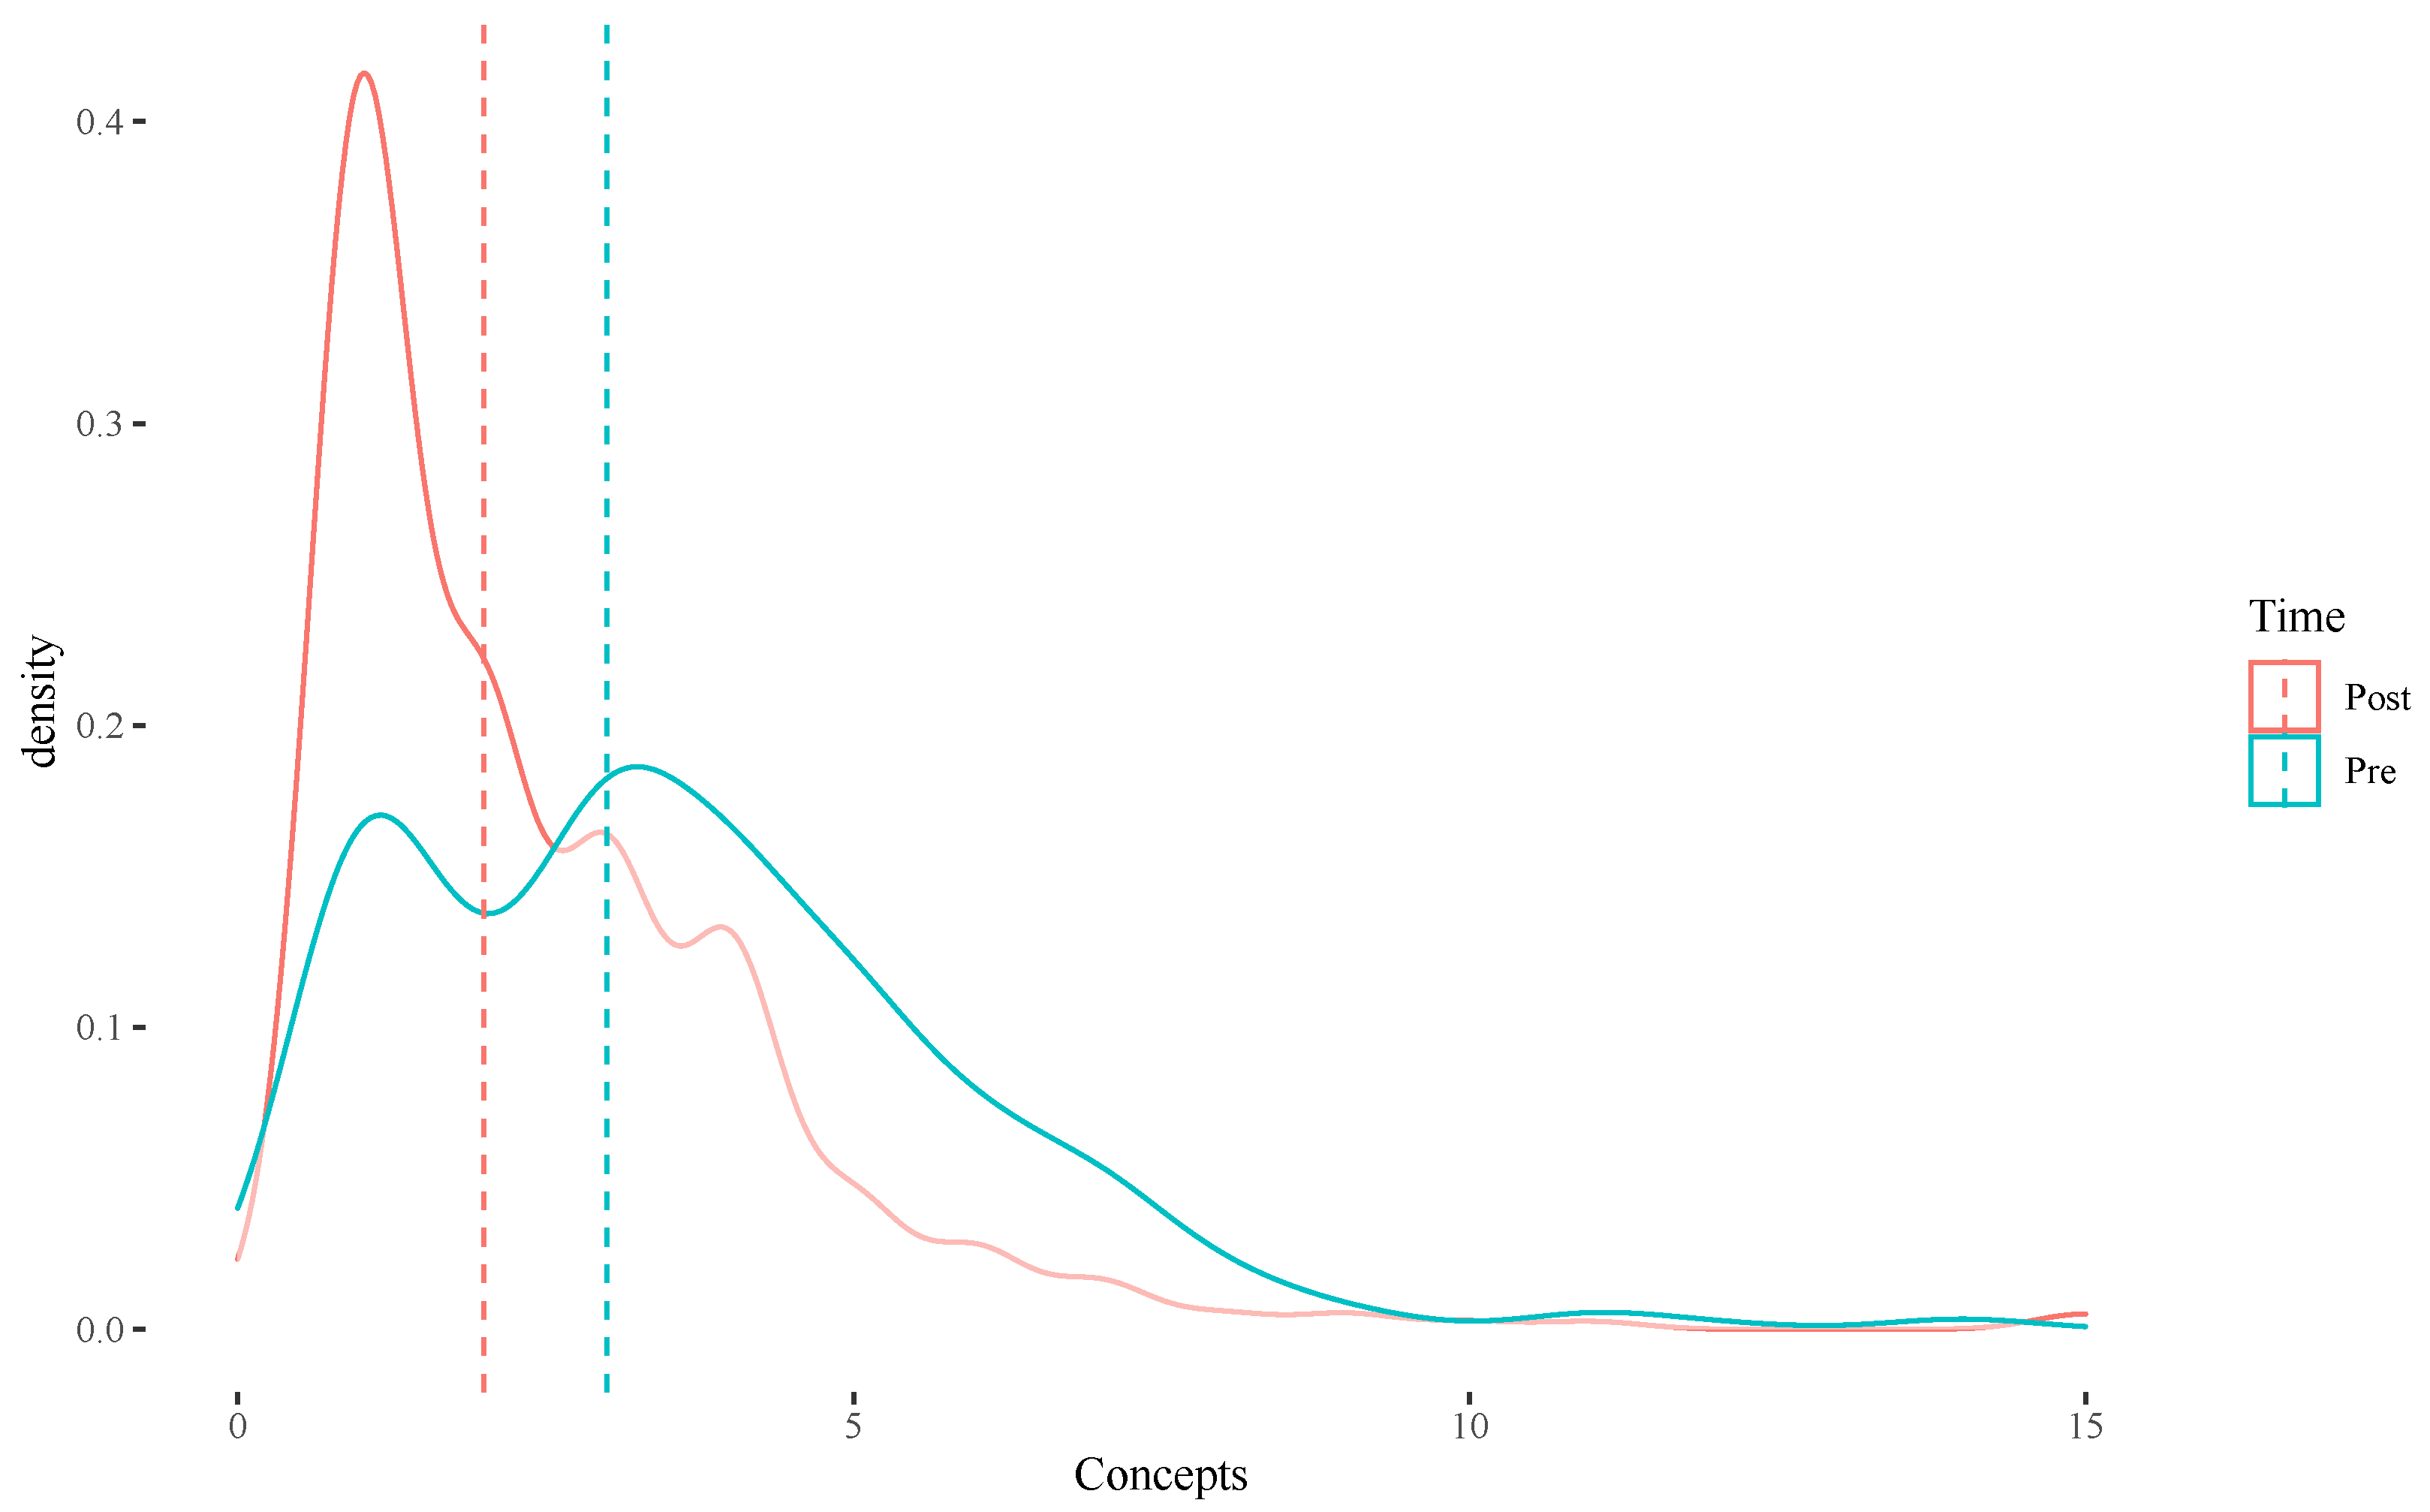
3.2. Systems
3.3. Relationships
3.4. Perspectives
4. Discussion
- 1.
- The treatment is something entirely random such as: Look for orange things such as Cheetos, oranges, basketballs, pumpkins or things that remind you of Cheetos, oranges, basketballs, pumpkins, etc.
- 2.
- The treatment is something more purposefully cognitive and structural such as: consider the polarizing arguments that could be made about the scene.
4.1. Distinctions
4.2. Systems
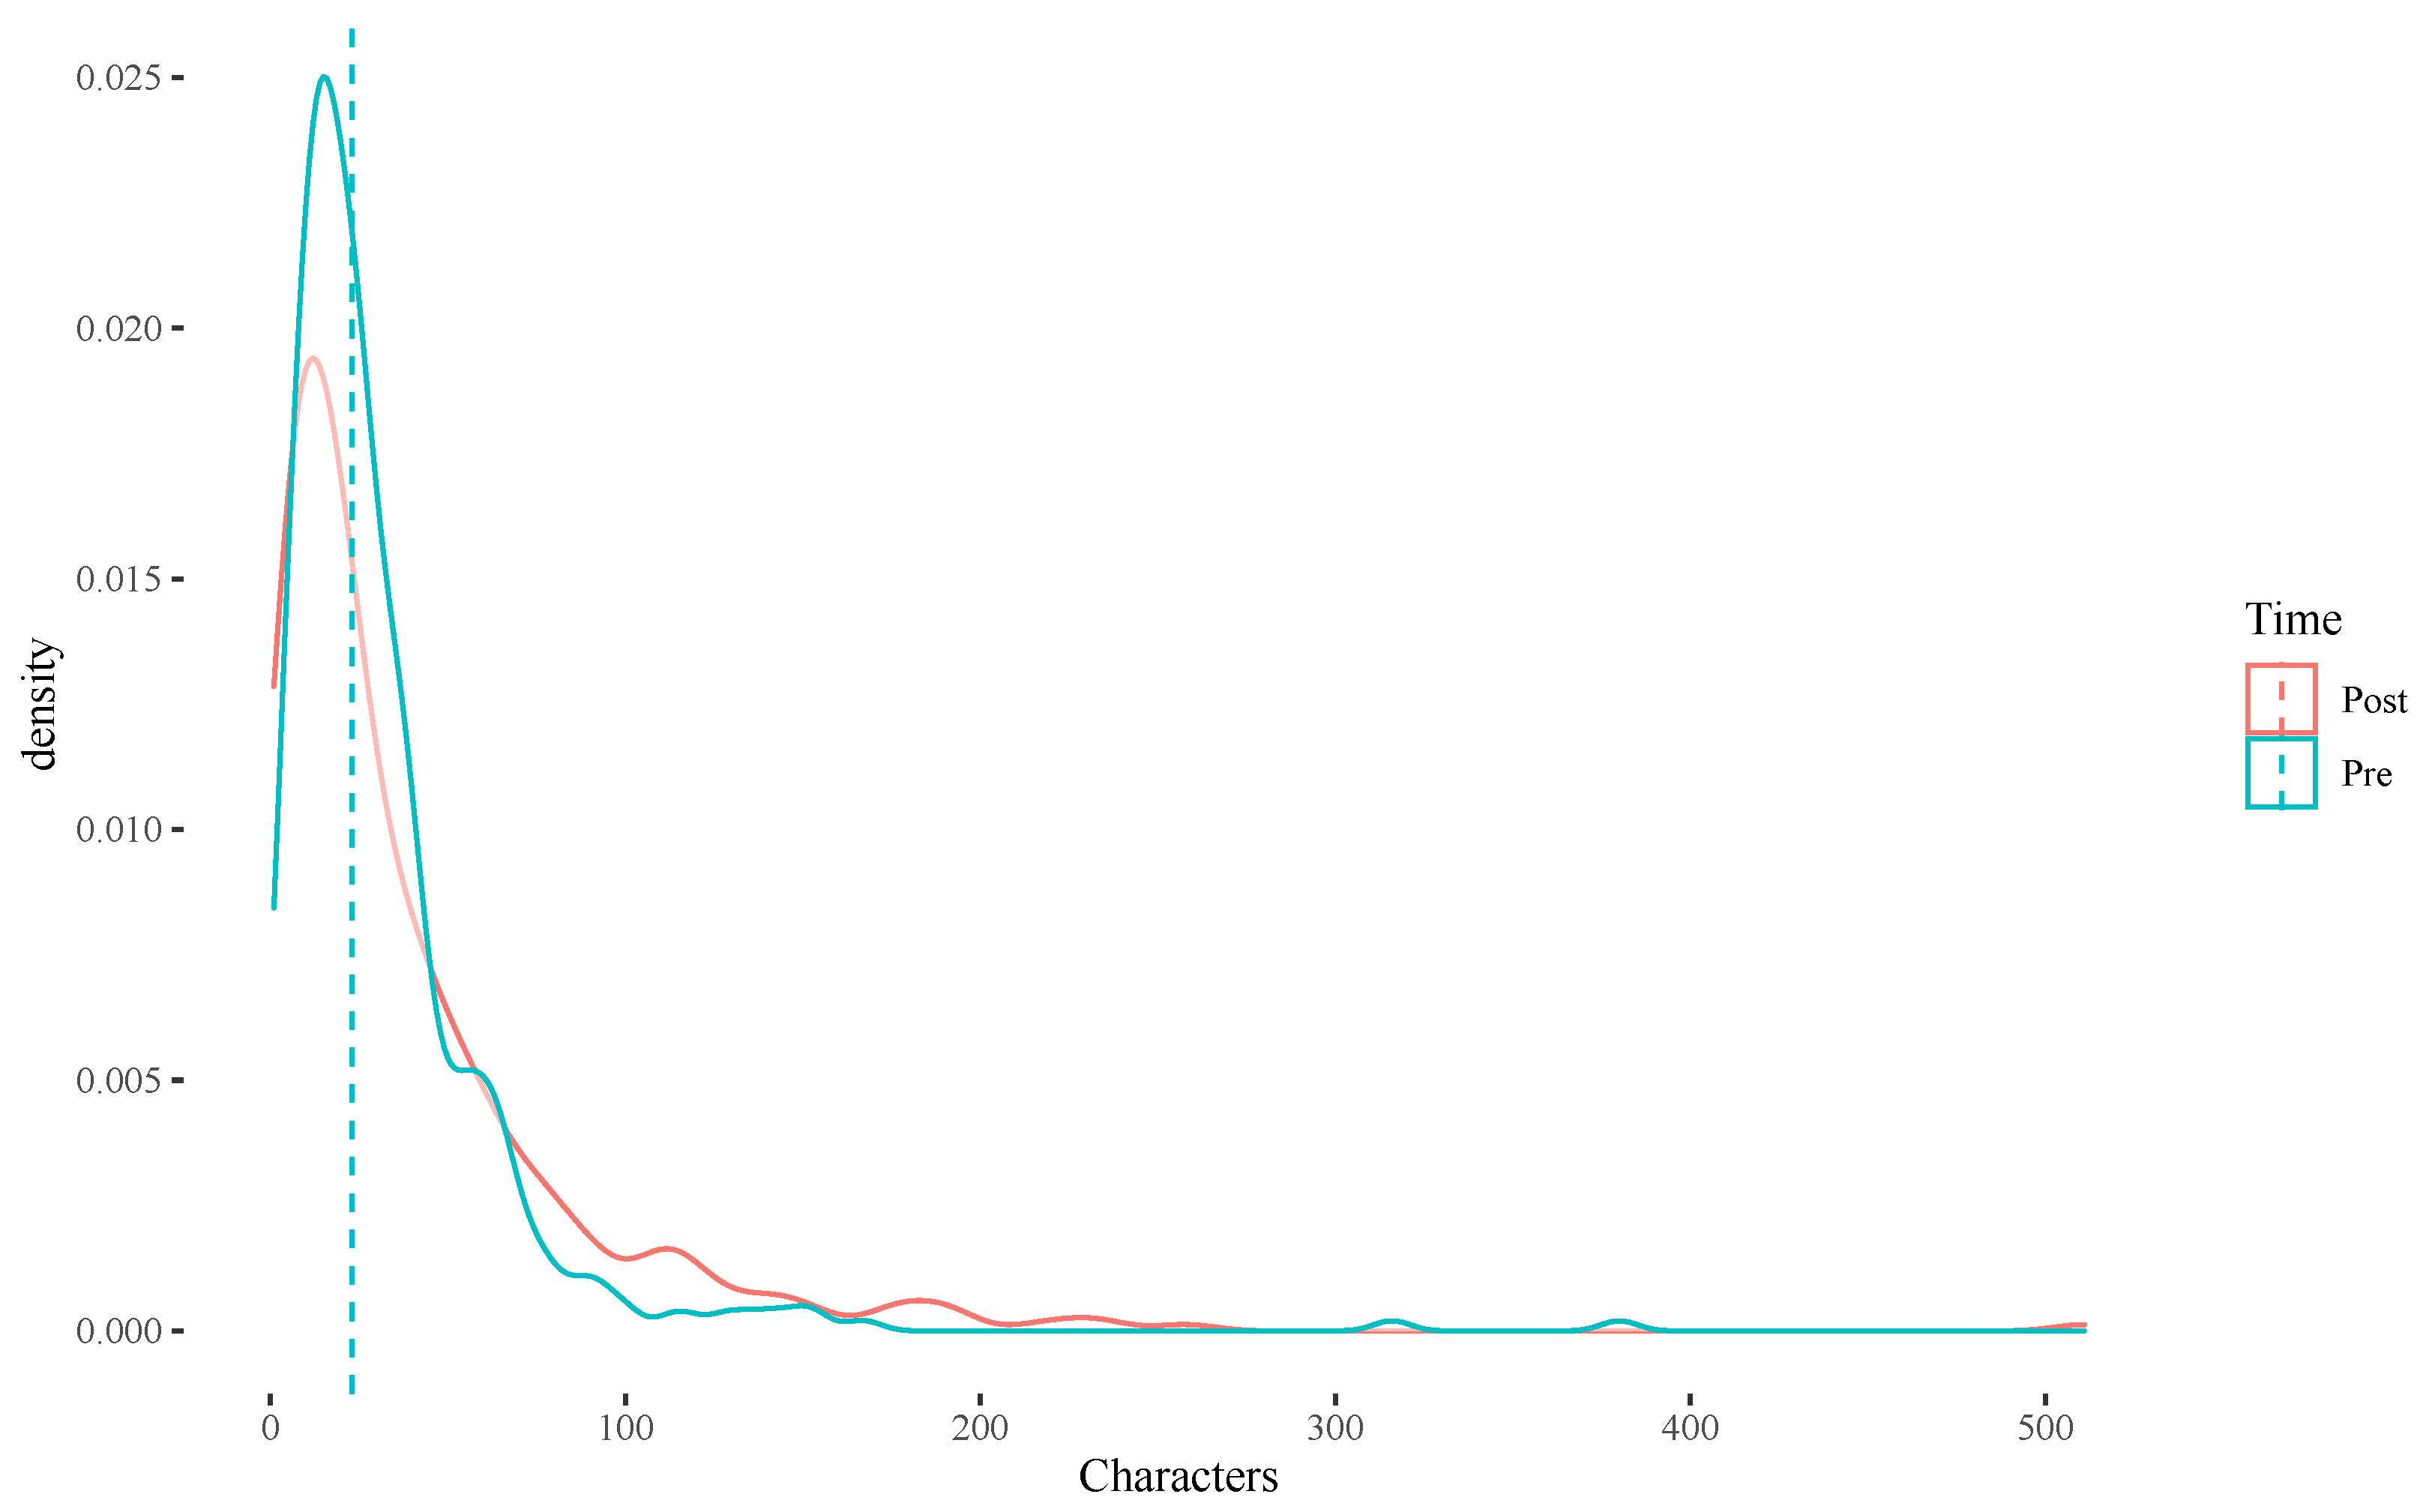
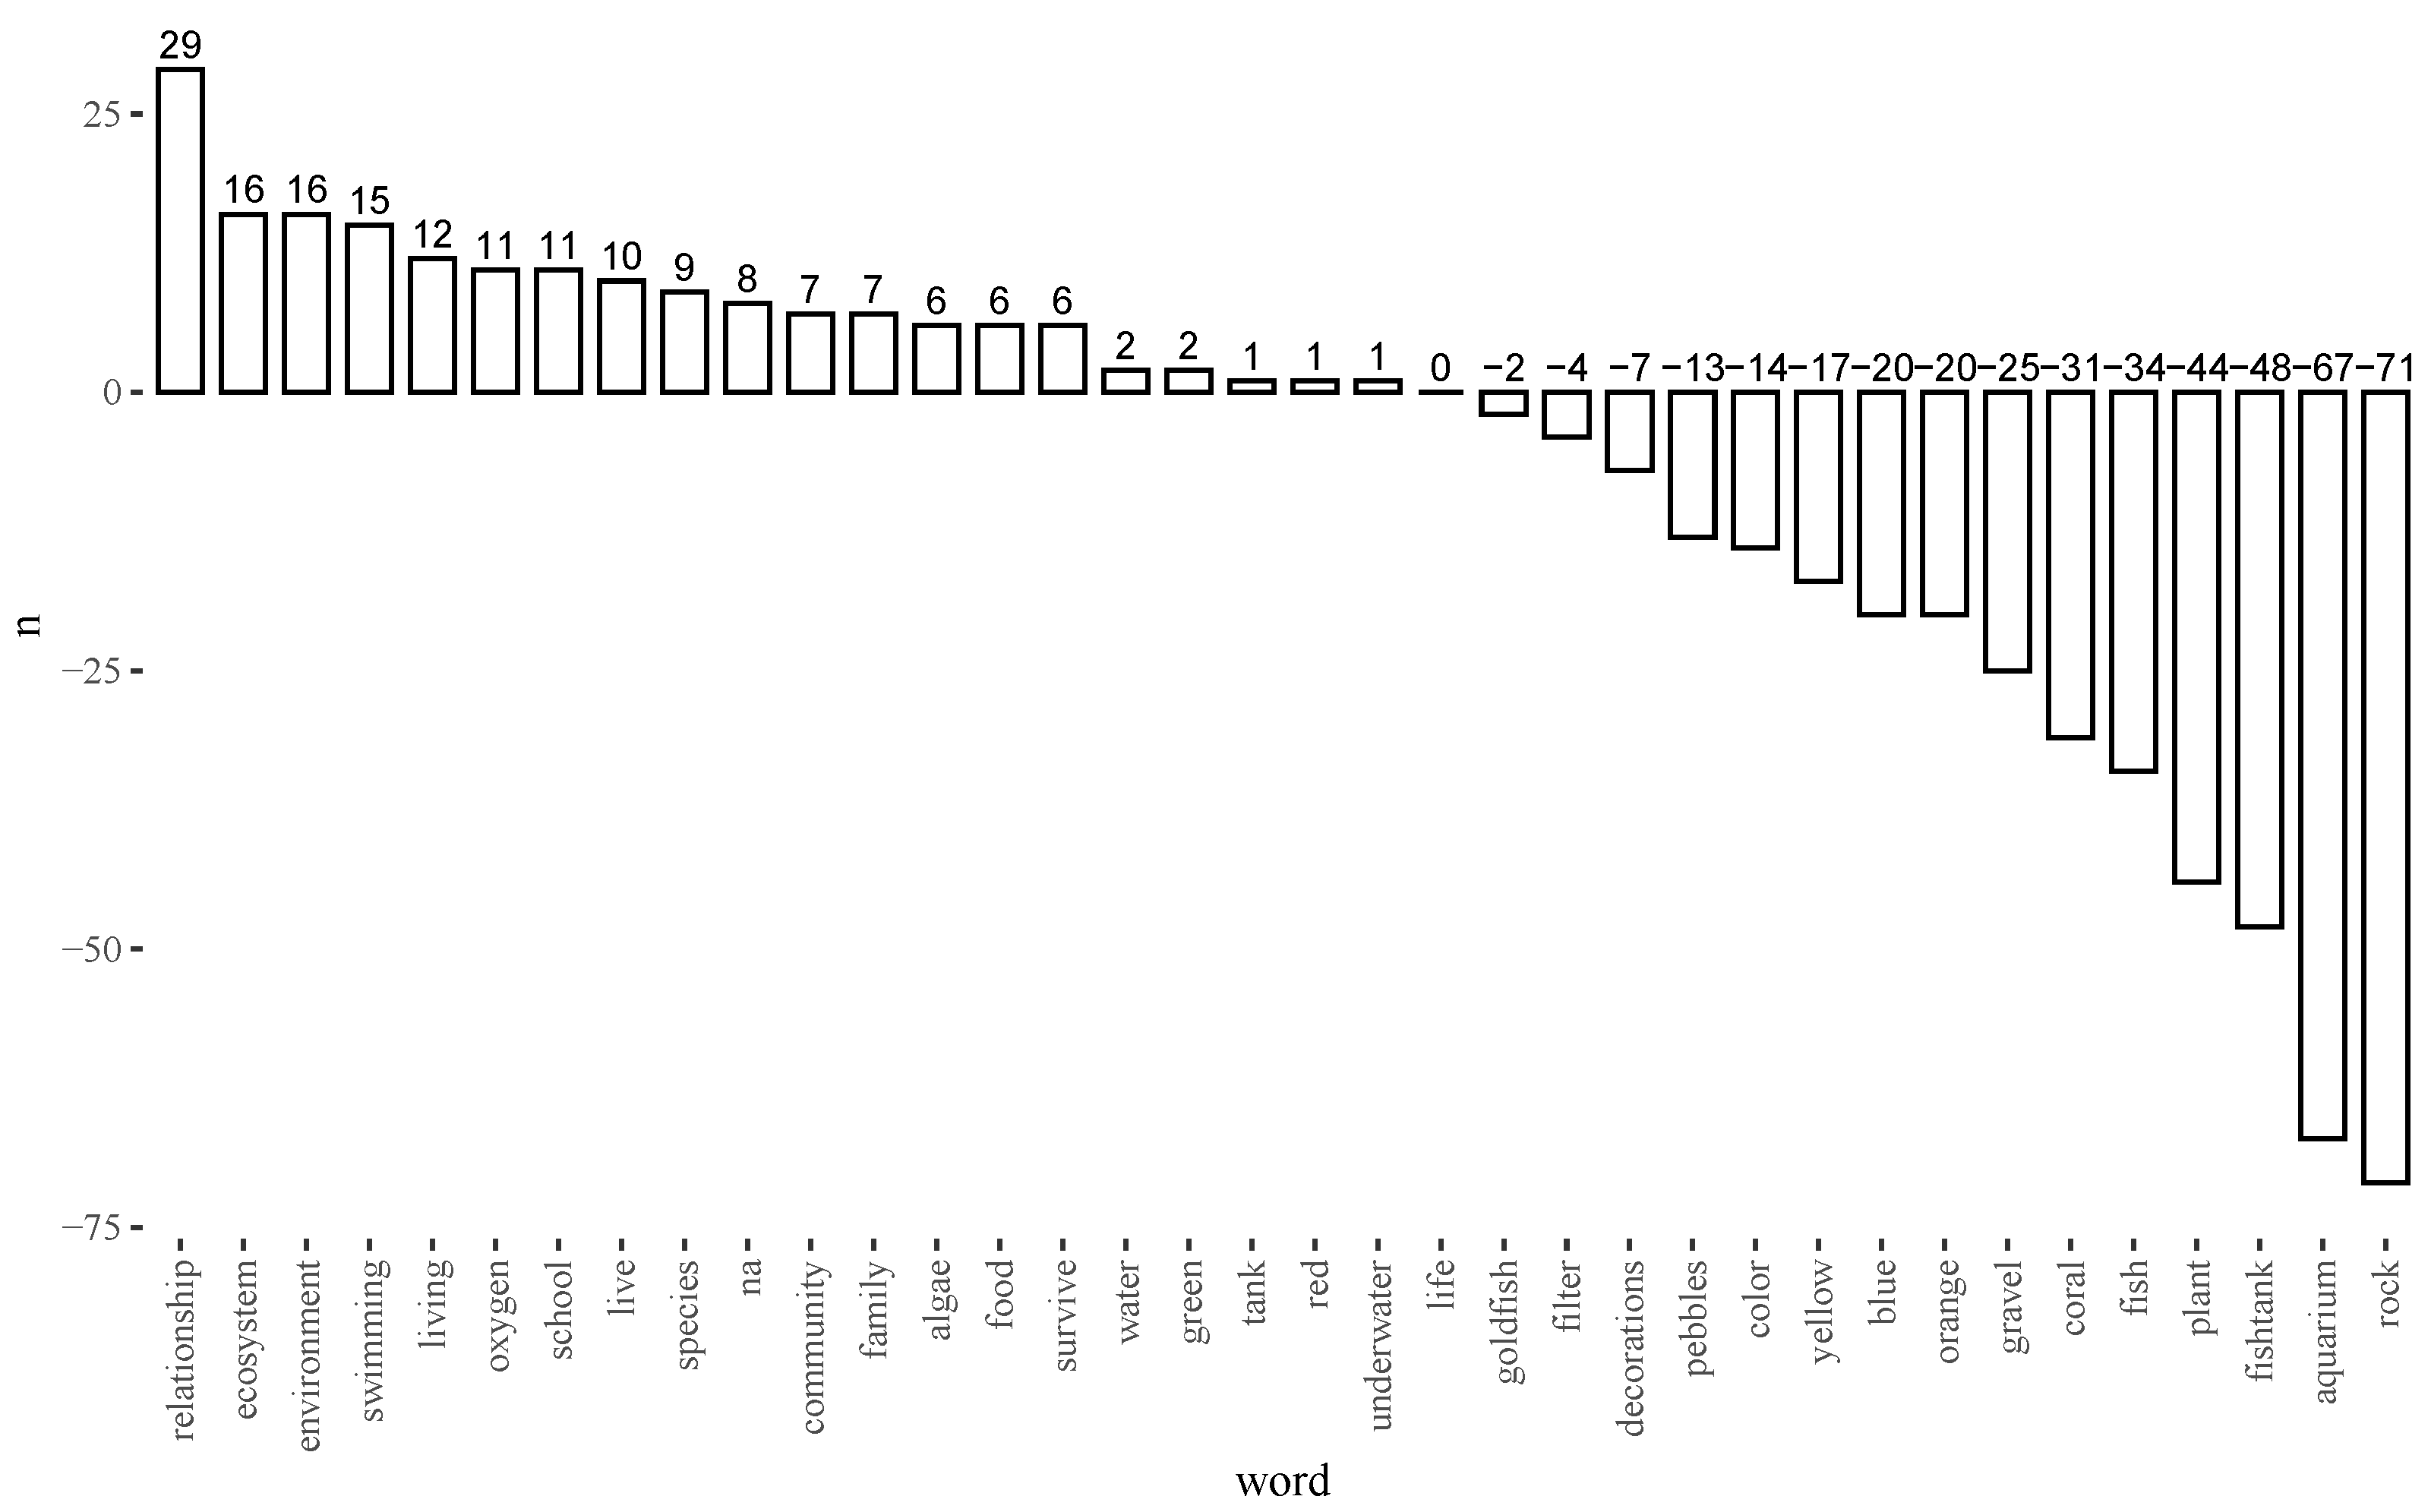
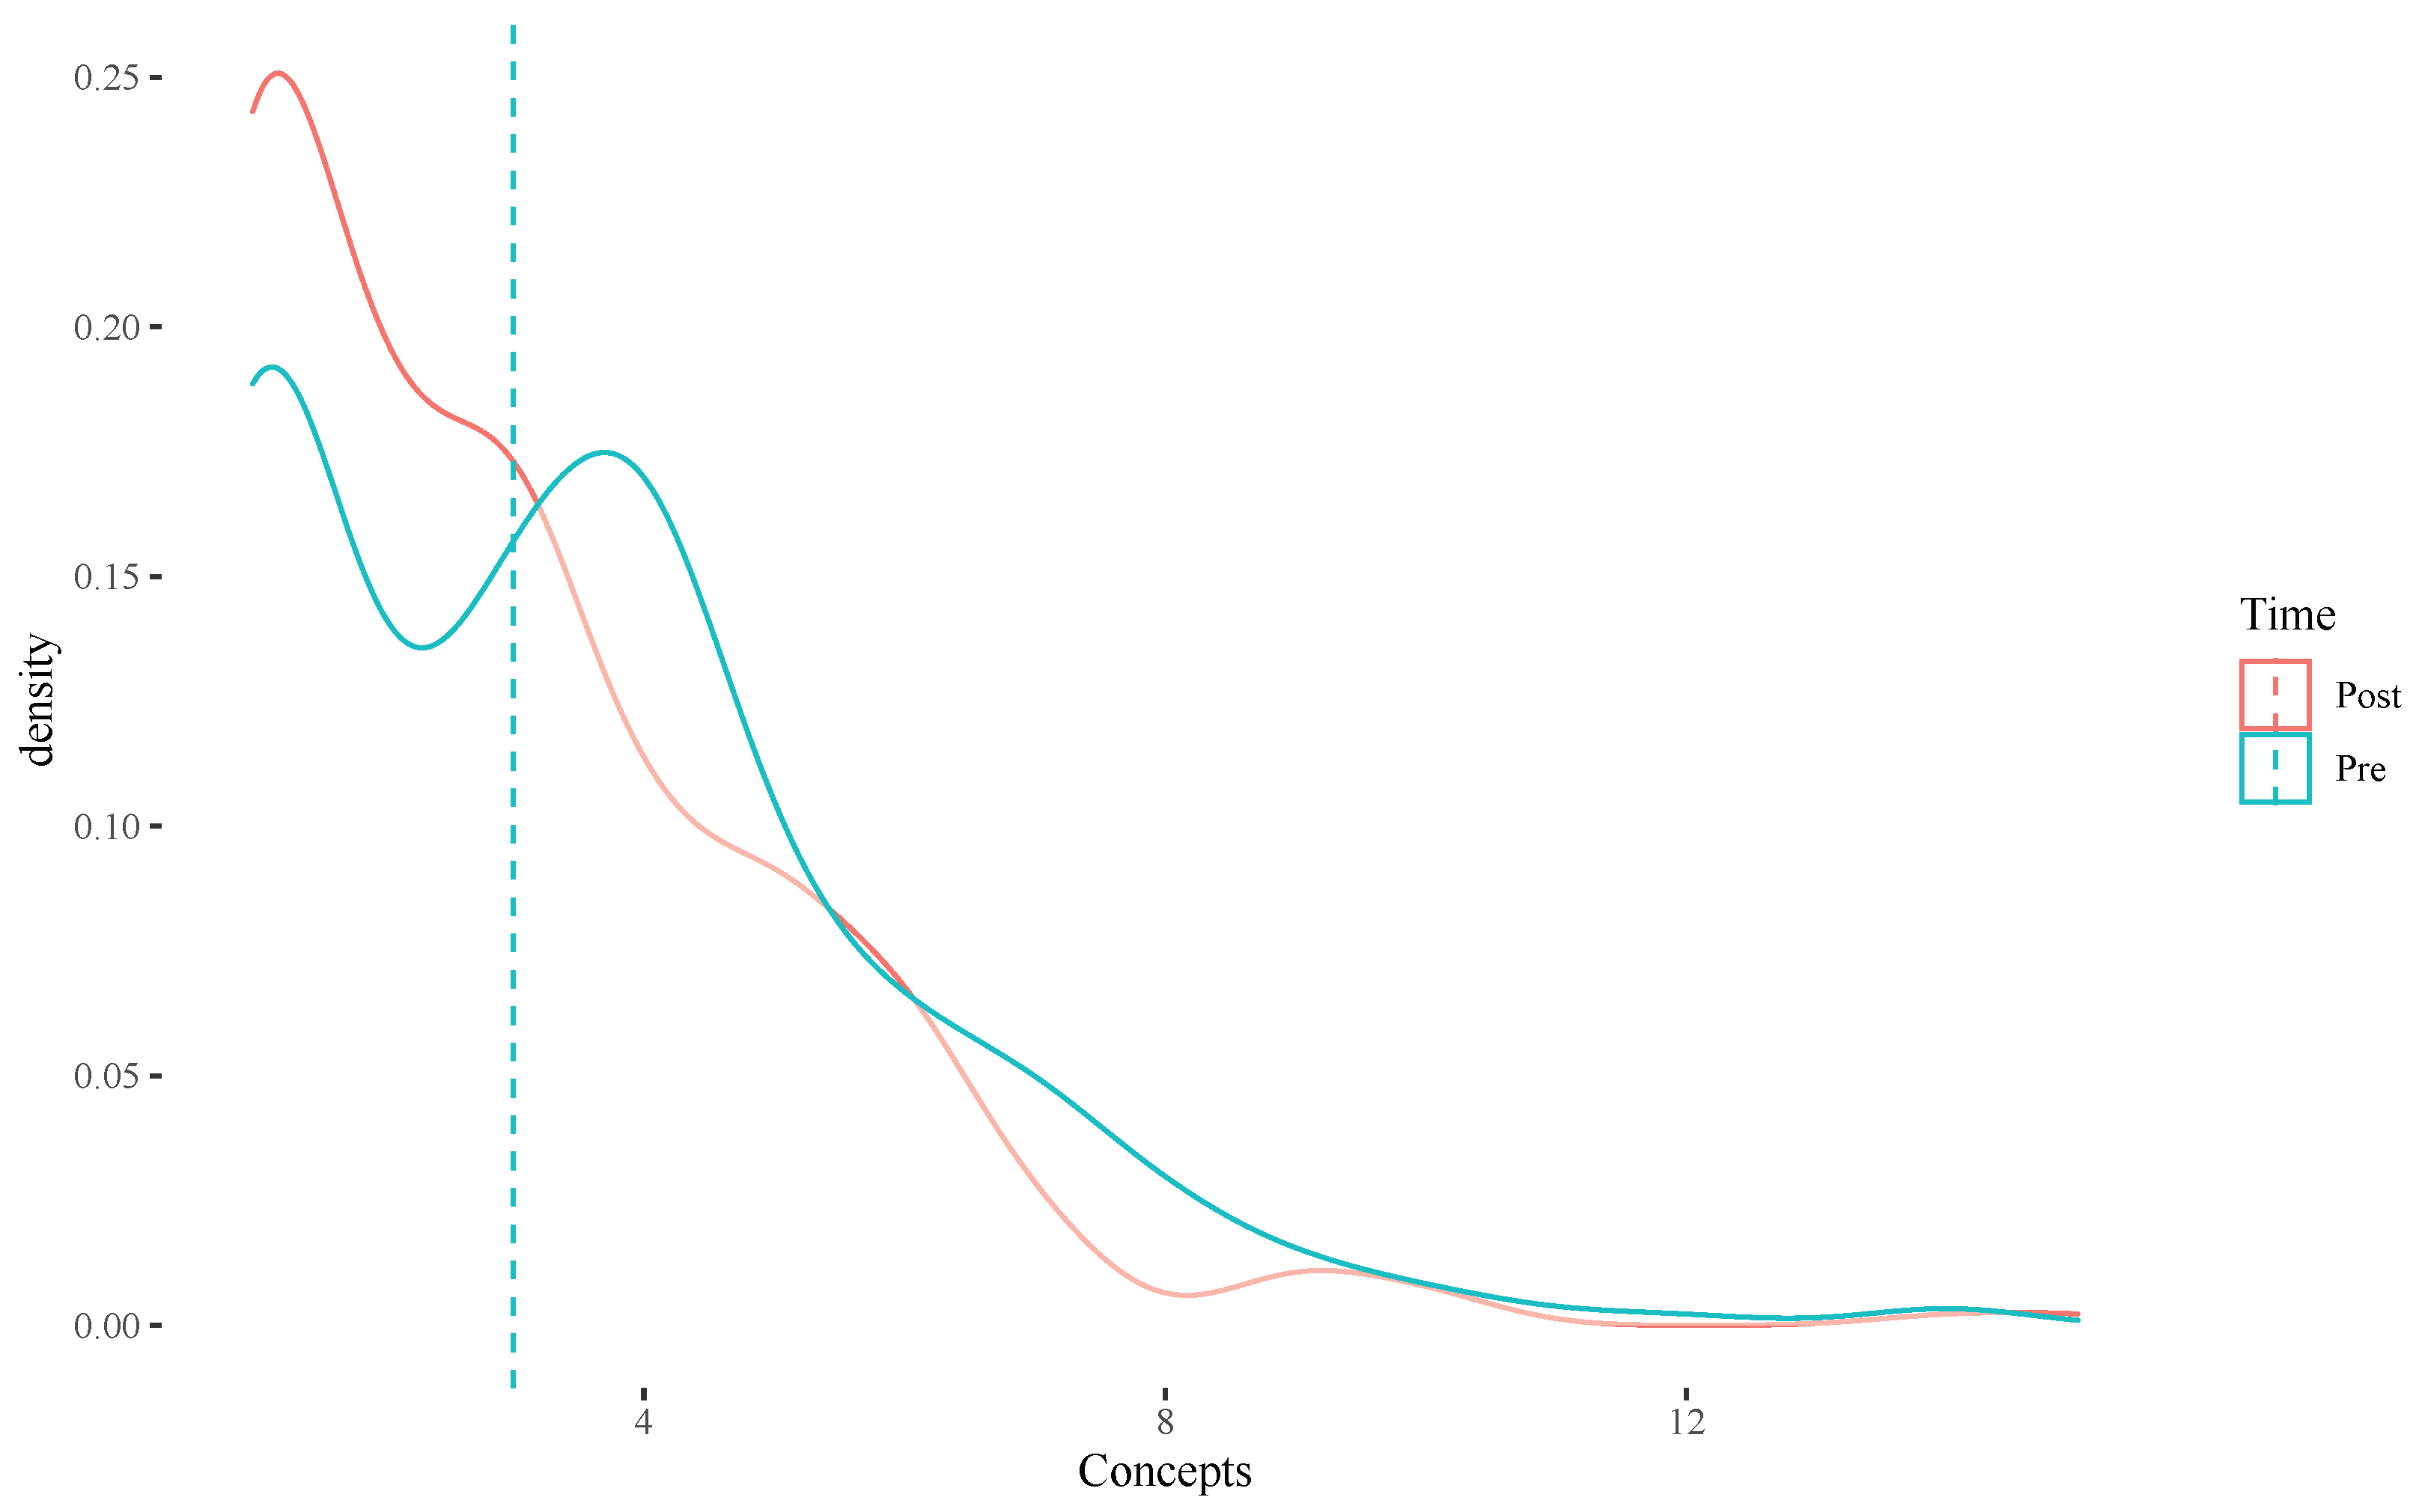
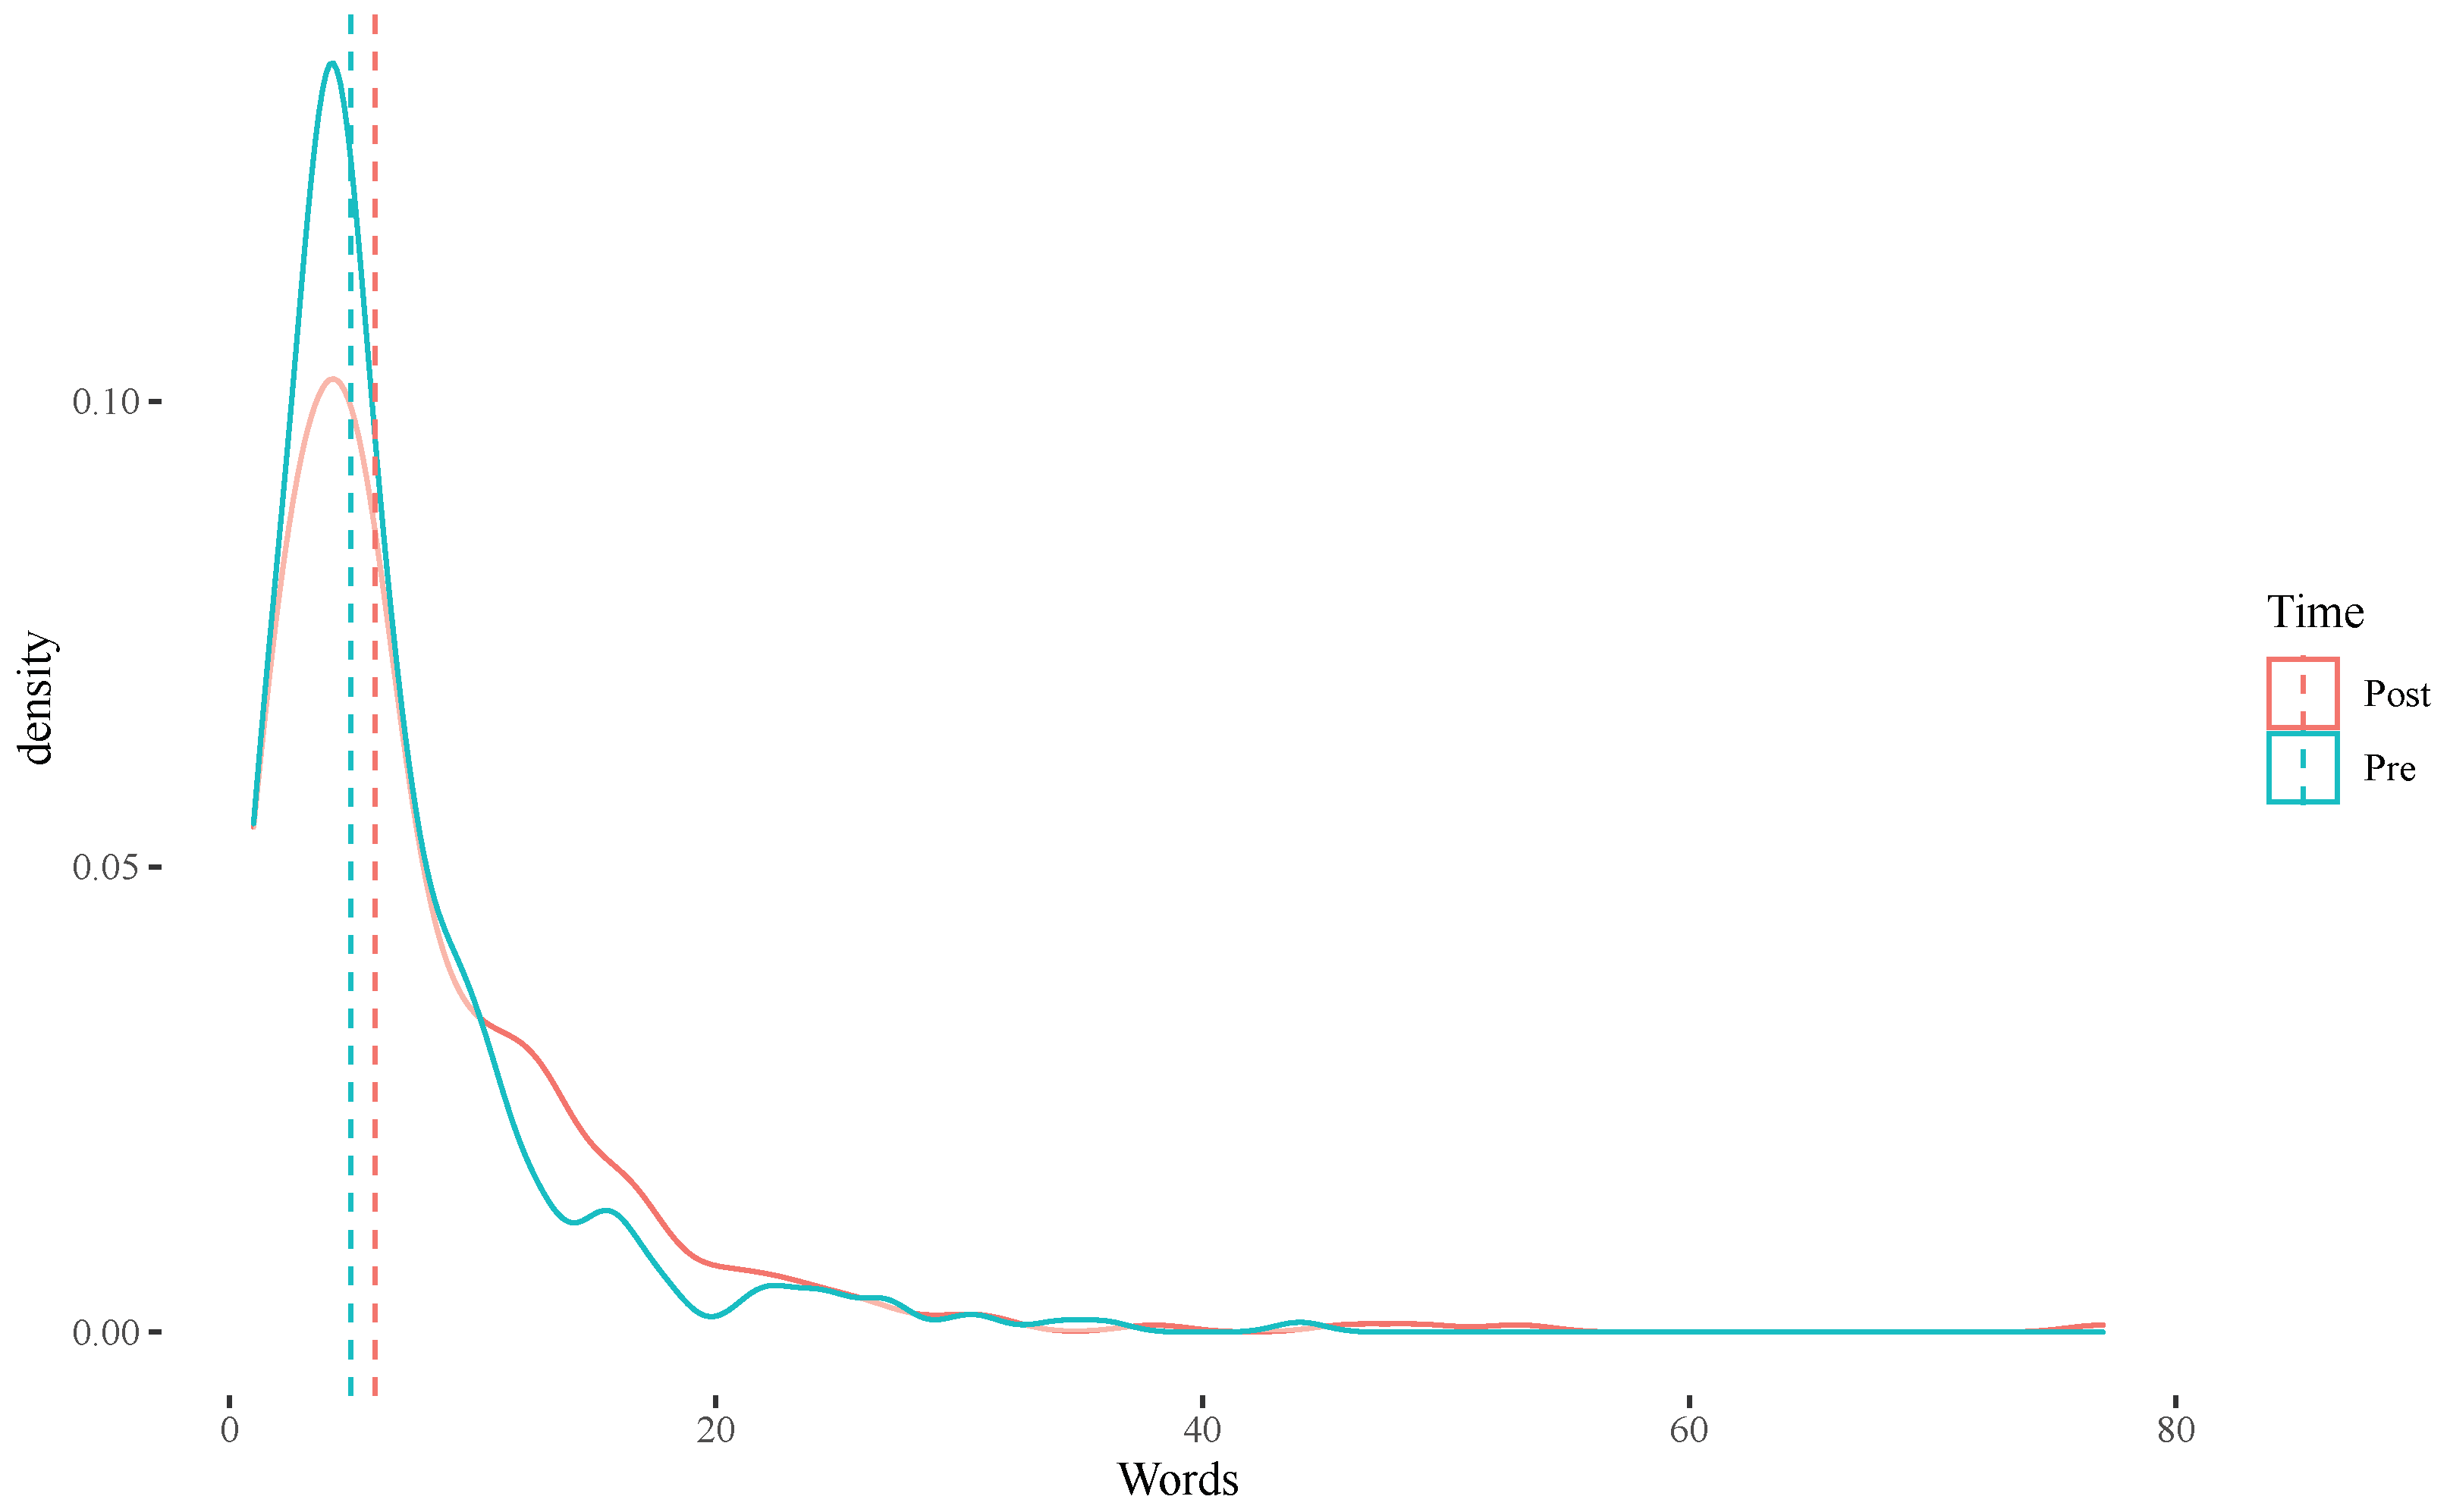
4.3. Relationships
4.4. Perspectives
5. Conclusions
- 1.
- people trained in Distinction-making will have more detailed and specific thoughts, whereas;
- 2.
- people trained in Systems-organizing will create more hierarchical structures and scale their thoughts up and down past the visual/conceptual question;
- 3.
- people trained in Relationship building will create and identify more and better interrelationships, and;
- 4.
- people trained in seeing Perspectives will see the stimulus from multiple points of view.
Author Contributions
Funding
Institutional Review Board Statement
Informed Consent Statement
Data Availability Statement
Conflicts of Interest
Abbreviations
| DSRP | DSRP Theory (Distinctions, Systems, Relationships, Perspectives) |
| D | identity–other Distinctions |
| S | part–whole Systems |
| R | action–reaction Relationships |
| P | point-view Perspectives |
| STMI | Systems Thinking and Metacognition Inventory |
| IQR | Interquartile Range |
| GLMM | Generalized Linear Mixed Modeling |
| RDS | Relate-Distinguish-Systematize Jig |
| 1 | We would use the words “gap in the research here” but a gap implies something missing between two existing things. Whereas a dearth is a scarcity or lack of something altogether. |
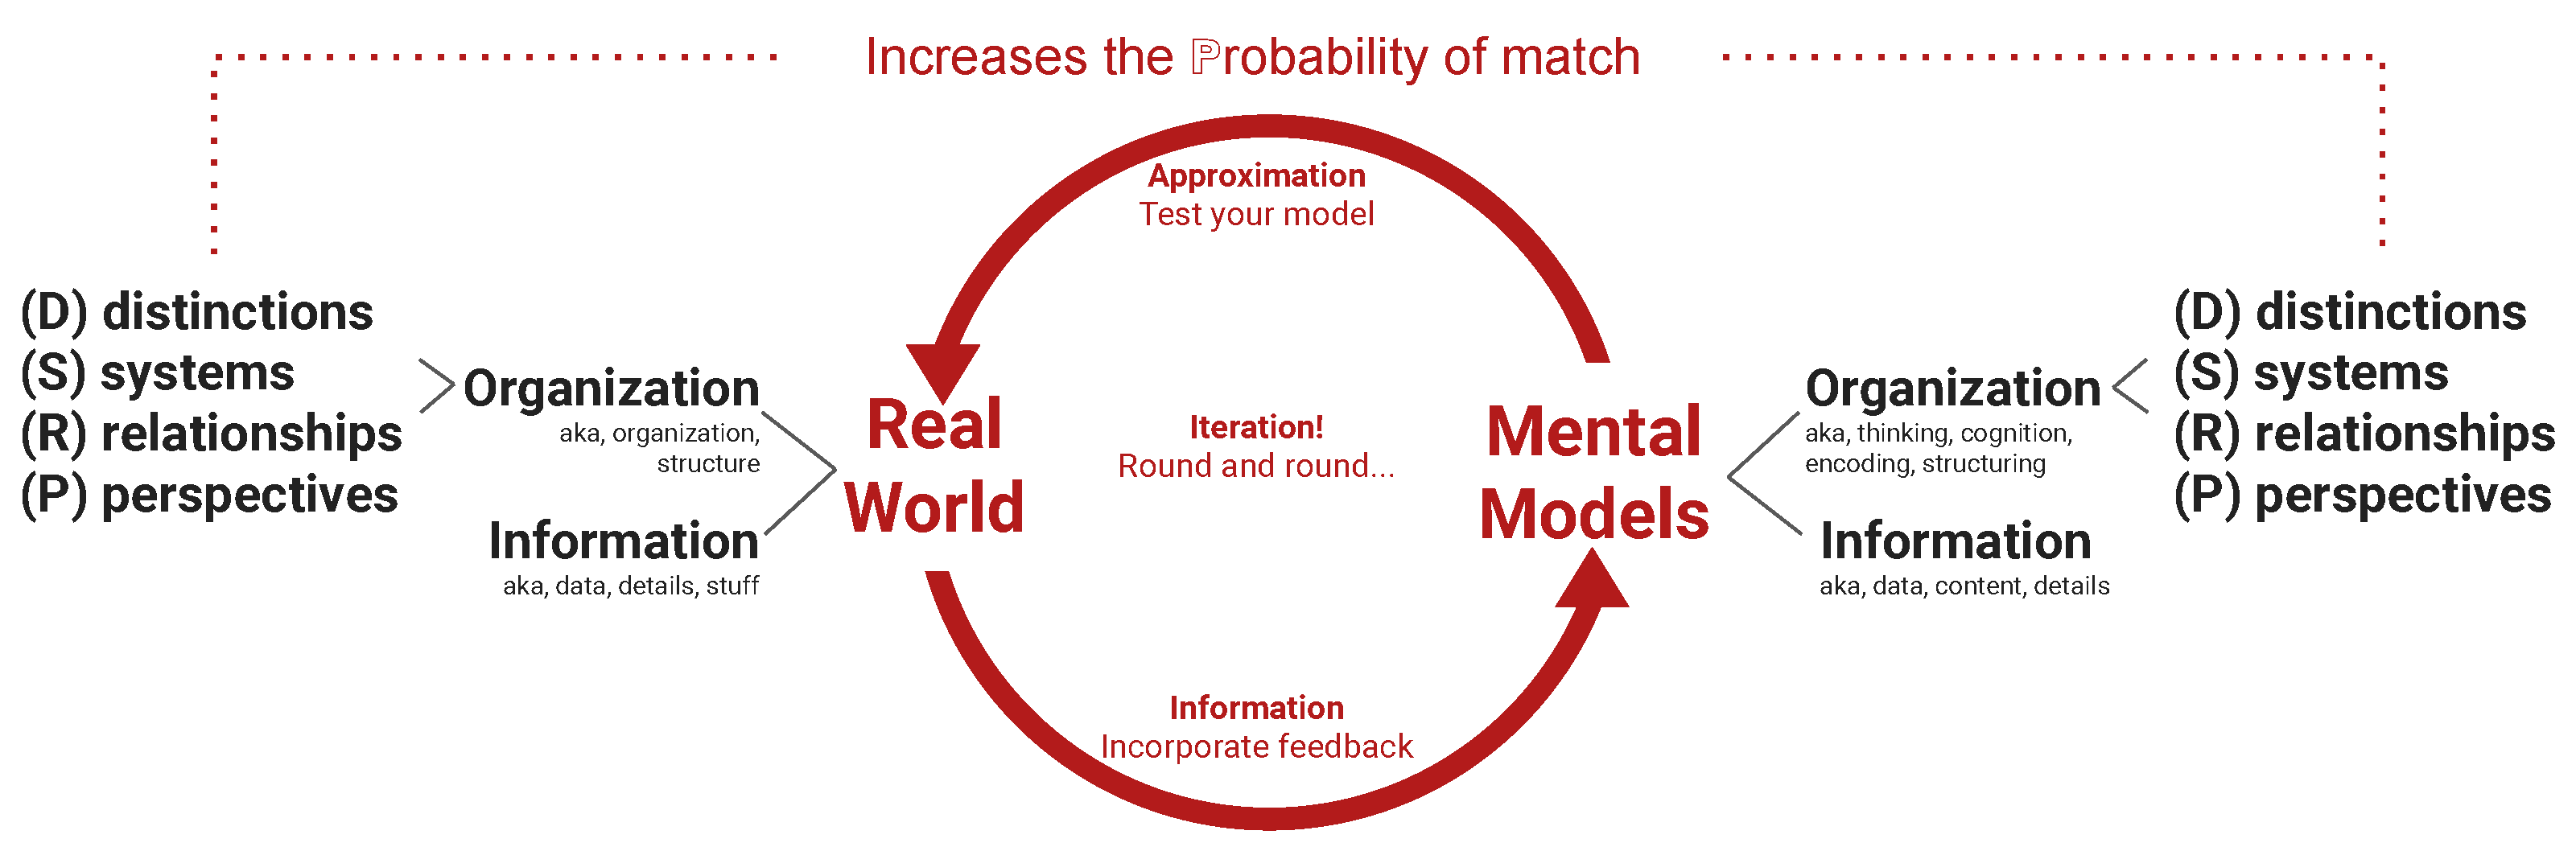
| 2 | It should be noted that the ST/DSRP Loop is the mirror opposite of confirmation bias. Confirmation bias reverses this loop, by fitting reality to one’s mental models, whereas DSRP Systems Thinking fits mental models to real-world observables and feedback. Parallelism is therefore the degree to which one’s cognitive paradigm, style, or mindset, aligns with nature’s. One purpose of this research program is to determine the degree to which DSRP Theory accomplishes this parallelism. |
| 3 |
References
- Cabrera, D. Systems Thinking; Cornell University: Ithaca, NY, USA, 2006. [Google Scholar]
- Cabrera, D.; Cabrera, L.; Midgley, G. (Eds.) The Four Waves of Systems Thinking. In Routledge Handbook of Systems Thinking; Routledge: London, UK, 2022; under process. [Google Scholar]
- Cabrera, D.; Cabrera, L.; Cabrera, E.; Hernandez, O.; Sukhbaatar, U.; Fuqua, K.; Benitez Collante, A.E.; Lemaiyan, E.; Warugongo, N.; Sekyere, A.; et al. The Origin of Ideas: Empirical Studies in Cognitive Complexity; Odyssean Press: Ithaca, NY, USA, 2022. [Google Scholar]
- Cabrera, D. Distinctions, Systems, Relationships, Perspectives: The simple rules of complex conceptual systems. In Proceedings of the 52nd Annual Conference of the International Society for the Systems ScInternational Society for the Systems Sciences, Madison, WI, USA, 13–18 July 2008; Volume 1. [Google Scholar]
- Cabrera, D.; Cabrera, L. Systems Thinking Made Simple: New Hope for Solving Wicked Problems in a Complex World; Odyssean Press: Ithaca, NY, USA, 2015. [Google Scholar]
- Cabrera, D.; Cabrera, L.; Lobdell, C. Systems Thinking. J. Eval. Program Plan. 2008, 31, 299–310. [Google Scholar] [CrossRef] [PubMed]
- Cabrera, D.; Cabrera, L. Complexity and Systems Thinking Models in Education: Applications for Leaders. In Learning, Design, and Technology: An International Compendium of Theory, Research, Practice, and Policy; Spector, M.J., Lockee, B.B., Childress, M.D., Eds.; Springer International Publishing: Cham, Switzerland, 2019; pp. 1–29. [Google Scholar]
- Cabrera, D.; Cabrera, L. What Is Systems Thinking? In Learning, Design, and Technology: An International Compendium of Theory, Research, Practice, and Policy; Spector, M.J., Lockee, B.B., Childress, M.D., Eds.; Springer International Publishing: Cham, Switzerland, 2019; pp. 1–28. [Google Scholar]
- Cabrera, L.; Cabrera, D. The Simple Rules of Complex Networks: Heuristics for Structural Predictions. In The Routledge Handbook for Systems Thinking; Cabrera, L., Cabrera, D., Midgley, G., Eds.; Routledge Press: London, UK, 2022. [Google Scholar]
- Cabrera, D.; Cabrera, L. Distinctions, Systems, Relationships, and Perspectives (DSRP): A Theory of Thinking and of Things. J. Eval. Program Plan. 2008, 31, 311–317. [Google Scholar] [CrossRef] [PubMed]
- Cabrera, D.; Cabrera, L. DSRP Theory: A Primer. Systems 2022, 10, 26. [Google Scholar] [CrossRef]
- Cabrera, D.; Cabrera, L.; Cabrera, E. A Literature Review of the Universal Patterns and Atomic Elements of Complex Cognition. In The Handbook of Systems Thinking; Cabrera, D., Cabrera, L., Midgley, G., Eds.; Routledge: London, UK, 2022. [Google Scholar]
- Cabrera, L.; Sokolow, J.; Cabrera, D. Developing and Validating a Measurement of Systems Thinking: The Systems Thinking and Metacognitive Inventory (STMI). In The Routledge Handbook for Systems Thinking; Cabrera, L., Cabrera, D., Midgley, G., Eds.; Routledge Press: London, UK, 2021. [Google Scholar]
- Cabrera, D.; Cabrera, L.; Cabrera, E. Perspectives Organize Information in Mind and Nature: Empirical Findings of Point-View Perspective (P) in Cognitive and Material Complexity. Systems, 2022; under process. [Google Scholar]
- Cabrera, D.; Cabrera, L.; Cabrera, E. Distinctions Organize Information in Mind and Nature: Empirical Findings of Identity-Other Distinctions (D) in Cognitive and Material Complexity. Systems, 2022; under process. [Google Scholar]
- Cabrera, D.; Cabrera, L.; Cabrera, E. Relationships Organize Information in Mind and Nature: Empirical Findings of Action-Reaction Relationships (R) in Cognitive and Material Complexity. Systems, 2022; under process. [Google Scholar]
- Cabrera, D.; Cabrera, L.; Cabrera, E. Systems Organize Information in Mind and Nature: Empirical Findings of Part-Whole Systems (S) in Cognitive and Material Complexity. Systems, 2022; under process. [Google Scholar]
- Cabrera, D.; Cabrera, L.; Midgley, G. (Eds.) Routledge Handbook of Systems Thinking; Routledge: London, UK, 2021. [Google Scholar] [CrossRef]
- Spencer-Brown, G. Laws of Form; Allen & Unwin: London, UK, 1969. [Google Scholar]
- Krauss, L. Why Is There Something Instead of Nothing? Simon and Schuster: New York, NY, USA, 2012. [Google Scholar]
- Euler, L. Solutio problematis ad geometriam situs pertinentis. Comment. Acad. Sci. Petropol. 1735, 8, 128–140. [Google Scholar]
- Kolata, G. Studying Learning In The Womb. Science 1984, 225, 302–303. [Google Scholar] [CrossRef] [Green Version]
- Partanen, E.; Kujala, T.; Näätänen, R.; Liitola, A.; Sambeth, A.; Huotilainen, M. Learning-induced neural plasticity of speech processing before birth. Proc. Natl. Acad. Sci. USA 2013, 110, 15145–15150. [Google Scholar] [CrossRef] [Green Version]
- Quinn, P.C.; Brown, C.R.; Streppa, M.L. Perceptual organization of complex visual configurations by young infants. Infant Behav. Dev. 1997, 20, 35–46. [Google Scholar] [CrossRef]
- Newman, R.S.; Jusczyk, P.W. The cocktail party effect in infants. Percept. Psychophys. 1996, 58, 1145–1156. [Google Scholar] [CrossRef] [PubMed]
- Gauthier, I.; Tarr, M.J. Becoming a “Greeble” expert: Exploring mechanisms for face recognition. Vision Res. 1997, 37, 1673–1682. [Google Scholar] [CrossRef] [Green Version]
- Aubin, T.; Jouventin, P. Cocktail-party effect in king penguin colonies. Proc. R. Soc. Lond. Ser. B-Biol. Sci. 1998, 265, 1665–1673. [Google Scholar] [CrossRef] [Green Version]
- Fry, S.N.; Wehner, R. Honey bees store landmarks in an egocentric frame of reference. J. Comp. Physiol. A-Neuroethol. Sens. Neural Behav. Physiol. 2002, 187, 1009–1016. [Google Scholar] [CrossRef] [PubMed]
- Badre, D. Cognitive control, hierarchy, and the rostro-caudal organization of the frontal lobes. Trends Cogn. Sci. 2008, 12, 193–200. [Google Scholar] [CrossRef]
- Bukach, C.M.; Gauthier, I.; Tarr, M.J.; Kadlec, H.; Barth, S.; Ryan, E.; Turpin, J.; Bub, D.N. Does acquisition of Greeble expertise in prosopagnosia rule out a domain-general deficit? Neuropsychologia 2012, 50, 289–304. [Google Scholar] [CrossRef]
- Drews, G. Contributions of Theodor Wilhelm Engelmann on phototaxis, chemotaxis, and photosynthesis. Photosynth. Res. 2005, 83, 25–34. [Google Scholar] [CrossRef]
- Sengupta, A.; Kruppa, T.; Löwen, H. Chemotactic predator-prey dynamics. Phys. Rev. E 2010, 83, 031914. [Google Scholar] [CrossRef] [Green Version]
- Berleman, J.E.; Kirby, J.R. Deciphering the hunting strategy of a bacterial wolfpack. FEMS Microbiol. Rev. 2009, 33, 942–957. [Google Scholar] [CrossRef] [Green Version]
- Pradel, E.; Zhang, Y.; Pujol, N.; Matsuyama, T.; Bargmann, C.I.; Ewbank, J.J. Detection and avoidance of a natural product from the pathogenic bacterium Serratia marcescens by Caenorhabditis elegans. Proc. Natl. Acad. Sci. USA 2007, 104, 2295–2300. [Google Scholar] [CrossRef] [PubMed] [Green Version]
- Rajalingham, R.; DiCarlo, J.J. Reversible Inactivation of Different Millimeter-Scale Regions of Primate IT Results in Different Patterns of Core Object Recognition Deficits. Neuron 2019, 102, 493–505.e5. [Google Scholar] [CrossRef] [Green Version]
- Clark, T. National boundaries, border zones, and marketing strategy: A conceptual framework and theoretical model of secondary boundary effects. J. Mark. 1994, 58, 67–80. [Google Scholar] [CrossRef]
- Coye, D. The Sneakers/Tennis Shoes Boundary. American Speech 1986, 61, 366–369. [Google Scholar] [CrossRef]
- Powers, E.; Cabrera, L.; Cabrera, D. No Word Is an Island: Distinguishing “Nerd” and “Geek”. Cognitive Case Study; Cornell University: Ithaca, NY, USA, 2016. [Google Scholar]
- Peterson, M.A.; Skow-Grant, E. Memory and Learning in Figure–Ground Perception. In Psychology of Learning and Motivation; Academic Press: Cambridge, MA, USA, 2003. [Google Scholar]
- Abdullah, M.H.; Klypin, A.; Wilson, G. Cosmological Constraints on Ω m and σ 8 from Cluster Abundances Using the GalWCat19 Optical-spectroscopic SDSS Catalog. Astrophys. J. 2020, 901, 90. [Google Scholar] [CrossRef]
- De Luca Picione, R.; Valsiner, J. Psychological Functions of Semiotic Borders in Sense-Making: Liminality of Narrative Processes. Eur. J. Psychol. Assess. 2017, 13, 532–547. [Google Scholar] [CrossRef] [Green Version]
- Glanville, R. The Self and the Other: The Purpose of Distinction. In Cybernetics and Systems ’90, Proceedings of the European Meeting on Cybernetics and Systems Research, Singapore, 17–20 April 1999; World Scientific: Singapore, 1999. [Google Scholar]
- Durand, R.; Calori, R. Sameness, Otherness? Enriching Organizational Change Theories With Philosophical Considerations On The Same And The Other. AMRO 2006, 31, 93–114. [Google Scholar] [CrossRef] [Green Version]
- Gillette, J.M. Boundary Lines of Social Phenomena. Am. J. Sociol. 1925, 30, 585–593. [Google Scholar] [CrossRef]
- Tajfel, H.; Wilkes, A.L. Classification and quantitative judgement. Br. J. Psychol. 1963, 54, 101–114. [Google Scholar] [CrossRef]
- Davies, C. Sexual Taboos and Social Boundaries. Am. J. Sociol. 1982, 87, 1032–1063. [Google Scholar] [CrossRef]
- Langer, E.J.; Bashner, R.S.; Chanowitz, B. Decreasing prejudice by increasing discrimination. J. Personal. Soc. Psychol. 1985, 49, 113. [Google Scholar] [CrossRef]
- Perdue, C.W.; Dovidio, J.F.; Gurtman, M.B.; Tyler, R.B. Us and them: Social categorization and the process of intergroup bias. J. Personal. Soc. Psychol. 1990, 59, 475. [Google Scholar] [CrossRef]
- Leudar, I.; Marsland, V. On membership categorization: ‘us’, ‘them’ and ‘doing violence’ in political discourse. Discourse Soc. 2004, 15, 243–266. [Google Scholar] [CrossRef]
- Young, J. On Insiders (Emic) and Outsiders (Etic): Views of Self, and Othering. Syst. Pract. Action Res. 2005, 18, 151–162. [Google Scholar] [CrossRef]
- Midgley, G.; Pinzón, L.A. Systemic mediation: Moral reasoning and boundaries of concern: Systemic mediation. Syst. Res. Behav. Sci. 2013, 30, 607–632. [Google Scholar] [CrossRef]
- Bentley, S.V.; Greenaway, K.H.; Haslam, S.A. Cognition in context: Social inclusion attenuates the psychological boundary between self and other. J. Exp. Soc. Psychol. 2017, 73, 42–49. [Google Scholar] [CrossRef]
- King, S.L.; Connor, R.C.; Krützen, M.; Allen, S.J. Cooperation-based concept formation in male bottlenose dolphins. Nat. Commun. 2021, 12, 2373. [Google Scholar] [CrossRef]
- Stafstrom, J.A.; Menda, G.; Nitzany, E.I.; Hebets, E.A.; Hoy, R.R. Ogre-Faced, Net-Casting Spiders Use Auditory Cues to Detect Airborne Prey. Curr. Biol. 2020, 30, 5033–5039.e3. [Google Scholar] [CrossRef]
- Rubin, N. Figure and ground in the brain. Nat. Neurosci. 2001, 4, 857–858. [Google Scholar] [CrossRef]
- Baylis, G.C.; Driver, J. Shape-coding in IT cells generalizes over contrast and mirror reversal, but not figure-ground reversal. Nat. Neurosci. 2001, 4, 937–942. [Google Scholar] [CrossRef]
- Bateson, G. Form Substance and Difference. Essent. Readings Biosemiotics 1970, 501, 9. [Google Scholar]
- Darwin, C. On the Origin of Species: By Means of Natural Selection, or The Preservation of Favoured Races in the Struggle for Life; John Murray: London, UK, 1859. [Google Scholar]
- Von Bertalanffy, L. The history and status of general systems theory. Acad. Manag. J. 1972, 15, 407–426. [Google Scholar]
- Rittel, H.W.J.; Webber, M.M. Dilemmas in a general theory of planning. Policy Sci. 1973, 4, 155–169. [Google Scholar] [CrossRef]
- Marchal, J.H. On the Concept of a System. Philos. Sci. 1975, 42, 448–468. [Google Scholar] [CrossRef]
- Goguen, J.A.; Varela, F.J. Systems And Distinctions: Duality And Complementarity. Int. J. Gen. Syst. 1979, 5, 31–43. [Google Scholar] [CrossRef]
- Ivan, M.; Kondo, K.; Yang, H.; Kim, W.; Valiando, J.; Ohh, M.; Salic, A.; Asara, J.M.; Lane, W.S.; Kaelin, W.G., Jr. HIFa Targeted for VHL-Mediated Destruction by Proline Hydroxylation: Implications for O Sensing. Science 2001, 292, 464–468. [Google Scholar] [CrossRef]
- Chen, P.; Fan, D.; Zhang, Y.; Selloni, A.; Carter, E.A.; Arnold, C.B.; Dankworth, D.C.; Rucker, S.P.; Chelikowsky, J.R.; Yao, N. Breaking a dative bond with mechanical forces. Nat. Commun. 2021, 12, 5635. [Google Scholar] [CrossRef]
- Wadhams, G.H.; Armitage, J.P. Making sense of it all: Bacterial chemotaxis. Nat. Rev. Mol. Cell Biol. 2004, 5, 1024–1037. [Google Scholar] [CrossRef]
- Janetopoulos, C.; Firtel, R.A. Directional sensing during chemotaxis. FEBS Lett. 2008, 582, 2075–2085. [Google Scholar] [CrossRef] [Green Version]
- Ikeya, N.; Woodward, J.R. Cellular autofluorescence is magnetic field sensitive. Proc. Natl. Acad. Sci. USA 2021, 118, e2018043118. [Google Scholar] [CrossRef]
- Förster, D.; Helmbrecht, T.O.; Mearns, D.S.; Jordan, L.; Mokayes, N.; Baier, H. Retinotectal circuitry of larval zebrafish is adapted to detection and pursuit of prey. Elife 2020, 9, e58596. [Google Scholar] [CrossRef] [PubMed]
- De Corte, B.J.; Navarro, V.M.; Wasserman, E.A. Non-cortical magnitude coding of space and time by pigeons. Curr. Biol. 2017, 27, R1264–R1265. [Google Scholar] [CrossRef] [PubMed] [Green Version]
- Schnell, A.K.; Loconsole, M.; Garcia-Pelegrin, E.; Wilkins, C.; Clayton, N.S. Jays are sensitive to cognitive illusions. R. Soc. Open Sci. 2021, 8, 202358. [Google Scholar] [CrossRef] [PubMed]
- Giannoni-Guzmán, M.A.; Rivera, E.; Aleman-Rios, J.; Melendez Moreno, A.M.; Ramos, M.P.; Pérez-Claudio, E.; Loubriel, D.; Moore, D.; Giray, T.; Agosto-Rivera, J.L. The Role of Colony Temperature in the Entrainment of Circadian Rhythms of Honey Bee Foragers. Ann. Entomol. Soc. Am. 2021, 114, 596–605. [Google Scholar] [CrossRef] [PubMed]
- Mareschal, D.; Quinn, P.C. Categorization in infancy. Trends Cogn. Sci. 2001, 5, 443–450. [Google Scholar] [CrossRef]
- Ashby, F.G.; Ell, S.W.; Waldron, E.M. Procedural learning in perceptual categorization. Mem. Cogn. 2003, 31, 1114–1125. [Google Scholar] [CrossRef] [PubMed] [Green Version]
- Sloutsky, V.M. The role of similarity in the development of categorization. Trends Cogn. Sci. 2003, 7, 246–251. [Google Scholar] [CrossRef]
- Lewis, M.; Balamurugan, A.; Zheng, B.; Lupyan, G. Characterizing Variability in Shared Meaning through Millions of Sketches. Proc. Annu. Meet. Cognit. Sci. Soc. 2021, 43. [Google Scholar]
- Lewandowsky, S.; Roberts, L.; Yang, L.X. Knowledge partitioning in categorization: Boundary conditions. Mem. Cogn. 2006, 34, 1676–1688. [Google Scholar] [CrossRef] [Green Version]
- Sperry, R.W. Cerebral Organization and Behavior: The split brain behaves in many respects like two separate brains, providing new research possibilities. Science 1961, 133, 1749–1757. [Google Scholar] [CrossRef]
- Lupyan, G. The conceptual grouping effect: Categories matter (and named categories matter more). Cognition 2008, 108, 566–577. [Google Scholar] [CrossRef] [PubMed]
- Van Dijk, J.; Kerkhofs, R.; van Rooij, I.; Haselager, P. Special Section: Can There Be Such a Thing as Embodied Embedded Cognitive Neuroscience? Theory Psychol. 2008, 18, 297–316. [Google Scholar] [CrossRef]
- Mahon, B.Z.; Caramazza, A. Concepts and categories: A cognitive neuropsychological perspective. Annu. Rev. Psychol. 2009, 60, 27–51. [Google Scholar] [CrossRef] [PubMed] [Green Version]
- Cira, N.J.; Benusiglio, A.; Prakash, M. Vapour-mediated sensing and motility in two-component droplets. Nature 2015, 519, 446–450. [Google Scholar] [CrossRef] [PubMed] [Green Version]
- Tweedy, L.; Thomason, P.A.; Paschke, P.I.; Martin, K.; Machesky, L.M.; Zagnoni, M.; Insall, R.H. Seeing around corners: Cells solve mazes and respond at a distance using attractant breakdown. Science 2020, 369, eaay9792. [Google Scholar] [CrossRef] [PubMed]
- Blackiston, D.; Lederer, E.; Kriegman, S.; Garnier, S.; Bongard, J.; Levin, M. A cellular platform for the development of synthetic living machines. Sci. Robot. 2021, 6, eabf1571. [Google Scholar] [CrossRef] [PubMed]
- Tarrant, M.; Calitri, R.; Weston, D. Social identification structures the effects of perspective taking. Psychol. Sci. 2012, 23, 973–978. [Google Scholar] [CrossRef]
- Takaoka, A.; Maeda, T.; Hori, Y.; Fujita, K. Do dogs follow behavioral cues from an unreliable human? Anim. Cogn. 2015, 18, 475–483. [Google Scholar] [CrossRef]
- Havy, M.; Waxman, S.R. Naming influences 9-month-olds’ identification of discrete categories along a perceptual continuum. Cognition 2016, 156, 41–51. [Google Scholar] [CrossRef] [Green Version]
- Mischel, W.; Ebbesen, E.B. Attention in delay of gratification. J. Pers. Soc. Psychol. 1970, 16, 329–337. [Google Scholar] [CrossRef] [Green Version]
- Schnell, A.K.; Boeckle, M.; Rivera, M.; Clayton, N.S.; Hanlon, R.T. Cuttlefish exert self-control in a delay of gratification task. Proc. Biol. Sci. 2021, 288, 20203161. [Google Scholar] [CrossRef] [PubMed]
- Boisseau, R.P.; Vogel, D.; Dussutour, A. Habituation in non-neural organisms: Evidence from slime moulds. Proc. Biol. Sci. 2016, 283, 20160446. [Google Scholar] [CrossRef] [PubMed]
- Cabrera, D.; Cabrera, L.; Powers, E. A Unifying Theory of Systems Thinking with Psychosocial Applications. Syst. Res. 2015, 32, 534–545. [Google Scholar] [CrossRef]
- Simon, H.A. The Architecture of Complexity. Proc. Am. Philos. Soc. 1962, 106, 467–482. [Google Scholar]
- Anderson, J.R. The adaptive nature of human categorization. Psychol. Rev. 1991, 98, 409. [Google Scholar] [CrossRef]
- Di Pellegrino, G. Categorization in single neurons. Trends Cogn. Sci. 2001, 5, 186. [Google Scholar] [CrossRef]
- Muehlhaus, J.; Heim, S.; Altenbach, F.; Chatterjee, A.; Habel, U.; Sass, K. Deeper insights into semantic relations: An fMRI study of part-whole and functional associations. Brain Lang. 2014, 129, 30–42. [Google Scholar] [CrossRef]
- Montoro, P.R.; Luna, D.; Ortells, J.J. Subliminal Gestalt grouping: Evidence of perceptual grouping by proximity and similarity in absence of conscious perception. Conscious. Cogn. 2014, 25, 1–8. [Google Scholar] [CrossRef]
- Baron-Cohen, S.; Ashwin, E.; Ashwin, C.; Tavassoli, T.; Chakrabarti, B. Talent in autism: Hyper-systemizing, hyper-attention to detail and sensory hypersensitivity. Philos. Trans. R. Soc. Lond. B Biol. Sci. 2009, 364, 1377–1383. [Google Scholar] [CrossRef] [Green Version]
- Lewin, K. Dynamic Theory of Personality; Read Books Ltd.: Redditch, UK, 1935. [Google Scholar]
- Mooney, R.L. Perception, language, and the part-whole problem. In Psychology of Reading; Garrard Press: New York, NY, USA, 1951. [Google Scholar]
- Ackoff, R.L. Towards a System of Systems Concepts. Manag. Sci. 1971, 17, 661–671. [Google Scholar] [CrossRef]
- Solomon, K.O.; Medin, D.L.; Lynch, E. Concepts do more than categorize. Trends Cogn. Sci. 1999, 3, 99–105. [Google Scholar] [CrossRef]
- Tversky, B.; Hemenway, K. Objects, parts, and categories. J. Exp. Psychol. Gen. 1984, 113, 169. [Google Scholar] [CrossRef] [PubMed]
- Glushko, R.J.; Maglio, P.P.; Matlock, T.; Barsalou, L.W. Categorization in the wild. Trends Cogn. Sci. 2008, 12, 129–135. [Google Scholar] [CrossRef] [PubMed]
- Liberman, Z.; Woodward, A.L.; Kinzler, K.D. The Origins of Social Categorization. Trends Cogn. Sci. 2017, 21, 556–568. [Google Scholar] [CrossRef]
- Fisher, M.; Keil, F.C. The Binary Bias: A Systematic Distortion in the Integration of Information. Psychol. Sci. 2018, 29, 1846–1858. [Google Scholar] [CrossRef]
- Kominsky, J.F.; Strickland, B.; Wertz, A.E.; Elsner, C.; Wynn, K.; Keil, F.C. Categories and Constraints in Causal Perception. Psychol. Sci. 2017, 28, 1649–1662. [Google Scholar] [CrossRef]
- Weily, J. Review of Cybernetics or Control and Communication in the Animal and the Machine. Psychol. Bull. 1951, 46, 236–237. [Google Scholar]
- Wiener, N. Cybernetics or Control and Communication in the Animal and the Machine; MIT Press: Cambridge, MA, USA, 1961. [Google Scholar]
- Clement, C.A.; Falmagne, R.J. Logical reasoning, world knowledge, and mental imagery: Interconnections in cognitive processes. Mem. Cogn. 1986, 24, 299–307. [Google Scholar] [CrossRef] [Green Version]
- Gopnik, A.; Glymour, C.; Sobel, D.M.; Schulz, L.E.; Kushnir, T.; Danks, D. A theory of causal learning in children: Causal maps and Bayes nets. Psychol. Rev. 2004, 111, 3–32. [Google Scholar] [CrossRef] [Green Version]
- Schulz, L.E.; Gopnik, A. Causal learning across domains. Dev. Psychol. 2004, 40, 162–176. [Google Scholar] [CrossRef] [Green Version]
- Greene, A.J. Making Connections. Sci. Am. Mind. 2010, 21, 22–29. [Google Scholar] [CrossRef]
- Piao, Y.; Yao, G.; Jiang, H.; Huang, S.; Huang, F.; Tang, Y.; Liu, Y.; Chen, Q. Do pit vipers assess their venom? Defensive tactics of Deinagkistrodon acutus shift with changed venom reserve. Toxicon 2021, 199, 101–108. [Google Scholar] [CrossRef] [PubMed]
- Chersi, F.; Ferro, M.; Pezzulo, G.; Pirrelli, V. Topological self-organization and prediction learning support both action and lexical chains in the brain. Top. Cogn. Sci. 2014, 6, 476–491. [Google Scholar] [CrossRef] [PubMed] [Green Version]
- Ferry, A.L.; Hespos, S.J.; Gentner, D. Prelinguistic Relational Concepts: Investigating Analogical Processing in Infants. Child Dev. 2015, 86, 1386–1405. [Google Scholar] [CrossRef] [PubMed] [Green Version]
- Harris, P.L.; German, T.; Mills, P. Children’s use of counterfactual thinking in causal reasoning. Cognition 1996, 61, 233–259. [Google Scholar] [CrossRef]
- Mascalzoni, E.; Regolin, L.; Vallortigara, G.; Simion, F. The cradle of causal reasoning: Newborns preference for physical causality. Dev. Sci. 2013, 16, 327–335. [Google Scholar] [CrossRef] [PubMed]
- Rolfs, M.; Dambacher, M.; Cavanagh, P. Visual adaptation of the perception of causality. Curr. Biol. 2013, 23, 250–254. [Google Scholar] [CrossRef] [Green Version]
- Dhamala, M. What is the nature of causality in the brain?—Inherently probabilistic: Comment on “Foundational perspectives on causality in large-scale brain networks” by M. Mannino and S.L. Bressler. Phys. Life Rev. 2015, 15, 139–140. [Google Scholar] [CrossRef] [Green Version]
- Sanefuji, W.; Haryu, E. Preschoolers’ Development of Theory of Mind: The Contribution of Understanding Psychological Causality in Stories. Front. Psychol. 2018, 9, 955. [Google Scholar] [CrossRef] [Green Version]
- Cabrera, D.; Cabrera, L.; Cabrera, E. An Ecology of Studies on Action-Reaction Relationships: Research into Universals of Systems Thinking and Cognitive Complexity in Mind and Nature. J. Syst. Think. 2021, 10, 21. [Google Scholar]
- Marvin, R.S.; Greenberg, M.T.; Mossler, D.G. The Early Development of Conceptual Perspective Taking: Distinguishing among Multiple Perspectives. Child Dev. 1976, 47, 511–514. [Google Scholar] [CrossRef]
- Premack, D.; Woodruff, G. Does the chimpanzee have a theory of mind? Behav. Brain Sci. 1978, 1, 515–526. [Google Scholar] [CrossRef] [Green Version]
- Endler, J.A. Bowerbirds, art and aesthetics: Are bowerbirds artists and do they have an aesthetic sense? Commun. Integr. Biol. 2012, 5, 281–283. [Google Scholar] [CrossRef]
- Thomas, B. Ravens attribute visual access to unseen competitors. Nat. Commun. 2016, 7, 1–6. [Google Scholar]
- Chamovitz, D. What a Plant Knows: A Field Guide to the Senses. Plant Prot. Q. 2012, 27, 116. [Google Scholar]
- Montesinos-Navarro, A.; Storer, I.; Perez-Barrales, R. Benefits for nurse and facilitated plants emerge when interactions are considered along the entire life-span. Perspect. Plant Ecol. Evol. Syst. 2019, 41, 125483. [Google Scholar] [CrossRef]
- Baron-Cohen, S.; Leslie, A.M.; Frith, U. Does the autistic child have a “theory of mind”? Cognition 1985, 21, 37–46. [Google Scholar] [CrossRef]
- Vallar, G.; Lobel, E.; Galati, G.; Berthoz, A.; Pizzamiglio, L.; Le Bihan, D. A fronto-parietal system for computing the egocentric spatial frame of reference in humans. Exp. Brain Res. 1999, 124, 281–286. [Google Scholar] [CrossRef]
- Dyson, F. Disturbing the Universe; Basic Books Inc.: New York, NY, USA, 1979. [Google Scholar]
- Zwick, A.; Álvarez, G.A.; Kurizki, G. Maximizing Information on the Environment by Dynamically Controlled Qubit Probes. Phys. Rev. Applied 2016, 5, 014007. [Google Scholar] [CrossRef]
- Álvarez, G.A. Email To Cabrera: “RE: Question about Your Article on Qubit Probes”; 2021. Available online: https://tinyurl.com/4876tv64 (accessed on 15 November 2021).
- Ruby, P.; Decety, J. How would you feel versus how do you think she would feel? A neuroimaging study of perspective-taking with social emotions. J. Cogn. Neurosci. 2004, 16, 988–999. [Google Scholar] [CrossRef]
- Russell, J.; Alexis, D.; Clayton, N. Episodic future thinking in 3- to 5-year-old children: The ability to think of what will be needed from a different point of view. Cognition 2010, 114, 56–71. [Google Scholar] [CrossRef] [PubMed]
- Rakoczy, H.; Wandt, R.; Thomas, S.; Nowak, J.; Kunzmann, U. Theory of mind and wisdom: The development of different forms of perspective-taking in late adulthood. Br. J. Psychol. 2018, 109, 6–24. [Google Scholar] [CrossRef] [PubMed] [Green Version]
- Mafessoni, F.; Lachmann, M. The complexity of understanding others as the evolutionary origin of empathy and emotional contagion. Sci. Rep. 2019, 9, 5794. [Google Scholar] [CrossRef] [PubMed]
- Tversky, A.; Kahneman, D. The Framing of Decisions and the Psychology of Choice. In Behavioral Decision Making; Springer: Boston, MA, USA, 1985. [Google Scholar]
- Schober, M.F. Spatial perspective-taking in conversation. Cognition 1993, 47, 1–24. [Google Scholar] [CrossRef]
- Bateson, G. Perspective Taking: Imagining how another would feel versus imagining how you would feel. Personal. Soc. Psychol. Bull. 1997, 23, 751–758. [Google Scholar] [CrossRef]
- Knowles, M.L. Social rejection increases perspective taking. J. Exp. Soc. Psychol. 2014, 55, 126–132. [Google Scholar] [CrossRef]
- Cavallo, A.; Ansuini, C.; Capozzi, F.; Tversky, B.; Becchio, C. When Far Becomes Near. Psychol. Sci. 2017, 28, 69–79. [Google Scholar] [CrossRef]
- Neale, M.A.; Bazerman, M.H. The Role of Perspective-Taking Ability in Negotiating under Different Forms of Arbitration. ILR Rev. 1983, 36, 378–388. [Google Scholar] [CrossRef]
- Galinsky, A.D.; Moskowitz, G.B. Perspective-taking: Decreasing stereotype expression, stereotype accessibility, and in-group favoritism. J. Pers. Soc. Psychol. 2000, 78, 708–724. [Google Scholar] [CrossRef]
- Takaku, S.; Weiner, B.; Ohbuchi, K.I. A cross-cultural examination of the effects of apology and perspective taking on forgiveness. J. Lang. Soc. Psychol. 2001, 20, 144–166. [Google Scholar] [CrossRef] [Green Version]
- Parker, S.K.; Axtell, C.M. Seeing Another Viewpoint: Antecedents and Outcomes of Employee Perspective Taking. Acad. Manag. J. 2001, 44, 1085–1100. [Google Scholar]
- Epley, N.; Keysar, B.; Van Boven, L.; Gilovich, T. Perspective taking as egocentric anchoring and adjustment. J. Pers. Soc. Psychol. 2004, 87, 327–339. [Google Scholar] [CrossRef] [PubMed] [Green Version]
- Davis, M.H.; Soderlund, T.; Cole, J.; Gadol, E.; Kute, M.; Myers, M.; Weihing, J. Cognitions associated with attempts to empathize: How do we imagine the perspective of another? Pers. Soc. Psychol. Bull. 2004, 30, 1625–1635. [Google Scholar] [CrossRef]
- Harwood, M.D.; Farrar, M.J. Conflicting emotions: The connection between affective perspective taking and theory of mind. Br. J. Dev. Psychol. 2006, 24, 401–418. [Google Scholar] [CrossRef]
- Tversky, B.; Hard, B.M. Embodied and disembodied cognition: Spatial perspective-taking. Cognition 2009, 110, 124–129. [Google Scholar] [CrossRef] [PubMed]
- Wang, C.S.; Tai, K.; Ku, G.; Galinsky, A.D.; Urgesi, C. Perspective-Taking Increases Willingness to Engage in Intergroup Contact. PLoS ONE 2014, 9, e85681. [Google Scholar] [CrossRef]
- Ben-Ami Bartal, I.; Decety, J.; Mason, P. Empathy and pro-social behavior in rats. Science 2011, 334, 1427–1430. [Google Scholar] [CrossRef] [Green Version]
- Satoh, S.; Bshary, R.; Shibasaki, M.; Inaba, S.; Sogawa, S.; Hotta, T.; Awata, S.; Kohda, M. Prosocial and antisocial choices in a monogamous cichlid with biparental care. Nat. Commun. 2021, 12, 1775. [Google Scholar] [CrossRef]
- Gagliano, M.; Renton, M.; Depczynski, M.; Mancuso, S. Experience teaches plants to learn faster and forget slower in environments where it matters. Oecologia 2014, 175, 63–72. [Google Scholar] [CrossRef]
- Gagliano, M. Inside the Vegetal Mind: On the Cognitive Abilities of Plants. In Memory and Learning in Plants; Baluska, F., Gagliano, M., Witzany, G., Eds.; Springer International Publishing: Cham, Switzerland, 2018; pp. 215–220. [Google Scholar]
- Cabrera, L.; Cabrera, D. Systems Thinking & Metacognition Inventory (STMI): A Validated Test of Systems Thinking. In The Routledge Handbook for Systems Thinking; Cabrera, L., Cabrera, D., Midgley, G., Eds.; Routledge Press: London, UK, 2021. [Google Scholar]
- Fleming, S.M. Metacognition Is the Forgotten Secret to Success Insight into Our Own Thoughts, or Metacognition, Is Key to High Achievement in All Domains; Scientific American Mind: New York, NY, USA, 2014. [Google Scholar]
- Flavell, J.H. Metacognition and cognitive monitoring: A new area of cognitive–developmental inquiry. Am. Psychol. 1979, 34, 906–911. [Google Scholar] [CrossRef]
- Flavell, J.H. Metacognitive Aspects of Problem Solving. In The Nature of Intelligence; Resnick, L.B., Ed.; Erlbaum: Hillsdale, NJ, USA, 1976; pp. 231–236. [Google Scholar]
- Piaget, J. The Psychology of Intelligence; Routledge: London, UK, 1950. [Google Scholar]
- Akturk, A.O.; Sahin, I. Literature Review on Metacognition and its Measurement. Procedia Soc. Behav. Sci. 2011, 15, 3731–3736. [Google Scholar] [CrossRef] [Green Version]
- Lewis, M.L.; Frank, M.C. The length of words reflects their conceptual complexity. Cognition 2016, 153, 182–195. [Google Scholar] [CrossRef] [PubMed] [Green Version]
- De Brey, C.; Musu, L.; McFarland, J. Status and Trends in the Education of Racial and Ethnic Groups 2018; National Center for Education Statistics: Washington, DC, USA, 2018.
- Aud, S.; Fox, M.A.; KewalRamani, A. Status and Trends in the Education of Racial and Ethnic Groups; National Center for Education Statistics: Washington, DC, USA, 2010.


| Existential (Basic Research) | Efficacy (Applied Research) | |
| Mind (cognitive complexity) | Does DSRP Exist in Mind? (i.e., Does DSRP exist as universal, material, observable cognitive phenomena?) | Is Metacognitive Awareness of DSRP Effective? (i.e., Does it increase ability to align cognitive complexity to real-world complexity? (a.k.a., parallelism) |
| Nature (ontological complexity) | Does DSRP Exist in Nature? (i.e., Does DSRP exist as universal, material, observable phenomena?) | |
| EMPIRICAL BASIS | ||
Things to consider from the identity–other Distinction Rule (D):
|
Things to consider from the part–whole Systems Rule (S):
|
Things to consider from the action–reaction Relationships Rule (R):
|
Things to consider from the point-view Perspectives Rule (P):
|
| D-treatment | 28.11 s |
| S-treatment | 35.19 s |
| R-treatment | 51.91 s |
| P-treatment | 50:40 s |
| Total | 165.61 s |
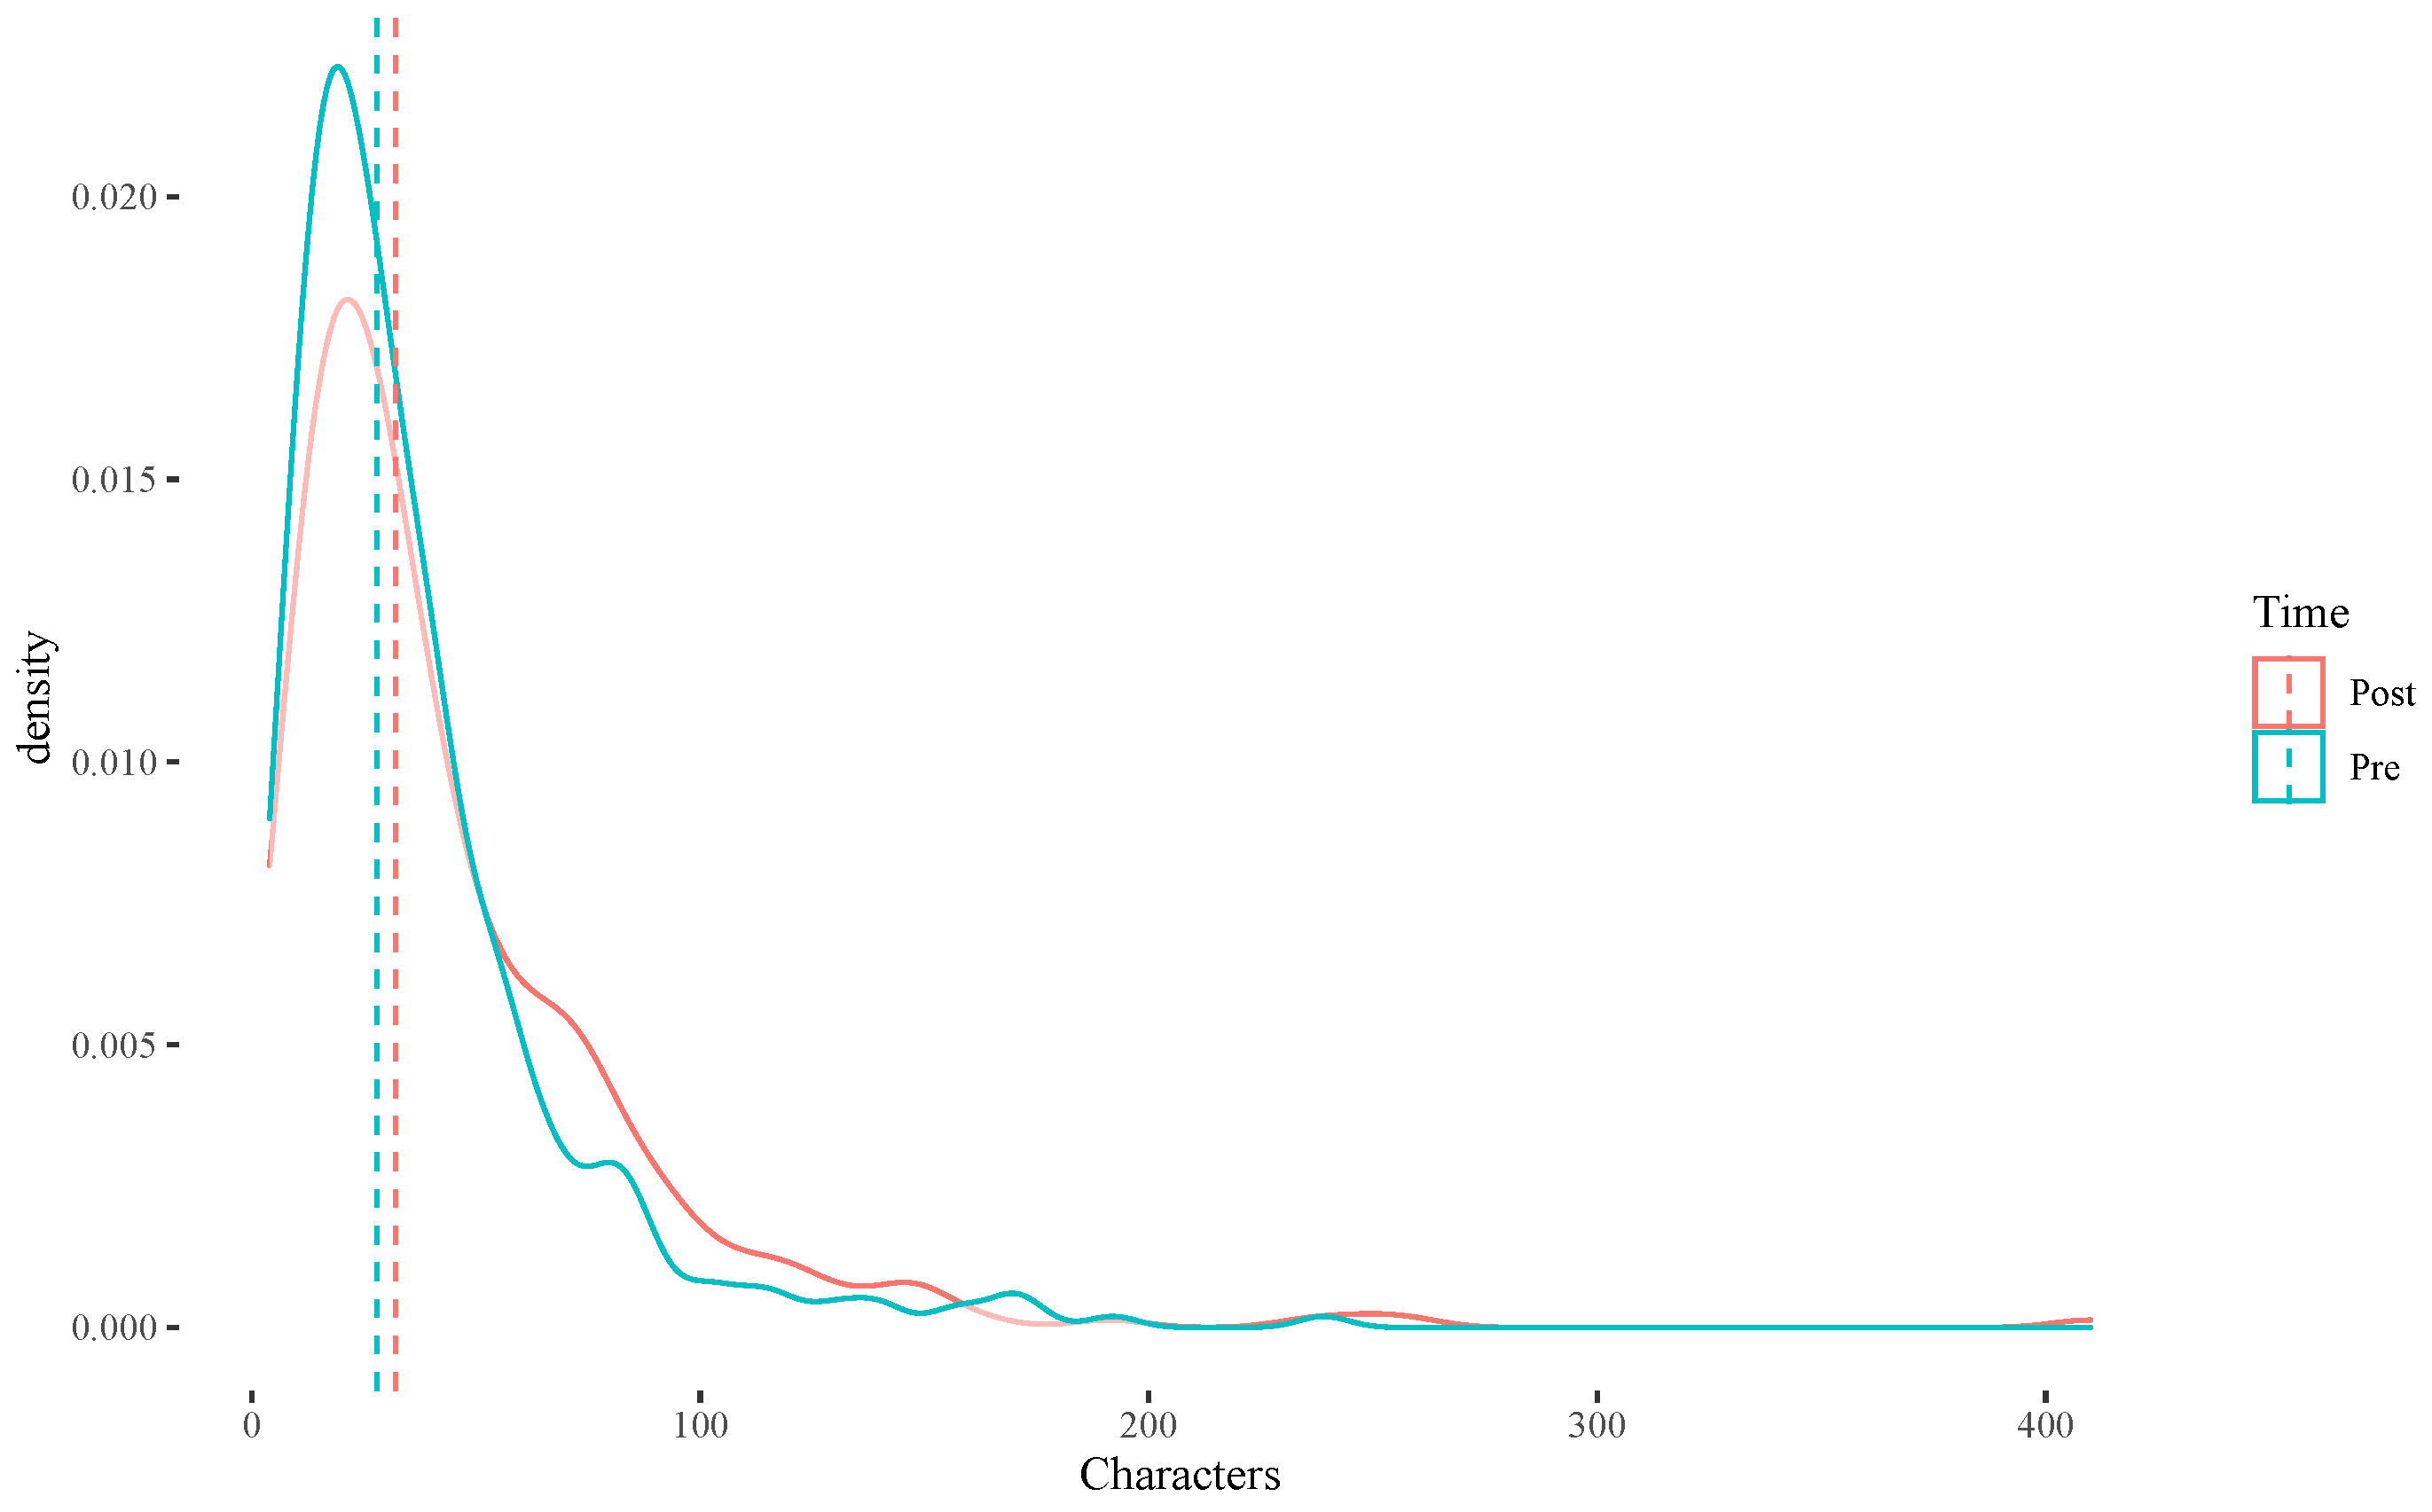
| PreD | PostD |
|---|---|
 |  |
| PreD | PostD | Difference | |
|---|---|---|---|
| Number of characters (including spaces) | 17,691 | 24,308 | +27.22% |
| Number of characters (without spaces) | 10,291 | 14,752 | +30.24% |
| Number of words (including repeated words) | 2098 | 3071 | +31.68% |
| Number of syllables (including repeated words) | 3246 | 4558 | +28.78% |
| Unique words | 251 | 453 | +44.59% |
| Number of characters (no spaces) for unique words | 1418 | 2626 | +46.00% |
| Number of syllables for unique words | 492 | 901 | +45.39% |
| Total unique words occurrence | 1832 | 2680 | +31.64% |
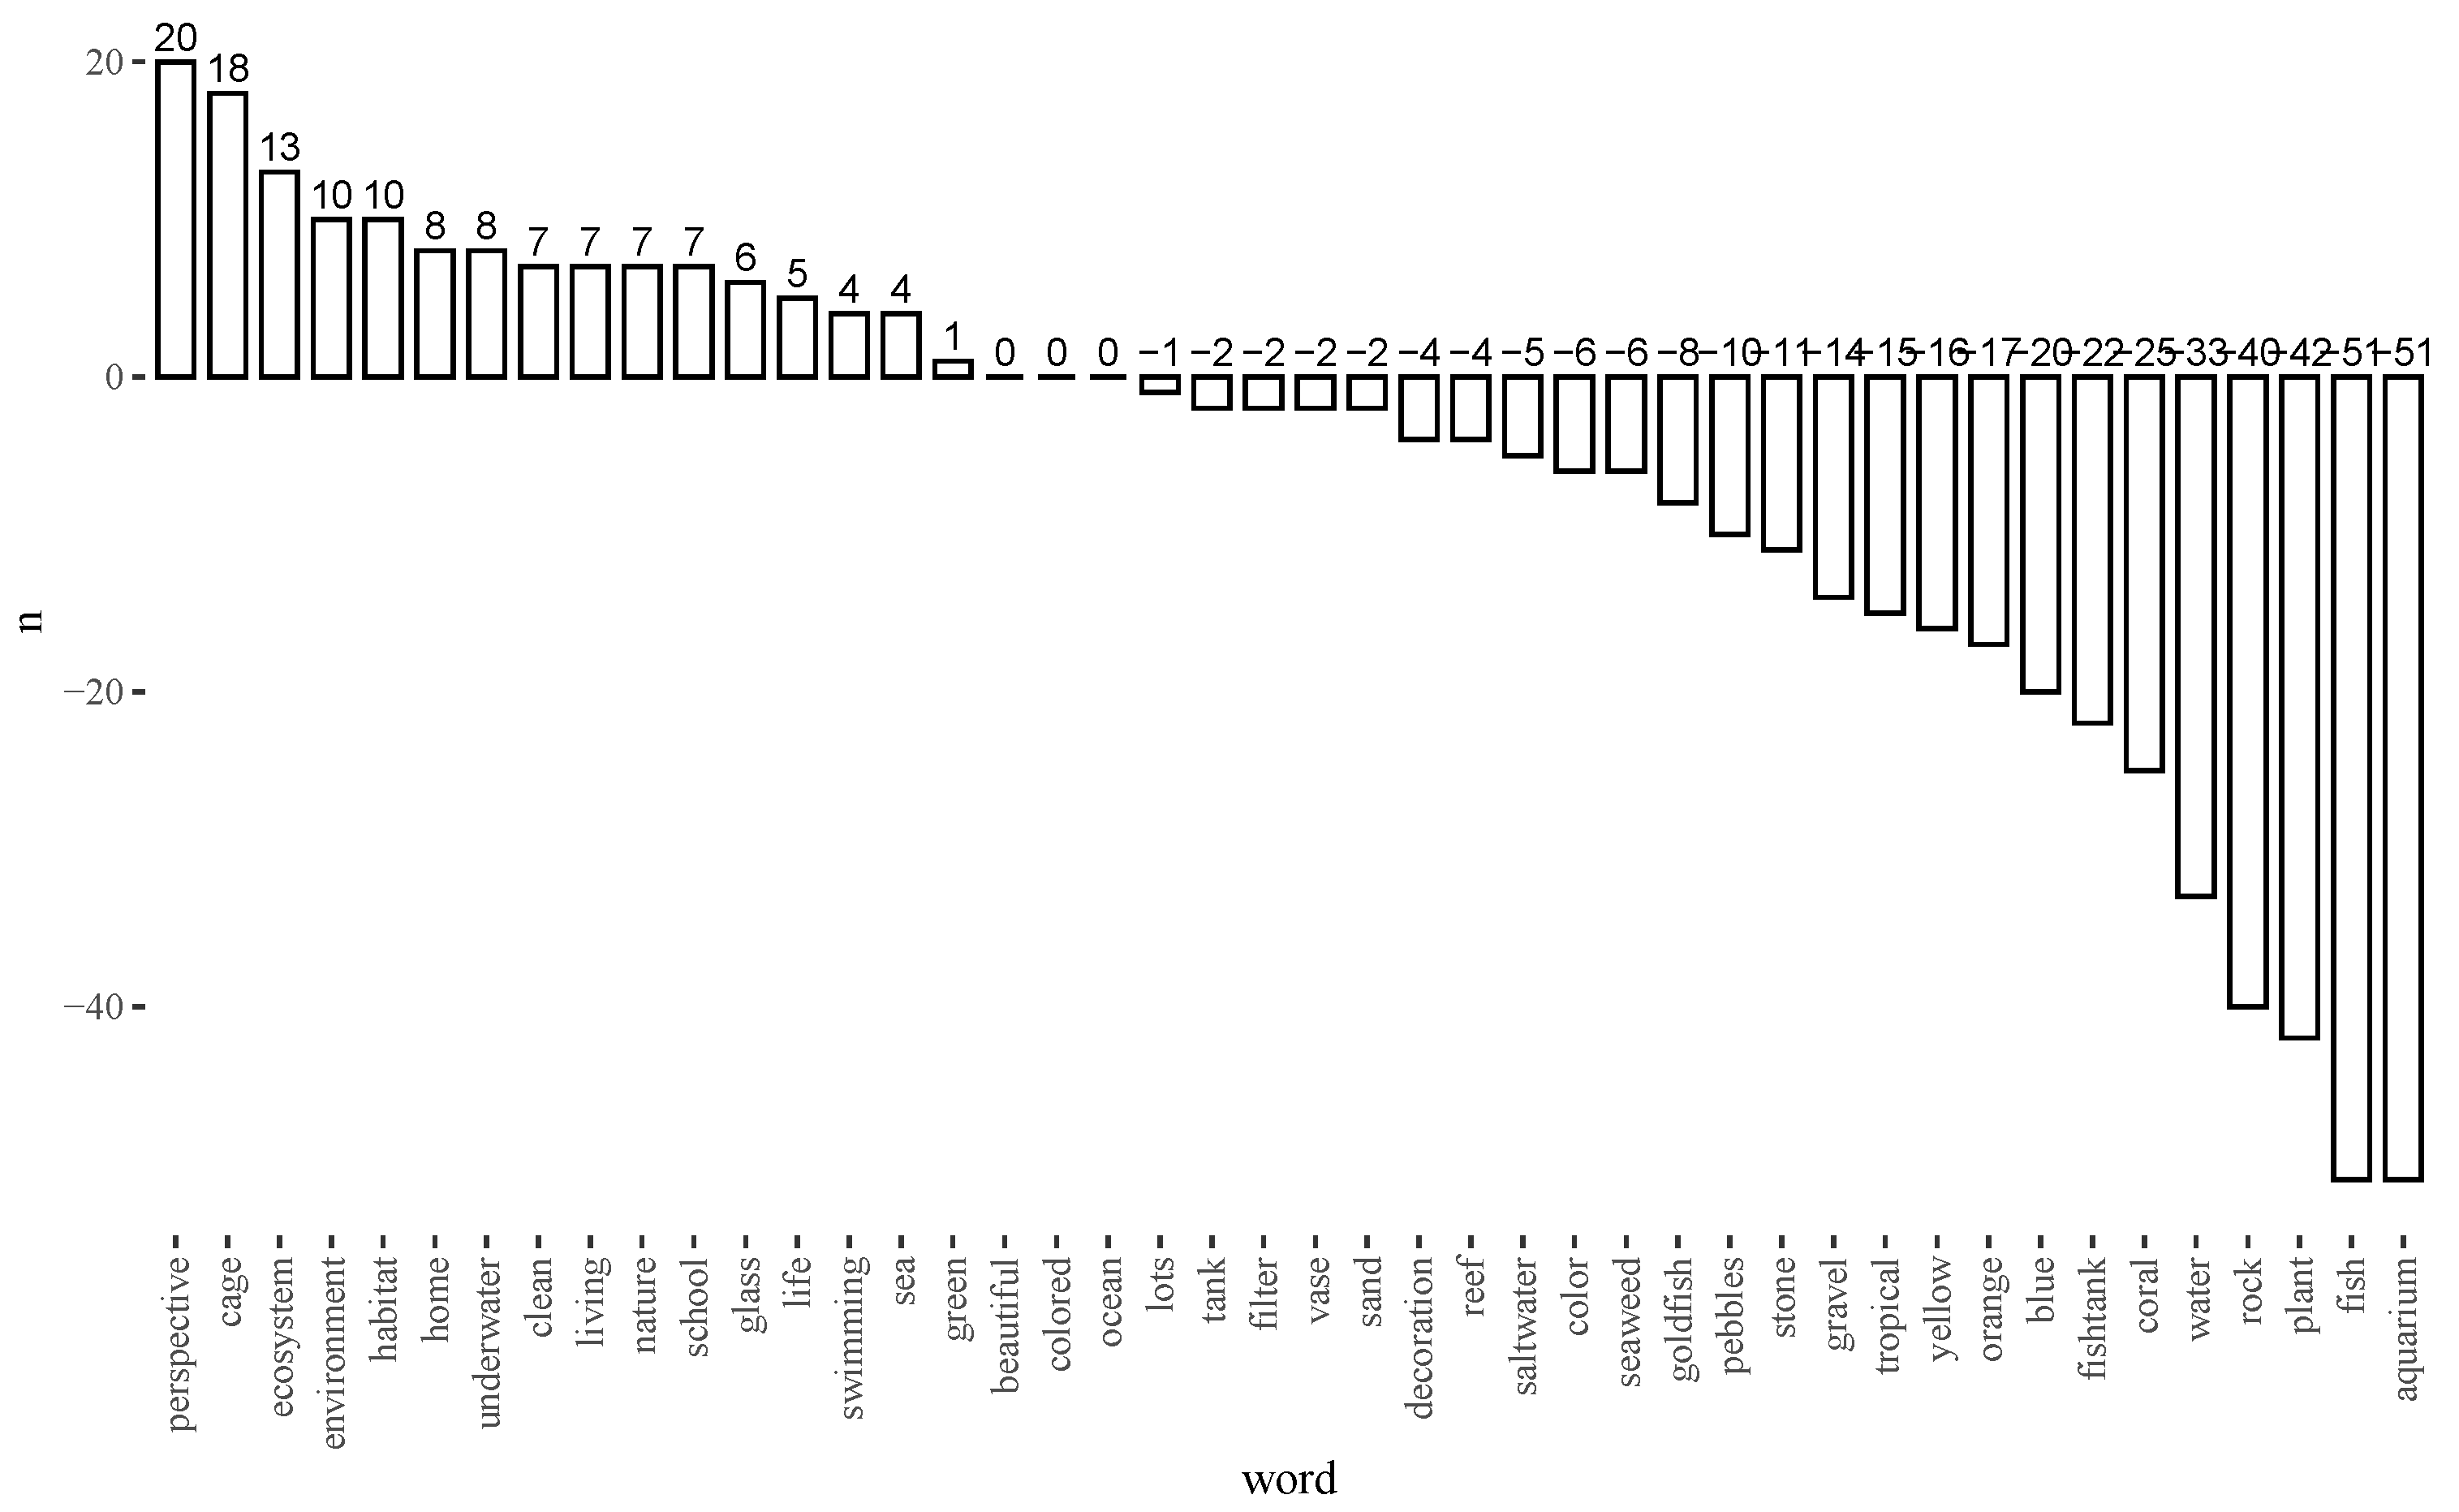
| PreD | PostD |
|---|---|
 |  |
| PreD Top 10 Words | PostD Top 10 Words |
|---|---|
| Fish | Fish |
| Water | Blue |
| Aquarium | Yellow |
| Fish tank | Water |
| Rock | Rock |
| Plant | Plant |
| Color | Orange |
| Blue | Aquarium |
| Tank | Color |
| Coral | Green |
| PreD (Total 1848) | PostD (Total 2695) | |||||
|---|---|---|---|---|---|---|
| Rank | Word | Occurs | % | Word | Occurs | % |
| 1 | fish | 410 | 22.19% | fish | 542 | 20.11% |
| 2 | water | 124 | 6.71% | blue | 145 | 5.38% |
| 3 | aquarium | 118 | 6.39% | yellow | 115 | 4.27% |
| 4 | fish tank | 92 | 4.98% | water | 114 | 4.23% |
| 5 | rock | 85 | 4.60% | rock | 98 | 3.64% |
| 6 | plant | 84 | 4.55% | plant | 80 | 2.97% |
| 7 | color | 65 | 3.52% | orange | 74 | 2.75% |
| 8 | blue | 52 | 2.81% | aquarium | 66 | 2.45% |
| 9 | tank | 43 | 2.33% | color | 56 | 2.08% |
| 10 | coral | 41 | 2.22% | green | 47 | 1.74% |
| 11 | yellow | 27 | 1.46% | goldfish | 42 | 1.56% |
| 12 | stone | 24 | 1.30% | tank | 40 | 1.48% |
| 13 | see | 22 | 1.19% | fish tank | 40 | 1.48% |
| 14 | beautiful | 20 | 1.08% | coral | 35 | 1.30% |
| 15 | tropical | 17 | 0.92% | different | 31 | 1.15% |
| 16 | orange | 17 | 0.92% | small | 27 | 1.00% |
| 17 | gravel | 16 | 0.87% | white | 22 | 0.82% |
| 18 | goldfish | 15 | 0.81% | beautiful | 20 | 0.74% |
| 19 | pebbles | 15 | 0.81% | stone | 19 | 0.71% |
| 20 | different | 13 | 0.70% | pebbles | 19 | 0.71% |
| 21 | lots | 12 | 0.65% | gravel | 17 | 0.63% |
| 22 | grass | 11 | 0.60% | swimming | 17 | 0.63% |
| 23 | swimming | 11 | 0.60% | with | 17 | 0.63% |
| 24 | some | 11 | 0.60% | see | 17 | 0.63% |
| 25 | seaweed | 10 | 0.54% | many | 16 | 0.59% |
| 26 | decorations | 10 | 0.54% | vase | 16 | 0.59% |
| 27 | very | 9 | 0.49% | clear | 15 | 0.56% |
| 28 | filter | 9 | 0.49% | that | 13 | 0.48% |
| 29 | tree | 8 | 0.43% | broken | 12 | 0.45% |
| 30 | green | 8 | 0.43% | very | 12 | 0.45% |
| 31 | clean | 8 | 0.43% | red | 12 | 0.45% |
| 32 | fake | 8 | 0.43% | tropical | 11 | 0.41% |
| 33 | pipe | 7 | 0.38% | seaweed | 11 | 0.41% |
| 34 | many | 7 | 0.38% | vs | 10 | 0.37% |
| 35 | vase | 7 | 0.38% | grey | 10 | 0.37% |
| 36 | nice | 7 | 0.38% | colored | 9 | 0.33% |
| 37 | sand | 7 | 0.38% | light | 9 | 0.33% |
| 38 | life | 6 | 0.32% | large | 9 | 0.33% |
| 39 | like | 6 | 0.32% | multiple | 8 | 0.30% |
| 40 | colored | 6 | 0.32% | pipe | 8 | 0.30% |
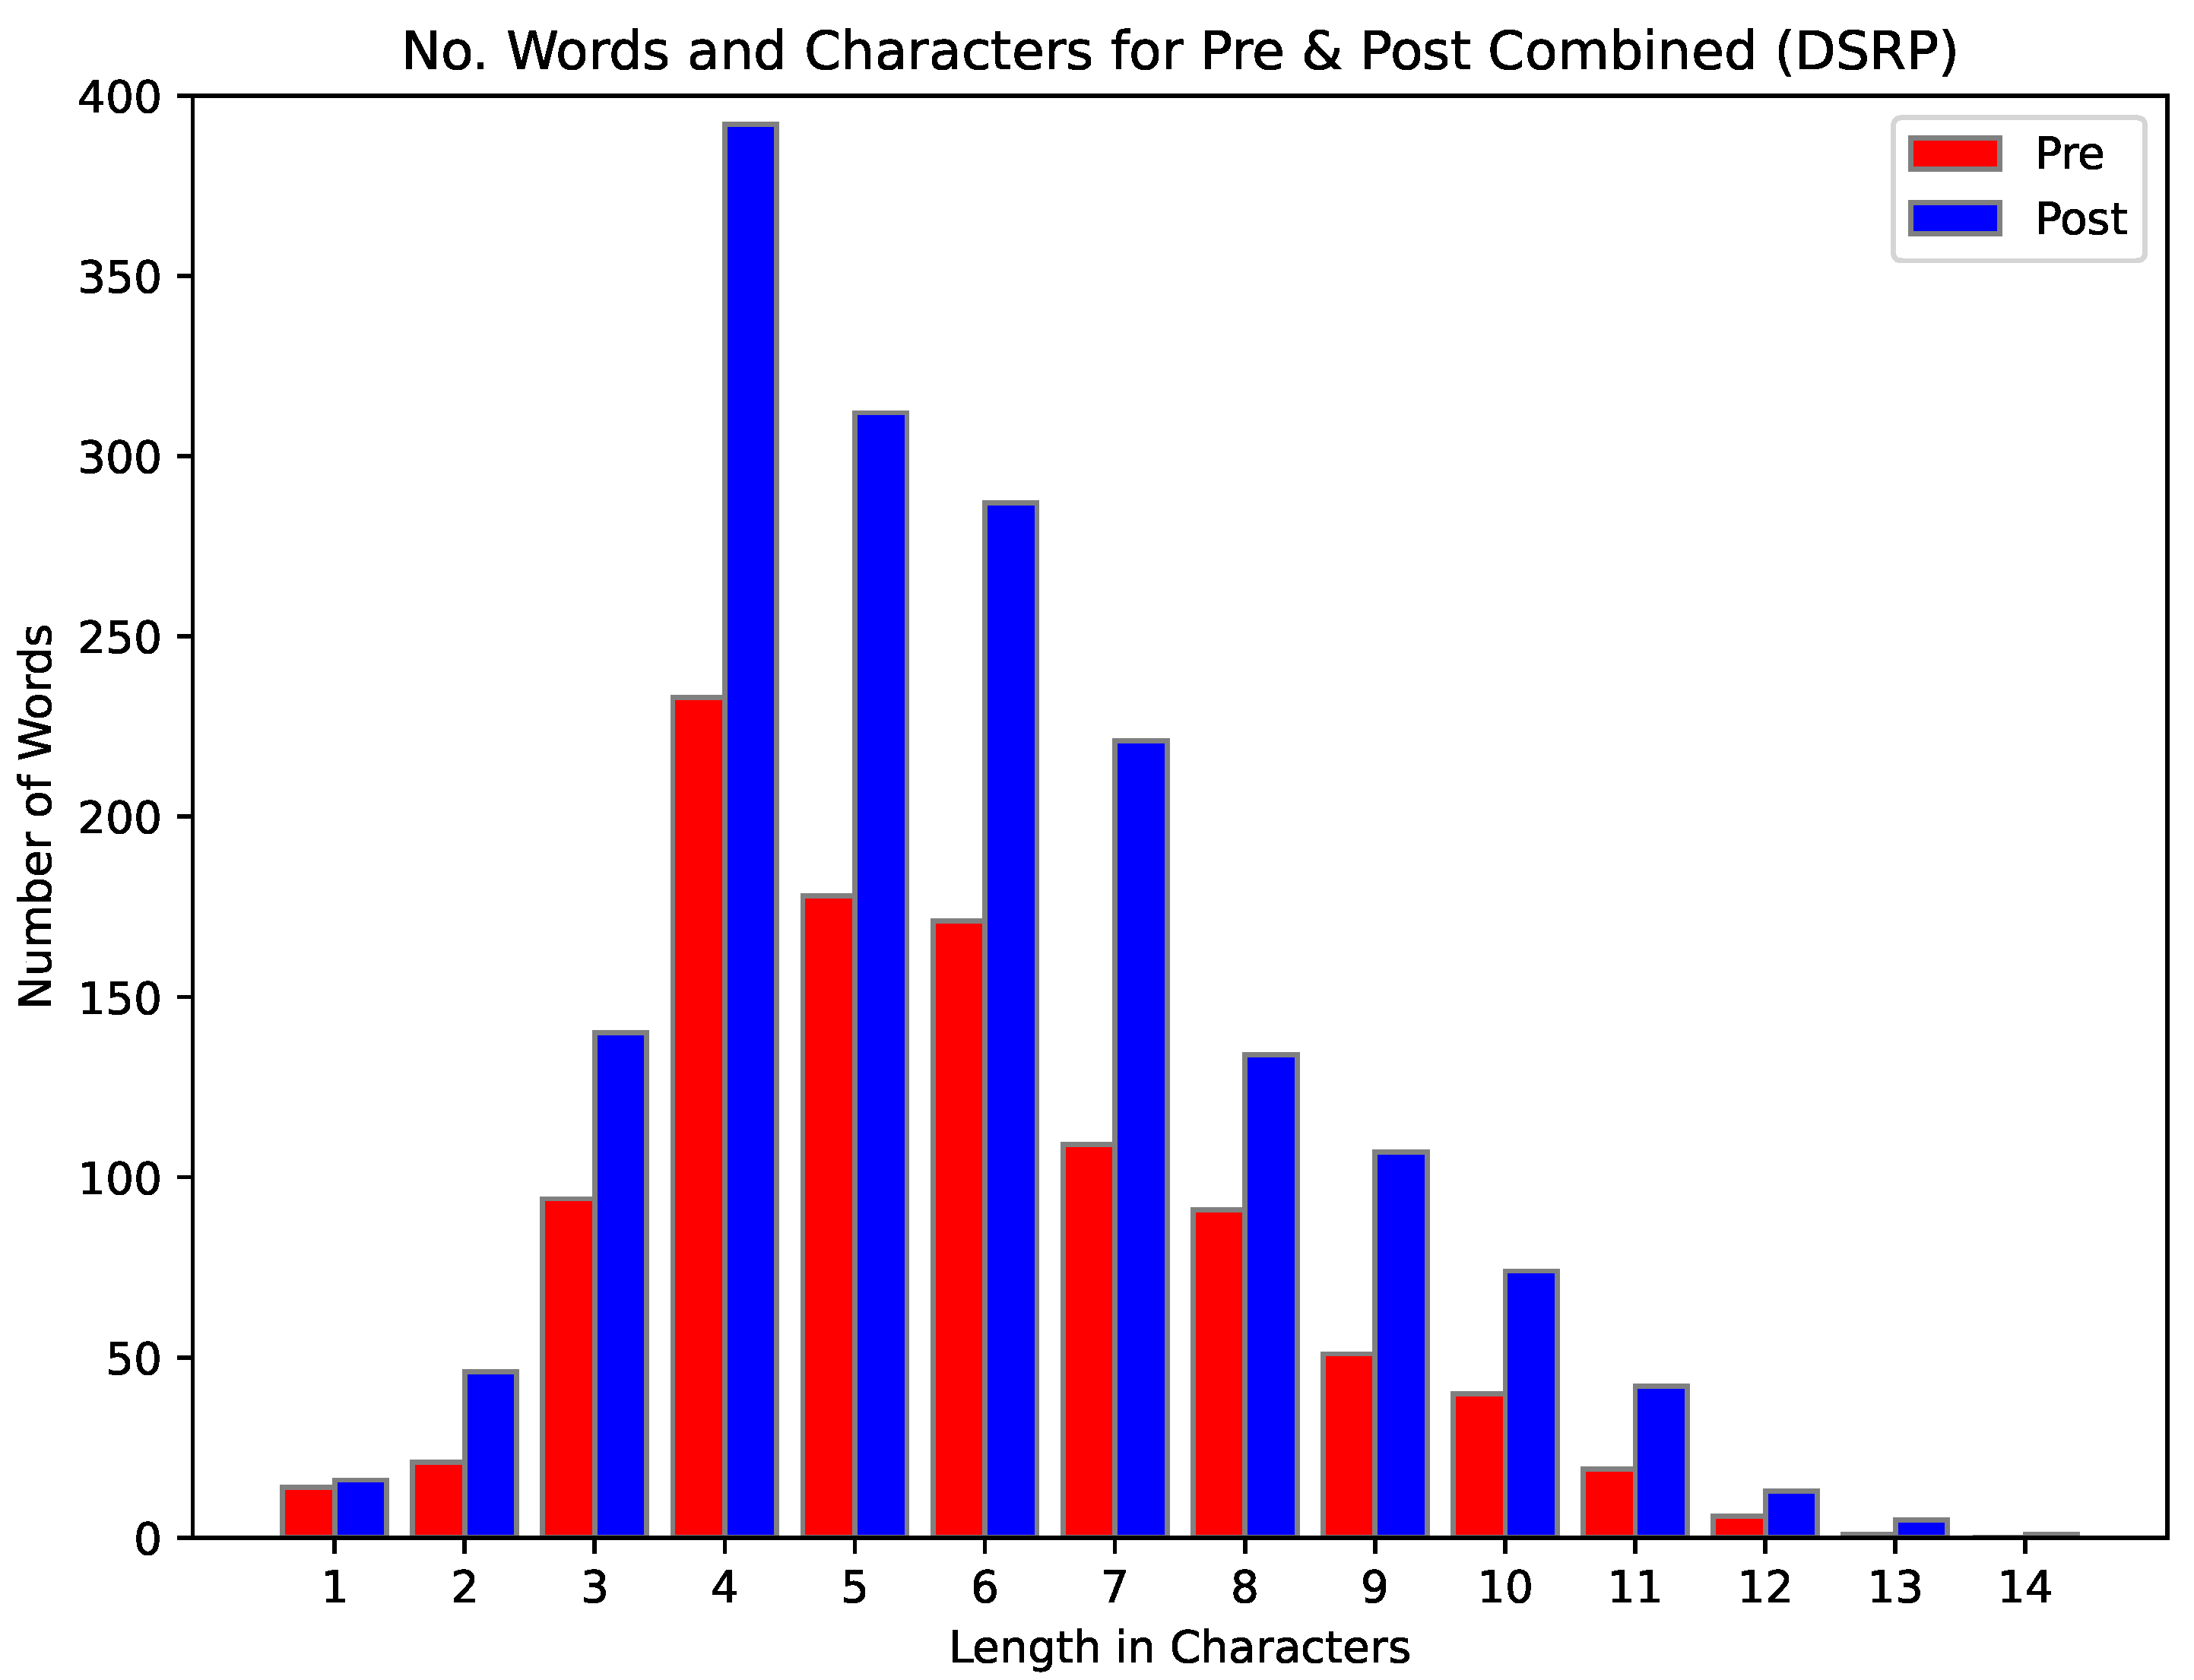
 |  |
|---|
| Pre | Post | P.overall | |
|---|---|---|---|
| No. concepts | 3.00 [1.00; 4.00] | 3.00 [1.00; 4.00] | 0.062 |
| No. words | 4.00 [3.00; 7.00] | 6.00 [3.00; 10.0] | <0.001 |
| No. characters | 21.0 [13.0; 36.0] | 29.0 [14.0; 53.0] | <0.001 |
| No. Concepts | No. Words | No. Characters | ||||
|---|---|---|---|---|---|---|
| Predictors | Incidence Rate Ratios | p | Incidence Rate Ratios | p | Incidence Rate Ratios | p |
| (Intercept) | 2.69 (1.91–3.77) | <0.001 | 3.07 (2.01–4.69) | <0.001 | 17.31 (11.43–26.21) | <0.001 |
| Time (Post vs. Pre) | 1.05 (0.97–1.14) | 0.201 | 1.43 (1.34–1.53) | <0.001 | 1.41 (1.31–1.51) | <0.001 |
| Age (1 level increase) | 0.98 (0.96–1.01) | 0.175 | 1.00 (0.97–1.04) | 0.878 | 1.01 (0.97–1.04) | 0.749 |
| Education (1 level increase) | 0.00 (0.96–1.04) | 0.913 | 1.00 (0.95–1.05) | 0.972 | 1.00 (0.95–1.04) | 0.907 |
| Ethnicity (Not Latino and/or Hispanic) | 0.97 (0.81–1.16) | 0.750 | 1.04 (0.83–1.30) | 0.734 | 1.03 (0.83–1.28) | 0.803 |
| Gender (Male) | 0.89 (0.79–1.00) | 0.053 | 0.67 (0.58–0.78) | <0.001 | 0.69 (0.60–0.80) | <0.001 |
| Marginal /Conditional | 0.013/0.365 | 0.107/0.664 | 0.095/0.621 | |||
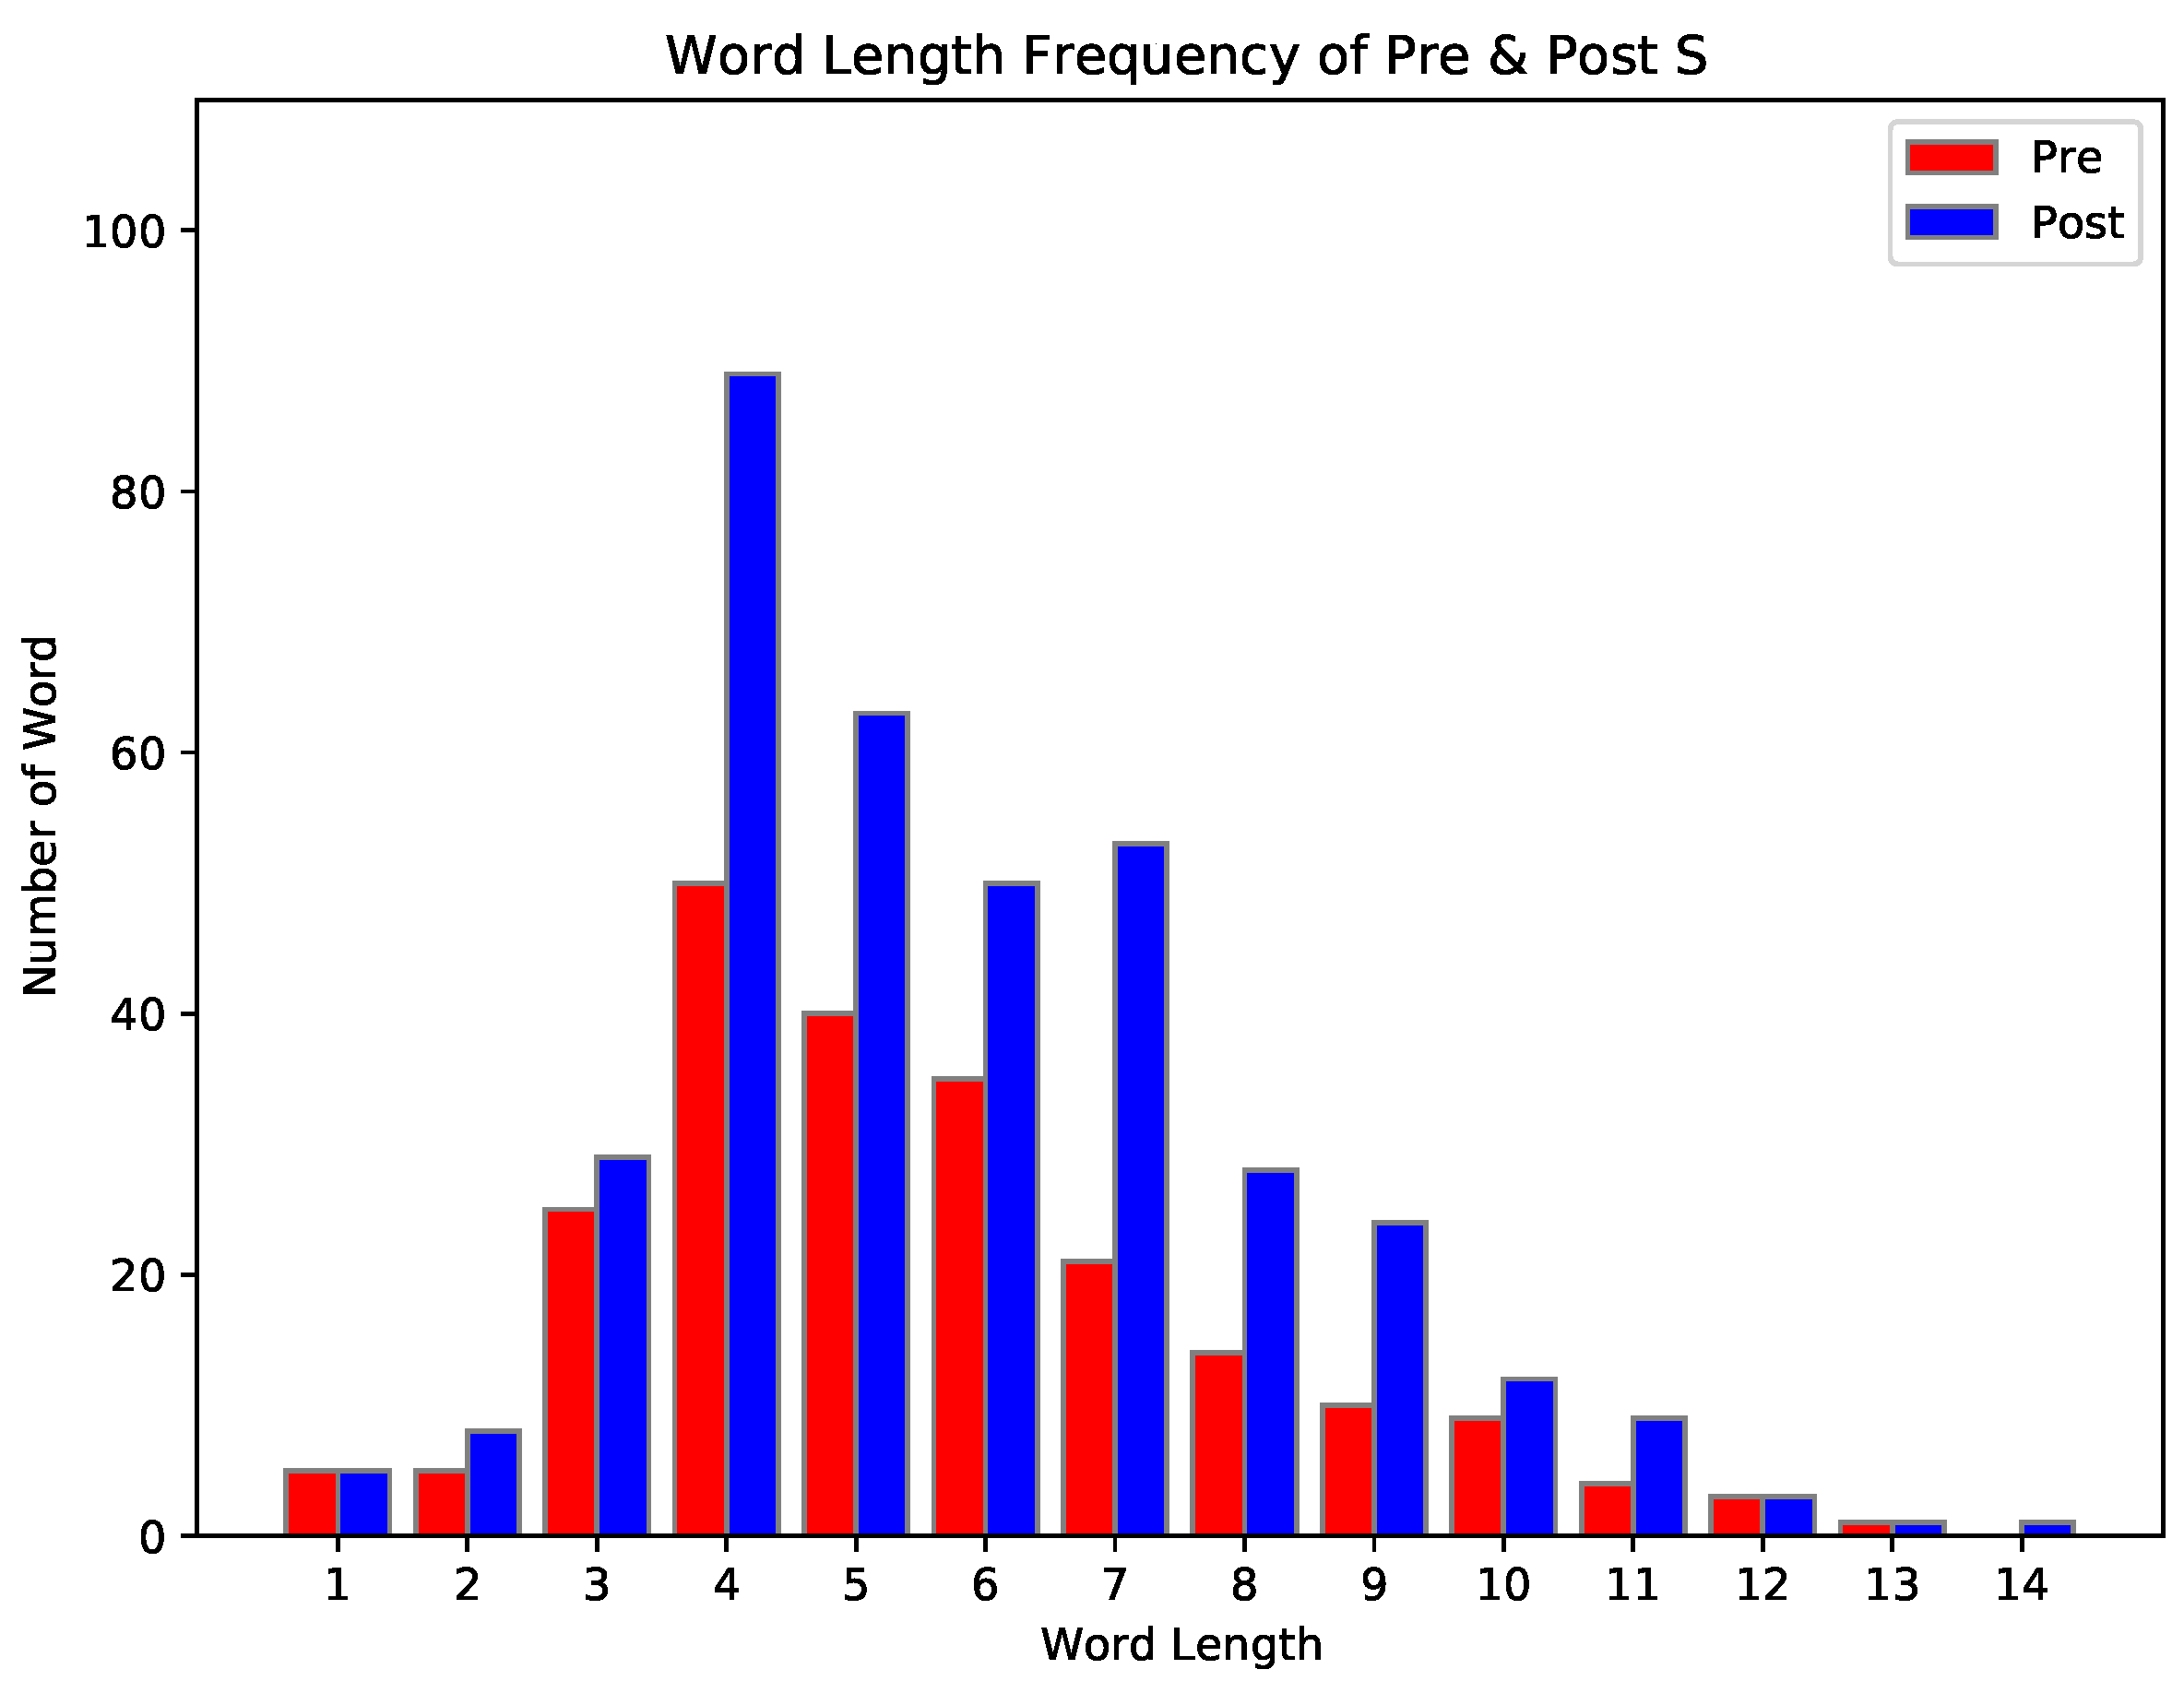
| PreS | PostS |
|---|---|
 |  |
| PreS | PostS | Difference | |
|---|---|---|---|
| Number of characters (including spaces) | 17,061 | 19,367 | +11.91% |
| Number of characters (without spaces) | 10,318 | 11,350 | +9.09% |
| Number of words (including repeated words) | 2092 | 2410 | +13.20% |
| Number of syllables (including repeated words) | 3207 | 3654 | +12.23% |
| Unique words | 243 | 416 | +41.59% |
| Number of characters (no spaces) for unique words | 1226 | 2414 | +49.21% |
| Number of syllables for unique words | 472 | 828 | +43.00% |
| Total unique words occurrence | 1911 | 2009 | +4.88% |
| PreS (Total 1911) | PostS (Total 2009) | |||||
|---|---|---|---|---|---|---|
| Rank | Word | Occurs | % | Word | Occurs | % |
| 1 | fish | 416 | 19.78% | fish | 305 | 12.66% |
| 2 | water | 136 | 6.47% | water | 145 | 6.02% |
| 3 | aquarium | 131 | 6.23% | aquarium | 92 | 3.82% |
| 4 | rock | 94 | 4.47% | plant | 92 | 3.82% |
| 5 | plant | 86 | 4.09% | rock | 68 | 2.82% |
| 6 | fish tank | 77 | 3.66% | fish tank | 56 | 2.32% |
| 7 | blue | 61 | 2.90% | tank | 44 | 1.83% |
| 8 | coral | 57 | 2.71% | and | 40 | 1.66% |
| 9 | color | 41 | 1.95% | blue | 39 | 1.62% |
| 10 | tank | 39 | 1.85% | system | 38 | 1.58% |
| 11 | yellow | 35 | 1.66% | color | 27 | 1.12% |
| 12 | gravel | 31 | 1.47% | ecosystem | 27 | 1.12% |
| 13 | orange | 31 | 1.47% | coral | 24 | 1.00% |
| 14 | and | 28 | 1.33% | gravel | 24 | 1.00% |
| 15 | stone | 22 | 1.05% | part | 23 | 0.95% |
| 16 | with | 22 | 1.05% | see | 19 | 0.79% |
| 17 | seaweed | 17 | 0.81% | stone | 18 | 0.75% |
| 18 | green | 16 | 0.76% | with | 18 | 0.75% |
| 19 | swimming | 16 | 0.76% | swimming | 16 | 0.66% |
| 20 | pebbles | 15 | 0.71% | vase | 16 | 0.66% |
| 21 | tropical | 15 | 0.71% | whole | 16 | 0.66% |
| 22 | vase | 15 | 0.71% | yellow | 15 | 0.62% |
| 23 | decorations | 14 | 0.67% | pebbles | 13 | 0.54% |
| 24 | white | 14 | 0.67% | sea | 13 | 0.54% |
| 25 | broken | 13 | 0.62% | contain | 12 | 0.50% |
| 26 | filter | 13 | 0.62% | green | 12 | 0.50% |
| 27 | reef | 12 | 0.57% | orange | 12 | 0.50% |
| 28 | see | 11 | 0.52% | this | 12 | 0.50% |
| 29 | different | 10 | 0.48% | zoom | 12 | 0.50% |
| 30 | light | 10 | 0.48% | decorations | 11 | 0.46% |
| 31 | saltwater | 10 | 0.48% | school | 11 | 0.46% |
| 32 | tree | 10 | 0.48% | different | 10 | 0.41% |
| 33 | lots | 9 | 0.43% | on | 10 | 0.41% |
| 34 | on | 9 | 0.43% | bubbles | 9 | 0.37% |
| 35 | sand | 9 | 0.43% | light | 9 | 0.37% |
| 36 | sea | 9 | 0.43% | living | 9 | 0.37% |
| 37 | bottom | 8 | 0.38% | also | 8 | 0.33% |
| 38 | many | 8 | 0.38% | glass | 8 | 0.33% |
| 39 | small | 8 | 0.38% | group | 8 | 0.33% |
| 40 | grass | 7 | 0.33% | life | 8 | 0.33% |
| Pre | Post | P.overall | |
|---|---|---|---|
| No. concepts | 3.00 [1.00; 5.00] | 3.00 [1.00; 4.00] | <0.001 |
| No. words | 4.00 [3.00; 7.00] | 4.00 [2.00; 7.00] | 0.13 |
| No. characters | 23.0 [14.0; 35.8] | 22.0 [13.0; 39.0] | 0.13 |
| No. Concepts | No. Words | No. Characters | ||||
|---|---|---|---|---|---|---|
| Predictors | Incidence Rate Ratios | p | Incidence Rate Ratios | p | Incidence Rate Ratios | p |
| Time (Post vs. Pre) | 0.87 (0.81–0.95) | <0.001 | 1.12 (1.02–1.22) | 0.015 | 1.08 (0.99–1.17) | 0.091 |
| Age (1 level increase) | 1.02 (0.99–1.04) | 0.259 | 1.06 (1.03–1.10) | <0.001 | 1.06 (1.03–1.10) | <0.001 |
| Education (1 level increase) | 0.99 (0.95–1.03) | 0.579 | 1.00 (0.96–1.05) | 0.847 | 1.01 (0.97–1.06) | 0.622 |
| Ethnicity (Not Latino and/or Hispanic) | 1.06 (0.88–1.28) | 0.538 | 0.99 (0.79–1.25) | 0.959 | 0.98 (0.79–1.22) | 0.847 |
| Gender (Male) | 0.93 (0.82–1.05) | 0.253 | 0.85 (0.73–0.99) | 0.039 | 0.85 (0.73–0.98) | 0.027 |
| Marginal /Conditional | 0.017/0.399 | 0.039/0.483 | 0.040/0.470 | |||
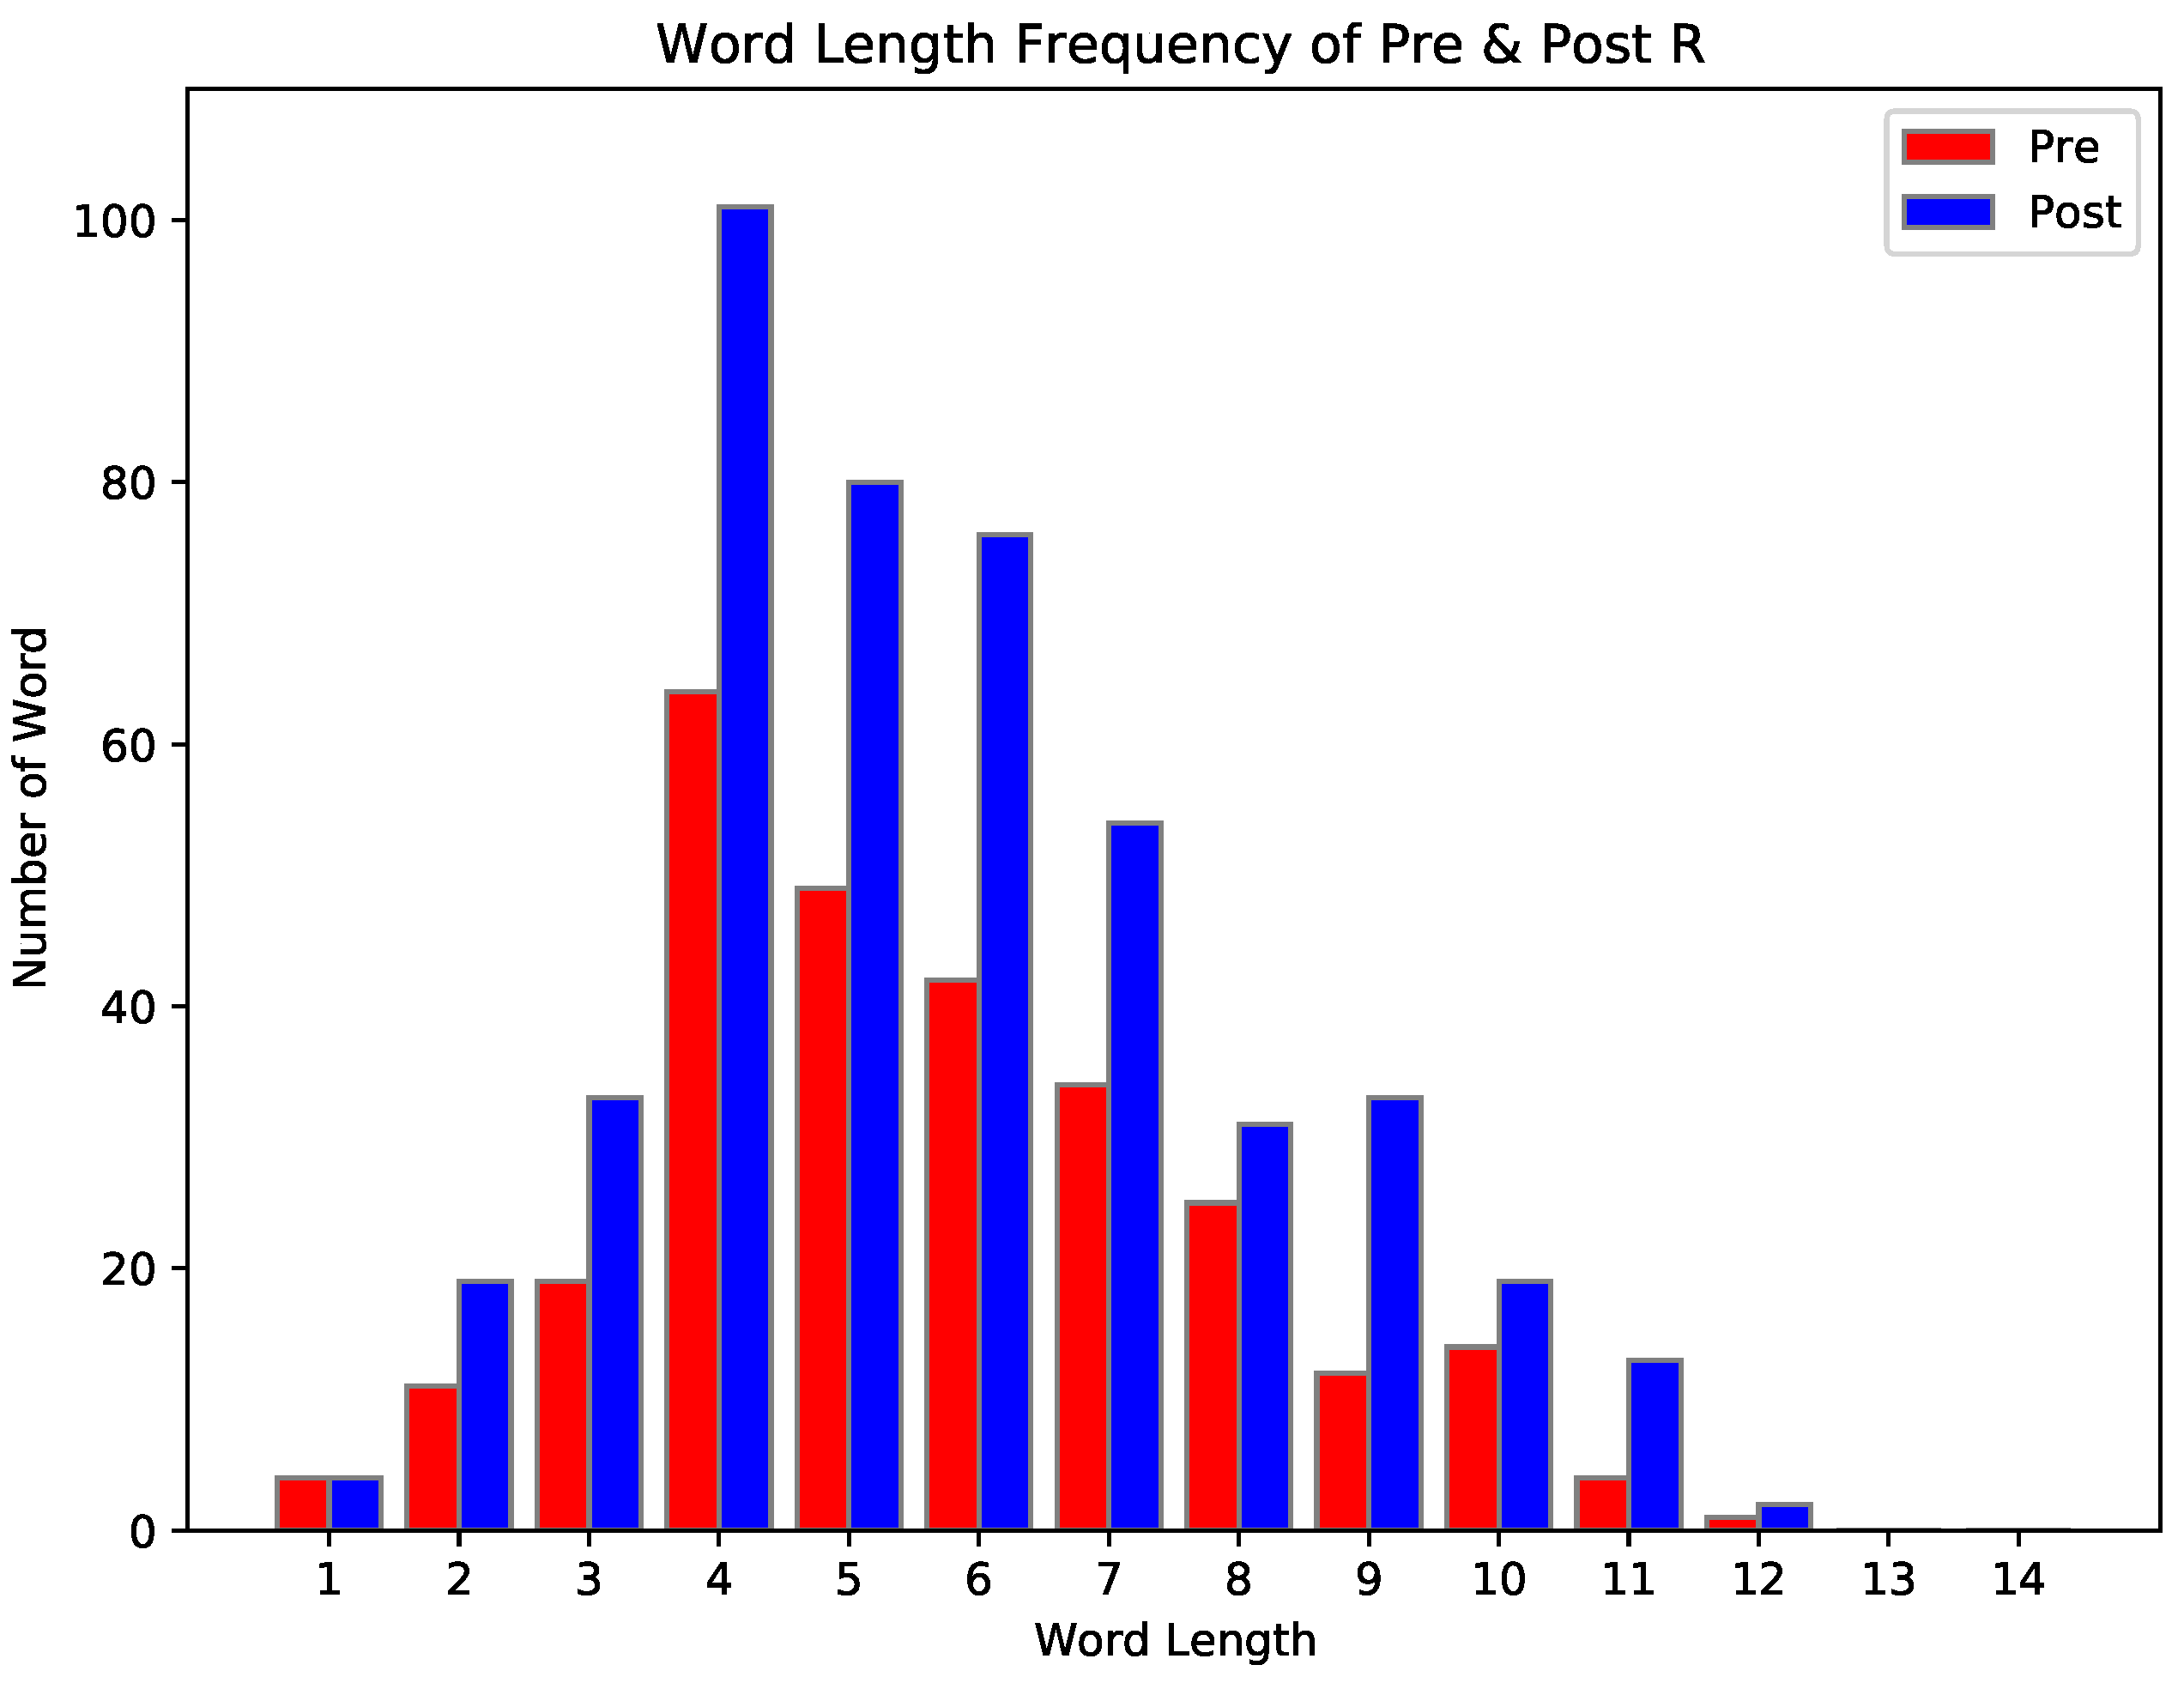
| PreR | PostR |
|---|---|
 |  |
| PreR | PostR | Difference | |
|---|---|---|---|
| Number of characters (including spaces) | 18,443 | 21,965 | +16.03% |
| Number of characters (without spaces) | 11,271 | 13,132 | +14.17% |
| Number of words (including repeated words) | 2248 | 2814 | +20.11% |
| Number of syllables (including repeated words) | 3532 | 2814 | +20.11% |
| Unique words | 279 | 466 | +40.13% |
| Number of characters (no spaces) for unique words | 1578 | 2684 | +41.21% |
| Number of syllables for unique words | 537 | 926 | +42.01% |
| Total unique words occurrence | 2138 | 2553 | +16.26% |
| PreR (Total 2138) | PostR (Total 2553) | |||||
|---|---|---|---|---|---|---|
| Rank | Word | Occurs | % | Word | Occurs | % |
| 1 | fish | 440 | 19.78% | fish | 404 | 14.36% |
| 2 | water | 151 | 6.79% | water | 154 | 5.47% |
| 3 | aquarium | 127 | 5.71% | and | 78 | 2.77% |
| 4 | rock | 116 | 5.21% | in | 67 | 2.38% |
| 5 | plant | 99 | 4.45% | plant | 62 | 2.38% |
| 6 | blue | 65 | 2.92% | of | 61 | 2.17% |
| 7 | fish tank | 64 | 2.88% | to | 61 | 2.17% |
| 8 | coral | 55 | 2.47% | aquarium | 56 | 1.99% |
| 9 | color | 43 | 1.93% | rock | 49 | 1.74% |
| 10 | tank | 41 | 1.80% | blue | 41 | 1.46% |
| 11 | yellow | 40 | 1.80% | relationship | 41 | 1.46% |
| 12 | gravel | 35 | 1.57% | tank | 40 | 1.42% |
| 13 | orange | 33 | 1.48% | are | 32 | 1.14% |
| 14 | of | 31 | 1.39% | is | 30 | 1.07% |
| 15 | in | 24 | 1.08% | swimming | 28 | 1.00% |
| 16 | and | 20 | 0.90% | color | 26 | 0.92% |
| 17 | filter | 20 | 0.90% | for | 24 | 0.85% |
| 18 | pebbles | 20 | 0.90% | yellow | 23 | 0.82% |
| 19 | vase | 19 | 0.85% | coral | 21 | 0.75% |
| 20 | see | 17 | 0.76% | with | 20 | 0.71% |
| 21 | tropical | 17 | 0.76% | good | 19 | 0.68% |
| 22 | goldfish | 16 | 0.72% | other | 19 | 0.68% |
| 23 | seaweed | 16 | 0.72% | ecosystem | 17 | 0.60% |
| 24 | with | 16 | 0.72% | different | 16 | 0.57% |
| 25 | decorations | 13 | 0.58% | environment | 16 | 0.57% |
| 26 | swimming | 13 | 0.58% | fish tank | 16 | 0.57% |
| 27 | different | 12 | 0.54% | that | 16 | 0.57% |
| 28 | reef | 12 | 0.54% | between | 15 | 0.53% |
| 29 | broken | 11 | 0.49% | green | 15 | 0.53% |
| 30 | green | 11 | 0.49% | need | 15 | 0.53% |
| 31 | fake | 10 | 0.45% | be | 14 | 0.50% |
| 32 | life | 10 | 0.45% | filter | 14 | 0.50% |
| 33 | saltwater | 10 | 0.45% | goldfish | 14 | 0.50% |
| 34 | decoration | 9 | 0.40% | on | 14 | 0.50% |
| 35 | is | 9 | 0.40% | each | 13 | 0.46% |
| 36 | small | 9 | 0.40% | orange | 13 | 0.46% |
| 37 | aquatic | 8 | 0.36% | living | 12 | 0.43% |
| 38 | are | 8 | 0.36% | can | 11 | 0.39% |
| 39 | pipe | 8 | 0.36% | oxygen | 11 | 0.39% |
| 40 | red | 8 | 0.36% | school | 11 | 0.39% |
| Pre | Post | P.overall | |
|---|---|---|---|
| No. concepts | 3.00 [2.00; 5.00] | 2.00 [1.00; 3.00] | <0.001 |
| No. words | 4.00 [3.00; 7.00] | 4.00 [2.00; 9.00] | 0.003 |
| No. characters | 23.0 [13.0; 38.0] | 23.0 [10.2; 50.8] | 0.015 |
| No. Concepts | No. Words | No. Characters | ||||
|---|---|---|---|---|---|---|
| Predictors | Incidence Rate Ratios | p | Incidence Rate Ratios | p | Incidence Rate Ratios | p |
| Time (Post vs. Pre) | 0.69 (0.63–0.75) | <0.001 | 1.21 (1.11–1.32) | <0.001 | 1.14 (1.04–1.24) | 0.004 |
| Age (1 level increase) | 1.00 (0.97–1.03) | 0.948 | 1.03 (1.00–1.07) | 0.050 | 1.04 (1.00–1.07) | 0.031 |
| Education (1 level increase) | 0.99 (0.95–1.02) | 0.511 | 1.01 (0.96–1.06) | 0.668 | 1.01 (0.96–1.06) | 0.752 |
| Ethnicity (Not Latino and/or Hispanic) | 1.00 (0.85–1.17) | 0.962 | 1.06 (0.85–1.32) | 0.597 | 1.04 (0.84–1.28) | 0.728 |
| Gender (Male) | 0.93 (0.83–1.05) | 0.251 | 0.75 (0.65–0.88) | <0.001 | 0.77 (0.66–0.89) | <0.001 |
| Marginal R2 / Conditional R2 | 0.076/0.370 | 0.051/0.517 | 0.041/0.481 | |||
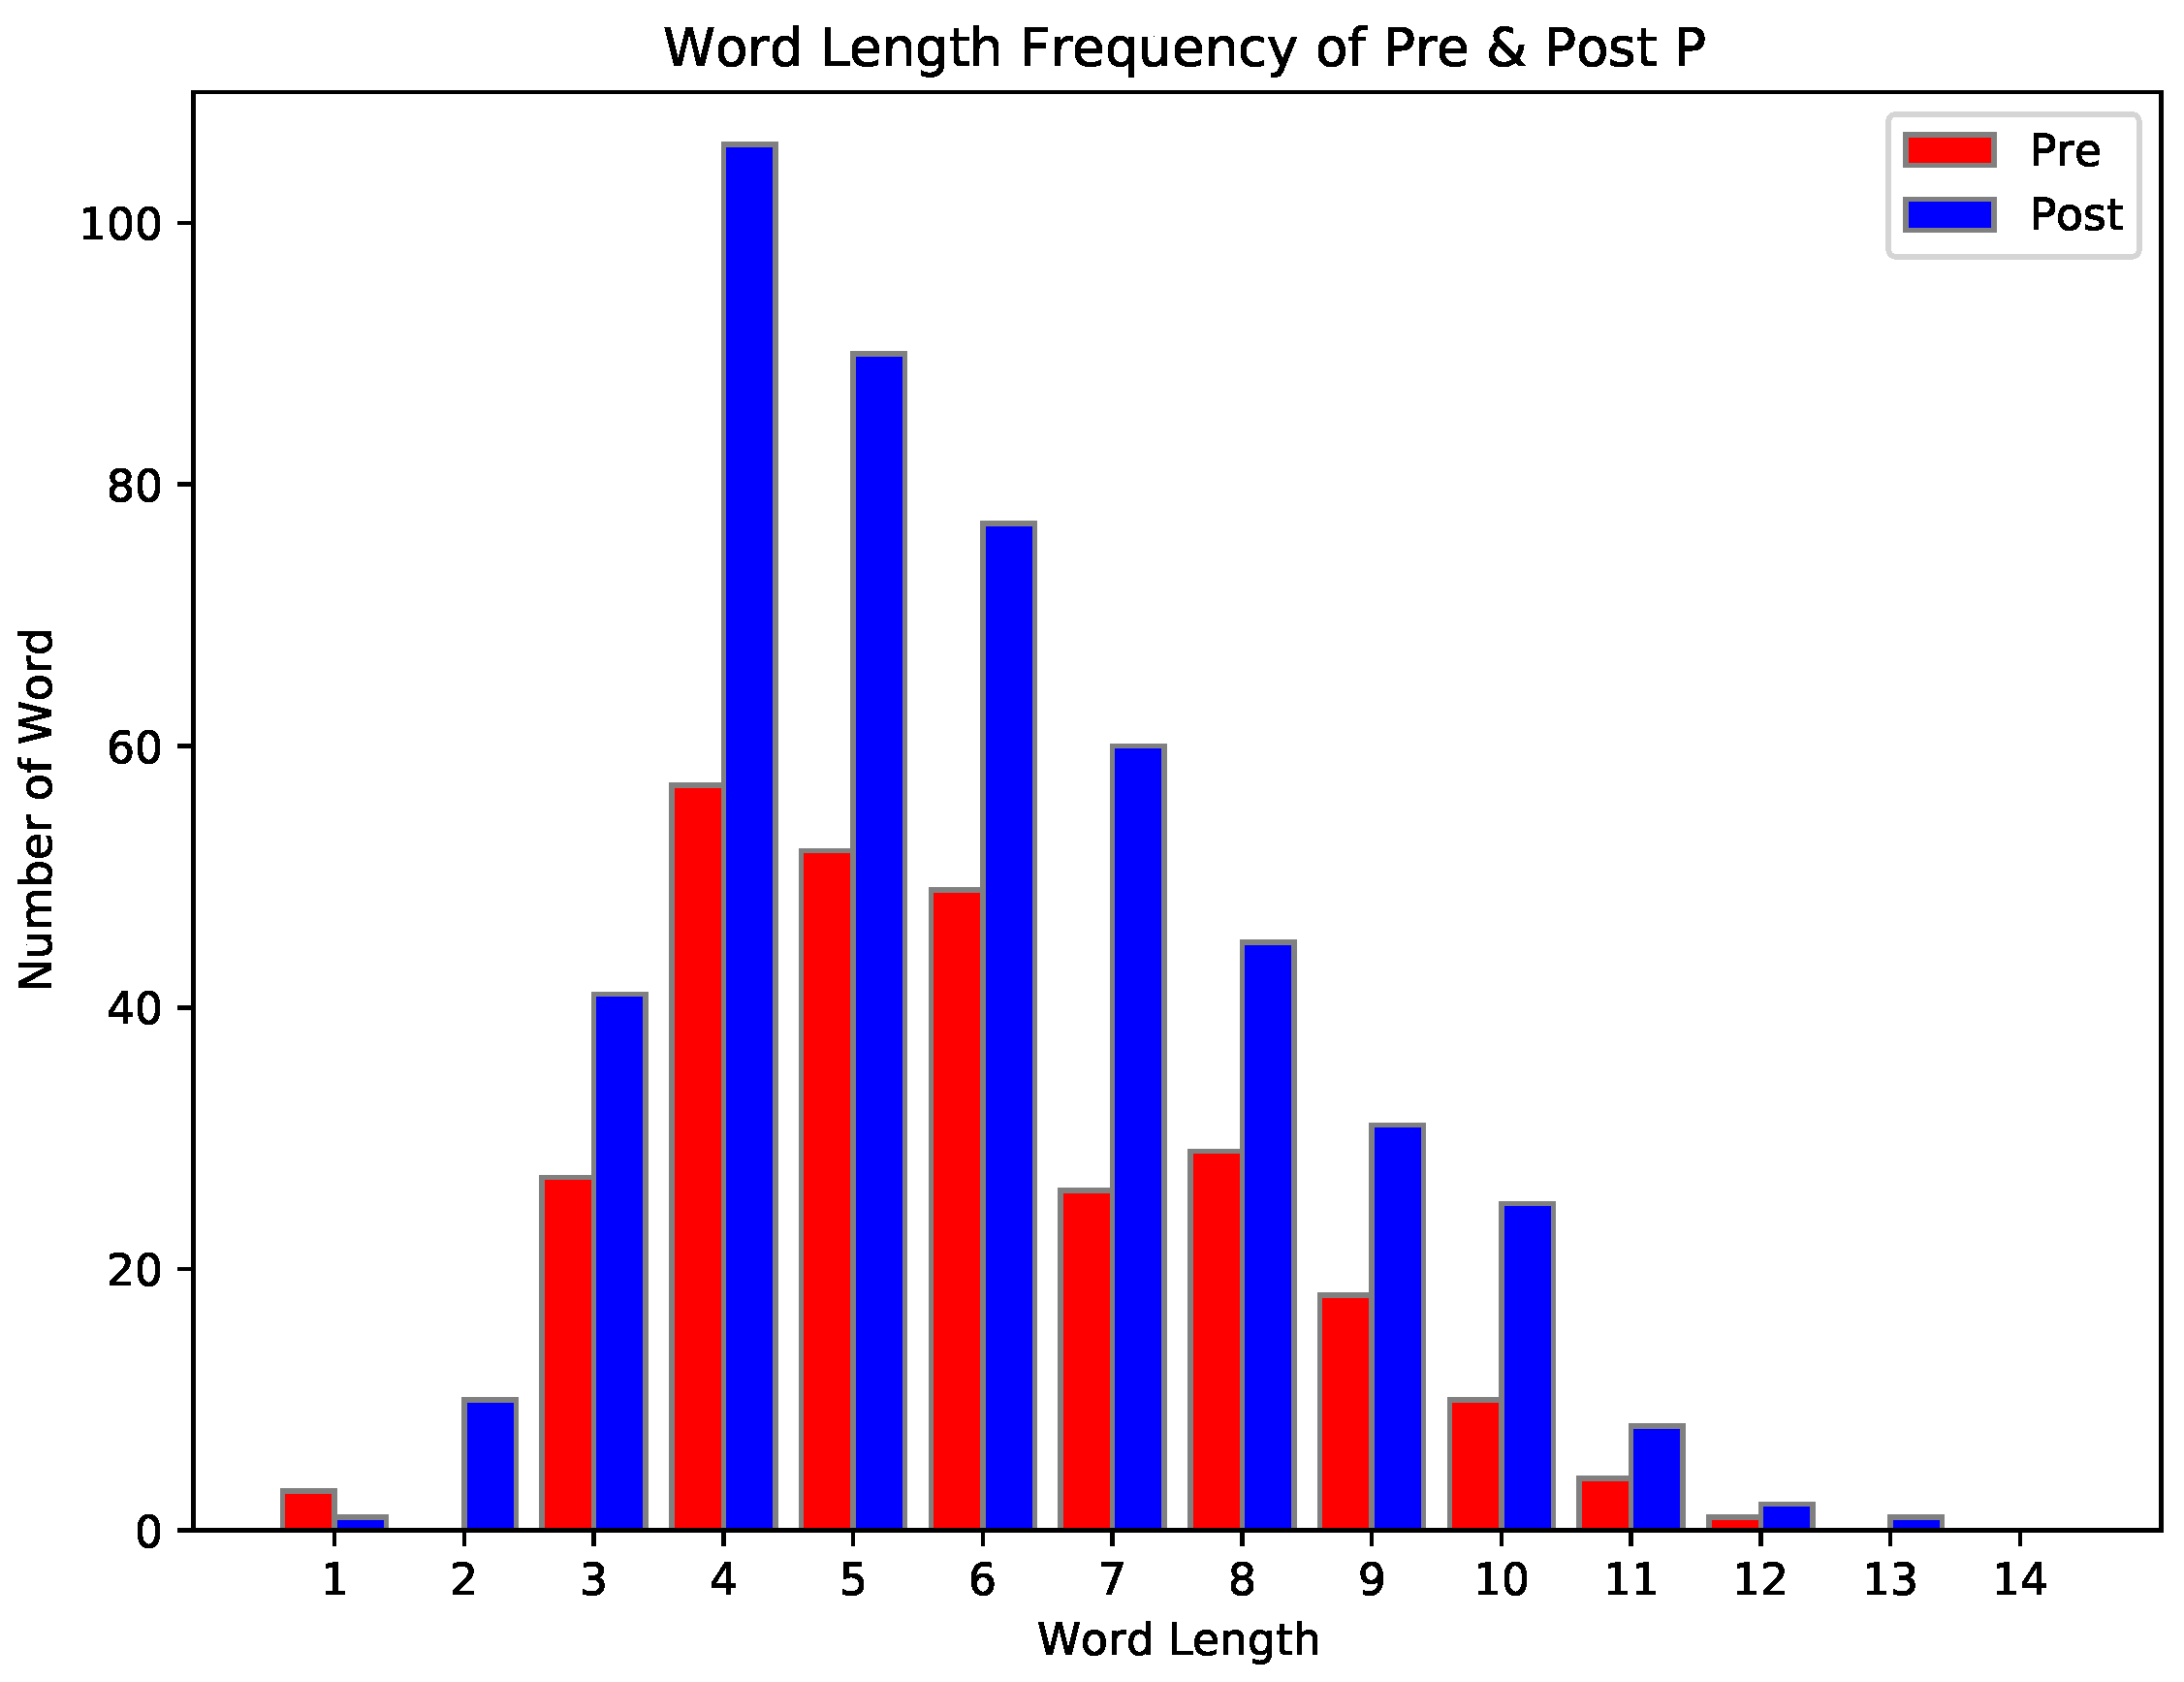
| PreP | PostP |
|---|---|
 |  |
| PreP | PostP | Difference | |
|---|---|---|---|
| Number of characters (including spaces) | 19,758 | 22,371 | +11.68% |
| Number of characters (without spaces) | 12,336 | 13,794 | +10.57% |
| Number of words (including repeated words) | 2513 | 2915 | +13.79% |
| Number of syllables (including repeated words) | 3967 | 4483 | +11.51% |
| Unique words | 276 | 497 | +44.47% |
| Number of characters (no spaces) for unique words | 1598 | 2914 | +45.16% |
| Number of syllables for unique words | 533 | 991 | +46.22% |
| Total unique words occurrence | 2089 | 2322 | +10.03% |
| PreP (Total 2089) | PostP (Total 2322) | |||||
|---|---|---|---|---|---|---|
| Rank | Word | Occurs | % | Word | Occurs | % |
| 1 | fish | 403 | 19.29% | fish | 350 | 15.07% |
| 2 | aquarium | 142 | 6.80% | water | 106 | 4.57% |
| 3 | water | 138 | 6.61% | aquarium | 90 | 3.88% |
| 4 | rock | 97 | 4.64% | color | 86 | 3.70% |
| 5 | color | 94 | 4.50% | rock | 57 | 2.45% |
| 6 | plant | 88 | 4.21% | blue | 48 | 2.07% |
| 7 | blue | 68 | 3.26% | plant | 45 | 1.94% |
| 8 | fish tank | 60 | 2.87% | tank | 42 | 1.81% |
| 9 | coral | 51 | 2.44% | see | 41 | 1.77% |
| 10 | tank | 45 | 2.15% | fish tank | 38 | 1.64% |
| 11 | yellow | 37 | 1.77% | swimming | 29 | 1.25% |
| 12 | orange | 28 | 1.28% | coral | 26 | 1.12% |
| 13 | tropical | 28 | 1.34% | perspective | 25 | 1.08% |
| 14 | gravel | 27 | 1.29% | with | 23 | 0.99% |
| 15 | many | 24 | 1.15% | different | 22 | 0.95% |
| 16 | see | 23 | 1.10% | yellow | 21 | 0.90% |
| 17 | swimming | 21 | 1.01% | cage | 18 | 0.78% |
| 18 | beautiful | 18 | 0.86% | small | 18 | 0.78% |
| 19 | pebbles | 17 | 0.81% | beautiful | 17 | 0.73% |
| 20 | saltwater | 16 | 0.77% | be | 16 | 0.69% |
| 21 | stone | 16 | 0.77% | clean | 15 | 0.65% |
| 22 | different | 15 | 0.72% | ecosystem | 15 | 0.65% |
| 23 | goldfish | 15 | 0.72% | there | 15 | 0.65% |
| 24 | seaweed | 15 | 0.72% | decoration | 14 | 0.60% |
| 25 | decoration | 13 | 0.62% | green | 14 | 0.60% |
| 26 | filter | 13 | 0.62% | gravel | 13 | 0.56% |
| 27 | green | 13 | 0.62% | life | 13 | 0.56% |
| 28 | small | 12 | 0.57% | tropical | 13 | 0.56% |
| 29 | reef | 11 | 0.53% | filter | 12 | 0.52% |
| 30 | vase | 11 | 0.53% | lots | 12 | 0.52% |
| 31 | greenery | 10 | 0.48% | many | 12 | 0.52% |
| 32 | sand | 9 | 0.43% | other | 12 | 0.52% |
| 33 | some | 9 | 0.43% | sea | 12 | 0.52% |
| 34 | life | 8 | 0.38% | large | 11 | 0.47% |
| 35 | sea | 8 | 0.38% | orange | 11 | 0.47% |
| 36 | aquatic | 7 | 0.34% | saltwater | 11 | 0.47% |
| 37 | bottom | 7 | 0.34% | that | 11 | 0.47% |
| 38 | clean | 7 | 0.34% | environment | 10 | 0.43% |
| 39 | light | 7 | 0.34% | habitat | 10 | 0.43% |
| 40 | nice | 7 | 0.34% | home | 10 | 0.43% |
| Pre | Post | P.overall | |
|---|---|---|---|
| No. concepts | |||
| Median [IQR] | 3.00 [1.00; 5.00] | 3.00 [1.00; 4.00] | 0.002 |
| Mean (SD) | 3.51 (2.36) | 2.99 (2.15) | 0.002 |
| 3.00 [1.00; 4.00] | 3.00 [1.00; 4.00] | 0.062 | |
| No. words | 5.00 [3.00; 8.00] | 6.00 [3.00; 10.0] | 0.064 |
| No. characters | 28.0 [18.0; 45.0] | 32.0 [19.0; 58.8] | 0.013 |
| No. Concepts | No. Words | No. Characters | ||||
|---|---|---|---|---|---|---|
| Predictors | Incidence Rate Ratios | p | Incidence Rate Ratios | p | Incidence Rate Ratios | p |
| (Intercept) | 4.12 (3.25–5.21) | <0.001 | 4.88 (3.68–6.46) | <0.001 | 25.69 (19.66–33.57) | <0.001 |
| Time (Post vs. Pre) | 0.85 (0.79–0.93) | <0.001 | 1.17 (1.09–1.26) | <0.001 | 1.19 (1.11–1.27) | <0.001 |
| Age (1 level increase) | 0.97 (0.95–1.00) | 0.051 | 1.01 (0.98–1.04) | 0.531 | 1.02 (0.99–1.05) | 0.253 |
| Education (1 level increase) | 1.01 (0.97–1.05) | 0.688 | 1.02 (0.97–1.07) | 0.429 | 1.02 (0.97–1.06) | 0.439 |
| Ethnicity (Not Latino and/or Hispanic) | 0.86 (0.71–1.04) | 0.128 | 1.11 (0.88–1.40) | 0.357 | 1.12 (0.90–1.40) | 0.293 |
| Gender (Male) | 0.91 (0.80–1.03) | 0.119 | 1.00 (0.86–1.15) | 0.982 | 1.01 (0.88–1.16) | 0.837 |
| Marginal /Conditional | 0.032/0.394 | 0.015/0.573 | 0.021/0.562 | |||
| p | |
|---|---|
| Identity–Other Distinctions (D) | |
| No. concepts | 0.062 |
| No. words | <0.001 |
| No. characters | <0.001 |
| Part–Whole Systems (S) | |
| No. concepts | <0.001 |
| No. words | 0.13 |
| No. characters | 0.13 |
| Action–Reaction Relationships (R) | |
| No. concepts | <0.001 |
| No. words | 0.003 |
| No. characters | 0.015 |
| Point–View Perspectives (P) | |
| No. concepts | 0.002 |
| No. words | 0.064 |
| No. characters | 0.013 |
| D | S | R | P | |
|---|---|---|---|---|
| Number of characters (including spaces) | +27.22% | +11.91% | +16.03% | +11.68% |
| Number of characters (without spaces) | +30.24% | +09.09% | +14.17% | +10.57% |
| Number of words (including repeated words) | +31.68% | +13.20% | +20.11% | +13.79% |
| Number of syllables (including repeated words) | +28.78% | +12.23% | +20.11% | +11.51% |
| Unique words | +44.59% | +41.59% | +40.13% | +44.47% |
| Number of characters (no spaces) for unique words | +46.00% | +49.21% | +41.21% | +45.16% |
| Number of syllables for unique words | +45.39% | +43.00% | +42.01% | +46.22% |
| Total unique words occurrence | +31.64% | +04.88% | +16.26% | +10.03% |
Publisher’s Note: MDPI stays neutral with regard to jurisdictional claims in published maps and institutional affiliations. |
© 2022 by the authors. Licensee MDPI, Basel, Switzerland. This article is an open access article distributed under the terms and conditions of the Creative Commons Attribution (CC BY) license (https://creativecommons.org/licenses/by/4.0/).
Share and Cite
Cabrera, D.; Cabrera, L.; Cabrera, E. The “Fish Tank” Experiments: Metacognitive Awareness of Distinctions, Systems, Relationships, and Perspectives (DSRP) Significantly Increases Cognitive Complexity. Systems 2022, 10, 29. https://0-doi-org.brum.beds.ac.uk/10.3390/systems10020029
Cabrera D, Cabrera L, Cabrera E. The “Fish Tank” Experiments: Metacognitive Awareness of Distinctions, Systems, Relationships, and Perspectives (DSRP) Significantly Increases Cognitive Complexity. Systems. 2022; 10(2):29. https://0-doi-org.brum.beds.ac.uk/10.3390/systems10020029
Chicago/Turabian StyleCabrera, Derek, Laura Cabrera, and Elena Cabrera. 2022. "The “Fish Tank” Experiments: Metacognitive Awareness of Distinctions, Systems, Relationships, and Perspectives (DSRP) Significantly Increases Cognitive Complexity" Systems 10, no. 2: 29. https://0-doi-org.brum.beds.ac.uk/10.3390/systems10020029