
Research on Financing Risk Factors of Expressway REITs in China with a Hybrid Approach


School of Economics and Management, Beijing Jiaotong University, Beijing 100044, China
*
Author to whom correspondence should be addressed.
Systems 2022, 10(2), 38; https://0-doi-org.brum.beds.ac.uk/10.3390/systems10020038
Submission received: 15 February 2022
/
Revised: 13 March 2022
/
Accepted: 15 March 2022
/
Published: 18 March 2022
(This article belongs to the Special Issue Research Trends on the Development of Integrated and Robust Social Development Management Systems)
Abstract
:Finding sustainable measures for expressway financing has long been a significant issue owing to high demand for funds of expressway construction and maintenance of existing facilities. In the Chinese context of expressway financing it has become imperative to shift from indirect bank financing to Real Estate Investment Trusts (REITs). This research investigates the impact of various factors on the financing risk of expressway REITs and estimates the weight of the impact of various aspects and the link between the factors. We used literature review, keyword co-occurrence analysis and keyword cluster analysis methods to identify 19 risk factors that affect the financing of expressway REITs, then we classified factors into six dimensions: credit risk, underlying asset risk, operational risk, market risk, liquidity risk, and other risk. In addition, a multi-level hierarchical structure model was established by the Integrated Decision-Making and Trial Evaluation Laboratory (DEMATEL) and an interpretative structural model (ISM). The research finds that the project’s future cash flow under-expected risk, price risk, and counterparty limited risk are direct factors, the bankruptcy isolation of the underlying assets risk is a deep factor affecting the financing of expressway REITs, and other factors are indirect factors. This study fills the gap in financing risk of expressway REITs in the context of China and contributes to exploring and establishing the financing risks identification approach and risk factors in expressway REITs based on Chinese contexts. This research presents a theoretical foundation and methodologies for reducing the financing risk of expressway REITs projects and improving financing safety.
1. Introduction
A Real Estate Investment Trust (REIT) is an important means to realize real estate securitization. It is an investment fund that pools the funds of most investors through the issuance of income certificates, then transfers them to professional institutions for real estate investment management and allocates investment income to investors in a timely manner [1]. Global REITs first originated in the United States in the 1960s [2]. As of December 2020, the global REITs market has a publicly traded market value of approximately US$2 trillion [3]. Infrastructure REITs refer to REITs with infrastructure as the underlying asset. According to Bloomberg data, the total scale of infrastructure REITs is conservatively estimated to be between 300–700 billion US dollars, and global infrastructure REITs account for 17–40% of all REITs [4].
On 30 April 2020, a “The Notice on Promoting the Pilot Work of Real Estate Trust Funds in the Infrastructure Sector” (The Notice) was issued to the public in China. China’s infrastructure mutual fund REITs refer to the establishment of closed-end public offering of funds by public fund managers and public offering of fund shares. Capital, through the purchase of infrastructure asset-backed securities (ABS), the completion of the acquisition of the underlying infrastructure, and the realization of securitized products are publicly traded in infrastructure assets [5]. The Notice pointed out the product structure of C-REITs is combined with public mutual funds and asset securitization, and the basic structure of infrastructure REITs in China is shown in Figure 1.
In recent years, the demand for funds for expressway construction and maintenance of existing facilities has remained relatively high [6] but the investment and financing model based on indirect bank financing is becoming unsustainable. The contradiction between the supply and demand of funds for the construction, maintenance and operation of expressways needs to be resolved urgently. The application of REITS to expressways has the ability to absorb social capital and provide investment channels for the public to participate in expressway construction, reduce the debt ratio of infrastructure investment entities and revitalize existing capital, and improve the level of expressway asset management in China. An expressway project is particularly suited to the requirements of infrastructure public mutual fund REITs projects. The Chinese government has been gradually and vigorously promoting the pilot work of infrastructure REITs from 2020. At the same time, as a typical capital-intensive industry, expressways have high initial investment and asset-liability ratios. Chinese domestic expressway REITs financing projects have the characteristics of high investment thresholds, poor liquidity, long payback periods, and numerous participants. During operation, there are many uncertain risks. Therefore, the risk assessment of the financing of expressway REITs has become an urgent problem that needs to be solved.
At present, much expressway REITs financing research has focused on the North American and Australian contexts only, and mainland China contexts have not been investigated [7]. Considering risk issues as a critical link in the financing of expressway REITs projects has just begun in China. In addition, there are few research articles on the expressway financing risks of REITs, and they are primarily qualitative. The overall delineation of financing risk of expressway REITs is still a gap that warrants scientific investigation since a comprehensive and scientific system structure has not been established. This research aims to prevent these risks by identifying and determining sequences and relationships factors affecting the financing of expressway REITs. The study contributes to reducing projects of expressway REITs financing risk and improving operational efficiency in the future. Therefore, this paper analyzes the classic REITs project financing risk evaluation index method in conjunction with the recent development of expressway REITs projects. First, the DEMATEL-ISM approach is used with data analysis to generate expressway financing risks for REITs and to assess the index system. Then, we objectively, and methodically investigate the links between the data to provide a scientifically helpful advisory tool for expressway REITs project financing.
2. Literature Review
2.1. Research on Influencing Risks Factors of REITs
Several researchers have utilized qualitative methodologies to examine the elements that influence the risks associated with REITs from various viewpoints. Gao (2006) examined the risk variables affecting REITs from a micro perspective. The findings indicate that the investment risk of REITs is primarily determined by the scale and quality of the real estate. Operational risks are considerably affected by the entrusted agency, financial risks, and the management of revenue variations [8]. Chen (2006) discovered that the primary factors determining the risk and return of REITs are the price of real estate and the experience of REIT management [9]. According to Dai (2006), cyclical risks in REITs may be triggered by issues such as an illogical corporate financing structure and high debt levels in the REITs business [10]. Zhang et al. (2015) analyzed investors’ redemption risk associated with the operation of real estate investment trusts. They concluded that the credit enhancement technique had a unique effect on the fund’s redemption risk [11]. Wang (2008) argued that domestic real estate trust investment funds face policy and market risks primarily and are collectively impacted by various external macroeconomic factors [12]. According to Liu et al. (2016), the external risks faced by REITs are primarily influenced by variables such as the environment, regulations, capital markets, and legislation [13].
Certain scholars primarily employ quantitative approaches, such as model construction, to investigate the risks associated with REITs. From the standpoint of REITs, Giannotti et al. (2013) discovered that the size of REITs affects their risk. Large-scale REITs benefit from a significant degree of risk diversification, which is influenced by the portfolio structure of the REITs [14]. By developing an asset pricing model, Chaudhry (2004) et al. conducted quantitative analysis on the non-systematic risks that influence REITs. The research findings indicate that the risk variables influencing REITs changed over time and had varying performances. [15]. From the perspective of external factors affecting REITs risk, Stefan and colleagues (2010) examined the link between REITs and the stock market using the Conditional Copula model, concluding that there is a definite positive correlation between REITs and the stock market [16]. To examine the influence of monetary policy on REITs, Chang (2011) split monetary policy into predictable and unexpected components. The research findings indicate that the unexpected component of monetary policy had a more significant influence on REITs. Additionally, deflation accelerates REITs’ recession likelihood [17].
2.2. Research on Risk Prevention and Control of REITs
According to some researchers, risk prevention and control in REITs should reinforce the respective roles of the principal actors, enhancing the risk measurement model and the underlying asset quality. From the perspective of the main section, Xu et al. (2006) argued that investors can manage their risks and returns through the establishment of public REITs. The funds raised by public REITs can be invested in a variety of different types of property assets; however, how to coordinate the interests of all parties in public REITs is also critical [18]. Guo (2017) noted that crises in REITs are frequently precipitated by internal changes. The government, management agencies, and investors should all have distinct roles and responsibilities, with each party being independently accountable for avoiding the risk of REITs caused by the principal-agent problem [19].
In terms of risk transmission and metrics, Dai, Hui (2014) said that REIT products, like many real estate enterprises, encounter cyclical risks due to their enormous debt and onerous financing demands. Therefore, to control the risk of REITs, the first step should be to establish a REITs risk metrics model relevant to China’s current scenario [10]. Long et al. (2017) suggested that when developing a portfolio of REITs, it is vital to evaluate changes in the quality of underlying assets, fund management, and the presence of risk transmission [20]. Considering specific measures, Yin and He (2011) proposed several practical risk management strategies, including joint management, budget management, contract management, sales fund supervision, scientific pricing, reasonable sales, establishing a positive reputation, strengthening internal audit, and cash flow control to mitigate the risk of REITs projects [21].
Concerning the principal-agent issue, Russell (2010) examined REITs via the lens of corporate debt structure and concluded that the market responded positively to bond issuance announcement. On this basis, the author analyzed the principal-agent issue and discovered some external concerns as well. As a result, the author argued for removing internal management institutions to resolve the principal-agent dilemma correctly [22]. Regarding REITs cooperation, Campbell et al. (2011) evaluated the risk management of REITs mergers using the results of earlier studies. According to the research findings, if REITs collaborate with high-quality enterprises early on, this provides an essential assurance for the risk management of REITs [23]. In terms of investment decision-making, Chen (2011) reviewed and integrated the risk theory of REITs, combining the enhancement of investment decision-making capabilities with the risk management requirements of REITs. The authors argued that REITs should address three distinct categories in current: understand REITs, then focus on risk points while investing in REITs, and finally pay attention to REITs risk management [24].
2.3. Research on the Risk of Expressway Asset Securitization
Benveniste and Berger (1987) demonstrated that investors may significantly enhance their investment allocation and improve Pareto by investing in high-credit-rated firms or public infrastructure. As a result, asset securitization contributes to the Pareto optimal allocation of societal resources [25]. According to Chen (2018), fixed assets require a diverse financing mechanism, particularly infrastructure investment. He stated that asset securitization has become an effective method of financing expressway development [26]. Sun (2019) concluded that when it comes to operational risks associated with expressway projects, projects frequently demand a significant initial expenditure and long-term engineering investment to achieve natural cash flow during the project’s development [27].
Tang (2012) stated a significant divide between China’s capital market and that of Western countries. China, which is still in the early stages of capital market development, is primarily concerned with issues such as the legal framework. The capital market’s corresponding rules and regulations should be reinforced and enhanced, and the duties of the numerous supervision and authority agencies remain unclear. Tax formulation and oversight are deficient in terms of appropriate references and regulatory difficulties [28]. According to Tang and Liu et al. (2012), there are significant gaps in the formulation of relevant laws and regulations for asset securitization in terms of expressways, and the inconsistency of standards used to assess asset pooling across different regional markets has resulted in the acquisition of funds confronted with a particular predicament [29].
In addition, the hotspots of international REITs research in recent years have focused on the correlation and contagion between REITs and the stock market [30,31], the interdependent dynamics of REITs’ markets under unstable conditions [32], and the causal relationship between the banking industry and REITs [33]. Studies on the development of REITs in China have focused on the mainland REITs market factors which affect the housing market and the development status of REITs and regulators in Hong Kong and Taiwan, as well as the opportunities for, and current obstacles to, the development of REITs in China [7,34].
According to the preceding sections, existing research has comprehensively examined the regional development, safety, sustainability, and process improvement elements of expressway REITs risk [16,18,21]. A review of the risk literature on expressway REITs indicates three additional critical points. First, expressway REITs have been established and recognized globally as a sustainable and cost-effective means of financing [26]. Second, despite the potential benefits of expressway REITs financing in China’s enormous economy, the vast majority of expressway REITs risk study has concentrated on North American and Australian contexts exclusively [28]. Third, there is still a scarcity of research that clearly demonstrates the risk variables of the REITs finance mode and their complex inter-relationships. As a result, the current work tries to address this.
The rest of the paper is organized as follows. A review of the literature is presented in Section 2. Section 3 outlines the approach used in detail, followed by a result of the data set in Section 4. Section 5 discusses the empirical findings and their consequences, while Section 6 concludes the paper.
3. Research Methodology
3.1. Overview of Fuzzy, DEMATEL and ISM
The Decision-Making Trial and Evaluation Laboratory (DEMATEL) algorithm proposed by American scholars [35,36] is based on matrix tools and graph theory. It combines expert discriminations to establish a relationship matrix to explore the logical relationships between factors within a complex network and allows ranking their importance [37]. This method focuses on complex system problems and quantitatively analyzes the importance and attributes of each risk factor by calculating four quantitative characteristics: influence degree, influenced degree, centrality degree, and cause degree, then determines the key risk factors [38]. Based on experts’ evaluations, the algorithm has a certain degree of ambiguity in the strength and weakness of the matrix directly affecting the value, which has a partial impact on the relationship between factors and affects the hierarchical structure of risk factors.
Therefore, a combination of Fuzzy Set Theory (FST) and DEMATEL, i.e., the Fuzzy-DEMATEL method, can be used to incorporate triangular fuzzy numbers into the traditional DEMATEL method. The direct influence matrix is fuzzified by converting the semantic evaluation of the experts into the corresponding triangular fuzzy numbers [39]. The fuzzy numbers are de-fuzzified to exact values by the Converting Fuzzy numbers into Crisp Scores (CFCS) defuzzification method proposed by Opricovic et al. [40].
Professor Join Warfield, USA, proposed the Interpretive Structural Modeling (ISM) algorithm for analyzing the relationships among factors in complex systems [41,42]. The model focusses on qualitative analysis and a combination of qualitative and quantitative analysis. This research combines the DEMATEL method and ISM, and further assembles to form the Fuzzy-DEMATEL-ISM method, to analyze the interrelationship of system factors and the impact on the overall system when the interrelationship changes. By establishing the adjacency matrix, solving the reachability matrix, and finally constructing the recursive hierarchical structure model of the system factors’ interactions, the factor hierarchy is analyzed.
3.2. Procedure of the Fuzzy-DEMATEL-ISM Method
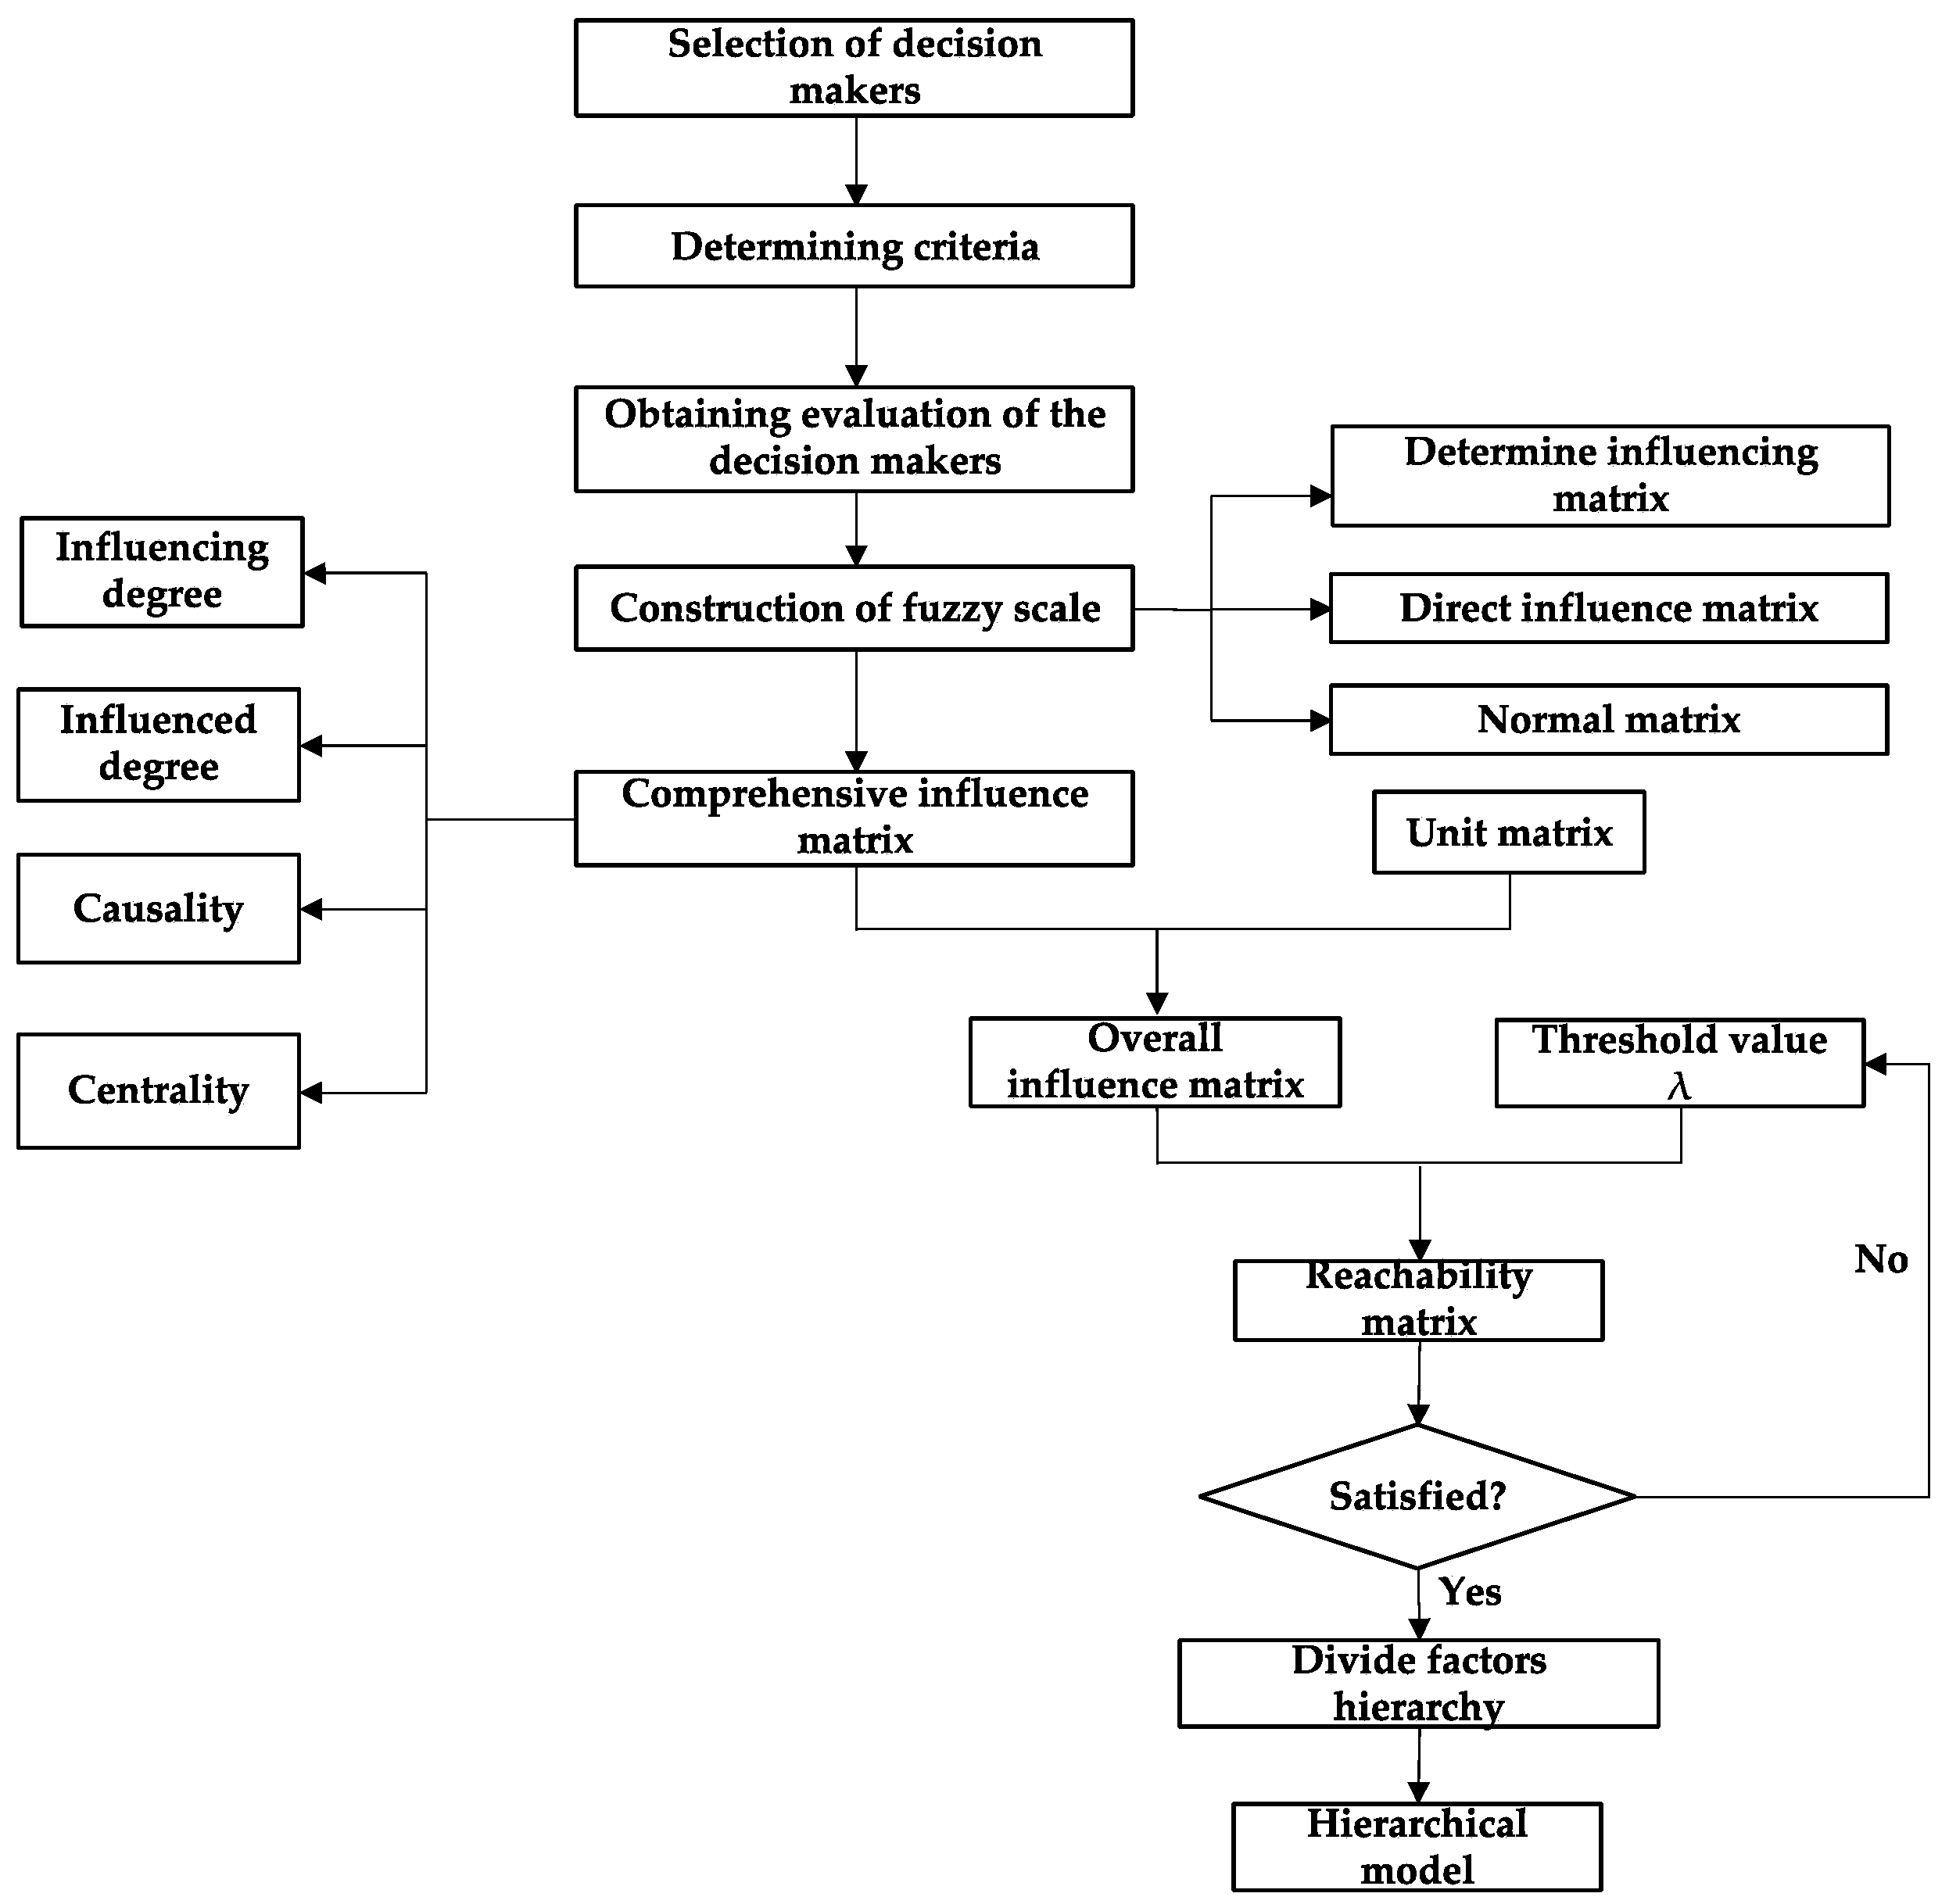
In this study, Excel worksheets were used to carry out the Fuzzy-DEMATEL-ISM methodology by Singh and Bhanot, (2019) and Opricovic and Tzeng (2003) [40,43] as shown in Figure 2. The specific steps are as fellow:
Step1: Construct impact factor indicators. The pair-wise comparison scale may be designated five levels, where the scores of 0, 1, 2, 3, and 4 represent “No influence”, “Very low influence”, “High influence”, and “Very high influence,” respectively.
Step2: Experts evaluate the strength of the relationship between the influencing factors and obtains the n-order initial direct influence matrix C:
Step3: Convert the initial direct influence matrix to the corresponding triangular fuzzy number. A triangular fuzzy number can be defined in this context as a , where , and denote the lower, medium, and upper numbers of the fuzzy sets. is the value on the left-side, which is a conservative value, is the middle value, which is the closest to the actual value, is the value on the right-side, which is an optimistic value, and satisfies . Get = , which indicates the degree to which has an influence on the estimates by k-th expert. Corresponding relationship between linguistic terms and fuzzy numbers is shown in Table 1.
Step4: The CFCS method is used for the triangle fuzzy number matrix defuzzification, and the standard direct influence matrix is achieved through calculation.
- (1)
- Standardization treatment of the triangle fuzzy numbers.
- (2)
- Calculation of the standard value of left and right.
- (3)
- Calculation of the crisp scores.
- (4)
- Integrate average value of crisp scores and obtain direct influence matrix.
Step5: Determination of normalized matrix. The direct influence matrix is normalized according to Formula (11), and the normalized direct influence matrix N is obtained.
among
Step6: Construction of the comprehensive impact matrix.
According to the normalized direct influence matrix, N is obtained by calculation, and the comprehensive impact matrix T can be acquired by using the Formulas (13) and (14).
among which I is denoted as the identity matrix.
Step7: Calculations of influencing degree and influenced degree.
The row sums and column sums are computed separately using Formulas (15) and (16) to obtain matrices and .
where represents value of influence of factor on factor in comprehensive impact matrix T; = influence degree; = influenced degree.
Step8: Calculations of cause degree and centrality degree.
The centrality degree is the sum of the influence degree and the influenced degree, which indicates the position of the factor in the system and the strength of the influence degree. The cause degree is the difference between the influence degree and the influenced degree, which represents the causal relationship between the influencing factors. If the cause degree is greater than 0, it is the cause factor and less than 0, it is the effect factor.
Step9: Calculation of overall influence matrix.
The comprehensive influence matrix does not consider the influence on itself, but primarily considers the impact relationship between different factors. As a result, the overall influence matrix H should be computed using the Formula (19).
where the I is denoted as the identity matrix.
Step10: Calculation of threshold value.
According to the overall influence matrix, H sets up the threshold value λ, . By setting the threshold λ, the factors that have less impact on the system can be discarded, and the system structure of the influencing factors can be simplified [44]. The value of the threshold λ has a great impact on the relationship between the influencing factors. If the threshold value is too large, the system structure is relatively simple, and the influence relationship between factors is difficult to measure. If the threshold value is too small, the system structure is more complicated, and the influence relationship between factors is too cumbersome [45].
Step11: Construct the reachable matrix.
where is the correlation value of factor and factor .
Step12: Construction of the reachable set and antecedent set.
is the antecedent set and is the reachable set. Both can be calculated from the reachable matrix. Formula (26) is used to detect elements of the layer.
Step13: Setting up an Interpretive Structural Model.
4. Result
4.1. Flowchart for Developing a Financing Scheme
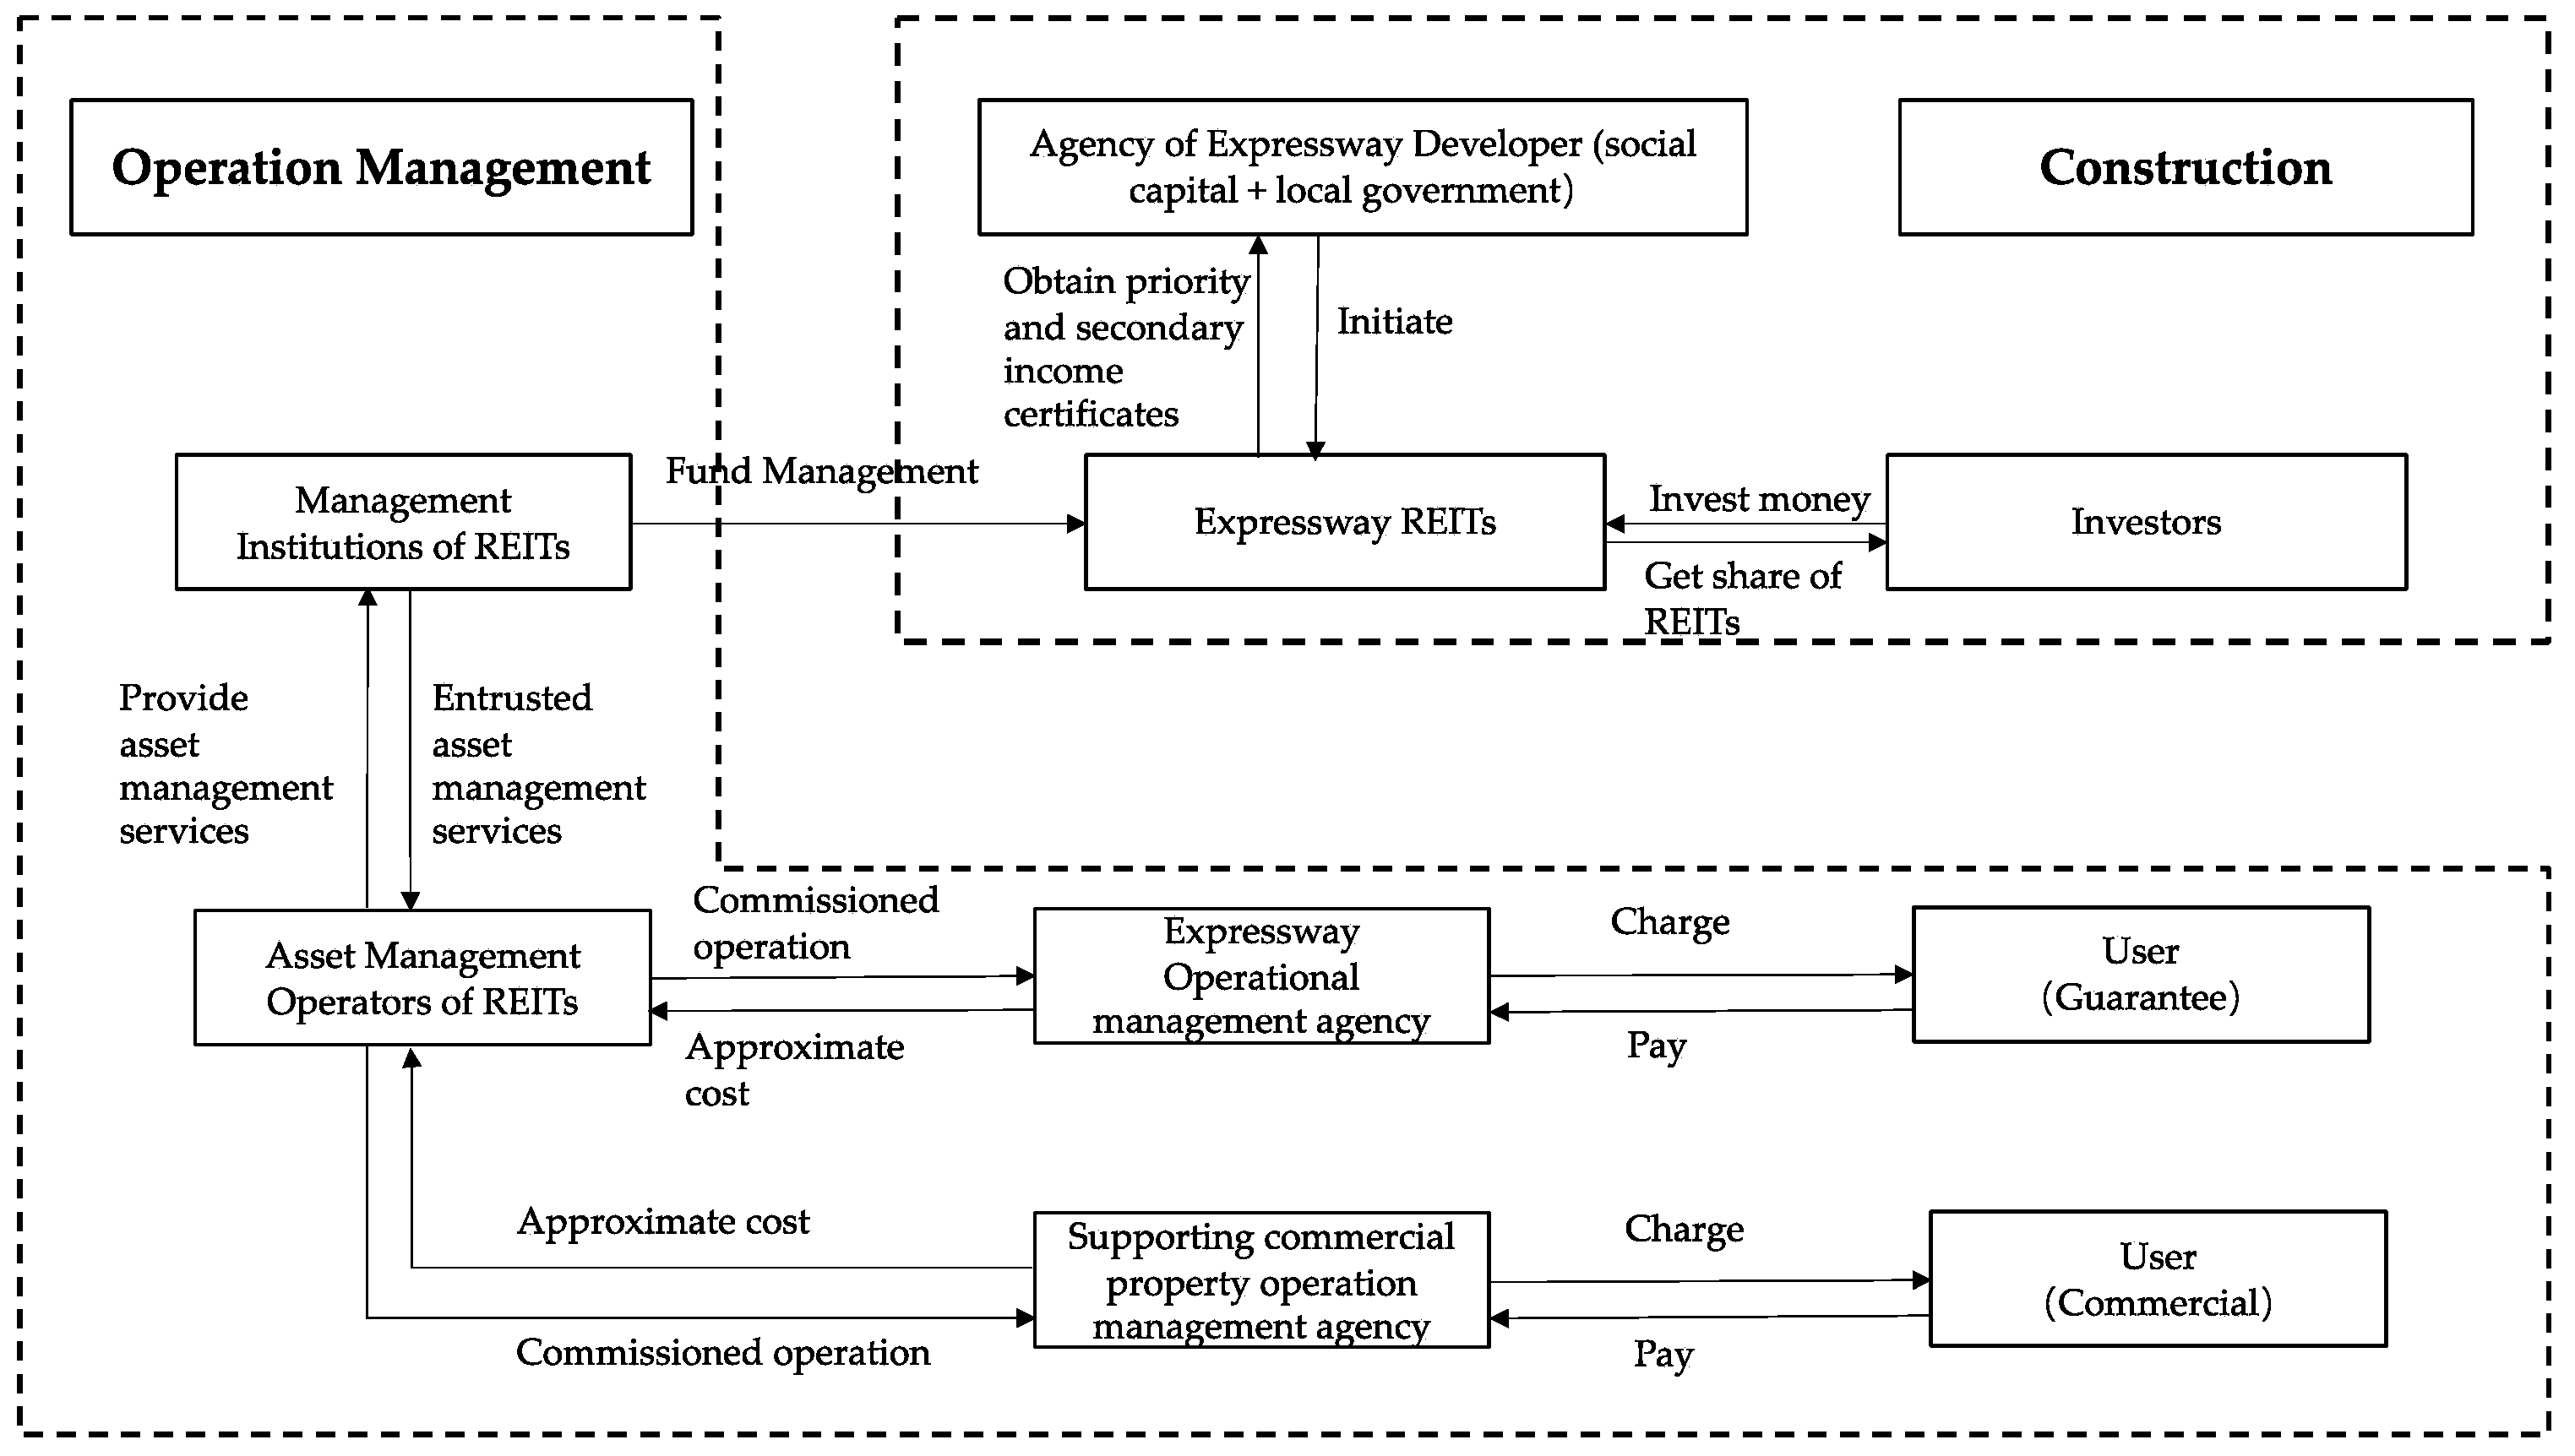
Financing of Expressway REITs is a highly sophisticated and methodical procedure that requires a high level of professionalism and complexity. Numerous parties are involved in the process from the formation of REITs until the termination of fund recovery. Consequently, implementing the REITs model to the expressway financing process is critical for China’s REIT development. This research builds a REITs operation model for expressways in accordance with China’s national requirements by referring to the actual operation of foreign REITs products (Figure 3): The government is the primary authority responsible for property rights, whereas the developer is the primary body responsible for construction. REITs are formed by cooperation between government and developers to pool the projected revenue from the expressway, service areas, and surrounding commercial properties in picturesque locations. According to the magnitude of the asset portfolio, REITs are issued to the public or select investors to obtain capital. Throughout the operation and administration phase, a professional team is entrusted with the daily management of the expressway in accordance with applicable government policy requirements. Moreover, the government is accountable for long-term investment security. In addition, basic transaction structure of expressway REITs as shown in Figure 4.
4.2. Identification of Influencing Factors
4.2.1. Data Source
This research selected data from the domestic CNKI, WANFANG, and CSSCI databases, and used “expressway REITs”, “REITs financing”, and “REITs risks” as the subject terms to search. The time span was from 2000 to 2021, all literature searches were conducted in the context of expressway, and a total of 241 related documents were retrieved.
To ensure the accuracy of the data and the reliability of the research, the first retrieved reports were screened, and non-academic articles such as news reports, book reviews, duplicate documents and invalid records were eliminated; finally, 116 articles were used as the sample data set. This paper used keyword co-occurrence analysis and keyword clustering analysis of CiteSpace software to obtain research hotspots of related risk factors in the field of expressway REITs financing.
4.2.2. Keyword Co-Occurrence Analysis
This study first used the keyword co-occurrence analysis method to screen the key influencing factors of the obtained sample data set. Keyword co-occurrence analysis is a document analysis function commonly used in CiteSpace software. “Co-occurrence”, in short, counts the number of occurrences of a group of words in a large number of internally related documents, measures their internal connections and segments the text with keywords. We specifically used the Averaged Perceptron (AP) algorithm in Natural Language Processing (NLP) to analyze the text of the selected documents [46]. The perceptron algorithm was proposed by Rosenblatt, and the main function was to identify the category of the sample by designing a classifier [47]. Through the learning of the training sample set, the solution of the weight of the discriminant function was obtained, and a linearly separable sample discriminant function was generated. This algorithm is a non-parametric algorithm and does not need any assumptions made on the statistical properties of various types of samples; it is a deterministic method.
The AP algorithm is a good online algorithm for binary classification. This algorithm obtains a separated hyperplane, which is parameterized by and is used for prediction. For a sample , the perceptron algorithm predicts the label of the sample by calculating . The final predicted label is realized by calculating . The algorithm only corrects the weight w when the prediction is wrong. If the correct label is , then the weight is corrected to ; if , the weight becomes , which can be summarized as . After training of sample , the previous training weights were kept, and then all values averaged after training. The pseudo code of the AP algorithm is shown in Algorithm 1.
| Algorithm 1: Pseudo code of Average Perceptron |
| Training data: |
| 1. |
| 2. for |
| 3. for |
| 4. |
| 5. |
| 6. |
| 7. |
| 8. |
| 9. |
4.2.3. Keyword Cluster Analysis
Existing research hotspots mainly focus on the using of VOS Viewer to show density distribution of all keywords [48], and clusters denote the closeness of journals in terms of mutual citations and are illustrated by distinct color connection lines [49]. However, our research processed the previously extracted keywords and performed keyword clustering analysis with the help of CiteSpace software to form a collection of clustering labels. In keyword clustering analysis, CiteSpace uses the K-Means clustering algorithm to aggregate and classify closely related keywords. In this algorithm, each keyword is assigned a value, and the keyword with the largest value in the same cluster is used as the label of the category. K-Means is an iterative clustering algorithm that pre-divides the data into K groups, randomly selects K objects as the initial cluster centers, then calculates the distance between each object and the cluster centers and assigns each object to the cluster center closest to it. The cluster centers and the objects assigned to them represent a cluster. Each time a sample is allocated, the cluster center of the cluster is recalculated based on the existing objects in the cluster. This process is repeated until a certain termination condition is met. The termination condition can be that no (or minimum) objects are reassigned to different clusters, no (or minimum) cluster centers change again, and the Sum of Squared Error (SSE) is locally minimal [50], with a pseudo code as shown in Algorithm 2.
| Algorithm 2: Pseudo code of K-Means |
| 1. sample a point uniformly at random from |
| 2. |
| 3. |
| 4. sample each point independently with probability |
| 5. |
| 6. |
| 7. For , set to be the number of points in closer to than any other point in |
| 8. Re-cluster the weighted points in to cluster |
4.2.4. Construction of Risk Factor System
Through the comprehensive use of keyword co-occurrence analysis and keyword clustering analysis methods, 19 key risk factors affecting the financing model of expressway REITs were screened out. The key risk factors were clustered and analyzed, and 19 risk factors were classified as belonging to the key label collection of six categories. System construction of the key factors affecting the financing model of expressway REITs in this paper is shown in Table 2.
Based on the risk factors selected above, the study used the Fuzzy-DEMATEL method to analyze the importance of financing risk factors of expressway REITs and obtained the exact value by defuzzification process. On this basis, the ISM was used to construct a hierarchical structure model of financing risk factors of expressway REITs and analyze the hierarchical relationship between each influencing factor. Our research used this method to make full use of a large amount of literature data to identify key factors and analyzed the complex systemic issues of capital, economy, society, environment, and policy in the financing process of expressway REITs. This results in a scientific study on the interactions between the risk evaluation index systems of expressway REITs financing.
4.3. Construct a Direct Impact Matrix
From the perspective of achieving the financing objectives of expressway REITs using the linguistic terms and triangular fuzzy numbers in Table 1, 22 experts and scholars evaluated the interaction relationship between 19 risk factors respectively, sorted out and summarized results, corrected the triangular fuzzy numbers, and blurred the data. The fuzzy matrix was de-fuzzified according to the CFCS method Formulas (2)–(8), and the direct influence matrix of 19 risk influencing factors of expressway REITs financing model was obtained (Table 3).
4.4. Construct Comprehensive Impact Matrix
According to Formulas (11) and (12), the data in Table 3 was standardized to obtain a normalized matrix (Table 4). On this basis, according to Formulas (13) and (14), the normalized matrix was calculated to obtain the comprehensive impact matrix of risk factors of the expressway REITs financing model (Table 5).
4.5. Calculate the Influence Degree, Influenced Degree, Centrality Degree and Cause Degree
According to Formulas (15)–(18), the influence degree, influenced degree, centrality degree and cause degree of each element were calculated. The results of the risk factors of the expressway REITs financing model are shown in Table 6, and the cause-centrality degree diagram of the expressway REITs financing model was established, as shown in Figure 5.
4.6. Construct the Reachability Matrix
According to Formulas (19) and (20), the comprehensive impact matrix was transformed into an overall impact matrix (Table 7). According to comprehensive impact matrix T and Formulas (21) and (22), λ is a given threshold value. After calculations, the α = 0.11247, β = 0.07233, so the threshold λ = α + β = 0.1848 was taken, where α is the average of the comprehensive impact matrix T, and β is the standard deviation of T. The value of threshold was set scientifically according to the actual situation around the 0.1848, and the threshold value λ was set mainly to discard the influence relationship with less influence. If the value of λ is too large, the structure of the system is simpler, and it is more difficult to measure the relationship between the factors. If the value is too small, the structure of the system is more complex and the relationship between the factors becomes complicated. To obtain the optimal system structure, we set the threshold λ to 0.1, 0.15, 0.2, and 0.25 as shown in Table 8, conducted multiple comparisons and analyses, and calculated the node degree of each influencing factor under different thresholds as shown in Figure 6, to obtain the optimal system structure.
According to the principle that the node degree is moderate, the larger nodes fall within the domain of key nodes identified by the DEMATEL method [39]. This is appropriate when λ takes the value of 0.15, and the reachable matrix of risk factors of the expressway REITs financing model is obtained according to Formula (23) (Table 9).
4.7. Establish a Multi-Layer Hierarchical Structure Model of Influencing Factors
The reachable set R(Xi), antecedent set A(Xi), and common set B(Xi) of the financing risk factors of expressway REITs are determined by Formulas (24) and (25), as shown in Table 10. The elements that satisfy the Formula (26) are the first-level elements of the system. After removing the elements of the first layer and continuing calculation according to Formula (26), the system was analyzed layer by layer to obtain the structural relationship of the system.
The reachable set and antecedent set of the factor are shown in Table 10. The factors satisfying Formula (26) are X4, X12, and X14. Therefore, the project’s future cash flow under-expected risk, price risk, and counterparty limited risk are first-level factors. Factors X1, X13, and X15 meet the requirements of Formula (26), so the credit risk of the project company, tax risk, and the realization risk on disposal of expressway-related interests are the second-level factors. The factors that meet the requirements of Formula (26) are X2, X3, and X11. Therefore, the credit risk of the original equity holder, the due diligence risk of the special plan manager, and the expressway market risk are at level 3.
The factors that meet the requirements of Formula (26) are X6, X8, X10, X16, X17 and X19. Therefore, the underlying asset operation risk, rating risk, interest rate risk, uncompleted exit risk, force majeure risk and policy risk are at level 4. The factors that meet the requirements of Formula (26) are X7, X9, and X18. Therefore, special account risks, legal risks, and risks related to public offerings are at level 5. The factor that meets the requirements of Formula (26) is X5, so the risk of bankruptcy isolation of the underlying assets is at level 6.
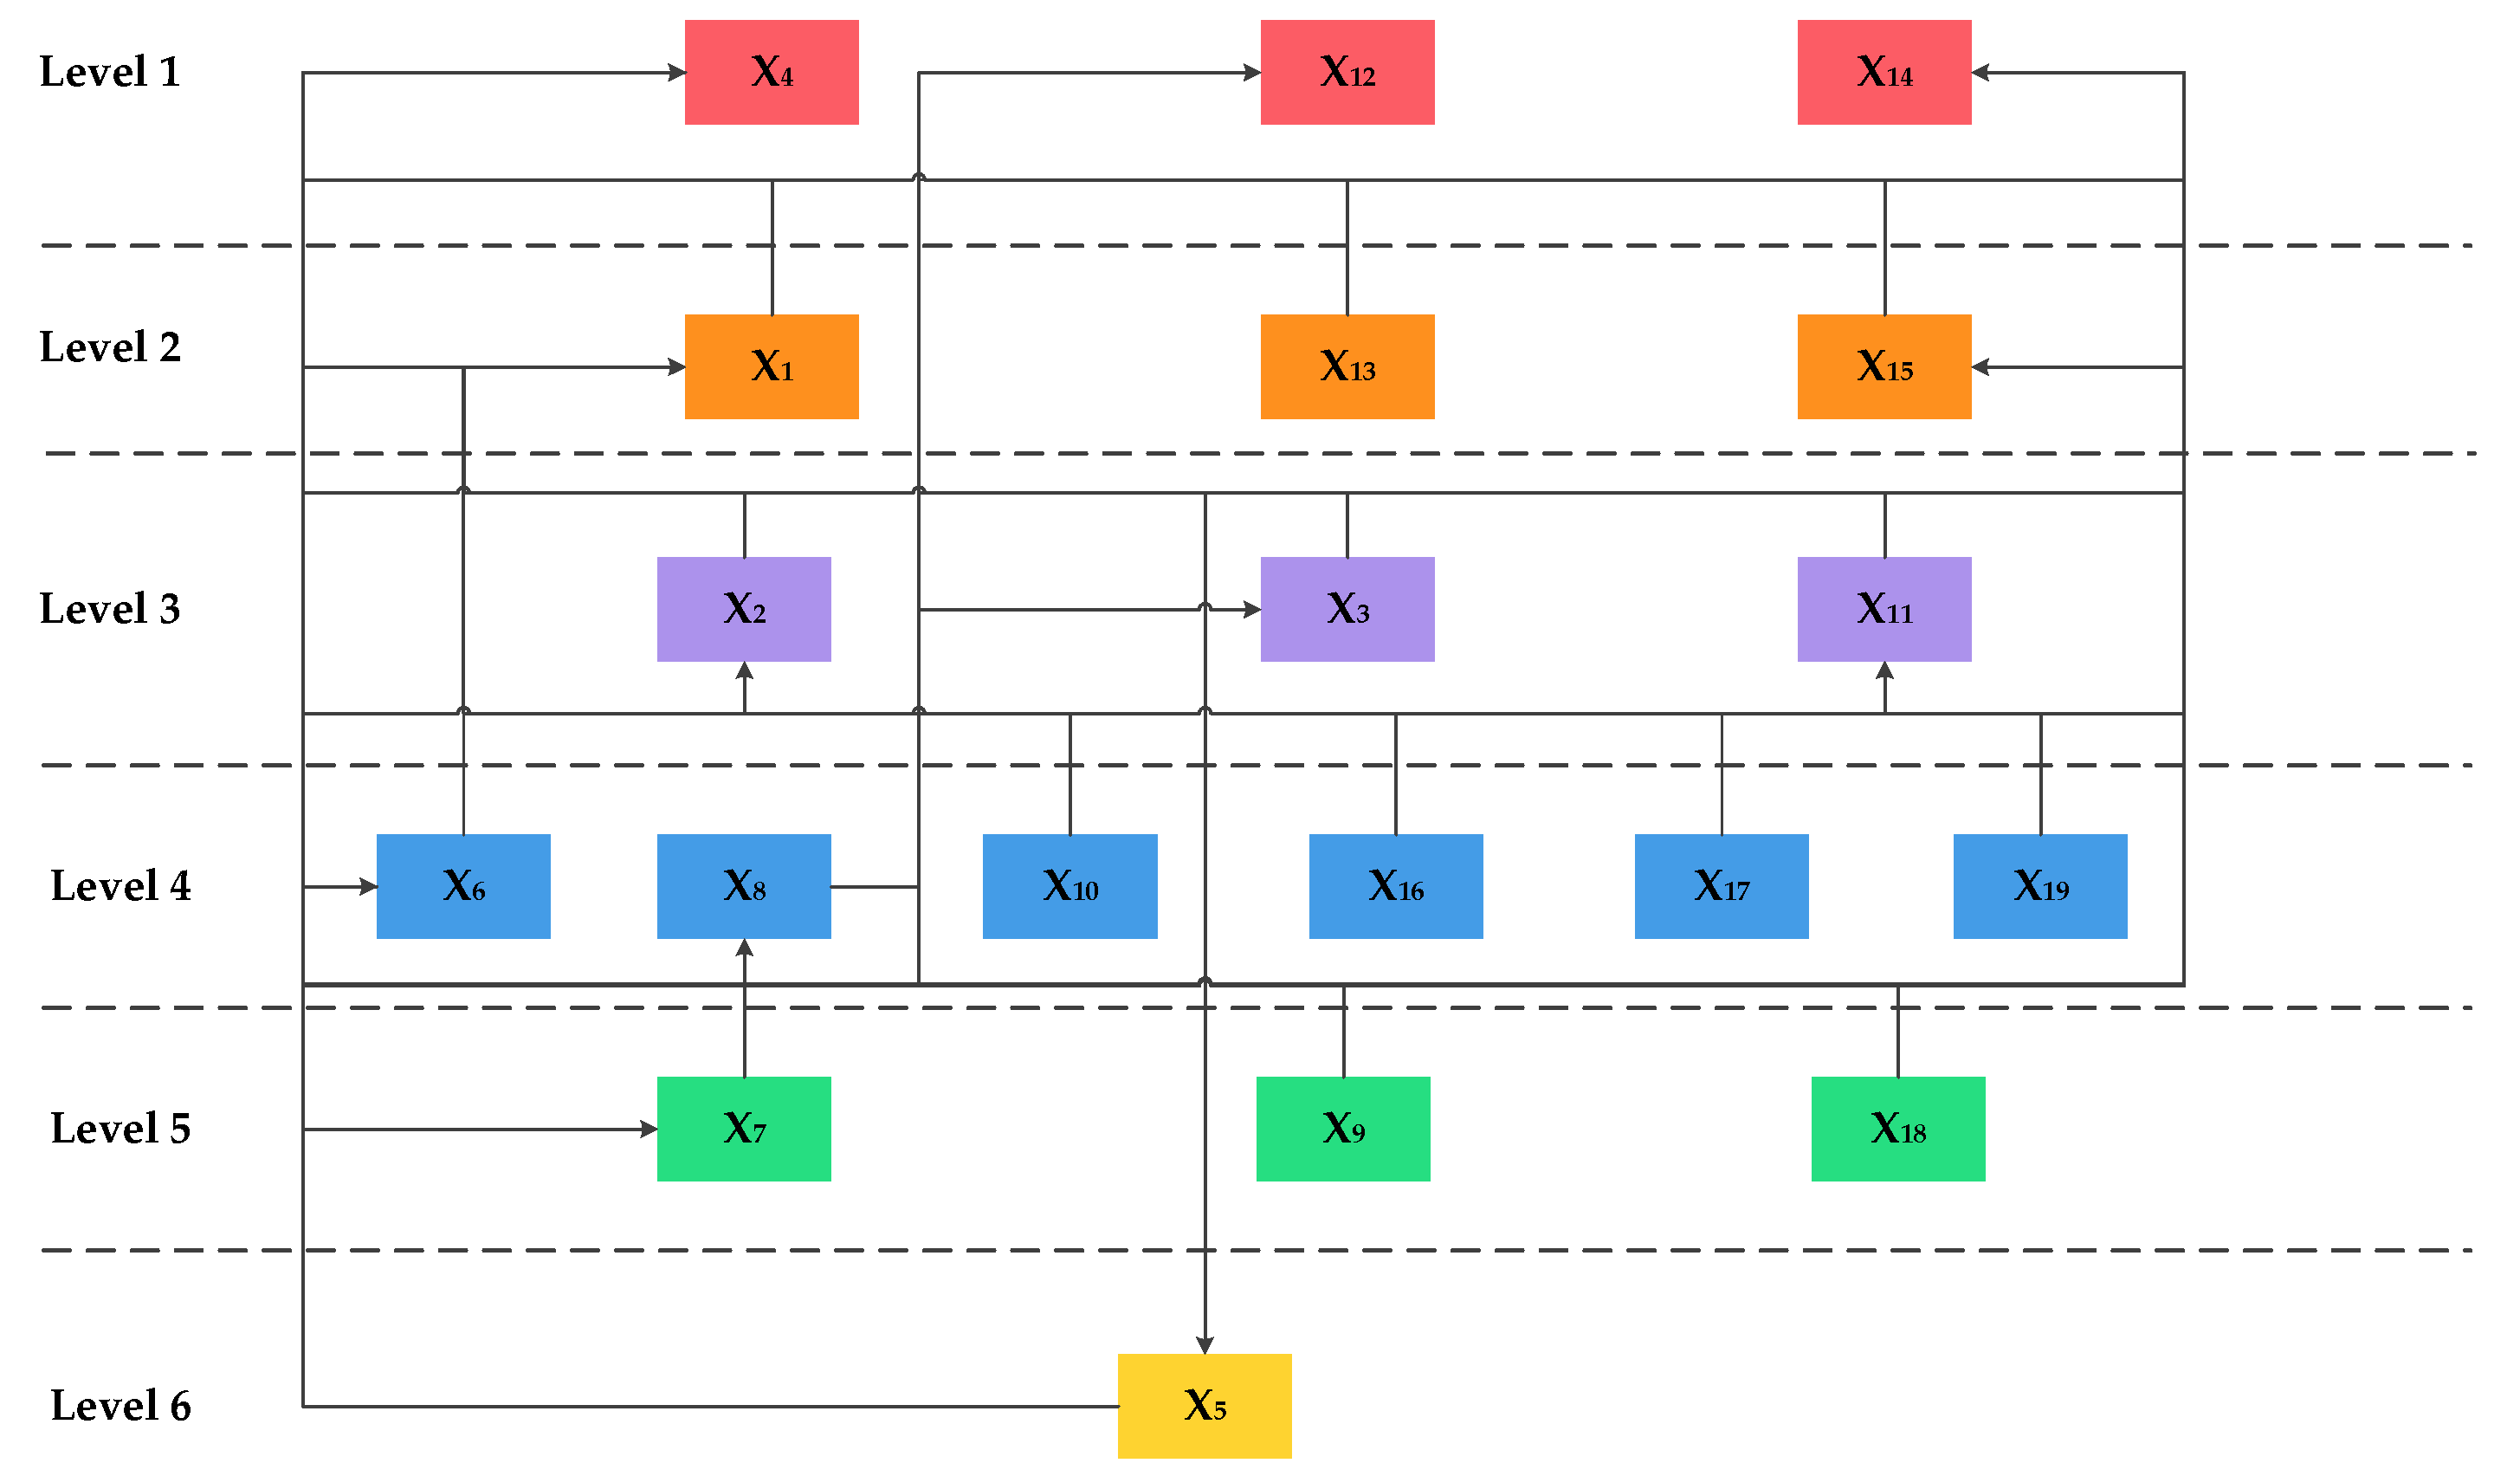
According to Formula (26), factors are extracted layer by layer, and the hierarchical structure model of the financing risk factors of expressway REITs is established (Figure 7). The multi-level structure diagram is divided into six levels, L1 = {X4, X12, X14}, L2 = {X1, X13, X15}, L3 = {X2, X3, X11}, L4 = {X6, X8, X10, X16, X17, X19}, L5 = {X7, X9, X18}, L6 = {X5}.
5. Discussion
5.1. Analysis of Hierarchical Structure Model of Influencing Factors
There is a complex relationship between the factors influencing the financing risk of expressway REITs shown in Figure 7. Among them, credit risk of the project company (X1), credit risk of the original equity holder (X2), due diligence risk of the special plan manager (X3), future cash flow under-expected risk (X4), expressway market risk (X11), price risk (X12), limited counterparty risk (X14), and realization risk on disposal of expressway-related interests (X15) are the most important factors. Moreover, the centrality degrees of the eight factors are also greater, indicating that these factors are key factors affecting the financing of expressway REITs and need to be focused on. Among them, the future cash flow under-expected risk (X4) has the largest centrality degree, indicating that cash flow meeting expectations or not is the key factor that influences the risk of expressway REITs financing.
- (1)
- Direct risk factors affecting the financing of expressway REITs
In the hierarchical structure model, the factors in layer 1 are direct factors. Future cash flow under-expected risk (X4), price risk (X12) and limited counterparty risk (X14) are the direct factors affecting the financing of expressway REITs. Among them, in the case of limited counterparties, holders of senior asset-backed securities may face the risk of not being able to sell the asset-backed securities at a suitable price within a reasonable period and suffer losses, resulting in the failure of the senior securities to exit normally, and difficulties in obtaining liquidity returns, which in turn affects the financing of expressway REITs products directly.
- (2)
- Indirect risk factors affecting the financing of expressway REITs
The factors in levels 2 to 5 are between the deep influencing layer and the direct influencing layer, which are indirect influencing factors. Through the analysis of these factors, the financing risks of expressway REITs can be studied more comprehensively. The credit risk of the project company (X1), tax risk (X13), and realization risk on disposal of expressway-related interests (X15) in the second layer are the transition layer. Taxation is involved in all aspects of REITs project in China, from the establishment, operation, dividends, and exit. Since infrastructure REITs need to pay value-added tax and stamp duty based on the value-added part of the assessed value when their assets are transferred to the project company, they face high tax burdens in the transfer of ownership, which has an indirect effect on the financing of expressway REITs. In addition, the realization risk on disposal of expressway-related interests (X15) is affected by the particularity of expressway toll rights, as well as the relevant disposal procedures and the market environment at that time, such as state capital. The time of realization and the amount of cash realized from the disposal of expressway toll rights, and advertising revenue receivables as pledged property, are uncertain, which may affect the realization of expected income of asset-backed securities holders and indirectly affects the financing of expressway REITs products. This should be focused on.
The credit risk of the original equity holder (X2), due diligence risk of the special plan manager (X3) and expressway market risk (X11) are indirect influencing factors in level 3. Credit and due diligence risks are related to all stakeholders involved in the contract who can complete and perform their due responsibilities and obligations or not. The prevention of such risks needs to be completed through the continuous improvement of regulations and standards, and the gradual maturity of related supporting mechanisms to promote the development of the investment and financing environment of expressway REITs.
Underlying asset operation risk (X6), rating risk (X8), interest rate risk (X10), uncompleted exit risk (X16), force majeure risk (X17) and policy risk (X19) are indirect risks in level 4. The operation of basic assets causes serious risk problems in operation due to the complexity of the external environment, which will reduce the management level and causes certain economic losses. The sustained and stable profitability of projects in operation management is key to the sustainability of REITs, and it is also the top priority of the financing risks affecting expressway REITs. The price fluctuations, policy changes and changes in the external environment indirectly affect the financing of expressway REITs and bring certain risk fluctuations.
Special account risks (X7), legal risks (X9) and risks related to public offerings (X18) are in level 5. Among the risks related to public offerings and listings, according to regulatory authorities of China, shares of REITs held by the original holders cannot be transferred during the lock-up period. Therefore, holders of the asset-backed securities of the special plan are allocated in the form of shares of REITs, and the income cannot be realized in the form of cash. Holders of special plan asset-backed securities that hold shares of REITs during the lock-up period need to consider the risk of a decline in the value of REITs shares, which indirectly affects the financing of expressway REITs products.
- (3)
- The fundamental influencing factors of the financing risk of expressway REITs
The risk of bankruptcy isolation of the underlying assets (X5) factor is a deep-seated factor in level 6. X5 is not easily affected by other factors and is more likely to affect other factors. It plays a basic role and ultimately has a fundamental impact on the financing risk of expressway REITs through levels 1–5. It is important to realize the bankruptcy isolation of the underlying assets and the original stakeholders of the expressway REITs project in China. Due to the particularity of China’s expressway projects, franchise rights cannot be freely transferred without the permission of relevant government departments. Therefore, it is important to realize the “true sale” of the underlying assets and achieve the risk isolation between the underlying assets and the original equity holders. This will affect the cash flow generated by expressway REITs project assets and become a fundamental factor affecting the financing risks of expressway REITs.
5.2. Analysis of Cause Degree and Result Degree
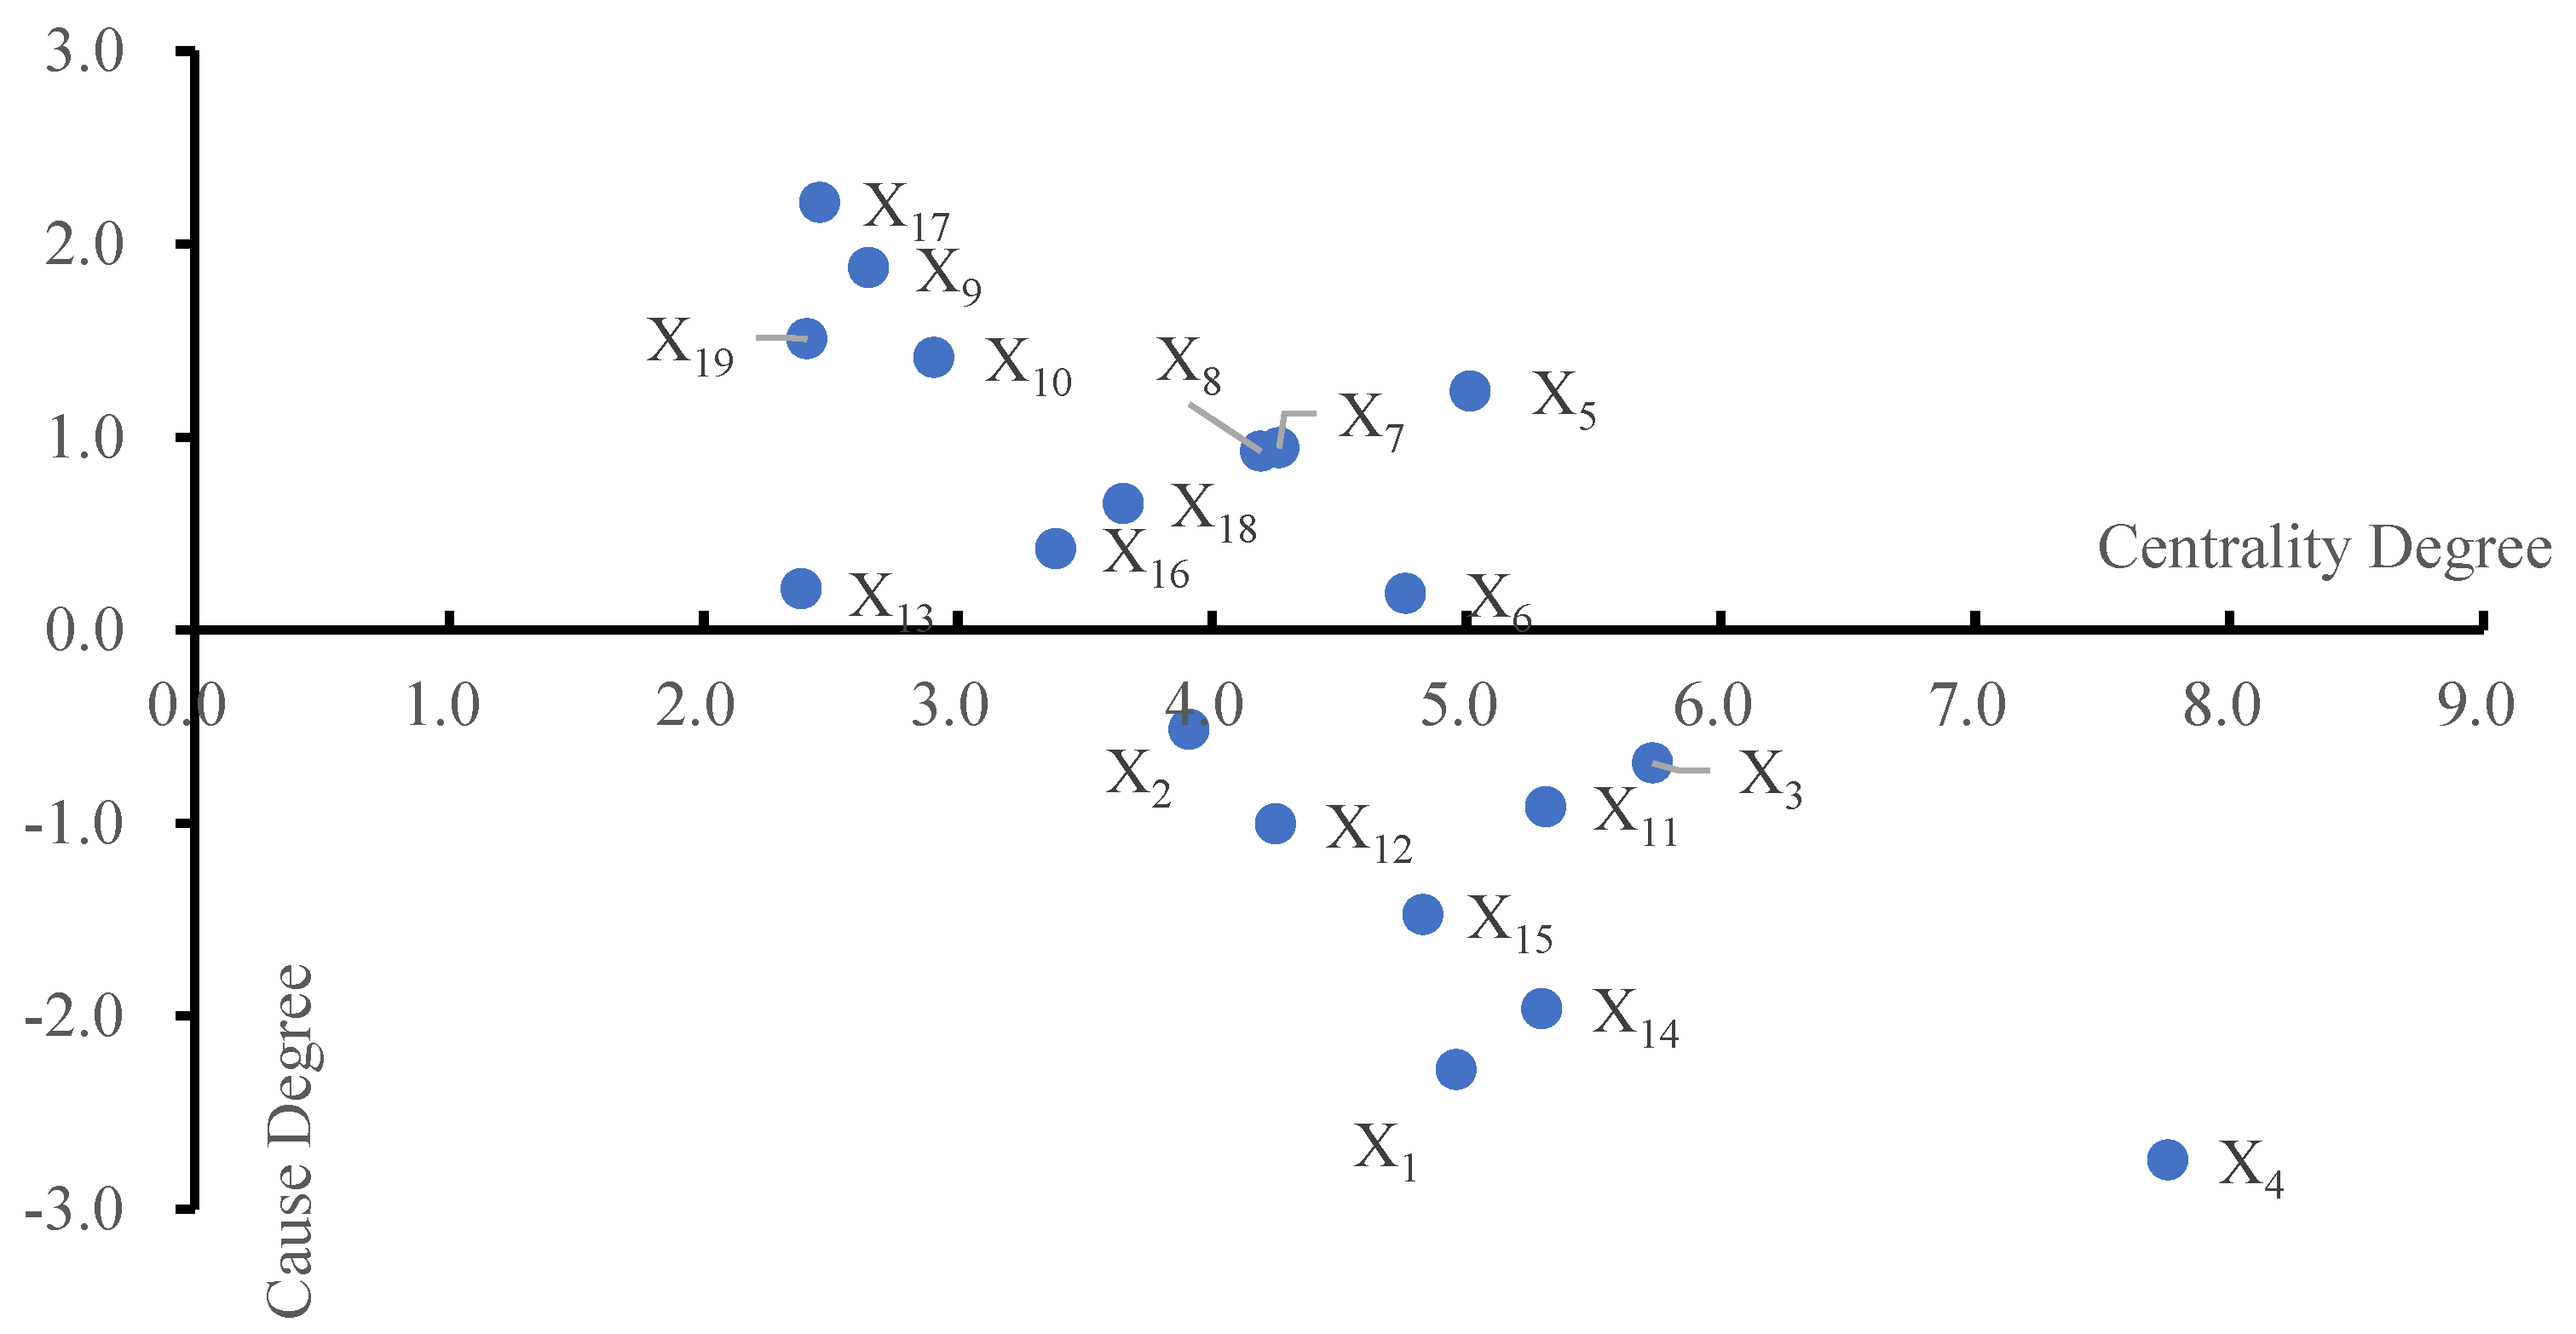
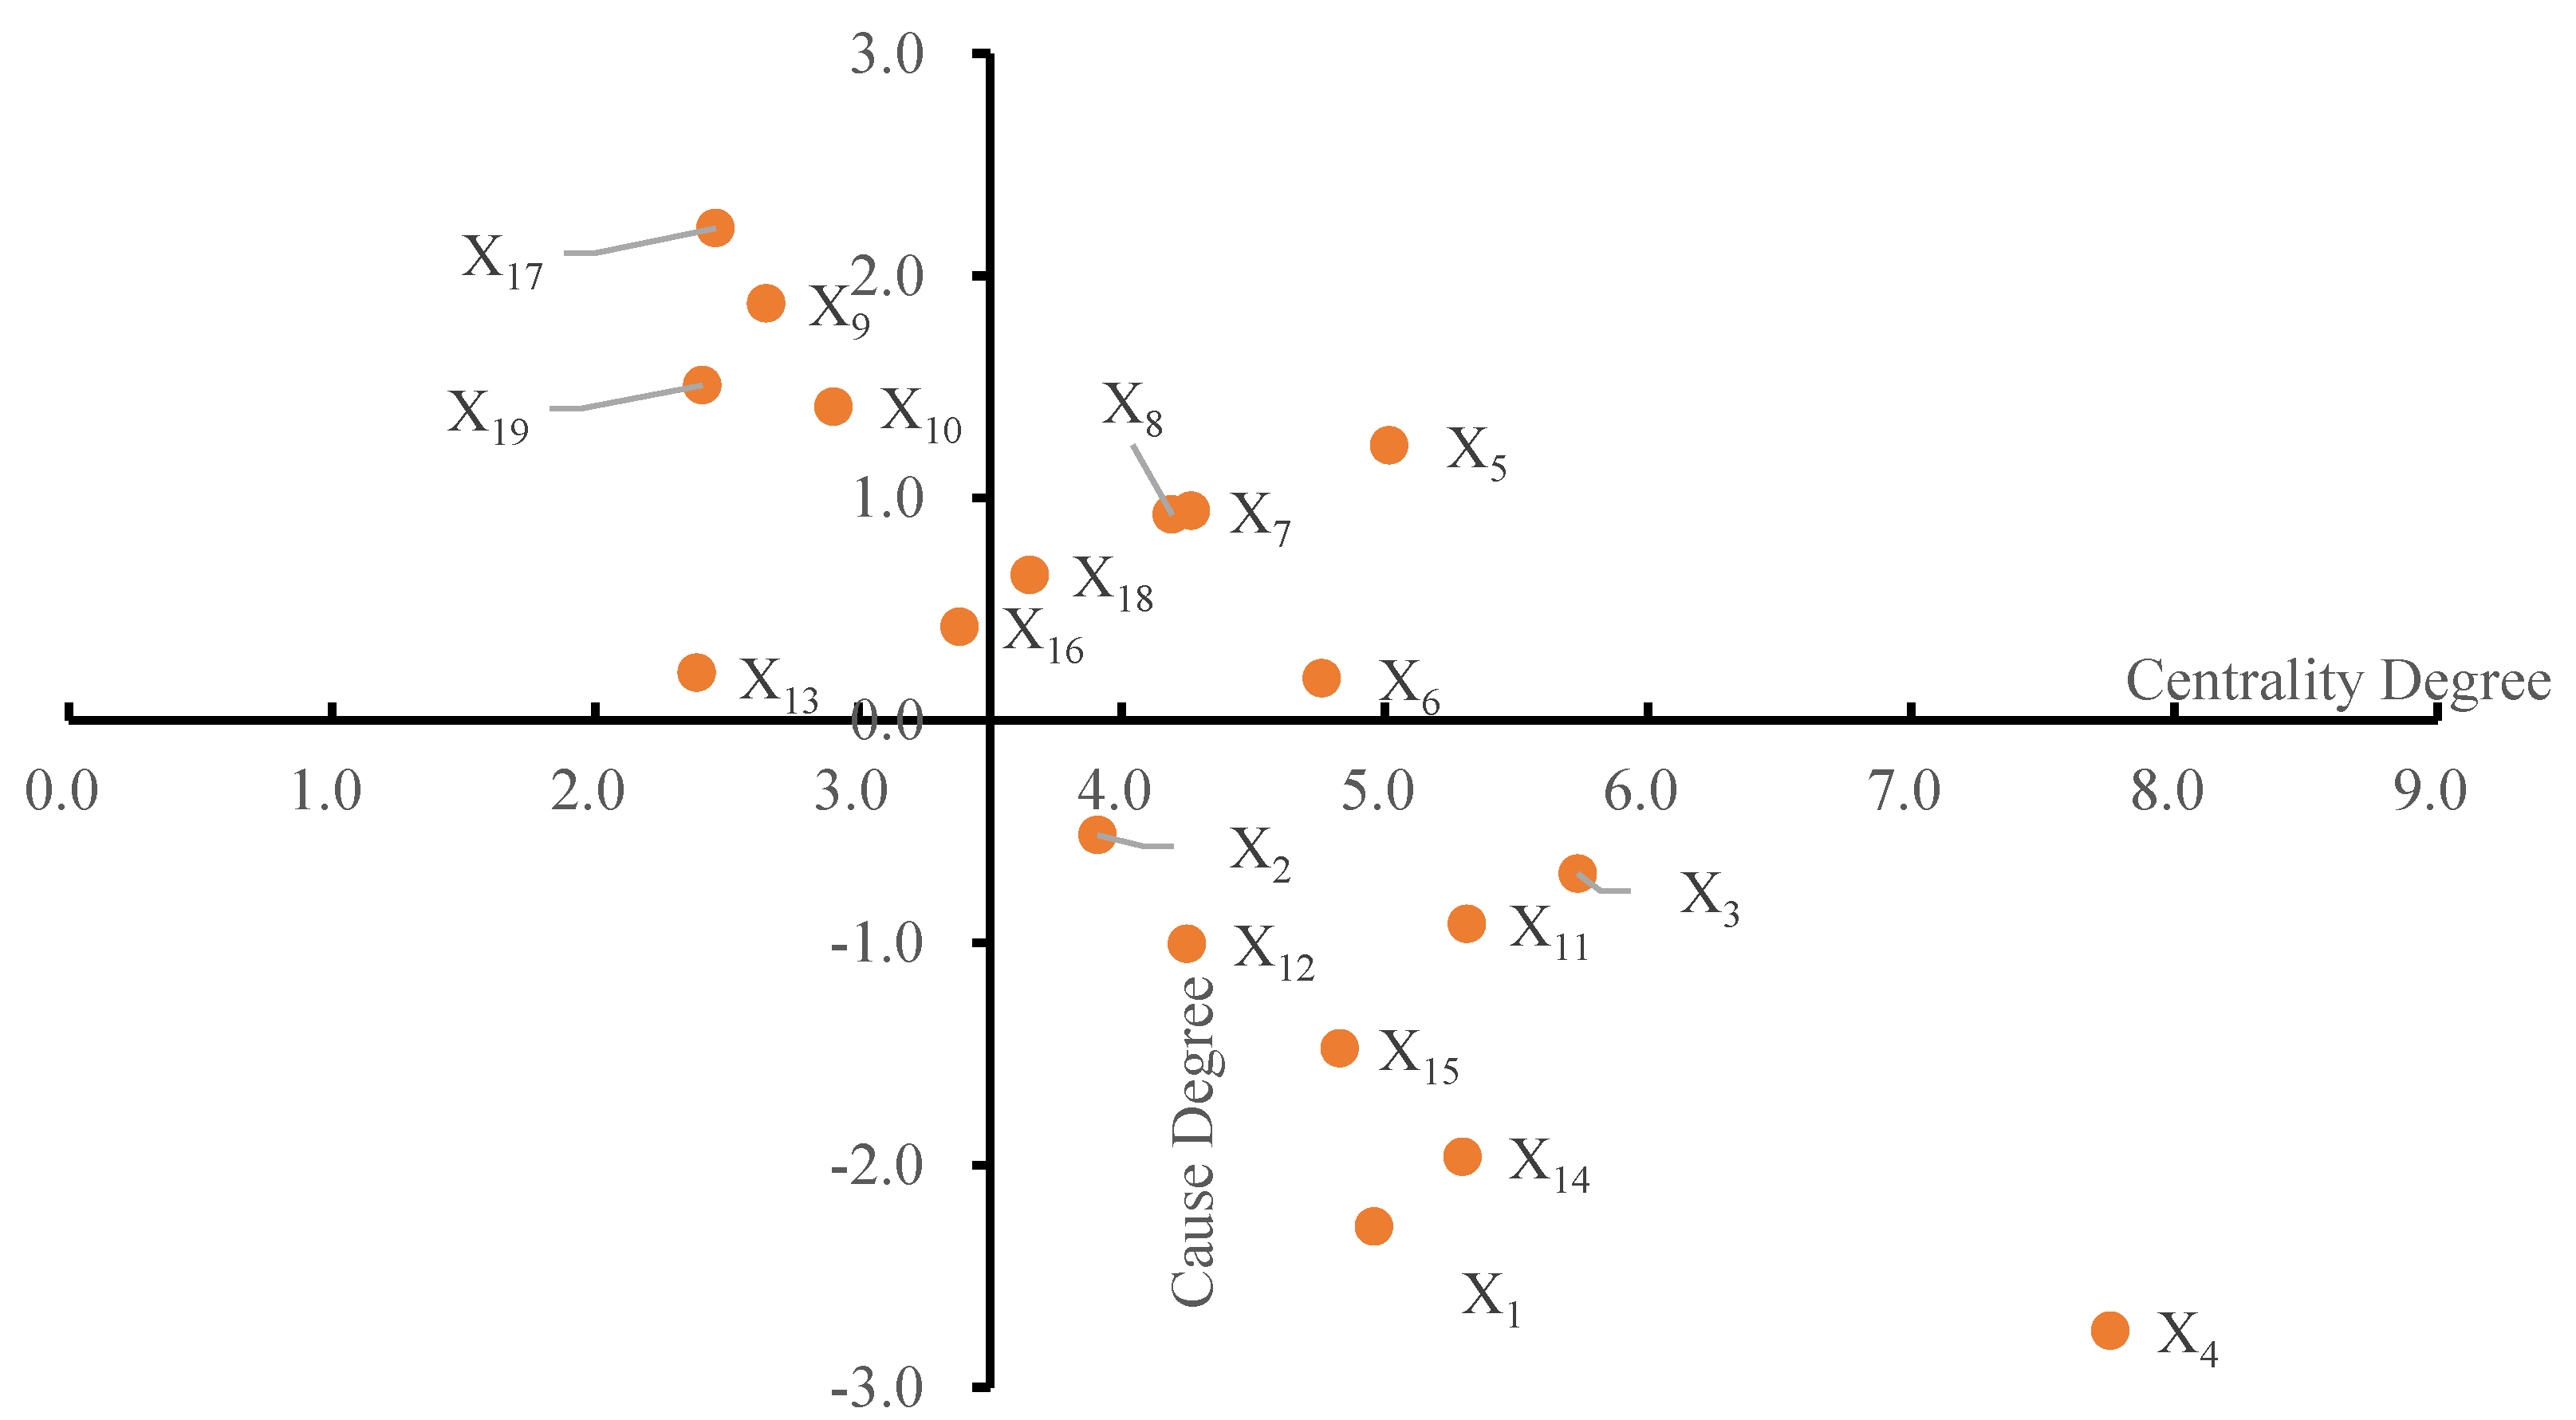
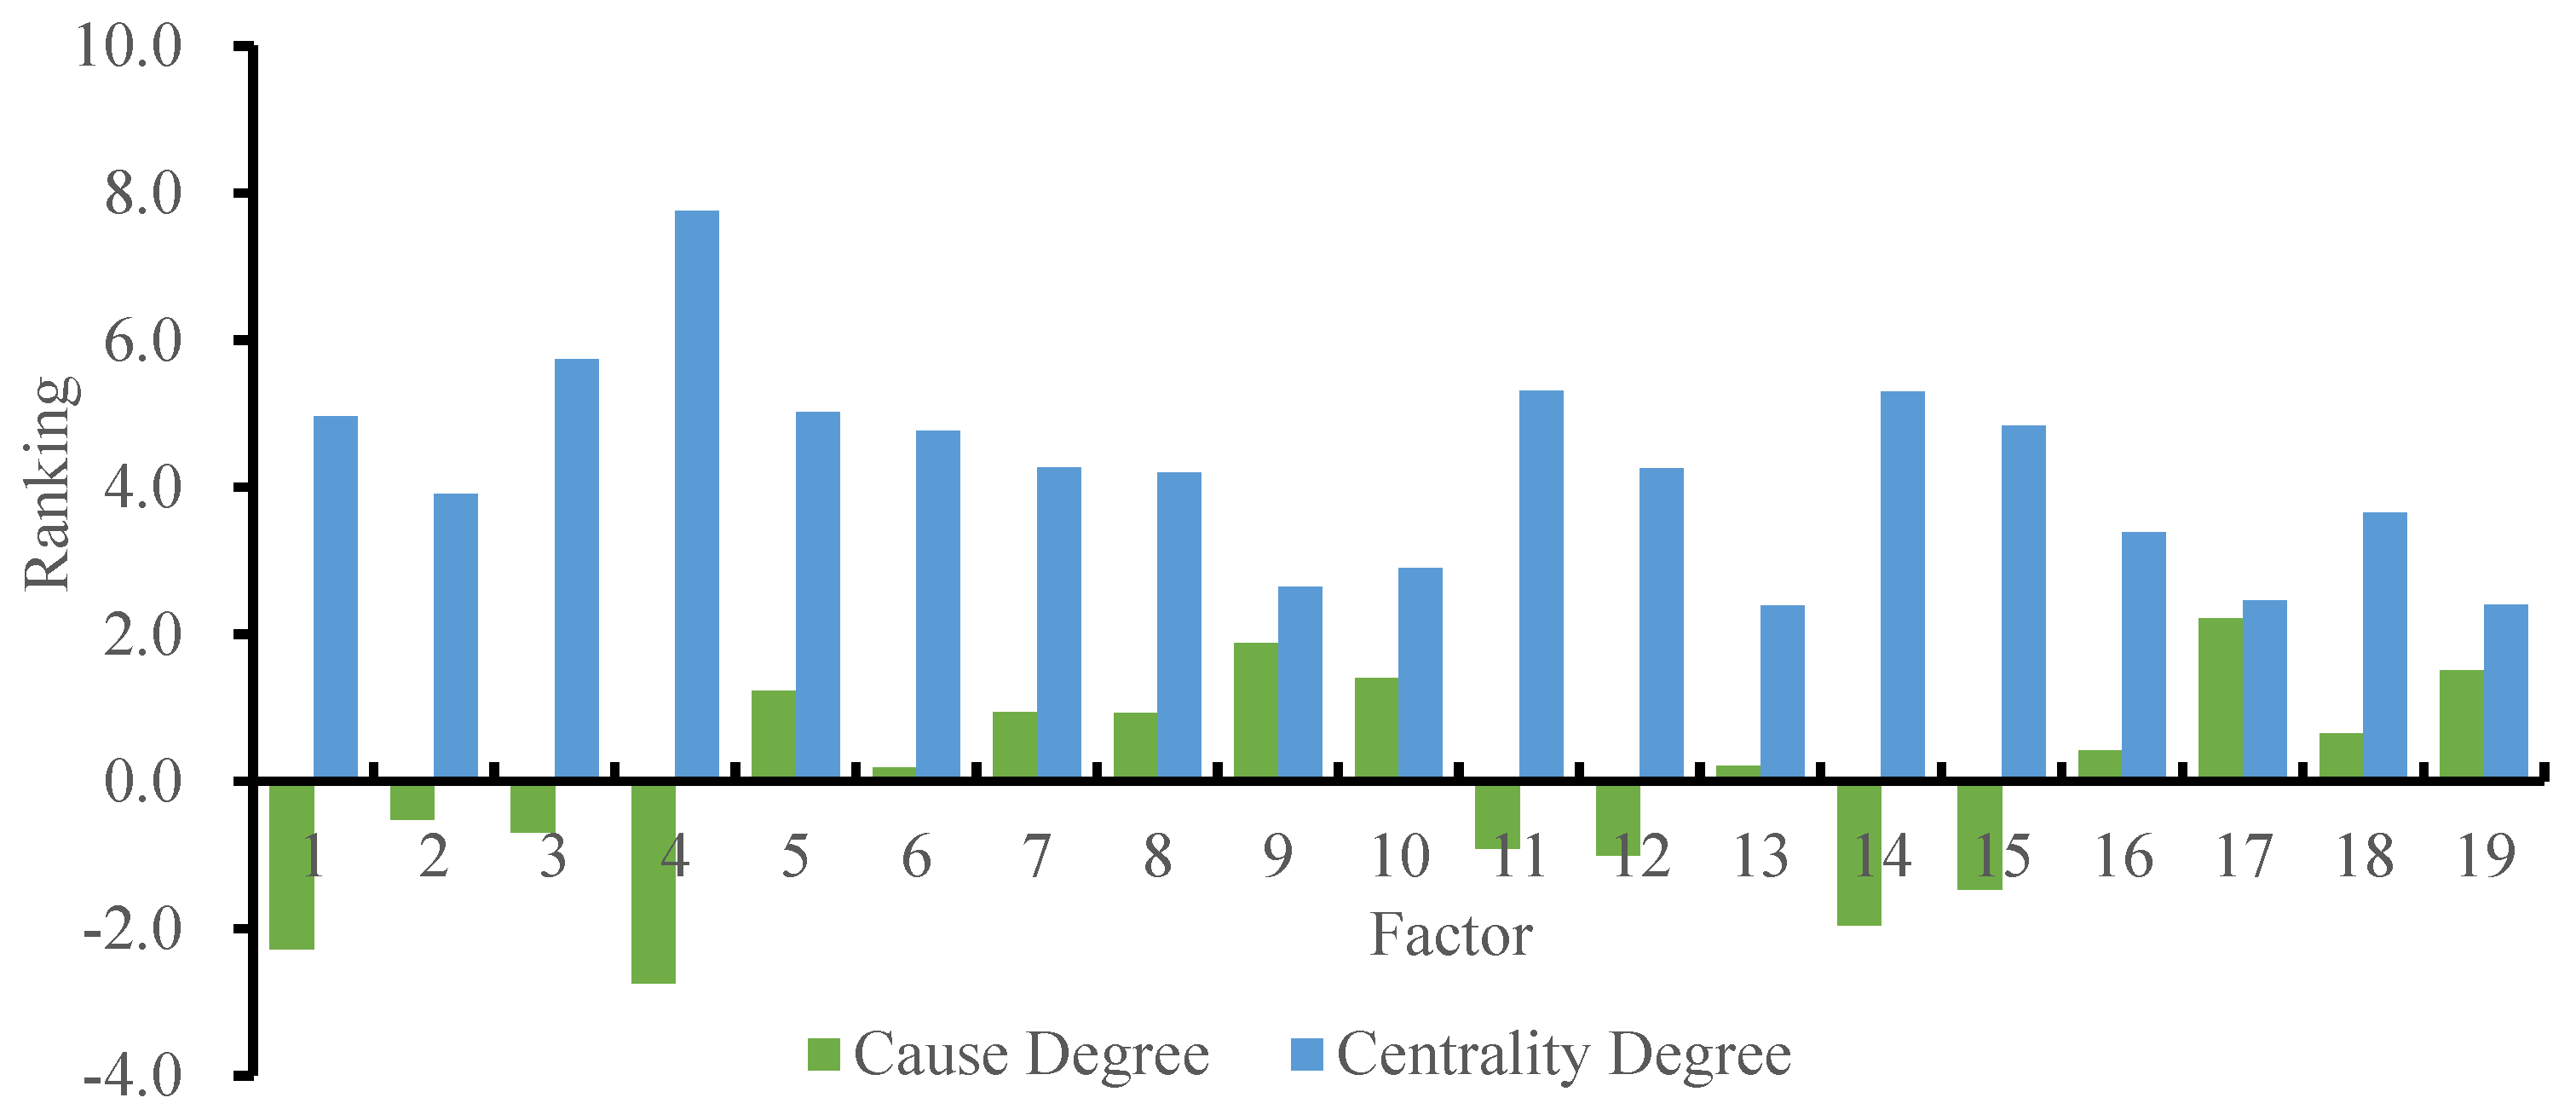
The complex system is analyzed through four indicators: influence degree, influenced degree, cause degree, and centrality. Centrality degree indicates the degree of importance of each influencing factor, and the larger the value of centrality, the greater the role played by the factor in the index system. The centrality degree is used to determine the importance of each factor on expressway REITs financing. When the cause degree of the influencing factor is greater than 0, this indicates that the factor has a greater influence on other factors when the value is larger, which is the cause indicator in the system. When the cause degree is less than 0, this indicates that the factor has a smaller influence on other factors when the value is smaller, which is the result indicator in the system. The degree of influence of various risk factors on the financing of expressway REITs can be analyzed by the influence degree and the influenced degree. To analyze and observe the relationship between the influencing factors by centrality degree and cause degree, taking Figure 5 as the prototype with (3.5, 0) as the origin, a new coordinate system is established. The relationship diagram of the influencing factors is shown in Figure 8. According to the Table 6, the order of the cause degree and centrality degree of the influencing factors is established, as shown in Figure 9.
It can be seen from the fourth quadrant of Figure 8 and negative value of cause degree in Figure 9 that the absolute value order of the resulting factors is: the future cash flow under-expected risk (X4), credit risk of the project company (X1), limited counterparty risk (X14), and realization risk on disposal of expressway-related interests (X15), price risk (X12), expressway market risk (X11), due diligence risk of the special plan manager (X3) and credit risk of the original equity holder (X2). These eight factors are easily affected by other factors. The order of the causal factors is force majeure risk (X17), legal risk (X9), policy risk (X19), interest rate risk (X10), risk of bankruptcy isolation of the underlying assets (X5), rating risk (X8), special account risk (X7), risks related to public offerings (X18), uncompleted exit risks (X16), tax risks (X13), and underlying asset operation risks (X6). These 11 factors have a profound impact on other factors.
In addition, according to Figure 8, the risk of bankruptcy isolation of the underlying assets (X5), rating risk (X8), special account risk (X7), risk related to public offerings (X18), and underlying asset operation risk (X6) are in the first quadrant. The cause and centrality degree of these factors are both higher than others, indicating that they are key factors and need to be focused on. Force majeure risk (X17), legal risk (X9), policy risk (X19), interest rate risk (X10), uncompleted exit risk (X16), and tax risk (X13) are in the second quadrant. These factors have a higher cause degree and lower centrality degree. This shows that these factors have a strong influence on other factors.
Credit risk of the project company (X1), credit risk of the original equity holder (X2), due diligence risk of the special plan manager (X3), future cash flow under-expected risk (X4), expressway market risk (X11), price risk (X12), limited counterparty risk (X14), and realization risk on disposal of expressway-related interests (X15) are located in the fourth quadrant, indicating that these factors have a relatively higher centrality degree and are key factors affecting the financing of expressway REITs. However, the cause degree of these factors is negative, which shows that these factors are result factors and are easily affected by other factors. Concerning the magnitude of the asset portfolio, REITs are issued to the public or select investors to obtain capital. Throughout the operation and administration phase, a professional team is entrusted with the daily management of the expressway in accordance with applicable government rules.
6. Conclusions
In this research, 19 factors affecting the financing risk of expressway REITs were obtained by literature research, keyword co-occurrence analysis and keyword clustering analysis methods, and were analyzed in depth by a combined Fuzzy-DEMATEL-ISM model. The research content is rich and comprehensive, and the results provide reference for further research on expressway REITs and experience for the development of infrastructure REITs project financing in China. The following conclusions were obtained.
First, the combination of Fuzzy-DEMATEL-ISM can be used to investigate the relationships between various factors that affect financing risk of expressway REITs. By calculating the cause degree and centrality degree of each influencing factor through the Fuzzy DEMATEL methods, 11 causality factors and eight result factors affecting the financing risk of expressway REITs were obtained. By using the ISM method, eight influencing factors with larger nodes were obtained. The relationships among these risk factors and their effects on the financing of expressway REITs were analyzed.
Moreover, the factors that affect financing risk of expressway REITs are quite complex with a hierarchical pattern. By establishing a multi-level hierarchical structure model of the factors influencing the financing risk of expressway REITs, this study divided 19 influencing factors from six dimensions into six levels. We fully analyzed the degree of influence of different levels of risk factors on the financing of expressway REITs and their mutual influence.
This study differs from previous studies in several points. Current research on the financing risk of expressway REITs has mainly studied the impact of a certain factor or a certain type of factor by means of case studies. However, our research first investigated an exhaustive set of risks to expressway REITs financing development as a sustainable solution was investigated. Second, the study focused on Chinese contexts to explore the impact of these risks toward the growth of expressway REITs financing in China. In addition, the study also evaluated the applicability of Fuzzy-DEMATEL-ISM approach for analyzing complicated inter-relationships. Finally, the findings enhance policymakers’ decisions by concentrating on the key influential risks to expressway REITs financing in China.
Furthermore, the policy recommendations for expressway REITs should be based on the particularity of the industry. Under the circumstance that the relevant supporting rules and regulations of REITs are not perfect at present, it is urgent to improve the in-situational framework of REITs from the top-level design, first by cooperating with the expressway capital supply system and investment and financing policies, in line with the development direction of the future overall expressway fund security policy. Second, to coordinate with the industry-related top-level design and by revision of laws and regulations. Third to cooperate with the industry asset management system to strengthen the supervision and assessment of the operation ability and management level of the assets.
Our study offers several avenues for future research. Since the findings of the study are contextual to China only, the same framework may be explored and tested in other nations struggling to develop REITs. Future research can be expanded to include not only expressways, but also the entire infrastructure sector, such as energy, municipal administration, and logistics industrial parks. Finally, case-based quantitative prioritization of factors may also be carried out in future research.
Author Contributions
Conceptualization, Y.S. and S.H.; Data curation, Y.S.; Formal analysis, Y.S. and S.H.; Investigation, Y.S. and S.H.; Methodology, Y.S. and S.H.; Software, Y.S.; Writing—original draft preparation, Y.S.; Writing—review and editing, Y.S. and S.H.; Project administration, S.H.; Funding acquisition, Y.S. and S.H. All authors have read and agreed to the published version of the manuscript.
Funding
This research was supported by the Fundamental Research Funds for the Central Universities 2021YJS047.
Institutional Review Board Statement
No applicable.
Informed Consent Statement
No applicable.
Data Availability Statement
No applicable.
Acknowledgments
The authors are grateful to the editor and anonymous referees for their constructive comments and suggestions, which sufficiently help the authors to improve the presentation of this manuscript.
Conflicts of Interest
The authors declare no conflict of interest.
References
- Chan, S.H.; Erickson, J.; Wang, K. Real Estate Investment Trusts-Structure, Performance, and Investment Opportunities; Economic Science Press: Beijing, China, 2004; pp. 36–41. [Google Scholar]
- Wu, D.; Niu, Y.S.; Du, Z.Q.; Wang, S.Q. A Brief Description of US REITs and Its Inspiration. Proj. Manag. Rev. 2020, 5, 34–38. [Google Scholar]
- Zhu, Y.M.; Xiao, F.S. Practical analysis of infrastructure public REITs. Proj. Manag. Rev. 2021, 2, 48–53. [Google Scholar]
- Wu, D.; Niu, Y.S.; Du, Z.Q.; Wang, S.Q.; Ye, L. Risk measurement of infrastructure REITs market. Proj. Manag. Rev. 2020, 6, 34–39. [Google Scholar]
- Han, Z.F. REITs: China’s Road; People’s Publishing House: Beijing, China, 2021; pp. 298–301. [Google Scholar]
- Cui, M.; Wang, J.; Huang, L.Y.; Luo, S.Y. Investment and Financing Dilemma in Transportation Infrastructure and the Exploration of REITs in China. Highway 2022, 67, 291–294. [Google Scholar]
- Li, R.Y.M.; Chau, K.W. Econometric Analyses of International Housing Markets; Routledge: London, UK, 2016. [Google Scholar]
- Gao, Y. Research on Risk Management of Real Estate Investment Trusts (REITs); East China Normal University: Shanghai, China, 2006. [Google Scholar]
- Chen, G.L. Risk-return study of REITs and its applicability to the use of insurance funds. Insur. Res. 2006, 9, 60–63. [Google Scholar]
- Dai, H. Risk Management of China’s Real Estate Investment Trusts. China Gen. Account. 2014, 1, 133–135. [Google Scholar]
- Zhang, W.Y.; Lin, J.Y.; Chen, Q.M.; Chen, Z.X.; Fang, H.B.; Liu, Q.S. A study on the risk of real estate trust cash-out. China Mark. 2015, 25, 96–97. [Google Scholar]
- Wang, R.T. Research on risk prevention of real estate investment trusts in China. Explor. Econ. Issues 2008, 9, 153–156. [Google Scholar]
- Liu, W.; Xia, E.J.; Yang, S.H. Research on risk evaluation of real estate trust investment funds. Shandong Soc. Sci. 2016, 8, 154–159. [Google Scholar]
- Giannotti, C.; Mattarocci, G. Risk diversification in a real estate portfolio: Evidence from the Italian market. J. Eur. Real Estate Res. 2013, 269, 86–87. [Google Scholar] [CrossRef]
- Chaudhry, M.; Maheshwari, S.; Webb, J. REITs and idiosyncratic risk. J. Real Estate Res. 2004, 26, 207–222. [Google Scholar] [CrossRef]
- Rong, N.; Trick, S. Modelling the Dependence Structure between Australian Equity and Real Estate Markets—A Conditional Copula Approach. Australas. Account. Bus. Financ. J. 2014, 8, 93–113. [Google Scholar] [CrossRef] [Green Version]
- Kuang, L.C. The Nonlinear Effects of Expected and Unexpected Components of Monetary Policy on the Dynamics of REITs Returns. Econ. Model. 2011, 28, 911–920. [Google Scholar]
- Xu, N.; Dong, J.; Song, L.F. The position, model, and basic framework of real estate investment trusts in mainland China. China Real Estate 2006, 8, 43–45. [Google Scholar]
- Guo, J.Q. The operation mode, transaction structure design and risk control of CMBS and REIT-like in China. Tsinghua Financ. Rev. 2017, 12, 82–84. [Google Scholar]
- Long, T.W.; Chen, F.H.; Yu, O.Y.; Wang, K.J. Review and reflection on real estate investment trust fund risk research. J. Eng. Manag. 2017, 31(05), 129–134. [Google Scholar]
- Yin, A.D.; He, H.N. Research on risk control measures of real estate trusts. Technol. Ind. 2011, 11, 54–57. [Google Scholar]
- James, R., III. Customer satisfaction with apartment housing offered by Real Estate Investment Trusts (REITs). Int. J. Consum. Stud. 2009, 33, 572–580. [Google Scholar] [CrossRef]
- Campbell, R.D.; Ghosh, C.; Petrova, M.; Sirmans, C.F. Corporate Governance and Performance in the Market for Corporate Control: The Case of REITs. J. Real Estate Financ. Econ. 2011, 42, 451–480. [Google Scholar] [CrossRef]
- Chen, M.-C.; Tsai, I.-C.; Chen, K.L.; Lo, H.Y. A Preliminary Analysis for Measuring Operating Performance of Real Estate Investment Trusts in Taiwan: Net Income vs. Operation Funds. Contemp. Manag. Res. 2011, 7, 271–290. [Google Scholar] [CrossRef]
- Benveniste, L.M.; Berger, A.N. Securitization with recourse: An instrument that offers uninsured bank depositors sequential claims. J. Bank. Financ. 1987, 11, 403–424. [Google Scholar] [CrossRef]
- Chen, L.M. Exploration of the securitization path of highway assets under the new normal. Transp. Financ. Account. 2018, 6, 11–14. [Google Scholar]
- Sun, Y.F.; Yang, X.Y.; Wang, X.Y. The risk of asset securitization financing of expressway PPP projects and its prevention. Financ. Account. Mon. 2019, 9, 164–170. [Google Scholar]
- Tang, B. Exploring the financing path of highway construction asset securitization. Bus. Account. 2012, 5, 88–89. [Google Scholar]
- Tang, S.Y.; Liu, Y. Asset securitization financing path of highway listed companies and thinking about it. Soc. Sci. 2012, 1, 90–91. [Google Scholar]
- Gomez-Gonzalez, J.E.; Hirs-Garzon, J. Dynamic Spillovers between REITs and Stock Markets in Global Financial Markets. J. Real Estate Portf. Manag. 2021, 27, 20–28. [Google Scholar] [CrossRef]
- Bouri, E.; Gupta, R.; Wang, S. Nonlinear contagion between stock and real estate markets: International evidence from a local Gaussian correlation approach. Int. J. Financ. Econ. 2020; 1–21. [Google Scholar] [CrossRef]
- Lesame, K.; Bouri, E.; Gabauer, D.; Gupta, R. On the Dynamics of International Real Estate-Investment Trust-Propagation Mechanisms: Evidence from Time-Varying Return and Volatility Connectedness Measures. Entropy 2021, 23, 1048. [Google Scholar] [CrossRef]
- Albulescu, C.T.; Bouri, E.; Tiwari, A.K.; Roubaud, D. Quantile causality between banking stock and real estate securities returns in the US. Q. Rev. Econ. Financ. 2020, 78, 251–260. [Google Scholar] [CrossRef]
- Zhu, B. The Development of REIT Markets in Greater China. In Understanding China’s Real Estate Markets; Springer: Cham, Switzerland, 2021; pp. 203–219. [Google Scholar]
- Vlachos, I. The impact of transaction cost economics and competitive factors upon the design of contracts: A study using DEMATEL. Int. J. Decis. Sci. Risk Manag. 2012, 4, 217–232. [Google Scholar]
- Wang, F.W.; Xu, Y.S.; Wang, Z.K.; Yin, Z.X.; Ma, Y. Significant ship for major ships based on DEMATEL-ANP. J. Saf. Environ. 2021, 21, 62–69. [Google Scholar]
- Keskin, G.A. Using integrated fuzzy DEMATEl and fuzzy C: Means algorithm for supplier evaluation and selection. Int. J. Prod. Res. 2015, 53, 3586–3602. [Google Scholar] [CrossRef]
- Zhou, D.Q. Systems Engineering Methods and Applications; Electronic Industry Press: Beijing, China, 2015. [Google Scholar]
- Li, R. Fuzzy method in group decision making. Comput. Math. Appl. 1999, 38, 91–101. [Google Scholar] [CrossRef] [Green Version]
- Opricovic, S.; Tzeng, G.H. Defuzzification within a multicriteria decision model. Int. J. Uncertain. Fuzziness Knowl. Based Syst. 2003, 11, 635–652. [Google Scholar] [CrossRef]
- Bu, L.J.; Yu, Z.J.; Shao, Z.K. Study on factors influencing fire safety management in universities based on DEMATEL/ISM. China Saf. Sci. J. 2018, 28, 133–138. [Google Scholar]
- Yue, R.T.; Han, Y.X. Research on DEMATEL-ISM model of airline security risk factors. J. Saf. Environ. 2020, 20, 2091–2097. [Google Scholar]
- Singh, R.; Bhanot, N. An integrated DEMATEL-MMDE-ISM based approach for analysing the barriers of IoT implementation in the manufacturing industry. Int. J. Prod. Res. 2020, 58, 2454–2476. [Google Scholar] [CrossRef]
- Liu, M.F.; Chen, W. Research on the risk factors of the logistics service quality of the fresh cold chain front warehouse based on the integrated DEMATEL-ISM. Saf. Environ. Eng. 2020, 27, 118–125. [Google Scholar]
- Wang, W.H.; Zhu, Z.X.; Mi, H.P.; Wang, J.Q.; Liu, Y.L.; Jiang, X.S. Research on the Influencing Factors of Fire Accidents in Urban Underground Comprehensive Pipe Gallery Based on DEMATEL-ISM. Saf. Environ. Eng. 2020, 20, 793–800. [Google Scholar]
- Collins, M. Discriminative training methods for hidden markov models: Theory and experiments with perceptron algorithms. In Proceedings of the 2002 Conference on Empirical Methods in Natural Language Processing (EMNLP 2002), Stroudsburg, PA, USA, 6 July 2002; pp. 1–8. [Google Scholar]
- Bian, Z.Q.; Zhang, X.G. Pattern Recognition; Tsinghua University Press: Beijing, China, 1999. [Google Scholar]
- Luo, F.; Li, R.Y.M.; Crabbe, M.J.C.; Pu, R. Economic development and construction safety research: A bibliometrics approach. Saf. Sci. 2022, 145, 105519. [Google Scholar] [CrossRef]
- Zeng, L.; Li, R.Y.M.; Nuttapong, J.; Sun, J.; Mao, Y. Economic Development and Mountain Tourism Research from 2010 to 2020: Bibliometric Analysis and Science Mapping Approach. Sustainability 2022, 14, 562. [Google Scholar] [CrossRef]
- Kaufman, L.; Rousseeuw, P. Finding Groups in Data: An Introduction to Cluster Analysis; Willey: New York, NY, USA, 1990. [Google Scholar]
Figure 1.
Structural diagram of infrastructure REITs in China.

Figure 2.
Conceptual model of the research.

Figure 3.
Expressway Financing Diagram in the REITs Mode.

Figure 4.
Basic Expressway REITs Transaction Structure.

Figure 5.
Degree divergence diagram of nodes of each factor.

Figure 6.
Degree divergence diagram of nodes of each factor.

Figure 7.
Hierarchical structure model.

Figure 8.
Relation diagram of influencing factors in new coordinate origin.

Figure 9.
Ranking of the causation and centrality of factors.


Table 1.
The fuzzy linguistic scale.
| Linguistic Terms | Triangular Fuzzy Numbers |
|---|---|
| No influence | (0, 0, 0.25) |
| Very low influence | (0, 0.25, 0.5) |
| Low influence | (0.25, 0.5, 0.7) |
| High influence | (0.5, 0.75, 1.0) |
| Very high influence | (0.75, 1.0, 1.0) |
Table 2.
Identification Result of Expressway REITs Financing Risks.
| Category | Influential Elements | Code | Brief Explanation |
|---|---|---|---|
| Credit risk R1 | credit risk of the project company | X1 | the project company has a credit default and cannot perform the risk of timely repayment of the loan principal and interest |
| credit risk of the original equity holder | X2 | the original equity holder has a credit default and cannot perform its obligations as a credit enhancement party and a trustee operator as agreed | |
| due diligence risk of the special plan manager | X3 | the manager of the special plan has not fulfilled due diligence in the management process or has not established an internal risk control system yet | |
| Underlying asset risk R2 | future cash flow under-expect risk | X4 | the future market revenue level of the project does not meet the expected value |
| risk of bankruptcy isolation of the underlying assets | X5 | the separation of revenue and franchise rights in the expressway REITs model fails to achieve true bankruptcy isolation | |
| underlying asset operation risk | X6 | the fund manager’s control over the project company’s board of directors and the right to amend the company’s articles of association are restricted | |
| Operational risk R3 | special account risk | X7 | the special plan did not keep separate accounts and independent accounting, resulting in the assets of the special plan not being managed separately from the inherent property of the manager |
| rating risk | X8 | inaccurate rating results due to unreasonable technical or rating methods of rating agencies | |
| legal risk | X9 | the current laws related to REITs are imperfect in China and cause adverse fluctuations in the returns of REITs products | |
| Market risk R4 | interest rate risk | X10 | the income of asset-backed securities holders may be affected by fluctuations in interest rates |
| expressway market risk | X11 | the return level of REITs with expressways as the underlying asset is subject to the risk of changes in the overall supply and demand of the market | |
| price risk | X12 | investors suffer losses due to price trends in the overall market for REITs that are unfavorable to investors | |
| tax risk | X13 | the transfer of assets to the project company is subject to VAT and stamp duty based on the appreciation of the appraised value | |
| Liquidity risk R5 | limited counterparty risk | X14 | with limited counterparties, holders of senior asset-backed securities may consider the inability to sell asset-backed securities at an appropriate price |
| realization risk on disposal of expressway-related interests | X15 | expressway toll rights as pledged assets and the disposal of accounts receivable from advertising operation income are subject to certain uncertainties, which may affect the realization of the expected income of asset-backed securities holders | |
| uncompleted exit risk | X16 | priority asset-backed securities that have applied for open-exit and have been confirmed have not completed exit; none of the original equity holders fulfilled their liquidity support obligations; priority asset-backed securities holders will encounter problems that cannot be withdrawn | |
| Other risk R6 | force majeure risk | X17 | the manager’s delay or failure to perform obligations and the loss of assets of the special plan directly or indirectly caused by circumstances beyond the manager’s control and the environment |
| risk related to public offering | X18 | the regulatory authority may stipulate that all or part of the REITs shares held by the original holders of REITs shares cannot be transferred during the lock-up period | |
| policy risk | X19 | during the period of the special plan, toll revenue of expressway vehicle will be reduced or even lost due to changes in China’s expressway toll policy in the future |
Table 3.
Direct influence matrix A.
| Aij | X1 | X2 | X3 | X4 | X5 | X6 | X7 | X8 | X9 | X10 | X11 | X12 | X13 | X14 | X15 | X16 | X17 | X18 | X19 |
|---|---|---|---|---|---|---|---|---|---|---|---|---|---|---|---|---|---|---|---|
| X1 | 0.00 | 0.14 | 0.32 | 2.18 | 0.27 | 0.77 | 0.18 | 0.23 | 0.18 | 0.09 | 0.27 | 0.41 | 0.27 | 2.23 | 1.32 | 0.23 | 0.00 | 0.18 | 0.09 |
| X2 | 2.09 | 0.00 | 0.23 | 2.14 | 1.23 | 0.64 | 0.09 | 0.36 | 0.14 | 0.09 | 0.64 | 0.50 | 0.23 | 1.27 | 1.14 | 0.32 | 0.00 | 0.73 | 0.05 |
| X3 | 2.18 | 0.32 | 0.00 | 2.23 | 2.73 | 1.23 | 2.82 | 0.18 | 0.09 | 0.27 | 0.77 | 0.64 | 0.32 | 0.64 | 1.09 | 0.82 | 0.00 | 0.14 | 0.23 |
| X4 | 2.86 | 2.32 | 2.73 | 0.00 | 0.41 | 0.32 | 0.50 | 0.18 | 0.05 | 0.23 | 1.18 | 1.23 | 0.64 | 2.14 | 2.68 | 0.41 | 0.00 | 0.68 | 0.18 |
| X5 | 1.82 | 1.59 | 2.82 | 1.50 | 0.00 | 1.73 | 2.23 | 2.18 | 0.23 | 0.36 | 0.77 | 0.77 | 0.45 | 1.23 | 1.32 | 1.36 | 0.00 | 0.77 | 0.36 |
| X6 | 1.68 | 1.86 | 2.27 | 1.82 | 0.73 | 0.00 | 0.32 | 1.14 | 0.18 | 0.32 | 1.73 | 0.82 | 0.41 | 1.14 | 1.32 | 0.36 | 0.00 | 1.09 | 0.14 |
| X7 | 1.09 | 1.27 | 2.82 | 2.18 | 1.14 | 1.23 | 0.00 | 1.18 | 0.23 | 0.36 | 0.77 | 0.41 | 0.14 | 2.23 | 0.64 | 0.41 | 0.00 | 1.18 | 0.32 |
| X8 | 2.86 | 1.14 | 2.14 | 2.59 | 0.23 | 1.18 | 0.64 | 0.00 | 0.41 | 0.27 | 1.36 | 0.82 | 0.00 | 2.18 | 1.23 | 0.32 | 0.00 | 0.77 | 0.05 |
| X9 | 0.45 | 0.32 | 0.64 | 1.68 | 1.50 | 1.86 | 0.91 | 0.09 | 0.00 | 0.18 | 0.59 | 0.59 | 1.23 | 0.23 | 2.05 | 0.41 | 0.18 | 1.14 | 1.36 |
| X10 | 0.32 | 0.18 | 0.41 | 2.23 | 0.23 | 1.18 | 0.77 | 0.18 | 0.18 | 0.00 | 2.59 | 2.14 | 0.68 | 1.50 | 1.68 | 0.32 | 0.05 | 0.41 | 0.18 |
| X11 | 1.32 | 0.77 | 1.32 | 2.14 | 0.86 | 1.36 | 0.23 | 0.09 | 0.00 | 0.45 | 0.00 | 2.41 | 0.55 | 1.41 | 0.82 | 1.27 | 0.00 | 0.59 | 0.00 |
| X12 | 0.18 | 0.14 | 0.32 | 2.59 | 0.59 | 0.73 | 0.36 | 0.14 | 0.00 | 0.23 | 2.05 | 0.00 | 1.14 | 0.91 | 1.27 | 0.14 | 0.00 | 0.32 | 0.00 |
| X13 | 0.41 | 0.18 | 0.59 | 1.32 | 0.41 | 0.32 | 0.27 | 0.00 | 0.14 | 0.32 | 0.77 | 0.91 | 0.00 | 1.18 | 0.77 | 0.36 | 0.23 | 0.64 | 0.23 |
| X14 | 0.36 | 0.23 | 0.23 | 2.27 | 0.36 | 0.77 | 0.68 | 0.18 | 0.00 | 0.00 | 2.59 | 1.32 | 0.09 | 0.00 | 0.41 | 1.23 | 0.00 | 0.45 | 0.09 |
| X15 | 0.77 | 0.32 | 0.41 | 2.27 | 0.36 | 0.45 | 0.00 | 1.50 | 0.00 | 0.64 | 1.18 | 1.41 | 0.00 | 1.36 | 0.00 | 0.41 | 0.00 | 0.27 | 0.14 |
| X16 | 1.27 | 0.91 | 1.14 | 1.86 | 0.41 | 0.68 | 0.45 | 0.77 | 0.14 | 0.23 | 0.64 | 0.64 | 0.50 | 2.59 | 0.59 | 0.00 | 0.00 | 0.55 | 0.09 |
| X17 | 1.50 | 0.82 | 1.18 | 2.05 | 0.59 | 0.68 | 0.32 | 0.64 | 1.32 | 1.18 | 1.82 | 1.09 | 0.00 | 0.32 | 1.41 | 0.23 | 0.00 | 0.68 | 0.27 |
| X18 | 1.86 | 1.41 | 1.77 | 2.50 | 0.27 | 0.91 | 0.14 | 2.14 | 0.09 | 0.14 | 0.32 | 0.32 | 0.18 | 0.45 | 1.14 | 0.59 | 0.41 | 0.00 | 0.14 |
| X19 | 0.18 | 0.09 | 0.23 | 2.32 | 0.55 | 0.86 | 0.00 | 1.00 | 0.55 | 0.36 | 2.59 | 1.77 | 1.14 | 0.41 | 0.32 | 0.00 | 0.55 | 0.45 | 0.00 |
Table 4.
Normalized matrix N.
| Nij | X1 | X2 | X3 | X4 | X5 | X6 | X7 | X8 | X9 | X10 | X11 | X12 | X13 | X14 | X15 | X16 | X17 | X18 | X19 |
|---|---|---|---|---|---|---|---|---|---|---|---|---|---|---|---|---|---|---|---|
| X1 | 0.00 | 0.01 | 0.01 | 0.10 | 0.01 | 0.04 | 0.01 | 0.01 | 0.01 | 0.00 | 0.01 | 0.02 | 0.01 | 0.10 | 0.06 | 0.01 | 0.00 | 0.01 | 0.00 |
| X2 | 0.10 | 0.00 | 0.01 | 0.10 | 0.06 | 0.03 | 0.00 | 0.02 | 0.01 | 0.00 | 0.03 | 0.02 | 0.01 | 0.06 | 0.05 | 0.01 | 0.00 | 0.03 | 0.00 |
| X3 | 0.10 | 0.01 | 0.00 | 0.10 | 0.13 | 0.06 | 0.13 | 0.01 | 0.00 | 0.01 | 0.04 | 0.03 | 0.01 | 0.03 | 0.05 | 0.04 | 0.00 | 0.01 | 0.01 |
| X4 | 0.13 | 0.11 | 0.13 | 0.00 | 0.02 | 0.01 | 0.02 | 0.01 | 0.00 | 0.01 | 0.05 | 0.06 | 0.03 | 0.10 | 0.12 | 0.02 | 0.00 | 0.03 | 0.01 |
| X5 | 0.08 | 0.07 | 0.13 | 0.07 | 0.00 | 0.08 | 0.10 | 0.10 | 0.01 | 0.02 | 0.04 | 0.04 | 0.02 | 0.06 | 0.06 | 0.06 | 0.00 | 0.04 | 0.02 |
| X6 | 0.08 | 0.09 | 0.11 | 0.08 | 0.03 | 0.00 | 0.01 | 0.05 | 0.01 | 0.01 | 0.08 | 0.04 | 0.02 | 0.05 | 0.06 | 0.02 | 0.00 | 0.05 | 0.01 |
| X7 | 0.05 | 0.06 | 0.13 | 0.10 | 0.05 | 0.06 | 0.00 | 0.05 | 0.01 | 0.02 | 0.04 | 0.02 | 0.01 | 0.10 | 0.03 | 0.02 | 0.00 | 0.05 | 0.01 |
| X8 | 0.13 | 0.05 | 0.10 | 0.12 | 0.01 | 0.05 | 0.03 | 0.00 | 0.02 | 0.01 | 0.06 | 0.04 | 0.00 | 0.10 | 0.06 | 0.01 | 0.00 | 0.04 | 0.00 |
| X9 | 0.02 | 0.01 | 0.03 | 0.08 | 0.07 | 0.09 | 0.04 | 0.00 | 0.00 | 0.01 | 0.03 | 0.03 | 0.06 | 0.01 | 0.10 | 0.02 | 0.01 | 0.05 | 0.06 |
| X10 | 0.01 | 0.01 | 0.02 | 0.10 | 0.01 | 0.05 | 0.04 | 0.01 | 0.01 | 0.00 | 0.12 | 0.10 | 0.03 | 0.07 | 0.08 | 0.01 | 0.00 | 0.02 | 0.01 |
| X11 | 0.06 | 0.04 | 0.06 | 0.10 | 0.04 | 0.06 | 0.01 | 0.00 | 0.00 | 0.02 | 0.00 | 0.11 | 0.03 | 0.07 | 0.04 | 0.06 | 0.00 | 0.03 | 0.00 |
| X12 | 0.01 | 0.01 | 0.01 | 0.12 | 0.03 | 0.03 | 0.02 | 0.01 | 0.00 | 0.01 | 0.10 | 0.00 | 0.05 | 0.04 | 0.06 | 0.01 | 0.00 | 0.01 | 0.00 |
| X13 | 0.02 | 0.01 | 0.03 | 0.06 | 0.02 | 0.01 | 0.01 | 0.00 | 0.01 | 0.01 | 0.04 | 0.04 | 0.00 | 0.05 | 0.04 | 0.02 | 0.01 | 0.03 | 0.01 |
| X14 | 0.02 | 0.01 | 0.01 | 0.11 | 0.02 | 0.04 | 0.03 | 0.01 | 0.00 | 0.00 | 0.12 | 0.06 | 0.00 | 0.00 | 0.02 | 0.06 | 0.00 | 0.02 | 0.00 |
| X15 | 0.04 | 0.01 | 0.02 | 0.11 | 0.02 | 0.02 | 0.00 | 0.07 | 0.00 | 0.03 | 0.05 | 0.07 | 0.00 | 0.06 | 0.00 | 0.02 | 0.00 | 0.01 | 0.01 |
| X16 | 0.06 | 0.04 | 0.05 | 0.09 | 0.02 | 0.03 | 0.02 | 0.04 | 0.01 | 0.01 | 0.03 | 0.03 | 0.02 | 0.12 | 0.03 | 0.00 | 0.00 | 0.03 | 0.00 |
| X17 | 0.07 | 0.04 | 0.05 | 0.10 | 0.03 | 0.03 | 0.01 | 0.03 | 0.06 | 0.05 | 0.08 | 0.05 | 0.00 | 0.01 | 0.07 | 0.01 | 0.00 | 0.03 | 0.01 |
| X18 | 0.09 | 0.07 | 0.08 | 0.12 | 0.01 | 0.04 | 0.01 | 0.10 | 0.00 | 0.01 | 0.01 | 0.01 | 0.01 | 0.02 | 0.05 | 0.03 | 0.02 | 0.00 | 0.01 |
| X19 | 0.01 | 0.00 | 0.01 | 0.11 | 0.03 | 0.04 | 0.00 | 0.05 | 0.03 | 0.02 | 0.12 | 0.08 | 0.05 | 0.02 | 0.01 | 0.00 | 0.03 | 0.02 | 0.00 |
Table 5.
Comprehensive impact matrix T.
| Tij | X1 | X2 | X3 | X4 | X5 | X6 | X7 | X8 | X9 | X10 | X11 | X12 | X13 | X14 | X15 | X16 | X17 | X18 | X19 |
|---|---|---|---|---|---|---|---|---|---|---|---|---|---|---|---|---|---|---|---|
| X1 | 0.09 | 0.06 | 0.09 | 0.21 | 0.05 | 0.08 | 0.05 | 0.05 | 0.01 | 0.02 | 0.09 | 0.08 | 0.04 | 0.18 | 0.13 | 0.05 | 0.00 | 0.04 | 0.01 |
| X2 | 0.20 | 0.07 | 0.11 | 0.24 | 0.11 | 0.09 | 0.05 | 0.06 | 0.01 | 0.02 | 0.12 | 0.10 | 0.04 | 0.17 | 0.15 | 0.06 | 0.00 | 0.07 | 0.01 |
| X3 | 0.26 | 0.12 | 0.16 | 0.32 | 0.20 | 0.15 | 0.20 | 0.09 | 0.02 | 0.04 | 0.16 | 0.14 | 0.06 | 0.20 | 0.19 | 0.10 | 0.00 | 0.07 | 0.03 |
| X4 | 0.28 | 0.19 | 0.24 | 0.23 | 0.10 | 0.11 | 0.10 | 0.08 | 0.01 | 0.04 | 0.18 | 0.17 | 0.07 | 0.25 | 0.25 | 0.09 | 0.00 | 0.09 | 0.02 |
| X5 | 0.29 | 0.19 | 0.30 | 0.35 | 0.11 | 0.20 | 0.20 | 0.18 | 0.03 | 0.05 | 0.19 | 0.17 | 0.07 | 0.26 | 0.23 | 0.14 | 0.00 | 0.11 | 0.04 |
| X6 | 0.24 | 0.18 | 0.24 | 0.30 | 0.12 | 0.10 | 0.09 | 0.12 | 0.02 | 0.04 | 0.20 | 0.15 | 0.06 | 0.21 | 0.19 | 0.08 | 0.00 | 0.11 | 0.02 |
| X7 | 0.22 | 0.16 | 0.27 | 0.33 | 0.14 | 0.16 | 0.09 | 0.13 | 0.02 | 0.05 | 0.17 | 0.13 | 0.05 | 0.26 | 0.17 | 0.09 | 0.00 | 0.12 | 0.03 |
| X8 | 0.29 | 0.15 | 0.23 | 0.34 | 0.10 | 0.15 | 0.10 | 0.07 | 0.03 | 0.04 | 0.19 | 0.15 | 0.05 | 0.26 | 0.20 | 0.08 | 0.00 | 0.10 | 0.02 |
| X9 | 0.16 | 0.11 | 0.16 | 0.27 | 0.14 | 0.17 | 0.10 | 0.08 | 0.01 | 0.04 | 0.15 | 0.13 | 0.10 | 0.15 | 0.21 | 0.08 | 0.01 | 0.11 | 0.08 |
| X10 | 0.15 | 0.09 | 0.14 | 0.29 | 0.08 | 0.13 | 0.09 | 0.06 | 0.02 | 0.03 | 0.23 | 0.20 | 0.07 | 0.20 | 0.19 | 0.07 | 0.01 | 0.07 | 0.02 |
| X11 | 0.20 | 0.12 | 0.18 | 0.29 | 0.11 | 0.14 | 0.08 | 0.06 | 0.01 | 0.05 | 0.12 | 0.20 | 0.07 | 0.20 | 0.16 | 0.11 | 0.00 | 0.08 | 0.01 |
| X12 | 0.11 | 0.07 | 0.11 | 0.26 | 0.08 | 0.09 | 0.06 | 0.05 | 0.01 | 0.03 | 0.18 | 0.08 | 0.08 | 0.15 | 0.15 | 0.05 | 0.00 | 0.06 | 0.01 |
| X13 | 0.10 | 0.06 | 0.10 | 0.17 | 0.06 | 0.06 | 0.05 | 0.04 | 0.01 | 0.03 | 0.11 | 0.10 | 0.02 | 0.13 | 0.11 | 0.05 | 0.01 | 0.06 | 0.02 |
| X14 | 0.13 | 0.08 | 0.11 | 0.25 | 0.07 | 0.10 | 0.08 | 0.05 | 0.01 | 0.02 | 0.20 | 0.14 | 0.04 | 0.11 | 0.11 | 0.10 | 0.00 | 0.06 | 0.01 |
| X15 | 0.14 | 0.08 | 0.11 | 0.25 | 0.07 | 0.08 | 0.05 | 0.11 | 0.01 | 0.05 | 0.15 | 0.14 | 0.03 | 0.17 | 0.10 | 0.06 | 0.00 | 0.05 | 0.02 |
| X16 | 0.18 | 0.11 | 0.15 | 0.25 | 0.08 | 0.10 | 0.08 | 0.08 | 0.02 | 0.03 | 0.13 | 0.11 | 0.06 | 0.24 | 0.13 | 0.05 | 0.00 | 0.07 | 0.02 |
| X17 | 0.21 | 0.13 | 0.18 | 0.30 | 0.10 | 0.12 | 0.08 | 0.09 | 0.07 | 0.08 | 0.20 | 0.16 | 0.05 | 0.16 | 0.20 | 0.07 | 0.00 | 0.09 | 0.03 |
| X18 | 0.23 | 0.15 | 0.20 | 0.30 | 0.08 | 0.12 | 0.07 | 0.15 | 0.02 | 0.03 | 0.12 | 0.11 | 0.04 | 0.16 | 0.17 | 0.08 | 0.02 | 0.05 | 0.02 |
| X19 | 0.13 | 0.08 | 0.12 | 0.28 | 0.09 | 0.11 | 0.05 | 0.09 | 0.04 | 0.04 | 0.22 | 0.17 | 0.09 | 0.14 | 0.13 | 0.05 | 0.03 | 0.07 | 0.01 |
Table 6.
Calculation results of causation and centrality.
| Factors | Influence Degree | Influenced Degree | Cause Degree | Centrality Degree | Centrality Ranking |
|---|---|---|---|---|---|
| X1 | 1.34 | 3.62 | −2.28 | 4.96 | 6 |
| X2 | 1.70 | 2.21 | −0.52 | 3.91 | 12 |
| X3 | 2.52 | 3.21 | −0.69 | 5.73 | 2 |
| X4 | 2.51 | 5.25 | −2.75 | 7.76 | 1 |
| X5 | 3.13 | 1.89 | 1.24 | 5.02 | 5 |
| X6 | 2.47 | 2.29 | 0.19 | 4.76 | 8 |
| X7 | 2.60 | 1.66 | 0.94 | 4.26 | 9 |
| X8 | 2.56 | 1.63 | 0.93 | 4.19 | 11 |
| X9 | 2.26 | 0.39 | 1.88 | 2.65 | 16 |
| X10 | 2.16 | 0.75 | 1.41 | 2.91 | 15 |
| X11 | 2.20 | 3.11 | −0.92 | 5.31 | 3 |
| X12 | 1.62 | 2.63 | −1.01 | 4.25 | 10 |
| X13 | 1.30 | 1.09 | 0.21 | 2.39 | 19 |
| X14 | 1.67 | 3.63 | −1.96 | 5.30 | 4 |
| X15 | 1.68 | 3.15 | −1.48 | 4.83 | 7 |
| X16 | 1.90 | 1.48 | 0.42 | 3.38 | 14 |
| X17 | 2.34 | 0.12 | 2.21 | 2.46 | 17 |
| X18 | 2.15 | 1.50 | 0.65 | 3.65 | 13 |
| X19 | 1.96 | 0.45 | 1.51 | 2.41 | 18 |
Table 7.
Overall influence matrix.
| Hij | X1 | X2 | X3 | X4 | X5 | X6 | X7 | X8 | X9 | X10 | X11 | X12 | X13 | X14 | X15 | X16 | X17 | X18 | X19 |
|---|---|---|---|---|---|---|---|---|---|---|---|---|---|---|---|---|---|---|---|
| X1 | 1.09 | 0.06 | 0.09 | 0.21 | 0.05 | 0.08 | 0.05 | 0.05 | 0.01 | 0.02 | 0.09 | 0.08 | 0.04 | 0.18 | 0.13 | 0.05 | 0.00 | 0.04 | 0.01 |
| X2 | 0.20 | 1.07 | 0.11 | 0.24 | 0.11 | 0.09 | 0.05 | 0.06 | 0.01 | 0.02 | 0.12 | 0.10 | 0.04 | 0.17 | 0.15 | 0.06 | 0.00 | 0.07 | 0.01 |
| X3 | 0.26 | 0.12 | 1.16 | 0.32 | 0.20 | 0.15 | 0.20 | 0.09 | 0.02 | 0.04 | 0.16 | 0.14 | 0.06 | 0.20 | 0.19 | 0.10 | 0.00 | 0.07 | 0.03 |
| X4 | 0.28 | 0.19 | 0.24 | 1.23 | 0.10 | 0.11 | 0.10 | 0.08 | 0.01 | 0.04 | 0.18 | 0.17 | 0.07 | 0.25 | 0.25 | 0.09 | 0.00 | 0.09 | 0.02 |
| X5 | 0.29 | 0.19 | 0.30 | 0.35 | 1.11 | 0.20 | 0.20 | 0.18 | 0.03 | 0.05 | 0.19 | 0.17 | 0.07 | 0.26 | 0.23 | 0.14 | 0.00 | 0.11 | 0.04 |
| X6 | 0.24 | 0.18 | 0.24 | 0.30 | 0.12 | 1.10 | 0.09 | 0.12 | 0.02 | 0.04 | 0.20 | 0.15 | 0.06 | 0.21 | 0.19 | 0.08 | 0.00 | 0.11 | 0.02 |
| X7 | 0.22 | 0.16 | 0.27 | 0.33 | 0.14 | 0.16 | 1.09 | 0.13 | 0.02 | 0.05 | 0.17 | 0.13 | 0.05 | 0.26 | 0.17 | 0.09 | 0.00 | 0.12 | 0.03 |
| X8 | 0.29 | 0.15 | 0.23 | 0.34 | 0.10 | 0.15 | 0.10 | 1.07 | 0.03 | 0.04 | 0.19 | 0.15 | 0.05 | 0.26 | 0.20 | 0.08 | 0.00 | 0.10 | 0.02 |
| X9 | 0.16 | 0.11 | 0.16 | 0.27 | 0.14 | 0.17 | 0.10 | 0.08 | 1.01 | 0.04 | 0.15 | 0.13 | 0.10 | 0.15 | 0.21 | 0.08 | 0.01 | 0.11 | 0.08 |
| X10 | 0.15 | 0.09 | 0.14 | 0.29 | 0.08 | 0.13 | 0.09 | 0.06 | 0.02 | 1.03 | 0.23 | 0.20 | 0.07 | 0.20 | 0.19 | 0.07 | 0.01 | 0.07 | 0.02 |
| X11 | 0.20 | 0.12 | 0.18 | 0.29 | 0.11 | 0.14 | 0.08 | 0.06 | 0.01 | 0.05 | 1.12 | 0.20 | 0.07 | 0.20 | 0.16 | 0.11 | 0.00 | 0.08 | 0.01 |
| X12 | 0.11 | 0.07 | 0.11 | 0.26 | 0.08 | 0.09 | 0.06 | 0.05 | 0.01 | 0.03 | 0.18 | 1.08 | 0.08 | 0.15 | 0.15 | 0.05 | 0.00 | 0.06 | 0.01 |
| X13 | 0.10 | 0.06 | 0.10 | 0.17 | 0.06 | 0.06 | 0.05 | 0.04 | 0.01 | 0.03 | 0.11 | 0.10 | 1.02 | 0.13 | 0.11 | 0.05 | 0.01 | 0.06 | 0.02 |
| X14 | 0.13 | 0.08 | 0.11 | 0.25 | 0.07 | 0.10 | 0.08 | 0.05 | 0.01 | 0.02 | 0.20 | 0.14 | 0.04 | 1.11 | 0.11 | 0.10 | 0.00 | 0.06 | 0.01 |
| X15 | 0.14 | 0.08 | 0.11 | 0.25 | 0.07 | 0.08 | 0.05 | 0.11 | 0.01 | 0.05 | 0.15 | 0.14 | 0.03 | 0.17 | 1.10 | 0.06 | 0.00 | 0.05 | 0.02 |
| X16 | 0.18 | 0.11 | 0.15 | 0.25 | 0.08 | 0.10 | 0.08 | 0.08 | 0.02 | 0.03 | 0.13 | 0.11 | 0.06 | 0.24 | 0.13 | 1.05 | 0.00 | 0.07 | 0.02 |
| X17 | 0.21 | 0.13 | 0.18 | 0.30 | 0.10 | 0.12 | 0.08 | 0.09 | 0.07 | 0.08 | 0.20 | 0.16 | 0.05 | 0.16 | 0.20 | 0.07 | 1.00 | 0.09 | 0.03 |
| X18 | 0.23 | 0.15 | 0.20 | 0.30 | 0.08 | 0.12 | 0.07 | 0.15 | 0.02 | 0.03 | 0.12 | 0.11 | 0.04 | 0.16 | 0.17 | 0.08 | 0.02 | 1.05 | 0.02 |
| X19 | 0.13 | 0.08 | 0.12 | 0.28 | 0.09 | 0.11 | 0.05 | 0.09 | 0.04 | 0.04 | 0.22 | 0.17 | 0.09 | 0.14 | 0.13 | 0.05 | 0.03 | 0.07 | 1.01 |
Table 8.
Node degrees of each factor corresponding to different thresholds.
| Factors | λ = 0.10 | λ = 0.15 | λ = 0.20 | λ = 0.25 |
|---|---|---|---|---|
| X1 | 22 | 16 | 12 | 6 |
| X2 | 20 | 8 | 4 | 2 |
| X3 | 29 | 20 | 12 | 6 |
| X4 | 29 | 27 | 23 | 18 |
| X5 | 22 | 13 | 8 | 6 |
| X6 | 25 | 14 | 7 | 3 |
| X7 | 18 | 12 | 7 | 5 |
| X8 | 17 | 11 | 6 | 5 |
| X9 | 14 | 8 | 4 | 3 |
| X10 | 19 | 7 | 6 | 3 |
| X11 | 29 | 19 | 10 | 3 |
| X12 | 24 | 11 | 5 | 3 |
| X13 | 7 | 3 | 2 | 2 |
| X14 | 27 | 19 | 11 | 6 |
| X15 | 27 | 15 | 6 | 3 |
| X16 | 15 | 6 | 4 | 3 |
| X17 | 12 | 9 | 5 | 3 |
| X18 | 16 | 8 | 5 | 3 |
| X19 | 10 | 5 | 4 | 3 |
Table 9.
Reachable matrix S.
| Sij | X1 | X2 | X3 | X4 | X5 | X6 | X7 | X8 | X9 | X10 | X11 | X12 | X13 | X14 | X15 | X16 | X17 | X18 | X19 |
|---|---|---|---|---|---|---|---|---|---|---|---|---|---|---|---|---|---|---|---|
| X1 | 1 | 0 | 0 | 1 | 0 | 0 | 0 | 0 | 0 | 0 | 0 | 0 | 0 | 1 | 0 | 0 | 0 | 0 | 0 |
| X2 | 1 | 1 | 0 | 1 | 0 | 0 | 0 | 0 | 0 | 0 | 0 | 0 | 0 | 1 | 0 | 0 | 0 | 0 | 0 |
| X3 | 1 | 0 | 1 | 1 | 1 | 1 | 1 | 0 | 0 | 0 | 1 | 0 | 0 | 1 | 1 | 0 | 0 | 0 | 0 |
| X4 | 1 | 1 | 1 | 1 | 0 | 0 | 0 | 0 | 0 | 0 | 1 | 1 | 0 | 1 | 1 | 0 | 0 | 0 | 0 |
| X5 | 1 | 1 | 1 | 1 | 1 | 1 | 1 | 1 | 0 | 0 | 1 | 1 | 0 | 1 | 1 | 0 | 0 | 0 | 0 |
| X6 | 1 | 1 | 1 | 1 | 0 | 1 | 0 | 0 | 0 | 0 | 1 | 0 | 0 | 1 | 1 | 0 | 0 | 0 | 0 |
| X7 | 1 | 1 | 1 | 1 | 0 | 1 | 1 | 0 | 0 | 0 | 1 | 0 | 0 | 1 | 1 | 0 | 0 | 0 | 0 |
| X8 | 1 | 0 | 1 | 1 | 0 | 0 | 0 | 1 | 0 | 0 | 1 | 1 | 0 | 1 | 1 | 0 | 0 | 0 | 0 |
| X9 | 1 | 0 | 1 | 1 | 0 | 1 | 0 | 0 | 1 | 0 | 0 | 0 | 0 | 1 | 1 | 0 | 0 | 0 | 0 |
| X10 | 0 | 0 | 0 | 1 | 0 | 0 | 0 | 0 | 0 | 1 | 1 | 1 | 0 | 1 | 1 | 0 | 0 | 0 | 0 |
| X11 | 1 | 0 | 1 | 1 | 0 | 0 | 0 | 0 | 0 | 0 | 1 | 1 | 0 | 1 | 1 | 0 | 0 | 0 | 0 |
| X12 | 0 | 0 | 0 | 1 | 0 | 0 | 0 | 0 | 0 | 0 | 1 | 1 | 0 | 0 | 0 | 0 | 0 | 0 | 0 |
| X13 | 0 | 0 | 0 | 1 | 0 | 0 | 0 | 0 | 0 | 0 | 0 | 0 | 1 | 0 | 0 | 0 | 0 | 0 | 0 |
| X14 | 0 | 0 | 0 | 1 | 0 | 0 | 0 | 0 | 0 | 0 | 1 | 0 | 0 | 1 | 0 | 0 | 0 | 0 | 0 |
| X15 | 0 | 0 | 0 | 1 | 0 | 0 | 0 | 0 | 0 | 0 | 0 | 0 | 0 | 1 | 1 | 0 | 0 | 0 | 0 |
| X16 | 1 | 0 | 1 | 1 | 0 | 0 | 0 | 0 | 0 | 0 | 0 | 0 | 0 | 1 | 0 | 1 | 0 | 0 | 0 |
| X17 | 1 | 0 | 1 | 1 | 0 | 0 | 0 | 0 | 0 | 0 | 1 | 1 | 0 | 1 | 1 | 0 | 1 | 0 | 0 |
| X18 | 1 | 0 | 1 | 1 | 0 | 0 | 0 | 1 | 0 | 0 | 0 | 0 | 0 | 1 | 1 | 0 | 0 | 1 | 0 |
| X19 | 0 | 0 | 0 | 1 | 0 | 0 | 0 | 0 | 0 | 0 | 1 | 1 | 0 | 0 | 0 | 0 | 0 | 0 | 1 |
Table 10.
The reachable set and antecedent set of the factor.
| Xi | R(Xi) | A(Xi) | R(Xi) ∩ A(Xi) |
|---|---|---|---|
| X1 | 1, 4, 14 | 1, 2, 3, 4, 5, 6, 7, 8, 9, 11, 16, 17, 18 | 1, 4 |
| X2 | 1, 2, 4, 14 | 2, 4, 5, 6 | 2, 4 |
| X3 | 1, 3, 4, 5, 6, 7, 11, 14, 15 | 3, 4, 5, 6, 7, 8, 9, 11, 16, 17, 18 | 3, 4, 5, 6, 7, 11 |
| X4 | 1, 2, 3, 4, 11, 12, 14, 15 | 1, 2, 3, 4, 5, 6, 7, 8, 9, 10, 11, 12, 13, 14, 15, 16, 17, 18, 19 | 1, 2, 3, 4, 11, 12, 14, 15 |
| X5 | 1, 2, 3, 4, 5, 6, 7, 8, 11, 12, 14, 15 | 5 | 5 |
| X6 | 1, 2, 3, 4, 6, 11, 14, 15 | 3, 5, 6, 7, 9 | 3, 6 |
| X7 | 1, 2, 3, 4, 6, 7, 11, 14, 15 | 3, 7 | 3, 7 |
| X8 | 1, 3, 4, 8, 11, 12, 14, 15 | 5, 8, 18 | 8 |
| X9 | 1, 3, 4, 6, 9, 14, 15 | 9 | 9 |
| X10 | 4, 10, 11, 12, 14, 15 | 10 | 10 |
| X11 | 1, 3, 4, 11, 12, 14, 15 | 3, 4, 5, 6, 7, 8, 10, 11, 12, 14, 17, 19 | 3, 4, 11, 12, 14 |
| X12 | 4, 11, 12 | 4, 5, 8, 10, 11, 12, 17, 19 | 4, 11, 12 |
| X13 | 4, 13 | 13 | 13 |
| X14 | 4, 11, 14 | 1, 2, 3, 4, 5, 6, 7, 8, 9, 10, 11, 14, 15, 16, 17, 18 | 4, 11, 14 |
| X15 | 4, 14, 15 | 3, 4, 5, 6, 7, 8, 9, 10, 11, 15, 17, 18 | 4, 15 |
| X16 | 1, 3, 4, 14, 16 | 16 | 16 |
| X17 | 1, 3, 4, 11, 12, 14, 15, 17 | 17 | 17 |
| X18 | 1, 3, 4, 8, 14, 15, 18 | 18 | 18 |
| X19 | 4, 11, 12, 19 | 19 | 19 |
Publisher’s Note: MDPI stays neutral with regard to jurisdictional claims in published maps and institutional affiliations. |
© 2022 by the authors. Licensee MDPI, Basel, Switzerland. This article is an open access article distributed under the terms and conditions of the Creative Commons Attribution (CC BY) license (https://creativecommons.org/licenses/by/4.0/).
Share and Cite
MDPI and ACS Style
Song, Y.; Hao, S. Research on Financing Risk Factors of Expressway REITs in China with a Hybrid Approach. Systems 2022, 10, 38. https://0-doi-org.brum.beds.ac.uk/10.3390/systems10020038
AMA Style
Song Y, Hao S. Research on Financing Risk Factors of Expressway REITs in China with a Hybrid Approach. Systems. 2022; 10(2):38. https://0-doi-org.brum.beds.ac.uk/10.3390/systems10020038
Chicago/Turabian StyleSong, Yimeng, and Shengyue Hao. 2022. "Research on Financing Risk Factors of Expressway REITs in China with a Hybrid Approach" Systems 10, no. 2: 38. https://0-doi-org.brum.beds.ac.uk/10.3390/systems10020038
Note that from the first issue of 2016, this journal uses article numbers instead of page numbers. See further details here.