
Distinctions Organize Information in Mind and Nature: Empirical Findings of Identity–Other Distinctions (D) in Cognitive and Material Complexity


Abstract
:1. Introduction
1.1. Empirical Findings of Distinctions across the Disciplines
- Kolata (1984) [4] shows that infants can distinguish their mother’s voices as soon as they are born, indicating that fetuses make distinctions in utero;
- Aubin and Jouventin’s (1998) [9] research the cocktail party effect in King Penguin colonies, showing that chicks only distinguish and react to their parent’s calls and vice versa;
- Quinn et al.’s 1997 study [6] shows that, from an early age, the human brain distinguishes between different patterns and shapes, even if the two shapes overlap;
- Gautheir and Tarr’s 1997 study [8], using computer-generated ‘Greebles’, demonstrated that the more exposure one has to fine-tuned and novel distinctions, the better they will be at recognizing them;
- Pradel et al.’s 2007 study [16] shows that nematodes distinguish their environments to avoid dangerous pathogens; and
- Langer et al.’s 1985 research [30] shows that the identity–other distinctions one makes can lead to long-term marginalization of the “other” and also that awareness of the identity–other structure of distinctions can dampen our marginalizing tendencies.
1.2. Theoretical Work on Distinctions
- The existence of distinctions (i.e., D as a noun);
- The act of distinction making (i.e., D as a verb); and
- That the relationship (i.e. is/is not) between identity and other is elemental in both (1) and (2) above.
Boundaries Are a Subset of Distinctions
- All boundary judgments are subsets of identity–other distinctions;
- All externalities identified by boundary judgements are subsets of other; and
- All distinctions have an identity–other structure.
1.3. Research Questions
- Existential (basic research): focused on the questions: “Does DSRP exist? Does DSRP exist as universal, material, observable phenomena?”
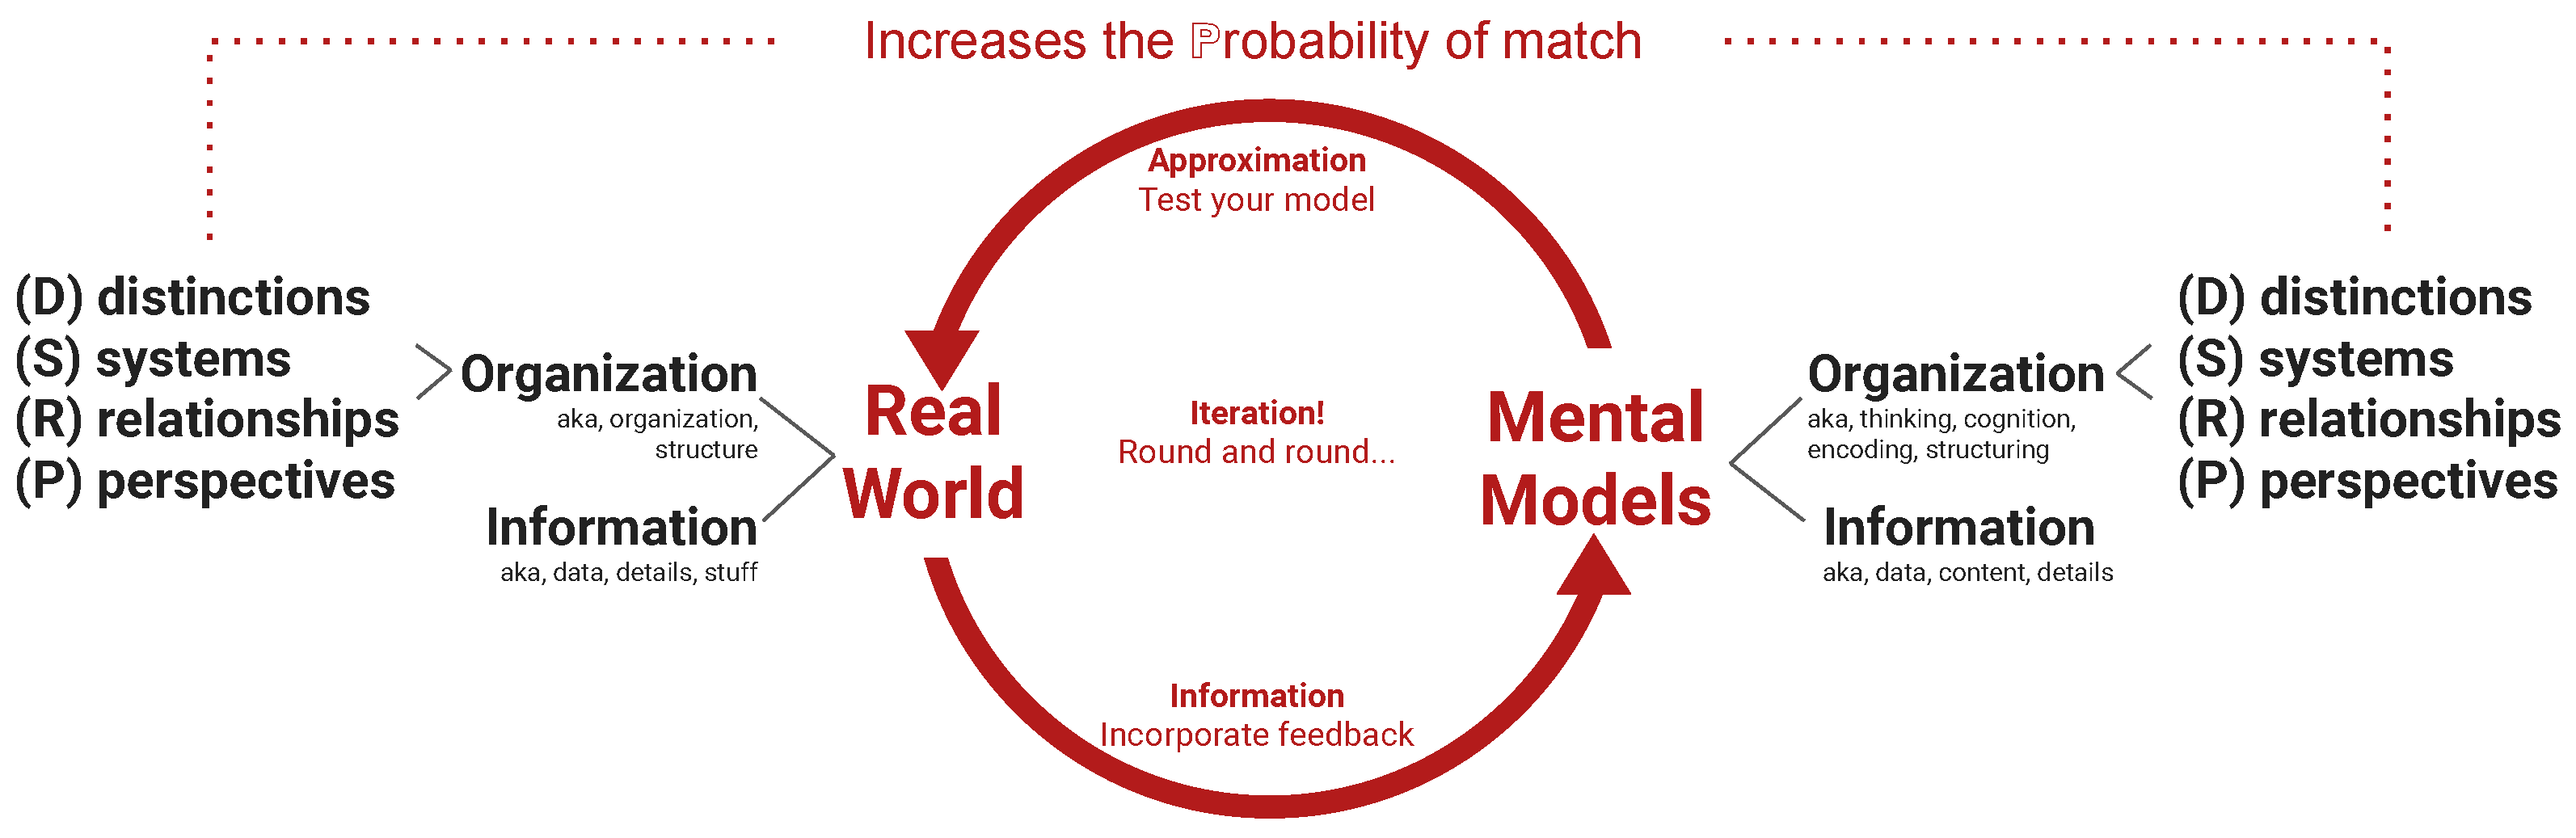
- Efficacy (applied research): focused on the questions: “Is DSRP effective? Does metacognition of DSRP increase effectiveness in navigating cognitive complexity in order to understand system (ontological) complexity?” This gets at the critically important issue of ‘parallelism’—defined as the probability that our cognitive organizational rules align with nature’s organizational rules—which is central to the idea of the systems thinking/DSRP loop [75]2 (Figure 7).
- Does the D-rule exist in mind and nature (in the same way evolution or heliocentrism exist)?
- Does awareness (metacognition) of the D-rule increase effectiveness in systems thinking or cognitive complexity, fluidity, etc.?
2. Materials and Methods
2.1. The Orange Polyhedra Study Methods
2.2. The Rorschach Study Methods
2.3. The Dog–Tree–Burger Study Methods
2.4. The What Is a Shape? Study Methods
2.5. The D-Mapping Study Methods
2.6. The D-STMI Study Methods
2.7. The D-Fishtank Study Methods
3. Results
3.1. The Orange Polyhedra Study
 on a white background. There were two task sets, A—object and B—whitespace, and two conditions, 1—identity and 2—other. A1 asked subjects to click on the ‘object’ and name it. A2 asked subjects to click on the ‘not-object’ and name it. B1 asked subjects to click on the ‘whitespace’ and name it. B2 asked subjects to click on the ‘not-whitespace’ and name it. Table 5 shows the underlying theoretical structure of the clicking and naming tasks.
- 82% of the subjects (307/374) named the polyhedra as either a ‘cube’, ‘box’, or ‘square’;
- 8.28% of the subjects (31/374) named the polyhedra as another polyhedra other than a cube. For example, a ‘quadrilateral’, ‘diamond’, or ‘trapezoid’;
- 6.68% of the subjects (25/374) named the polyhedra as the part they clicked on. For example, ‘face’, ‘edge’, or ‘corner’;
- 2.94% of the subjects (11/374) provided ‘other’ names that could not be interpreted, such as ‘Jim’ (perhaps literally giving the object a name) or ‘roof’ and ‘heat lamp’ (perhaps naming the object as something it looked similar to).
- 52.13% or 195 of 374 correctly clicked somewhere other than the orange object (a.k.a., the Not-object) as instructed;
- 52.60% of the subjects (197/374) named the ‘not-object’ (i.e., the background) as instructed.
- -
- Of those: 49.74% (98/197) named it ‘background’, ‘space’, ‘screen’, or other like-terms; 25.38% (50/197) named it ‘not-object’; and
- -
- 21.82% (43/197) named it ‘nothing’, ‘none’, or ‘blank’, and 3.04% (6/197) gave ‘other’ names that could not be interpreted, such as ‘desk’ or ‘unknown’.
- A total of 47.86% or 179 of 374 subjects incorrectly clicked on the object instead of the background space in the image and named it as follows:
- 43.85% of the subjects (164/374) named the ‘object’ (i.e., the orange polyhedra);
- -
- Of those: 85.36% (140/164) named the object ‘cube’, ‘square’, ‘box’, or like-terms; and
- -
- 14.63% (24/164) gave ‘other’ names that could not be interpreted, such as ‘hex’ or ‘corona’.
- A total of 83.42% (312/374) clicked on the whitespace as instructed and named it as follows:
- -
- 82.46% (254/308) named it ‘whitespace’, ‘background’, ‘space’, or other like-terms;
- -
- 10.38% (32/308) named it ‘nothing’, or ‘blank’; and
- -
- 7.14% (22/308) gave ‘other’ names that could not be interpreted such as ‘Susan’ or ‘ghost’.
- A total of 16.57% or 62 of 374 subjects incorrectly clicked on the object and named it as follows:.
- -
- 17.64% of the subjects (66/374) named the ‘object’ (i.e., the orange polyhedra).
- *
- Of those: 57.57% (38/66) named the object ‘cube’, ‘square’, ‘box’, or like-terms; 25.75% (17/66) gave ‘other’ names that could not be interpreted, such as ‘excellent’ or ‘objection’;
- *
- 2.94% of all subjects (11/374) did not provide names for their clicks.
- A total of 89.57% or 335 of 374 clicked on the not-whitespace (a.k.a., the object);
- 87.96% of the subjects (329/374) named the ‘non-whitespace’ (i.e., the orange polyhedra as instructed) as follows:
- -
- 77.50% (255/329) named it ‘square’, ‘cube’, ‘box’, or other like-terms;
- -
- 11.55% (38/329) named it ‘non-whitespace’; and
- -
- 10.94% (36/329) gave ‘other’ names that could not be interpreted, such as ‘bubba’ or ‘pole’.
- A total of 10.43% or 39 of 374 subjects incorrectly clicked on the ´whitespace´;
- 8.55% of the subjects (32/374) named the ‘whitespace’ (i.e., the background).
- -
- Of those who named it: 46.87% (15/32) named the object ‘background’, ‘space’, or like-terms;
- -
- 31.25% (10/32) named the object ‘nothing’, or ‘blank’; and
- -
- 21.87% (7/32) gave ‘other’ names that could not be interpreted such as ‘grinch’ or ‘ski’.
- A total of 3.47% (13/374) did not provide a name for their click.
- -
- This suggests that those who incorrectly clicked did so in error as they completed the task by naming what they clicked on correctly.
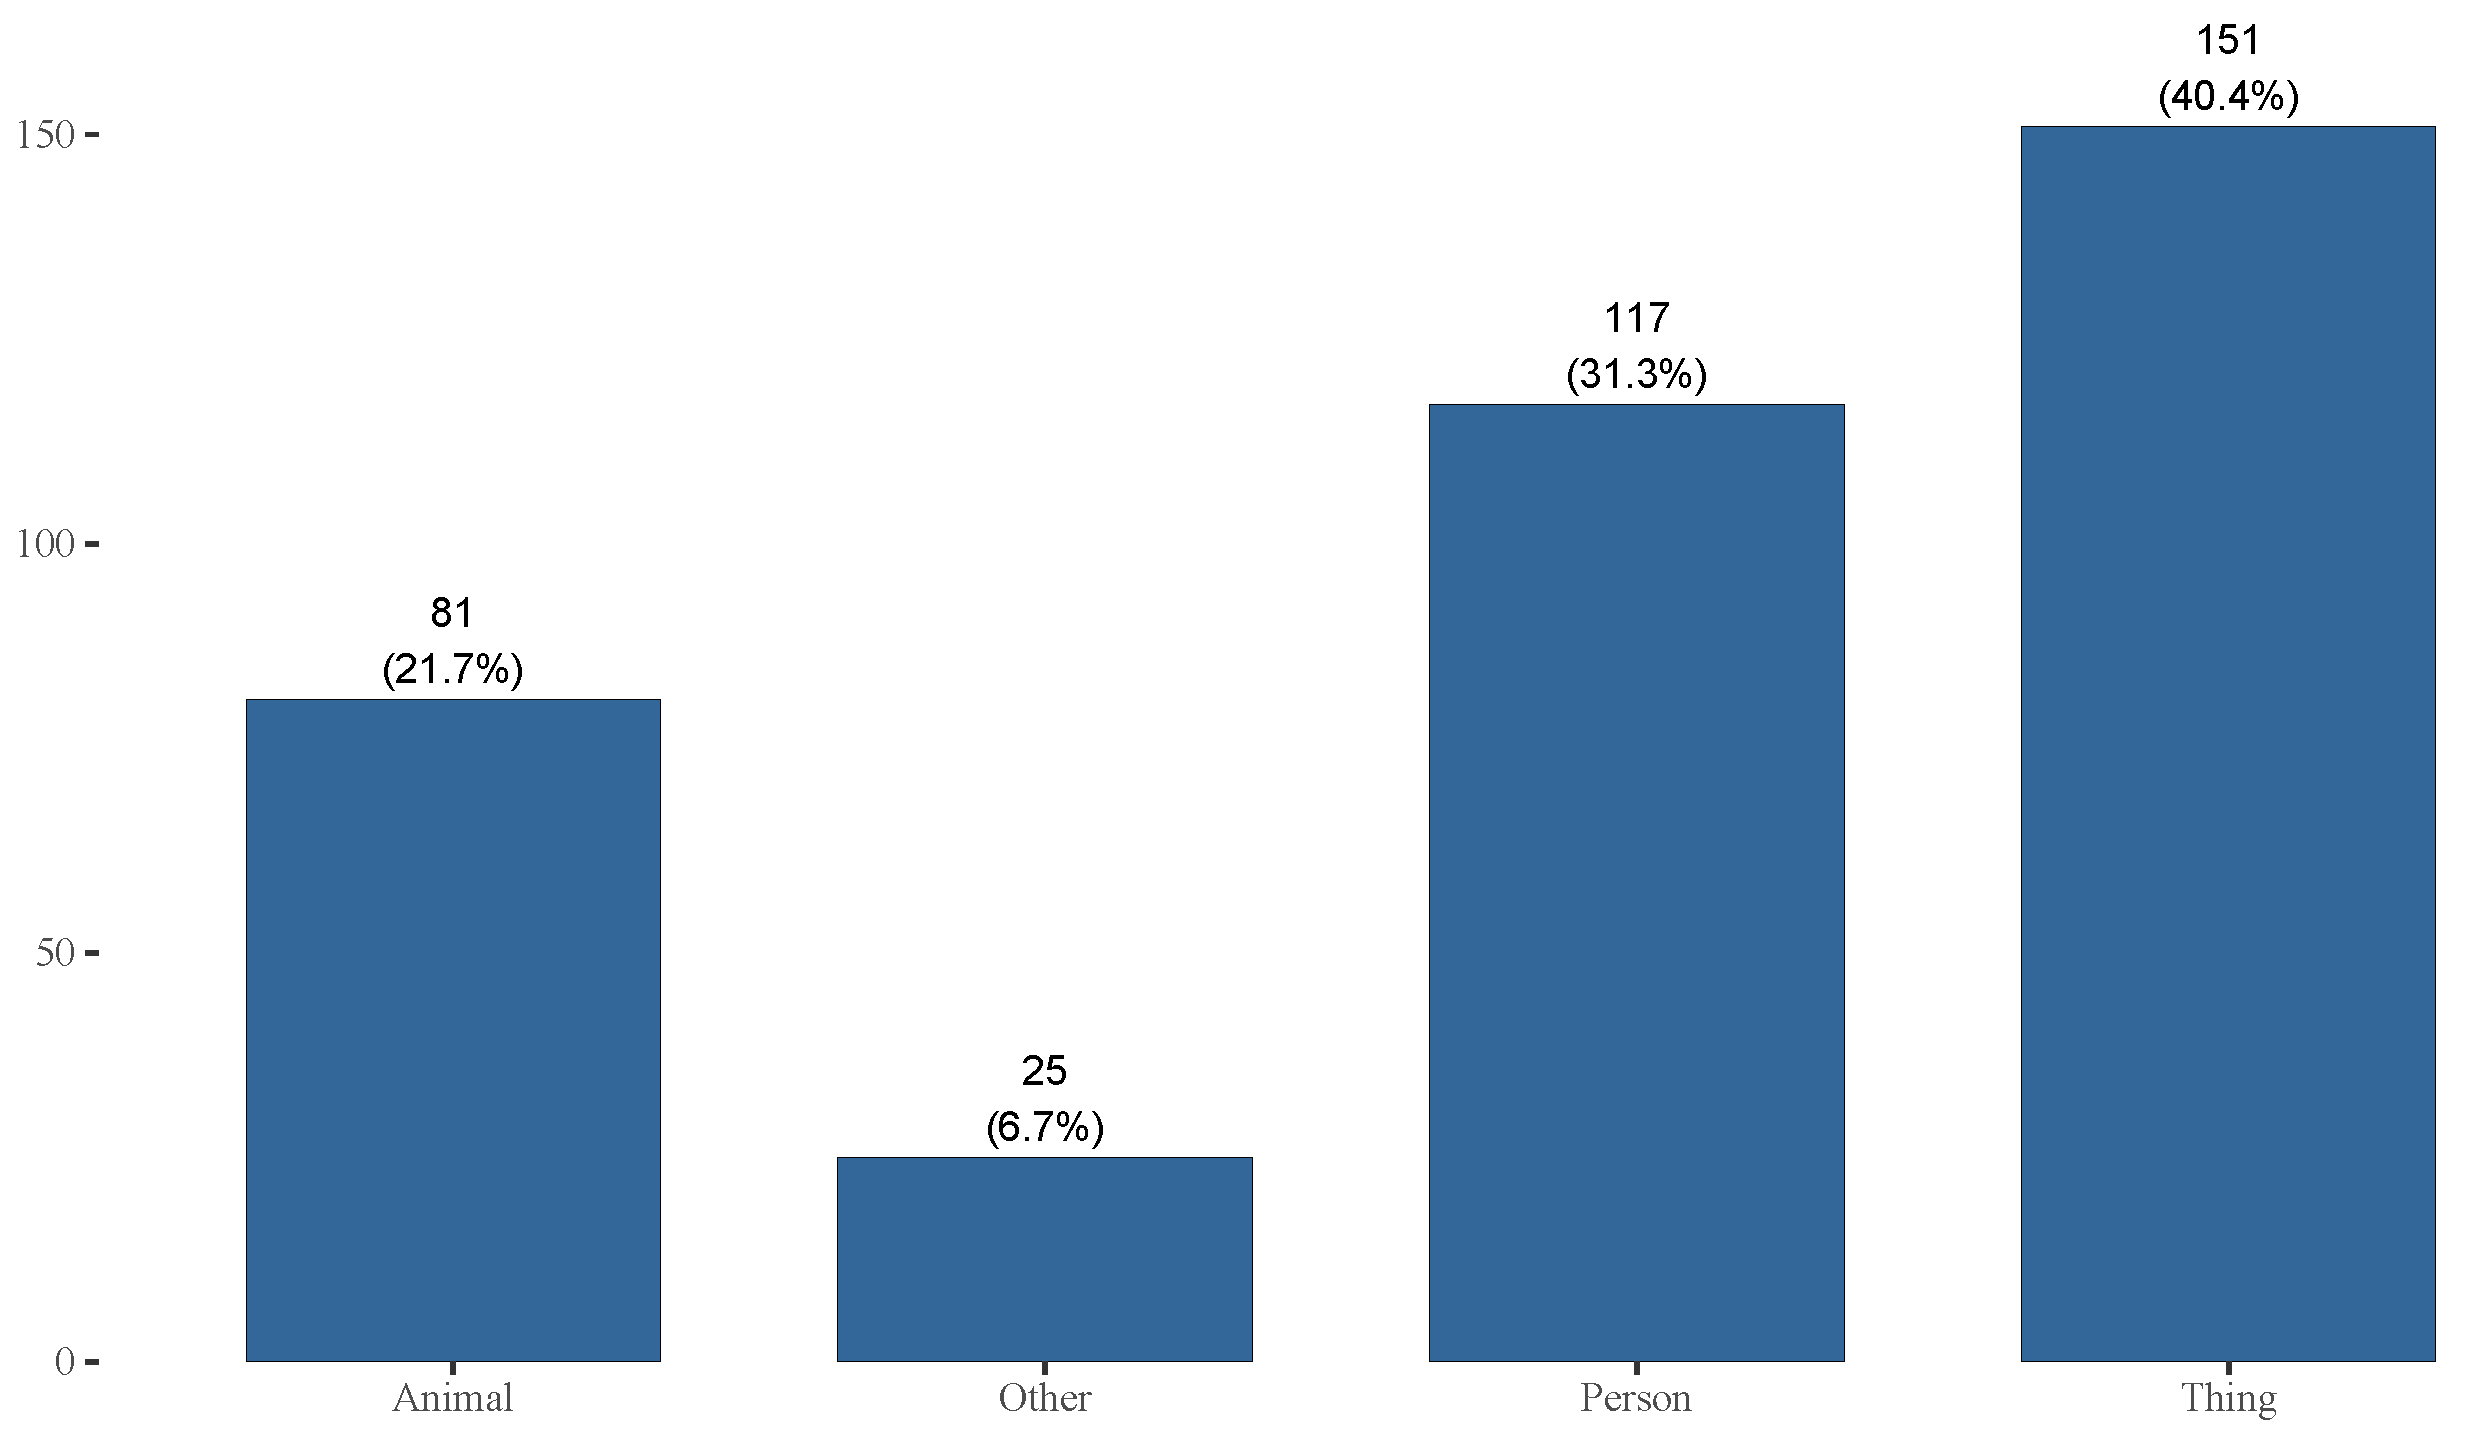
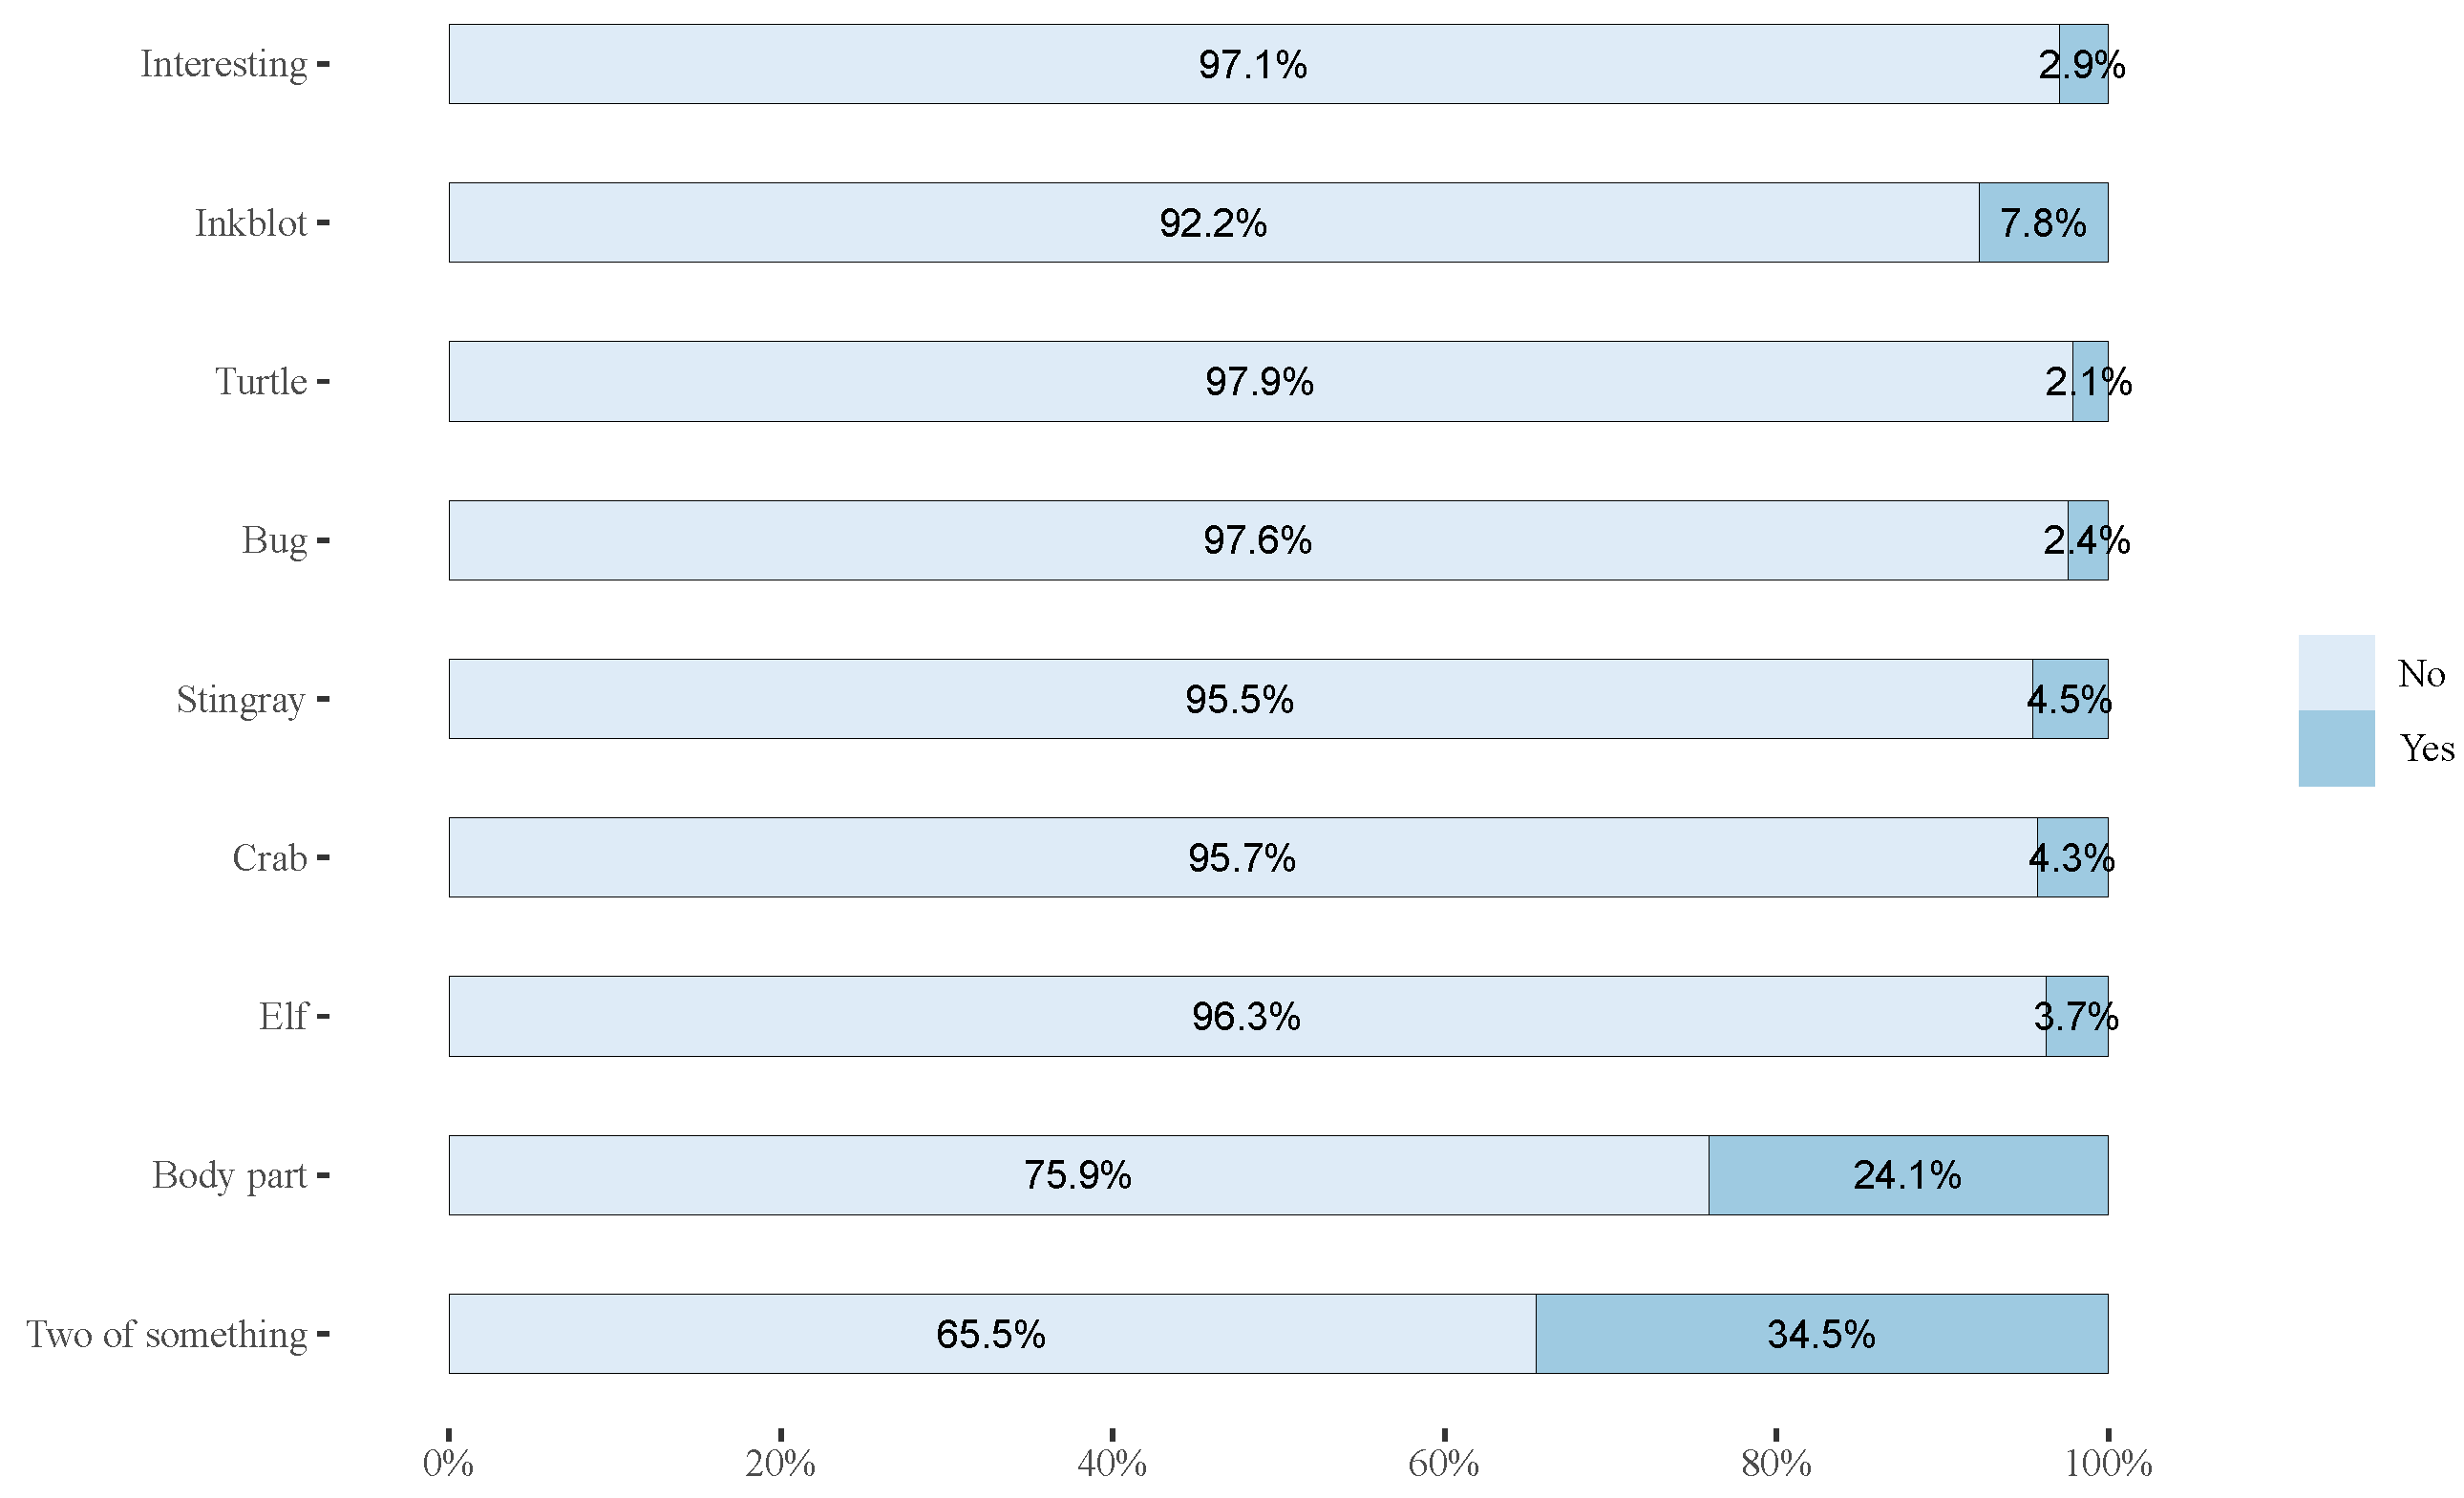
3.2. The Inkblot Study
 shown in Figure 10 and then asked, “Describe what you see”.
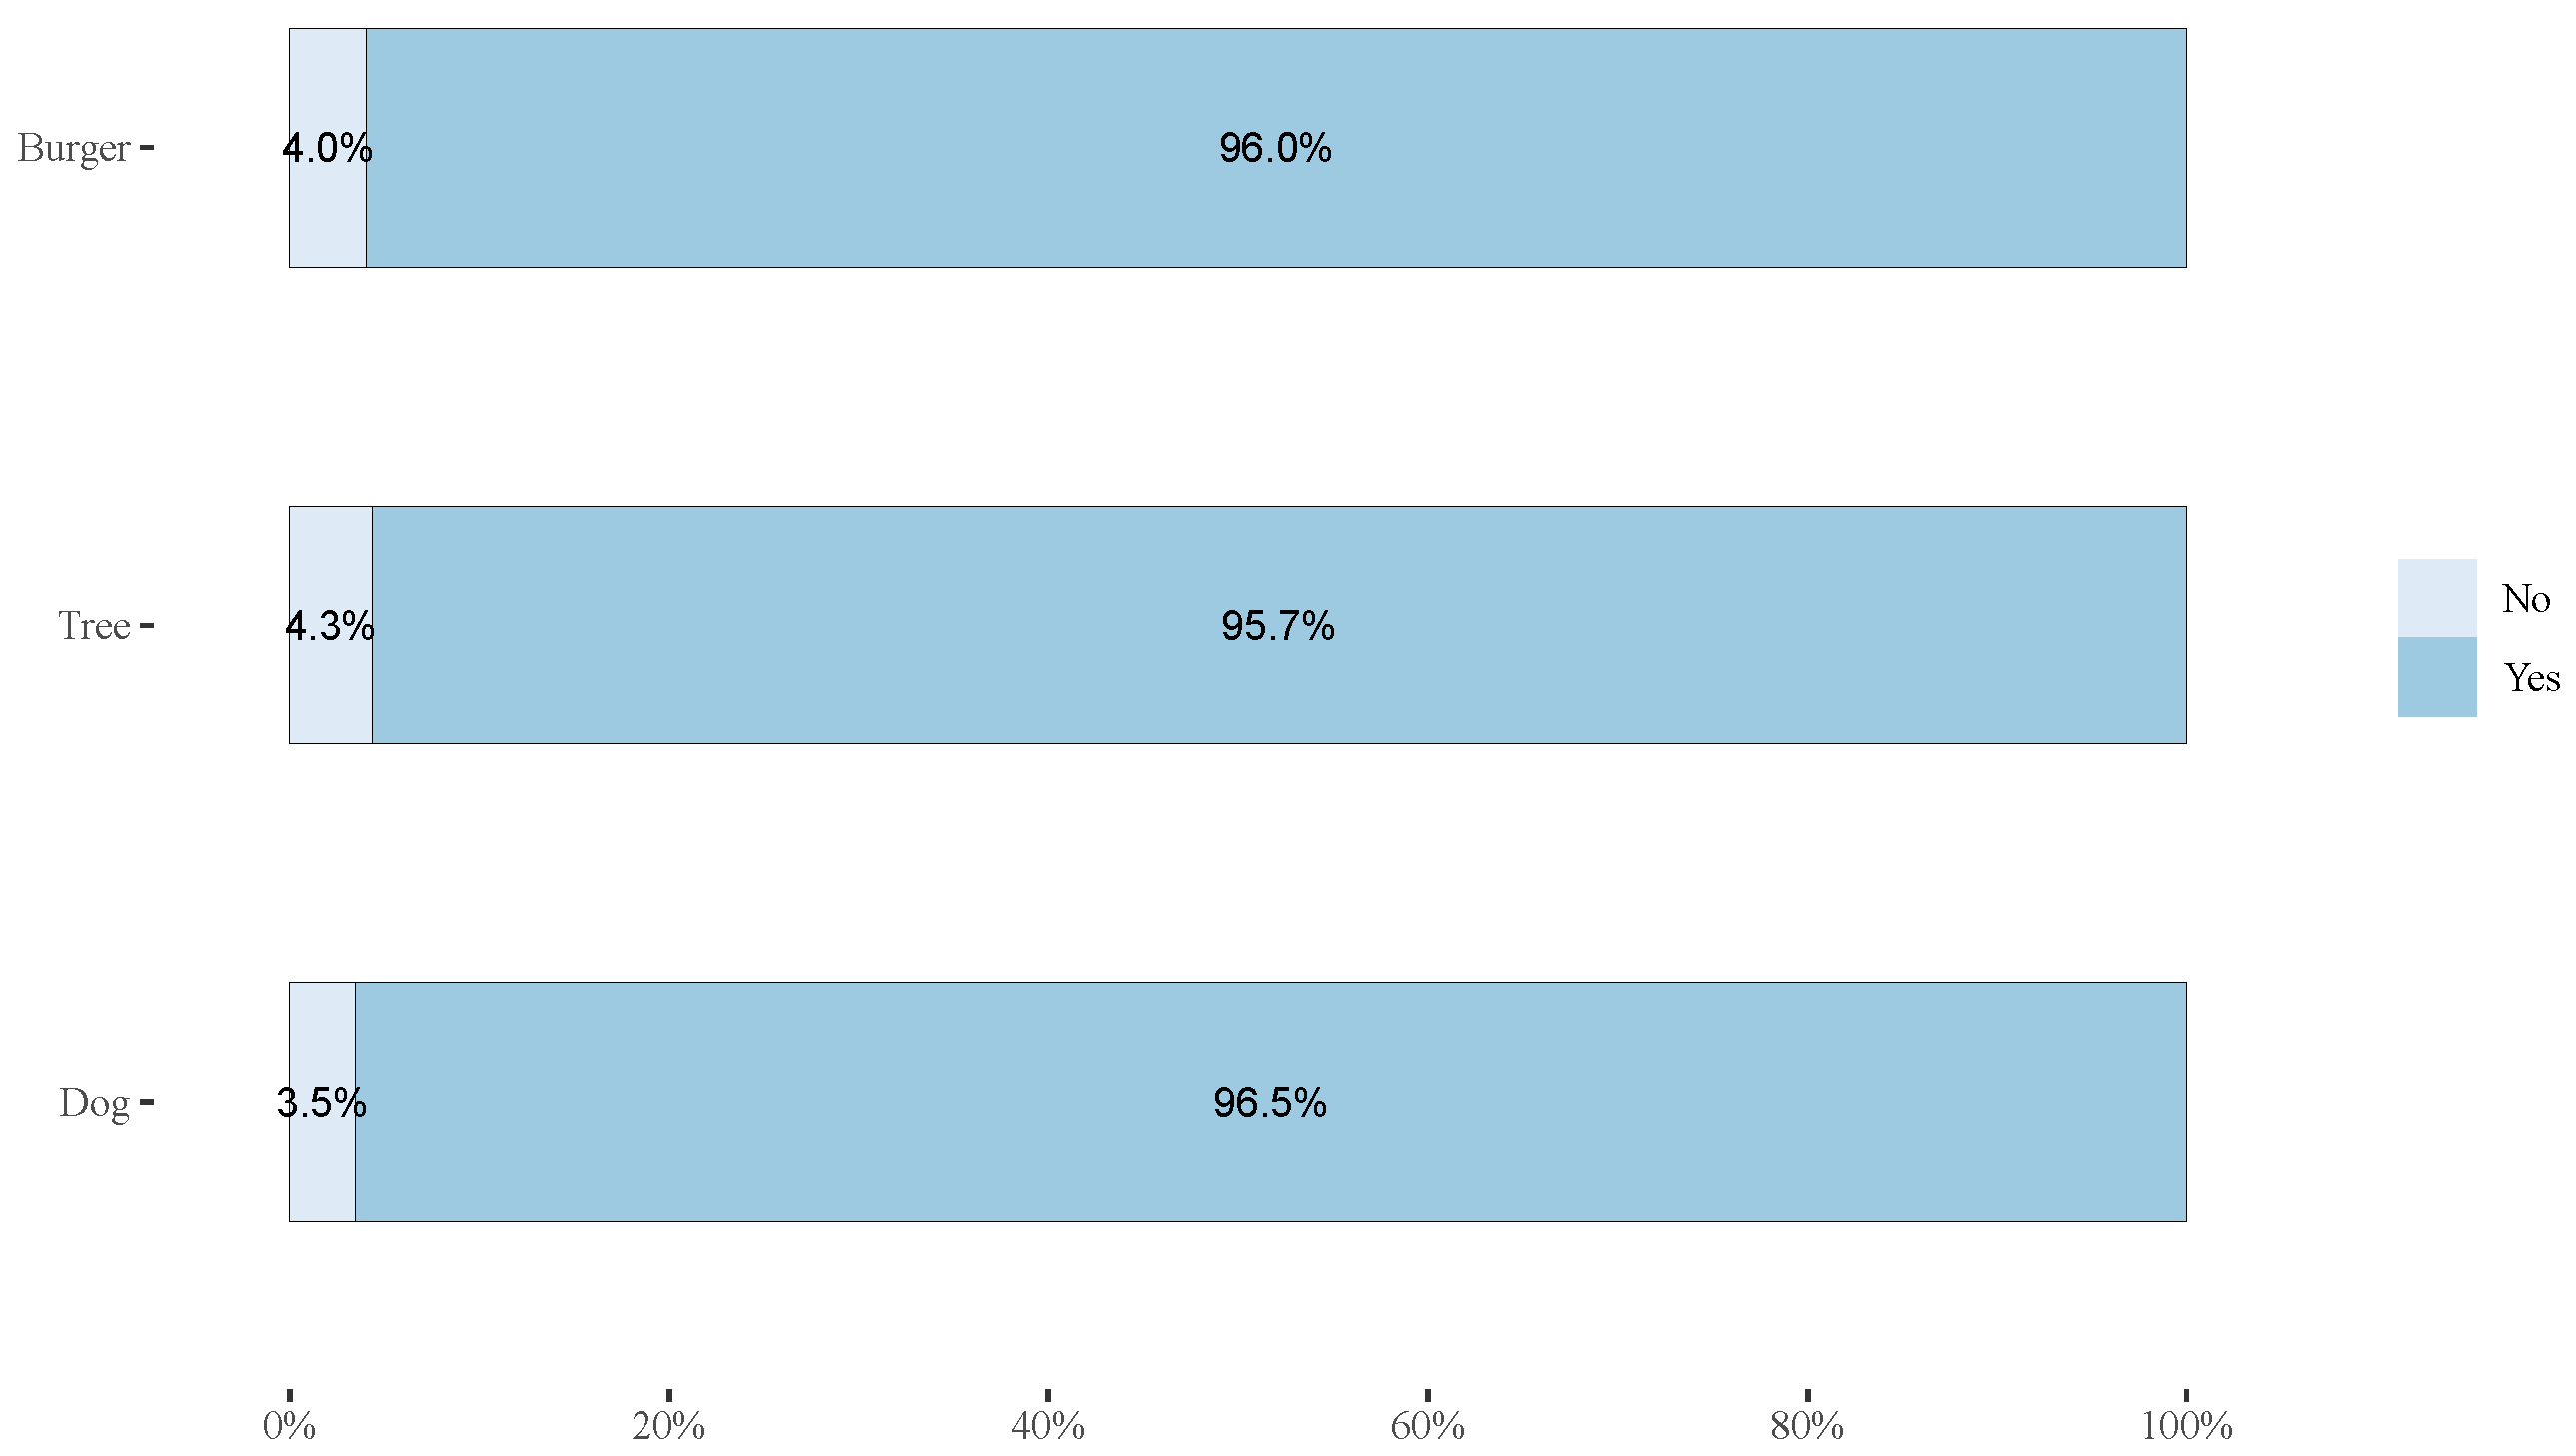
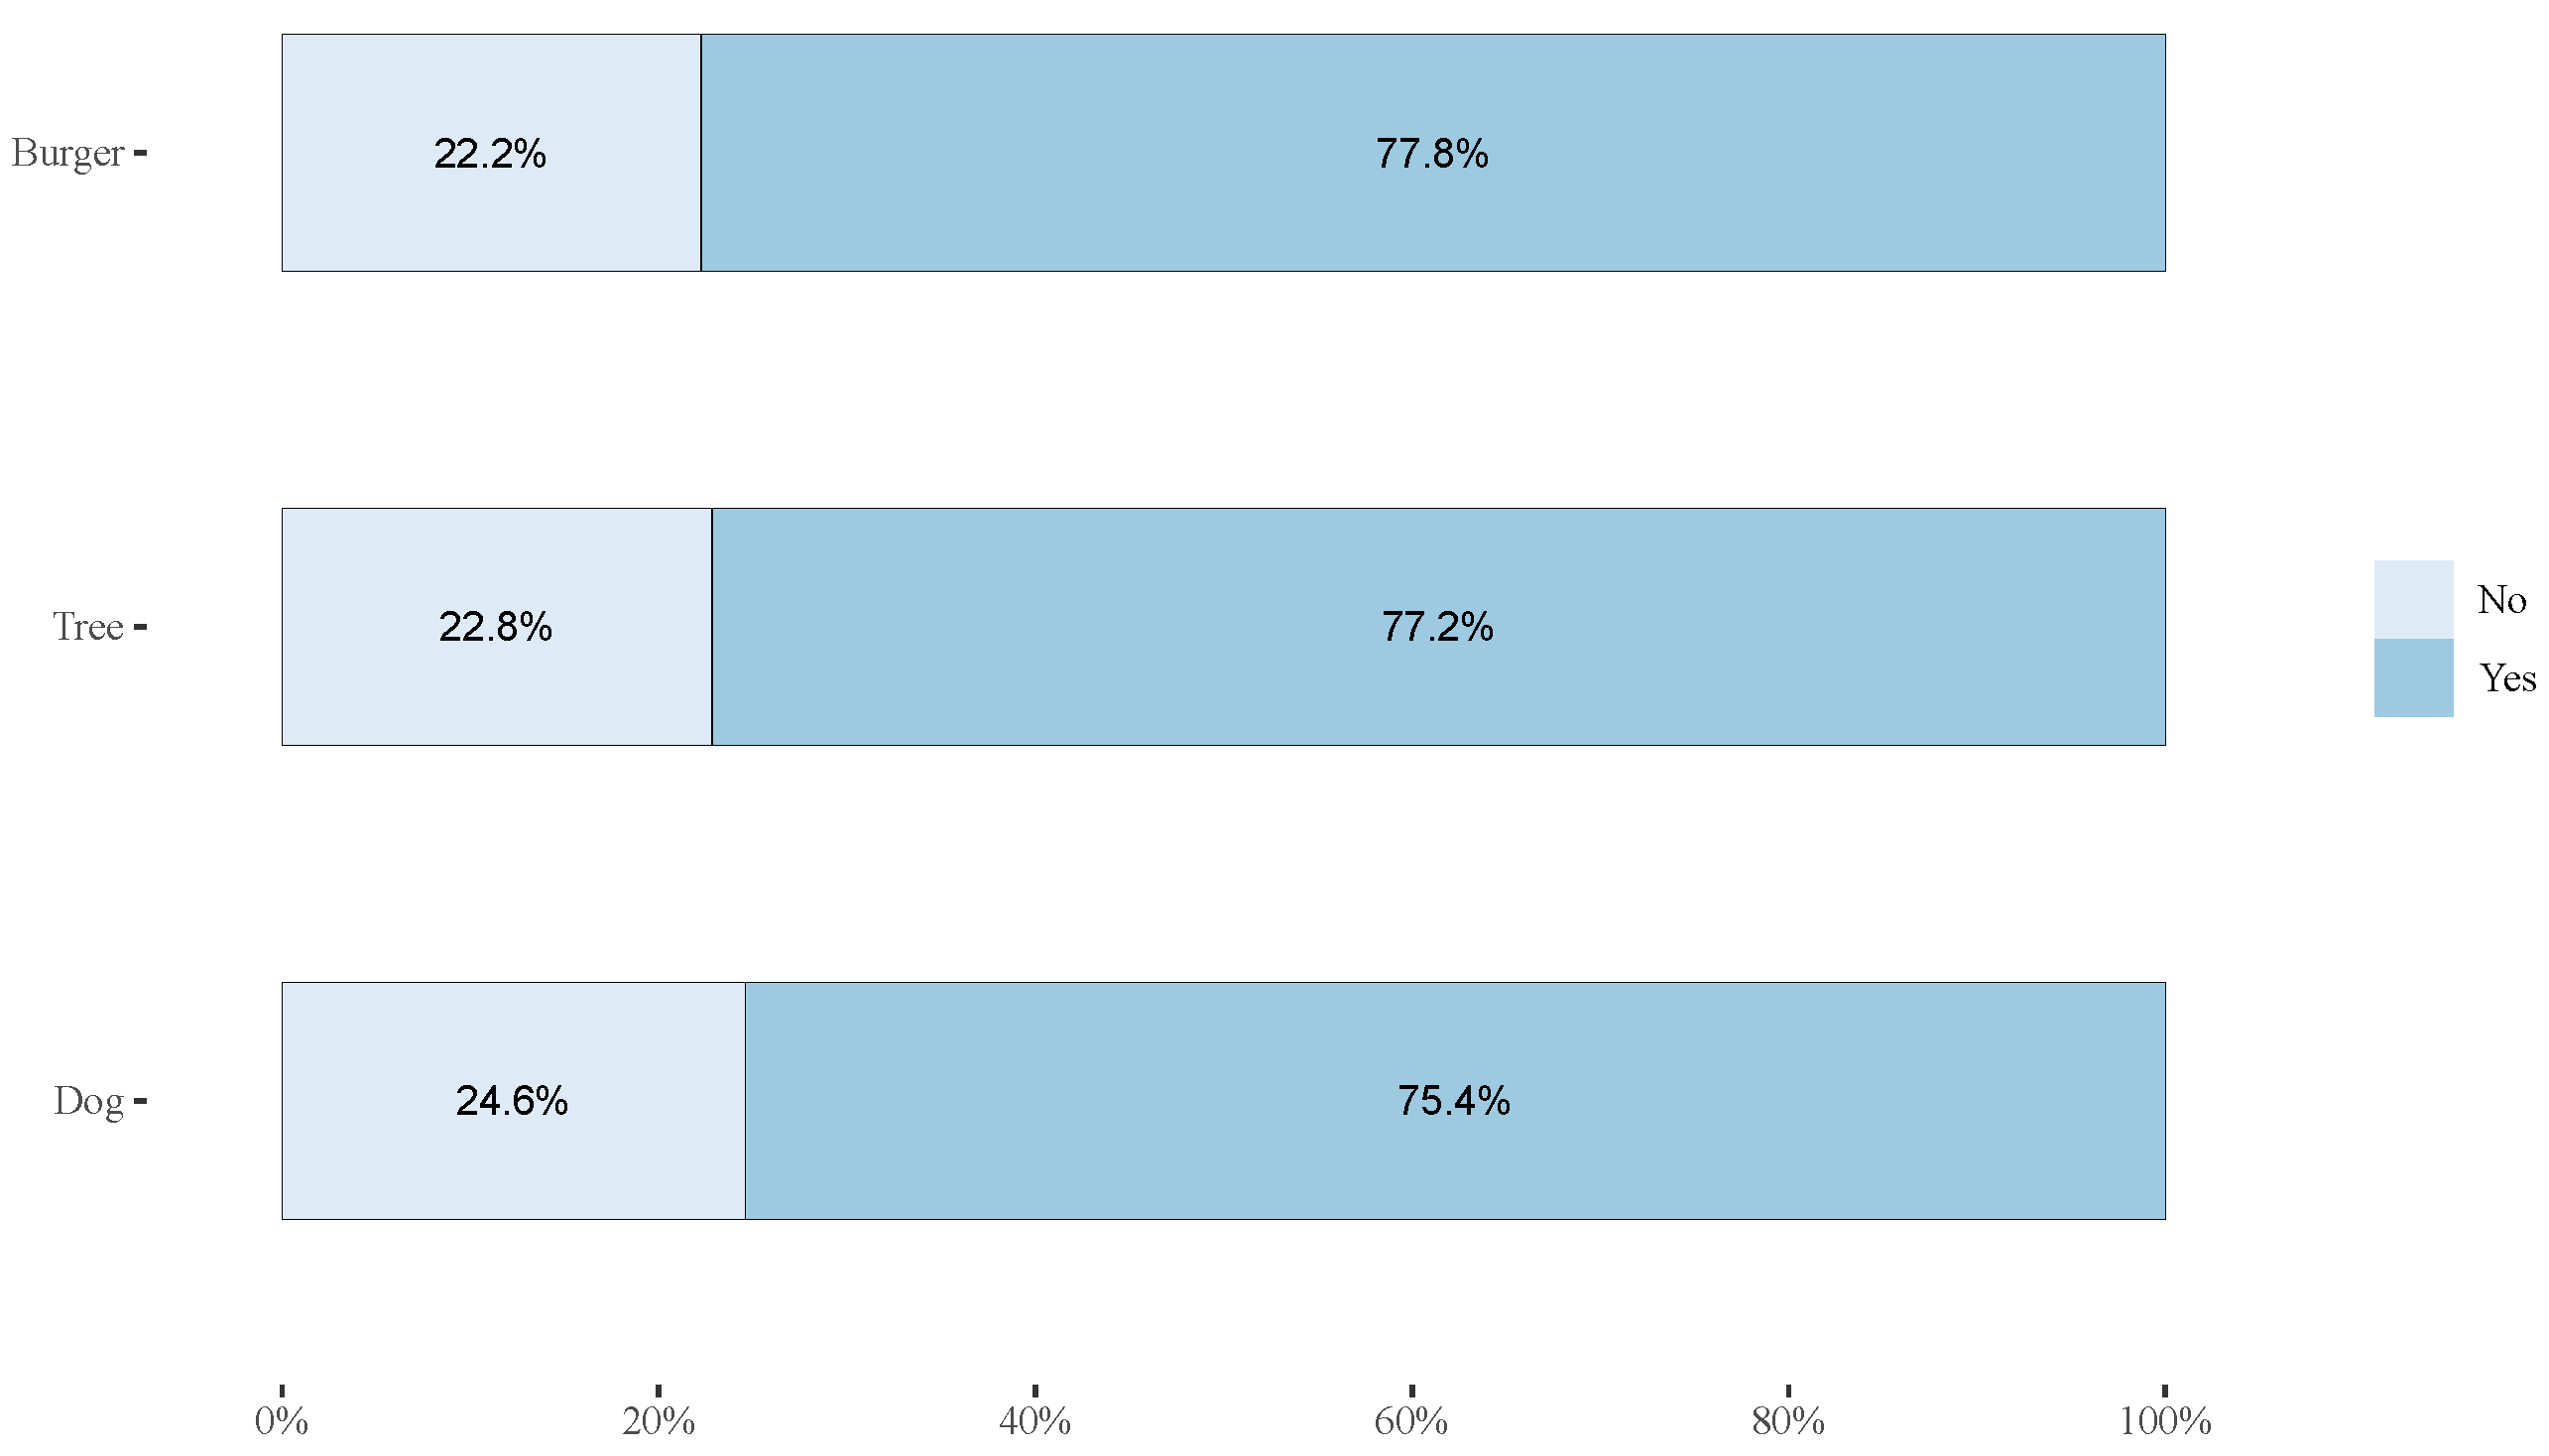
3.3. The Dog–Tree–Burger Study
3.4. The Shape/Not-Shape Study
3.5. The D-Mapping Study Results
3.6. The D-STMI Study Results
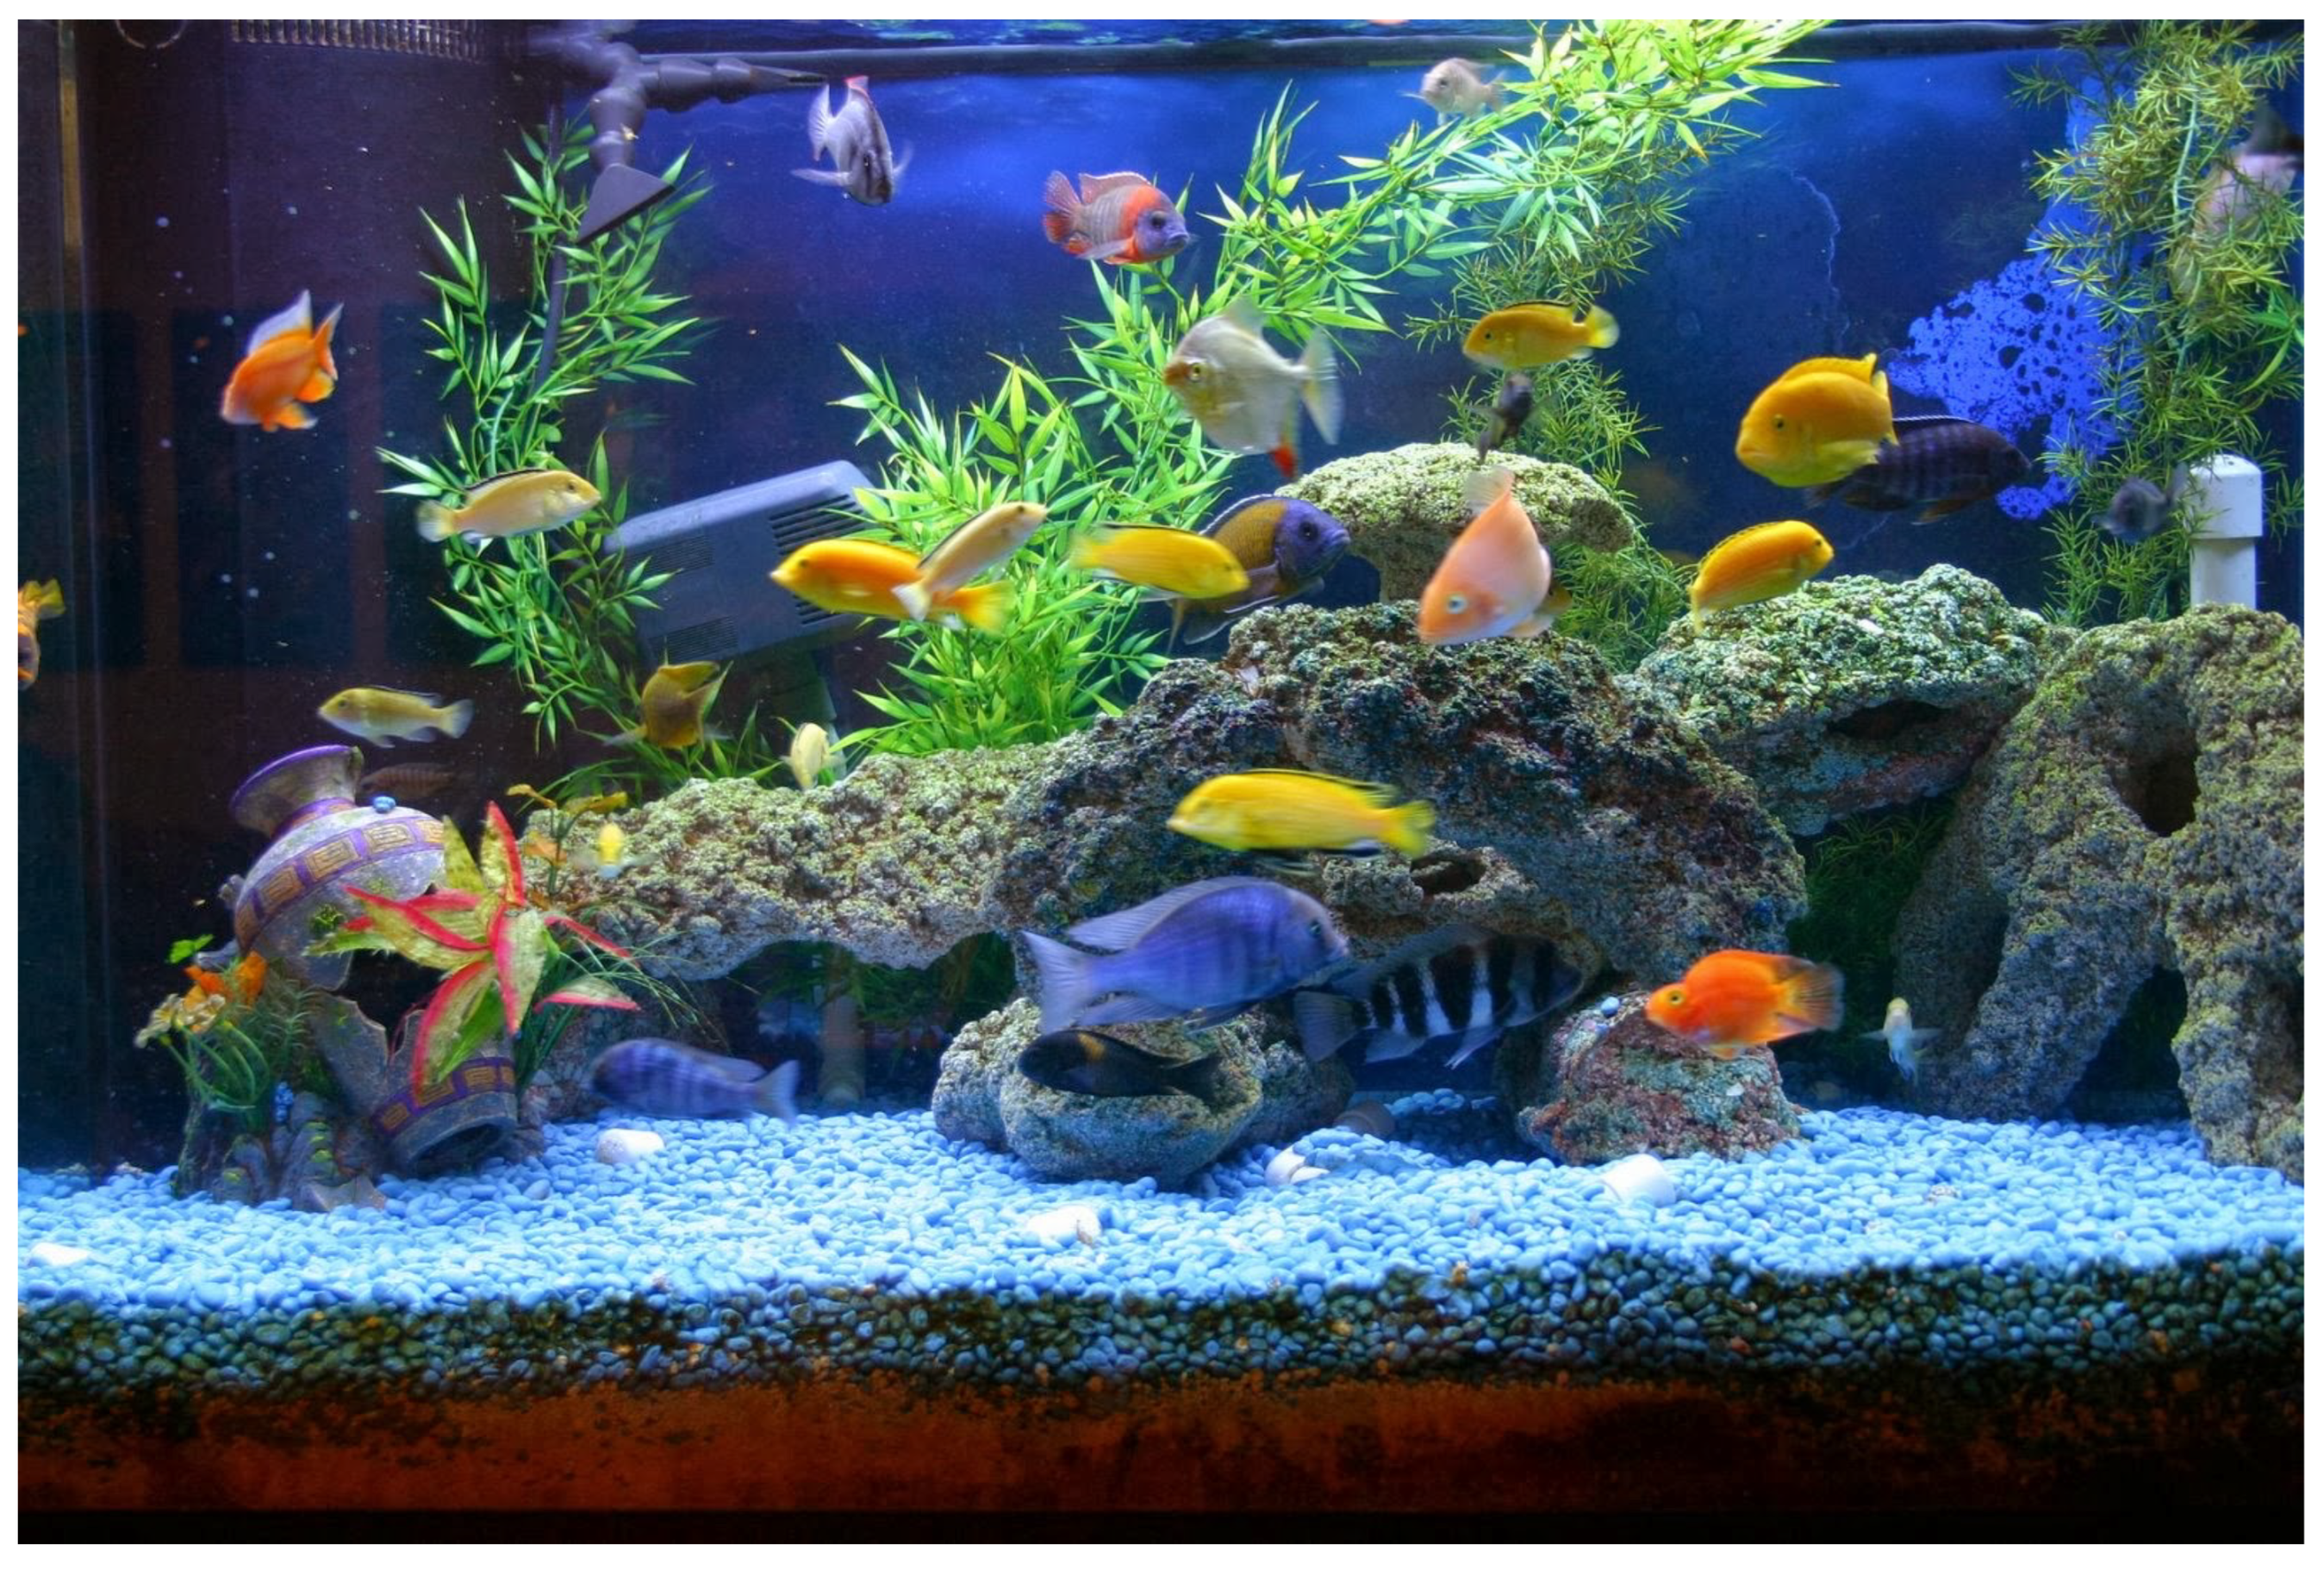
3.7. The D-Fishtank Study Results
4. Discussion of Findings
4.1. The Orange Polyhedra Study
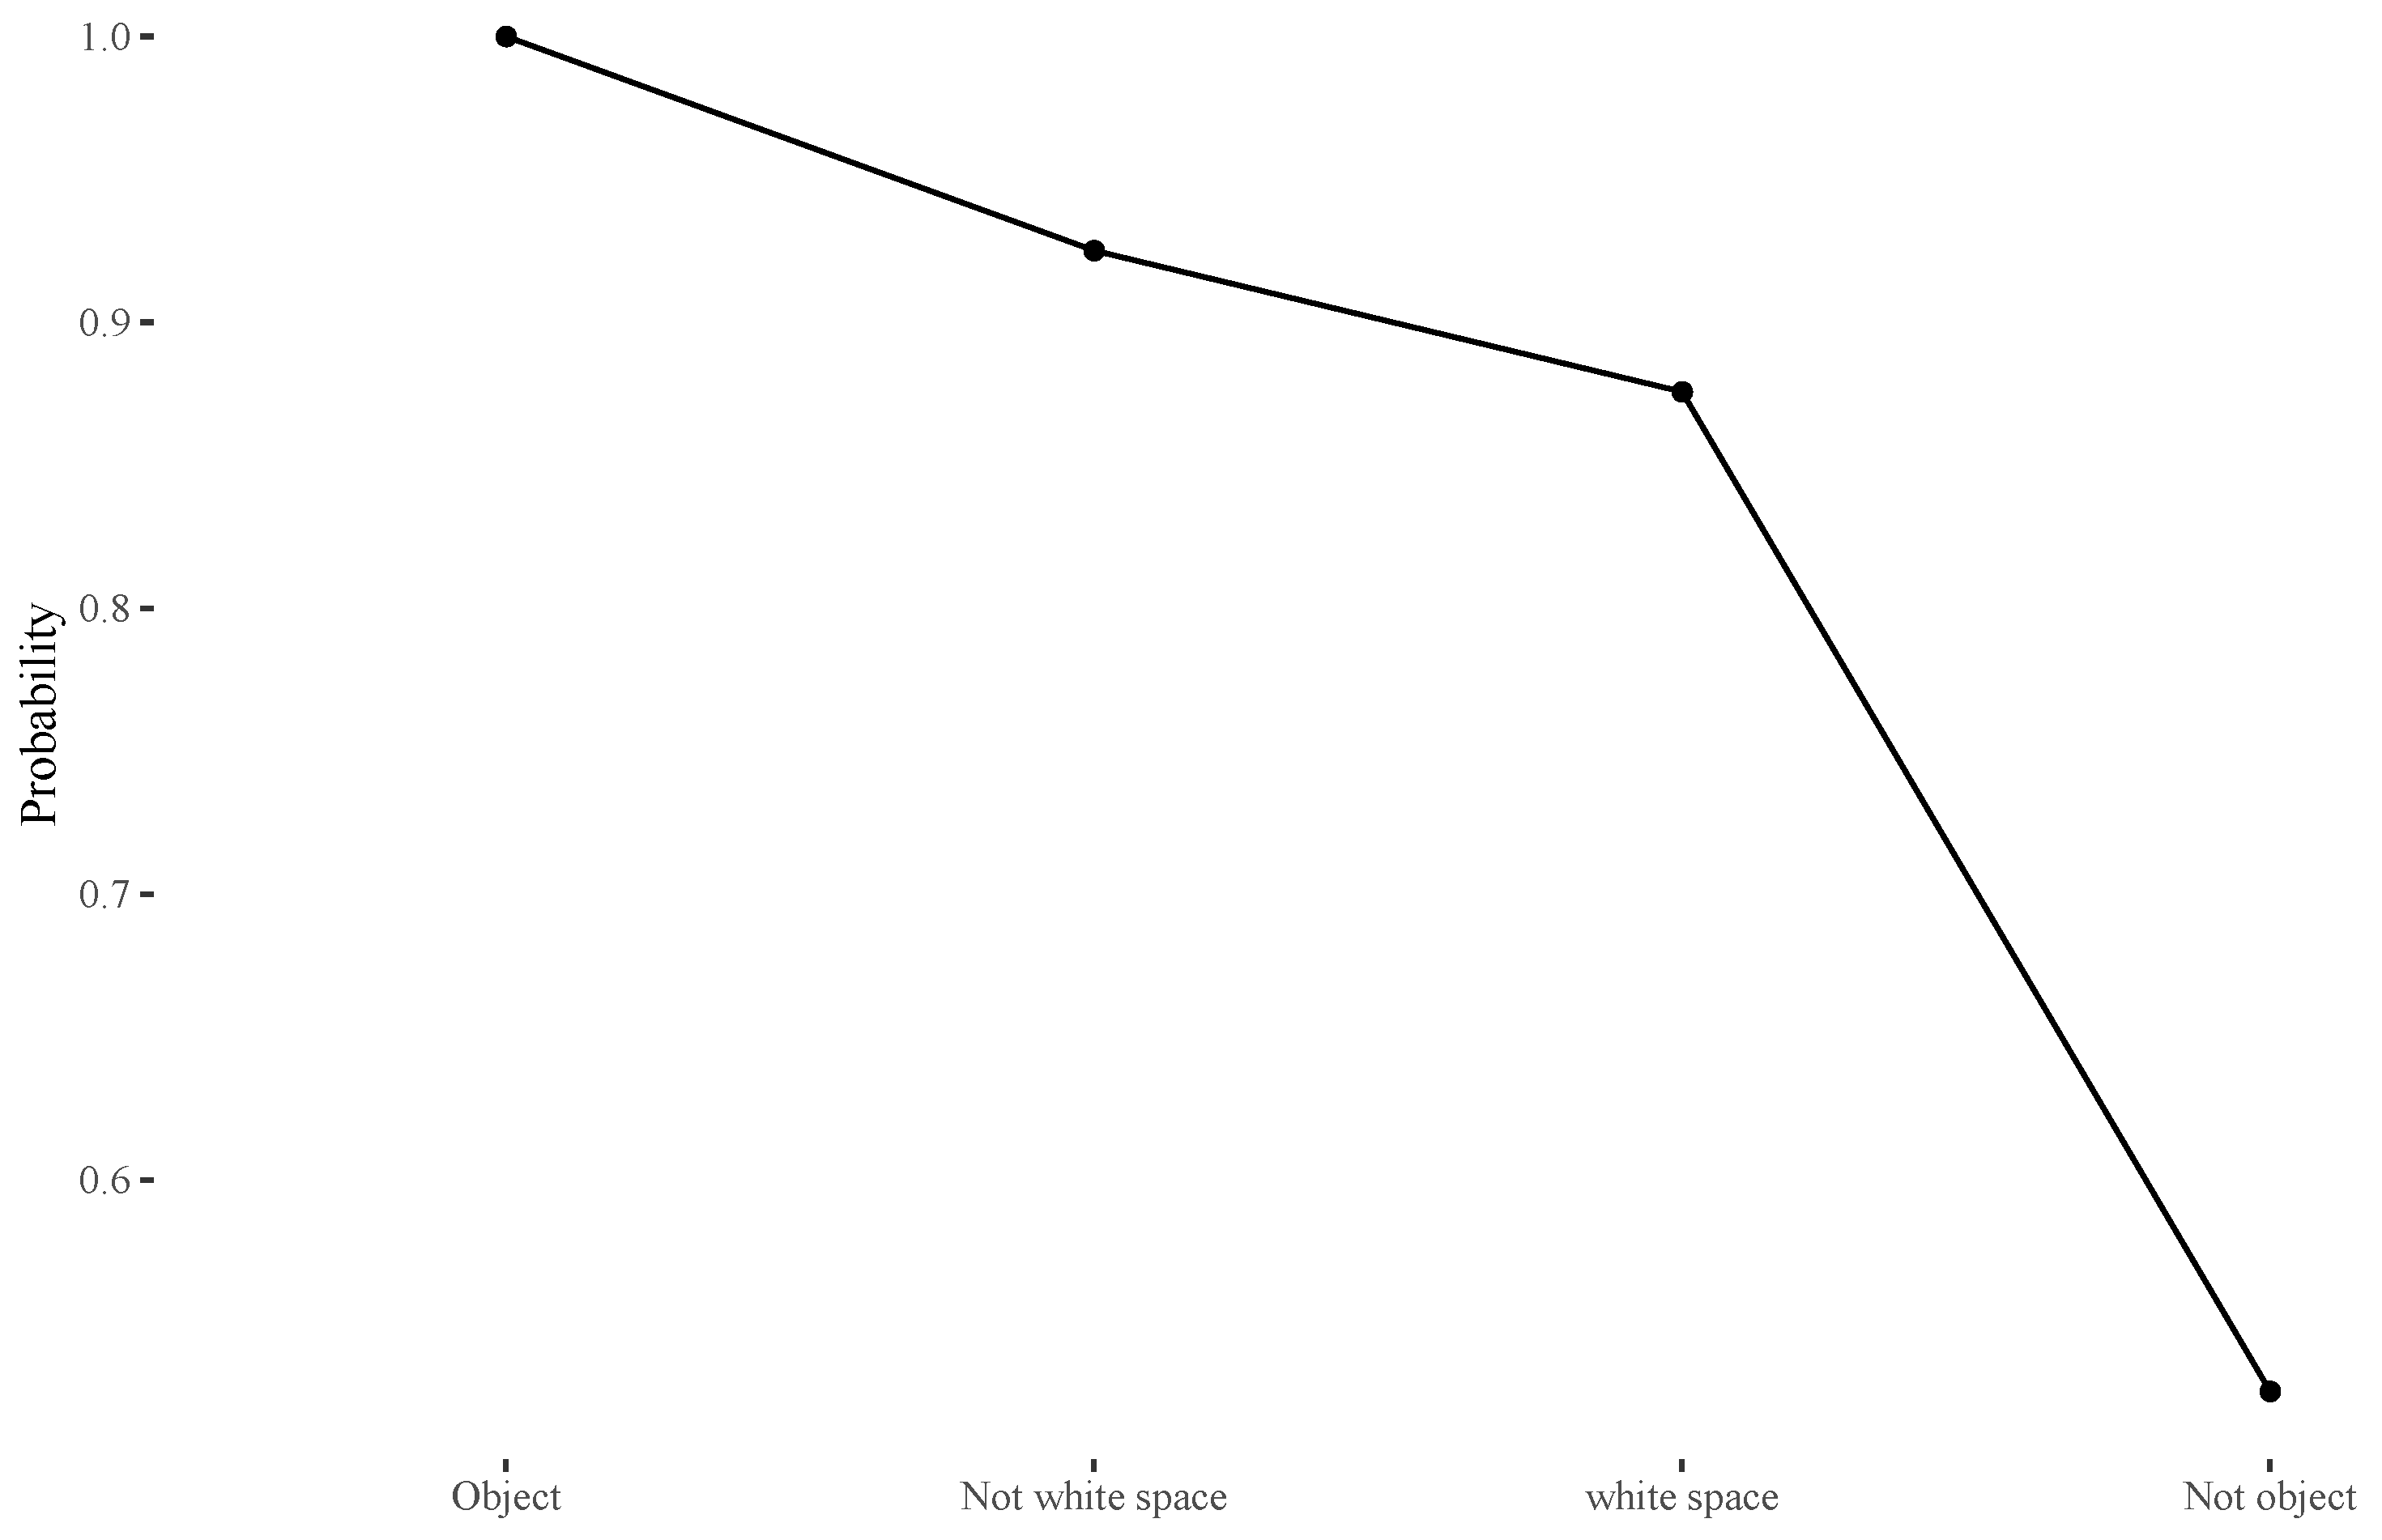
- People have an easier time identifying and naming objects than not-objects
- When the identity is an object, they do better;
- When the identity is a not-object, they do worse;
- When the other is an object, they do better; and
- When the other is a not-object, they do worse.
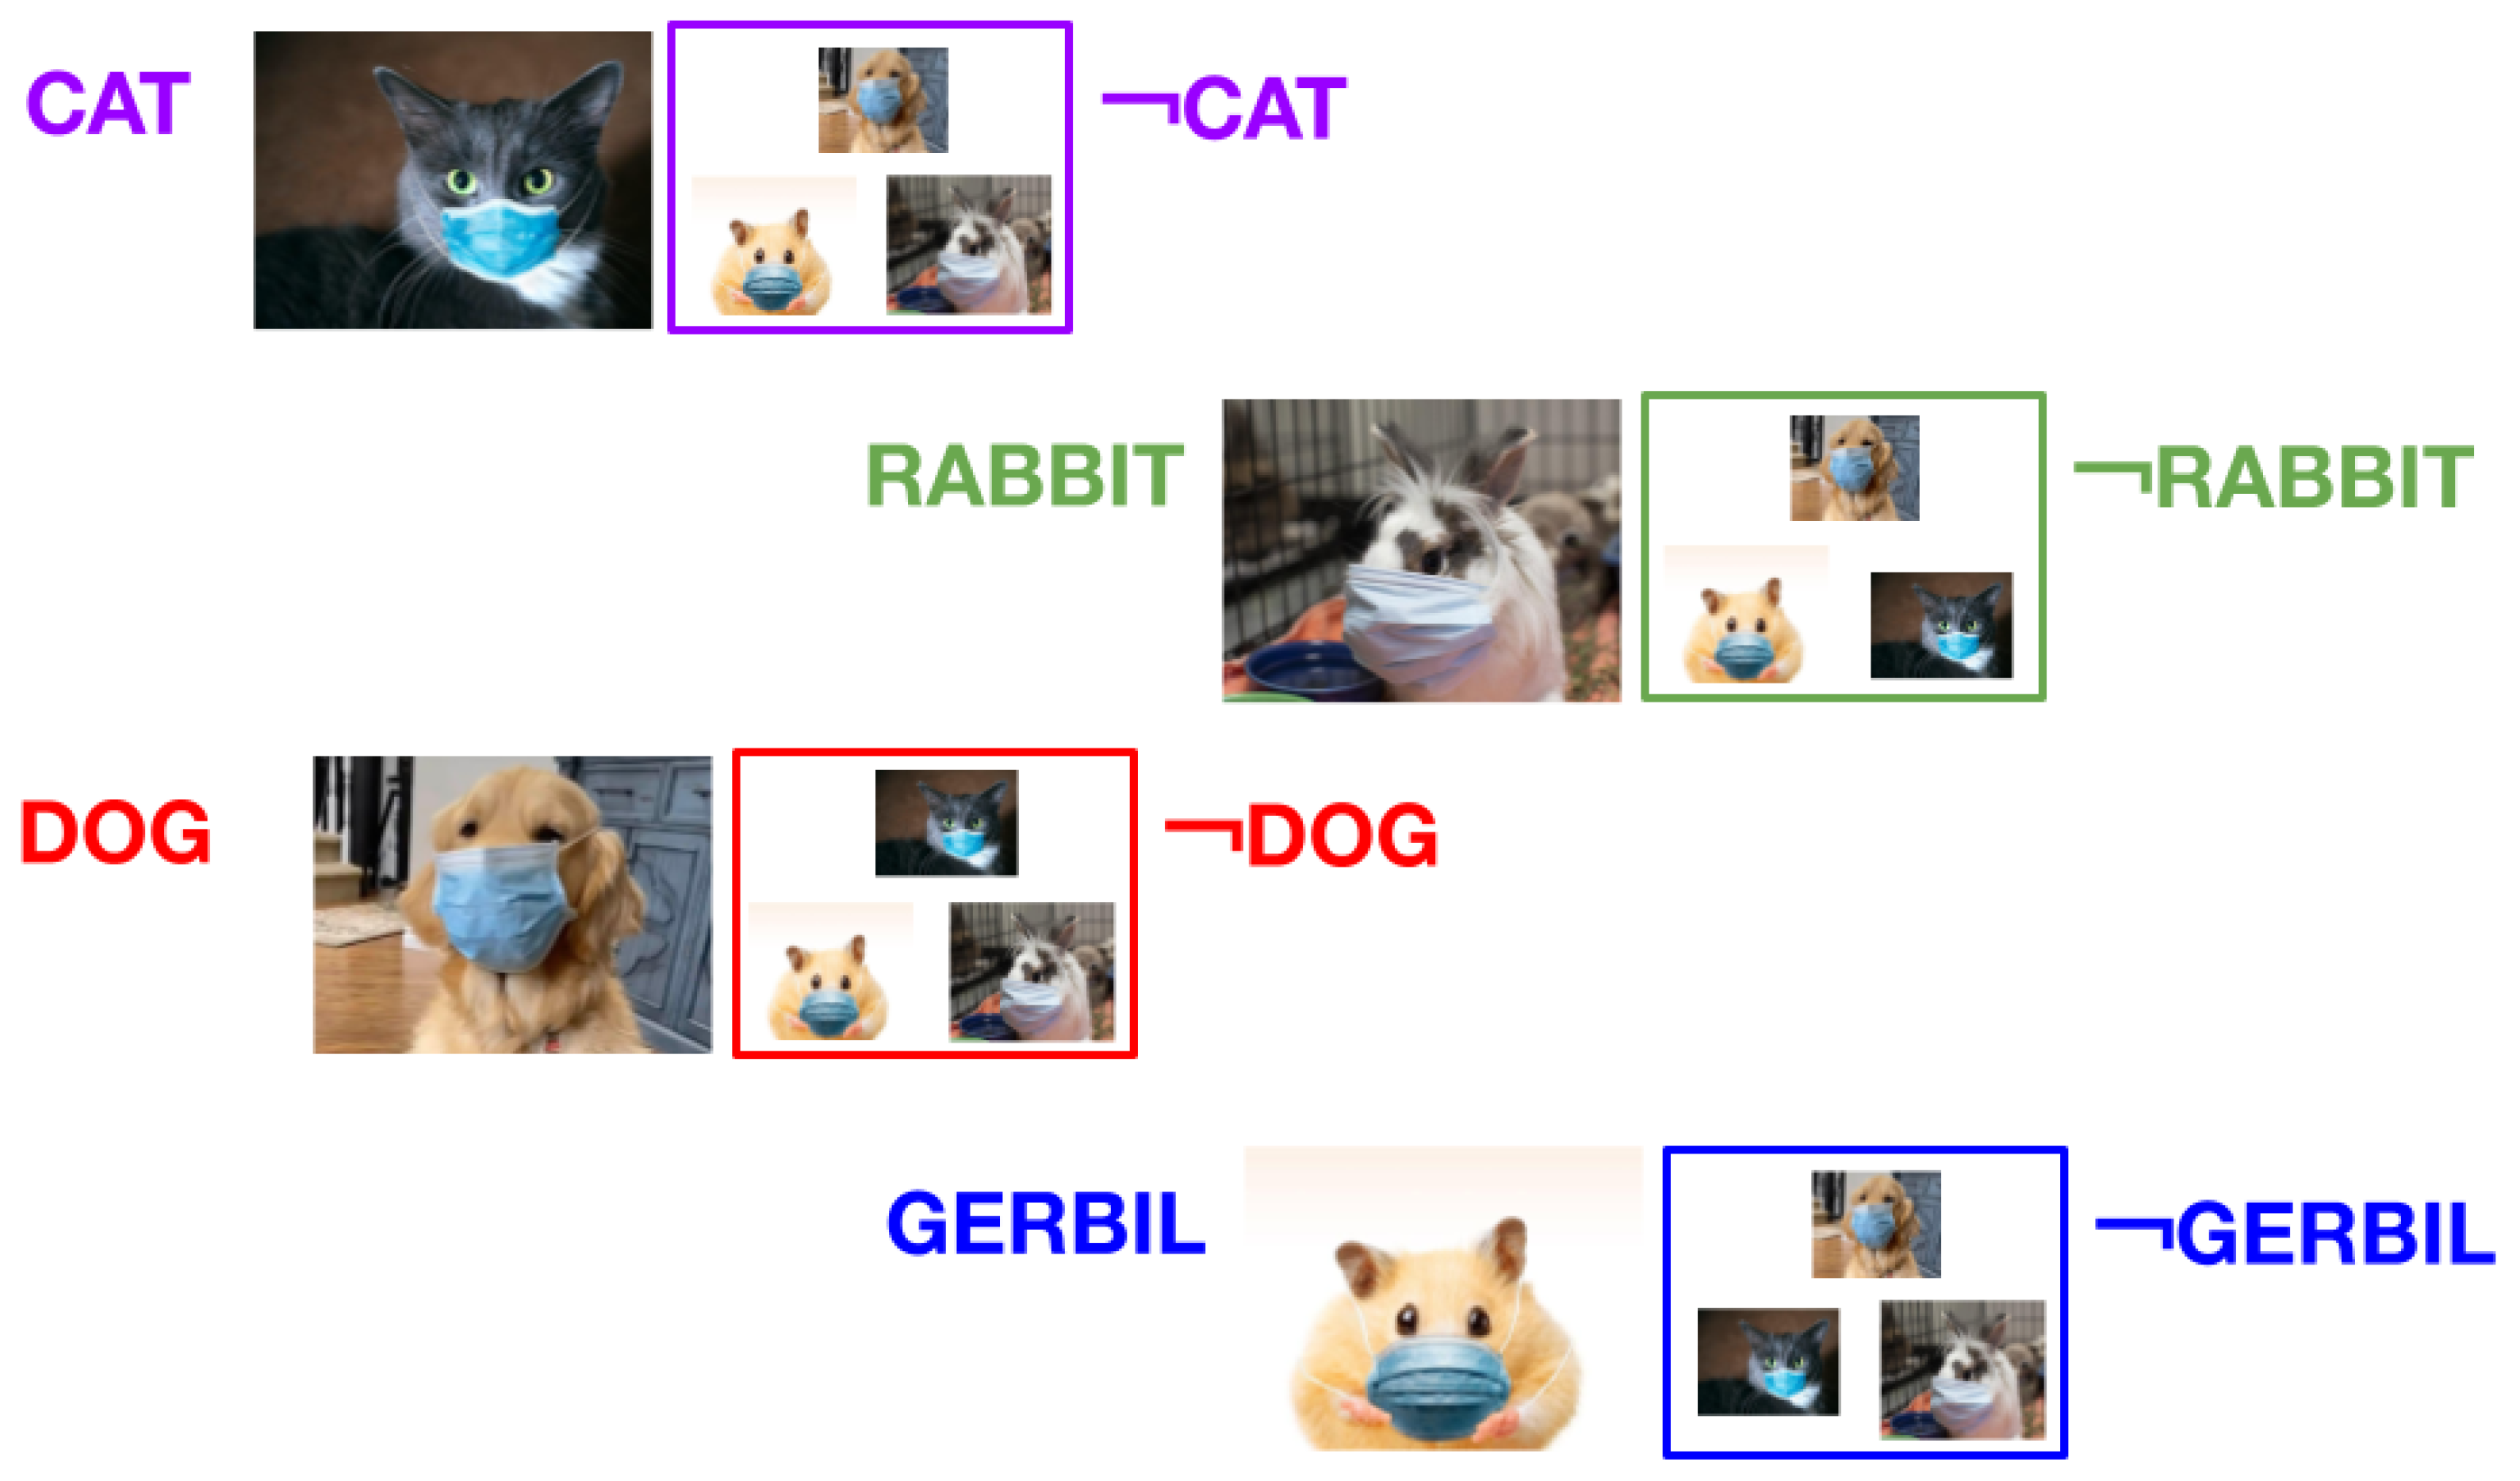
4.2. The Rorschach/Inkblot Study
- Same/same (i.e., the same identity can be called by the same name);
- Same/different (i.e., the same identity can be called by different names);
- Different/same (i.e., different identities can be called by the same name); or
- Different/different (i.e., different identities can be called different names).
4.3. The Dog–Tree–Burger Study
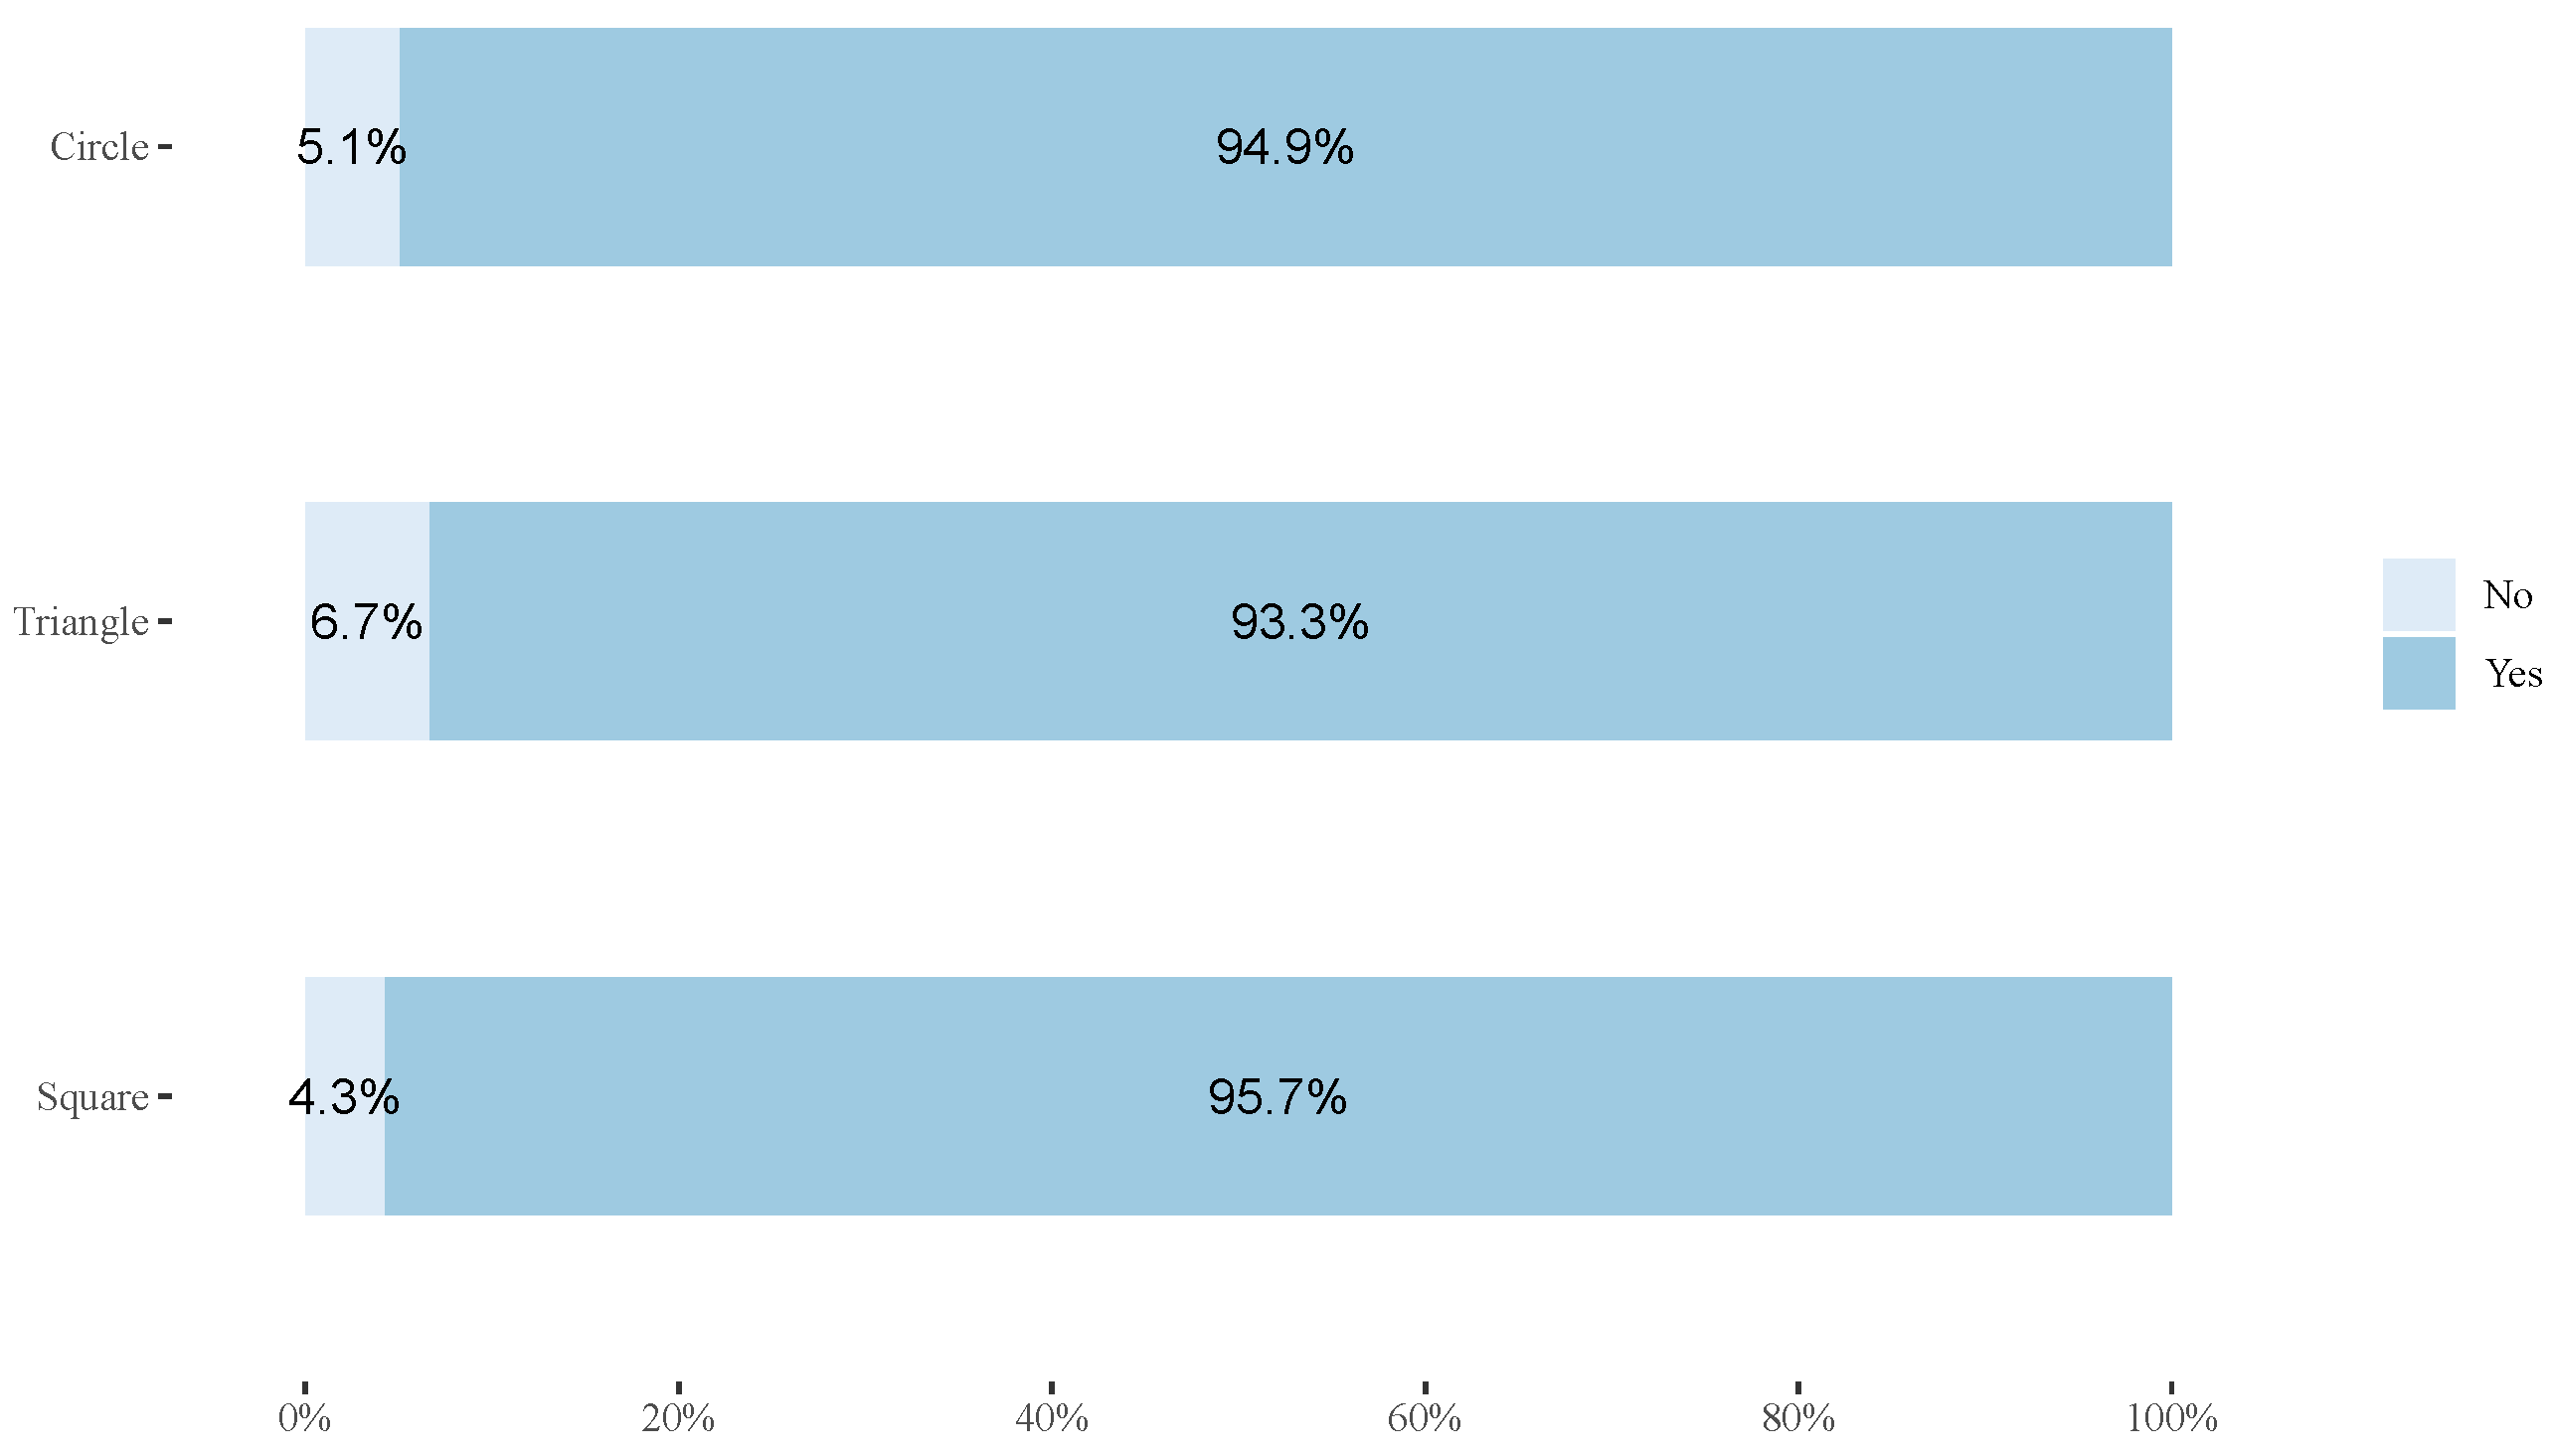
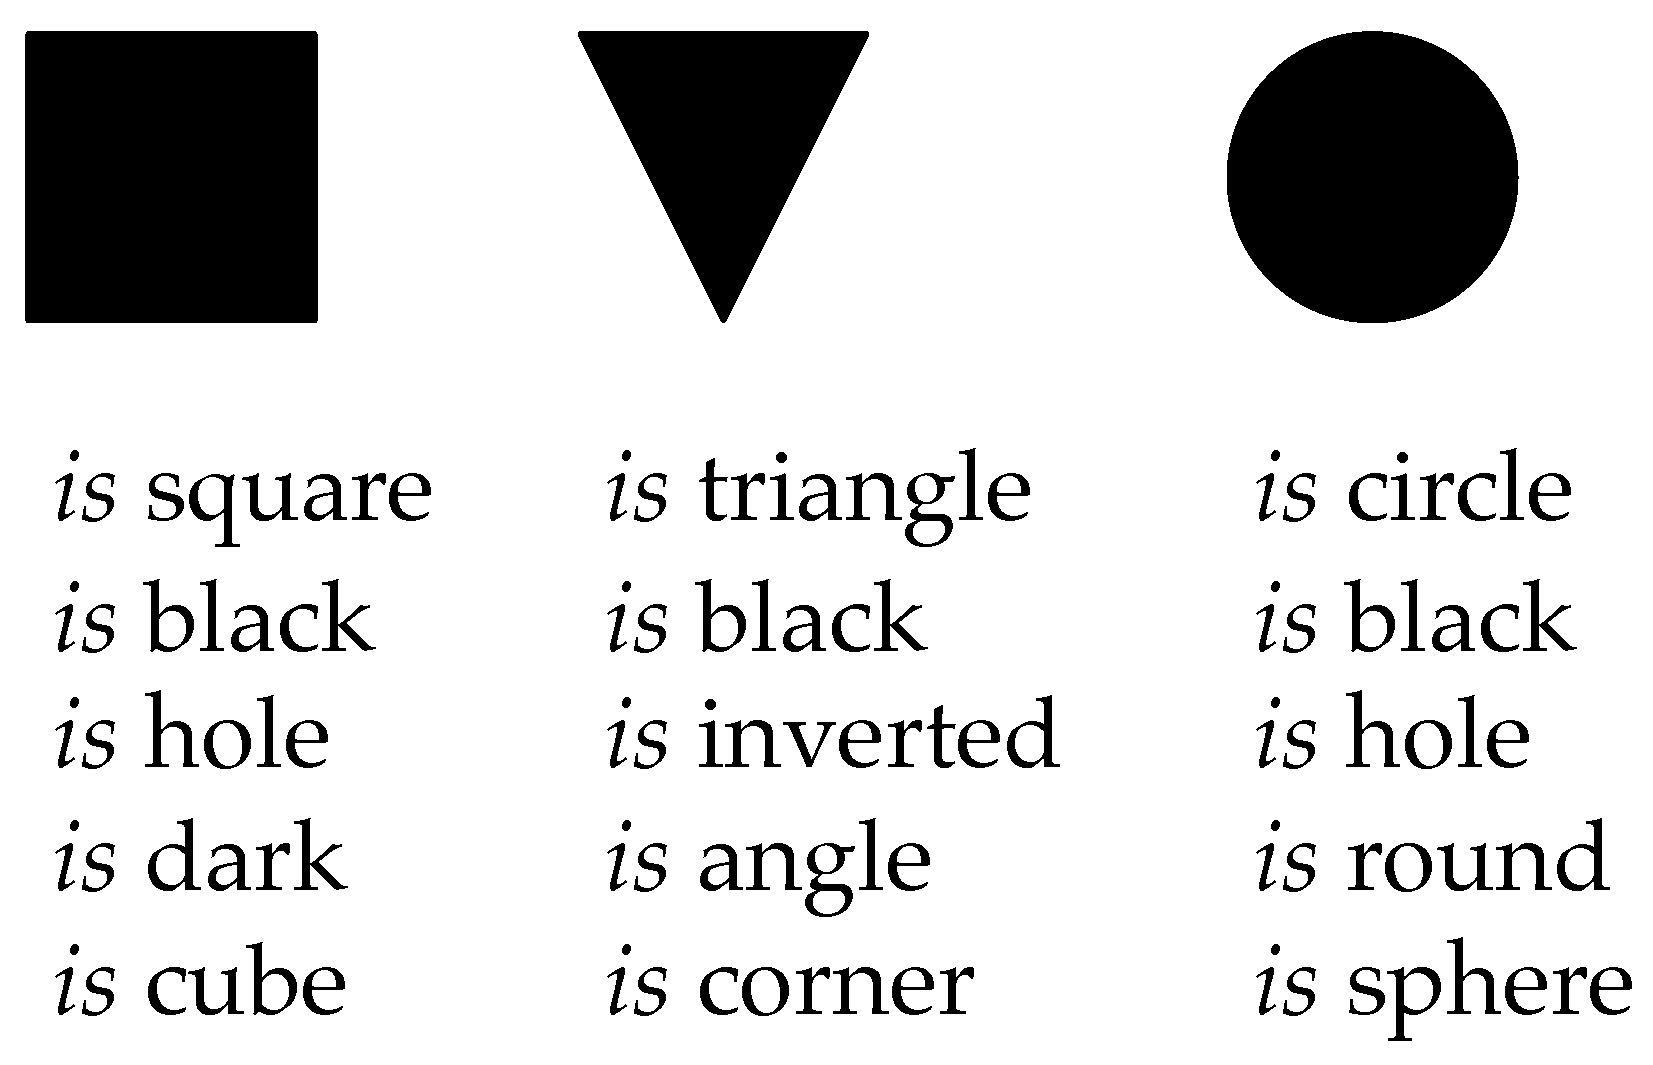
4.4. The Shape/Not-Shape Study
4.5. Dependency Research Studies
4.6. The D-Mapping Study
4.7. The D-STMI Study
4.8. The D-Fishtank Study
4.9. Summary of Findings on Existence, Universality, Efficacy, and Parallelism
- Universal to the organization of information:
- (a)
- in the mind (i.e., thinking, metacognition, encoding, knowledge formation, science, including both individual and social cognition, etc.; and
- (b)
- in nature (i.e., physical/material, observable systems, matter, scientific findings across the disciplines, etc.).
- Made up of elements (identity, other) that are:
- (a)
- Co-implying (i.e., if one exists, the other exists; called the co-implication rule);
- (b)
- Related by a special7 Relationship: existential/existential-negation (i.e., is/is-not); and
- (c)
- Act simultaneously as, and are, therefore, interchangeable with, the elements of relationships (action, reaction), systems (part, whole) and perspectives (point, view). This is called the simultaneity rule.
- Mutually-dependent on action–reaction relationships (R)), part–whole systems (S), point-view perspectives (P), such that D, S, R, and P are necessary and sufficient; and
- Taken metacognitively:
- (a)
- Constitute the basis for making structural predictions about information (based on co-implication and simultaneity rules) of observable phenomena and are, therefore, a source of creativity, discovery, innovation, invention, and knowledge discovery; and
- (b)
- Effective in navigating cognitive complexity to align with ontological systems complexity.
5. Conclusions
Author Contributions
Funding
Institutional Review Board Statement
Informed Consent Statement
Data Availability Statement
Conflicts of Interest
Abbreviations
| DSRP | DSRP theory (distinctions, systems, relationships, perspectives) |
| D | identity–other distinctions |
| S | part–whole systems |
| R | action–reaction relationships |
| P | point-view perspectives |
| STMI | systems thinking and metacognition inventory |
| IQR | interquartile range |
| GLMM | generalized linear mixed modeling |
| RDS | relate–distinguish–systematize jig |
| 1 | Some readers may find it confusing that we combine what might be called a positivist or objective and a constructivist or phenomenological or subjective epistemic views. We see no particular difficulty as the philosophical debate as to their incompatibility appears to be little more than a false dichotomy. It seems quite obvious to us that, given both everyday behavior and empirical evidence, not one of us humans or animals go about their day as if nothing is real. Likewise, even the most cantankerous positivist would concede that our mental models are real and influence real world behavior, even when the models themselves are not valid. Alas, we consider this to be the domain of philosophers (which we are not) and focus on following where the empirical science and data lead us, regardless of whether or not it violates one of our epistemic beliefs. We see absolutely no problem mixing positivism and phenomenology, for example. Nor do we see an issue mixing reductionism and holism or nature and nurture or behaviorism and cognitivism. These are false dichotomies that likely should be placed in the dustbin of history. |
| 2 | From [83], “It should be noted that the ST/DSRP loop is the mirror opposite of confirmation bias. Confirmation bias reverses this loop, by fitting reality to one’s mental models, whereas DSRP-systems thinking fits mental models to real-world observables and feedback. Parallelism is therefore the degree to which one’s cognitive paradigm, style, or mindset, aligns with nature’s. One purpose of this research program, is to determine the degree to which DSRP theory accomplishes this parallelism”. |
| 3 | STMI is the acronym for the systems thinking and metacognition inventory |
| 4 | full disclosure, Plectica systems mapping software was invented by Dr. Derek Cabrera and used for years as a pilot software for research purposes (it was originally called MetaMap). Cabrera later co-founded Plectica and developed the software further as a consumer application. Plectica was then sold to Frameable and Cabrera is no longer actively involved in the company. |
| 5 | The why not a dot? study indicates a similar part–whole structure for identities, meaning that both identities and others are part–whole structures [84]. |
| 6 | the STMI study focused on more than just the effects of distinctions; see [82]. |
| 7 | “special” here refers to the specific relationship. In contrast to general or universal relationships. |
References
- Spencer-Brown, G. Laws of Form; Allen & Unwin: London, UK, 1969. [Google Scholar]
- Krauss, L. Why Is There Something Instead of Nothing? [Video]. Available online: https://www.scientificamerican.com/article/why-is-there-something-instead-of-nothing-video/ (accessed on 7 December 2021).
- Euler, L. Solutio Problematis ad Geometriam Situs Pertinentis; Commentarii Academiae Scientiarum Petropolitanae: St. Petersburg, Russia, 1741; Volume 53, pp. 128–140. [Google Scholar]
- Kolata, G. Studying Learning In The Womb. Science 1984, 225, 302–303. [Google Scholar] [CrossRef] [PubMed]
- Partanen, E.; Kujala, T.; Näätänen, R.; Liitola, A.; Sambeth, A.; Huotilainen, M. Learning-induced neural plasticity of speech processing before birth. Proc. Natl. Acad. Sci. USA 2013, 110, 15145–15150. [Google Scholar] [CrossRef] [PubMed]
- Quinn, P.C.; Brown, C.R.; Streppa, M.L. Perceptual Organization of Complex Visual Configurations by Young Infants. Infant Behav. Dev. 1997, 20, 35–46. [Google Scholar] [CrossRef]
- Newman, R.S.; Jusczyk, P.W. The Cocktail Party Effect in Infants. Percept. Psychophys. 1996, 58, 1145–1156. [Google Scholar] [CrossRef]
- Gauthier, I.; Tarr, M.J. Becoming a “Greeble” expert: Exploring mechanisms for face recognition. Vis. Res. 1997, 37, 1673–1682. [Google Scholar] [CrossRef]
- Aubin, T.; Jouventin, P. Cocktail-party effect in king penguin colonies. Proc. R. Soc. Lond. Ser. B-Biol. Sci. 1998, 265, 1665–1673. [Google Scholar] [CrossRef]
- Fry, S.N.; Wehner, R. Honey bees store landmarks in an egocentric frame of reference. J. Comp. Physiol. A-Neuroethol. Sens. Neural Behav. Physiol. 2002, 187, 1009–1016. [Google Scholar] [CrossRef]
- Badre, D. Cognitive control, hierarchy, and the rostro-caudal organization of the frontal lobes. Trends Cogn. Sci. 2008, 12, 193–200. [Google Scholar] [CrossRef]
- Bukach, C.M.; Gauthier, I.; Tarr, M.J.; Kadlec, H.; Barth, S.; Ryan, E.; Turpin, J.; Bub, D.N. Does acquisition of Greeble expertise in prosopagnosia rule out a domain-general deficit? Neuropsychologia 2012, 50, 289–304. [Google Scholar] [CrossRef]
- Drews, G. Contributions of Theodor Wilhelm Engelmann on phototaxis, chemotaxis, and photosynthesis. Photosynth. Res. 2005, 83, 25–34. [Google Scholar] [CrossRef]
- Sengupta, A.; Kruppa, T.; Löwen, H. Chemotactic predator-prey dynamics. Phys. Rev. E 2010, 83, 031914. [Google Scholar] [CrossRef] [PubMed]
- Berleman, J.E.; Kirby, J.R. Deciphering the hunting strategy of a bacterial wolfpack. FEMS Microbiol. Rev. 2009, 33, 942–957. [Google Scholar] [CrossRef]
- Pradel, E.; Zhang, Y.; Pujol, N.; Matsuyama, T.; Bargmann, C.I.; Ewbank, J.J. Detection and avoidance of a natural product from the pathogenic bacterium Serratia marcescens by Caenorhabditis elegans. Proc. Natl. Acad. Sci. USA. 2007, 104, 2295–2300. [Google Scholar] [CrossRef] [PubMed]
- Rajalingham, R.; DiCarlo, J.J. Reversible Inactivation of Different Millimeter-Scale Regions of Primate IT Results in Different Patterns of Core object Recognition Deficits. Neuron 2019, 102, 493–505.e5. [Google Scholar] [CrossRef] [PubMed]
- Clark, T. National boundaries, border zones, and marketing strategy: A conceptual framework and theoretical model of secondary boundary effects. J. Marketing 1994, 58, 67–80. [Google Scholar] [CrossRef]
- Coye, D. The Sneakers/Tennis Shoes Boundary. Am. Speech. 1986, 61, 366–369. [Google Scholar] [CrossRef]
- Powers, E.; Cabrera, L.; Cabrera, D. No Word is an Island: Distinguishing “Nerd” and “Geek”. In Cognitive Case Study Series; Cornell University: Ithaca, NY, USA, 2016. [Google Scholar]
- Cabrera, D.; Cabrera, L. Systems Thinking Made Simple: New Hope for Solving Wicked Problems in a Complex World; Odyssean Press: Ithaca, NY, USA, 2015. [Google Scholar]
- Peterson, M.A.; Skow-Grant, E. Memory and Learning in Figure–Ground Perception. Psychology Learn. Motivation. 2003, 42, 1–35. [Google Scholar]
- Abdullah, M.H.; Klypin, A.; Wilson, G. Cosmological Constraints on Ω m and σ 8 from Cluster Abundances Using the GalWCat19 Optical-spectroscopic SDSS Catalog. APJ 2020, 901, 90. [Google Scholar] [CrossRef]
- De Luca Picione, R.; Valsiner, J. Psychological Functions of Semiotic Borders in Sense-Making: Liminality of Narrative Processes. Eur. J. Psychol. Assess. 2017, 13, 532–547. [Google Scholar] [CrossRef]
- Glanville, R. The Self and the Other: The Purpose of Distinction. In Trappl, R. “Cybernetics and Systems’ 90” the Proceedings of the European Meeting on Cybernetics and Systems Research; World Scientific: Singapore, 1999. [Google Scholar]
- Durand, R.; Calori, R. Sameness, Otherness? Enriching Organizational Change Theories With Philosophical Considerations On The Same And The Other. AMRO 2006, 31, 93–114. [Google Scholar] [CrossRef]
- Gillette, J.M. Boundary Lines of Social Phenomena. Am. J. Sociol. 1925, 30, 585–593. [Google Scholar] [CrossRef]
- Tajfel, H.; Wilkes, A.L. Classification and quantitative judgement. Br. J. Psychol. 1963, 54, 101–114. [Google Scholar] [CrossRef] [PubMed]
- Davies, C. Sexual Taboos and Social Boundaries. Am. J. Sociol. 1982, 87, 1032–1063. [Google Scholar] [CrossRef]
- Langer, E.J.; Bashner, R.S.; Chanowitz, B. Decreasing prejudice by increasing discrimination. J. Pers. Soc. Psychol. 1985, 49, 113–120. [Google Scholar] [CrossRef] [PubMed]
- Perdue, C.W.; Dovidio, J.F.; Gurtman, M.B.; Tyler, R.B. Us and them: Social categorization and the process of intergroup bias. J. Pers. Soc. Psychol. 1990, 59, 475–486. [Google Scholar] [CrossRef]
- Leudar, I.; Marsland, V. On membership categorization: ’us’, ’them’ and ’doing violence’ in political discourse. Discourse Soc. 2004, 15, 243–266. [Google Scholar] [CrossRef]
- Young, J. On Insiders (Emic) and Outsiders (Etic): Views of Self, and Othering. Syst. Pract. Action Res. 2005, 18, 151–162. [Google Scholar] [CrossRef]
- Midgley, G.; Pinzón, L.A. Systemic mediation: Moral reasoning and boundaries of concern: Systemic mediation. Syst. Res. Behav. Sci. 2013, 30, 607–632. [Google Scholar] [CrossRef]
- Bentley, S.V.; Greenaway, K.H.; Haslam, S.A. Cognition in context: Social inclusion attenuates the psychological boundary between self and other. J. Exp. Soc. Psychol. 2017, 73, 42–49. [Google Scholar] [CrossRef]
- King, S.L.; Connor, R.C.; Krützen, M.; Allen, S.J. Cooperation-based concept formation in male bottlenose dolphins. Nat. Commun. 2021, 12, 2373. [Google Scholar] [CrossRef]
- Stafstrom, J.A.; Menda, G.; Nitzany, E.I.; Hebets, E.A.; Hoy, R.R. Ogre-Faced, Net-Casting Spiders Use Auditory Cues to Detect Airborne Prey. Curr. Biol. 2020, 30, 5033–5039.e3. [Google Scholar] [CrossRef]
- Rubin, N. Figure and ground in the brain. Nat. Neurosci. 2001, 4, 857–858. [Google Scholar] [CrossRef] [PubMed]
- Baylis, G.C.; Driver, J. Shape-coding in IT cells generalizes over contrast and mirror reversal, but not figure-ground reversal. Nat. Neurosci. 2001, 4, 937–942. [Google Scholar] [CrossRef] [PubMed]
- Bateson, G. Form Substance and Difference. Essent. Read. Biosemiotics 1970, 72, 90–104. [Google Scholar]
- Darwin, C. On the Origin of Species: By Means of Natural Selection, or The Preservation of Favoured Races in the Struggle for Life; John Murray: London, UK, 1859. [Google Scholar]
- Von Bertalanffy, L. The history and status of general systems theory. Acad. Manag. J. 1972, 15, 407–426. [Google Scholar]
- Rittel, H.W.J.; Webber, M.M. Dilemmas in a general theory of planning. Policy Sci. 1973, 4, 155–169. [Google Scholar] [CrossRef]
- Marchal, J.H. On the Concept of a System. Philos. Sci. 1975, 42, 448–468. [Google Scholar] [CrossRef]
- Goguen, J.A.; Varela, F.J. Systems And Distinctions: Duality And Complementarity. Int. J. Gen. Syst. 1979, 5, 31–43. [Google Scholar] [CrossRef]
- Ivan, M.; Kondo, K.; Yang, H.; Kim, W.; Valiando, J.; Ohh, M.; Salic, A.; Asara, J.M.; Lane, W.S.; Kaelin, W.G., Jr. HIFa Targeted for VHL-Mediated Destruction by Proline Hydroxylation: Implications for O Sensing. Science 2001, 292, 464–468. [Google Scholar] [CrossRef]
- Chen, P.; Fan, D.; Zhang, Y.; Selloni, A.; Carter, E.A.; Arnold, C.B.; Dankworth, D.C.; Rucker, S.P.; Chelikowsky, J.R.; Yao, N. Breaking a dative bond with mechanical forces. Nat. Commun. 2021, 12, 5635. [Google Scholar] [CrossRef]
- Wadhams, G.H.; Armitage, J.P. Making sense of it all: Bacterial chemotaxis. Nat. Rev. Mol. Cell Biol. 2004, 5, 1024–1037. [Google Scholar] [CrossRef] [PubMed]
- Janetopoulos, C.; Firtel, R.A. Directional sensing during chemotaxis. FEBS Lett. 2008, 582, 2075–2085. [Google Scholar] [CrossRef] [PubMed]
- Ikeya, N.; Woodward, J.R. Cellular autofluorescence is magnetic field sensitive. Proc. Natl. Acad. Sci. USA 2021, 118, e2018043118. [Google Scholar] [CrossRef] [PubMed]
- Förster, D.; Helmbrecht, T.O.; Mearns, D.S.; Jordan, L.; Mokayes, N.; Baier, H. Retinotectal circuitry of larval zebrafish is adapted to detection and pursuit of prey. Elife 2020, 9, e58596. [Google Scholar] [CrossRef]
- De Corte, B.J.; Navarro, V.M.; Wasserman, E.A. Non-cortical magnitude coding of space and time by pigeons. Curr. Biol. 2017, 27, R1264–R1265. [Google Scholar] [CrossRef]
- Schnell, A.K.; Loconsole, M.; Garcia-Pelegrin, E.; Wilkins, C.; Clayton, N.S. Jays are sensitive to cognitive illusions. R. Soc. Open Sci. 2021, 8, 202358. [Google Scholar] [CrossRef]
- Giannoni-Guzmán, M.A.; Rivera, E.; Aleman-Rios, J.; Melendez Moreno, A.M.; Ramos, M.P.; Pérez-Claudio, E.; Loubriel, D.; Moore, D.; Giray, T.; Agosto-Rivera, J.L. The Role of Colony Temperature in the Entrainment of Circadian Rhythms of Honey Bee Foragers. Ann. Entomol. Soc. Am. 2021, 114, 596–605. [Google Scholar] [CrossRef]
- Mareschal, D.; Quinn, P.C. Categorization in infancy. Trends Cogn. Sci. 2001, 5, 443–450. [Google Scholar] [CrossRef]
- Ashby, F.G.; Ell, S.W.; Waldron, E.M. Procedural learning in perceptual categorization. Mem. Cognit. 2003, 31, 1114–1125. [Google Scholar] [CrossRef]
- Sloutsky, V.M. The role of similarity in the development of categorization. Trends Cogn. Sci. 2003, 7, 246–251. [Google Scholar] [CrossRef]
- Lewis, M.; Balamurugan, A.; Zheng, B.; Lupyan, G. Characterizing Variability in Shared Meaning through Millions of Sketches. In Proceedings of the Annual Meeting of the Cognitive Science Society, Vienna, Austria, 26–29 July 2021; University of California: San Diego, CA, USA, 2021; Volume 43. [Google Scholar]
- Lewandowsky, S.; Roberts, L.; Yang, L.X. Knowledge partitioning in categorization: Boundary conditions. Mem. Cognit. 2006, 34, 1676–1688. [Google Scholar] [CrossRef] [PubMed]
- Sperry, R.W. Cerebral Organization and Behavior: The split brain behaves in many respects like two separate brains, providing new research possibilities. Science 1961, 133, 1749–1757. [Google Scholar] [CrossRef] [PubMed]
- Lupyan, G. The conceptual grouping effect: Categories matter (and named categories matter more). Cognition 2008, 108, 566–577. [Google Scholar] [CrossRef] [PubMed]
- Van Dijk, J.; Kerkhofs, R.; van Rooij, I.; Haselager, P. Special Section: Can There Be Such a Thing as Embodied Embedded Cognitive Neuroscience? Theory Psychol. 2008, 18, 297–316. [Google Scholar] [CrossRef]
- Mahon, B.Z.; Caramazza, A. Concepts and categories: A cognitive neuropsychological perspective. Annu. Rev. Psychol. 2009, 60, 27–51. [Google Scholar] [CrossRef] [PubMed]
- Cira, N.J.; Benusiglio, A.; Prakash, M. Vapour-mediated sensing and motility in two-component droplets. Nature 2015, 519, 446–450. [Google Scholar] [CrossRef]
- Tweedy, L.; Thomason, P.A.; Paschke, P.I.; Martin, K.; Machesky, L.M.; Zagnoni, M.; Insall, R.H. Seeing around corners: Cells solve mazes and respond at a distance using attractant breakdown. Science 2020, 369, eaay9792. [Google Scholar] [CrossRef]
- Blackiston, D.; Lederer, E.; Kriegman, S.; Garnier, S.; Bongard, J.; Levin, M. A cellular platform for the development of synthetic living machines. Sci Robot 2021, 6, eabf1571. [Google Scholar] [CrossRef]
- Tarrant, M.; Calitri, R.; Weston, D. Social identification structures the effects of perspective taking. Psychol. Sci. 2012, 23, 973–978. [Google Scholar] [CrossRef]
- Takaoka, A.; Maeda, T.; Hori, Y.; Fujita, K. Do dogs follow behavioral cues from an unreliable human? Anim. Cogn. 2015, 18, 475–483. [Google Scholar] [CrossRef]
- Havy, M.; Waxman, S.R. Naming influences 9-month-olds’ identification of discrete categories along a perceptual continuum. Cognition 2016, 156, 41–51. [Google Scholar] [CrossRef] [PubMed]
- Mischel, W.; Ebbesen, E.B. Attention in delay of gratification. J. Pers. Soc. Psychol. 1970, 16, 329–337. [Google Scholar] [CrossRef]
- Schnell, A.K.; Boeckle, M.; Rivera, M.; Clayton, N.S.; Hanlon, R.T. Cuttlefish exert self-control in a delay of gratification task. Proc. Biol. Sci. 2021, 288, 20203161. [Google Scholar] [CrossRef] [PubMed]
- Boisseau, R.P.; Vogel, D.; Dussutour, A. Habituation in non-neural organisms: Evidence from slime moulds. Proc. Biol. Sci. 2016, 283, 20160446. [Google Scholar] [CrossRef] [PubMed]
- Cabrera, D. Systems Thinking; Cornell University: Ithaca, NY, USA, 2006. [Google Scholar]
- Cabrera, D.; Cabrera, L.; Lobdell, C. Systems Thinking. J. Eval. Program Plan. 2008, 31, 299–310. [Google Scholar] [CrossRef]
- Cabrera, D.; Cabrera, L. DSRP Theory: A Primer. Systems 2022, 10, 26. [Google Scholar] [CrossRef]
- Cabrera, D.; Cabrera, L. Complexity and Systems Thinking Models in Education: Applications for Leaders. In Learning, Design, and Technology: An International Compendium of Theory, Research, Practice, and Policy; Spector, M.J., Lockee, B.B., Childress, M.D., Eds.; Springer International Publishing: Cham, Switzerland, 2019; pp. 1–29. [Google Scholar]
- Cabrera, D.; Cabrera, L. What Is Systems Thinking? In Learning, Design, and Technology: An International Compendium of Theory, Research, Practice, and Policy; Spector, M.J., Lockee, B.B., Childress, M.D., Eds.; Springer International Publishing: Cham, Switzerland, 2019; pp. 1–28. [Google Scholar]
- Cabrera, L.; Cabrera, D. The Simple Rules of Complex Networks: Heuristics for Structural Predictions. In The Routledge Handbook for Systems Thinking; Cabrera, L., Cabrera, D., Midgley, G., Eds.; Routledge Press: London, UK, 2022. [Google Scholar]
- Cabrera, D.; Cabrera, L. Distinctions, Systems, Relationships, and Perspectives (DSRP): A Theory of Thinking and of Things. J. Eval. Program Plan. 2008, 31, 311–317. [Google Scholar] [CrossRef]
- Cabrera, D.; Cabrera, L.; Midgley, G. The Four Waves of Systems Thinking. In The Routledge Handbook for Systems Thinking; Cabrera, D., Cabrera, L., Midgley, G., Eds.; Routledge Press: London, UK, 2022. [Google Scholar]
- Cabrera, D.; Cabrera, L.; Cabrera, E. A Literature Review of the Universal Patterns and Atomic Elements of Complex Cognition. In The Handbook of Systems Thinking; Cabrera, D., Cabrera, L., Midgley, G., Eds.; Routledge: London, UK, 2022. [Google Scholar]
- Cabrera, L.; Sokolow, J.; Cabrera, D. Developing and Validating a Measurement of Systems Thinking: The Systems Thinking and Metacognitive Inventory (STMI). In The Routledge Handbook for Systems Thinking; Cabrera, L., Cabrera, D., Midgley, G., Eds.; Routledge Press: London, UK, 2022. [Google Scholar]
- Cabrera, D.; Cabrera, L.; Cabrera, E. The ’Fish Tank’ Experiments: Metacognitive awareness of DSRP significantly increases cognitive complexity. Systems 2022, 10, 29. [Google Scholar] [CrossRef]
- Cabrera, D.; Cabrera, L.; Cabrera, E. Perspectives Organize Information in Mind and Nature: Empirical Findings of Point-View Perspective (P) in Cognitive and Material Complexity. Systems, 2022; submitted. [Google Scholar]
- Cabrera, D.; Cabrera, L.; Cabrera, E. Relationships Organize Information in Mind and Nature: Empirical Findings of Action-Reaction Relationships (R) in Cognitive and Material Complexity. Systems, 2022; submitted. [Google Scholar]
- Cabrera, D.; Cabrera, L.; Cabrera, E. Systems Organize Information in Mind and Nature: Empirical Findings of Part-Whole Systems (S) in Cognitive and Material Complexity. Systems, 2022; submitted. [Google Scholar]
- Cabrera, D.; Cabrera, L.; Cabrera, E.; Hernandez, O.; Sukhbaatar, U.; Fuqua, K.B.; Collante, A.E.; Lemaiyan, E.; Warugongo, N.; Sekyere, A.; et al. The Origin of Ideas: Empirical Studies in Cognitive Complexity; Odyssean Press: Ithaca, NY, USA, 2021. [Google Scholar]
- Cabrera, D.; Cabrera, L.; Midgley, G. Routledge Handbook of Systems Thinking; Routledge: London, UK, 2021. [Google Scholar]
- Midgley, G.; Munlo, I.; Brown, M. The theory and practice of boundary critique: Developing housing services for older people. J. Oper. Res. Soc. 1998, 49, 467–478. [Google Scholar] [CrossRef]
- Cabrera, D.; Cabrera, L. Thinking at Every Desk: Four Simple Skills to Transform Your Classroom, 2nd ed.; Education Series; Norton Books: New York, NY, USA, 2011. [Google Scholar]
- Cabrera, D. Patterns of Knowledge: Knowledge as a Complex Adaptive System (CAS); Regis University: Denver, CO, USA, 2002. [Google Scholar]
- Cabrera, D. Remedial Genius: Think and Learn Like a Genius with the Five Principles of Knowledge; Project N Press: Loveland, CO, USA, 2000. [Google Scholar]
- Cabrera, D.; Cabrera, L. Thinking at Every Desk: Four Simple Skills to Transform Your Classroom, 1st ed.; Odyssean Press: Ithaca, NY, USA, 2008. [Google Scholar]
- Cabrera, D. Patterns of Knowledge: Knowledge as a Complex, Evolutionary System, an Educational Imperative; Solomon Press: New York, NY, USA, 2002. [Google Scholar]
- Cabrera, D. What is Systems Thinking? Cornell University: Ithaca, NY, USA, 2005. [Google Scholar]
- Available online: https://bridget-edwards.com/namaste-and-sawubona-a-zulu-greeting/ (accessed on 17 March 2022).
- Cabrera, D.; Cabrera, L. Plectica; Software for Visual Systems Mapping; Plectica: New York, NY, USA, 2016. [Google Scholar]
- Cabrera, E.; Cabrera, D.; Cabrera, L. The Efficacy of Systems Mapping. J. Syst. Think. 2021, 11, 21. [Google Scholar]
- Cabrera, E.; Cabrera, D.; Cabrera, L. The ‘Fish Tank’ Experiments: Metacognitive awareness significantly increases cognitive complexity. J. Syst. Think. 2021, 10, 21. [Google Scholar]
- Kruger, J.; Dunning, D. Unskilled and unaware of it: How difficulties in recognizing one’s own incompetence lead to inflated self-assessments. J. Pers. Soc. Psychol. 1999, 77, 1121–1134. [Google Scholar] [CrossRef] [PubMed]
- Lewis, M.L.; Frank, M.C. The length of words reflects their conceptual complexity. Cognition 2016, 153, 182–195. [Google Scholar] [CrossRef] [PubMed]


| Passage A | Passage B |
|---|---|
| Text text texty text textual text text texty text text text. Text text texty text textual text text texty text text text. Text text texty text textual text text texty text text text. | Text text texty text textual text text texty text text text. Text text texty text textual text text texty text text text. Text text texty text textual text text texty text text text. |
| During a stressful time for the country, it would be good if the president rose to the occasion and showed some class. | During a stressful time for the country, it would be good for the president to show some class and place a hlblue rose at the site of the travesty. |
| A Distinction is defined as identity co-implying other | |||
| An identity exists | An other exists | Identity co-implies other | A distinction exists |
| i | o | ||
 | Any identity–other Distinction is also:
|
| Mind (cognitive complexity) | Existential (Basic Research) | Efficacy (Applied Research) |
| Does DSRP exist in the mind? (i.e., does DSRP exist as universal, material, observable cognitive phenomena?) | Is metacognitive awareness of DSRP effective? (i.e., Does it increase ability to align cognitive complexity to real-world complexity? (a.k.a., parallelism) | |
| Nature (ontological complexity) | Does DSRP exist in nature? (i.e., does DSRP exist as universal, material, observable phenomena?) | |
| EMPIRICAL BASIS | ||
 |  |  |  |  |
|---|---|---|---|---|
| Set | A1 | B1 | A2 | B2 |
| 1: Identity [named] | Click/name object | |||
| Click/name whitespace | ||||
| 2: Other [negated] | Click/name Not-object | |||
| Click/name Not-whitespace |
| Null Hypotheses | Alternative Hypotheses |
|---|---|
| Item | Number | Percentage |
|---|---|---|
| Clicked on not-object | 195 | 52.13% |
| Clicked on object | 179 | 47.86% |
| Named the not-object | 197 | 52.60% |
| Named the object | 164 | 43.85% |
| Stats: M = 0.52, SD = 0.50, N = 374, CI = 98% | ||
| Item | Number | Percentage |
|---|---|---|
| Clicked on whitespace | 312 | 83.42% |
| Clicked on object | 62 | 16.57% |
| Named the whitespace | 308 | 82.35% |
| Named the object | 66 | 17.64% |
| Stats: M = 0.83, SD = 0.37, N = 374, CI = 99% | ||
| Item | Number | Percentage |
|---|---|---|
| Clicked on not-whitespace (object) | 335 | 89.57% |
| Clicked on whitespace | 39 | 10.43% |
| Named non-whitespace (object) | 329 | 87.96% |
| Named whitespace | 32 | 8.55% |
| Stats: M = 0.90, SD = 0.31, N = 374, CI = 99% | ||
 |  |  |  |  |
| Task/Action | Click/Name Object (O) | Click/Name not-Whitespace (NW) | Click/Name Whitespace (W) | Click/Name Not-Object (NO) |
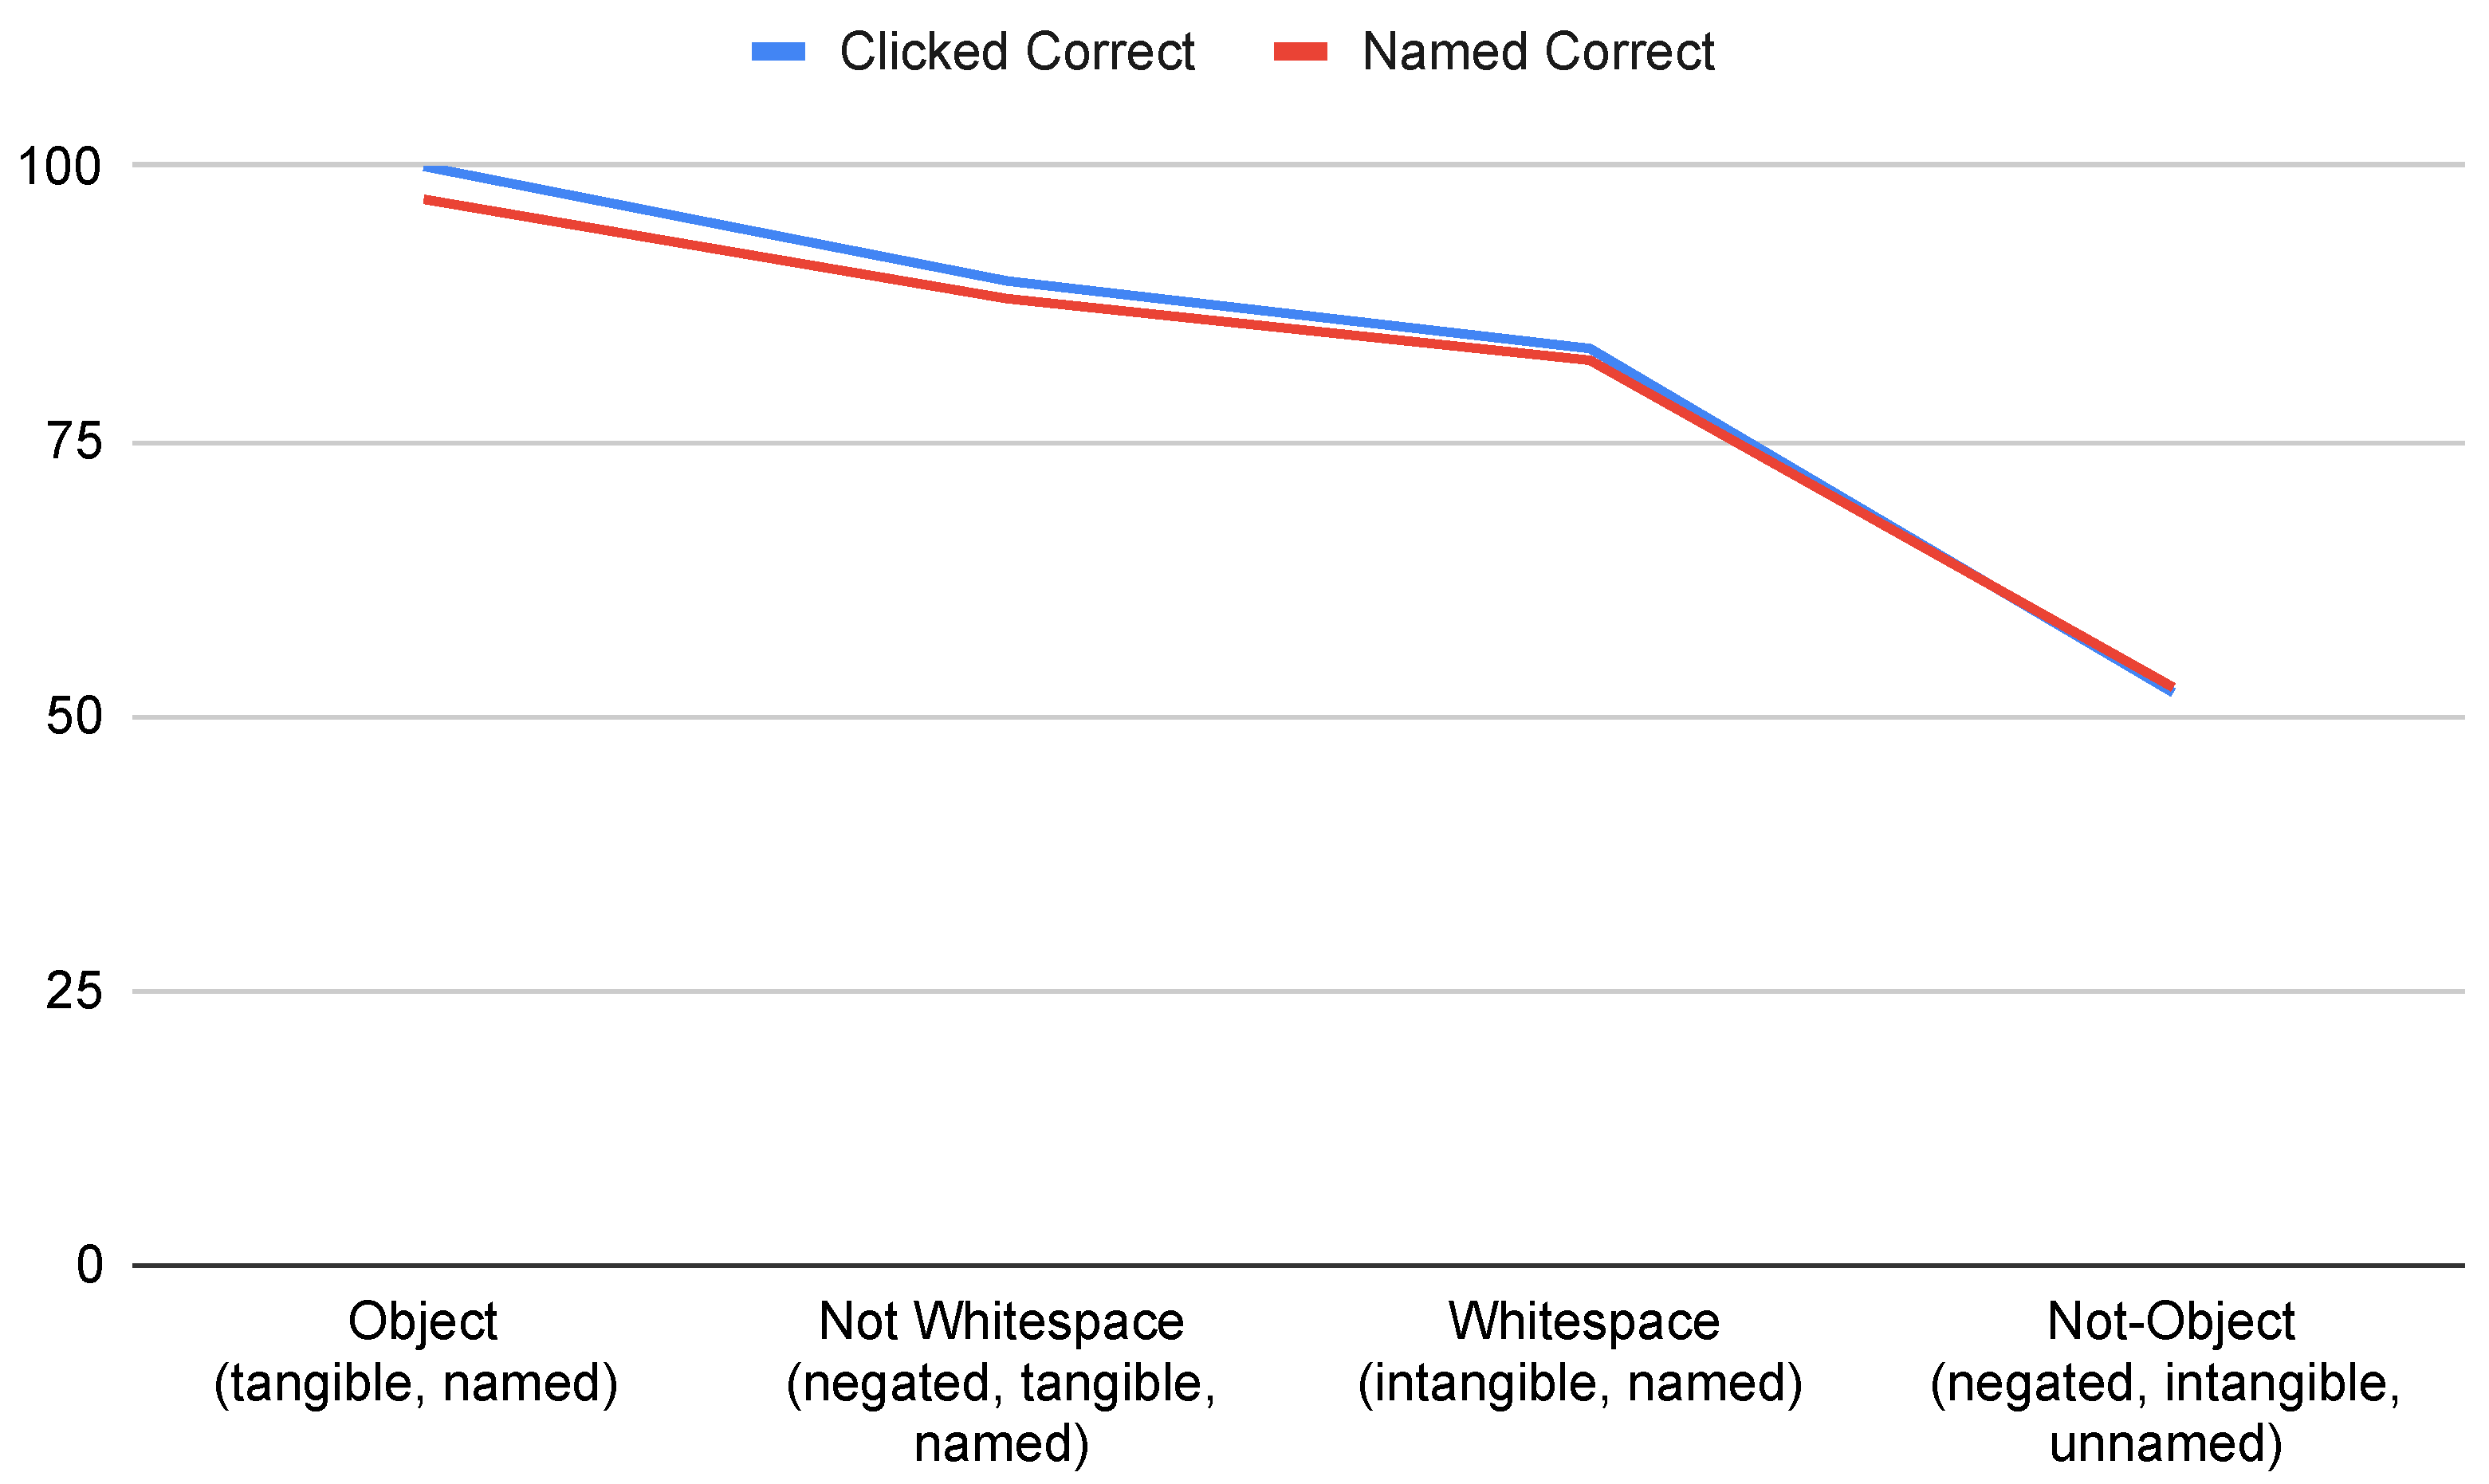
| Clicked correct | 100% O | 89.57% NW | 83.42% W | 52.13% NO |
| Clicked incorrect | 0% NO | 10.43% W | 16.57% O | 47.86% O |
| Named correct | 97% O | 87.96% NW | 82.35% W | 52.60% NO |
| Named incorrect | 3% NO | 8.55% W | 17.64% O | 43.85% O |
| Stats | M = 1.00 | M = 0.90 | M = 0.83 | M = 0.52 |
| SD = 0.00 | SD = 0.31 | SD = 0.37 | SD = 0.50 | |
| N = 374 | N = 374 | N = 374 | N = 374 | |
| CI = 99% | CI = 99% | CI = 99% | CI = 98% |
| Incorrect | Correct | p | |
|---|---|---|---|
| object | N = 374 | ||
| Diamond/rhombus | 8 (2.14%) | ||
| Other | 34 (9.09%) | ||
| Parts of a cube | 25 (6.68%) | ||
| Square/cube/box | 307 (82.1%) | ||
| Not-object | N = 179 | N = 195 | <0.001 |
| Description of background | 1 (0.56%) | 95 (48.7%) | |
| Description of object | 140 (78.2%) | 0 (0.00%) | |
| No answer | 6 (3.35%) | 9 (4.62%) | |
| Not-object | 1 (0.56%) | 49 (25.1%) | |
| Nothing/blank | 7 (3.91%) | 36 (18.5%) | |
| Other | 24 (13.4%) | 6 (3.08%) | |
| White space | N = 62 | N = 312 | <0.001 |
| Description of background | 0 (0.00%) | 254 (81.4%) | |
| Description of object | 38 (61.3%) | 0 (0.00%) | |
| No Answer | 5 (8.06%) | 6 (1.92%) | |
| Nothing/blank | 2 (3.23%) | 30 (9.62%) | |
| Other | 17 (27.4%) | 22 (7.05%) | |
| Non-whitespace | N = 40 | N = 334 | |
| Description of background | 14 (35.0%) | 1 (0.30%) | |
| Description of object | 2 (5.00%) | 253 (75.7%) | |
| No answer | 1 (2.50%) | 12 (3.59%) | |
| Non-whitespace | 7 (17.5%) | 31 (9.28%) | |
| Nothing/blank | 8 (20.0%) | 2 (0.60%) | |
| Other | 8 (20.0%) | 35 (10.5%) |
| Null Hypothesis | Adjusted p |
|---|---|
| object ↔ not-object = 0 | <0.001 |
| object ↔ whitespace = 0 | <0.001 |
| object ↔ non-whitespace = 0 | <0.001 |
| not-object ↔ whitespace = 0 | <0.001 |
| not-object ↔ non-whitespace = 0 | <0.001 |
| whitespace ↔ non-whitespace = 0 | 0.03 |
| Null Hypotheses | Alternative Hypotheses | |
|---|---|---|
| Top 8 Unique Responses | Number | Percentage |
|---|---|---|
| Two of something (e.g., pairs, two, 2, etc.) | 129 | 34.49% |
| Body Part | 90 | 24.06% |
| Inkblot/Rorschach test | 29 | 7.75% |
| Stingray | 17 | 4.54% |
| Crab | 16 | 4.27% |
| Elf/gnome/clown | 14 | 3.74% |
| Bug/arachnid | 9 | 2.40% |
| Turtle | 8 | 2.13% |
| Pairwise Comparison | p |
|---|---|
| Animal − Other = 0 | <0.001 |
| Animal − Person = 0 | <0.001 |
| Animal − Thing = 0 | <0.001 |
| Other − Person = 0 | <0.001 |
| Other − Thing = 0 | <0.001 |
| Person − Thing = 0 | <0.001 |
| Bug | Crab | Elf | Inkblot | Interesting | Stingray | Turtle | Two of Something | |
|---|---|---|---|---|---|---|---|---|
| Body part | <0.0001 | <0.0001 | <0.0001 | <0.0001 | <0.0001 | <0.0001 | <0.0001 | 0.0038 |
| Bug | 0.2303 | 0.3772 | 0.0036 | 0.71 | 0.1742 | 0.8294 | <0.0001 | |
| Crab | 0.7513 | 0.0876 | 0.4094 | 0.8587 | 0.1621 | <0.0001 | ||
| Elf | 0.0398 | 0.6302 | 0.6554 | 0.2768 | <0.0001 | |||
| Inkblot | 0.0097 | 0.1204 | 0.0022 | <0.0001 | ||||
| Interesting | 0.3352 | 0.5851 | <0.0001 | |||||
| Stingray | 0.1204 | <0.0001 | ||||||
| Turtle | <0.0001 |
 |  |  | |
|---|---|---|---|
| % Correct * | Dog | Tree | Burger |
| Dog | 361 (96.52%) | ||
| Tree | 358 (95.72%) | ||
| Burger | 358 (95.72%) | ||
| Not a dog | 339 (90.64%) | 295 (78.88%) | |
| Not a tree | 327 (87.43%) | 310 (82.89%) | |
| Not a burger | 327 (87.43%) | 316 (84.49%) |
| [ALL] N = 360 | |||
|---|---|---|---|
| Dog | Not a dog | ||
| Dog (y): | 334 (96.5%) | N | 337 (97.4%) |
| Dog (n): | 316 (91.3%) | Y | 323 (93.4%) |
| Dog (n): | 319 (92.2%) | Y | 279 (80.6%) |
| Tree | Not a tree | ||
| Tree (n): | 324 (93.6%) | Y | 310 (89.6%) |
| Tree (y): | 331 (95.7%) | N | 332 (96.0%) |
| Tree (n): | 336 (97.1%) | Y | 294 (85.0%) |
| Burger | Not-burger | ||
| Burger (n): | 328 (94.8%) | Y | 311 (89.9%) |
| Burger (n): | 336 (97.1%) | Y | 300 (86.7%) |
| Burger (y): | 332 (96.0%) | N | 335 (96.8%) |
| Dog | p | |
|---|---|---|
| 21.291 | <0.001 | |
| 38.878 | <0.001 | |
| 32.432 | <0.001 |
| Dog | |
|---|---|
| Dog (y) − not a dog (y) = 0 | 0.05 |
| Dog (y) − not a dog (y) = 0 | <0.001 |
| Not a dog (y) − not a dog (y) = 0 | <0.001 |
| Tree | |
| Not a tree (y) − not a tree (y) = 0 | 0.07 |
| Not a tree (y) − tree (y) = 0 | <0.001 |
| Not a tree (y) − tree (y) = 0 | <0.001 |
| Burger | |
| Burger (y) − not a burger (y) = 0 | <0.001 |
| Burger (y) − not a burger (y) = 0 | <0.001 |
| Not a burger (y) − not a burger (y) = 0 | 0.23 |
| Shape | Identified/Named | N (%) |
|---|---|---|
| ◼ “Square” (box, cube, etc.) | No | 16 (4.28%) |
| Yes | 358 (95.7%) | |
| ▼ “Triangle” (pyramid, etc.) | No | 19 (5.08%) |
| Yes | 355 (94.9%) | |
| ● “Circle” (round, sphere, etc.) | No | 25 (6.68%) |
| Yes | 349 (93.3%) |
| Shape | N (%) | p |
|---|---|---|
| Square: | 40.595 | <0.001 |
| Circle: | 62.893 | <0.001 |
| Triangle | 122.07 | <0.001 |
| “Square” (box, cube, etc.) | 343 | 91.71% |
| Description of image (black, dark, etc.) | 18 | 4.81% |
| Other (hole, nick, etc.) | 13 | 3.47% |
| “Triangle” | 350 | 93.58% |
| Description of image (black, inverted, etc.) | 7 | 4.54% |
| Other (rectangle, corner, etc.) | 17 | 1.87% |
| “Circle” (round, sphere, etc.) | 358 | 95.72% |
| Description of image (black) | 2 | 0.53% |
| Other (yes, goal, etc.) | 14 | 3.74% |
| Clicked on Not-Square | Clicked on Not-Triangle | Clicked on Not-Circle |
|---|---|---|
 |  |  |
| 92.24% | 93.58% | 94.38% |
| M = 0.92 | M = 0.94 | M = 0.94 |
| SD = 0.27 | SD = 0.28 | SD = 0.30 |
| N = 374 | N= 374 | N= 374 |
| CI = 99% | CI = 99% | CI = 99% |
| Pairwise Comparisons | N (%) | p |
|---|---|---|
| Correctly respond to “square” and “not-square” | 334 (89.3%) | <0.001 |
| Correctly respond “circle” and “not-circle” | 330 (88.2%) | <0.001 |
| Correctly respond to “triangle” and “not-triangle” | 326 (87.2%) | <0.001 |
| Percentages | Action taken | Number |
|---|---|---|
| 48% (N = 16,516) | distinguished nothing (i.e., did not think) | 0 times |
| 52% (N = 17,882) | distinguished things | 2,066,654 times |
| of those 48% | broke down their distinctions into parts | 769,120 times |
| of those 46% | related things | 565,999 times |
| of those 25% | distinguished their relationships | 87,318 times |
| of those 16% | took at least one perspective | 39,398 times |
| of those 4% | distinguished their perspective taking | 16,668 times |
| What People Tend to Do | What People Tend Not to Do |
|---|---|
| Make identities () | Rarely consider the other () |
| Rarely challenge or validate the identities () they make | |
| Make part–whole systems () | Rarely challenge the way (or consider alternative ways) that parts are organized into wholes () |
| Rarely think and from the level they are thinking about ( or ) | |
| Rarely relate the parts of the whole () | |
| Occasionally relate things (R) | Almost never distinguish their relationships () or zoom into them and add parts () |
| Sometimes look for the direct cause (R), but rarely think in webs of causality (S of Rs) | |
| Take only their own perspective (P) (implicitly) | Almost never take explicit perspectives () |
| Rarely take multiple perspectives () | |
| Rarely take conceptual perspectives () |
Things to consider from the identity–other distinction rule (D):
|
| PreD | PostD | Difference | |
|---|---|---|---|
| Number of characters (including spaces) | 17,691 | 24,308 | +27.22% |
| Number of characters (without spaces) | 10,291 | 14,752 | +30.24% |
| Number of words (including repeated words) | 2098 | 3071 | +31.68% |
| Number of syllables (including repeated words) | 3246 | 4558 | +28.78% |
| Unique words | 251 | 453 | +44.59% |
| Number of characters (no spaces) for unique words | 1418 | 2626 | +46.00% |
| Number of syllables for unique words | 492 | 901 | +45.39% |
| Total unique word occurrence | 1832 | 2680 | +31.64% |
 |  |
| Pre | Post | P.overall | |
|---|---|---|---|
| No. concepts | 3.00 [1.00; 4.00] | 3.00 [1.00; 4.00] | 0.062 |
| No. words | 4.00 [3.00; 7.00] | 6.00 [3.00; 10.0] | <0.001 |
| No. characters | 21.0 [13.0; 36.0] | 29.0 [14.0; 53.0] | <0.001 |
| Clicked on Not-Square | Clicked on Not-Triangle | Clicked on Not-Circle |
|---|---|---|
 |  |  |
| Conclusions | Summary |
|---|---|
| Globally and universally, identity–other distinctions exist. | exists. |
| Contrary to prevailing belief, things are defined not solely by their essence or accepted definitions, but also in relation to the other things they are with. | is relative. |
| Distinctions are made at the individual and collective level. | is universal. |
| At the individual level, people make a diversity of distinctions, collectively, they see things similarly. | In a pool of difference, we distinguish similarly. |
| We use: different names for different things; different names for the same things; same names for different things; and same names for the same things. | Left implicit, D confuses, made explicit D clarifies. |
| Cognitively speaking, there is a parallel invisible universe of not-things, which provide the ‘ether’ | Negated identities matter. |
| Unstructured, people have a hard time getting their thinking started. | D-rule jump starts thinking. |
| Identity–other are both part–whole systems of ’is’s’ and ’is-not’s’. | D is S-dependent. |
| We also know that the other is an identity. | i and o are interchangeable. |
| The D-rule is dependent on S, R, and P rules, and S, R and P rules are dependent on the D-rule. | DSRP is massively parallel and fractal. |
| The more tangible and explicit things are, the easier it is for people to make identity–other distinctions. People miss things when they are not tangible/explicit, which is a lot. | Awareness of the D-rule decreases bias. |
| We know what people do and do not do, which could help us improve thinking. Namely: rarely consider the other; people rarely challenge existing distinctions; rarely validate. | Awareness of D-rule improves thinking. |
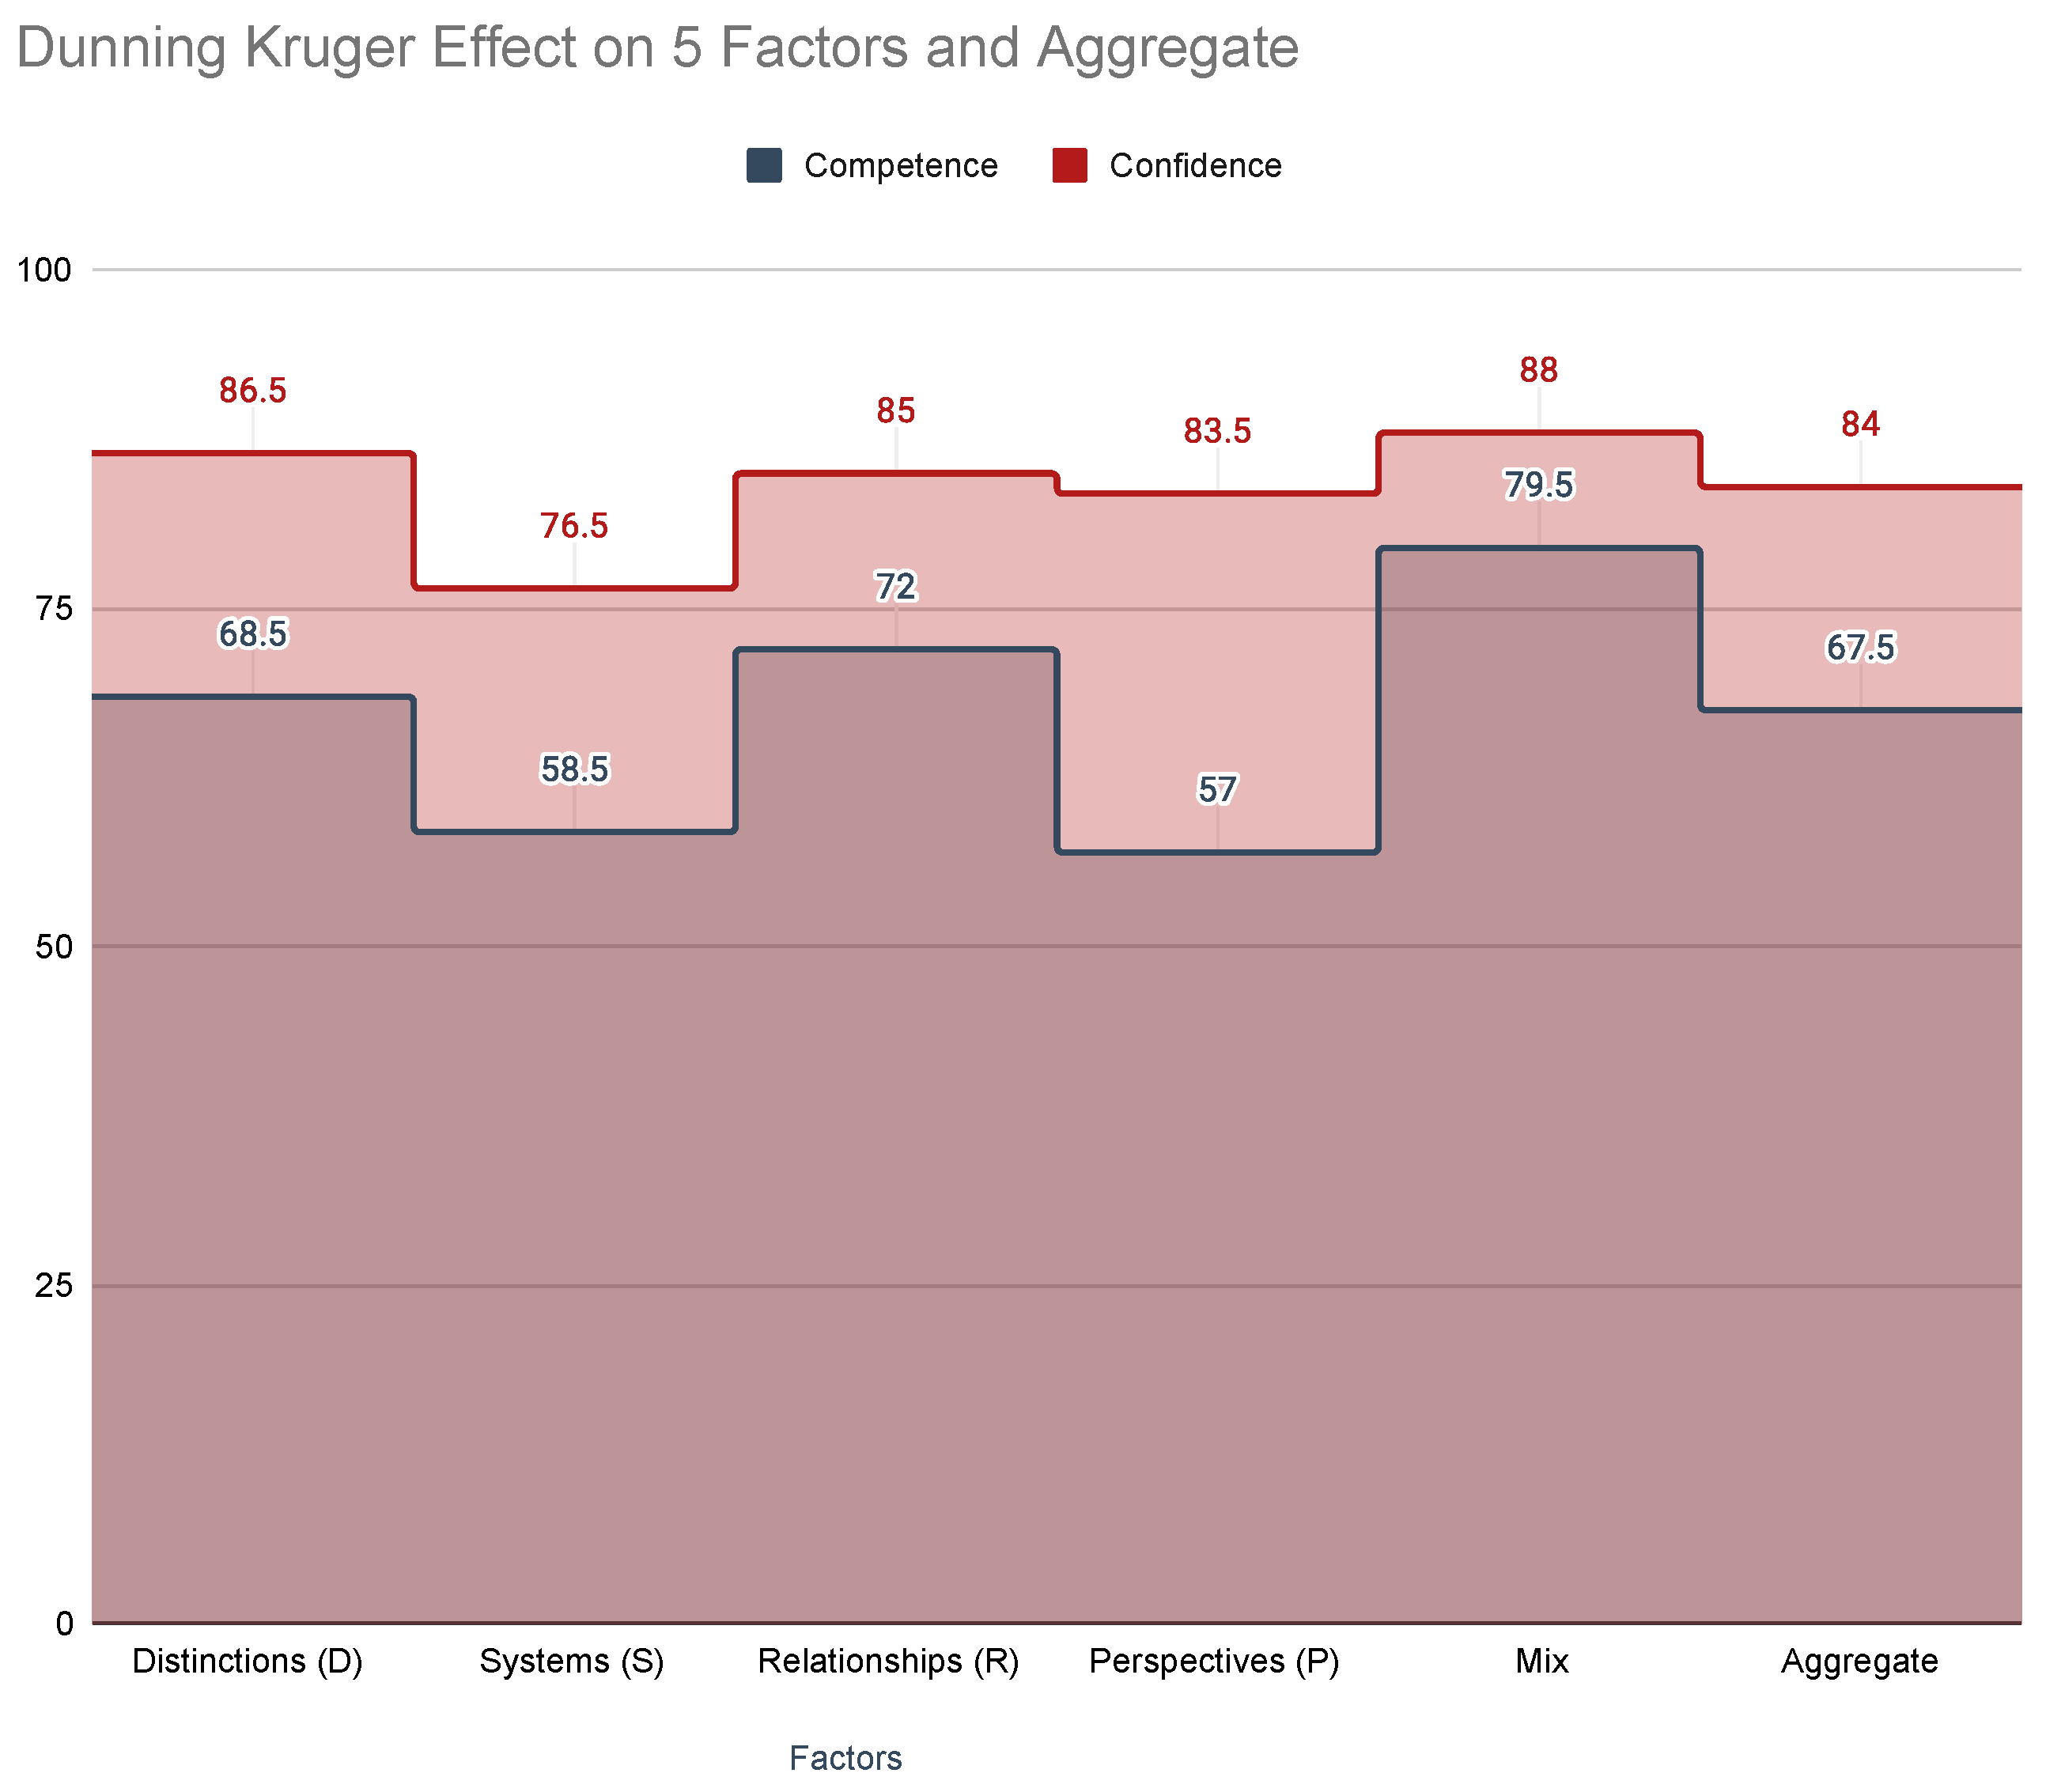
| People have greater confidence than competence in distinction making. | We are overconfident with |
| A relatively short treatment in the D-rule can dramatically affect cognitive ability and complexity. | The “D-rule” makes you smarter. |
Publisher’s Note: MDPI stays neutral with regard to jurisdictional claims in published maps and institutional affiliations. |
© 2022 by the authors. Licensee MDPI, Basel, Switzerland. This article is an open access article distributed under the terms and conditions of the Creative Commons Attribution (CC BY) license (https://creativecommons.org/licenses/by/4.0/).
Share and Cite
Cabrera, D.; Cabrera, L.; Cabrera, E. Distinctions Organize Information in Mind and Nature: Empirical Findings of Identity–Other Distinctions (D) in Cognitive and Material Complexity. Systems 2022, 10, 41. https://0-doi-org.brum.beds.ac.uk/10.3390/systems10020041
Cabrera D, Cabrera L, Cabrera E. Distinctions Organize Information in Mind and Nature: Empirical Findings of Identity–Other Distinctions (D) in Cognitive and Material Complexity. Systems. 2022; 10(2):41. https://0-doi-org.brum.beds.ac.uk/10.3390/systems10020041
Chicago/Turabian StyleCabrera, Derek, Laura Cabrera, and Elena Cabrera. 2022. "Distinctions Organize Information in Mind and Nature: Empirical Findings of Identity–Other Distinctions (D) in Cognitive and Material Complexity" Systems 10, no. 2: 41. https://0-doi-org.brum.beds.ac.uk/10.3390/systems10020041