1. Introduction: A Public Management Education Challenge
There is a new challenge facing public management education—to teach public managers to handle a broad range of novel situations characterized by complexity when dealing with an emerging class of problems that we dub “sustainable” public management problems. This paper first gives a quick overview of the current state of public management education, poses a preliminary multi-dimensional concept of complexity that encompasses both positivist and social constructionist view of complexity, and proposes a broad design for simulation-based learning environments (SBLEs) to teach in this complex domain. We next present an example of one such SBLE—the Pointe Claire Coastal Protection Case, a case focusing on the decisions of a fictional Regional Coastal Planning Commission on the Mississippi Coast faced with the dual threat of current storm damage from hurricanes such as those already hitting the coast (e.g., Katrina) as well as the future probable threats of enhanced damage due to global warming. Finally, the paper discusses how this SBLE was implemented in a first class on modeling methods in the core MPA program of the Rockefeller College of Public Affairs and Policy at the University at Albany, SUNY (the Rockefeller College, for short) and presents some instructor reflections on the effectiveness of the Pointe Claire Coastal Protection Case as a teaching method to enhance student competence to deal with dynamic problems in this complex domain. The paper concludes with thoughts about future research needed in this area.
Traditional Public Management Education and Complexity
The Current State of Public Management Education
Public management education relies heavily on traditional classroom learning which assumes that knowledge and skills needed for sustainable public management can be transferred from the instructor to the students through readings and lectures. As noted by Comfort and Wukich [
1], the majority of courses on crisis management currently offered in MPA programs are designed and managed based on this traditional teaching and learning approach. However, rapid change in public policy decision making environments, especially the increase in technical and social complexity, has expanded the set of qualities expected of public managers, and the ways to nurture these qualities in MPA programs. The U.S. National Association of Schools of Public Affairs and Administration (NASPAA) suggests higher education and training programs in public management, public policy, and public affairs programs pursue five competencies as the core qualities of successful public managers: the ability (1) to lead and manage in public governance; (2) to participate in and contribute to the policy process; (3) to analyze, synthesize, think critically, solve problems and make decisions; (4) to articulate and apply a public service perspective; and (5) to communicate and interact productively with a diverse and changing workforce and citizenry [
2]. However, the details of each competency are left to institutions that run education or training programs to define. Appendix A shows how the Rockefeller College has elaborated the NASPAA’s five core competencies. Among the five competencies, our SBLE example model mainly seeks to achieve the third competency, that is, the ability to analyze, synthesize, think critically, solve problems and make decisions.
A Proposal for Thinking about Complexity
Public managers and policy makers in the 21st century are required to manage complex systems whose boundaries spill over agency, jurisdictional, and sector boundaries. Within these systems uncertainty is commonplace. Ever since Lindblom [
3] first brought up complexity as a new topic, the literature has reviewed many features of such “wicked problems.” Although various approaches to conceptualizing complexity exist (e.g., complex adaptive systems, agent-based, soft-systems methodology, and many others cataloged by [
4]), little attention has been paid to methods and approaches for teaching and learning in and about complex systems in public management settings.
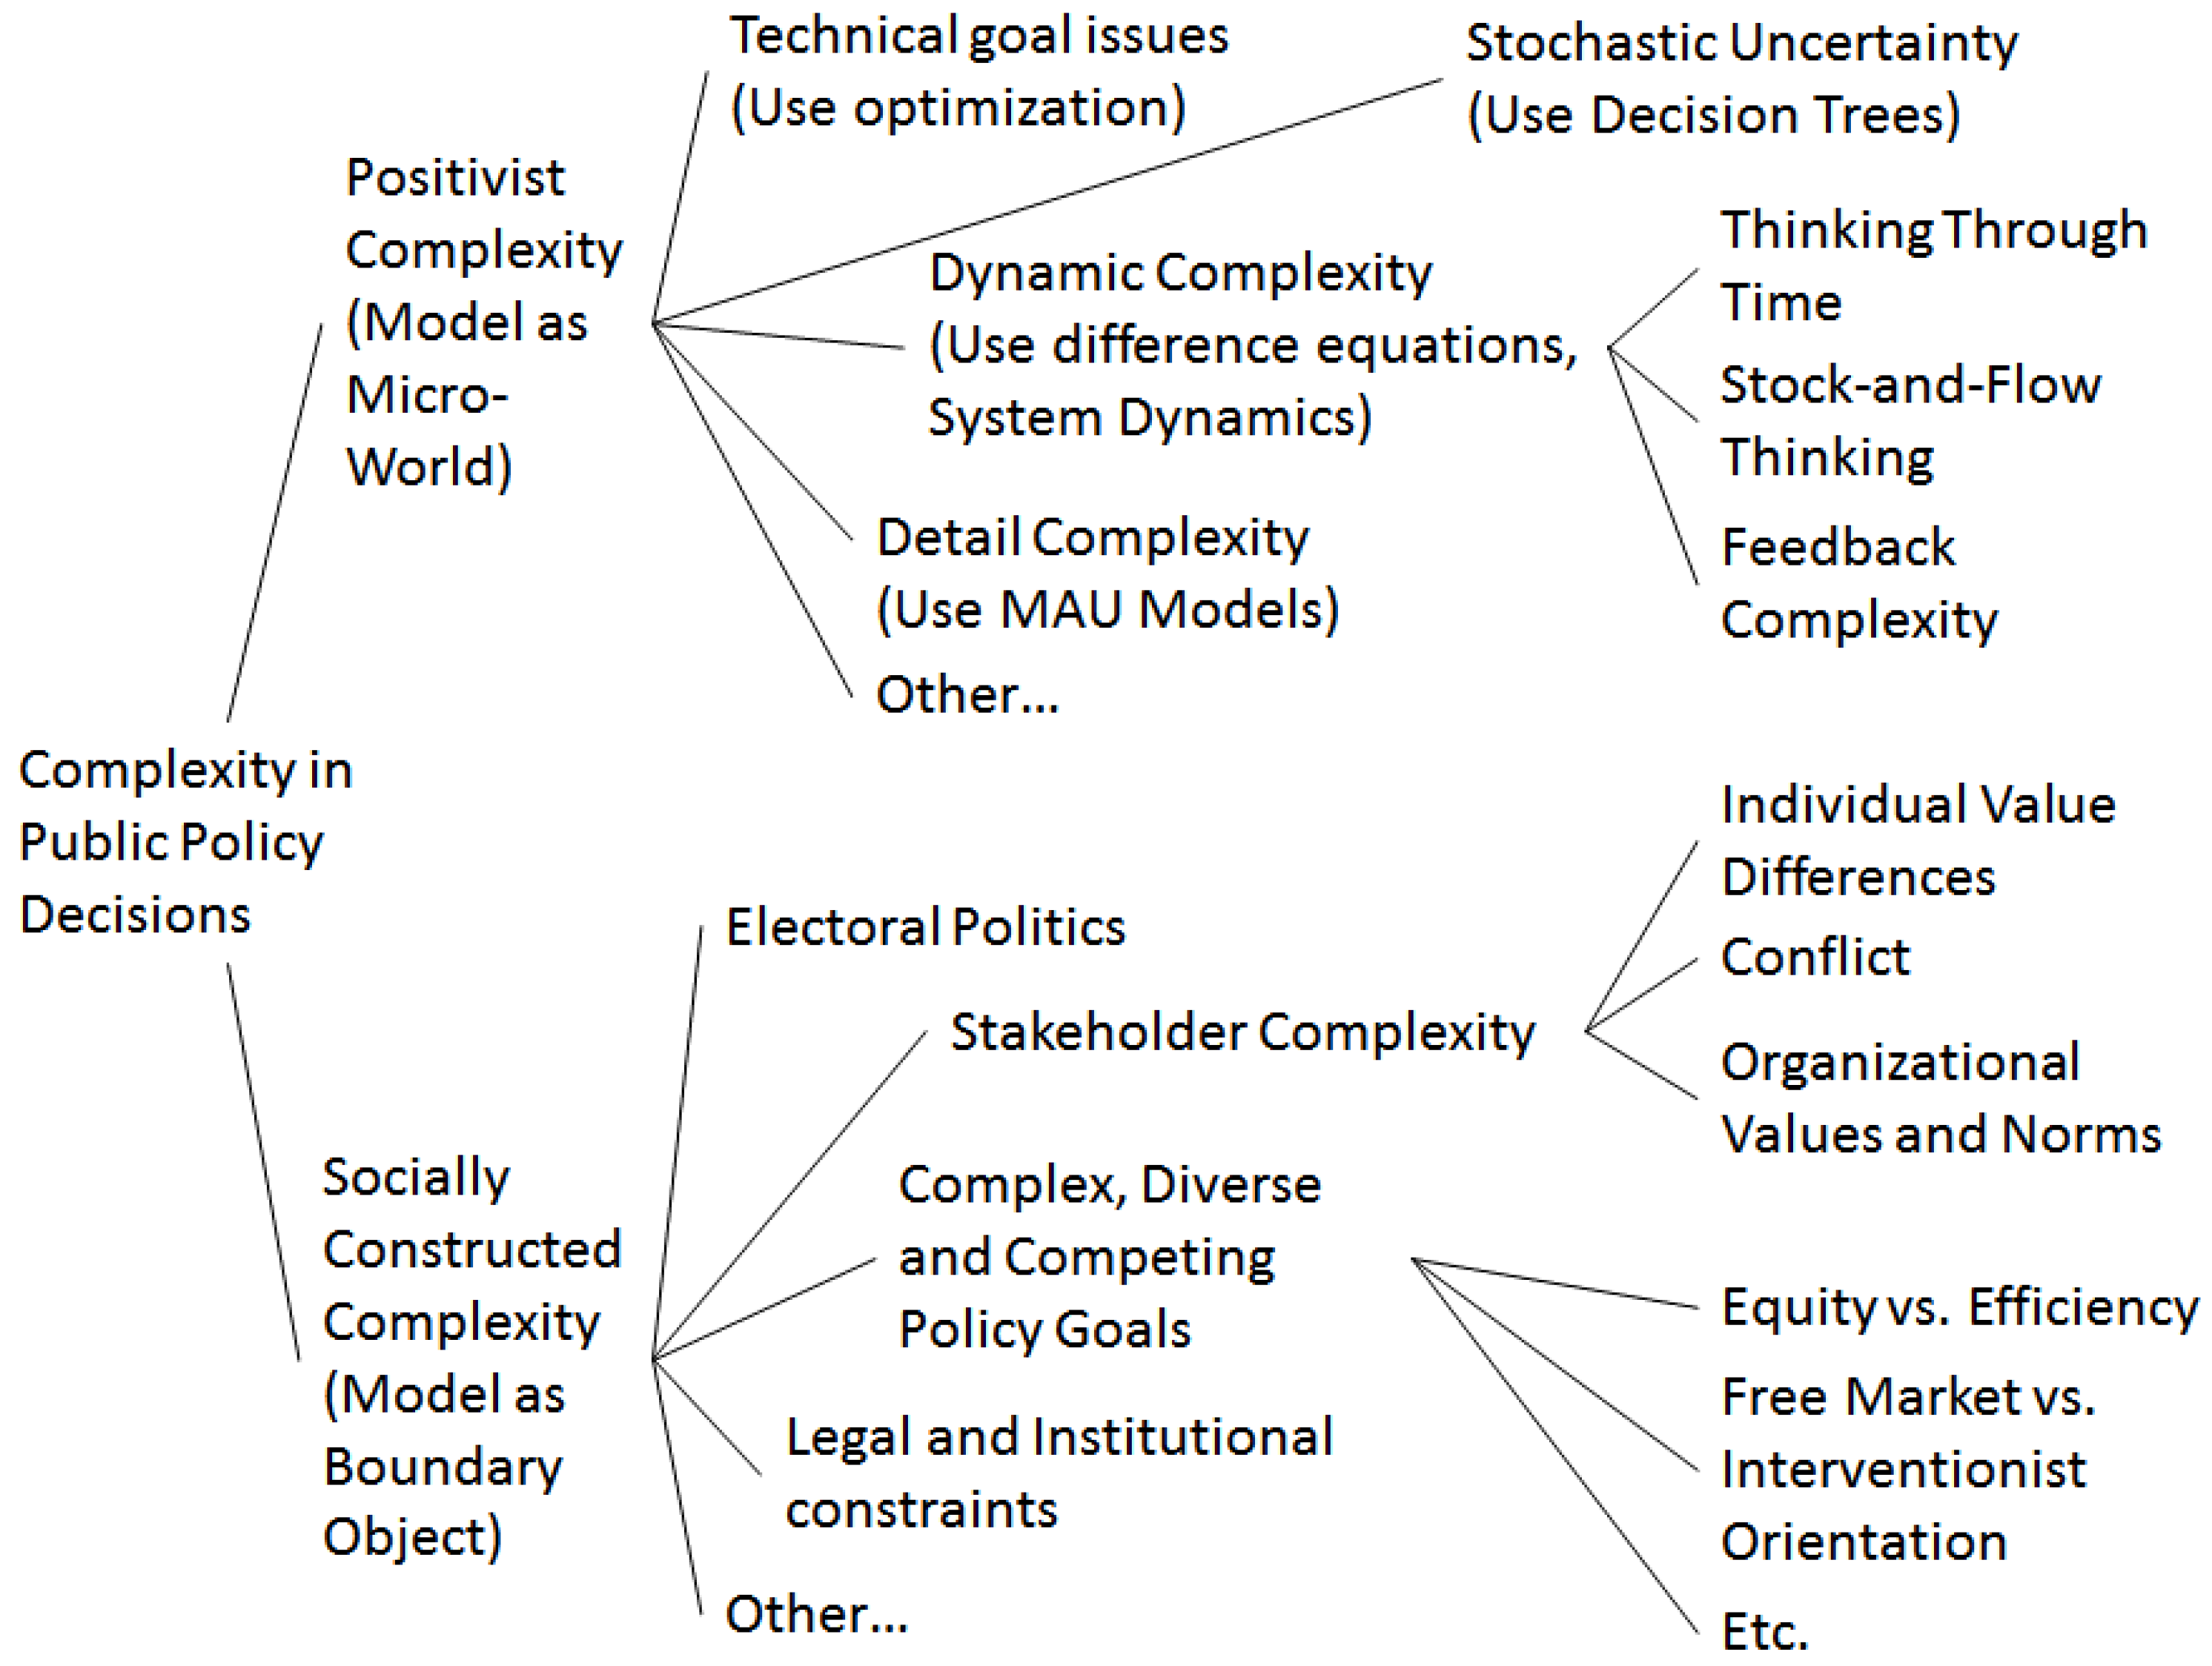
Here, we suggest a taxonomy of “complexity in public policy decisions” encompassing positivistic and interpretive features of systems complexity. This taxonomy, shown in
Figure 1, classifies the features of complexity in public management settings largely into two dimensions: (1)
positivistic complexity, which is a bundle of objectively observable and measureable features that make public policy problems difficult to manage (such as decision-making in the face of stochastic uncertainty or feedback complexity within complex systems models); and (2)
socially constructed complexity, an interpretive perspective which results from the diverse interactions of multiple stakeholders with often competing points of view, leading to intra-group, organizational, or political conflicts. The taxonomy includes suggested analysis methods for different kinds of positivist complexity in parentheses.
Figure 1.
A taxonomy of complexity in public policy decisions.
Figure 1.
A taxonomy of complexity in public policy decisions.
How This Paper Addresses Complexity in the Public Management Curriculum
In this paper, we address the question of how to teach complexity in public management curriculum by reporting on a curricular innovation—the introduction of a simulation-based learning environment—and reflect on the effectiveness of the approach. Simulation-based cases are widely used in business education, but are relatively new in public management education [
5]. We believe they offer significant advantages for public management education and should be more widely used. In particular, simulation-based cases allow the pairing of realistic scenarios with accessible technology for rapid experimentation. Simulations compress the time it takes to “experience” long-term effects of policy options and allow learners to experiment with different assumptions. Cases can be crafted to ensure that diverse stakeholders’ positions are patent and visible, while simulation tools can give students the opportunity to test the effects of diverse alternative interventions.
2. Development of the Simulation-Based Learning Environment
With the taxonomy shown in
Figure 1 in mind, we designed a simulation-based learning environment (SBLE) to help students understand how to manage multiple dimensions of complexity. A simulation-based learning environment is a package of materials and exercises designed around a simulation model. The goal of the SBLE is to help learners discover concepts in the process of experimenting with the simulation. The environment instantiates the “double-looping learning model” proposed by Sterman [
6] for teaching and learning about complexity. Kim
et al. [
7] have previously extended and applied this vision of double loop learning to applied projects in the public sector and Ghaffarzadegan and Andersen [
8] have applied similar concepts to developing theory about public safety. The two main branches in
Figure 1 reflect two quite different views of what role a model may play in public policy analysis. The top branch suggests that a model can be used as a “micro-world”: a representation of a particular policy environment with all its related types of system-level complexity to help managers (and students) explore and understand uncertainty and feedback complexity. The bottom branch of the diagram in
Figure 1 suggests that a good model can serve as a “boundary object” or as an artifact that can be used to support active dialogue and learning between involved stakeholders, helping them navigate socially constructed boundaries in the system. Black [
9] and Black and Andersen [
10] have provided a more complete elaboration of how formal models can serve as boundary objects in the policy process.
Exercises within the environment are typically scaffolded such that initial exercises provide learners with a high degree of guidance, then successive exercises provide progressively less external instruction and require greater learner autonomy [
11]. SBLEs can be designed for varying degrees of facilitation, ranging from stand-alone packages that require almost no live facilitation to exercises used in classroom settings with significant instructor involvement [
12]. Progressively removing scaffolding in a series of exercises promotes double-loop learning by building learning skills at the same time as it facilitates specific content learning. The exercises in this SBLE guide students to confront and examine different aspects of decision complexity. Following the double-loop model, participants are first guided to experience complexity, then reflect on their experience to make sense of it.
We modified a core Rockefeller College class in Data, Models, and Decisions to include an extended 10 week unit dealing with the efforts of a community on the Gulf Coast of the United States to manage coastal protection planning. The curricular unit was called the Pointe Claire Coastal Protection Planning Exercise and consisted of a variety of models drawn from standard topics in the class (decision trees, difference equations, and multi-attribute utility models), all dealing with coastal protection. All the exercises concerned the Pointe Claire Coastal Protection Case Study. The focus of the Pointe Claire case is community policy-making for protection against storm damage. Although Pointe Claire is a fictitious coastal town set on the US Gulf Coast, its issues are common among many real Gulf Coast communities. It is based on an actual planning project undertaken by the US Army Corps of Engineers on the Mississippi Coast, but is not calibrated to any specific place.
In addition to analytic exercises, students engaged in role-playing assignments where student teams analyzed the positions of various stakeholders within the community. Students wrote policy white papers to the Executive Director of the Coastal Planning Commission from the point of view of a newly hired executive assistant helping the Executive Director deal with the technical complexities of the coastal planning project (the Commission in the case study was working with the US Army Corps of Engineers) as well as differing perspectives of various stakeholders on the planning commission. As one part of the overall 10-week Planning Exercise, students worked with a system dynamics simulation model that depicts complex dynamic interactions involved in coastal protection.
The purpose of the Pointe Claire SBLE was two-fold: (1) In substantive terms, to teach students to use a complex simulation model as a tool to understand a multi-faceted set of interactions and come up with robust policy conclusions; and (2) In terms of the policy process, to teach students how to use complex models to help groups of public policy stakeholders come to agreement around policy goals. The SBLE was designed around the CoastalProtectSIM simulation model, which allows participants to explore the effect of policies under normally variable storm conditions as well as conditions expected under climate change. The complete learning environment consists of a system dynamics simulation model of the impact of storms on a typical coastal community plus a series of exercises that focus on stakeholder complexity and decision making within a community-based governing board tasked with planning for such storms in the face of future-possible global warming threats. The learning environment had three phases: (1) Set up; (2) Guided Use of the Simulator; and (3) Post Simulation Debriefing. The content of each phase and our qualitative assessment of the effectiveness of the exercise are contained in
Section 4.2 and
Section 4.3 below.
The CoastalProtectSim model is the centerpiece of the Pointe Claire Simulation-Based Learning Environment. The model and exercises were developed by a team: The lead modeler currently works for the US Army Corps of Engineers and used his experience working in water resources for the Corps as a basis for much of the model structure. While the model was based on representative characteristics of coastal communities, it is a simplified model for teaching. The biogeophysical science of this coastal region has not been as carefully calibrated as would be the case in an actual model developed by the Corps. Because the simulation model was a keystone to the larger set of activities, it is presented in more detail below.
3. The CoastalProtectSIM Model
CoastalProtectSIM captures elements of complexity within the problem context: (1) delays in constructing coastal protection; (2) cost sharing challenges for construction and annual maintenance; (3) impacts of costal land development on natural barriers; and (4) the timing of benefits and costs in net present value calculations for long range coastal flood risk planning.
The model uses a random number generator based on a seed parameter to create weather scenarios, whereby the probability of any particular storm may generate a surge large enough to exceed natural and man-made protection. The mechanism motivating the seeds is key the use of the model as a test of policy ideas. Each seed corresponds to what we refer to as a different “random world”. The model can be simulated in several hundred different simulated worlds that differ in their behavior. Every time the simulation is run with the same seed, the model uses exactly the same set of random numbers to create exogenous storm behaviors. So for a given random seed (random world), students can get identical effects each time they run the model. This makes it easier for students to understand how the model is running under their policy constructs. However, students can also switch to another seed and generate another random world that obeys the same rules by selecting a parameter in the rerun menu, changing the size and timing of the exogenous natural environmental conditions, and again evaluate their plans under a different series of events with different timing.
In addition, an optional global warming scenario is built into the model that allows for the amplification of the storm surges based on severity of storms and sea level rise. Costs associated with mitigation and benefits from damages avoided are calculated in terms of their net present value at the required 7% discount rate for new projects at the US Army Corps of Engineers. CoastalProtectSIM requires the decision maker to determine whether the long term benefits are worth the investment of short and intermediate term mitigation measures. The time span for the model is 40 years to allow for long term and short term tradeoffs to be explored. In this section, we describe the model structure and provide base run behavior for three random “normal” and two climate change scenarios. The section concludes with a description of several policy runs and a discussion of tradeoffs for each strategy.
3.1. Model Description
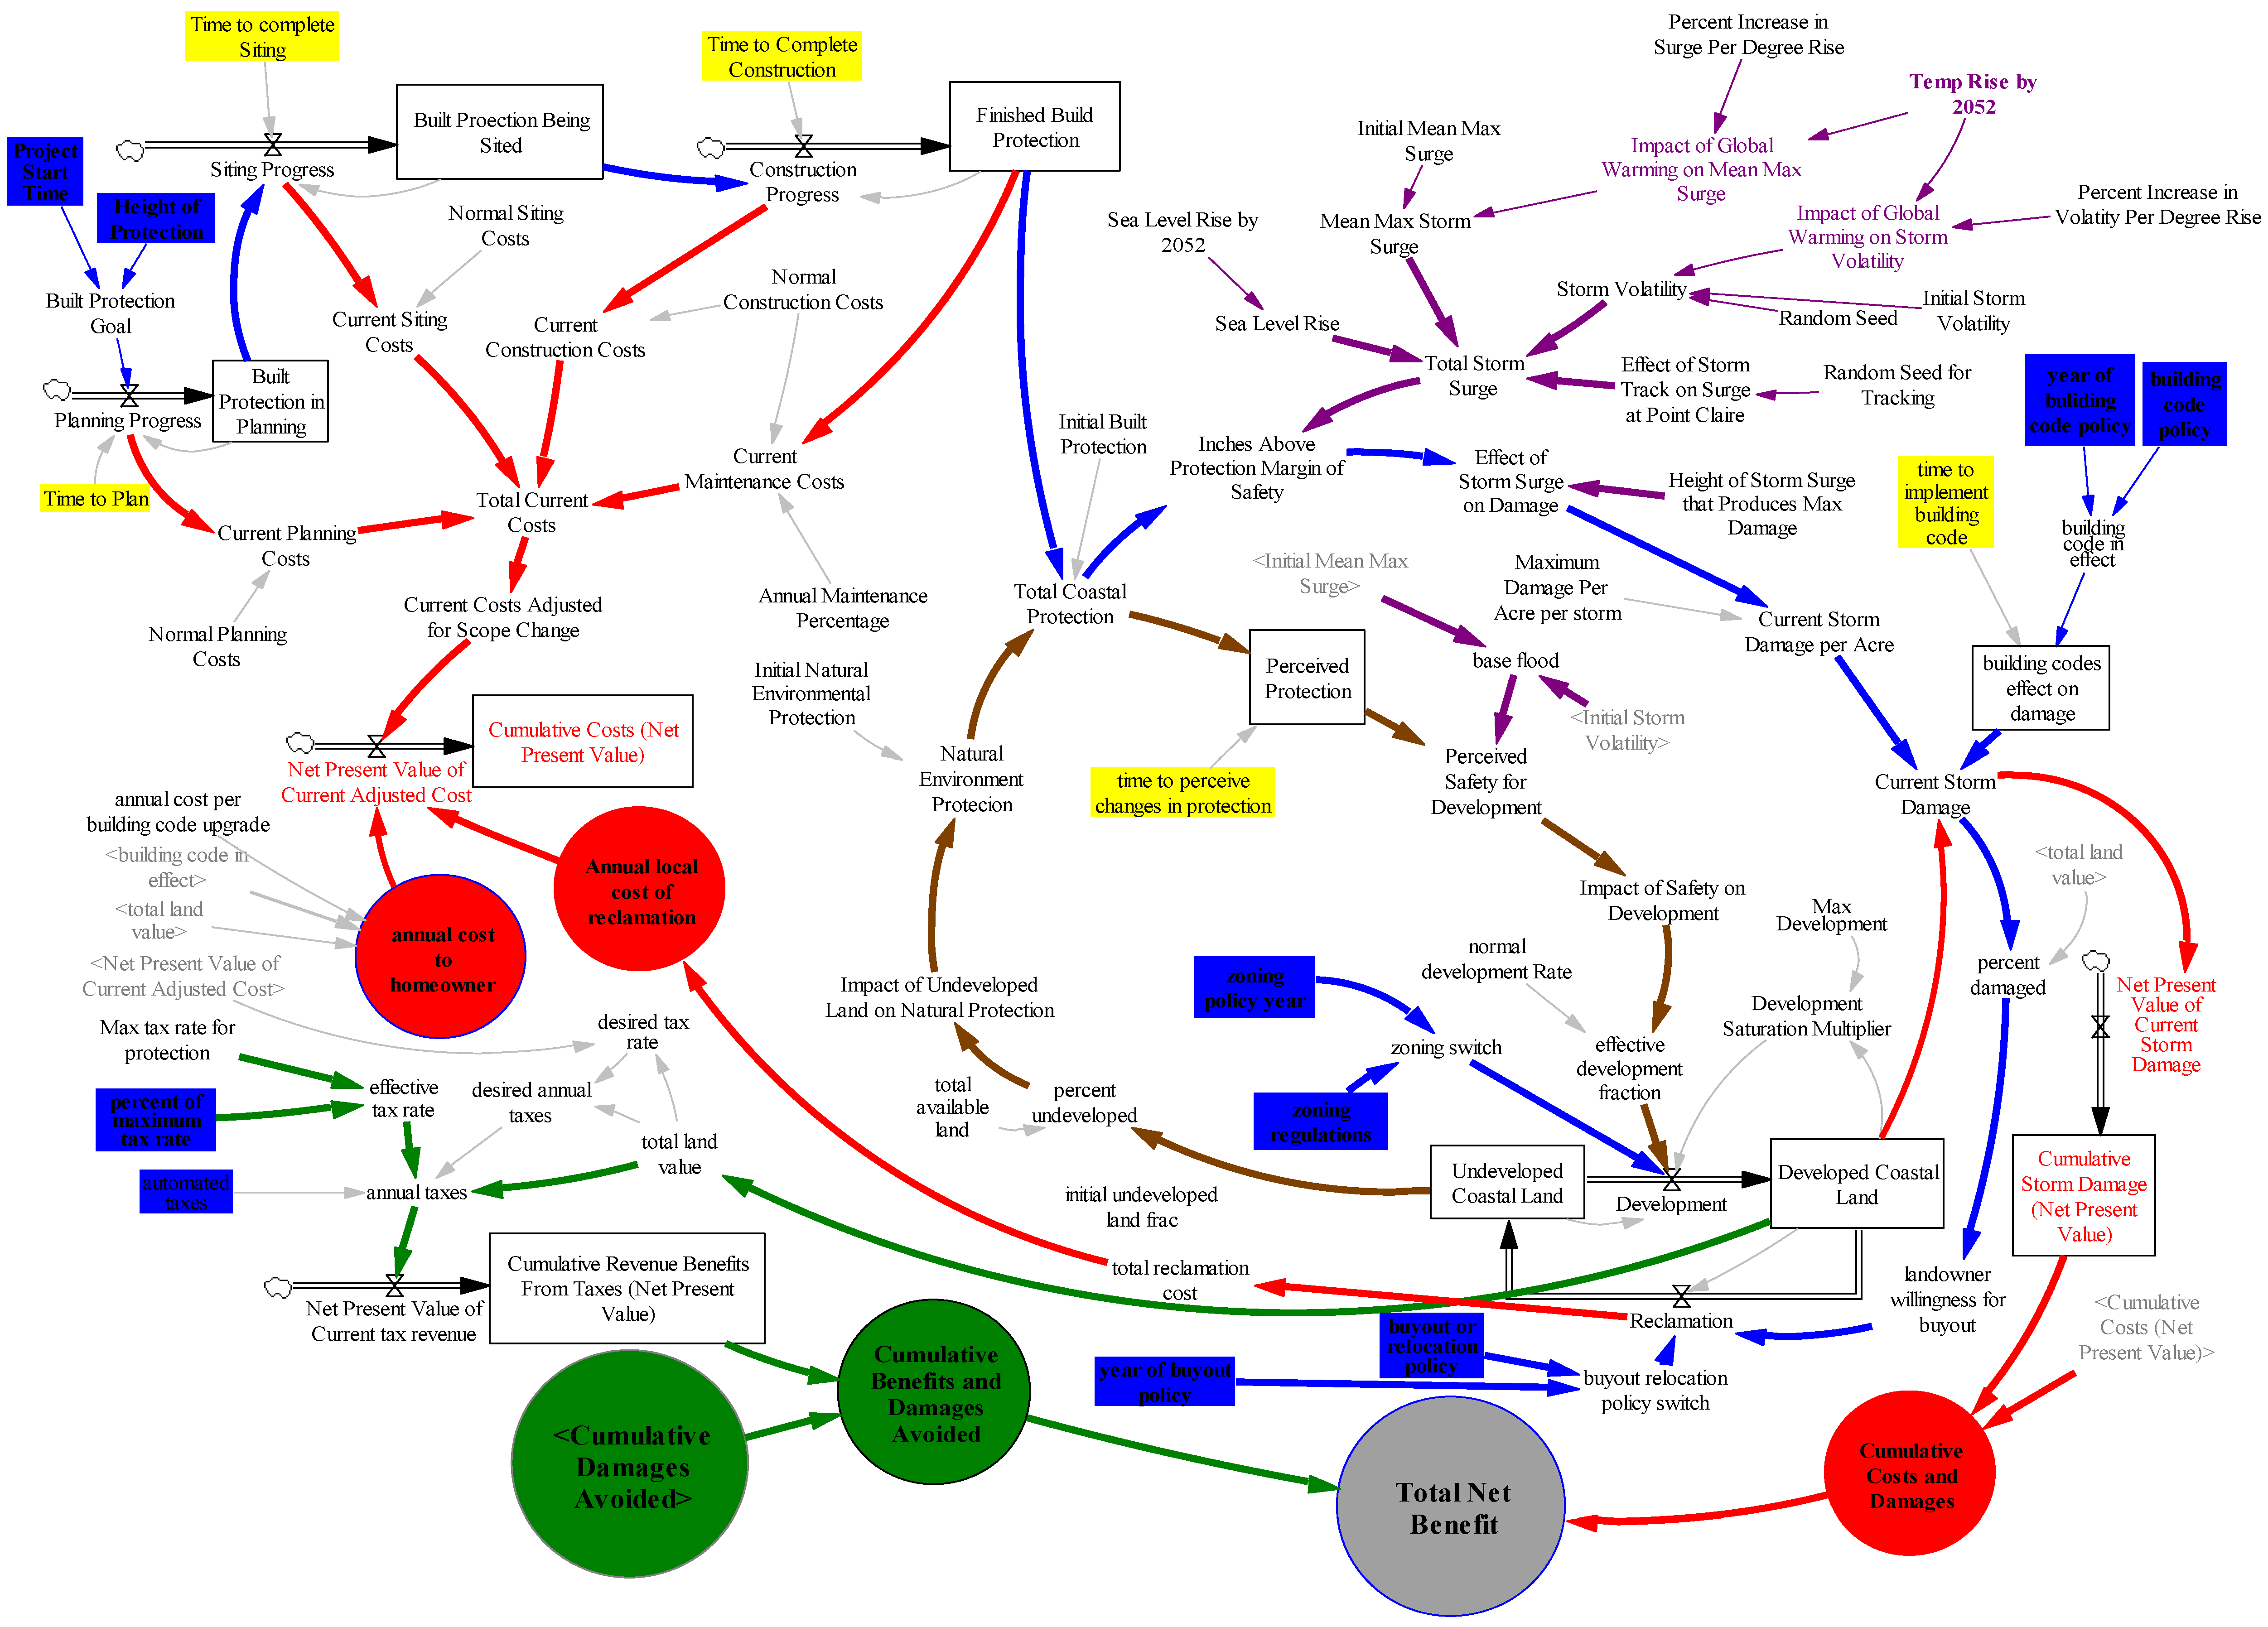
CoastalProtectSIM (
Figure 2) captures the essential elements of coastal storm planning. It has five model sectors: (1) structural mitigation; (2) land development and natural barriers; (3) storm intensity and climate change; (4) costs associated with damages and mitigation measures; and (5) benefits from cumulative tax revenue.
Table 1 provides a legend for the causal map to help the reader identify each of the five variable types discussed in this section of the paper.
Table 1.
Legend for CoastalProtectSIM causal map, shown in
Figure 2.
Table 1.
Legend for CoastalProtectSIM causal map, shown in Figure 2.
| Causal link color | CoastalProtectSIM Model Structure |
|---|
| Blue | Policies to mitigate damages and minimize recovery costs |
| Brown | Natural barriers to protect the community |
| Purple | Storms and climate change |
| Red | Disaster damages and mitigation costs |
| Green | Benefits from tax revenue and damages avoided |
Figure 2.
CoastalProtectSIM model structure.
Figure 2.
CoastalProtectSIM model structure.
3.1.1. Structural Mitigation (Blue Links in Figure 2)
The structure shown in the upper left corner of the causal map (
Figure 2) captures the connection between the planning and implementation of structural coastal barriers, such as constructed levees, dams and beach nourishment projects. Community decision makers identify the desired height of protective structures and the project start time. The time to complete the plan formulation process is not within the control of the local decision maker. The
Built Protection in Planning accumulation accounts for the time between the decision to construct protective barriers and the time it takes to complete reconnaissance and feasibility studies. In the U.S. Army Corps of Engineers’ budgeting process, completed plans lead to
Built Protection Being Sited through Preconstruction Engineering and Design (PED) investigations, which is an intermediate step before formal construction. The final accumulation,
Finished Build Protection, is based on the rate of construction for protective structures along the coast. In the default settings of the model, which we term the “base run”, the total delay for these three stocks is 10 years, which corresponds to the average delay time in the Corps’s planning and construction process.
Projects that have been completed increase the Total Coastal Protection which reduce the amount of storm surge the community experiences directly (Inches Above Protection Margin of Safety). The model assumes a threshold over which storm surge will produce some degree of property damage. As storm surge rises above the total protection on the coast, the Effect of Storm Surge on Damage increases to a potential Maximum Damage per Acre per Storm, which has been set for the base run at maximum of $100K/acre. Current Storm Damage is also influenced by the building codes effect on damage, which represents a policy whereby floodplain managers are able to successfully implement codes to guarantee lower levels of property damage during the next storm event.
If the Current Storm Damage is higher than the protection provided by structural policies or strict building code enforcement, the resulting percent damages indicate the extent of damages in the community. If this percent is relatively large, the landowner willingness for buyout will increase as well. It is conceivable landowners would be willing to relocate during the recovery period, thus creating open space and increasing the level of Undeveloped Coastal Land and reducing Developed Coastal Land. The potential balancing feedback loop suggests an opportunity to minimize future damages. Alternatively, a zoning regulation can be enforced to restrict development, which would help to guarantee the balancing loop maintains its goal seeking behavior. There is a caveat with respect to the link between percent damaged and landowner willingness for buyout. CoastalProtectSIM has model structure (hidden in this view) that activates federal disaster assistance in very large disasters, which may reduce the willingness to relocate in certain cases.
3.1.2. Natural Barriers (Brown Links)
The level of
Undeveloped Coastal Land (center of
Figure 2) acts as a natural barrier to protect against storm events. As this level increases, its
impact on Natural Protection increases, which enhances the
natural environment during major storm events. Communities that maintain large sand dunes between developed property and the ocean, as well as sustainable beaches solutions to import or relocate sand on the shore have more protection during hurricanes and major storm events. The natural barriers combine with structural protection to increase the
Total Coastal Protection, which as previously discussed minimizes storm surge and flood damages. However, this added protection also increases the
perceived protection in the community. A high
perceived safety for development adds pressure on the community to expand and develop on the shore. As the
impact of safety on development increases,
development in the community will increase as well. Since this balancing loop contains a relatively long delay between actual and perceived safety in the community, it can lead to oscillations in the level of safety with the system.
3.1.3. Storms and Climate Change (Purple Links)
The CoastalProtectSIM model operationalizes storms through two concepts: mean storm surge and volatility. Total Storm Surge is a function of Mean Max Storm Surge, Storm Volatility, Sea Level Rise, and the effect of storm track. The Mean Max Storm Surge is set at 108 inches in the base run, with the potential to increase based on the impact of global warming on mean max surge. Storm Volatility is formulated as a Random Normal variable with a range of −50–400 inches, an initial storm volatility of 24 inches (the standard deviation of the variable), with a dynamic impact of global warming to amplify the volatility over time. This variable is sampled for each storm based on a Random Seed that effectively selects one possible future pattern of storm conditions. To account for climate change, the model uses Temperature Rise by 2052 to affect volatility through an assumed relationship of percent increase in volatility per degree rise. In the base run, the temperature rise is set at zero. Sea Level is a third contributing factor to storm surge. It is set at zero in the base run. The fourth and final contributing factor is the Effect of Storm track on surge, whose purpose is to add a layer of uncertainty in the model. That is, not every storm is perfectly predicted. In most cases, the storm surge is not as high as the protective barriers, which results in a zero effect of storm surge on damage.
3.1.4. Disaster Damages and Mitigation Costs (Red Links)
There are two types of costs recorded in CoastalProtectSIM. The first are costs associated with the implementation of mitigation policies. The model calculates
current planning costs, current siting costs, current construction costs, and
maintenance costs at an annual rate which feed into a
Net Present Value of Current Adjusted Costs (upper left corner of
Figure 2). There are major financial challenges for many communities who wish to participate in structural mitigation measures on the coast. Even after project construction has been completed, communities must participate in cost-sharing for the maintenance of these projects. In the model, the costs are recorded and discounted at the U.S. Federal government required rate of 7%.
The second cost in the model is the cost to purchase or reclaim property. Even in cases where the federal government supports a buyout of local property, there is usually some level of cost sharing on the part of the non-federal partner. In addition, there are costs associated with the implementation of strict building code policies, which carry a direct burden to the homeowner. Finally, the cost to recover a community after disaster is recorded as stock of Cumulative Storm Damages. Taken together, these costs determine the outcome of a given set of mitigation policies.
3.1.5. Benefits from Tax Revenue and Damages Avoided (Green Links)
The model calculates benefits as shown in the lower left corner of
Figure 2. CoastalProtectSIM allows the decision maker to implement a tax policy to offset the community cost-sharing burden. It is assumed that taxes are collected solely to offset the costs of crisis prevention. The model calculates a
desired tax rate based on the
Net Present Value of Current Adjusted Costs. The
total land value is used to determine an appropriate tax rate.
CoastalProtectSIM contains a second, parallel model that runs “behind the scenes” without policy intervention. Both models are subject to the same storms. The resulting damages from the “no intervention” model is compared to the policy runs in the “policy intervention” model. The Cumulative Damages Avoided is the difference between Cumulative Storm Damages in the two models. Cumulative Damages Avoided is added to the revenue generated from taxes for a total Cumulative Benefits and Damages Avoided. The difference between this total and the Cumulative Costs and Damages is recorded as Total Net Benefits.
3.2. Model Behavior
The model generates storms and storm surges over the course of a 40 year period. The storms are randomly generated and a percentage of the storms may exceed the man-made and natural barriers and cause storm damage. The model is used to test strategies under various scenarios and communicate the results. Multiple iterations with variations on strategies expose students to the effects of dynamic complexity on the policy process.
The following selection of model runs highlights different types of uncertainty and tradeoffs unique to this particular policy domain.
3.2.1. Base Run
The base run for each random pattern of storm conditions has the same set of policy and planning assumptions. At the start of the simulation, the Pointe Claire community has minimal flood risk management policies in place. It relies on natural barriers to provide flood protection. The base run for each random seed shows the costs to Pointe Claire from different types of storm “challenges.” A policy mix that performs well under one random seed may not achieve the same level of success under another random seed.
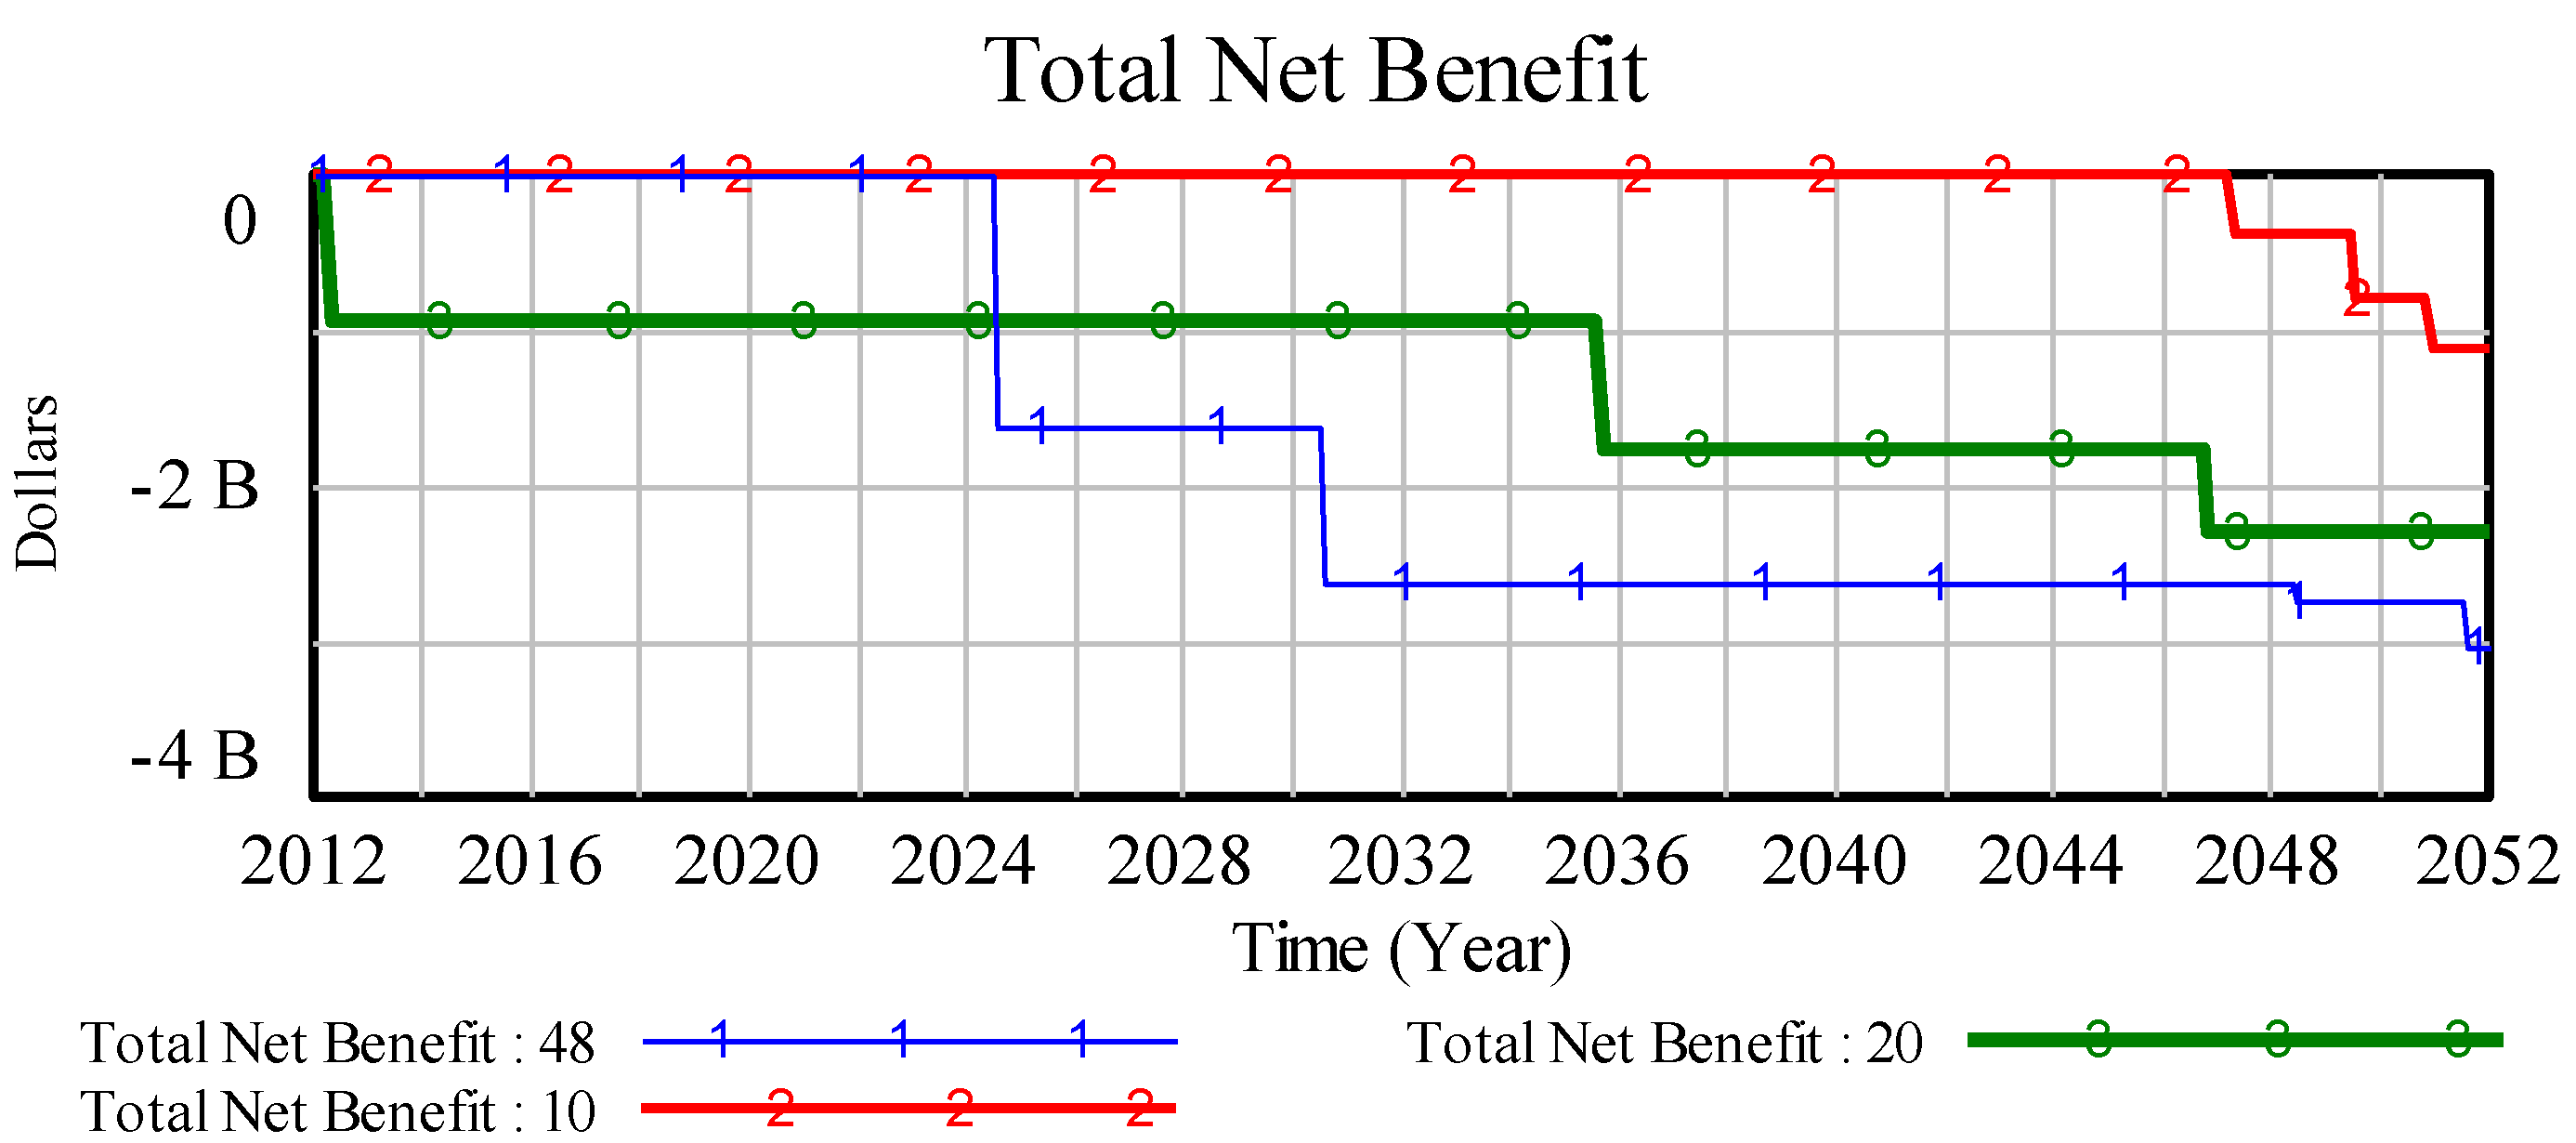
Figure 3 presents the effects of three different random seeds.
Random Seed 1: The base run in the first example (run with random seed = 48) shows the effect of four storm events beyond the protection of its natural barriers. The first event occurs midway in the run, with a second event 10 years later. The final two events are rather small and occur at the end of the base run.
Random Seed 2: In the second sample base run (with random seed = 10) the community is hit with three events in a row. All events occur late in the run, starting at approximately 2046.
Random Seed 3: In the third example (random seed = 20), the community is hit with an event almost immediately. The next event beyond its natural barriers occurs approximately 25 years later. A third event occurs another 10 years later, with each subsequent event slightly less damaging than the previous.
Figure 3.
Total Net Benefit in response to three sample random storm patterns.
Figure 3.
Total Net Benefit in response to three sample random storm patterns.
3.2.2. Climate Change
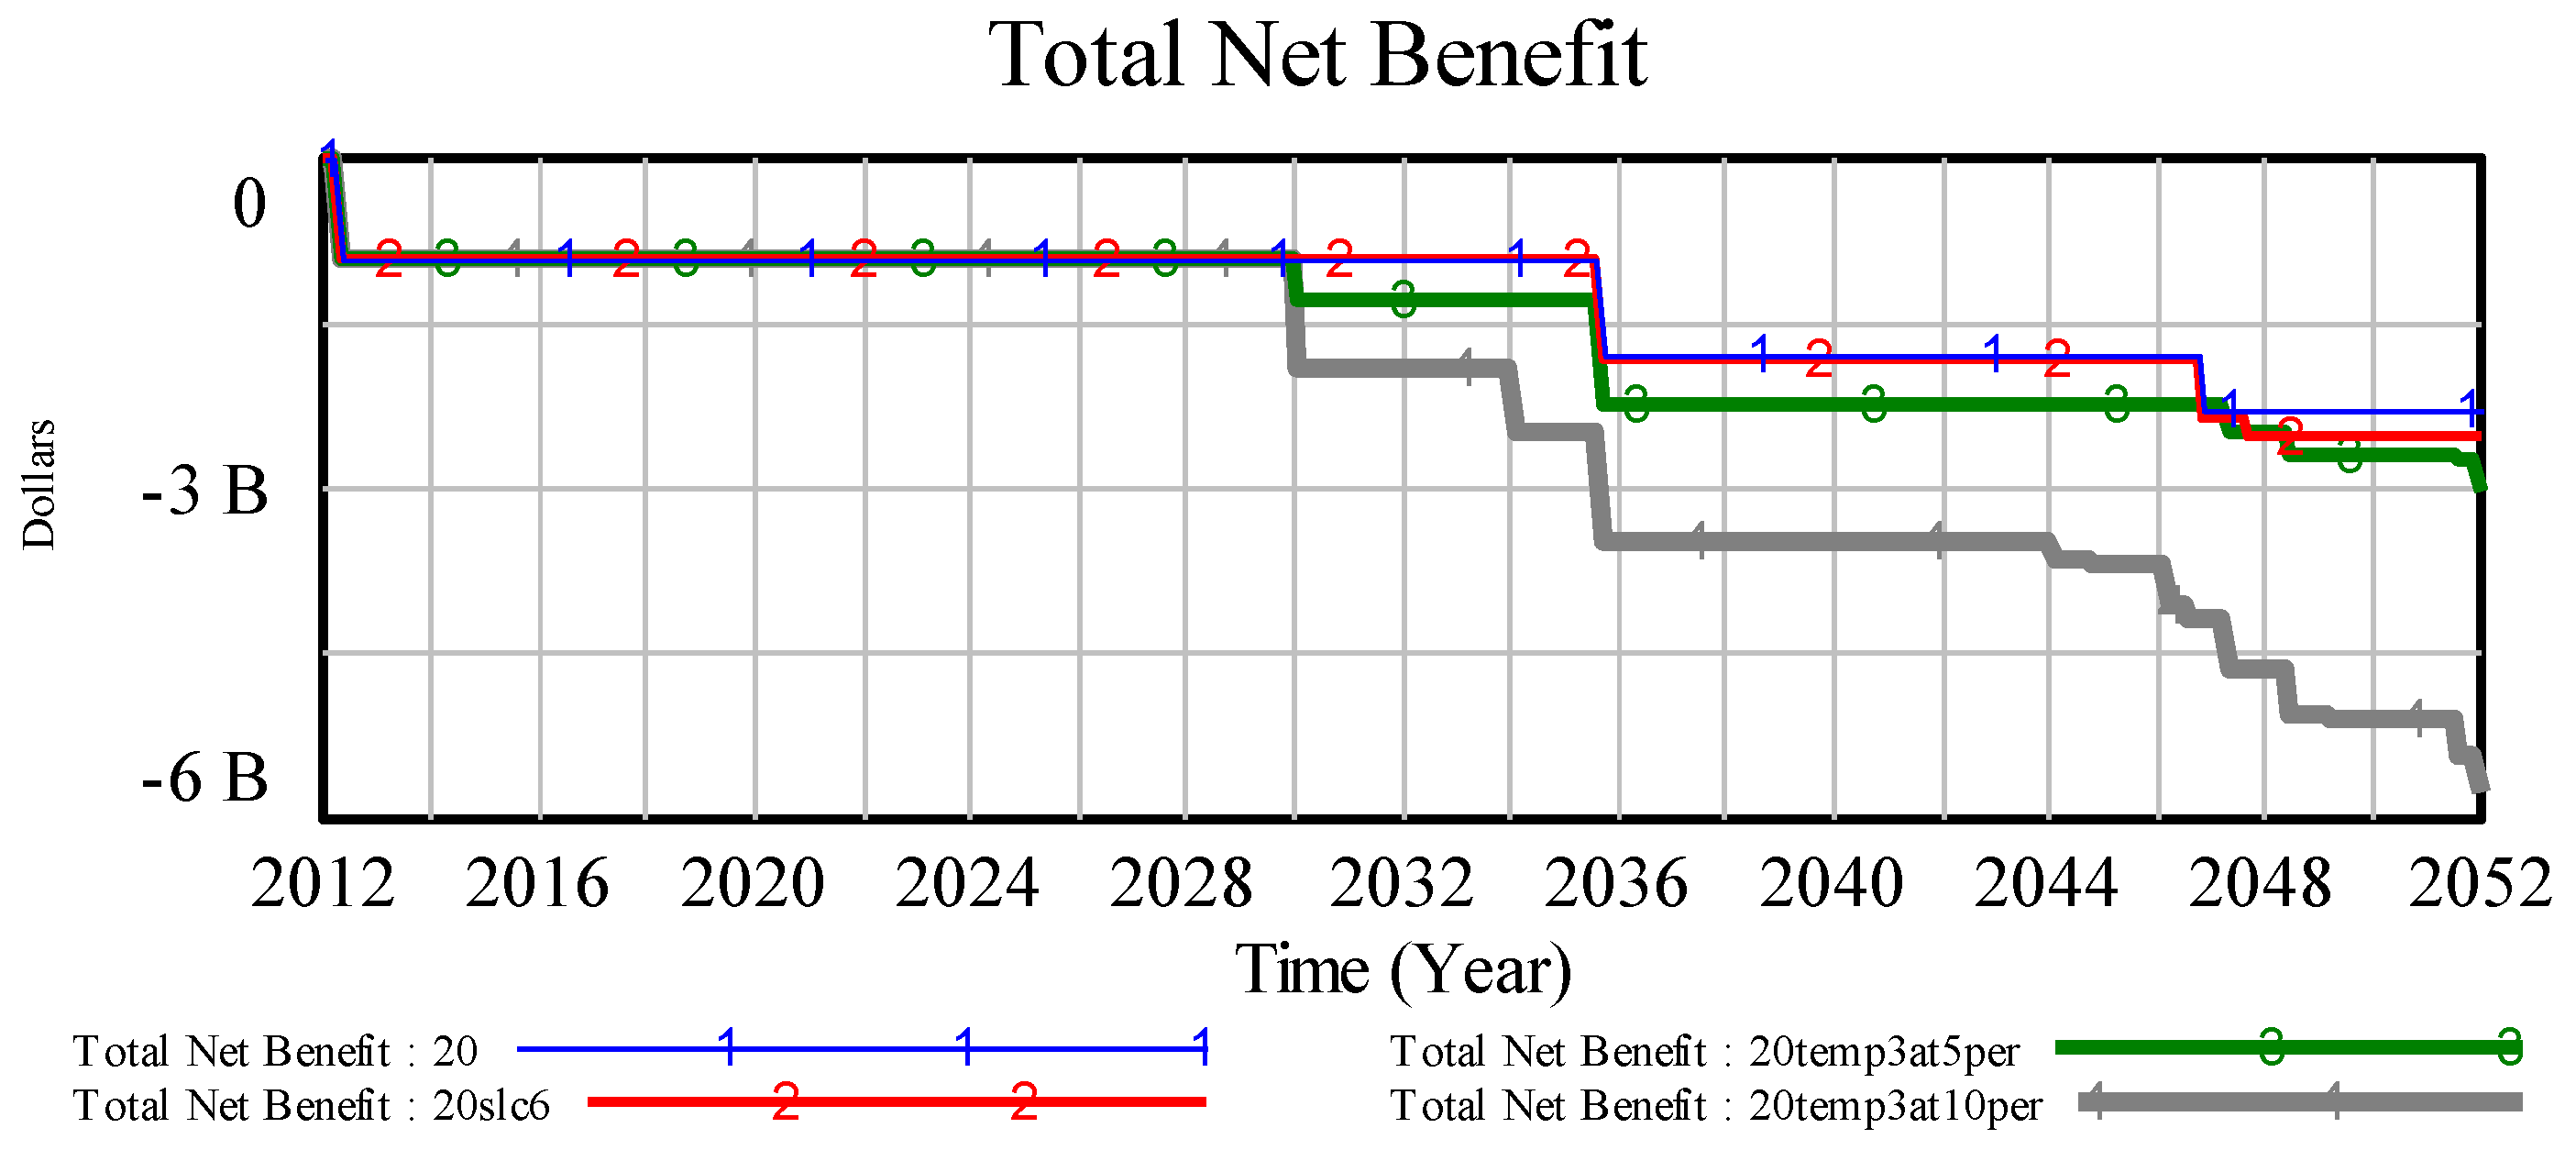
Three examples of different climate change scenarios under random seed 20 are presented in this paper. The base run with sea level rise at 6 inches has some impacts in the later years of the run. The total cumulative damages are similar to the base run. A second global warming run with parameter change for temperature rise of 3 degrees (5% surge per degree) results in relatively higher damages toward the end of the run. A final global warming run in random seed 20 had a 3 degree temperature rise with a 10% surge per degree. This global warming test results in a change in both frequency and severity of damage, with several more events creating damage in the later years. This final test shows cumulative damages nearly double the size of the base run.
Figure 4 presents the base run along with the effects of different climate change scenarios.
Figure 4.
Total Net Benefit in response to three sample random storm patterns, with climate change.
Figure 4.
Total Net Benefit in response to three sample random storm patterns, with climate change.
3.2.3. Policy Runs
The CoastalProtectSIM model has several types of policy alternatives available to decision-makers. A description of each policy, with recommended policy values along with default values in the base run is described in
Table 2. The recommended values are merely suggestions to decision maker to provide some boundaries and make it easier to keep track of many policy mix combinations. The contents in
Table 2 were provided to the decision makers to describe all policy options in CoastalProtectSIM model.
Table 2.
CoastalProtectSIM Policy Information Provided in the SBLE.
Table 2.
CoastalProtectSIM Policy Information Provided in the SBLE.
| Policy Parameter | Description | Default/Recommended Policy Values |
|---|
| Height of Protection | Built protection for Pointe Claire includes projects such as seawalls, beach replenishment, and barrier island replenishment. The height of built protection adds to the community’s existing natural environment protection. It takes approximately 5 years to complete the initial planning studies and at least another 5 years to complete the construction project.
The height of man-made protection will determine the construction and annual maintenance costs. In the real world, cost-sharing requirements make it difficult for some communities to participate in agreements with the Corps. Therefore, both construction and maintenance costs should be considered to determine the appropriate height of protection. | Default: 0
Policy values: 0,18, 24, or 36 inches |
| Tax Rate for Protection | There are several costs to consider in the model: costs for planning, construction, and operations and maintenance. Taxes should cover the non-federal share of these costs. | Default: 0
Policy values: tax rate between 0 and 0.002 |
| Automated Tax Rate | You may notice it is difficult to set the tax rate just right. Instead of setting the tax rate for protection, you may opt to use the automated taxes feature. When this feature is activated, you will be guaranteed to collect taxes exactly at the cost of your height of protection | Default: 0
Policy values: 0 or 1 |
| Building Code Enactment and Enforcement Policy | One way to avoid damages without clearing homes from the floodplain is to develop strict building codes for flood proofing and elevating structures above the base flood elevation level. Building codes would not eliminate all of the damage during a storm. Set the building code policy to any number between 0 and 1. This will be the percentage of structures (the goal) you expect to be in compliance with your codes. Also, keep in mind that building codes come at a cost to the property owner.
Building codes should be considered as part of a holistic flood risk management strategy. Since costs will be immediate and benefits will potentially occur only after damages are avoided, the year in which the building policy is implemented plays an important role in both cumulative costs and damages. | Default: 0
Policy values: between 0 and 1 |
| Year of Building Code Policy | The enactment and enforcement of building code policies make structures less prone to storm surge damage. These policies reduce damages and save money when storm surges exceed the height of protection. Building codes increase property maintenance costs on homeowners and businesses. Unlike seawalls and large structural mitigation projects, building codes place more financial responsibility on the individual. Floodplain managers are accountable for the implementation of these policies. These policies are rather important, as FEMA Community Rating System (CRS) points and National Flood Insurance Program (NFIP) discounts depend on their successful implementation. | Default: 2020
Policy values:
between 2012 and 2052 |
| Buyout or Relocation Policy | Buyouts, relocations, and reclamation policies remove homes from the floodplain. Pointe Claire does not have the resources to remove homes before a disaster strikes. However, if you decide to implement a buyout policy, landowners will be inclined to accept a buyout during major events. They are less likely to accept a buyout during smaller events. Federal programs such as the FEMA Hazard Mitigation Grant Program help minimize reclamation costs on the local community. The buyout policy in Coastal Sim represents the percentage of properties offered a buyout during the next event. | Default: 0
Policy values: 0 to 1 |
| Year of Buyout Policy | Select the year when the buyout policy goes into effect. It is assumed that once the policy goes into effect, buyouts will be offered for every event after that year. Keep in mind, buyouts will not be offered immediately. Buyout offers are only extended to residents after events where Pointe Claire incurs damages.
In this model, if no storm occurs after the buyout policy, then no land is reclaimed. | Default: 2020
Policy values: 2012 to 2052 |
| Zoning Regulations | Each community faces a delicate balance between zoning for “open space” and zoning for land development. Zoning regulations prevent new development in flood prone areas. Development in Pointe Claire can change over time based on policy decisions. The value of the zoning policy is the percentage of development prevented. Keep in mind that strict zoning policies lower the tax base in Pointe Claire. A lower tax base lowers the amount of tax revenue that may be collected to offset the cost of structural protection projects. Therefore, zoning regulations could generate costs for remaining homeowners. | Default: 0
Policy values: 0 to 1 |
| Zoning Policy Year | Select the year when zoning policies will go into effect. Zoning policies take effect immediately. Zoning regulations should be considered as part of a holistic flood risk management strategy. The year in which these policies go into effect may not lead to immediate implementation. Therefore, the year the zoning policy is implemented is important policy and determined by the user. | Default: 2020
Policy values: 2012 to 2052 |
Figure 5,
Figure 6 and
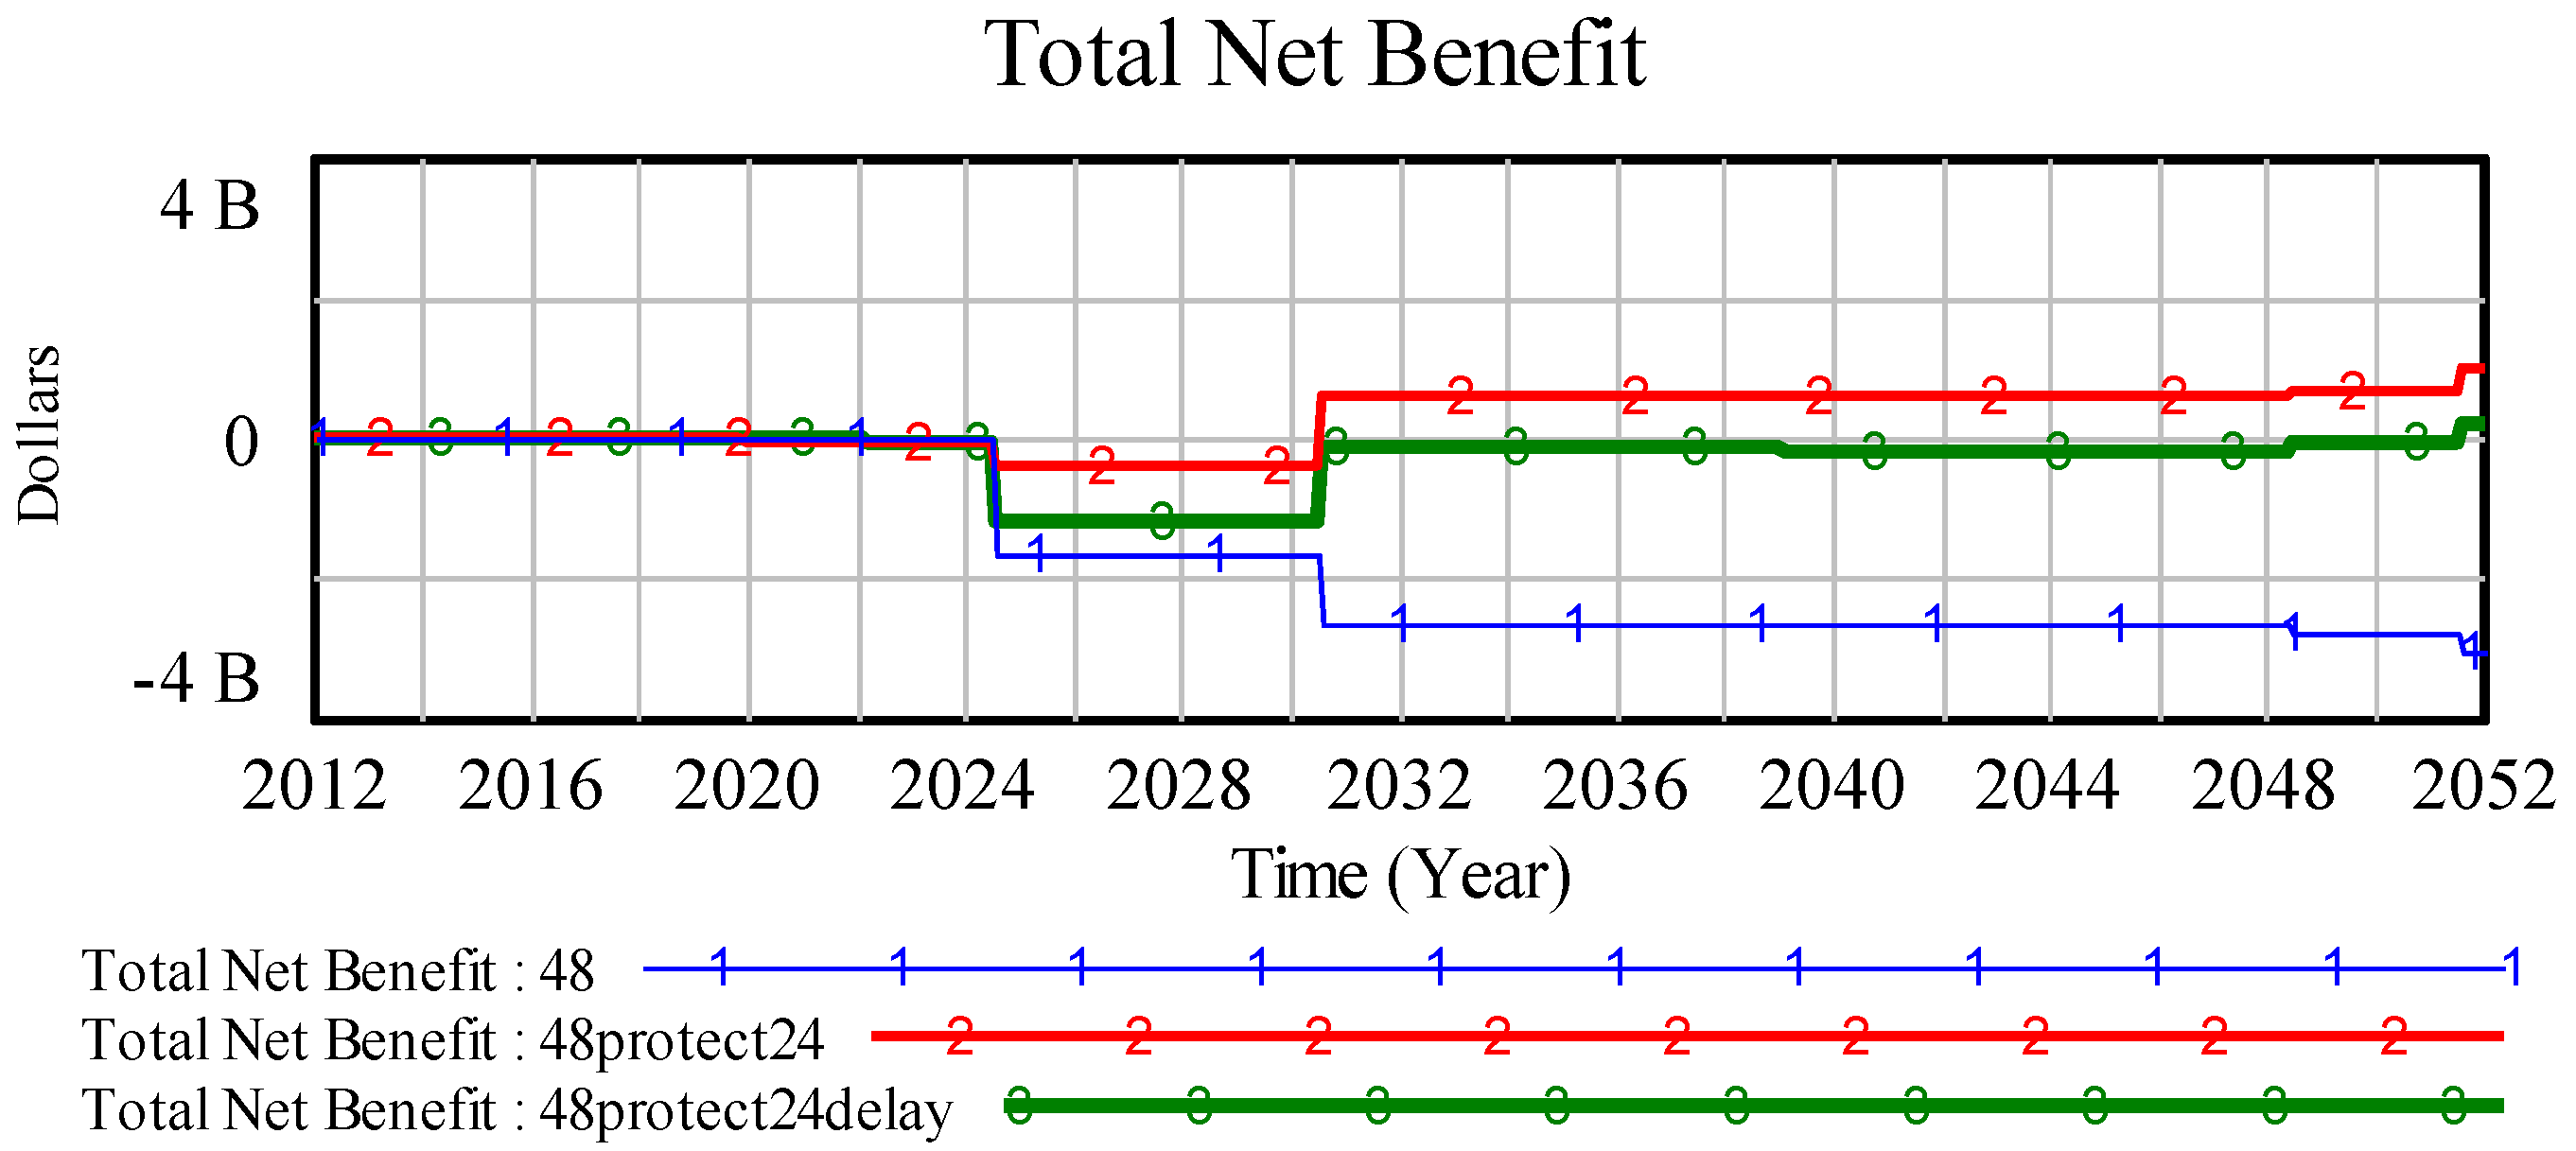
Figure 7 illustrate the effect of some of the policy options on the simulation results. The timing of costs and benefits present a challenge to the decision maker, as some policies only yield a strong net present value due to events in the later years of the model run. Other policies could be hindered by factors beyond the community’s control, such as delays in the Corps planning process. Yet, other policies show that no single approach is enough to sustain development in this coastal community. The handful of policies selected for discussion in this paper highlight challenges in policymaking and strategic communication, as each policy mix holds a unique set of tradeoffs. For simplicity, each policy described in this section uses the same random seed (48) in the base run.
Figure 5.
Total Net Benefit in three sample random storm patterns, with structural mitigation Policy run 2 that represents building an additional 24'' height in physical barriers with no planning or implementation delay and policy run 3 represents the same scenario with a delay.
Figure 5.
Total Net Benefit in three sample random storm patterns, with structural mitigation Policy run 2 that represents building an additional 24'' height in physical barriers with no planning or implementation delay and policy run 3 represents the same scenario with a delay.
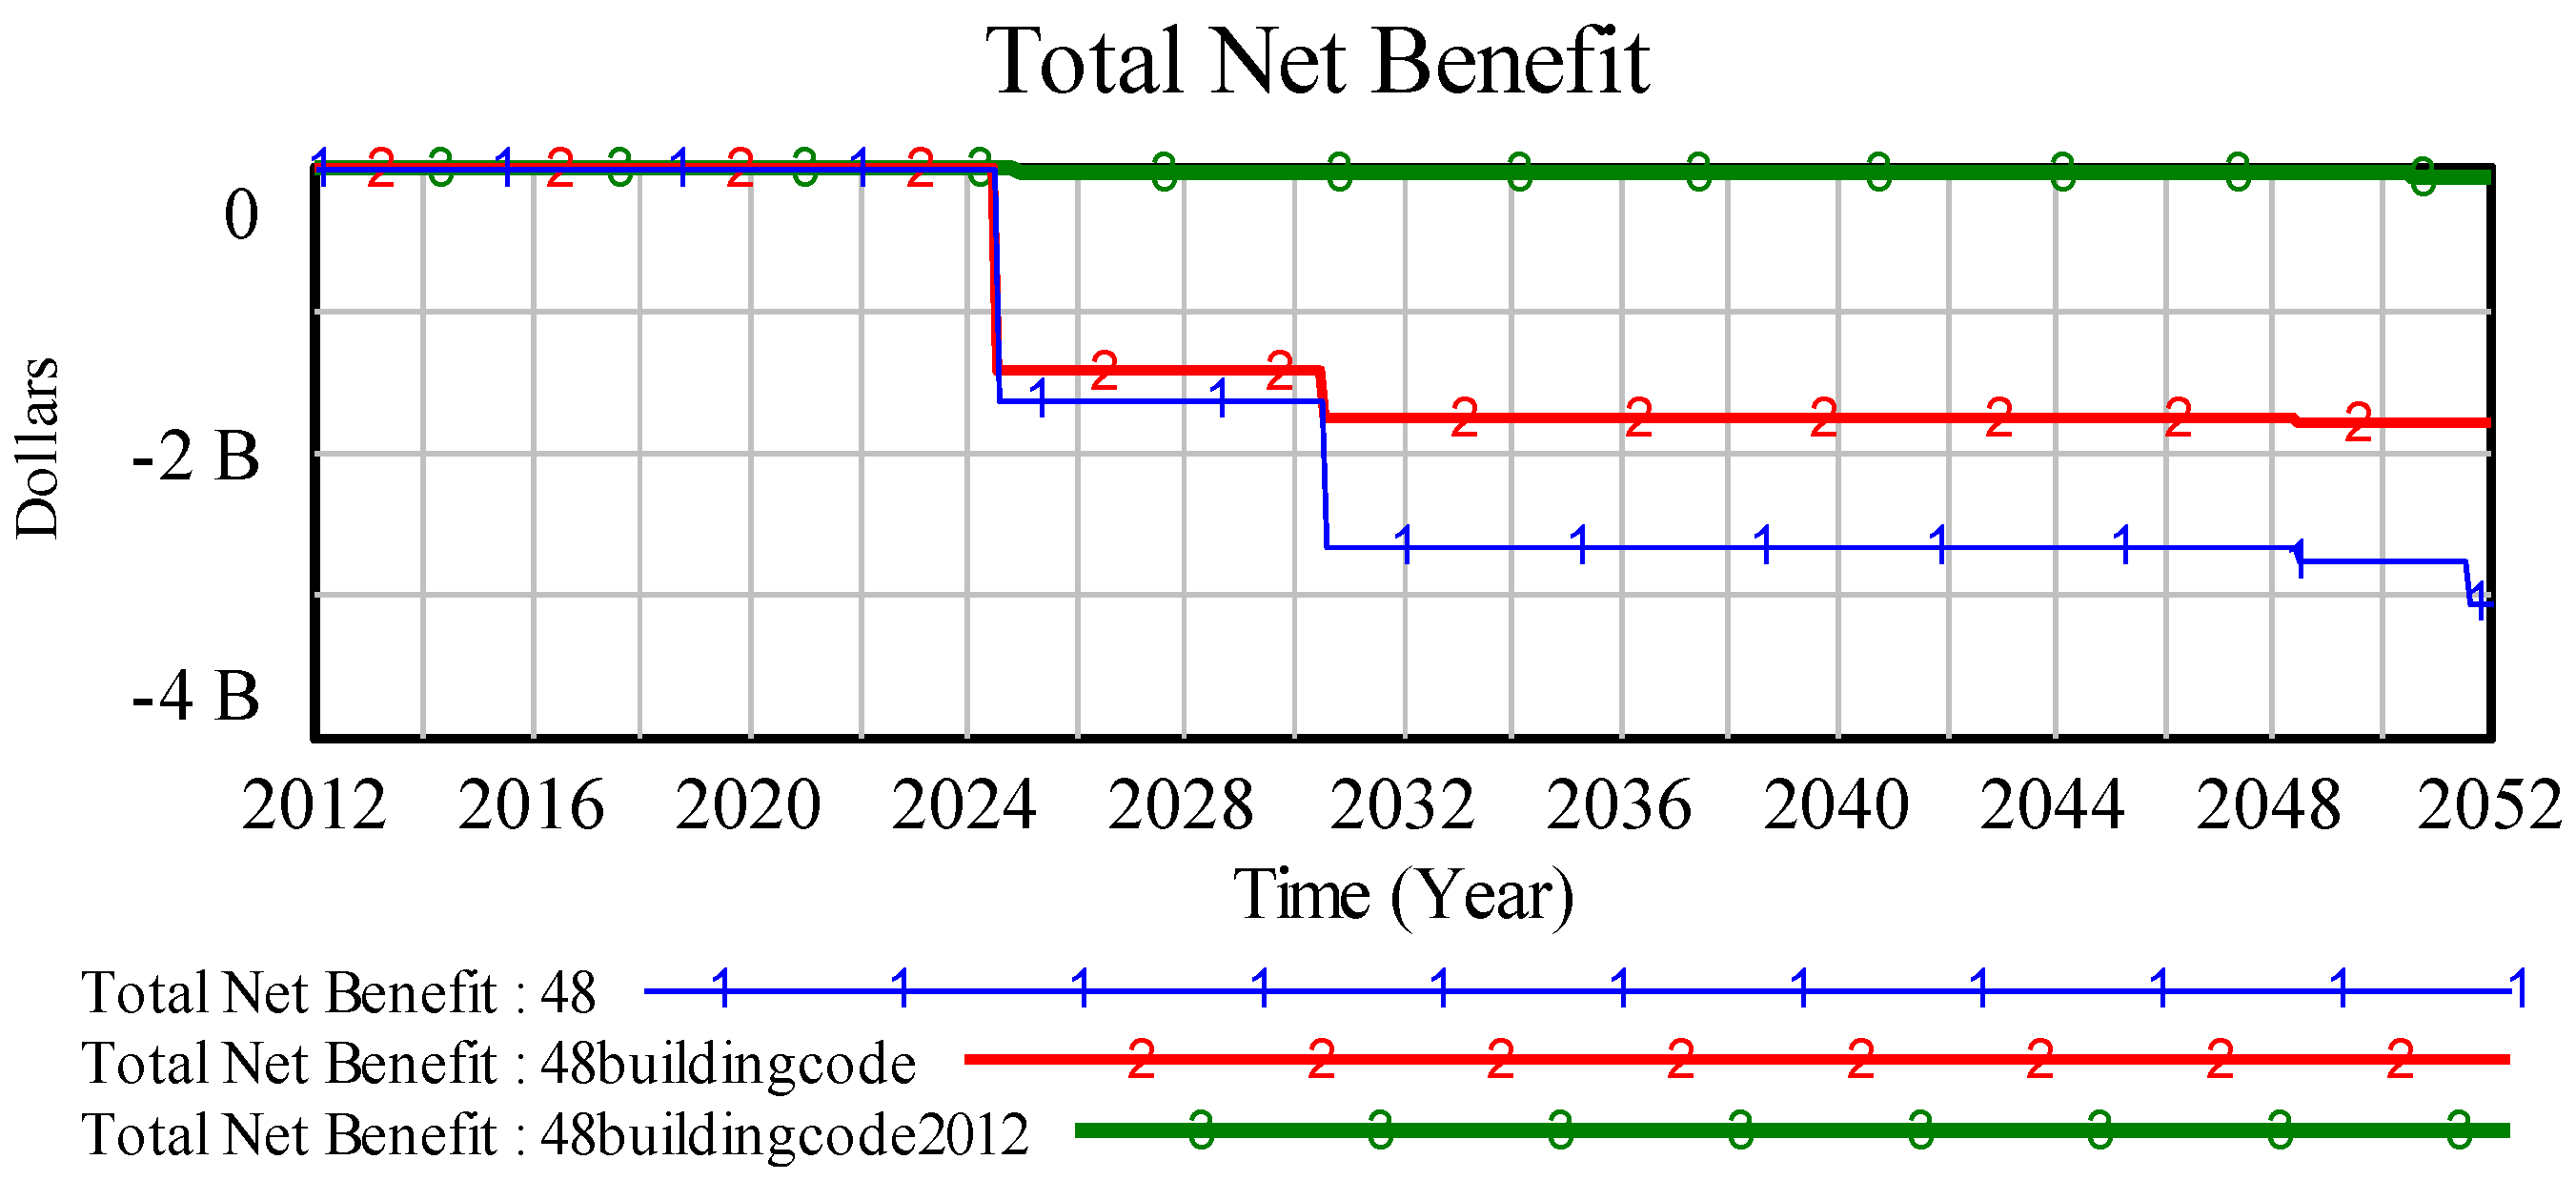
Figure 6.
Total Net Benefit in three sample random storm patterns with build code enforcement.
Figure 6.
Total Net Benefit in three sample random storm patterns with build code enforcement.
Figure 7.
Total Net Benefit in three sample random storm patterns with buyouts and zoning policies.
Figure 7.
Total Net Benefit in three sample random storm patterns with buyouts and zoning policies.
The policy run for structural mitigation is interesting for two reasons. First, on the surface the policy appears to be rather successful against the base case. Whereas the base run results in final total costs to the community in excess of 3 billion dollars, the coastal protection from engineered solutions yields a net benefit in damages avoided of nearly 2 billion dollars. Recall random seed 48 has four events that exceed the community’s natural barrier protection. After the first event, the policy solution does not produce enough benefit to warrant the cost of the project. However, as the model continues to run, it is clear the benefits exceed the costs. Also important to note, the Corps of Engineers uses a 50 year life for most of its planning studies. The second interesting observation on this policy is its sensitivity to delays in the system. The model was run a third time to reflect an additional five year delay in the coastal protection project. This delay results in rather severe damages in during the first event. In fact, total net benefits of the policy just barely rise above zero, which is due to avoided damages in the last year of the run. This example shows two ways CoastalProtectSIM model can help decision makers identify and discuss the uncertainty and timing of costs and benefits in flood prone communities.
While a “building code only” approach does not quite produce robust outcomes in random world 48, the policy highlights an interesting challenge for decision makers. For this policy run, the community sets building codes at a goal of 100% compliance. To reflect the political capital needed to get such level of compliance, the policy goes into effect in 2020. Compared to the base run, the delay in implementation results in damages similar to the base during the first major event. However, with each subsequent event most of the damages are avoided. A third run of the model with an earlier implementation start date (2012) is a vast improvement on the same policy with a slower rollout strategy. In this run, building codes are fully implemented by the first major event and most of the damages are avoided. However, since building codes have a burden on the individual property owner, the result is a net zero benefit to the community.
The above sample of runs gives a partial sample of work that students were encouraged to complete in their final papers. In addition to running these and other runs one at a time, all of the student groups wound up presenting policy packages that ran combinations of policy clusters. Perhaps, the most realistic feature of the CoastalProtectSIM model is the fact that no single policy serves as the magic bullet in flood risk management. Flood risk management requires a holistic systems view of the problem. This is certainly true at the Corps today, where a new focus has been placed on coordinating structural and nonstructural measures. The “buyout only” approach barely outperforms the base case in random world 48. There are two inherent challenges with this policy. First, damages must be large enough for property owners to be willing to accept a buyout, but not too large to receive federal assistance to recover status quo ex ante. Second, buyout policies alone do not remove the pressure to redevelop on the coast. A third run of the model with buyouts and zoning policies prove to be a more sustainable solution. While net benefits are not quite above zero by the end of the run, these policies show that a holistic approach has more potential benefit. That is, by placing pressure on both the inflow and outflow of the land development sector stocks, the policy mix helps to contain future damages.
4. How the Simulator Was Used in the Class Context
The Pointe Claire SBLE was used as part of a larger 10-week Planning Exercise based on the Pointe Claire Coastal Protection Case Study in an MPA core class on data, models, and decisions. This is the place in the core program at the Rockefeller College where basic principles of modeling and how modeling can be used to support the policy process are taught.
4.1. Relationship to Other Units Taught in the Modeling Class
The first two thirds of this class treats various topics in modeling and the final third is devoted to databases and data management. In the first two thirds of the class, each modeling topic has one or more lecture units and an associated problem set. All problem sets had at least one problem that was set in the Pointe Claire case situation. Pointe Claire appeared as a decision tree in the unit on decision analysis and as a set of running equations in the unit on difference equations. The unit on multi-attribute utility (MAU) modeling came after the SBLE based on the CoastalProtectSIM model and most students drafted a MAU model to represent stakeholder preferences in the Pointe Claire Region. The point was driven home over and over that a single case situation contains many kinds of complexities and can be modeled using different modeling tools.
One of the best points of the class was the demonstrated ability of students to integrate insights from various types of modeling insights in their final group assignments. Most groups provided a synthesis of insights from the simulation model with insights that they had gained in the formal decision analysis units of the course or more frequently in the multi-attribute utility modeling portions of the course. For example, quite frequently students used MAU analysis to characterize differences in stakeholder preferences for various performance measures presented within the CoastalProtectSIM model.
4.2. Components of the Complete Simulation-Based Learning Environment
The actual CoastalProtectSIM simulator described above was linked to numerous in-class exercises as well as individual and group assignments. Those exercises and assignments can be described in three clusters.
4.2.1. Simulator “Set Up” Activities
Students engaged in an in-class exercise working with the C-LEARN simulation [
13], a high fidelity simulation system used to forecast impacts of CO
2 emissions on global warming over a 50 year plus time horizon (See Appendix B-1 in Supplementary file).
Students drafted a memo detailing a way to use the C-LEARN simulator as part of the coastal protection planning process in the Pointe Claire Region (see Appendix B-2 in Supplementary file).
Students participated in a group model-building exercise in which the class mapped out a system structure similar to the structure of the CoastalProtectSIM (See Appendix B-3 in Supplementary file).
4.2.2. Guided Use of the Simulation
Students participated in two computer lab exercises where they formulated portions of the CoastalProtectSIM model to become more familiar with how the model was formulated in detail (See Appendix B-4 in Supplementary file).
Students participated in role playing exercises in classroom discussions so that they gained a better feel for how key stakeholders took positions on coastal protection.
Students were given a detailed handout with instructions for running the simulator and given time in the lab to interact with the model working in small groups.
4.2.3. Post-Simulation Debriefing Activities
Working in small groups, students “solved” the policy problem and drafted a policy memo with a supporting set of PowerPoint slides indicating what they found to be the “best” policy solution and why (See Appendix B-5 in Supplementary file).
Students did background reading in three related perspectives on public policy formation—(A) readings on stakeholder analysis and management in the policy process, (B) readings in the creation of mini-publics as a way to achieve policy consensus, and (C) readings on organizational learning and systems thinking as goals of networks or organizations working in the public policy field.
Students drafted individual papers using the three sets pf background readings in public policy plus their work with the simulator (See Appendix B-5 in Supplementary file).
4.3. Qualitative Assessment of What Worked Well (or not)
This core MPA class has had a relatively stable content for the past 15 years and our author team has had substantial experience teaching this class over that whole period. Using that background and experience to reflect on the class, we present below five of the relative successes (and remaining challenges) of using a more fully elaborated learning environment to structure much of the class. These brief reflections serve as our informal attempt to “benchmark” these new innovations against prior offerings of this same class.
- (1)
The previous versions of the class suffered from the impression that models of policy problems are small solvable chunks with no clear connection to the broader policy and managerial context in which they arise. This impression arises because the course presents multiple small problems organized in problem sets (and repeated on in-class examinations). This approach certainly did a better job of illustrating a single larger problem domain and illustrating that multiple approaches can usefully be applied to a large and complex policy problem.
- (2)
The Pointe Claire case was easier to relate to readings and other topics taught elsewhere in the core curriculum. The three assigned readings on the policy process, used to help structure the final assignment, were taken directly from another core class. Students immediately cross-connected the content of that other core class on institutions and politics (involving stakeholder analysis and the formation of “mini-publics”) with the content of this case. The lesson was easy to see—the stuff that we teach in several core classes is all connected in complex policy domains.
- (3)
This design probably had too many moving pieces. Portions of the assignments handed out in week 8 of the class referred back to details that were described in a handout that had been discussed in week 2 of the class. Some students lamented that they had a hard time keeping all of the pieces of the assignments straight. Students seeking a more straight-forward “cookbook” approach to modeling were frustrated by much of the open-ended nature of the linked assignments—how much do we need to remember from one place in the class to the next.
- (4)
The very best students in the class were challenged by all of the moving parts and did extraordinary work on their final group and individual assignments. Compared to past versions of the class, case assignments were much more developed and students had a nuanced understanding of many topics that went beyond simple model mechanics.
- (5)
While several attempts were made to “open up the simulator” (e.g., students were given a version of the simulator that had all of the equations open for manipulation and all students were required to build a simple version of the simulator as one of their difference equation assignments), many students still treated results from the CoastalProtectSIM simulator as “black box” results.
Overall, our impression was that the inclusion of this suite of exercises around the Pointe Claire Coastal Protection scenario considerably increased the overall complexity of and perhaps the workload of the class. This had the effect of bifurcating student reactions to the class with some students liking the additional sense of challenge, while others just wanted to be done with what, in the end, was just another core class they had to complete.
Also, we believe that further developing and incorporating materials that use System Dynamics simulation models to teach complexity will ultimately challenge the faculty who are teaching the classes. In our case, we always had access to faculty who were well trained in complex modeling and were able to fill in “on the fly” if the developed curricular materials hit a thin spot. We believe that the both the simulator and the supporting material will need to be more thoroughly developed and tested, possibly implemented through a web-based portal such as the Forio simulation portal [
14] before such curricular innovations can become widespread.
5. Implications and Future Work
The use of the Pointe Claire SBLE described here supports the potential of SBLEs to teach complexity in public management education. The experience of the instructors and robustness of post simulation policy analyses indicates this simulation-based learning environment did help build a more complete and useful understanding of public policy complexity in public management students. We are moving forward with plans to improve and refine this SBLE in several ways:
We are revising the background case material to make it into a more coherent set of background instructions as a response to student feedback and questions during the exercise. Initially, this will take the form of a unified packet of materials with hyperlinks, but we are moving in the direction of embedding all of these materials into a more integrated environment.
We are working toward a simplified and revised version of the basic simulation itself that has improved clarity with respect to policy levers and feedback effects.
Student final assignments are the best written record of what students have learned. We are experimenting with a sequence of assignments that might highlight learning in more of a “pre” and “post” environment in order to gain a better handle on overall learning.
We are interested in examining what components of the SBLE were most effective, which were necessary to produce the desired outcome, and which might be unnecessary.
These types of SBLEs have the potential to secure thoughtful public engagement in sustainable planning across a wide range of domains that share features in common with coastal protection. The case described here focused on public management students, but the approach has potential for use with other groups, including community stakeholders. It will improve the ability of the public management workforce to engage the public in decision making about sustainable futures.
Acknowledgments
An earlier version of this paper was presented at the 31st International Conference of the System Dynamics Society, Cambridge, MA, USA, 21–25 July 2013. The authors thank Ventana Systems for providing the VENSIM simulation environment for this project.
Author Contributions
Michael Deegan developed the initial CoastalProtectSim model, worked with Rod MacDonald to adapt it for use in the class, and wrote the technical sections describing the model. David Andersen designed the SBLE curriculum materials around the model, conceptualized the use of the SBLE to teach complexity, and implemented the SBLE in the Rockefeller College MPA program together with Minyoung Ku. David Anderson, Krystyna Stave and Eliot Rich set the SBLE in a broader theoretical context and wrote the text describing the SBLE and its broader implications. Minyoung Ku contributed to the alignment of the SBLE to NASPAA’s core competencies and led the evaluation effort.
Conflicts of Interest
The authors declare no conflict of interest.
References
- Comfort, L.K.; Wukich, C. Developing decision-making skills for uncertain conditions: The challenge of educating effective emergency managers. J. Public Aff. Educ. 2013, 19, 53–71. [Google Scholar]
- National Association of Schools of Public Affairs and Administration, Accreditation Standards for Master’s Degree Programs in Public Administration. Available online: http://www.naspaa.org/accreditation/NS/naspaaStandards.asp (accessed on 16 January 2014).
- Lindblom, C.E. The Science of “Muddling Through”. Public Adm. Rev. 1959, 19, 79–88. [Google Scholar] [CrossRef]
- Couture, M. Complexity and Chaos—State-of-the-Art; List of Works, Experts, Organizations, Projects, Journals, Conferences and Tools; Defence Research and Development Canada: Valcartier, Canada, 2007. [Google Scholar]
- Hu, Q.; Johnston, E.; Hemphill, L.; Krishnamurthy, R.; Vinze, A. Exploring the role of interactive computer simulations in public administration education. J. Public Aff. Educ. 2012, 18, 513–530. [Google Scholar]
- Sterman, J.D. Learning in and about complex systems. Syst. Dyn. Rev. 1994, 10, 291–330. [Google Scholar] [CrossRef]
- Kim, H.; MacDonald, R.H.; Andersen, D.F. Simulation and managerial decision making: A double-loop learning framework. Public Adm. Rev. 2013. [Google Scholar] [CrossRef]
- Ghaffarzadegan, N.; Andersen, D.F. Modeling behavioral complexities of warning issuance for domestic security: A simulation approach to develop public management theories. Int. Public Manag. J. 2012, 15, 337–363. [Google Scholar] [CrossRef]
- Black, L.J. When visuals are boundary objects in system dynamics work. Syst. Dyn. Rev. 2013, 29, 70–86. [Google Scholar] [CrossRef]
- Black, L.J.; Andersen, D.F. Using visual representations as boundary objects to resolve conflict in collaborative model-building approaches. Syst. Res. Behav. Sci. 2012, 29, 194–208. [Google Scholar] [CrossRef]
- Sawyer, R.K. The Cambridge Handbook of the Learning Sciences; Cambridge University Press: New York, NY, USA, 2006. [Google Scholar]
- Stave, K.; Beck, A.; Galvan, C. Assessing the effects of simulation-based learning on operational understanding of accumulation principles. Simulat. Gaming 2014, in press. [Google Scholar]
- Sterman, J.; Fiddaman, T.; Franck, T.; Jones, A.; McCauley, S.; Rice, P.; Sawin, E.; Siegel, L. Climate interactive: The C-ROADS climate policy model. Syst. Dyn. Rev. 2012, 28, 295–305. [Google Scholar] [CrossRef] [Green Version]
- Forio Simulation Portal. Available online: http://www.forio.com (accessed on 16 January 2014).
© 2014 by the authors; licensee MDPI, Basel, Switzerland. This article is an open access article distributed under the terms and conditions of the Creative Commons Attribution license (http://creativecommons.org/licenses/by/3.0/).


