
How Corporations Deal with Reporting Sustainability: Assessment Using the Multicriteria Logistic Biplot Approach


Abstract
:1. Introduction
2. Material and Methods
2.1. Reliable Secondary Data Bases: The GRI Reports
2.2. The Assessment of Portuguese and Spanish Organizations

| Group ID | Sector |
|---|---|
| A and B | NACE classification sections: Primary Sector (PS) |
| C | Industrial Sector (IS) |
| D and E | Water and Energy (WE) |
| F | Construction (CN) |
| G to N | Services Sector (SS) |
| O to Q | Public Administration and Social Services (ASS) |
| P | Education (ED) |
| R, S, T, U and V | Others (OT) |
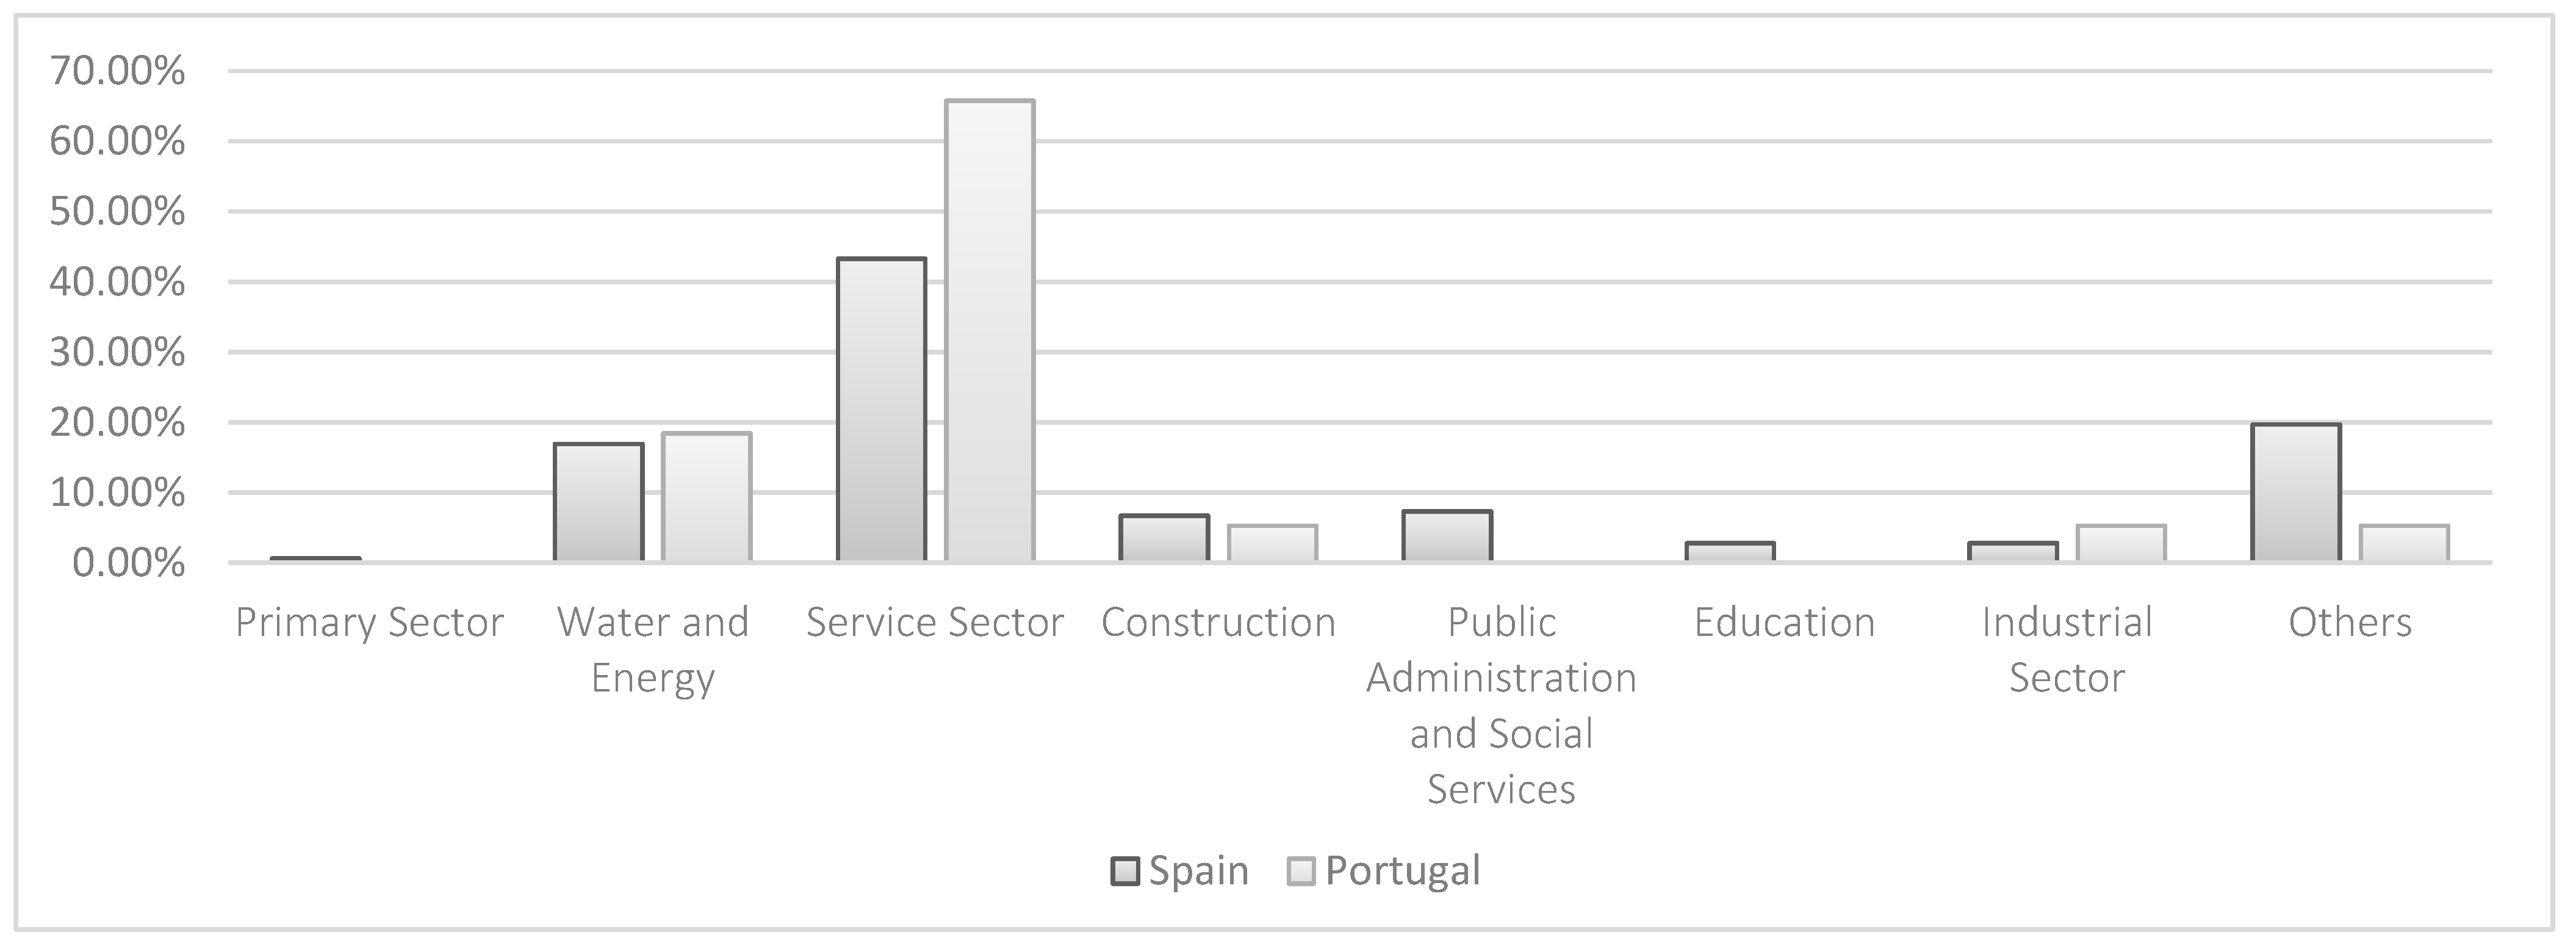
| Sector | Sample Size |
|---|---|
| Primary | 0.5% |
| Water and Energy | 17.1% |
| Services | 47.22% |
| Construction | 6.5% |
| Public Administration and Services | 6.00% |
| Education | 2.30% |
| Industrial | 3.20% |
| Others | 17.10% |


2.3. Statistical Methods
- -
- Distances among companies points on the scattergram are inversely related to their profiles similarities, i.e., close companies have similar characteristics.
- -
- The angle between vectors (variables) indicates the degree of association between the variables: the acute (small) angles indicate that the variables are closely related, that is, when a company presents one of the characteristics it also presents the other one and vice versa.
- -
- The angles between vectors representing the variables and factorial axis, estimate the degree of the relation between the variable and the latent dimension. Taking into account that the horizontal axis is the one which always accounts for most information, variables forming acute angles with the first axis are the more relevant to ordinate the companies in relation to the more important gradient of sustainability; that is to classify companies according sustainability.
- -
- The projections of the companies onto the vector representing the variables, estimate the expected probability of the characteristic for that company given its combination of characteristics.
- -
- The length of the vector that represents each variable indicates the discriminating power of the variable in separating the companies. Shorter vectors are those with the greatest discriminatory power (as long as their information is adequately represented on the plot).
3. Analysis of Results
3.1. Exploratory Analysis

3.2. Logistic Biplot with External Information
3.2.1. Gradients of Sustainability

| EC1 | 9.04 | <0.05 | 0.56 | 90.28 | 0.65 | −0.75 | 2 |
| EC2 | 8.39 | <0.05 | 0.69 | 86.57 | 0.94 | −0.35 | 1 |
| EC3 | 7.47 | <0.05 | 0.68 | 87.96 | 0.96 | −0.28 | 1 |
| EC4 | 5.69 | <0.05 | 0.44 | 78.24 | 0.94 | 0.42 | 1 |
| EC6 | 7.36 | <0.05 | 0.62 | 82.41 | 0.91 | 0.42 | 1 |
| EC7 | 7.23 | <0.05 | 0.62 | 86.11 | 0.83 | 0.55 | 1 |
| EC8 | 10.60 | <0.05 | 0.80 | 87.96 | 0.63 | −0.78 | 2 |
| EN1 | 14.13 | <0.05 | 0.83 | 89.81 | 0.51 | −0.86 | 2 |
| EN2 | 13.51 | <0.05 | 0.69 | 87.04 | 0.94 | −0.34 | 1 |
| EN3 | 6.84 | <0.05 | 0.39 | 81.02 | 0.99 | 0.15 | 1 |
| EN4 | 6.68 | <0.05 | 0.61 | 83.80 | 0.59 | −0.81 | 2 |
| EN8 | 6.20 | <0.05 | 0.56 | 82.87 | 0.72 | −0.69 | 1 |
| EN16 | 11.67 | <0.05 | 0.72 | 86.11 | −0.77 | 0.64 | 1 |
| EN17 | 9.70 | <0.05 | 0.63 | 83.80 | −0.64 | 0.77 | 2 |
| EN19 | 11.26 | <0.05 | 0.69 | 85.18 | 0.66 | −0.75 | 2 |
| EN20 | 16.53 | <0.05 | 0.79 | 88.43 | 0.57 | −0.82 | 2 |
| EN21 | 10.03 | <0.05 | 0.63 | 83.33 | −0.98 | −0.19 | 1 |
| EN22 | 12.01 | <0.05 | 0.73 | 87.50 | 0.76 | −0.65 | 1 |
| EN23 | 8.42 | <0.05 | 0.68 | 84.72 | −0.80 | 0.60 | 1 |
| EN26 | 9.84 | <0.05 | 0.73 | 87.04 | 0.40 | 0.92 | 2 |
| EN27 | 11.51 | <0.05 | 0.71 | 87.04 | 0.94 | 0.34 | 1 |
| EN28 | 17.01 | <0.05 | 0.75 | 87.96 | 0.89 | 0.44 | 1 |
| LA10 | 6.62 | <0.05 | 0.55 | 83.33 | 0.97 | −0.23 | 1 |
| LA14 | 5.40 | <0.05 | 0.49 | 81.02 | 0.66 | 0.75 | 2 |
| HR6 | 8.82 | <0.05 | 0.69 | 85.65 | 0.85 | 0.53 | 1 |
| S01 | 6.81 | <0.05 | 0.63 | 87.04 | 0.44 | 0.90 | 2 |
| S04 | 17.80 | <0.05 | 0.86 | 93.06 | −0.45 | −0.89 | 2 |
| S05 | 9.05 | <0.05 | 0.70 | 84.72 | −0.47 | −0.88 | 2 |
| S08 | 20.04 | <0.05 | 0.84 | 89.35 | 0.72 | −0.69 | 1 |
| S09 | 27.39 | <0.05 | 0.93 | 96.30 | 0.93 | −0.37 | 1 |
| S010 | 23.25 | <0.05 | 0.89 | 95.37 | 0.95 | 0.30 | 1 |
| PR1 | 8.07 | <0.05 | 0.58 | 84.72 | 0.39 | 0.92 | 2 |
| PR3 | 6.48 | <0.05 | 0.58 | 81.48 | 0.65 | −0.75 | 2 |
| PR6 | 6.12 | <0.05 | 0.55 | 81.02 | 0.94 | −0.35 | 1 |
- (i)
- One of them consists of environmental indicators: (EN1, EN2 Materials), (EN16, EN17, EN19, EN20, EN21, EN22 Emissions, Effluents, and Waste), (EN26 and EN27 Products and Services), all with high positive correlation, that means that when one of them is reported all the rest are also reported. PR1 (Health and safety impacts of products) and EC1 (Economic Performance), are strongly related to the previous group of environmental indicators, but they are indicators with low discriminating power because most companies report them.
- (ii)
- EN8 (Water) and EN23 (Total number and volume of significant spills.) which are also environmental indicators are strongly related to each other, but have a weak inverse relationship with the previous group: that is, when the companies report these indices, they generally do not report indices belonging to the previous group. The latter two environmental indicators covary strongly with socio-economic aspects, HR6 (Child Labor), (EC6, EC7, Market Presence), EC8 (Indirect Economic Impacts) and institutional aspects, SO5 (Public Policy), PR6 (Marketing Communications) and LA10 (Training and Education).
- (iii)
- Another group of indices that strongly covariance between them and present a positive, but weaker relationship, with the two previously mentioned groups, is formed by Socioeconomics aspects EC3 (Coverage of the organization’s defined benefit plan obligations), SO1 (Local community engagement), Institutionalize PR3 (Product and Service Labelling), and Environment (EN4 Energy and EC2 Financial implications due to climate change.)
- (iv)
- The fourth group consists of the indices EN28 and SO8 (Compliance, monetary and non-monetary sanctions for non-compliance with environmental laws and regulation, respectively), PR9 (Compliance monetary value for non-compliance with laws and regulations concerning the provision and use of products and services), SO4 (Actions taken in response to incidents of Corruption), SO9 and SO10 (Negative impacts on local communities). SO9 and SO10 are two of the indices added in G3.1. This group of indices are more correlated with the second factorial axis (vertical), and thus forms the second gradient sustainability. According to this gradient, it is possible to order the companies projecting them onto this second axis. In this way it is possible to order the companies according to the type of the report, companies with G3 (on the top) and companies with G3.1, down. In addition, it is possible to differentiate which are penalized for not complying with the law, those that comply with legislation.
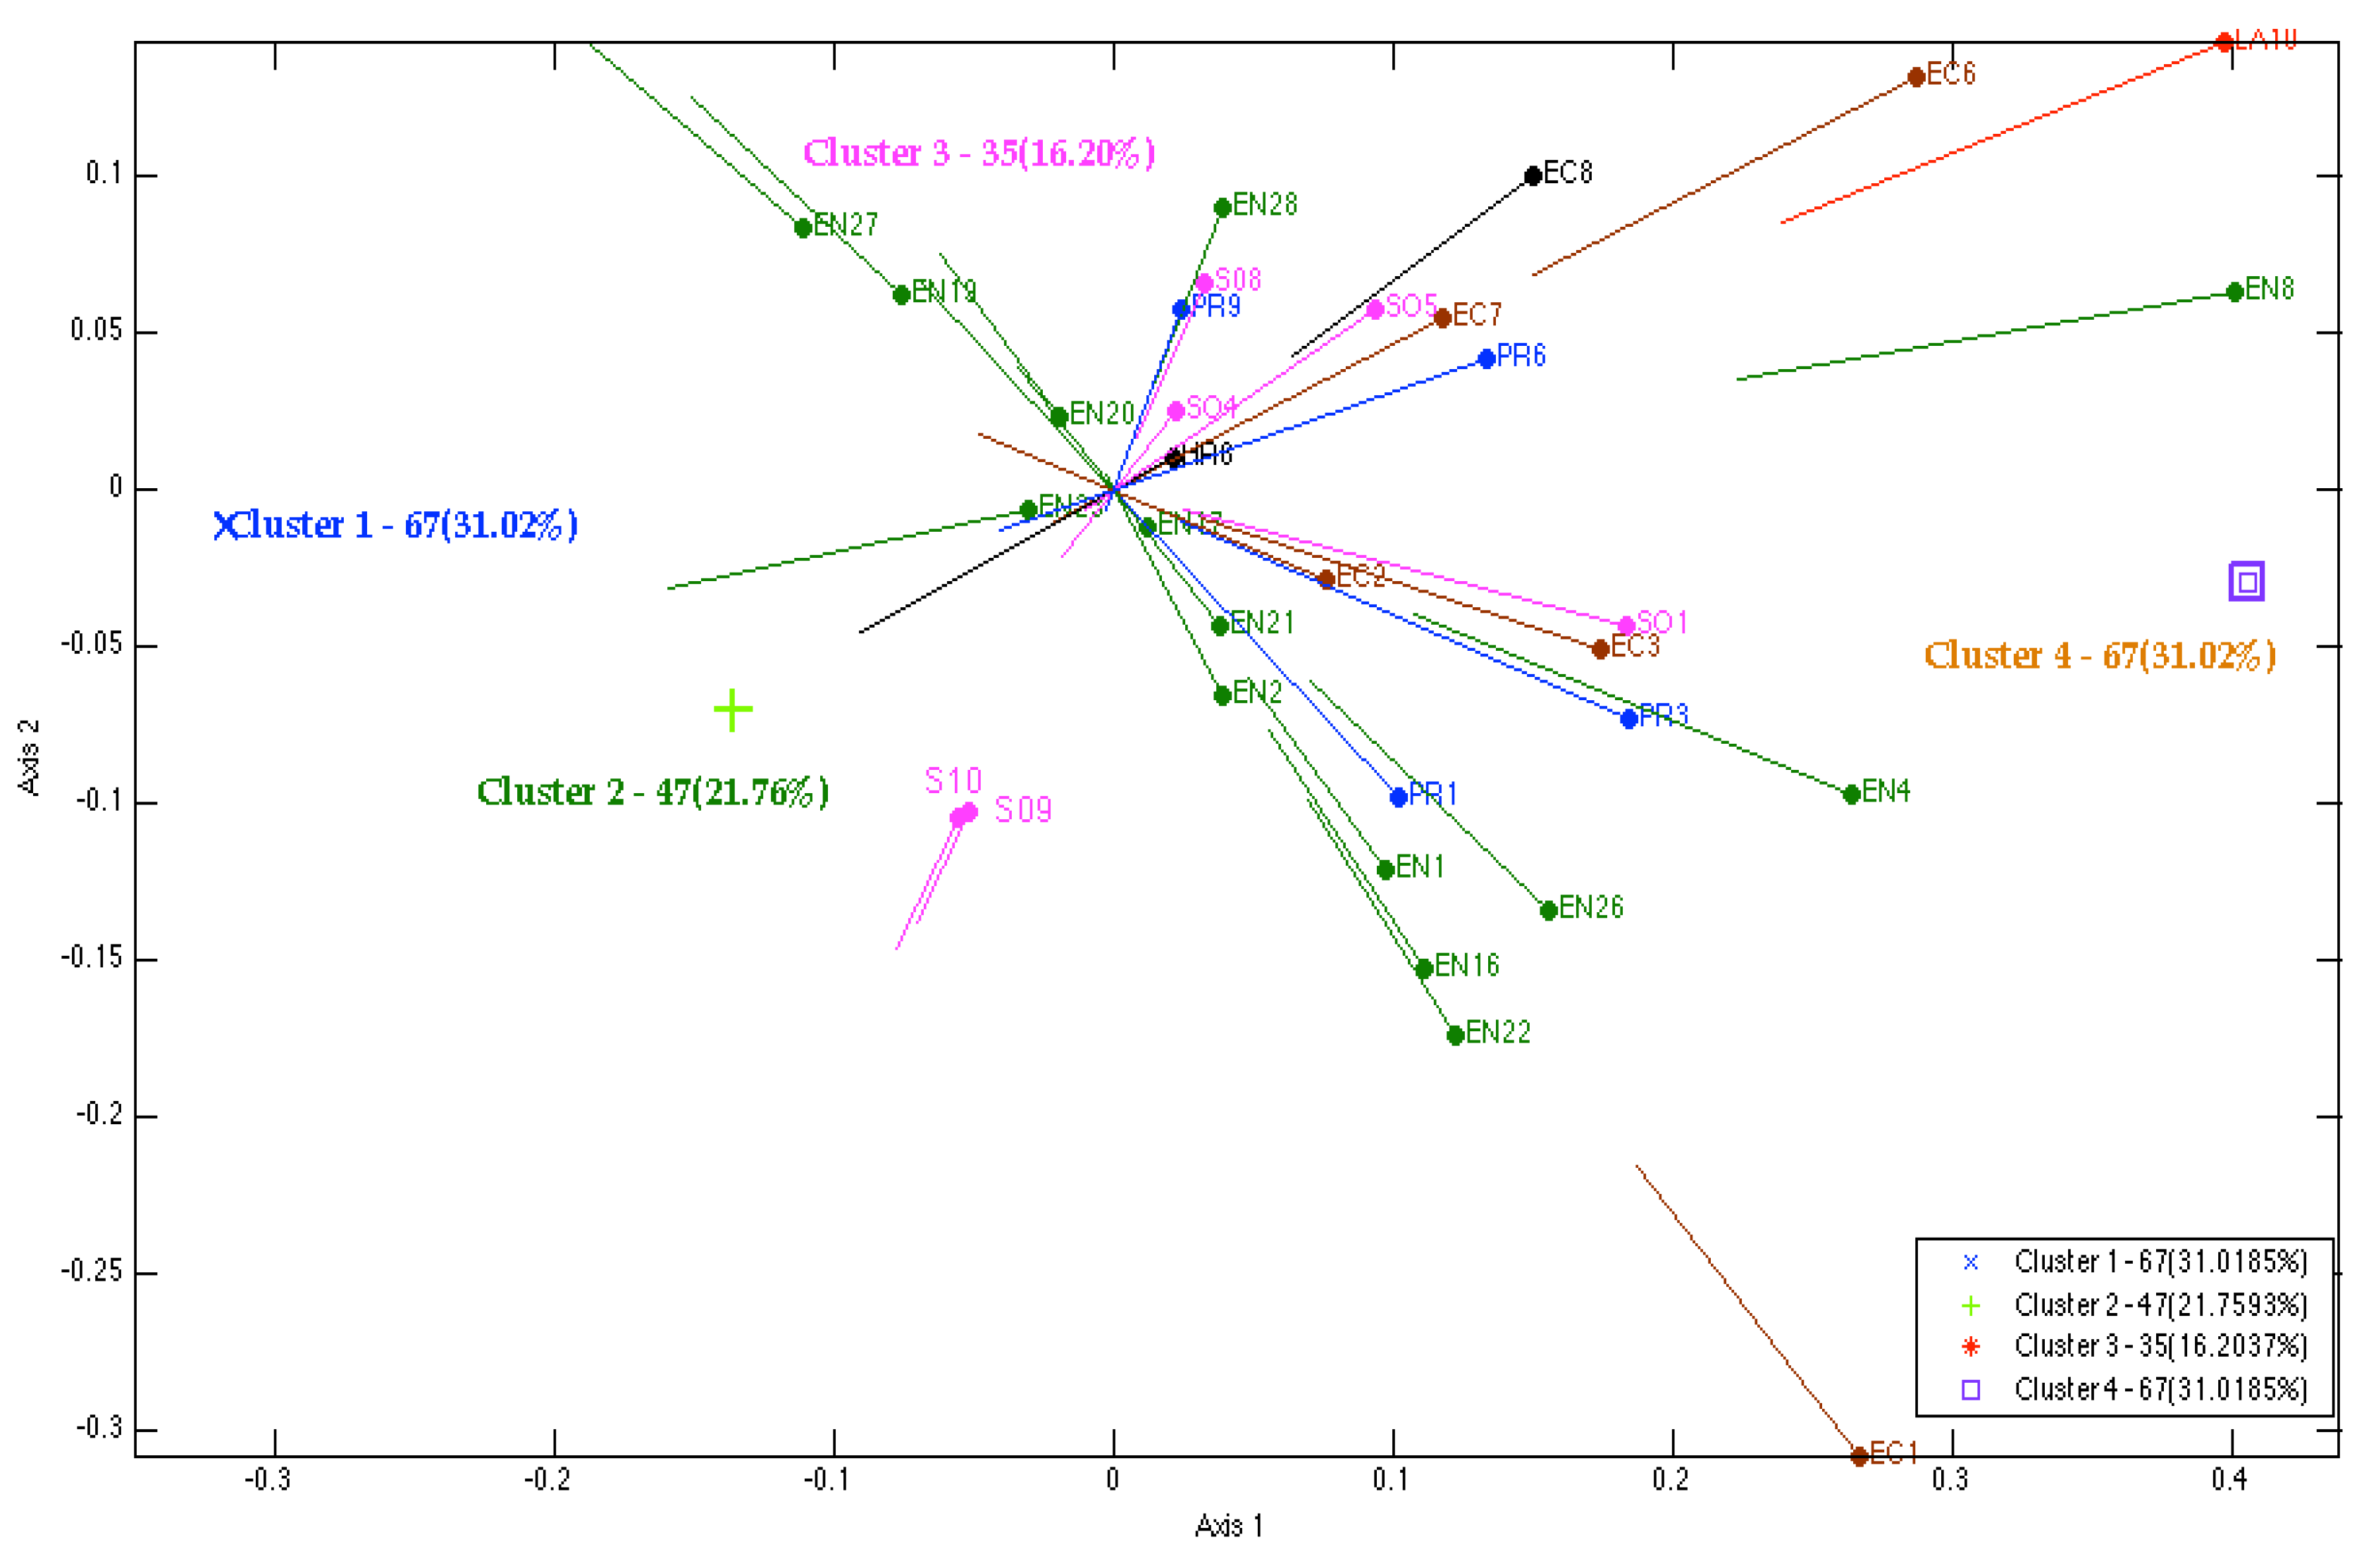
3.2.2. Clusters of Sustainability

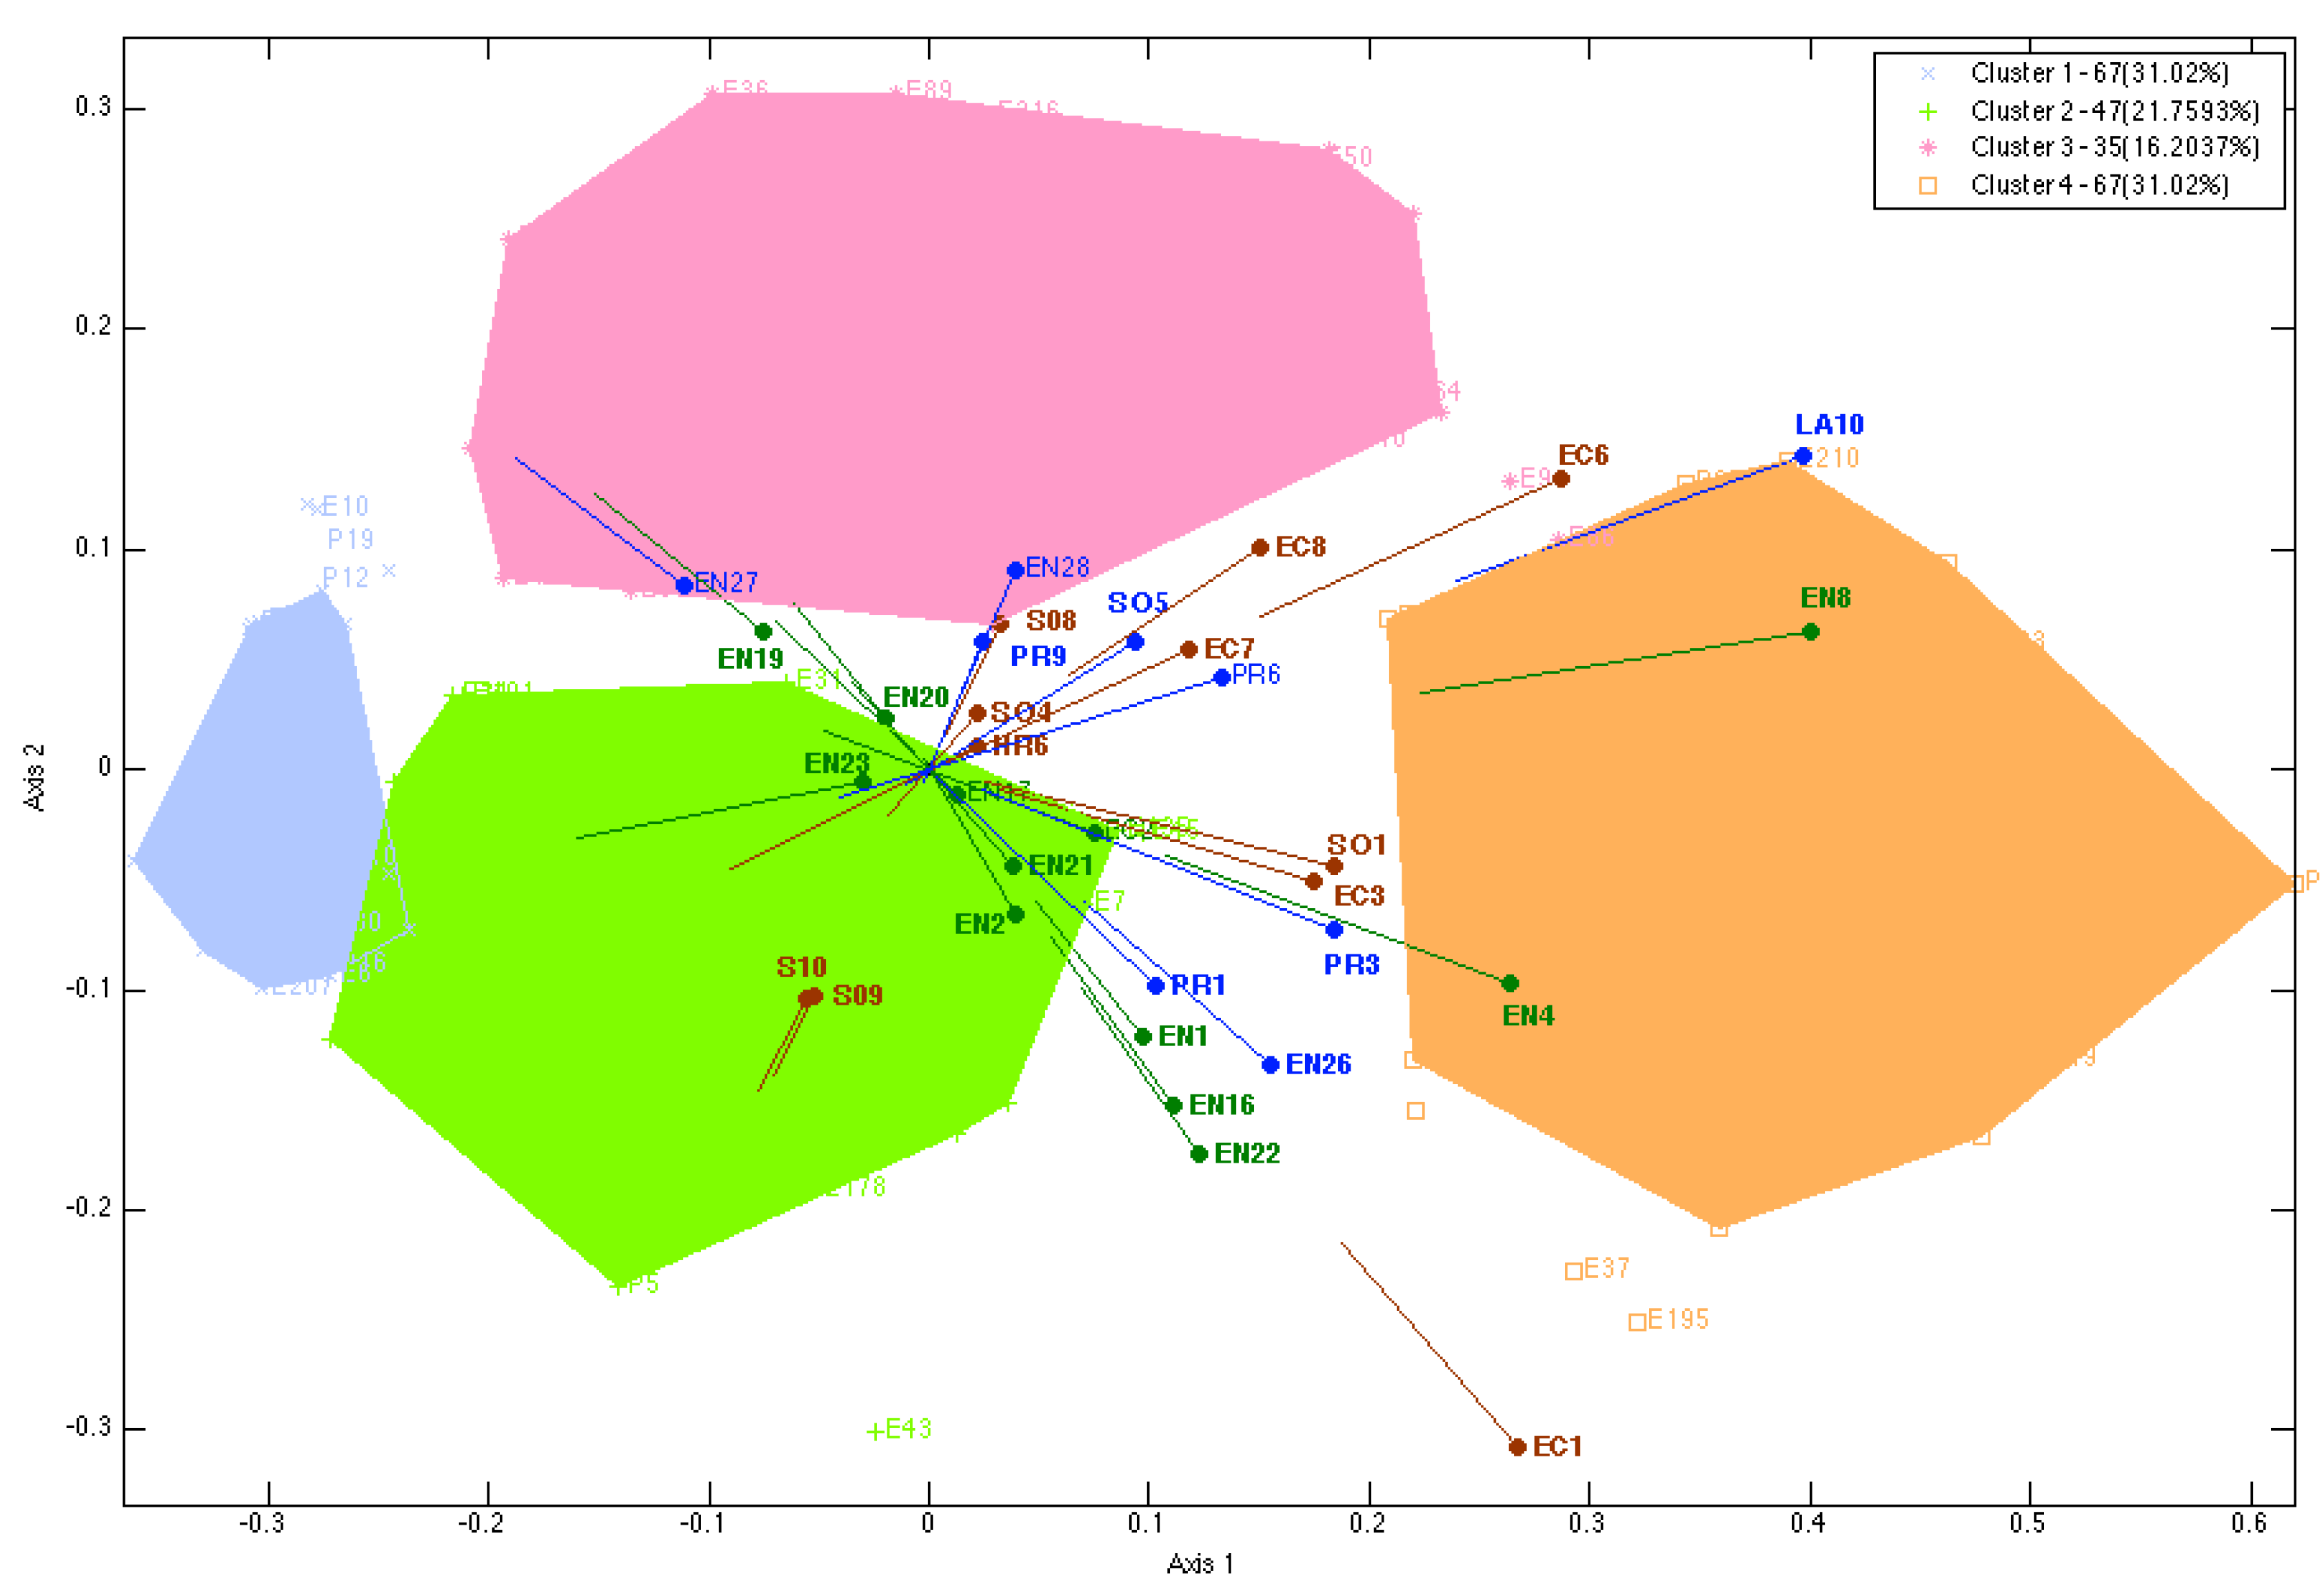
- (i)
- Cluster 1 (in blue) with 67 companies (31%) is the cluster formed by the companies reporting the most sustainability indices, i.e., this cluster contains the companies with highest level of contribution towards sustainability. The convex hull occupies a small area, not because the cluster is formed by few companies, but because they all have a very similar profile based on the fact that all companies reported all indicators. As can be seen, if we project the cluster on each and every one of the indicators, the projection belongs to the region of presence. In Table 4, it is possible that all companies belonging to Cluster 1, the 100% rate reported the indexes EC1, EC6, EN8, EN21, EN22, EN23, EN26, EN28, SO4 and PR3. More than 90% of the firms in this cluster report all other indices except SO9 that is reported by the 67.16% and SO10 that is reported by 65.67% of the firms in this cluster. It should be noted that these two indices are incorporated in the G3.1.
- (ii)
- Companies belonging to Cluster 2 (in green), 47 companies (21.76%), and companies belonging to Cluster 3 (in pink), 34 companies (15.74%) and companies belonging to Cluster 4 (in orange), 68 companies (31.48%), occupy similar positions in relation to the horizontal gradient sustainability but are differentiated by axis 2. Cluster 2 can be considered second in relation to the level of sustainability. In Cluster 2, the only indicator EC8, is reported by 100% of the firms in this cluster, between 90% and 99% of companies in this cluster reported EC1, EC4, EC6, EN4, EN8, EN22, LA10, SO4 and SO8. Between 80% and 90% companies in this Cluster 2, reported EC2, EC7, EN1, EN3, EN16, EN26, EN28, LA14, SO1, SO5 and PR9. Between 70 and 80% of companies in this cluster reported EN2, HR6, PR3 and PR6. Less than 30% of companies in Cluster 2 reported EN19, EN20 and EN27. The two indices included in the G3.1, SO9 and SO10, are only reported by 47% of companies in this cluster.
- (iii)
- No sustainability index was reported by 100% of companies in Cluster 3 (in pink). The EC1, EN1, EN2, EN16, EN22 and LA10 indices are reported by more than 90% of the firms in the cluster. Between 80% and 90% of the companies in Cluster 3 reported the EC6, EN3, EN8, EN26, PR1 SO1 and indexes. Between 70 and 80% of companies in Cluster 3 reported the EC3, EN4, EN17, EN20, EN21 and PR3 indexes. Less than 30% of companies in Cluster 3 reported EN23, EN28, SO4, SO9, SO10 and PR9. Note that while 47% of companies in Cluster 2 reported the two new indices G3.1, SO9, SO10, but in this cluster only reported the 8.57% and 11.43%.
- (iv)
- Cluster 4 (in orange) with 67 companies (31%) is the cluster formed by firms with lower levels of contribution towards sustainability, i.e., consists of firms with the least indices reported. Only EC1 index is reported by a 73% increase of companies in this cluster, all other indices are reported by a significantly lower percentage of companies.
| N = 216 | n | Cluster 1 67 | Cluster 2 47 | Cluster 3 34 | Cluster 4 68 |
|---|---|---|---|---|---|
| Country N = 216 n Spain = 178 n Portugal = 38 | Spain | (49) 73.1% | (36) 76.6% | (32) 94.1% | (61) 89.7% |
| Portugal | (18) 26.9% | (11) 23.4% | (2) 5.9% | (7) 10.3% | |
| p = 0.013 | |||||
| % calculated relative to its country total | 27.5% S/47.4% P | 20.2% S/28.9% P | 18.0% S/5.3% P | 34.3% S/18.4% P | |
| Report n = 155 | GRI-G3 | (13) 34.2% | (10) 30.3% | (13) 56.5% | (32) 52.5% |
| GRI-G3.1 | (25) 65.8% | (23) 69.7% | (10) 43.5% | (29) 47.5% | |
| p = 0.065 | |||||
| Sector n = 216 | Primary Sector | (0) 0% | (0) 0% | (0) 0% | (1) 1.5% |
| Industry Sector | (1) 1.5% | (2) 4.3% | (3) 8.8% | (1) 1.5% | |
| Water Energy | (19) 28.4% | (8) 17% | (5) 14.7% | (5) 7.4% | |
| CoNstruction | (5) 7.5% | (3) 6.4% | (2) 5.9% | (4) 5.9% | |
| Services Sector | (32) 47.8% | (24) 51.1% | (13) 38.2% | (33) 48.5% | |
| AdmSocServic | (2) 3.0% | (3) 6.4% | (5) 14.7% | (3) 4.4% | |
| EDucation | (1) 1.5% | (0) 0% | (0) 0% | (4) 5.9% | |
| OThers | (7) 10.4% | (7) 14.9% | (6) 17.6% | (17) 25.0% | |
| p = 0.053 | |||||
| Size n = 216 | Large | (60) 89.6% | (32) 68.1% | (18) 52.9% | (17) 25.0% |
| Medium | (4) 6.0% | (7) 14.9% | (6) 17.6% | (3) 4.4% | |
| Small | (3) 4.5% | (8) 17% | (10) 29.4% | (48) 70.6% | |
| p = 0.000 | |||||
| Type n = 100 | Private | (18) 69.2% | (7) 58.3% | (6) 42.9% | (35) 72.9% |
| Public | (4) 15.4% | (0) 0.0% | (1) 7.1% | (1) 2.1% | |
| Other | (4) 15.4% | (5) 41.7% | (7) 50% | (12) 25% | |
| p = 0.017 | |||||
| Status n = 154 | GRI- Checked | (20) 51.3% | (21) 63.6% | (15) 65.2% | (12) 20.3% |
| Third Part checked | (13) 33.3% | (8) 24.2% | (3) 13.0% | (18) 30.5% | |
| Self declared | (6) 15.4% | (4) 12.1% | (4) 17.4% | (25) 42.4% | |
| Undeclared | (0) 0.0% | (0) 0.0% | (1) 4.3% | (4) 6.8% | |
| p = 0.000 | |||||
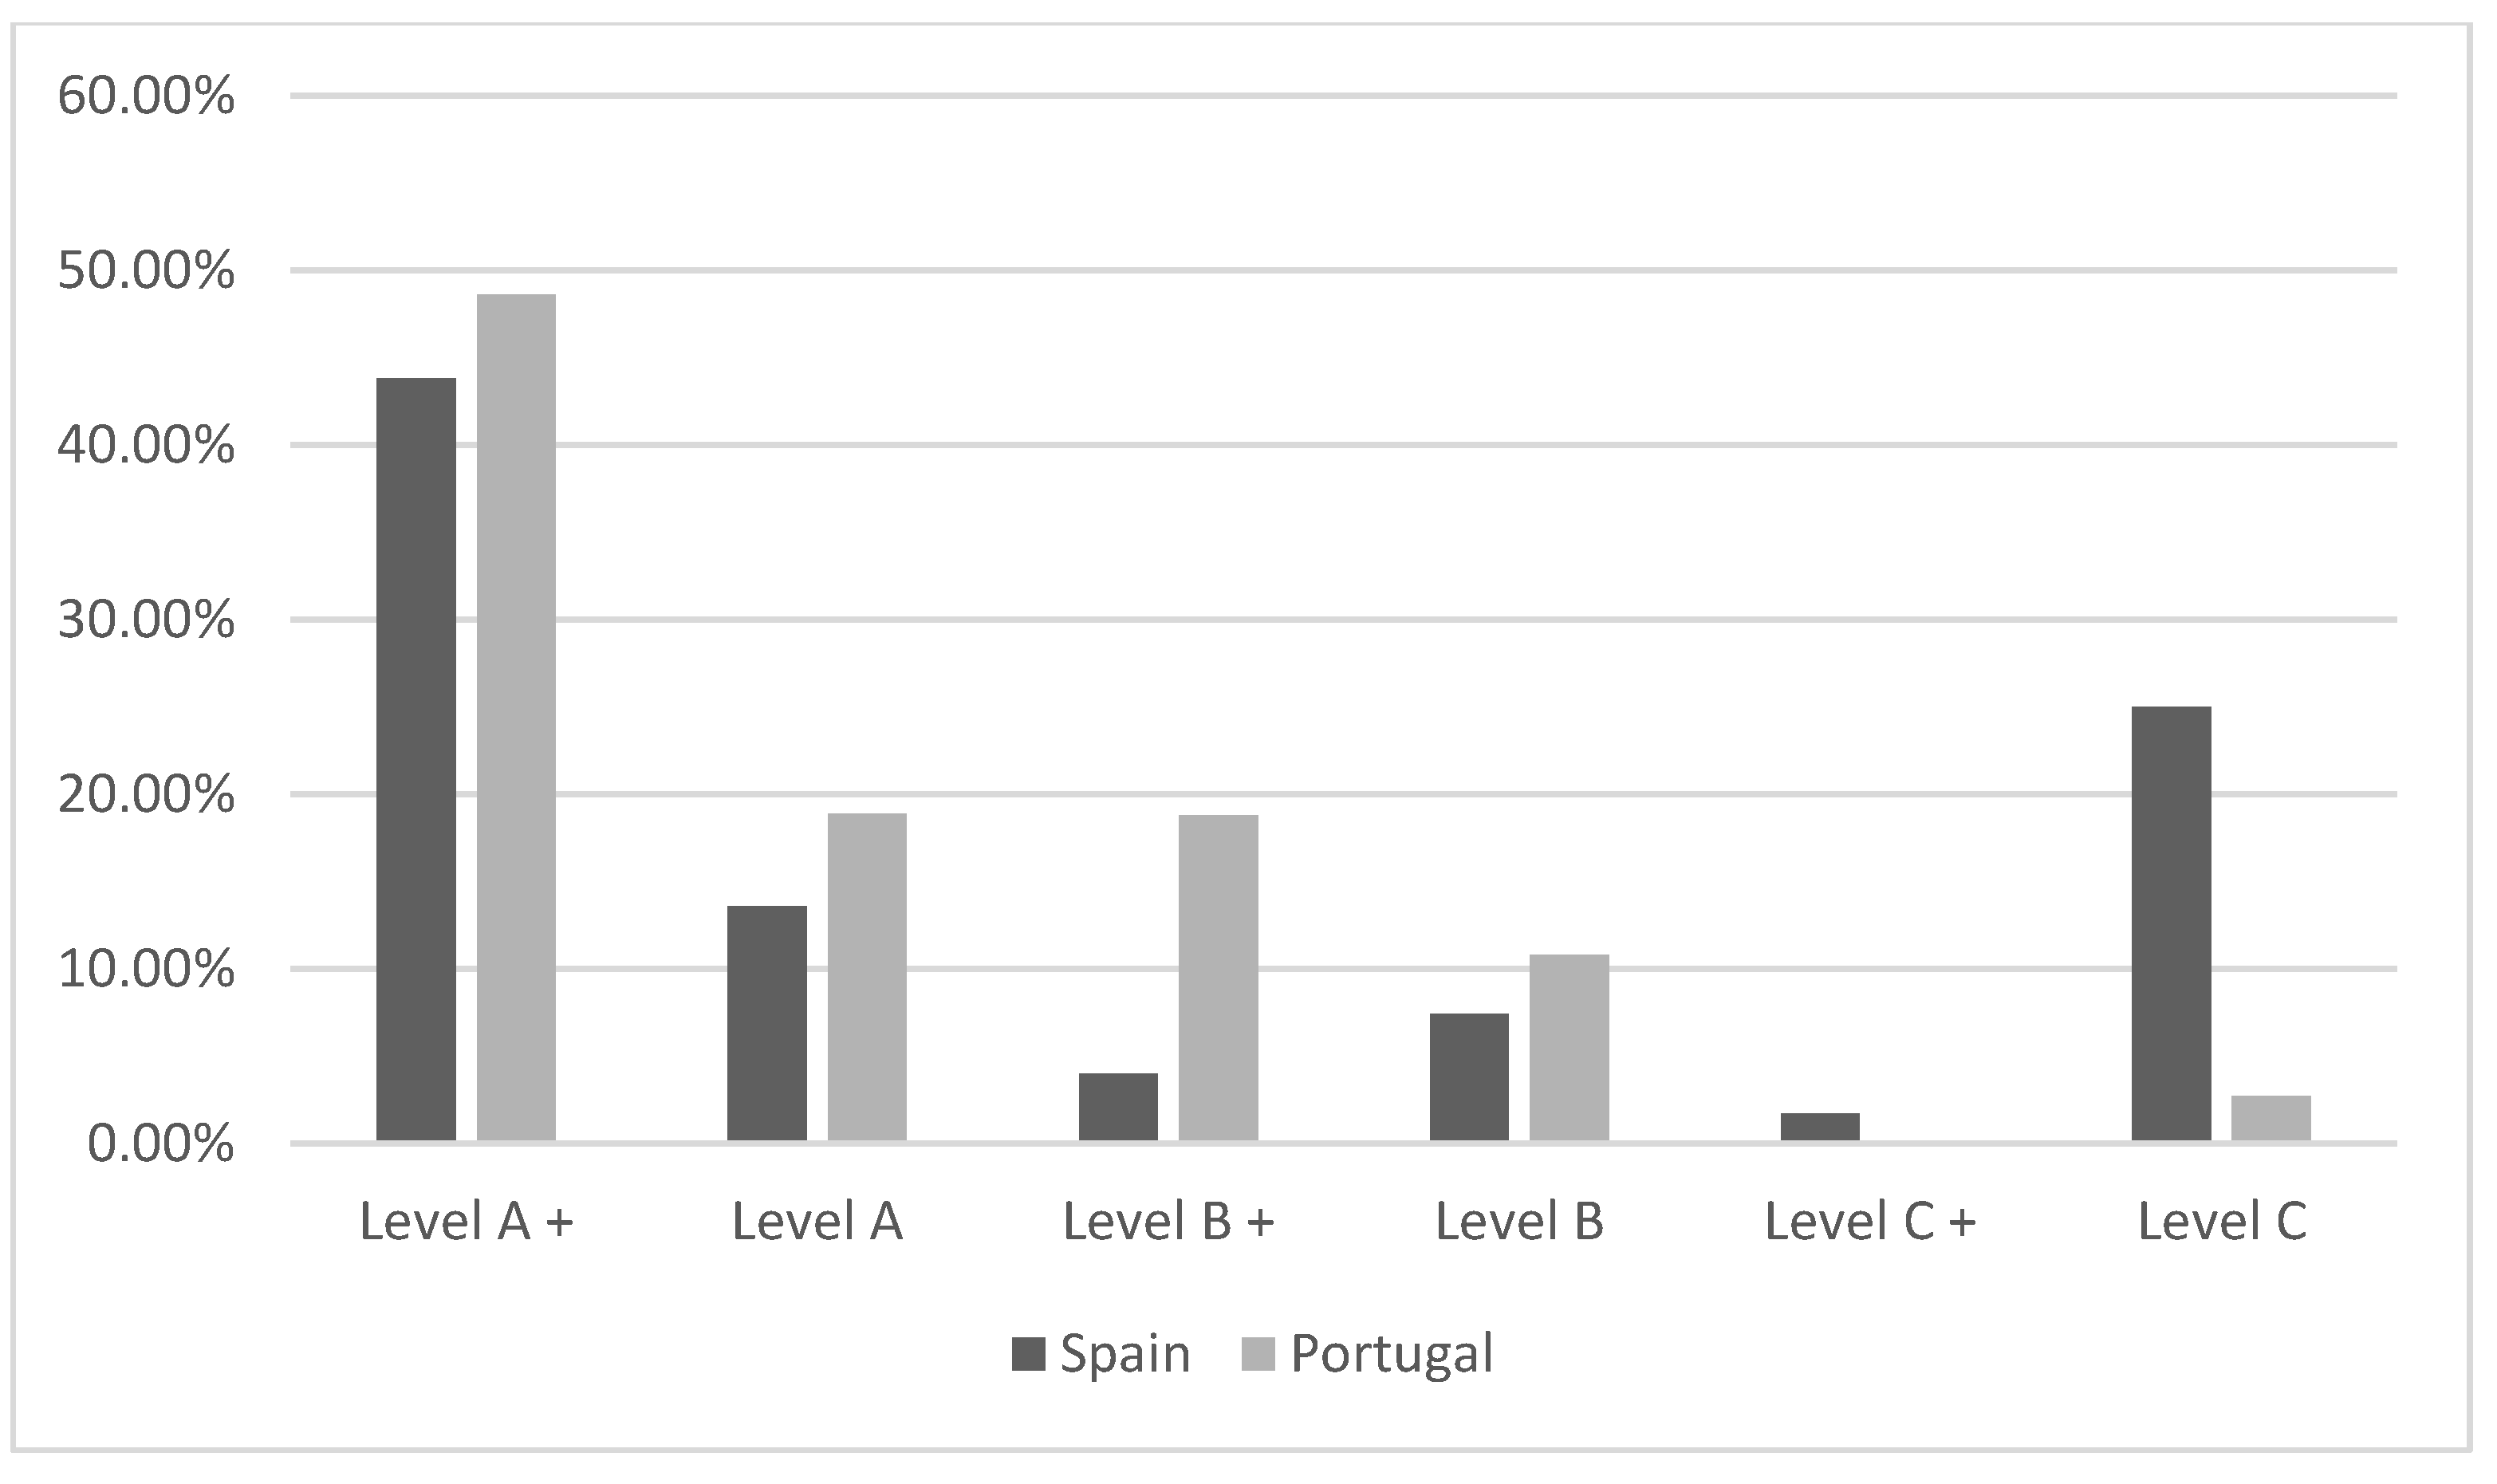
| Applicat Level n = 155 | C | (0) 0.0% | (1) 3.0% | (3) 13.05 | (38) 63.3% |
| C+ | (0) 0.0% | (0) 0.0% | (0) 0.0% | (3) 5.0% | |
| B | (1) 2.6% | (3) 9.1% | (2) 8.7% | (6) 10.0% | |
| B+ | (1) 2.6% | (5) 15.2% | (3) 13.0% | (4) 6.7% | |
| A | (10) 25.6% | (7) 21.2% | (4) 17.4% | (0) 0.0% | |
| A+ | (27) 69.2% | (17) 51.5% | (11) 47.8% | (3) 5.0% | |
| Undeclared | (0) 0.0% | (0) 0.0% | (0) 0.0% | (6) 10.0% | |
| p = 0.000 |
4. Discussion of Results
| Cluster 1 | |||||
|---|---|---|---|---|---|
| EC1 | 95.52 | EC2 | 95.52 | EN26 | 100.0 |
| EC3 | 97.01 | EN1 | 100 | EN27 | 85.07 |
| EC4 | 98.51 | EN2 | 91.04 | EN28 | 100.0 |
| EC6 | 100.0 | EN3 | 100 | LA10 | 98.51 |
| EC7 | 95.52 | EN4 | 97.02 | SO5 | 98.51 |
| EC8 | 98.51 | EN8 | 100 | PR1 | 95.52 |
| LA14 | 92.54 | EN16 | 98.51 | PR3 | 100.0 |
| HR6 | 97.02 | EN17 | 95.52 | PR6 | 98.51 |
| SO1 | 98.51 | EN19 | 92.54 | ||
| SO4 | 100.0 | EN20 | 98.51 | ||
| SO8 | 95.52 | EN21 | 100 | ||
| SO9 | 67.16 | EN22 | 100 | ||
| SO10 | 65.67 | EN23 | 100 | ||
5. Conclusions
- Reporting on the assessment to sustainability measures is an increasing practice within Portuguese and Spanish corporation, in particular services or water and energy sector. In Portugal more than 60% of all the reports have origin in the services.
- In relation to size, in Portugal large companies report more; Spanish small companies are more active in recording their results. Most corporations have chosen an A+ kind of assessment, meaning that they are opened to have their data confirmed by external assurance in the classification process.
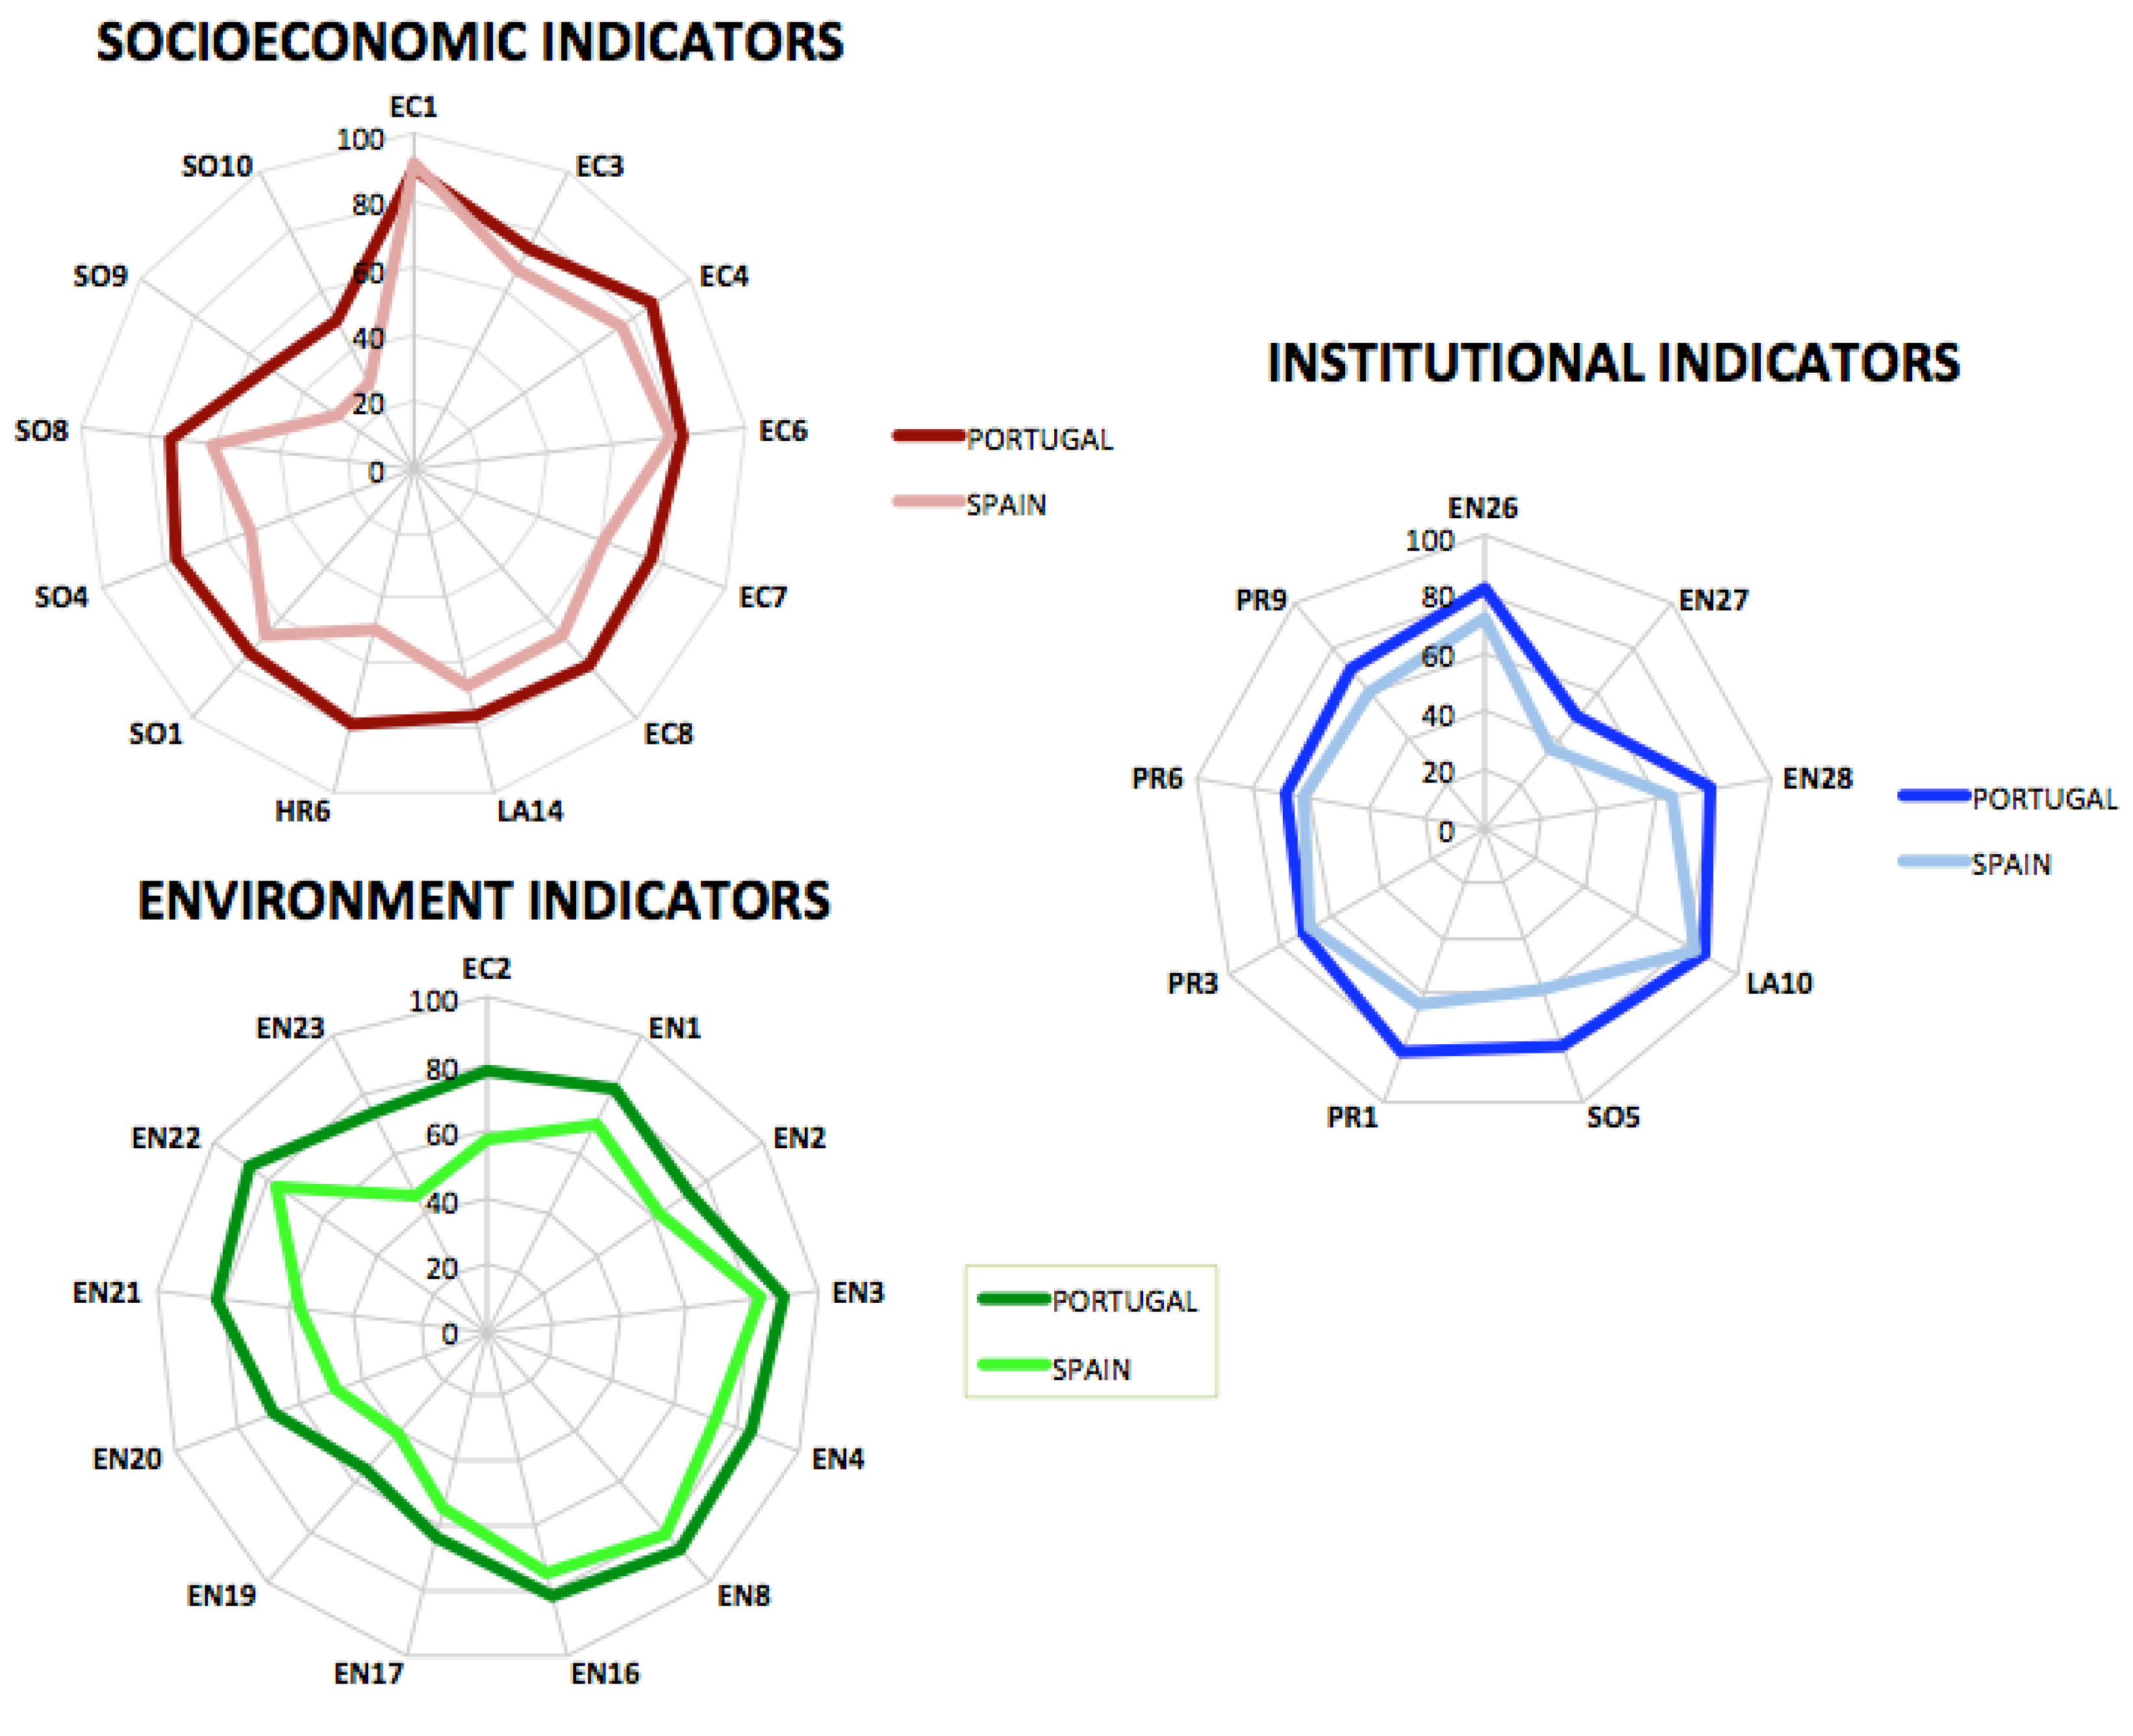
- When observing the three set of indicators, we can conclude that a few indicators are not meaningful to the reported initiatives. The most expressive examples differ between Portugal and Spain. For the Portuguese case, they are related to effluents and emissions, operations with negative impact on the communities and waste; For Spain, significant missing data is detected in used material in the productive processes, mitigation measures for operations with negative impact on the communities and waste, just like in Portugal.
- Corporation behavior when reporting can be grouped in four groups. The most expressive group contains 67 companies, 49 from Spain and 18 from Portugal. Most of them from the private sector. There is also a significant amount of corporation that do not report fully and we assume they have lower levels of sustainability. Most of them, 90%, are located in Spain, are small and belong to services.
- Those indicators that are more prompt to be reported are market presence, public policy, usage of materials and water, institutional dimension of products and compliance.
Acknowledgements
Conflicts of Interest
References
- Vaz, E.; Walczynska, A.; Nijkamp, P. Regional challenges in tourist wetland systems: An integrated approach to the Ria Formosa in the Algarve, Portugal, 2013. Reg. Environ. Change 2013, 13, 33–42. [Google Scholar] [CrossRef]
- Noronha Vaz, T.; Galindo, P.V.; Vaz, E.; Nijkamp, P. Innovative firms behind the regions: Analysis of regional innovation performance in Portugal by external logistic biplots. Eur. Urban Reg. Stud. 2013. [Google Scholar] [CrossRef]
- Ghisetti, C.; Quatrato, F. Beyond inducement in climate change: Does environmental performance spur environmental technologies? A regional analysis of cross-sectoral differences. Ecol. Econ. 2013, 96, 99–113. [Google Scholar] [CrossRef] [Green Version]
- Spangenberg, J.H.; Pfahl, S.; Deller, K. Towards indicators for institutional sustainability: Lessons from an analysis of Agenda 21. Ecol. Indic. 2002, 2, 61–77. [Google Scholar] [CrossRef]
- Shields, D.J.; Šolarb, S.V.; Martin, W.E. The role of values and objectives in communicating indicators of sustainability. Ecol. Indic. 2002, 2, 149–160. [Google Scholar] [CrossRef]
- Mitchell, G.; May, A.; McDonald, A. PICABUE: A methodological framework for the development of indicators of sustainable development. Int. J. Sustain. Dev. World Ecol. 1995, 2, 104–123. [Google Scholar] [CrossRef]
- Holling, C.S. Adaptative Environmental Assessment and Management; Wilrey: London, UK, 1978. [Google Scholar]
- Marimon, F.; Alonso-Almeida, M.M.; Rodriguez, M.P.; Cortez, C.A. The worldwide diffusion of the global reporting initiative: What is the point? J. Clean. Prod. 2012, 33, 132–144. [Google Scholar] [CrossRef]
- Perez-Batres, L.A.; Miller, V.V.; Pisani, M.J. CSR, sustainability and the meaning of global reporting for Latin American corporations. J. Bus. Ethics 2010, 91, 193–209. [Google Scholar] [CrossRef]
- Brown, H.S.; de Jong, M.; Levy, D.L. Building institutions based on information disclosure: Lessons from GRI’s sustainability reporting. J. Clean. Prod. 2009, 17, 571–580. [Google Scholar] [CrossRef]
- Global Reporting Initiative. What is GIR. Available online: https://www.globalreporting.org/information/about-gri/what-is-GRI/Pages/default.aspx (accessed on 20 December 2014).
- Global Reporting Initiative. Available online: http://www.globalreporting.org (accessed on 12 November 2014).
- METADATA—Statistical Classification of Economic Activities in the European Community, Rev. 2 (2008). Available online: http://ec.europa.eu/eurostat/ramon/nomenclatures/index.cfm?TargetUrl=LST_NOM_DTL&StrNom=NACE_REV2&StrLanguageCode=EN (accessed on 12 November 2014).
- Vicente-Villardon, J.L.; Galindo-Villardon, M.P.; Blazquez-Zaballos, A. Logistic Biplots. In Multiple Correspondence Analysis and Related Methods; Greenacre, M., Blasius, J., Eds.; Statistics in Social and Behavioral Sciences Series: Boca Raton, FL, USA, 2006; pp. 503–521. [Google Scholar]
- Demey, J.R.; Vicente-Villardón, J.L.; Galindo, M.P.; Zambrano, A.Y. Identifying molecular markers associated with classifications of genotypes by external logistic biplot. Bioinformatics 2008, 24, 28–32. [Google Scholar] [CrossRef]
- Alazzani, A.; Wan-Hussin, W.N. Global reporting initiative’s environmental reporting: A study of oil and gas companies. Ecol. Indic. 2013, 32, 19–24. [Google Scholar] [CrossRef]
- MultiBiplot—Multivariate Analysis using Biplots. Available online: http://biplot.usal.es/ClassicalBiplot/index.html (accessed on 12 November 2014).
- Gower, J. A general coefficient of similarity and some of its properties. Biometric 1971, 27, 857–874. [Google Scholar] [CrossRef]
- Galindo, P.V.; Vaz, T.N.; Nijkamp, P. Institutional capacity to dynamically innovate: An application to the Portuguese case. Technol. Forecast. Soc. Change 2010, 78, 3–12. [Google Scholar] [CrossRef]
- Vaz, E.; Noronha, T.; Vicente-Galindo, P.; Nijkamp, P. Modelling innovation support systems for regional development—Analysis of cluster structures in innovation in Portugal. Entrepren. Reg. Dev. 2014, 26, 23–46. [Google Scholar] [CrossRef]
- Gallego-Álvarez, I.; Vicente-Villardón, J.L. Analysis of environmental indicators in international companies by applying the logistic biplot. Ecol. Indic. 2012, 23, 250–261. [Google Scholar] [CrossRef]
- Global Reporting Initiative. Sustainable Reporting Guidelines. 2006. Available online: http://www.globalreporting.org (accessed on 4 November 2014).
- Molden, B.; Janoušková, S.; Hák, T. How to understand and measure environmental sustainability: Indicators and targets. Ecol. Indic. 2012, 17, 4–13. [Google Scholar] [CrossRef]
© 2015 by the authors; licensee MDPI, Basel, Switzerland. This article is an open access article distributed under the terms and conditions of the Creative Commons Attribution license (http://creativecommons.org/licenses/by/4.0/).
Share and Cite
Vicente Galindo, P.; Vaz, E.; De Noronha, T. How Corporations Deal with Reporting Sustainability: Assessment Using the Multicriteria Logistic Biplot Approach. Systems 2015, 3, 6-26. https://0-doi-org.brum.beds.ac.uk/10.3390/systems3010006
Vicente Galindo P, Vaz E, De Noronha T. How Corporations Deal with Reporting Sustainability: Assessment Using the Multicriteria Logistic Biplot Approach. Systems. 2015; 3(1):6-26. https://0-doi-org.brum.beds.ac.uk/10.3390/systems3010006
Chicago/Turabian StyleVicente Galindo, Purificación, Eric Vaz, and Teresa De Noronha. 2015. "How Corporations Deal with Reporting Sustainability: Assessment Using the Multicriteria Logistic Biplot Approach" Systems 3, no. 1: 6-26. https://0-doi-org.brum.beds.ac.uk/10.3390/systems3010006