Economic Analysis of Model-Based Systems Engineering

University of Southern California, Los Angeles, CA 90089-1192, USA
*
Author to whom correspondence should be addressed.
Systems 2019, 7(1), 12; https://0-doi-org.brum.beds.ac.uk/10.3390/systems7010012
Submission received: 26 December 2018
/
Revised: 14 February 2019
/
Accepted: 15 February 2019
/
Published: 20 February 2019
(This article belongs to the Special Issue Model-Based Systems Engineering)
Abstract
:In the face of ever-increasing complexity of systems and system development programs, several aerospace, automotive, and defense organizations have already begun or are contemplating the transition to model-based systems engineering (MBSE). The key challenges that organizations face in making this decision are determining whether it is technically feasible and financially beneficial in the long-run to transition to MBSE, and whether such transition is achievable given budgetary constraints. Among other cost drivers of this transition, are a new digital infrastructure, personnel training in MBSE, and cost-effective migration of legacy models and data into the new infrastructure. The ability to quantify gains from MBSE investment is critical to making the decision to commit to MBSE implementation. This paper proposes a methodological framework for analyzing investments and potential gains associated with MBSE implementation on large-scale system programs. To this end, the MBSE implementation problem is characterized in terms of: system complexity, environment complexity and regulatory constraints, and system lifespan. These criteria are applied to systems in twelve major industry sectors to determine MBSE investment and expected gains. Results from this cost-benefit analysis are used to justify investment in MBSE implementation where warranted. This approach is generic and can be applied to different sectors for economic evaluation of costs and benefits and justification of transition to MBSE if warranted.
1. Introduction
In the face of ever-increasing complexity of systems and system development programs, several major aerospace and defense organizations are turning to model-based systems engineering (MBSE) to reduce system and program complexity. These organizations are specifically interested in determining whether MBSE is worth the investment and whether the transition to MBSE is affordable given budgetary constraints. Among other cost considerations, this transition requires a new digital infrastructure and cost-effective migration of legacy models and data into the new environment [1]. An MBSE investment also needs to cover costs associated with evaluating candidate MBSE methodologies, infrastructure implementation/extension, personnel training, model development and verification, model curation, and configuration management. While investment in MBSE implementation is made in the early stages of the system life cycle, the gains are invariably realized in the latter stages of the system life cycle. The factors that contribute to these gains include early defect detection, model and data reuse, technical and programmatic risk reduction, improved communication, supply chain efficiency, product line definition, and standards conformance. Therefore, the different industry sectors need the ability to quantify the benefits of MBSE investment to justify investing in MBSE. Despite the lack of such quantitative data, some industry sectors (e.g., aerospace, energy, and automotive), that already have systems engineering (SE) practices in place, have begun to transition to MBSE. Other industry sectors (e.g., consumer electronics, healthcare, and construction) that do not have SE practices in place are turning to SE as the preferred means to manage complexity in their respective markets. Other industries are beginning to explore possible on-ramps to accelerate MBSE implementation without disrupting their ongoing operations. However, several industries that are currently following traditional SE practices are looking for evidence to justify MBSE investment. This recognition provides the motivation for this paper.
This paper is organized as follows. Section 2 presents industry sectors that stand to benefit from SE practices. Section 3 reviews the limitations of the traditional SE approach. Section 4 discusses the potential benefits of the MBSE approach a. Section 5 presents an overview of the study approach and evaluation framework for economic analysis of MBSE implementation in the different sectors. Section 6 presents an economic analysis of the traditional SE approach. Section 7 presents an economic analysis of the MBSE approach. Section 8 compares and contrasts the economics of the two approaches in terms of their investment costs. Section 9 examines MBSE implementation in terms of key problem characteristics and their impact on MBSE investment and expected gains. Section 10 discusses how problem characterization of systems in different sectors can be used to gauge the benefits of MBSE implementation in those sectors, and then applies the approach to those sectors. Section 11 presents conclusion and discusses future MBSE advances along with their investment cost implications and expected payback.
2. Industry Sectors that Stand to Benefit from SE
Industries that stand to benefit from systems engineering can be conveniently grouped into twelve sectors: transportation and mobility, aerospace and defense, industrial equipment, energy and utilities, architecture and construction, life sciences, high-tech, marine and offshore, financial and business services, consumer goods and retail, natural resources, and consumer packaged goods and retail.
Table 1. presents the industry sectors and associated systems. The transportation and mobility sector includes original equipment manufacturers (OEMs) of cars, light and heavy trucks, buses, trains, motorcycles, racecars, and suppliers. The aerospace and defense industry sector includes commercial and military aircraft, satellites and exploration systems. The industrial equipment sector includes specialized manufacturing machinery, industrial robots, machine tools, 3D printers, power and fluidic equipment, fabricated metal and plastic products, and heavy mobile machinery. The energy, processes, and utilities sector consists of power generation and distribution systems. The architecture and construction industry deals with commercial and government infrastructures, buildings and cities. Life science includes applications of cyber–physical–human systems in pharmaceutical, biotechnology, medical devices, and patient care. The high-tech industry consists of consumer electronics, telecommunication, computing and network, technology suppliers, contract manufacturing services, security, control and instrumentation, and semiconductors. The marine and offshore sector comprises the shipbuilding industry and water transportation systems such as commercial ships, naval carriers, offshore vessels, yachts and workboats. The financial and business services sector includes systems related to banking, insurance and financial markets. The consumer and retail industry sector encompasses systems related to home, lifestyle, and fashion. The natural resources sector spans mining, oil, gas, agriculture and forestry industries. The consumer goods and retail sector span the food and beverage industry, beauty and personal care, household products, packaging suppliers, and general retailers.
In these industry sectors, there are primarily two types of organizations: (a) organizations in which SE practices are being followed and who are trying to decide whether to transition to MBSE; (b) organizations wanting to adopt SE practices. The latter are interested in determining whether to adopt traditional SE or pursue MBSE. Examples of the former are aerospace, defense, and energy. Examples of the latter are high-tech industries.
Systems in the different industry sectors differ in complexity, the characteristics of the operational environment in which they operate, and their lifespan. For example, aircraft systems have high complexity, long lifespans, and a strict regulatory environment. On the other hand, consumer electronics have relatively low complexity, short lifespans, and comparatively a loose regulatory environment. Since industry sectors differ from each other along these dimensions and the amount of investment and potential gains can be expected to vary across industry sectors, the MBSE strategy for each industry sector needs to be addressed on a case-by-case basis (i.e., it needs to be customized). In the following sections, we examine the different economic factors that impact MBSE implementation decision in the different industry sectors.
3. Limitations of Traditional (i.e., Document-Centric) Systems Engineering
In the traditional systems engineering approach, thousands of documents are generated during a system’s life cycle. For large, complicated systems such as aircraft, satellites and power plants, documents generated during program execution are numerous and include requirements specification, requirement traceability, master equipment list, concept of operations (ConOps), operational view diagrams, interface description documents, design structure matrix, test scenarios, test specifications, and deployment plans [3]. Furthermore, interface control documents (ICDs) by themselves could comprise multiple documents categorized by the type of interface. For example, mechanical interface, thermal interface and information interface have separate ICDs to avoid conflicts among individuals from different disciplines working on the same project. Furthermore, there could be hundreds of components with each requiring the development of an ICD. Consequently, for complex systems there could be thousands of documents that need to be created and maintained throughout the system life cycle. These documents are used by systems engineers during the various stages of the system development process. Specifically, they help with determining what information needs to be communicated by one team to another during system development [4]. Since the data represented in these documents do not have explicit dependencies, a change in one document needs to be reflected manually in all the other affected documents. This manual process is not only lengthy but also prone to error. Furthermore, when documents are used to facilitate communication, it is difficult to verify their completeness and consistency, and to surface conflicting or contradictory information. Finally, since documents are written in natural language (i.e., sentences and paragraphs), they are not in a suitable form for formal verification and testing [4]. Figure 1 graphically depicts traditional systems engineering and model-based systems engineering.
4. Promise of Model-Based Systems Engineering
MBSE covers several important but not all systems engineering functions [1,5]. MBSE provides opportunities to capture and harmonize information from multiple disciplines within an integrated digital model of the system [6,7,8]. Since dependencies across multiple disciplines are explicitly addressed in the model, a change made in one part of the model is automatically reflected in all the impacted parts of the model. This feature makes it possible to maintain consistent and up-to-date information in the integrated digital model. In addition, completeness, consistency, traceability and contradiction checks can be performed. As important, MBSE enables the replication of models in a hierarchy. For example, model parameters, interfaces, structure and behaviors at the system level can be replicated and integrated at the subsystem or the component level. For the same problem with traditional document-centric systems engineering, a separate document would have to be manually created at each level in the hierarchy. In sharp contrast, MBSE allows the use of models from higher level in hierarchy to rapidly develop models at lower levels. As important, documents are not viewed as data; rather, they are viewed as data repositories. With MBSE, data can be encoded into models, thereby providing an opportunity to integrate the system model across life cycle processes, and thereby promote reuse.
MBSE has achieved a positive Return on Investment (ROI) for the US Submarine Fleet. The Submarine Warfare Federated Tactical System1 (SWFTS) is a rapidly evolving, COTS-based combat system of systems (SoS) acquired by the US Navy for deployment across the Fleet. The SWFTS program integrates the combat system from component systems produced by multiple programs of record. The Program Executive Office for Submarines practices continuous process improvement in an unending quest to improve efficiency and deliver greater capability to the fleet despite increasing budget pressures. As part of this quest, in 2011 the SWFTS SoS engineering team started a three-year program to transition from the traditional document-based systems engineering process to model-based systems engineering (MBSE) process utilizing UML and SysML That transition was successfully completed and is now producing a positive return on investment (ROI) for the customer. SWFTS is a level-of-effort contract, so the ROI manifests in a combination of increased number of baselines developed, improved quality of systems engineering products, and expanded scope of work within constant funding. Since the transition to SysML-based MBSE, the average number of baselines produced on a monthly basis has increased by approximately 30%. The number of subsystems and combat system variants integrated in these baselines has increased by 60%. Over the same time period, the complexity of an average baseline, as measured by numbers of requirements and defined interfaces, has grown at 7.5% per annum. The efficiencies achieved through the transition to MBSE have also enabled the SWFTS SoS engineering team to accomplish additional tasks that had previously fallen below the funding line. One measure of this growing engineering scope is that the number of discrete systems engineering products produced by the team has increased by over 60%, with most generated directly out of the SoS model [9].
5. Study Approach
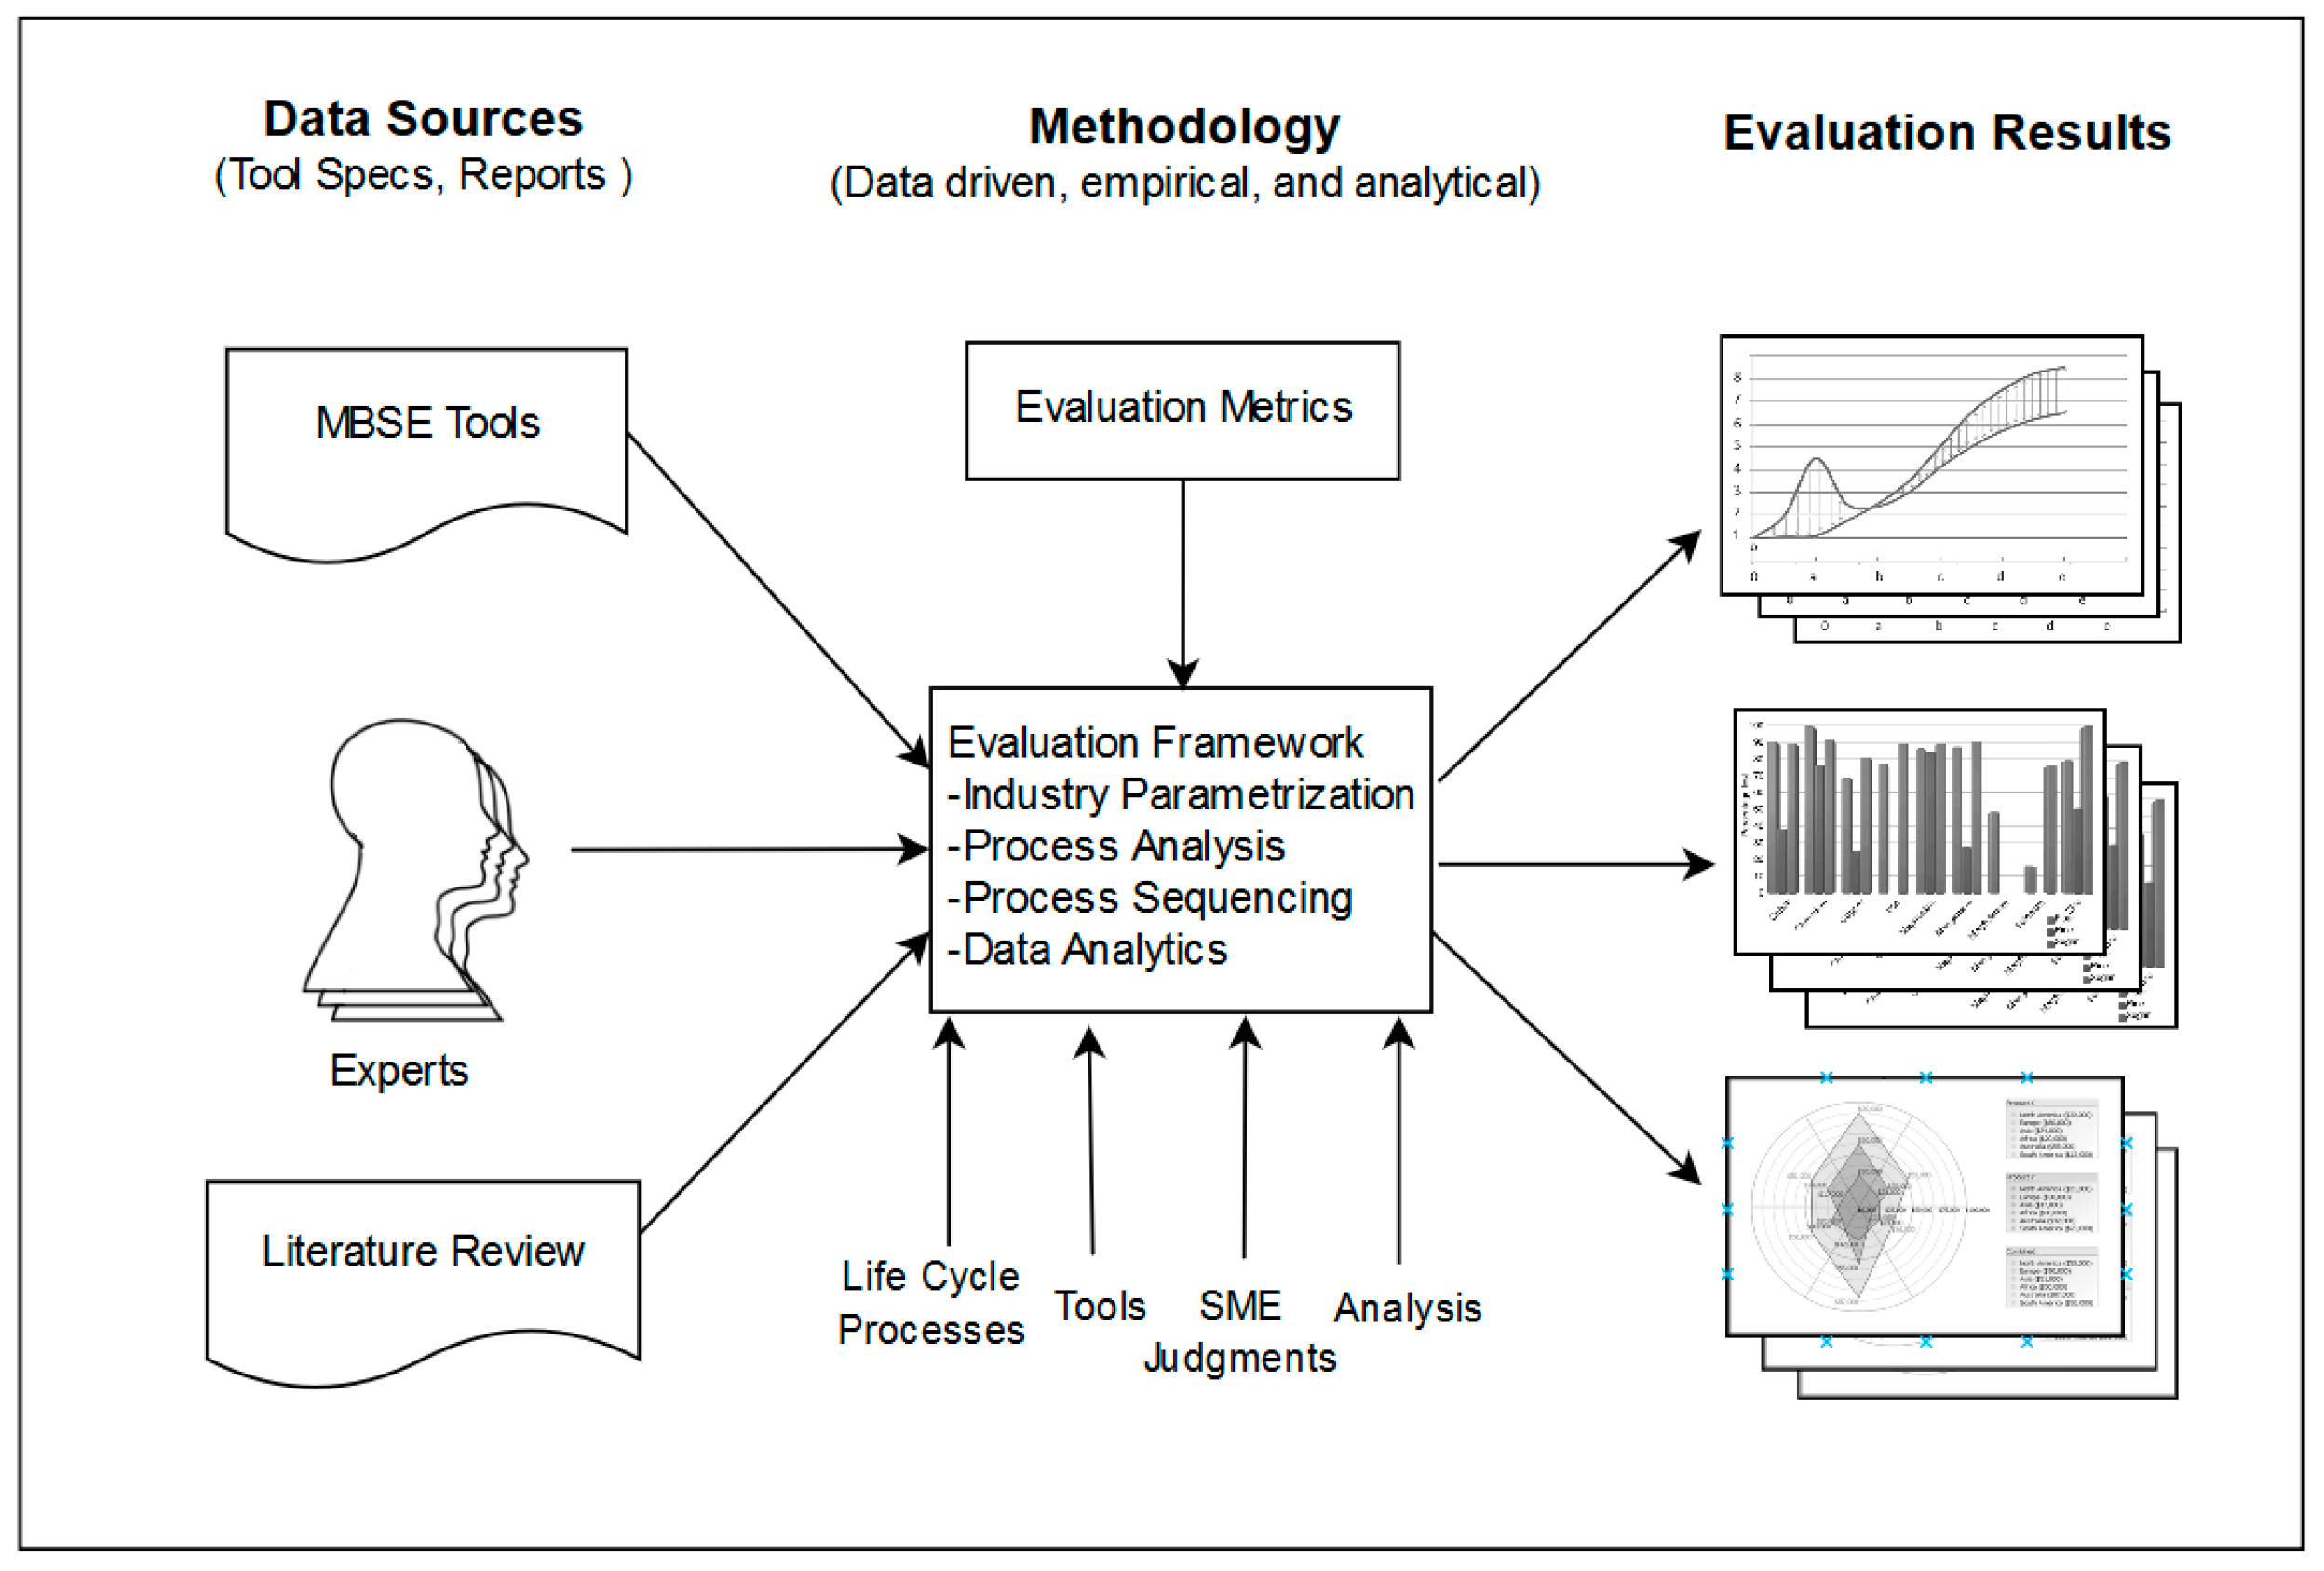
Our overall study approach is based on creating an evaluation framework Figure 2 for economic analysis of MBSE implementation. Inputs to this evaluation framework include: data on MBSE tools in the form of tool specifications and reports; lessons learned by industry experts who had gone through the process of implementing MBSE; and existing literature on high-level economic justification of MBSE. The literature on MBSE tools helped with understanding the amount of training needed in general-engineering, systems engineering, modeling languages, and methodology. The MBSE tool specifications and reports provided information on the amount of effort, cost, and talent required to implement MBSE. In addition, keynote talks from government and industry experts were used as a source of lessons learned along with anecdotal information pertaining to investments and returns associated with traditional SE and MBSE.
The overall methodology accounts for interest rates, inflation rates and risk premium in evaluating viability of MBSE implementation. The evaluation framework comprises: SE life cycle processes; guidelines for tailoring SE life cycle processes for different industries; key MBSE implementation problem characteristics such as system complexity, environment complexity, and system lifespan that help assess MBSE value proposition for different industries; parametric cost curves for traditional systems engineering and MBSE; popular MBSE tools and their coverage of the SE life cycle; process Design Structure Matrix (DSM)-based approaches for process analysis and process sequencing; and database of lessons learned on major government programs. Analysis of system life cycle processes is necessary to ensure that the framework applies to a wide range of industry sectors. Since each industry sector has somewhat different processes, analyzing processes from the perspectives of sequence, dependencies, and parallelism and evaluating their temporal characteristics is essential for calculating the net present worth of investments and returns. For example, there could be several real-world scenarios in which the transition to MBSE has already begun; in such cases, the framework can be applied to ensure maximum returns on investments already made.
In our study, we parameterized the MBSE implementation problem using the system’s internal, external and temporal (i.e., lifespan) characteristics. These characteristics were selected because they enable comparison of different industries in terms of the value that MBSE implementation can provide. With this parameterization, we discovered that there are some industry sectors which may not benefit significantly from MBSE implementation in their current circumstance, but with rapidly changing internal and external characteristics of systems in those sectors, MBSE implementation may well turn out to be beneficial in the future. These three MBSE implementation problem characteristics also provided insights into how much to spend on MBSE implementation in the different industry sectors in relative terms. With this parameterization, we were able to create clusters of industry sectors, which could potentially benefit from MBSE implementation. Applying this MBSE implementation problem characterization to each sector, it became apparent that not all sectors derived the same benefit from MBSE implementation. This was expected because based on the systems in each sector, the MBSE implementation problems are different. The clustering of industry sectors allowed us to address MBSE implementation for each cluster as a whole. Thus, a MBSE approach employed in one industry sector within a cluster can be applied to other industry sectors in the same cluster.
Evaluation metrics in Figure 2 are associated with the variables that we want to estimate using the methodology. The metrics encompass both generic measures such as effort, cost, and cycle times as well as domain-specific measures. The results of the evaluation are primarily in the form of graphs and charts. These results contribute actionable insights into when, where and to what degree to adopt MBSE to economically justify MBSE investments and returns for a particular system development project, or a family of projects.
Figure 3 presents the key steps in the overall methodology for MBSE economic analysis. It begins with characterizing the MBSE implementation problem in terms of system complexity, environment complexity, and system lifespan. These attributes are applied to different industry sectors are considered to produce key characteristics. System evaluation is performed using these characteristics to produce the characteristics of each sector. These evaluation results along with budget constraints are used to perform cost-benefit analysis. Investments, payback and their time frame are used in evaluating benefits and costs. If the benefits justify the cost of MBSE investment, the next steps in the methodology are to plan, schedule and cost the transition to MBSE. After making sure that the costs are within budget constraints, the plan is executed. On the other hand, if the benefits do not justify the cost, the organization stays with the status quo (i.e., traditional SE practices).
6. Economic Analysis of Traditional System Engineering Approach
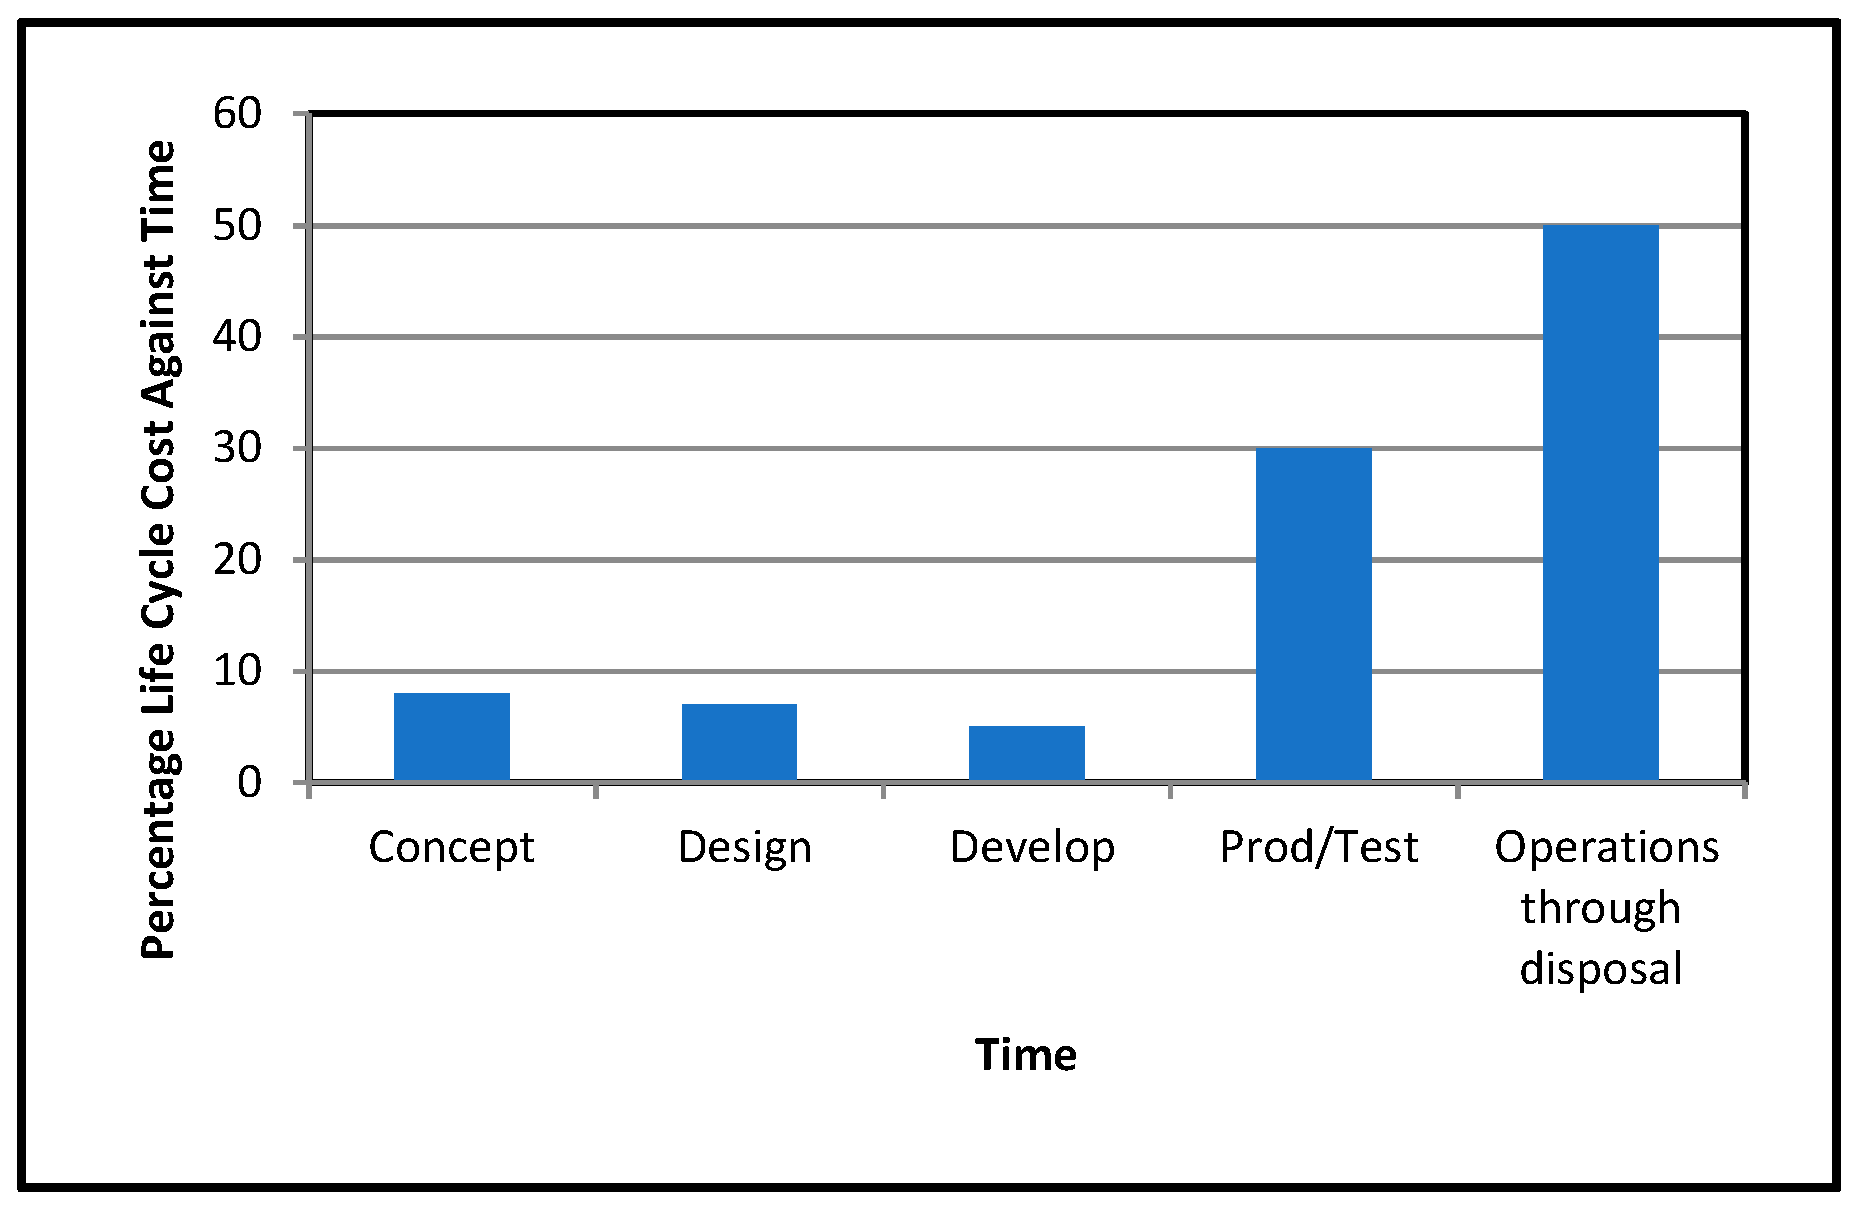
Traditional systems engineering approaches are document-centric, and document-centric approaches tend to have hidden costs. To illuminate the economics of document-centric SE approaches, we present an important curve in Figure 4. This curve explains the percentage cost for each life cycle stage for systems engineering projects based on a statistical analysis conducted on the US Department of Defense programs, as reported by the Defense Acquisition University [3]. From these figures, we can deduce that investments in the early phases of system life cycle, are comparatively lower than they are in the later phases. Furthermore, concept, design and development phase cumulatively account for 20% of the total life cycle cost. The remaining 80% of the cost occurs in the production, testing, operations, support, maintenance, and disposal phases.
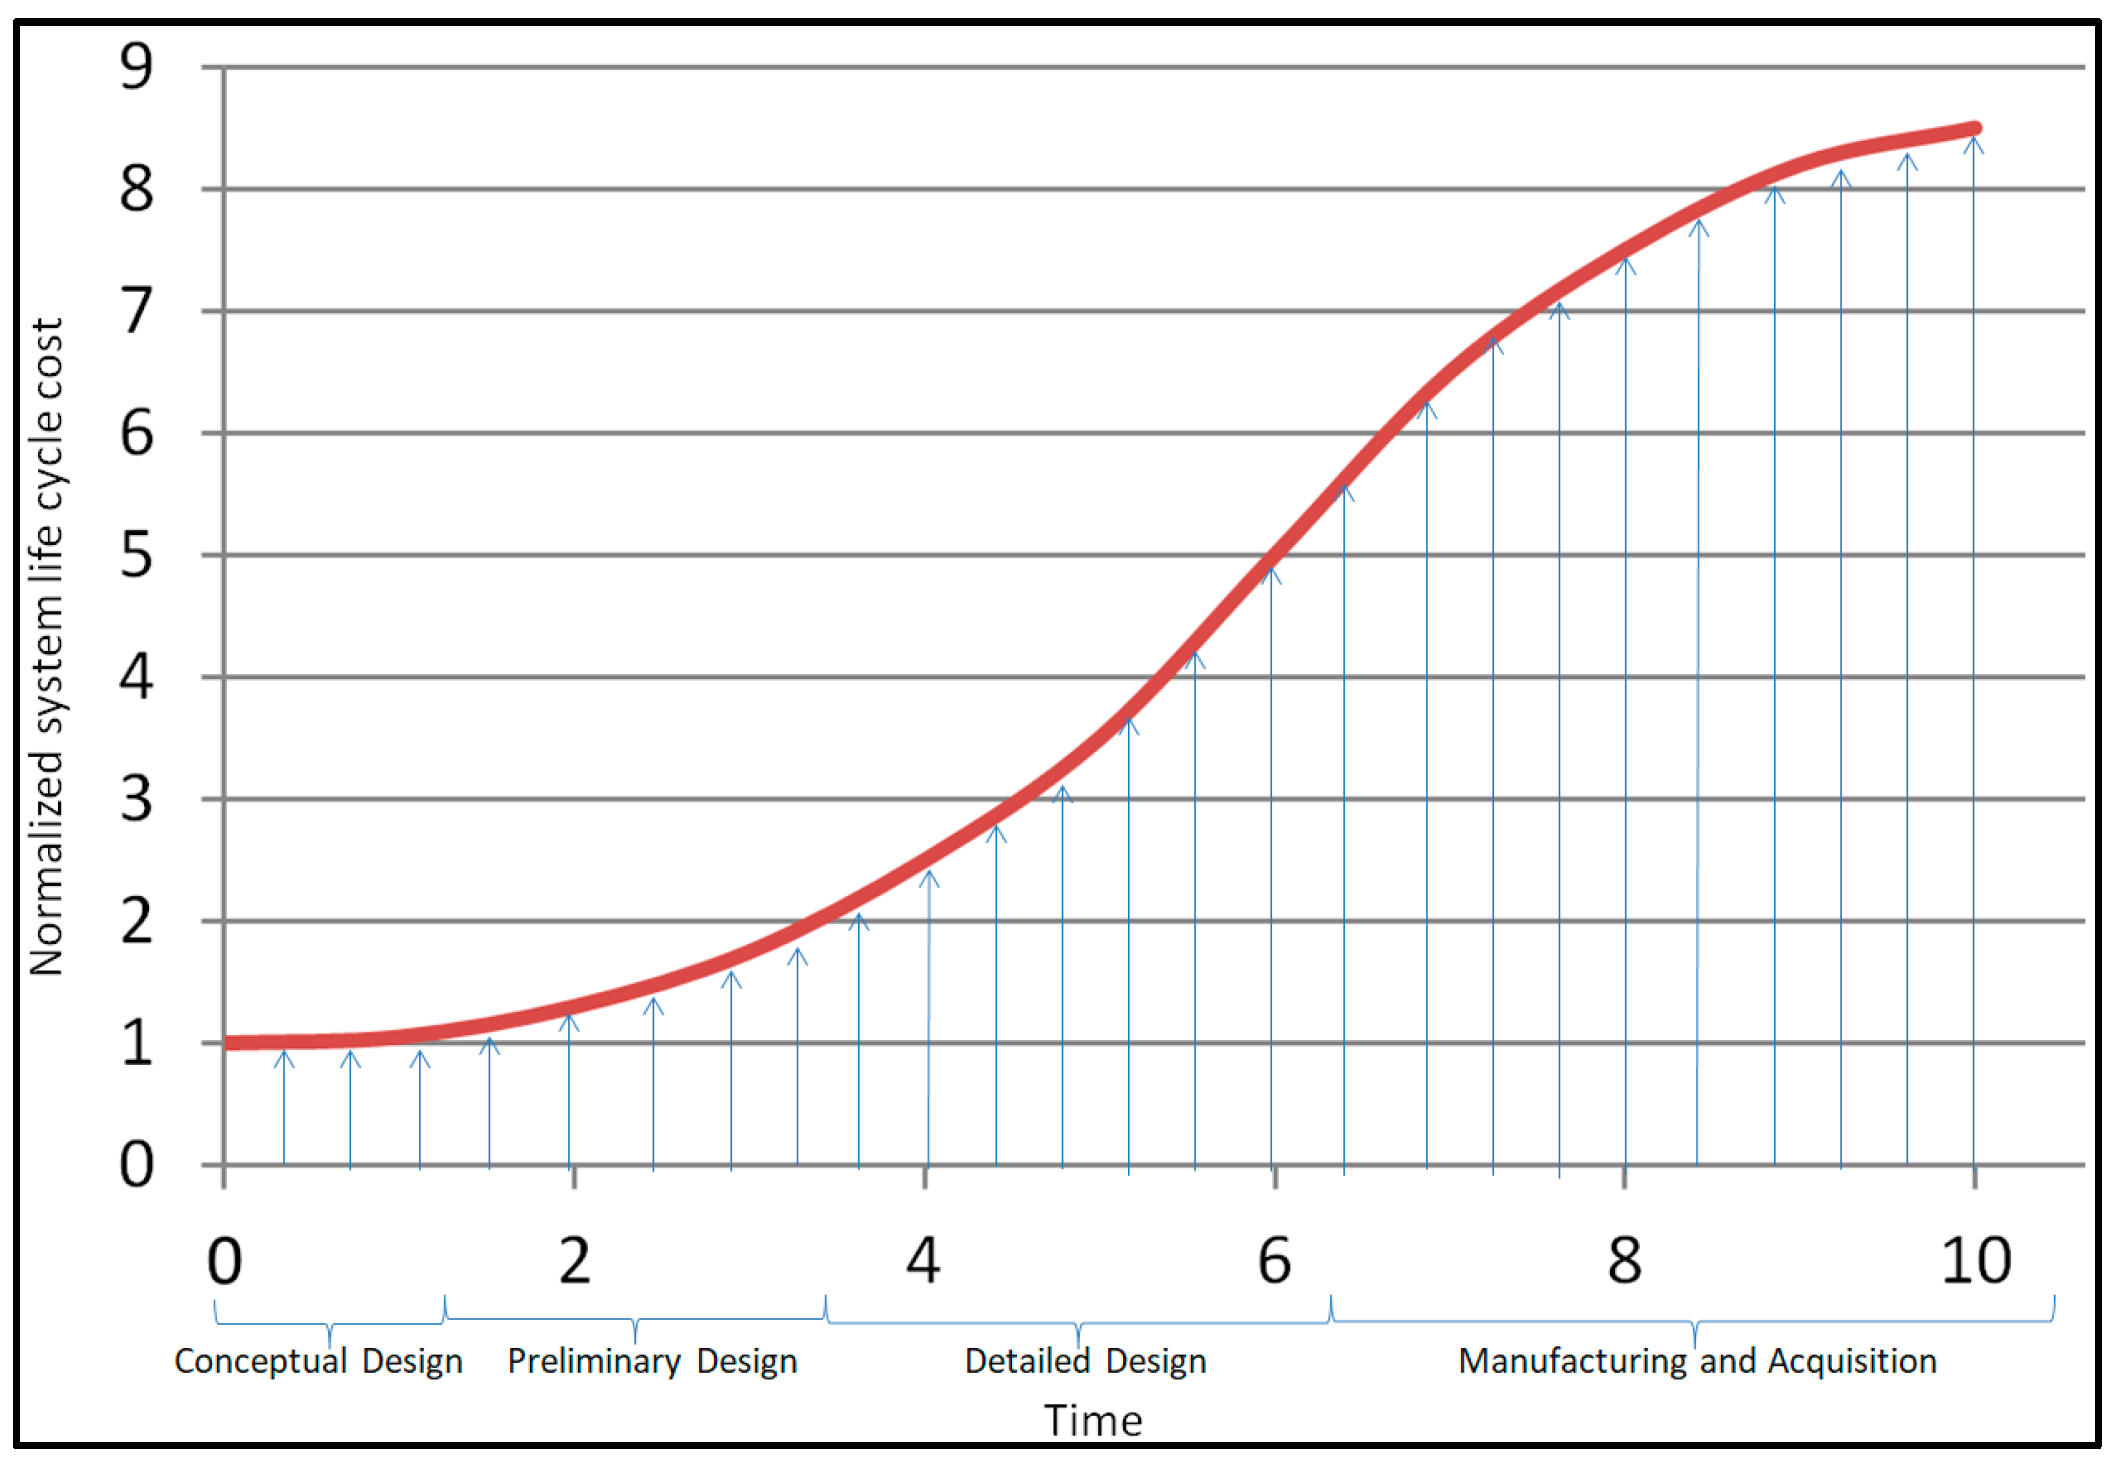
From an analysis of cost in the system life cycle for traditional SE, we can create an approximate cost profile for SE initiatives (Figure 5). In this figure, the ordinate (i.e., the vertical axis) represents normalized system life cycle cost, and the abscissa (i.e., the horizontal axis) represents time. As shown in this figure, SE investment is relatively low in the early stages of the system life cycle. Specifically, for conceptual design and preliminary design, investments are relatively low, but for detailed design, manufacturing, production, and operation the investment increases sharply.
7. Economic Analysis of MBSE Approach
For MBSE projects, it is difficult to find cost curves similar to those for traditional SE in the literature. This is understandable because MBSE is relatively new and, therefore, economic analysis data for MBSE initiatives is not available. Therefore, in our study we took a different approach to approximate cost curves for MBSE projects. Specifically, we combined historical data (evidence) from a space mission with current MBSE coverage of the system life cycle processes using the ISO 15288 process standard. The source of the former was a keynote address at the 2016 No Magic World Symposium. The keynote speaker spoke specifically about the scale of the investment to implement MBSE to “save” NASA’s Mars mission with an overall project cost of $327 M [10]. According to him, an initial MBSE investment of $5–10 M from the project budget could have immeasurably helped that project. We gathered additional evidence from a project manager from the industrial equipment sector. He indicated that on a $40 M equipment development project, basic MBSE implementation took under 1% additional investment to cover requirement management, functional allocation, traceability, document generation, verification, and validation. However, his team did not employ MBSE to cover system analysis, simulation and detailed integration with the design and development processes of the system life cycle. From these sources, we were able to make an educated inference about the relative cost of MBSE investment for a system development project. Even so, it is not possible to identify how such costs should be distributed (i.e., how investments should be made) over the system life cycle. Therefore, to analyze MBSE investment over the system life cycle. Specifically, we examined MBSE tool coverage of system life cycle processes. According to ‘System Life Cycle ISO/IEC/IEEE 15288 2015(E): Processes in System Life Cycle,’ there are four major processes that characterize the system life cycle: technical processes, technical management processes, organizational project-enabling processes, and agreement processes [11]. These four major processes consist of 30 sub-processes. Each sub-process consists of activities, and each activity consists of tasks. We evaluated the coverage of MBSE tools for system life cycle processes for each task using four popular MBSE tools (e.g., No Magic Cameo Systems Modeler, IBM Rational Rhapsody, Eclipse Papyrus and Eclipse Capella) that are representative of the life cycle coverage provided by MBSE tools. The data associated with SE life cycle process coverage by MBSE tools provides important insights into the temporal spend profile for MBSE investment needed to cover the system life cycle.
7.1. System Life Cycle Processes
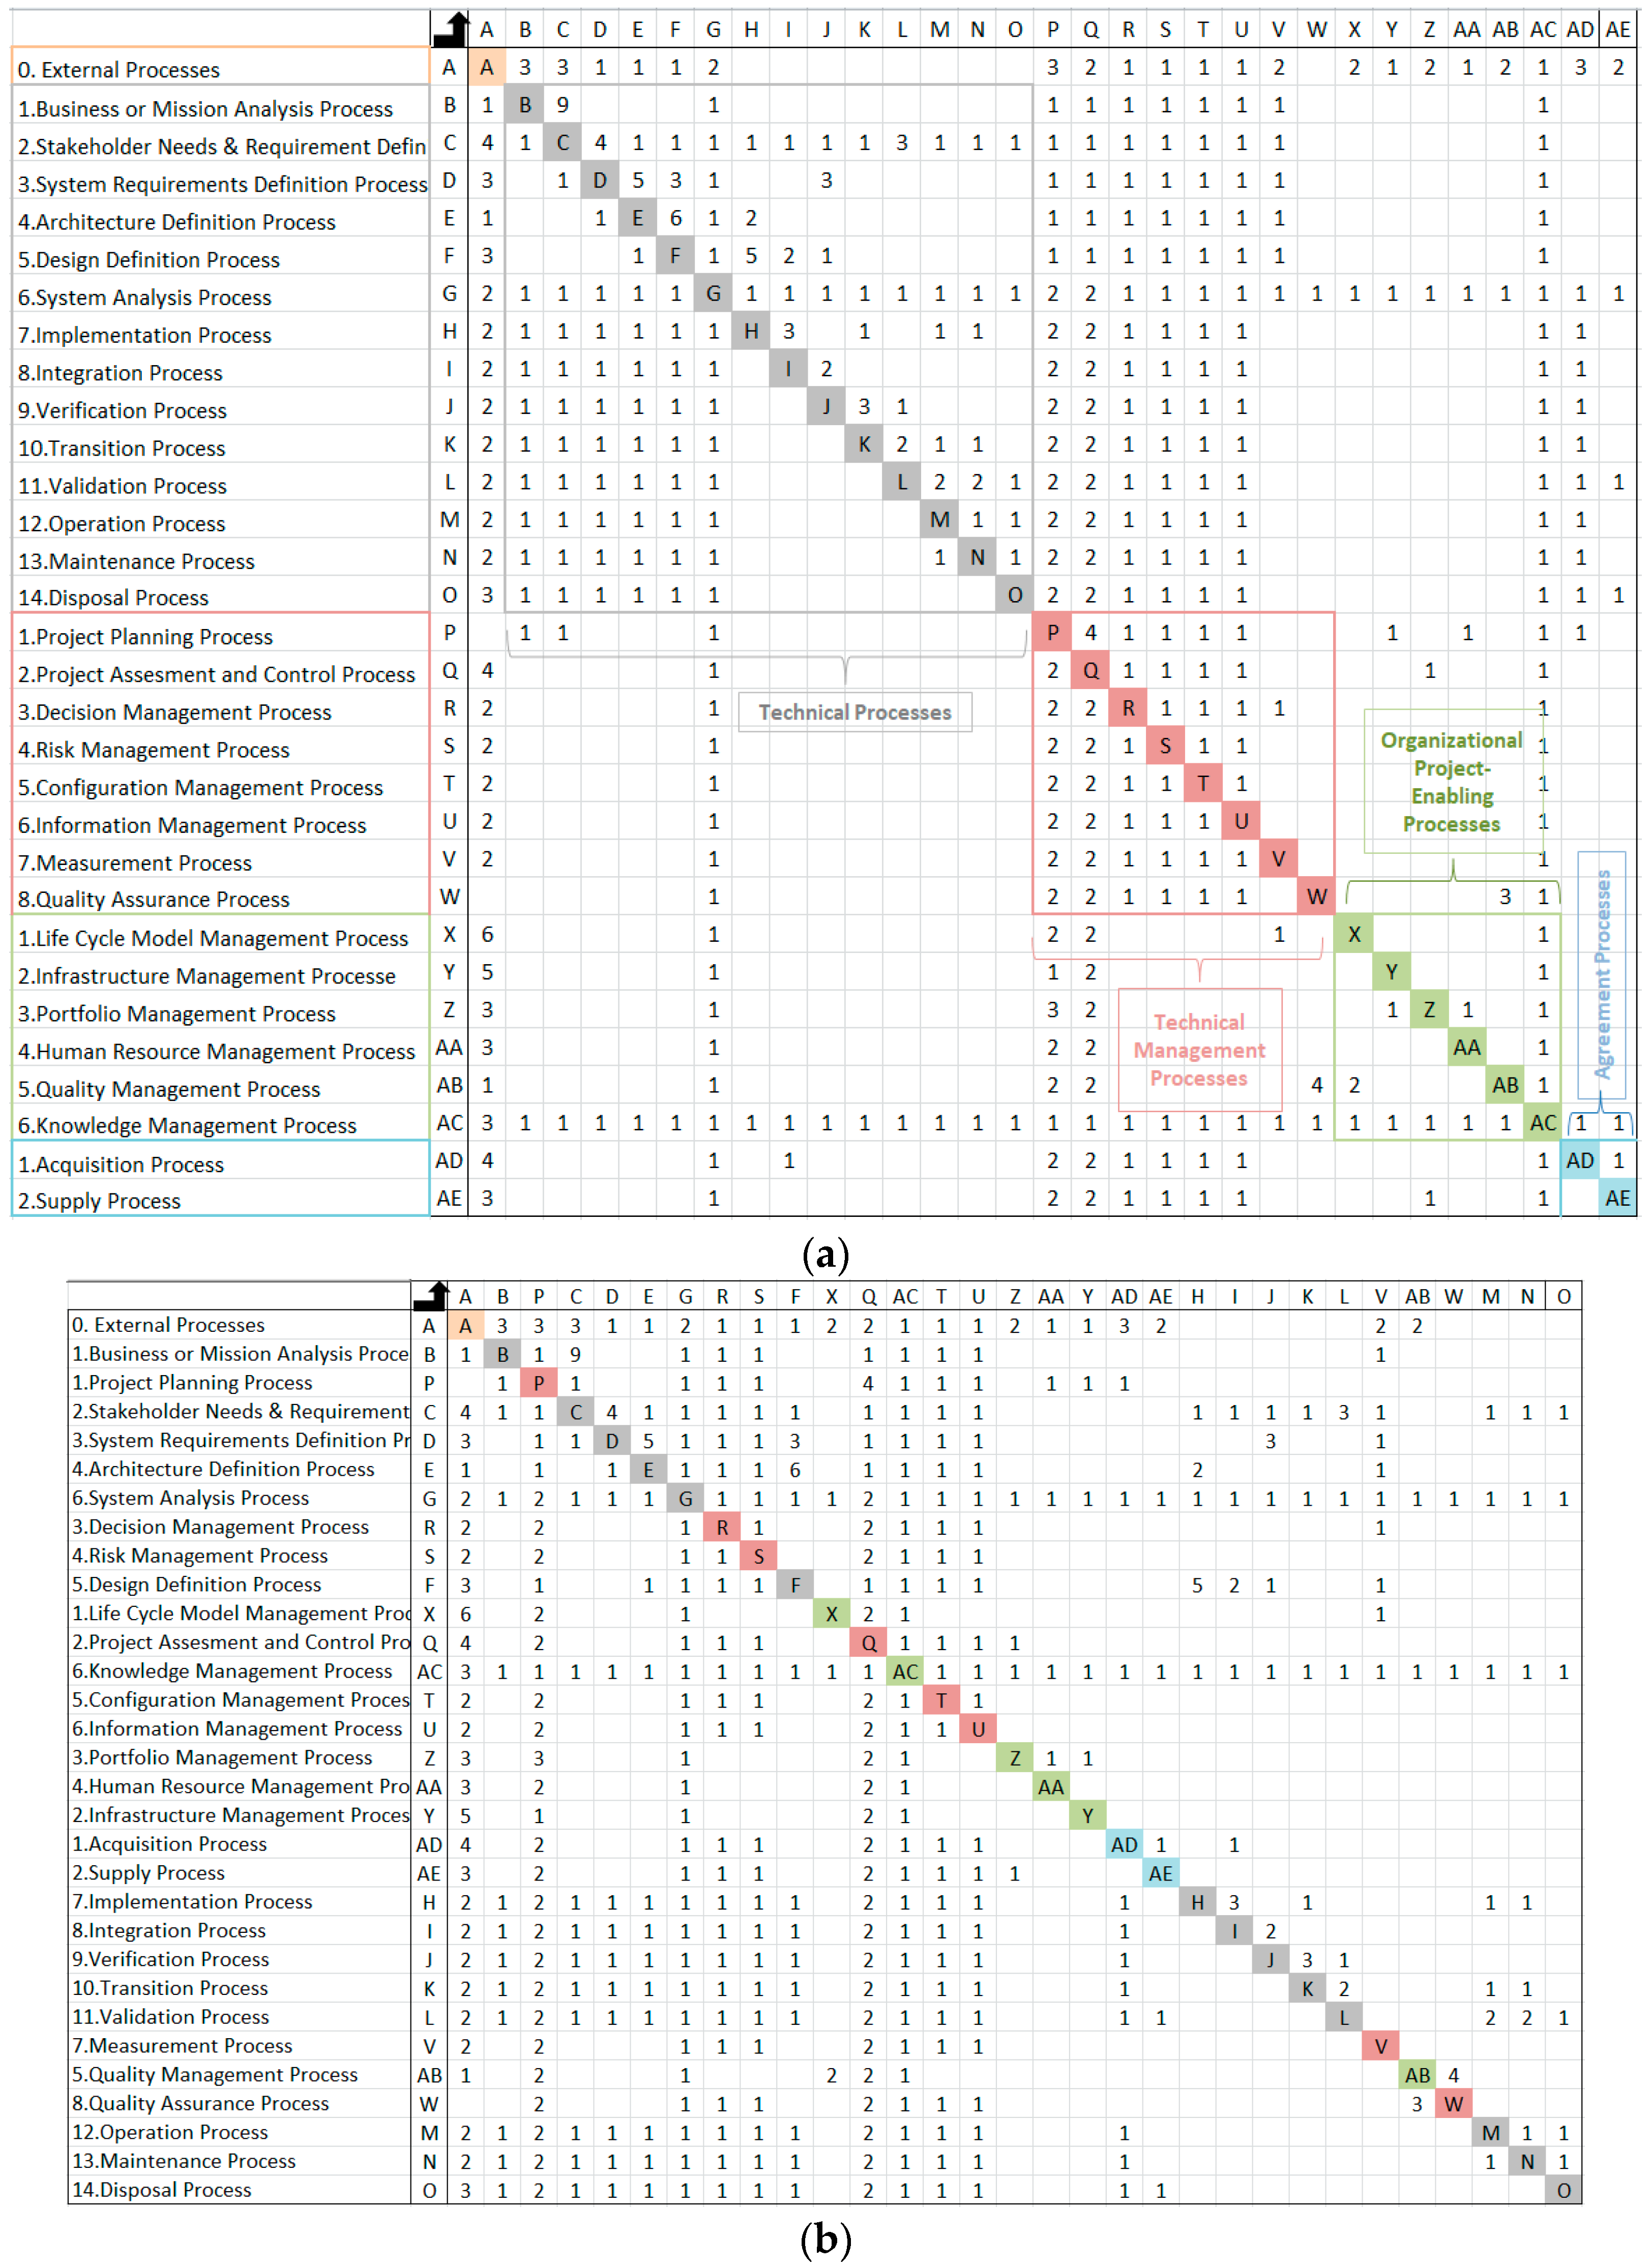
Our study evaluated the selected MBSE tools against ISO 15288 processes (which define the system life cycle and coverage requirements). Once again, we decomposed the processes into activities and activities into tasks (Table 2). There are 14 technical processes, 54 activities and 240 tasks that resulted from the decomposition [11]. It was rather straightforward to determine whether or not the exemplar MBSE tools addressed each task. Based on the total number of tasks in a given process and the number of tasks covered by the MBSE tool, we were able to calculate the percentage coverage by each tool of the corresponding technical process. Since technical processes are the primary focus of MBSE tools, our study focused mostly on technical processes. The remaining processes (i.e., technical management, organizational project enabling processes and agreement processes) were analyzed using system life cycle process model Figure 6, and processes dependency structure matrix (DSM) shown in Figure 7a,b.
Our task evaluation here is based on research papers from the SE literature, our hands-on experience with MBSE tools, available MBSE tool documentation, and models that we developed as needed to complete the evaluation. Our study accounted for plugins which allow these MBSE tools to integrate with third-party tools related to requirement engineering, PLM, CAD integration, analysis, simulation, design optimization, real-time and embedded development, publishing, reviewing and collaboration [12,13]. Figure 8a presents the percentage coverage of technical processes by MBSE tools. Figure 8b presents an MBSE cost curve.
7.2. Sequencing System Life Cycle Processes
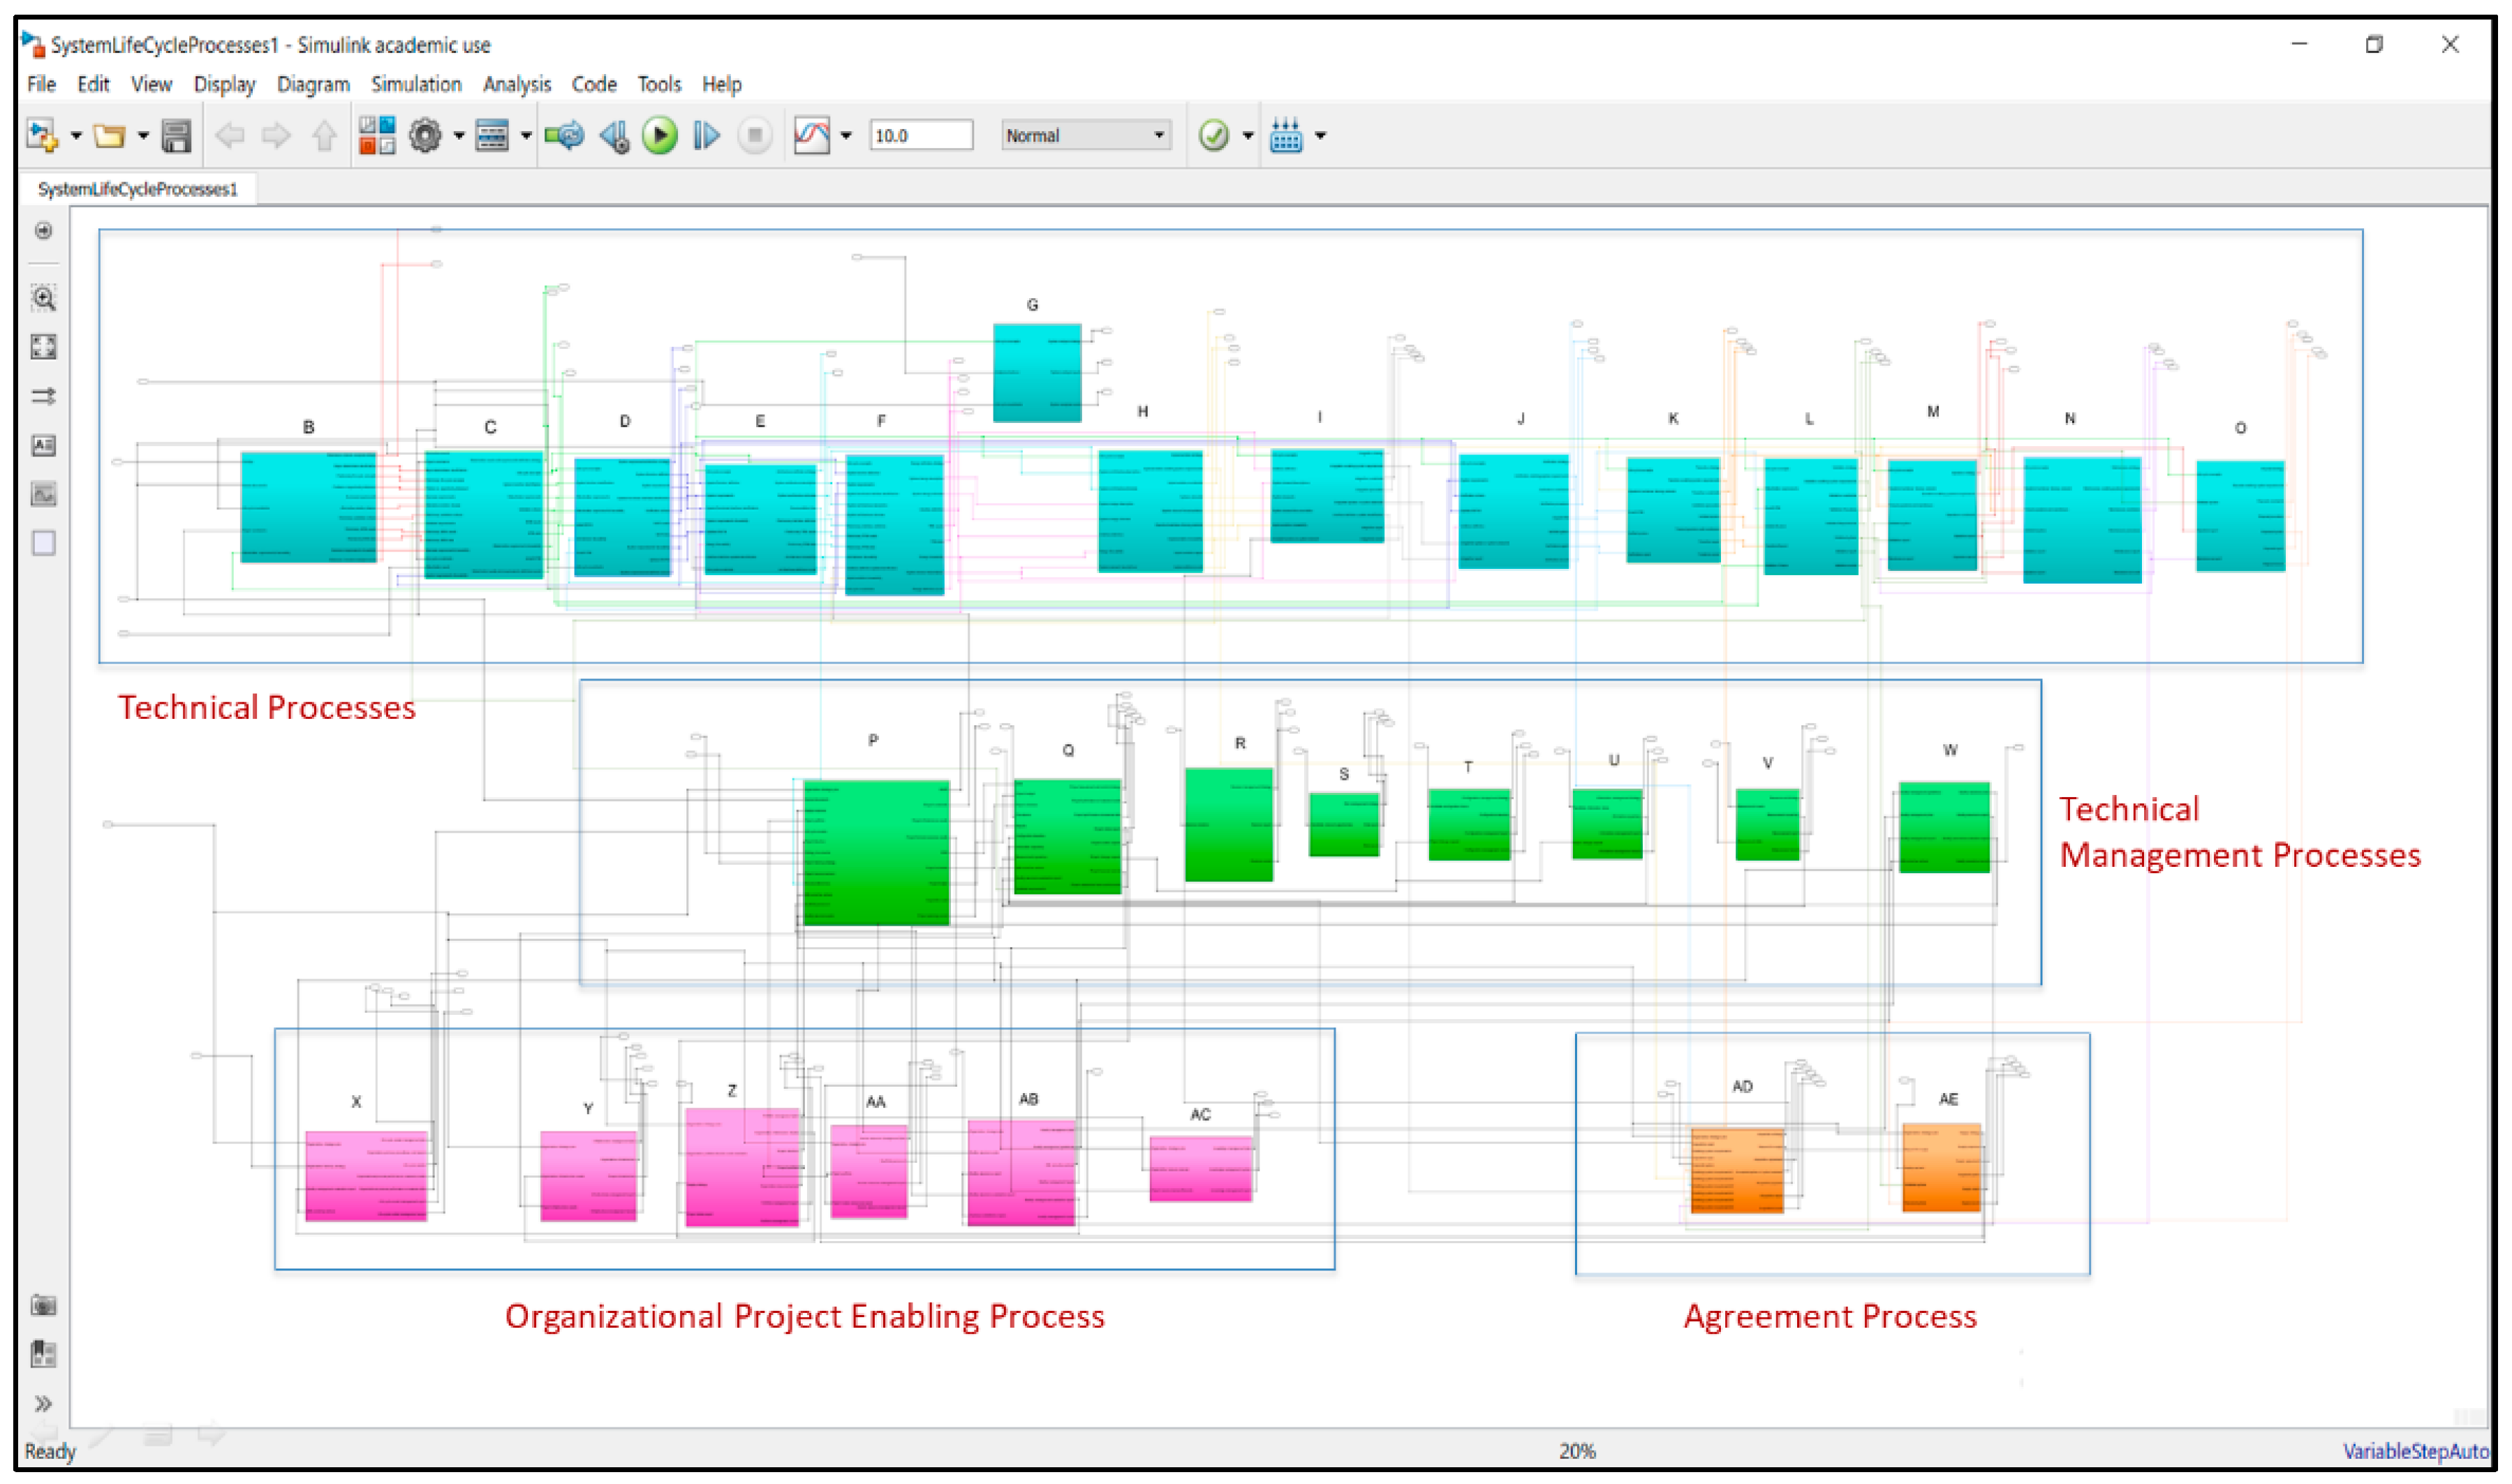
After quantifying the coverage provided by MBSE tools of system life cycle processes, we identified where these tools are employed in the system life cycle. To this end, we created a Simulink® Model of all 30 processes Figure 6 and their interfaces using the processes identified in the INCOSE SE Handbook [3]. We then converted this model to a Processes Dependency Structure Matrix (DSM) shown in Figure 7a. From the Processes DSM, it became possible to evaluate the parallel, sequential, and coupled processes Figure 7b.
In our study, we also created an Excel sheet with Visual Basic program to manipulate Process DSM, and sequence processes in accord with their coupling, dependency, and parallelism. Figure 6 and Figure 7a,b present system life cycle process model, Process DSM, and sequenced Process DSM, respectively.
7.3. Cost Curves for Systems Engineering Programs with MBSE Approach
After sequencing the DSM, it became evident that MBSE tools today are focused primarily on the front end of the system life cycle. Furthermore, for SE projects that use an MBSE approach, projects can be expected to make higher investment in conceptual design and preliminary design stages. In these upfront engineering phases, considerable investment goes into the preliminary design stage. Figure 8a indicates percentage coverage of MBSE tools for system life cycle processes. In addition, with MBSE, substantial cost savings can be expected during the latter stages of design. Since the MBSE approach is likely to reduce the number of defects in latter stages of design, it follows that the cost in these later stages will be significantly lower in comparison to the traditional SE approach. Figure 8b presents an approximate cost curve associated with the MBSE spend profile. As seen in this figure, MBSE cost is greater in conceptual and preliminary design phases. In fact, the majority of the cost associated with MBSE implementation can be expected to be in the preliminary design phase.
8. Economics of MBSE versus Traditional SE
The comparison of investments between MBSE and traditional (i.e., document-centric) SE is depicted in Figure 9a. The blue curve indicates the cost of MBSE projects, while the red curve indicates the traditional SE project cost across the system life cycle. At the conceptual and preliminary design stages, MBSE projects require greater investment than traditional SE projects. However, in the latter stages of design MBSE projects require substantially lower investment than traditional SE projects. For economic justification, the net present worth (NPW) of investment should be strictly less than the NPW of gains resulting from the MBSE approach in the system life cycle. Or, the net present worth of savings should be greater than the net present worth of a predefined MBSE investment earlier in the life cycle. Figure 9b presents the difference in investments between MBSE and traditional SE and the expected savings from MBSE implementation.
As noted earlier, with MBSE, organizations invariably spend more money early in the lifecycle and when making upfront investment. Due to the time value of money, additional expenditures early in the system life cycle should be considerably less than the gains from the latter stages in the life cycle phase. Discounting and converting gains into present worth provides an accurate measure of return-on-investment (ROI). Clearly, gains should be significantly more than investments to make MBSE implementation successful. From approximate calculations on sample projects, the NPW of traditional SE projects and MBSE projects are found to be comparable.
However, there exists a tipping point in MBSE implementation, where the NPW of investment exceeds the gains from MBSE. This point could happen because of excess investment early in the life cycle, or lower than expected gains later in the lifecycle. The ROI also depends on the timing of investments and gains. The investment NPW for traditional SE and MBSE are calculated from two equations. The equation to calculate Investment NPW approximation for Traditional SE is ≈ 36.6597 C. The equation to calculate Investment NPW approximation for MBSE is ≈ 34.7564 C; where, C is assumed to be a scaling constant, n is number of time interval for investments considered to be 10 from the cost curves, i is overall interest rate for time interval considered to be 3.5%, and is investment made after k time intervals depicted in the cost curves as normalized system life cycle cost.
Because approximate NPW investment for traditional SE and MBSE are comparable, the results in this case are inconclusive relative to which is the preferred option. This recognition drives the need for a deeper analysis of factors related to MBSE investment and gains.
9. Economic Analysis of MBSE Implementation
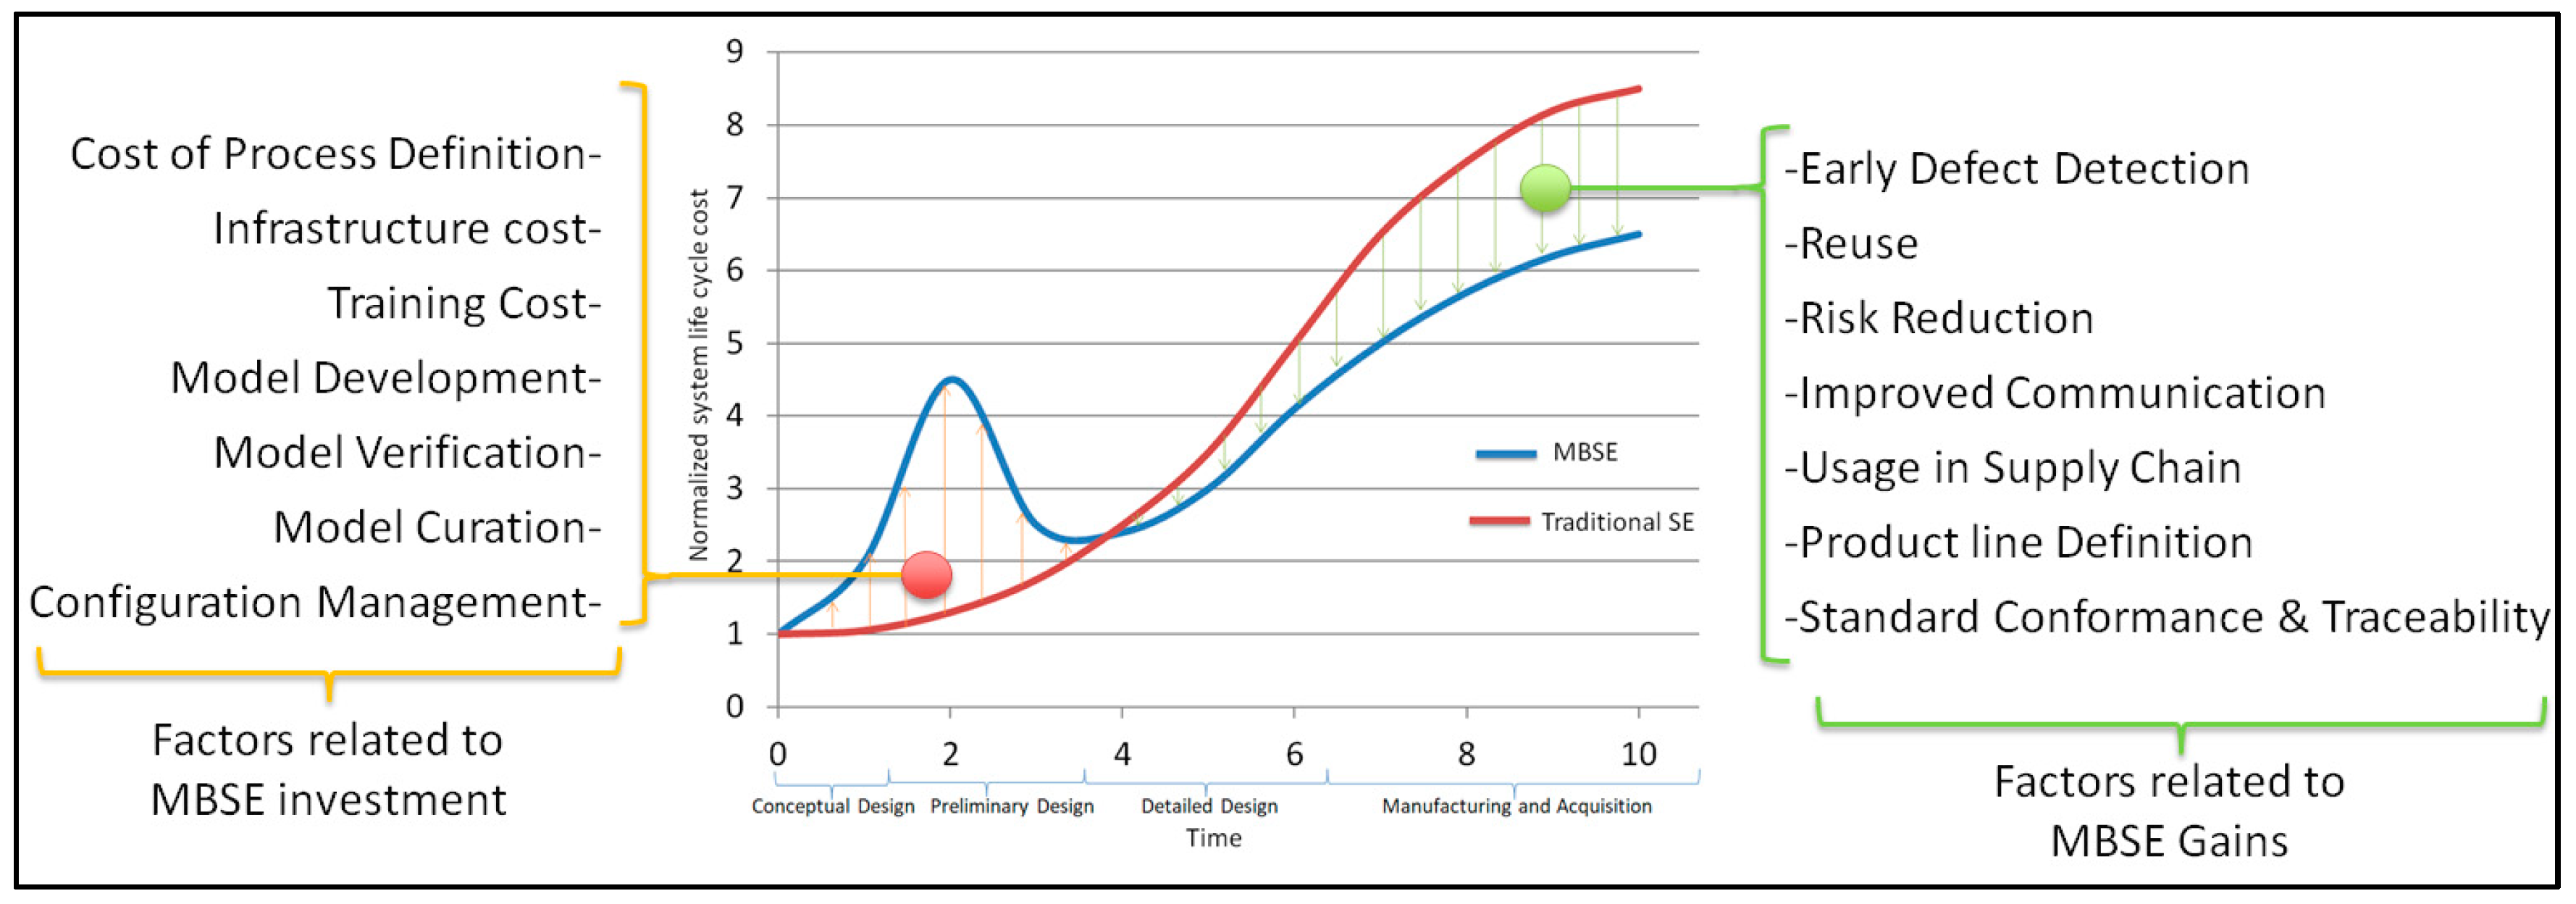
As discussed in the previous section, SE initiatives that employ an MBSE approach require greater upfront investment (i.e., in the earlier stages of the system life cycle) than needed with traditional SE. However, such initiatives can be expected to produce greater gains in the latter stages of the system life cycle. Therefore, an analysis of factors related to early investment in MBSE and factors related to gains in the latter stages from MBSE can be expected to provide useful insights for economic justification of MBSE implementation. Figure 10 presents key factors related to MBSE investments and gains.
9.1. Factors Related to MBSE Investment
MBSE investment covers a number of costs including the cost of MBSE process definition, infrastructure cost, training cost, and model-related costs. Each cost is described next.
Process definition cost is a key consideration in calculating the cost of adopting an MBSE methodology for organization-wide implementation. MBSE process definition depends on the MBSE methodology selected. There are several MBSE methodologies, such as INCOSE Object-Oriented Systems Engineering Method (OOSEM), Object-Process Methodology (OPM), IBM Rational Unified Process for Systems Engineering (RUP SE) for Model-/Driven Systems Development (MDSD), Vitech Model-Based System Engineering (MBSE) Methodology, JPL State Analysis (SA) [14]. Implementing a particular methodology and generating models using that methodology have different costs associated with them (i.e., not all MBSE methodologies cost the same).
Infrastructure cost is another cost category. Infrastructure cost consists of licenses, equipment, environments, processing, and collaboration. Infrastructure cost for this study is assumed to be specific to projects. In general, infrastructure cost is incurred at the enterprise level, but that can be shared among projects to quantify costs specific to each project.
Training cost is a distinct category. It involves, training on tools, training on modeling languages, and training employees in systems engineering and MBSE. Training cost involves the cost for learning curves and organization level resistance to change.
Model-related costs are a major source of costs. Model development efforts include identifying the goal, purpose, and scope of the model, improving model capabilities, defining the intent of use, and configuring the model for the intended number of users. Building federated, centralized or hybrid models have different costs [4]. The scale of the model is also a cost modifier. Unifying the model format has its own cost [10]. Maintaining model consistency is a source of costs. Building models are not enough; model verification needs to be performed at each stage of model development to ensure model correctness and credibility [4]. Identifying criteria of model verification and determining the right level of model abstraction have their own costs [1]. Identifying opportunities of model trading and executing it in the right context also requires effort. In the case of MBSE, an increase in the number of stakeholders working on central digital models makes the models more prone to errors and require model curation efforts. Model curation consists of gauging model characteristics, selecting models for implementation, and devising model policies [4]. Configuration management efforts include maintaining ownership, managing data rights and distribution of rights, re-use or copyrights.
9.2. Factors Related to MBSE Gains
The factors that pertain to gains from MBSE include early defect detection, reuse, product line definition, risk reduction, improved communication, usage in supply chain and standards conformance [1,4,5,10]. It is well known that the later in the system life cycle that defects are detected, the greater the cost of correcting the defects. The ability of MBSE to identify defects early in the system life cycle can contribute to significant cost savings and thereby provide significant gains [4]. Another key factor is the ability to use legacy models and data during the latter stages of system life cycle to eliminate extraneous activities and reduce rework. The ability of MBSE to exploit legacy models and data also contributes to economic justification. Since individual projects may not have the luxury of time to work on data reuse, additional measures are needed at the enterprise management level to incentivize projects to achieve this reuse. In particular, commercial aircraft and automobiles which have product lines with variants can benefit from model and data reuse. MBSE can be expected to provide significant gain to define product line characteristics because of single, centralized configurable system models [4]. The adoption of MBSE can be expected to increase confidence while reducing risks related to both processes and products. Also, with increasing system complexity, it is becoming increasingly difficult to account for emergence. Therefore, risk reduction in complex systems is a significant gain [1]. With centralized digital repositories and data analysis capability, MBSE promises to increase communication efficiency and reduce feedback loops. These characteristics can potentially provide important gains (e.g., speed up the process) during the system life cycle. MBSE also provides opportunities to share data and knowledge in timely fashion, which translates into increased supply chain efficiency [5]. Additionally, MBSE provides cost savings through quick traceability mechanisms that are built into today’s modeling environments. However, the ever-increasing complexity of systems in multiple domains is making it increasingly difficult to conform to standards.
From the analysis of factors related to both investments and returns/gains, it became apparent that MBSE needs to derive value from a variety of systems engineering activities across the system life cycle to produce convincing economic justification. In other words, using model-based approach solely for requirements engineering is not enough. The use of integrated digital models for data analysis, trade studies, decision support, and communication is necessary throughout the detailed design, implementation, production, maintenance, retrofit, operation, and retirement stages of the system life cycle.
10. Assessing MBSE Implementation Benefit
As noted previously, the factors associated with MBSE investment and expected gains depend largely on the system’s intrinsic characteristics such as complexity, operational environment characteristics, and system lifespan. The system’s complexity can be considered to be a function of the number of unique components in the system, the interactions between them, the amount of knowledge required for developing the system, and the amount of information needed to describe the system [15,16]. A system’s environment can be characterized in terms of the number of stakeholders and the number of external entities the system needs to interact with which are outside the system’s boundary, and the regulatory environment. In other words, the system’s environment consists of stakeholders, external systems which impose regulatory and interface constraint, and applicable standards that the system needs to conform to. This factor includes system interaction with humans or entities outside the system boundary. A system’s lifespan can be characterized by the system’s useful life. The system lifecycle spans the time required for concept formulation, development, production, operation/utilization and retirement stages. Before transitioning to operation, a system must conform to the various applicable standards.
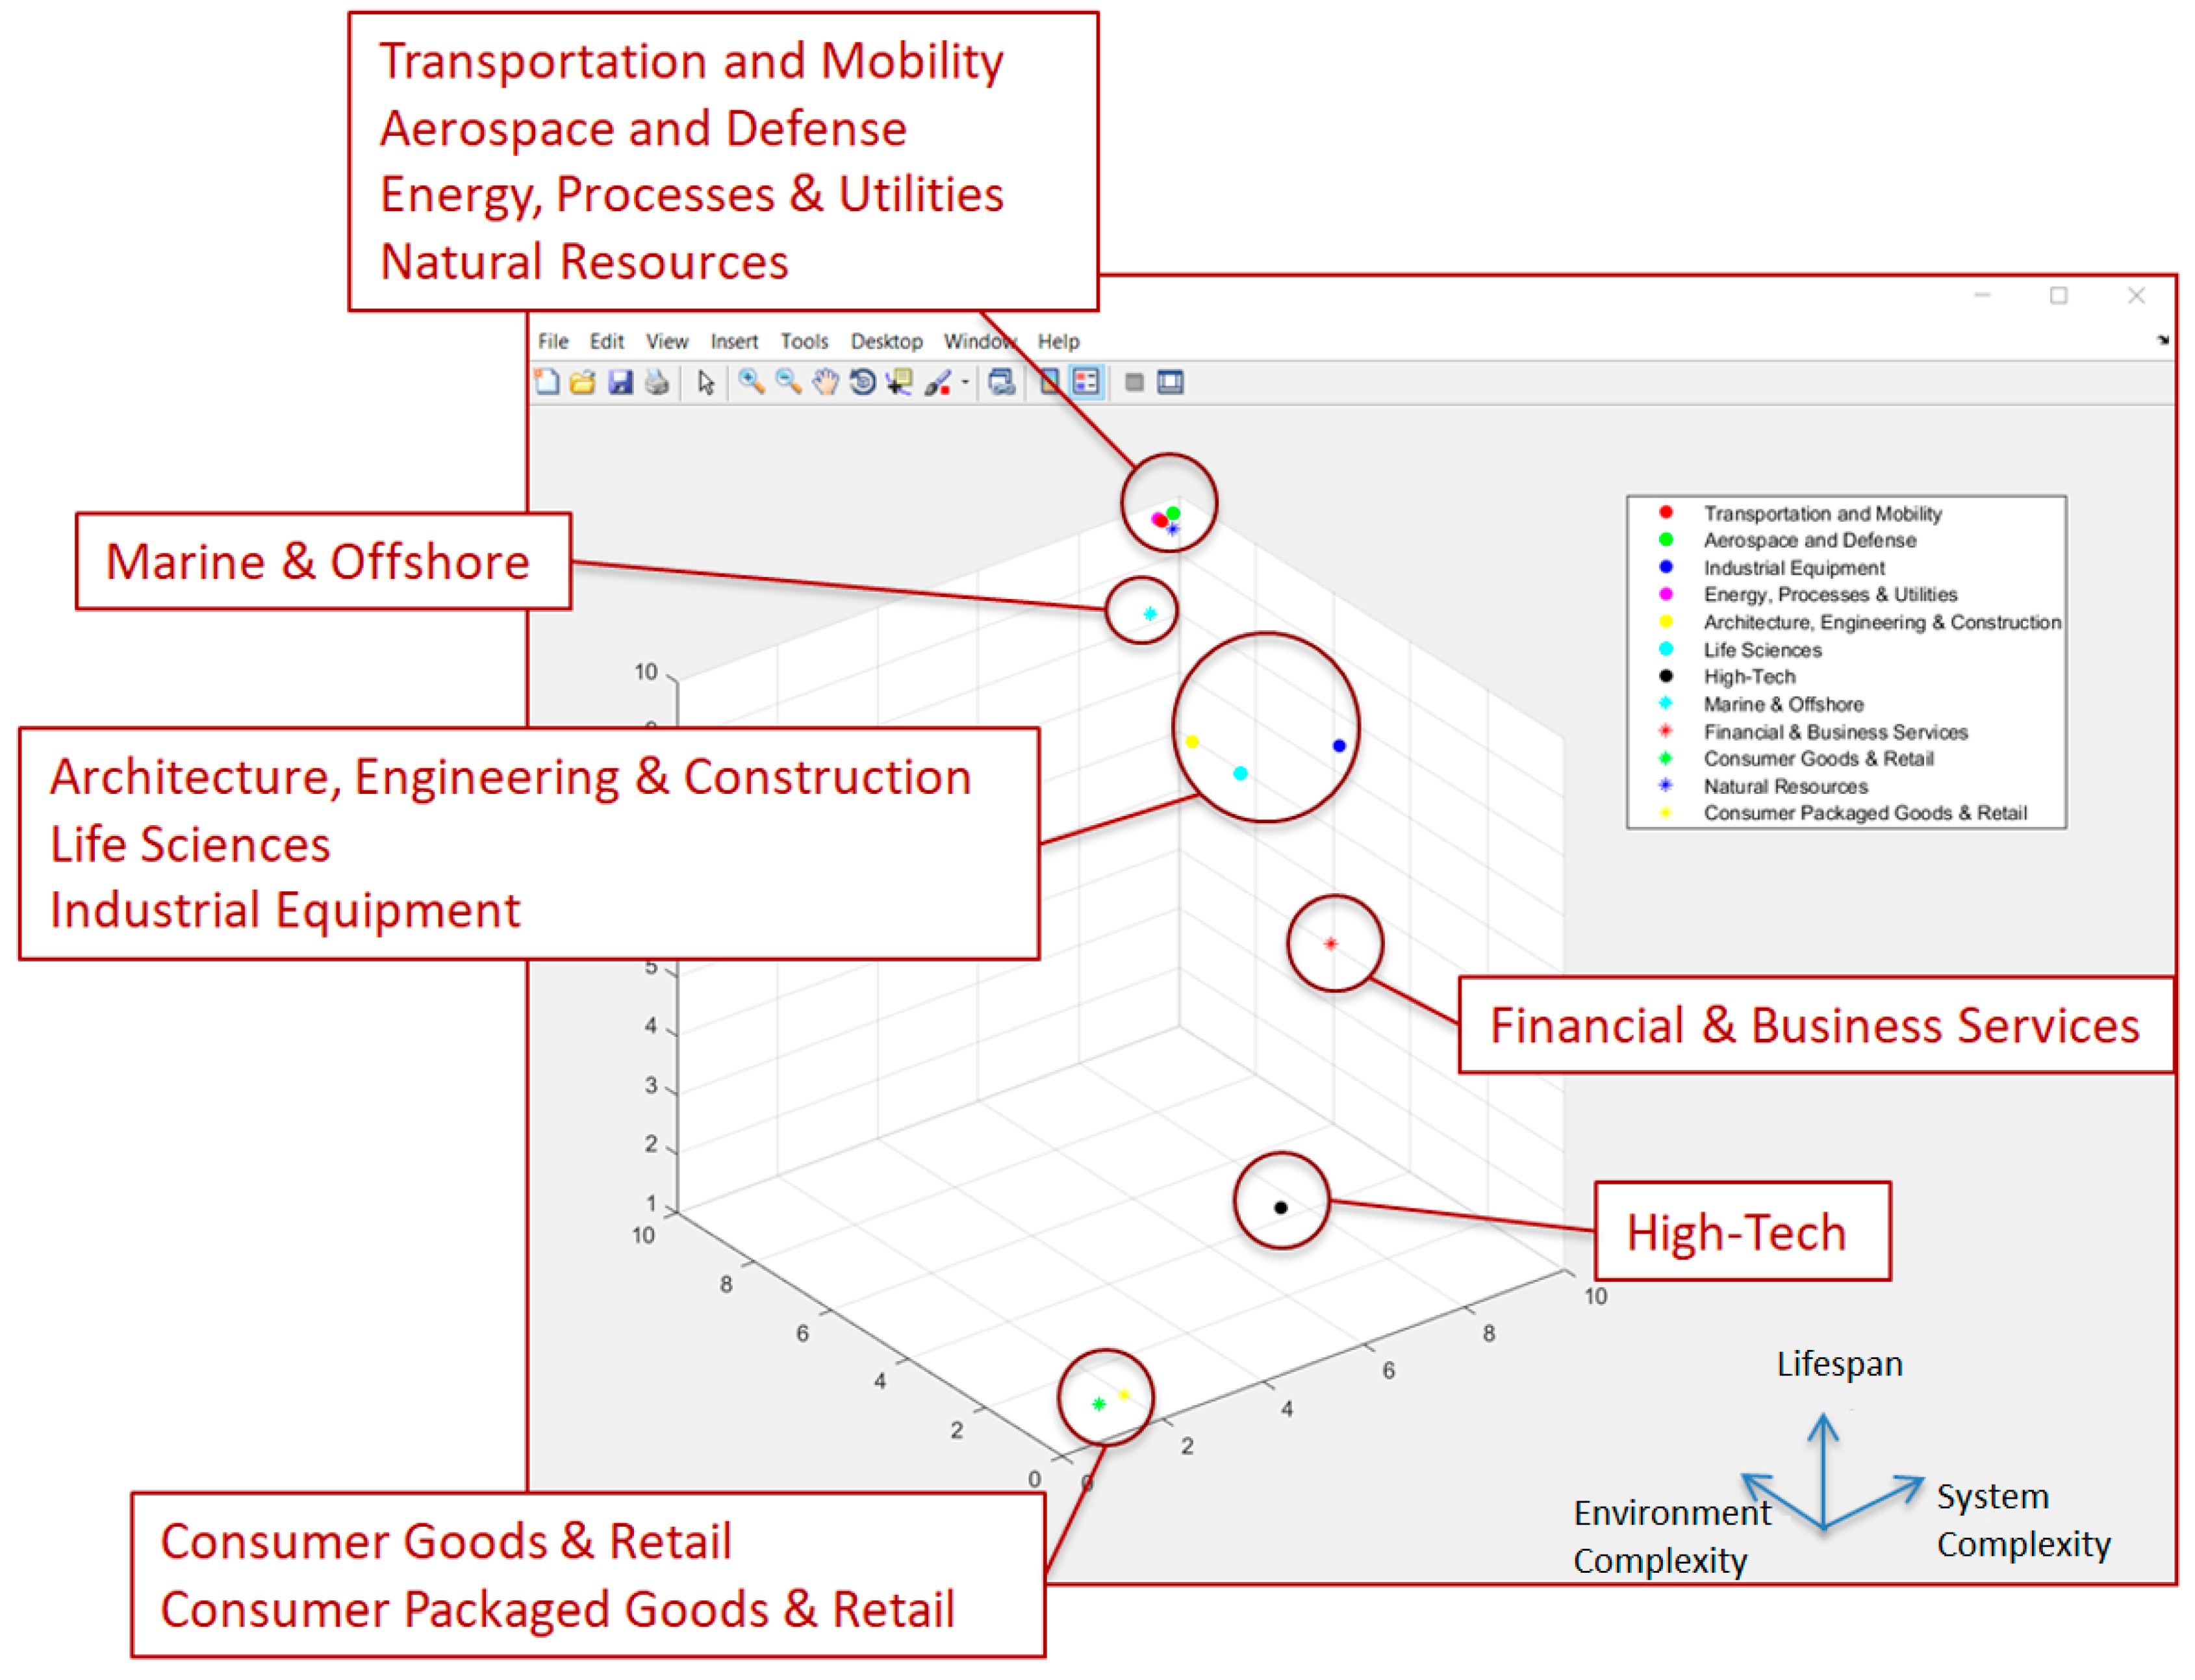
We parameterized MBSE implementation problem using systems complexity, environment complexity, and system lifespan as distinguishing characteristics. We then identified those industry sectors in which maximum gains are likely to be achieved with the adoption of MBSE. Figure 11a–c presents MBSE implementation problem in terms of system complexity, environment complexity, and system lifespan for 12 industry sectors. The constructed scale of system complexity, environmental complexity and lifespan are divided into three segments-high, medium and low. For example, aerospace systems such as airliners have more than ~100,000 parts (high), which is more complex than high-tech industry sector systems like copying machines which have ~2000 parts (medium). The systems used by household consumers on daily basis which have up to ~300 parts (low) [17]. Here, complexity of systems is determined on the basis of number of unique components, interactions between components, amount of knowledge required to develop the system and amount of information needed to describe the system. High, medium, and low scales of environmental complexity are evaluated based on the number of stakeholders, external systems which impose regulatory and interface constraint, and applicable standards that the system needs to conform to related to particular industry sector. Systems with a relatively short useful lifespan of 0 to 1 year are attributed to low score in parameterization compared to systems with a lifespan of more than 30 years.
11. Conclusions
This paper has presented a methodological framework for economic analysis of MBSE implementation that can be applied to different sectors. MBSE and traditional SE approaches are compared in terms of upfront investment and expected gains. Compared to traditional SE, MBSE is shown to require greater upfront investment with gains showing up in the latter stages of the system life cycle. Three key MBSE implementation problem characteristics (i.e., system complexity, environment complexity and system lifespan) are identified as the major discriminators of the different sectors when it comes to MBSE implementation. These factors are used to evaluate the different industry sectors in terms of MBSE costs and MBSE returns Figure 12.
By parameterizing the MBSE implementation problem in terms of system complexity, regulatory and operational environment complexity, and system lifespan, we were able to identify those industries that stand to derive the most value from the adoption of the MBSE approach. As shown in Figure 12, MBSE can be expected to greatly benefit the transportation and mobility, aerospace and defense, energy, processes and utilities and natural resources industries. With the increasing complexity of systems in the marine and offshore, architecture, engineering and construction, life sciences, and industrial equipment sectors, MBSE can potentially play an important role throughout the system life cycle. Industry sectors such as financial and business services and high-tech are not likely to benefit from MBSE as much as the other industries. From our study, systems related to home, lifestyle and fashion and consumer packaged goods and retail are likely to benefit less than the other sectors.
More recently, MBSE is being augmented with interactive storytelling approaches to maximize stakeholder participation in upfront engineering [18,19,20]. This added capability will have costs associated with it as well as benefits. The costs will be associated with mapping system models into system stories that are interactively executed in virtual worlds or simulations [19,20]. The gains are elimination of rework and extraneous design iterations that typically occur when not all stakeholders have been able to contribute to upfront engineering [18]. These costs and benefits can be incorporated in our evaluation framework. Ultimately, the ability to quantify factors related to MBSE investments and returns will enable prediction of ROI from investments in MBSE on large-scale system programs and product development initiatives.
In sum, the MBSE value the proposition for a particular industry and the affordable transition to model-based approach are the two key challenges that need to be addressed in quantifiable terms before committing to MBSE implementation. By identifying when and where the system life cycle processes with MBSE impact occur and then quantifying the factors that contribute to the investments and gains, organizations can make informed decisions. By parameterizing individual SE projects, we can identify where maximum gains are likely to be achieved with the adoption of MBSE. Future research can expand the framework to take additional factors into account and provide more comprehensive economic justification for MBSE in different industries.
Author Contributions
Conceptualization, A.M.M. and S.P.; Methodology, A.M.M. and S.P.; Validation, A.M.M. and S.P.; Formal analysis, A.M.M. and S.P.; Investigation, A.M.M. and S.P.; Resources, A.M.M.; Data curation, S.P.; Writing—Original Draft preparation, A.M.M. and S.P.; Writing—Review and Editing, A.M.M.; Visualization, S.P.; Supervision, A.M.M.; Project administration, A.M.M.
Funding
This research received no external funding.
Conflicts of Interest
The authors declare no conflict of interest.
References
- Carroll, E.; Malins, R. Systematic Literature Review: How Is Model-Based Systems Engineering Justified? Sandia National Laboratories. 2016. Available online: https://www.incose.org/docs/default-source/enchantment/161109-carrolled-howismodel-basedsystemsengineeringjustified-researchreport.pdf?sfvrsn=2&sfvrsn=2 (accessed on 4 December 2018).
- Transforming Industries, Markets and Customer Experiences, Dassault Systèmes®. Available online: https://ifwe.3ds.com/ (accessed on 4 December 2018).
- Walden, D.D.; Roedler, G.J.; Forsberg, K.; Hamelin, R.D.; Shortell, T.M. Systems Engineering Handbook: A Guide for System Life Cycle Processes and Activities; John Wiley & Sons Inc.: Hoboken, NJ, USA, 2015. [Google Scholar]
- Architecture and Systems Engineering: Models and Methods to Manage Complex Systems (2017) Course 3 Model-Based Systems Engineering: Documentation and Analysis, Massachusetts Institute of Technology Online Professional Education Program. Available online: https://sysengonline.mit.edu/course-3/ (accessed on 7 August 2017).
- Madni, A.M.; Sievers, M. Model-Based Systems Engineering: Motivation, Current Status, and Needed Advances. In Proceedings of the Conference on Systems Engineering Research, Redondo Beach, CA, USA, 23–25 March 2017. [Google Scholar]
- Ramos, A.L.; Ferreira, J.V.; Barcelo, J. Model-based systems engineering: An emerging approach for modern systems. IEEE Trans. Syst. Man Cybern. C Appl. Rev. 2012, 42, 101–111. [Google Scholar]
- Stoewer, H. Model-based systems engineering (MBSE): Missing link in the digital enterprise strategy? In Proceedings of the INCOSE MBSE Workshop, Los Angeles, CA, USA, 26 January 2014. [Google Scholar]
- Friedenthal, S.; Oster, C. Architecting Spacecraft with SysML: A Model-Based Systems Engineering Approach; CreateSpace Independent Publishing Platform: Scotts Valley, CA, USA, 2017. [Google Scholar]
- Zingarelli, M.A.; Wright, S.R.; Pallack, R.J.; Mattos, K.C. SWFTS—System Engineering Applied to Submarine Combat Systems. Available online: https://www.navalengineers.org/SiteCollectionDocuments/2010%20Proceedings%20Documents/ETS%20201 0%20Proceedings/Zingarelli.pdf (accessed on 4 December 2018).
- Technology & Enterprise Architecture: Economical Modeling: Minimizing Effort, Maximizing Modeling Return on Investment (ROI), Speaker: Michael Vinarcik—Booz Allen Hamilton, May 24th 2016 Keynote from the No Magic World Symposium. 2016. Available online: https://vimeopro.com/nomagic/no-magic-world-symposium-2016-presentations/video/170588353 (accessed on 4 December 2018).
- IEEE Guide—Adoption of ISO/IEC TR 24748-2:2011 Systems and Software Engineering—Life Cycle Management—Part 2: Guide to the Application of ISO/IEC 15288 (System Life Cycle Processes) (24748-2-2012). Available online: https://0-standards-ieee-org.brum.beds.ac.uk/standard/24748-2-2012.html (accessed on 4 December 2018).
- No Magic Documentation. Available online: https://www.nomagic.com/support/documentation (accessed on 12 December 2018).
- Madni, A.M.; Sievers, M. Model Based Systems Engineering: Motivation, Current Status, and Research Opportunities. Syst. Eng. 2018, 21, 172–190. [Google Scholar]
- Estefan, J.A. Survey of model-based systems engineering (MBSE) methodologies. INCOSE MBSE Focus Group 2007, 25, 1–12. [Google Scholar]
- De Weck, O.; Roos, D.; Magee, C.; Vest, C. Engineering Systems Meeting Human Needs in a Complex Technological World; MIT Press: Cambridge, MA, USA, 2011. [Google Scholar]
- Kolmogorov, A.N. Combinatorial Foundation of Information Theory and the Calculus of Probability. Russ. Math. Surv. 1983, 38, 29–40. [Google Scholar]
- Miller, G.A. The Magical Number Seven, Plus or Minus Two: Some Limits on Our Capacity for Processing Information. Psychol. Rev. 1956, 63, 81–97. [Google Scholar] [PubMed]
- Eclipse Capella Documentation. Available online: https://www.polarsys.org/capella/ (accessed on 12 December 2018).
- Madni, A.M. Expanding Stakeholder Participation in Upfront System Engineering through Storytelling in Virtual Worlds. Syst. Eng. 2015, 18, 16–27. [Google Scholar]
- Madni, A.M.; Spraragen, M.; Madni, C.C. Exploring and Assessing Complex System Behavior through Model-Driven Storytelling. In Proceedings of the 2014 IEEE International Conference on Systems, Man, and Cybernetics (SMC), San Diego, CA, USA, 5–8 October 2014. [Google Scholar]
Figure 1.
(a) Traditional systems engineering; (b) model-based systems engineering.
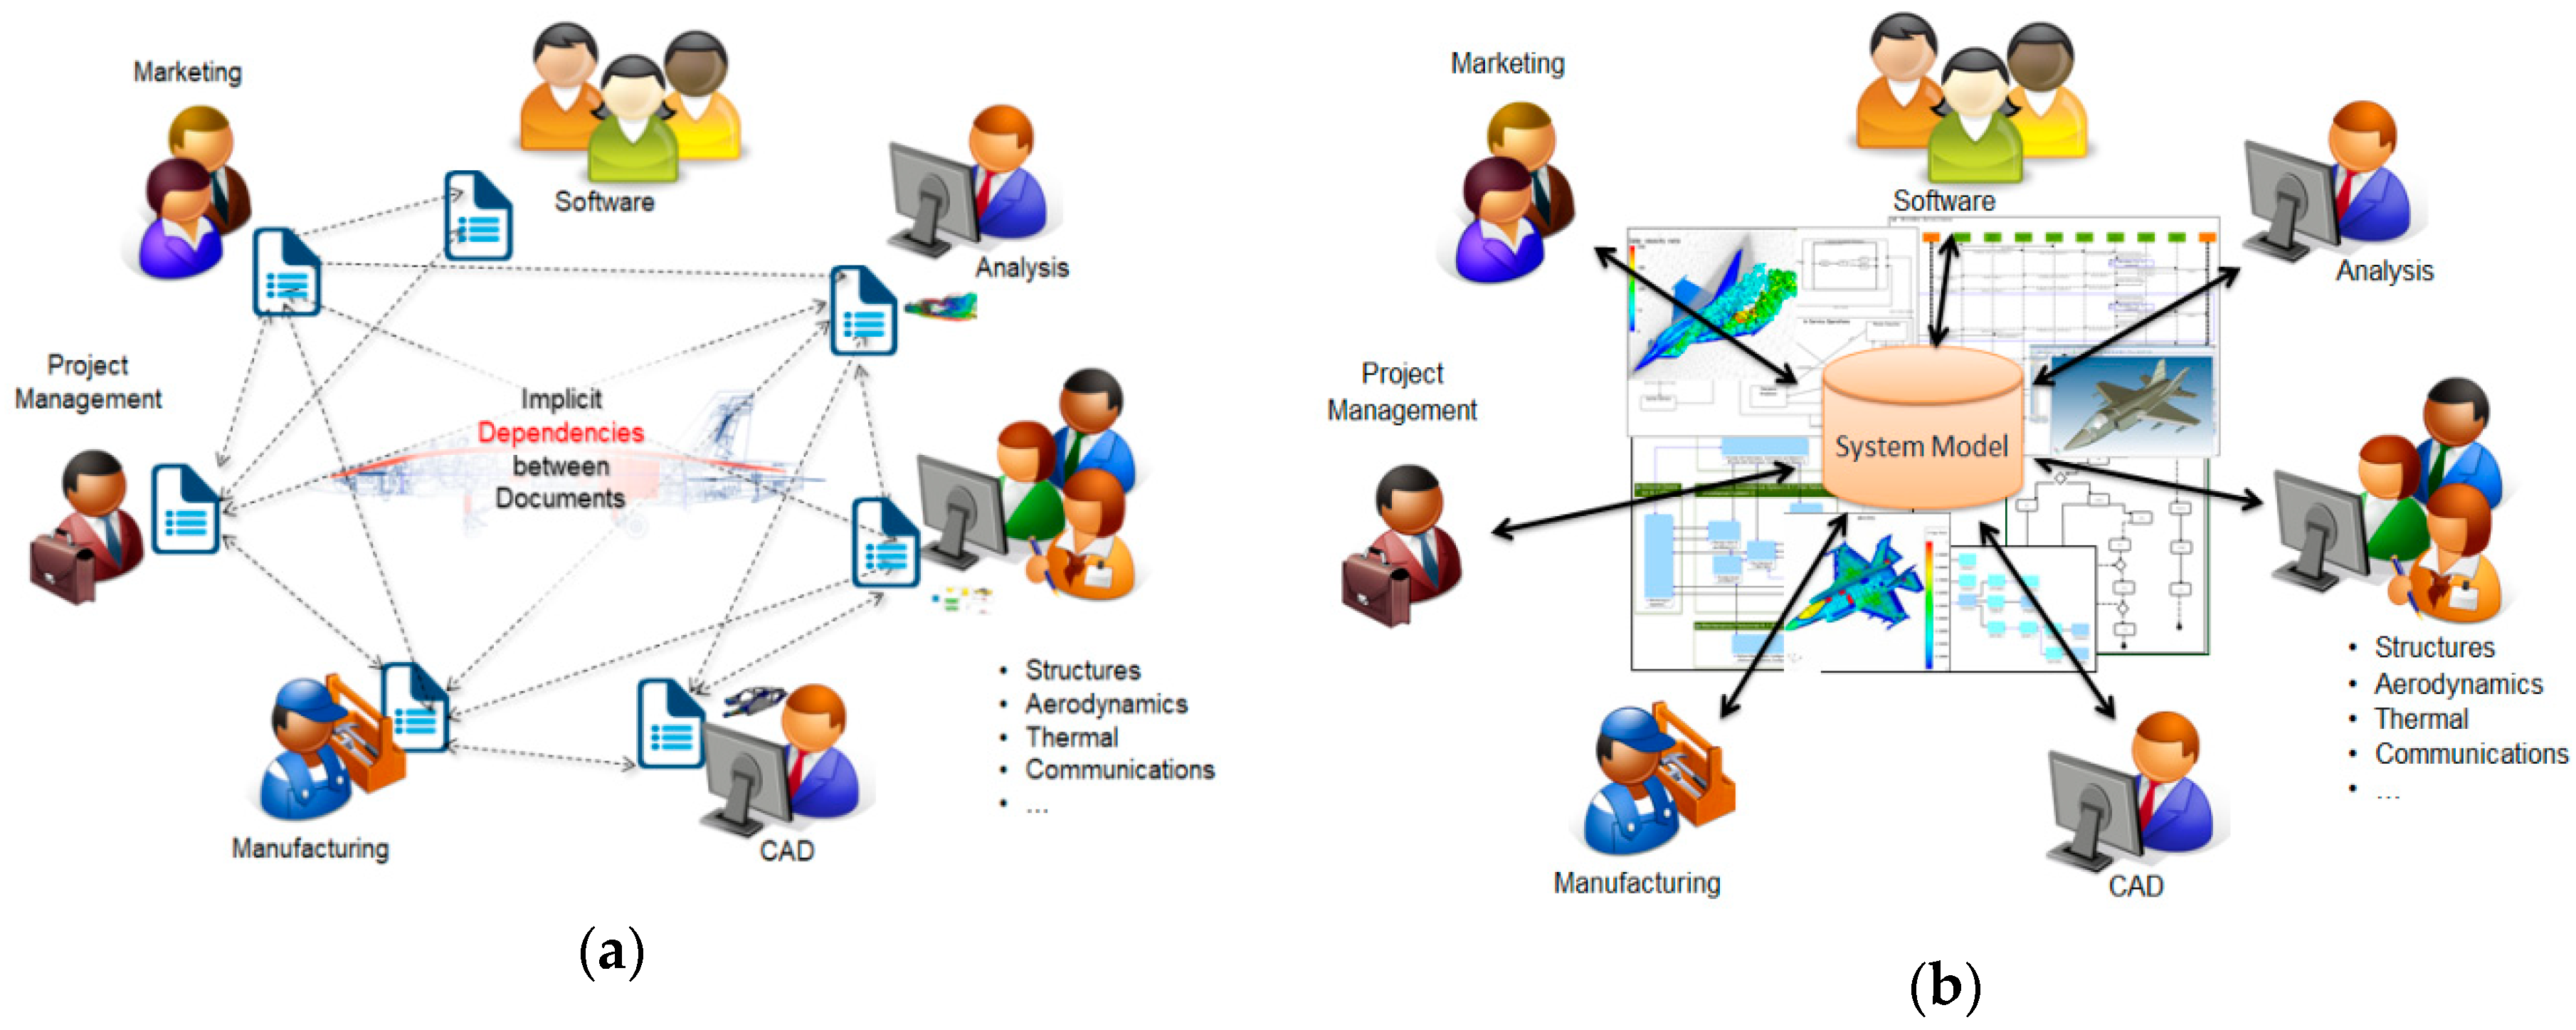
Figure 2.
Model-based systems engineering (MBSE) Economic Analysis Approach.

Figure 3.
MBSE economic analysis methodology: process flow.
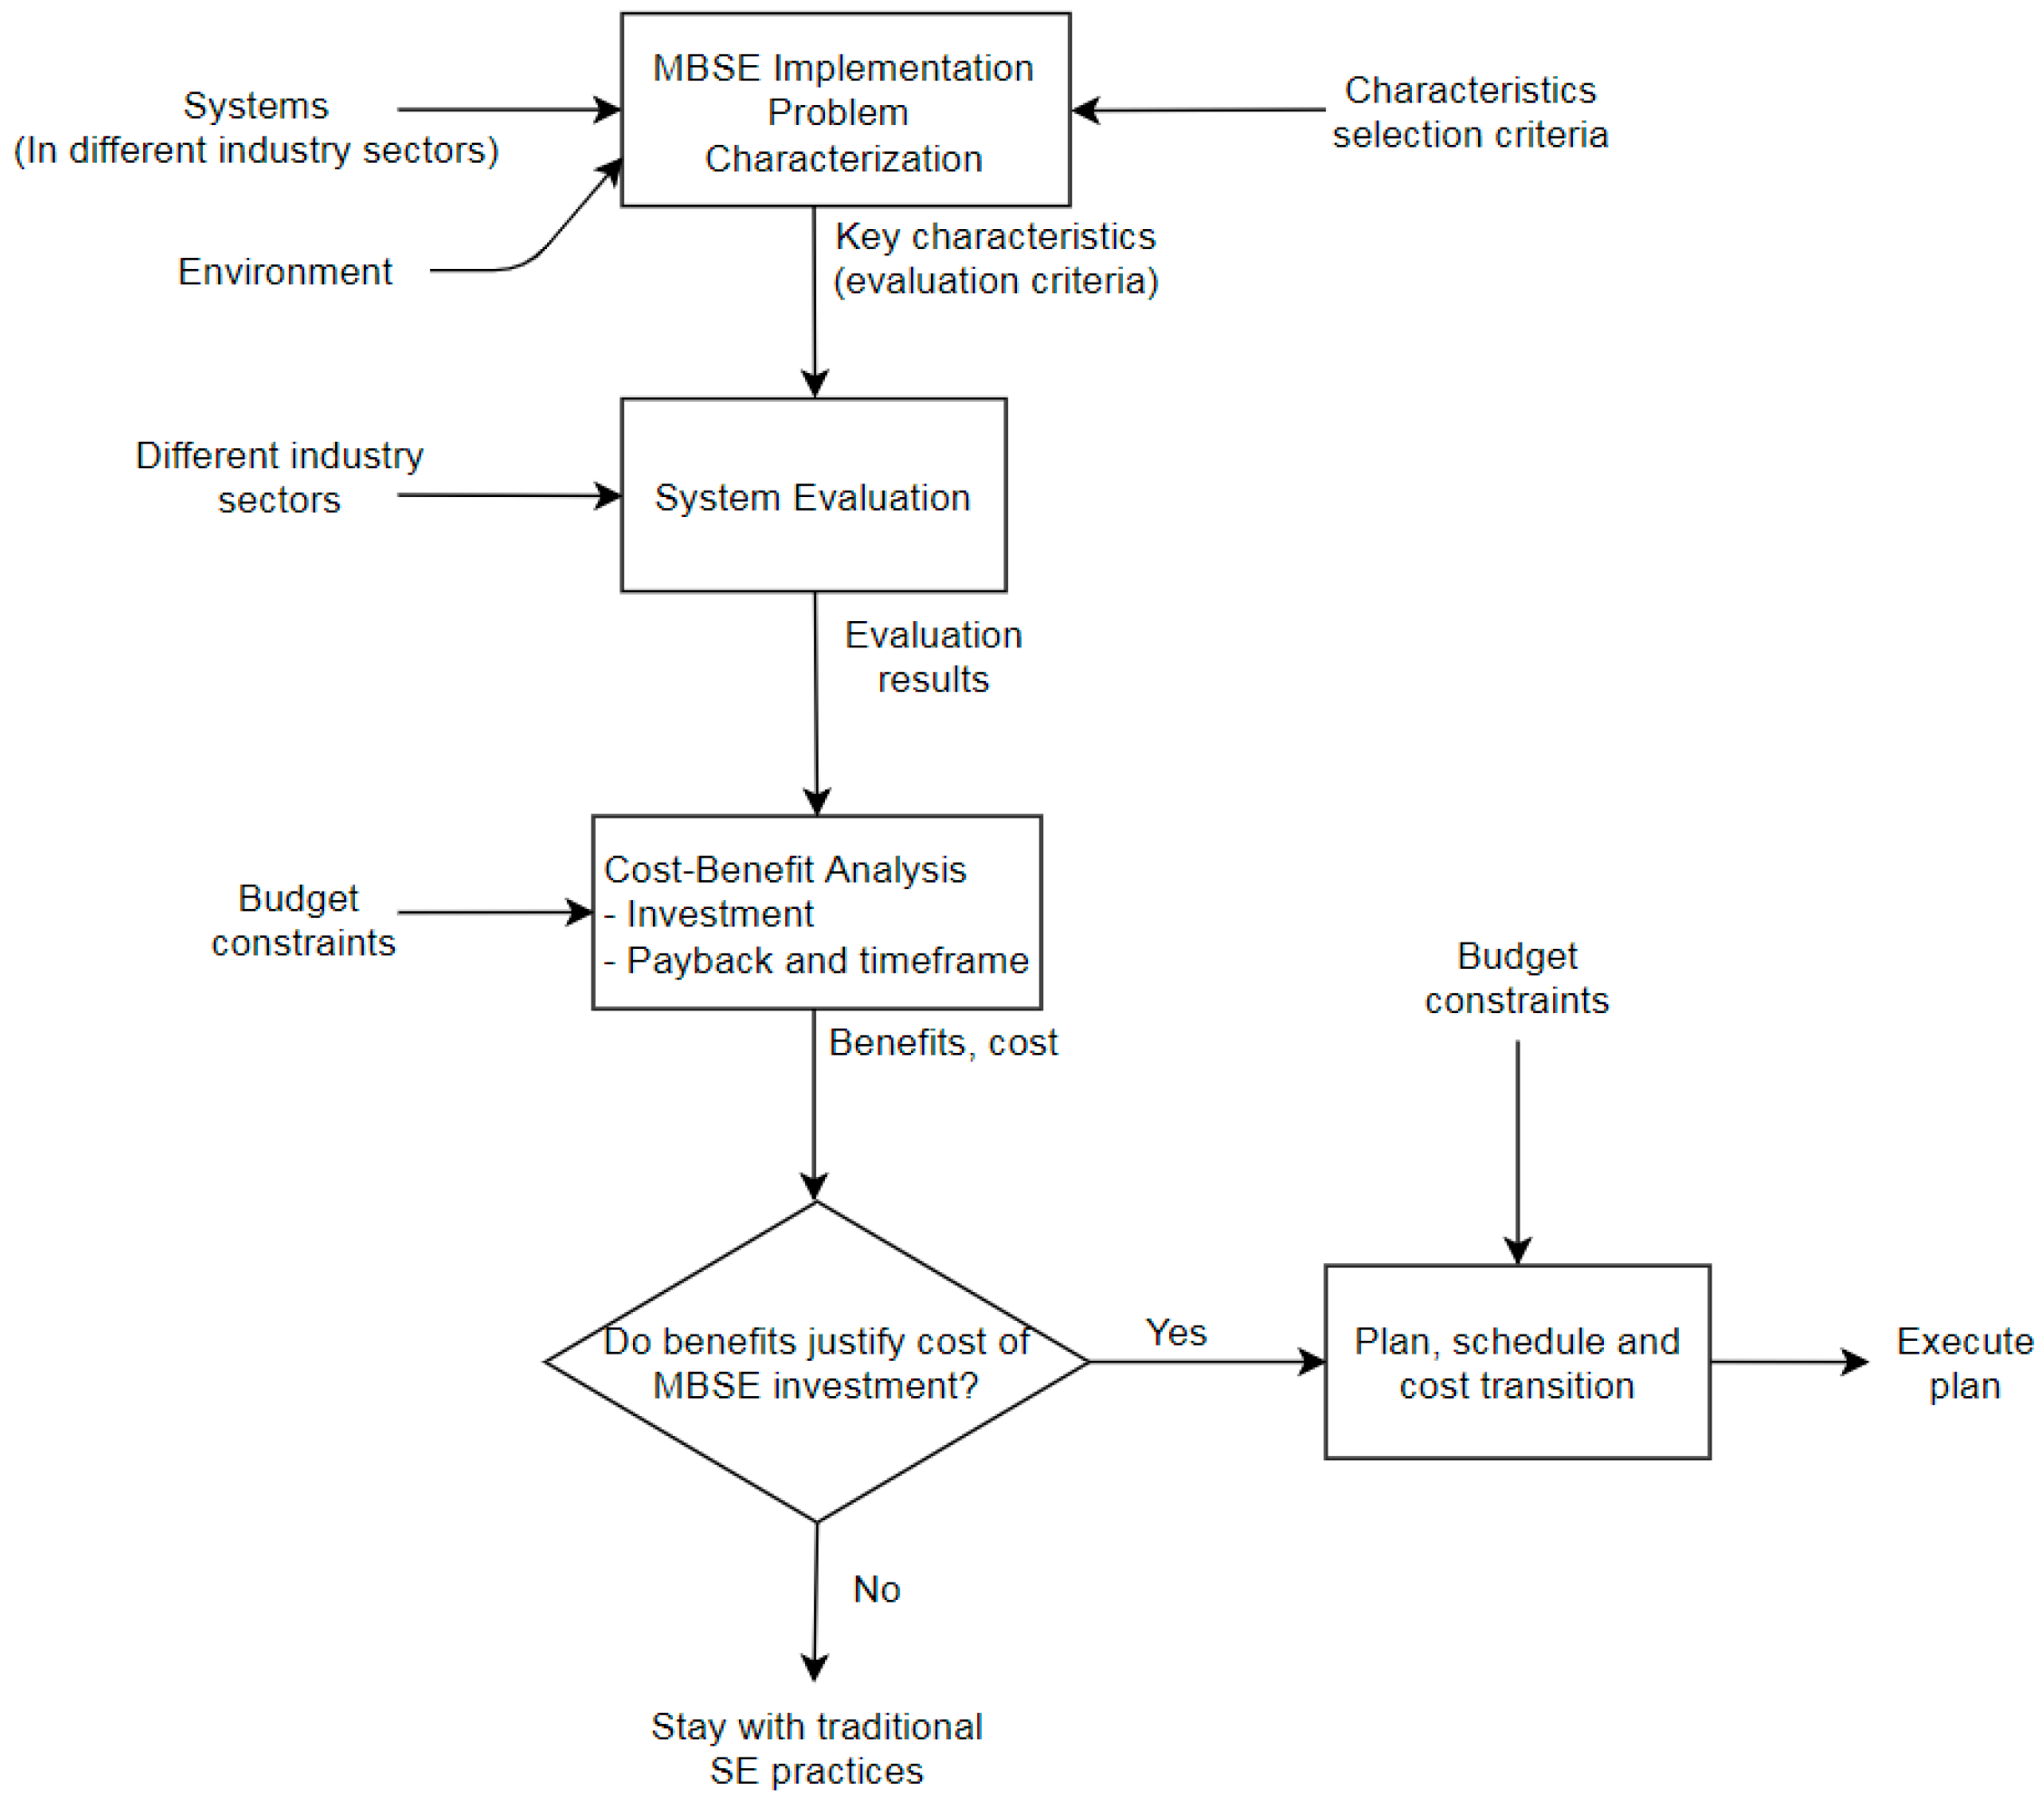
Figure 4.
Committed life cycle cost against time for each stage [3].
Figure 4.
Committed life cycle cost against time for each stage [3].

Figure 5.
Traditional SE cost curve.

Figure 6.
Simulink model of system life cycle processes.

Figure 7.
(a) Processes dependency structure matrix; (b) sequenced processes dependency structure matrix processes.
Figure 7.
(a) Processes dependency structure matrix; (b) sequenced processes dependency structure matrix processes.

Figure 8.
(a) Percentage coverage of system life cycle processes by MBSE tools; (b) MBSE cost curve.
Figure 8.
(a) Percentage coverage of system life cycle processes by MBSE tools; (b) MBSE cost curve.
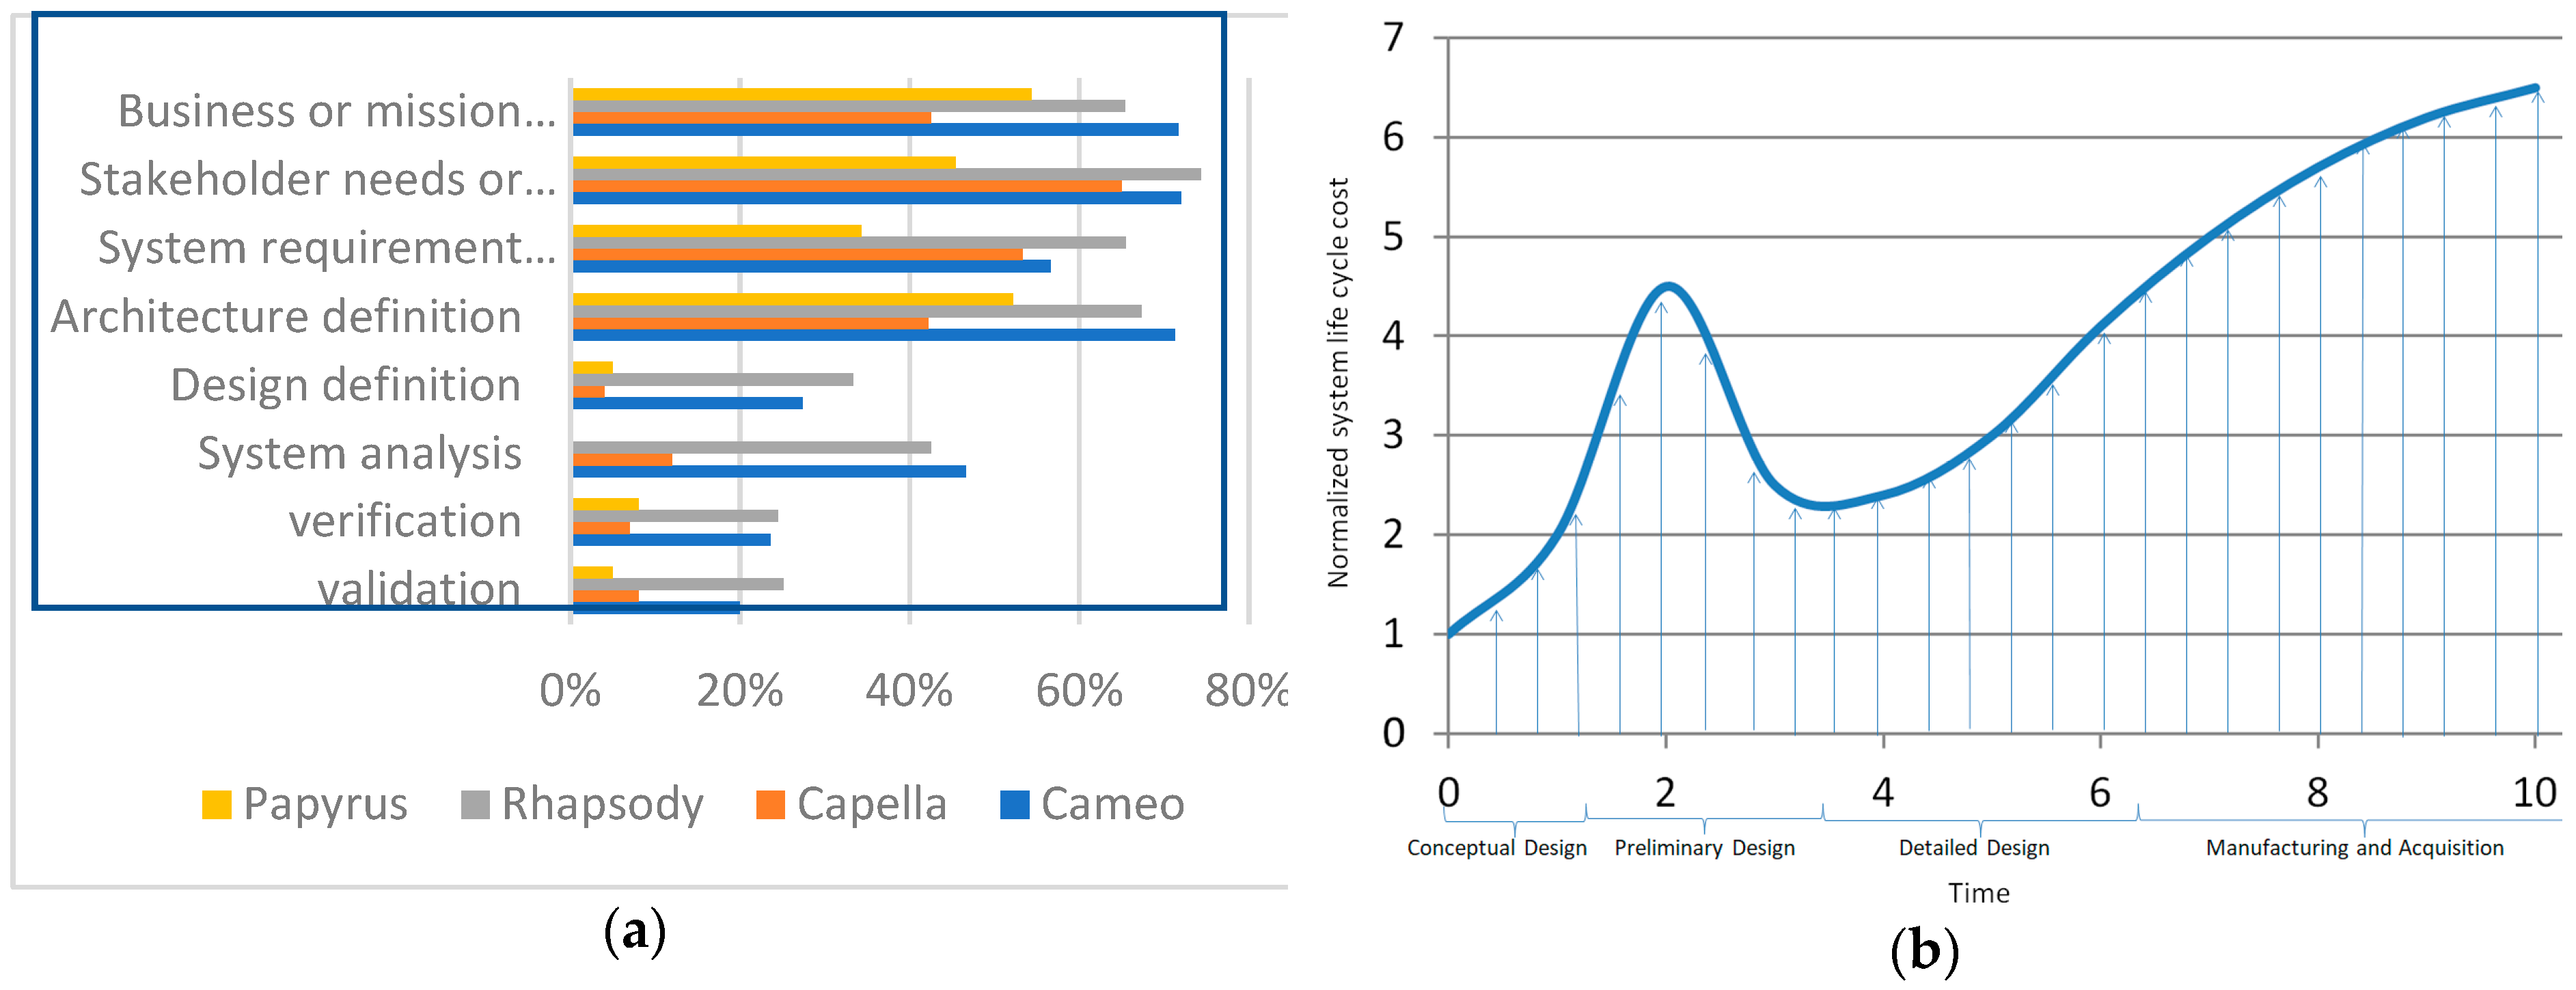
Figure 9.
(a) Comparison of costs between traditional SE and MBSE; (b) difference in investments and savings between traditional SE and MBSE.
Figure 9.
(a) Comparison of costs between traditional SE and MBSE; (b) difference in investments and savings between traditional SE and MBSE.
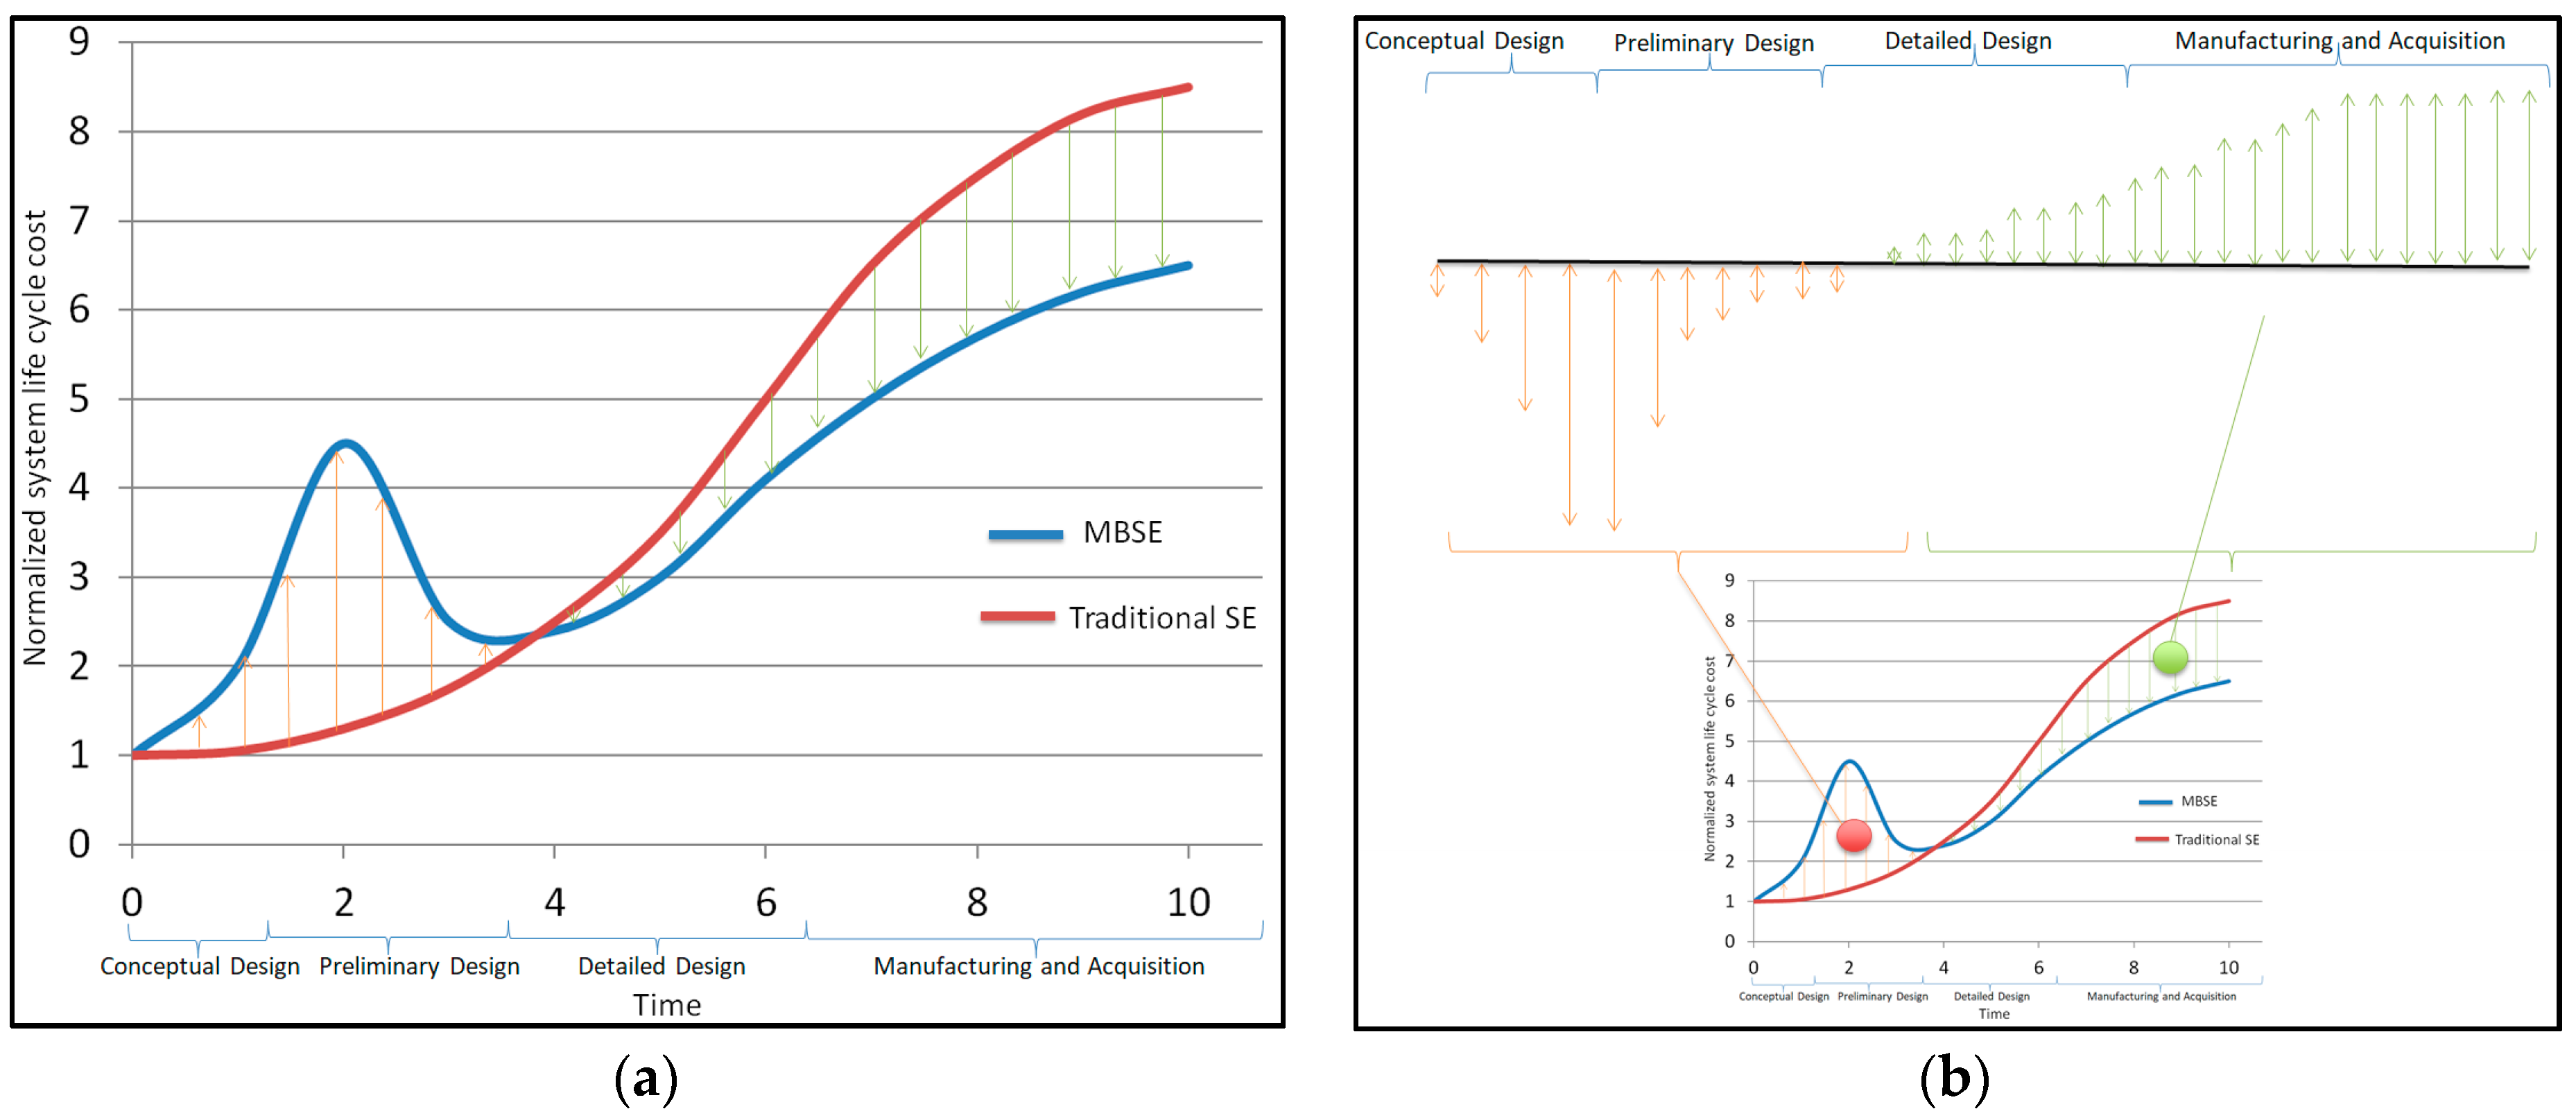
Figure 10.
MBSE factors related to investments and gains.

Figure 11.
MBSE implementation problem difficulty in industry sectors: (a) industry sectors on subjective constructed scale of system complexity, environment complexity, and lifespan; (b) industry sectors on quantitative approximate scale of system complexity, environment complexity, and lifespan; (c) visual representation of MBSE implementation problem in industry sectors along three axes.
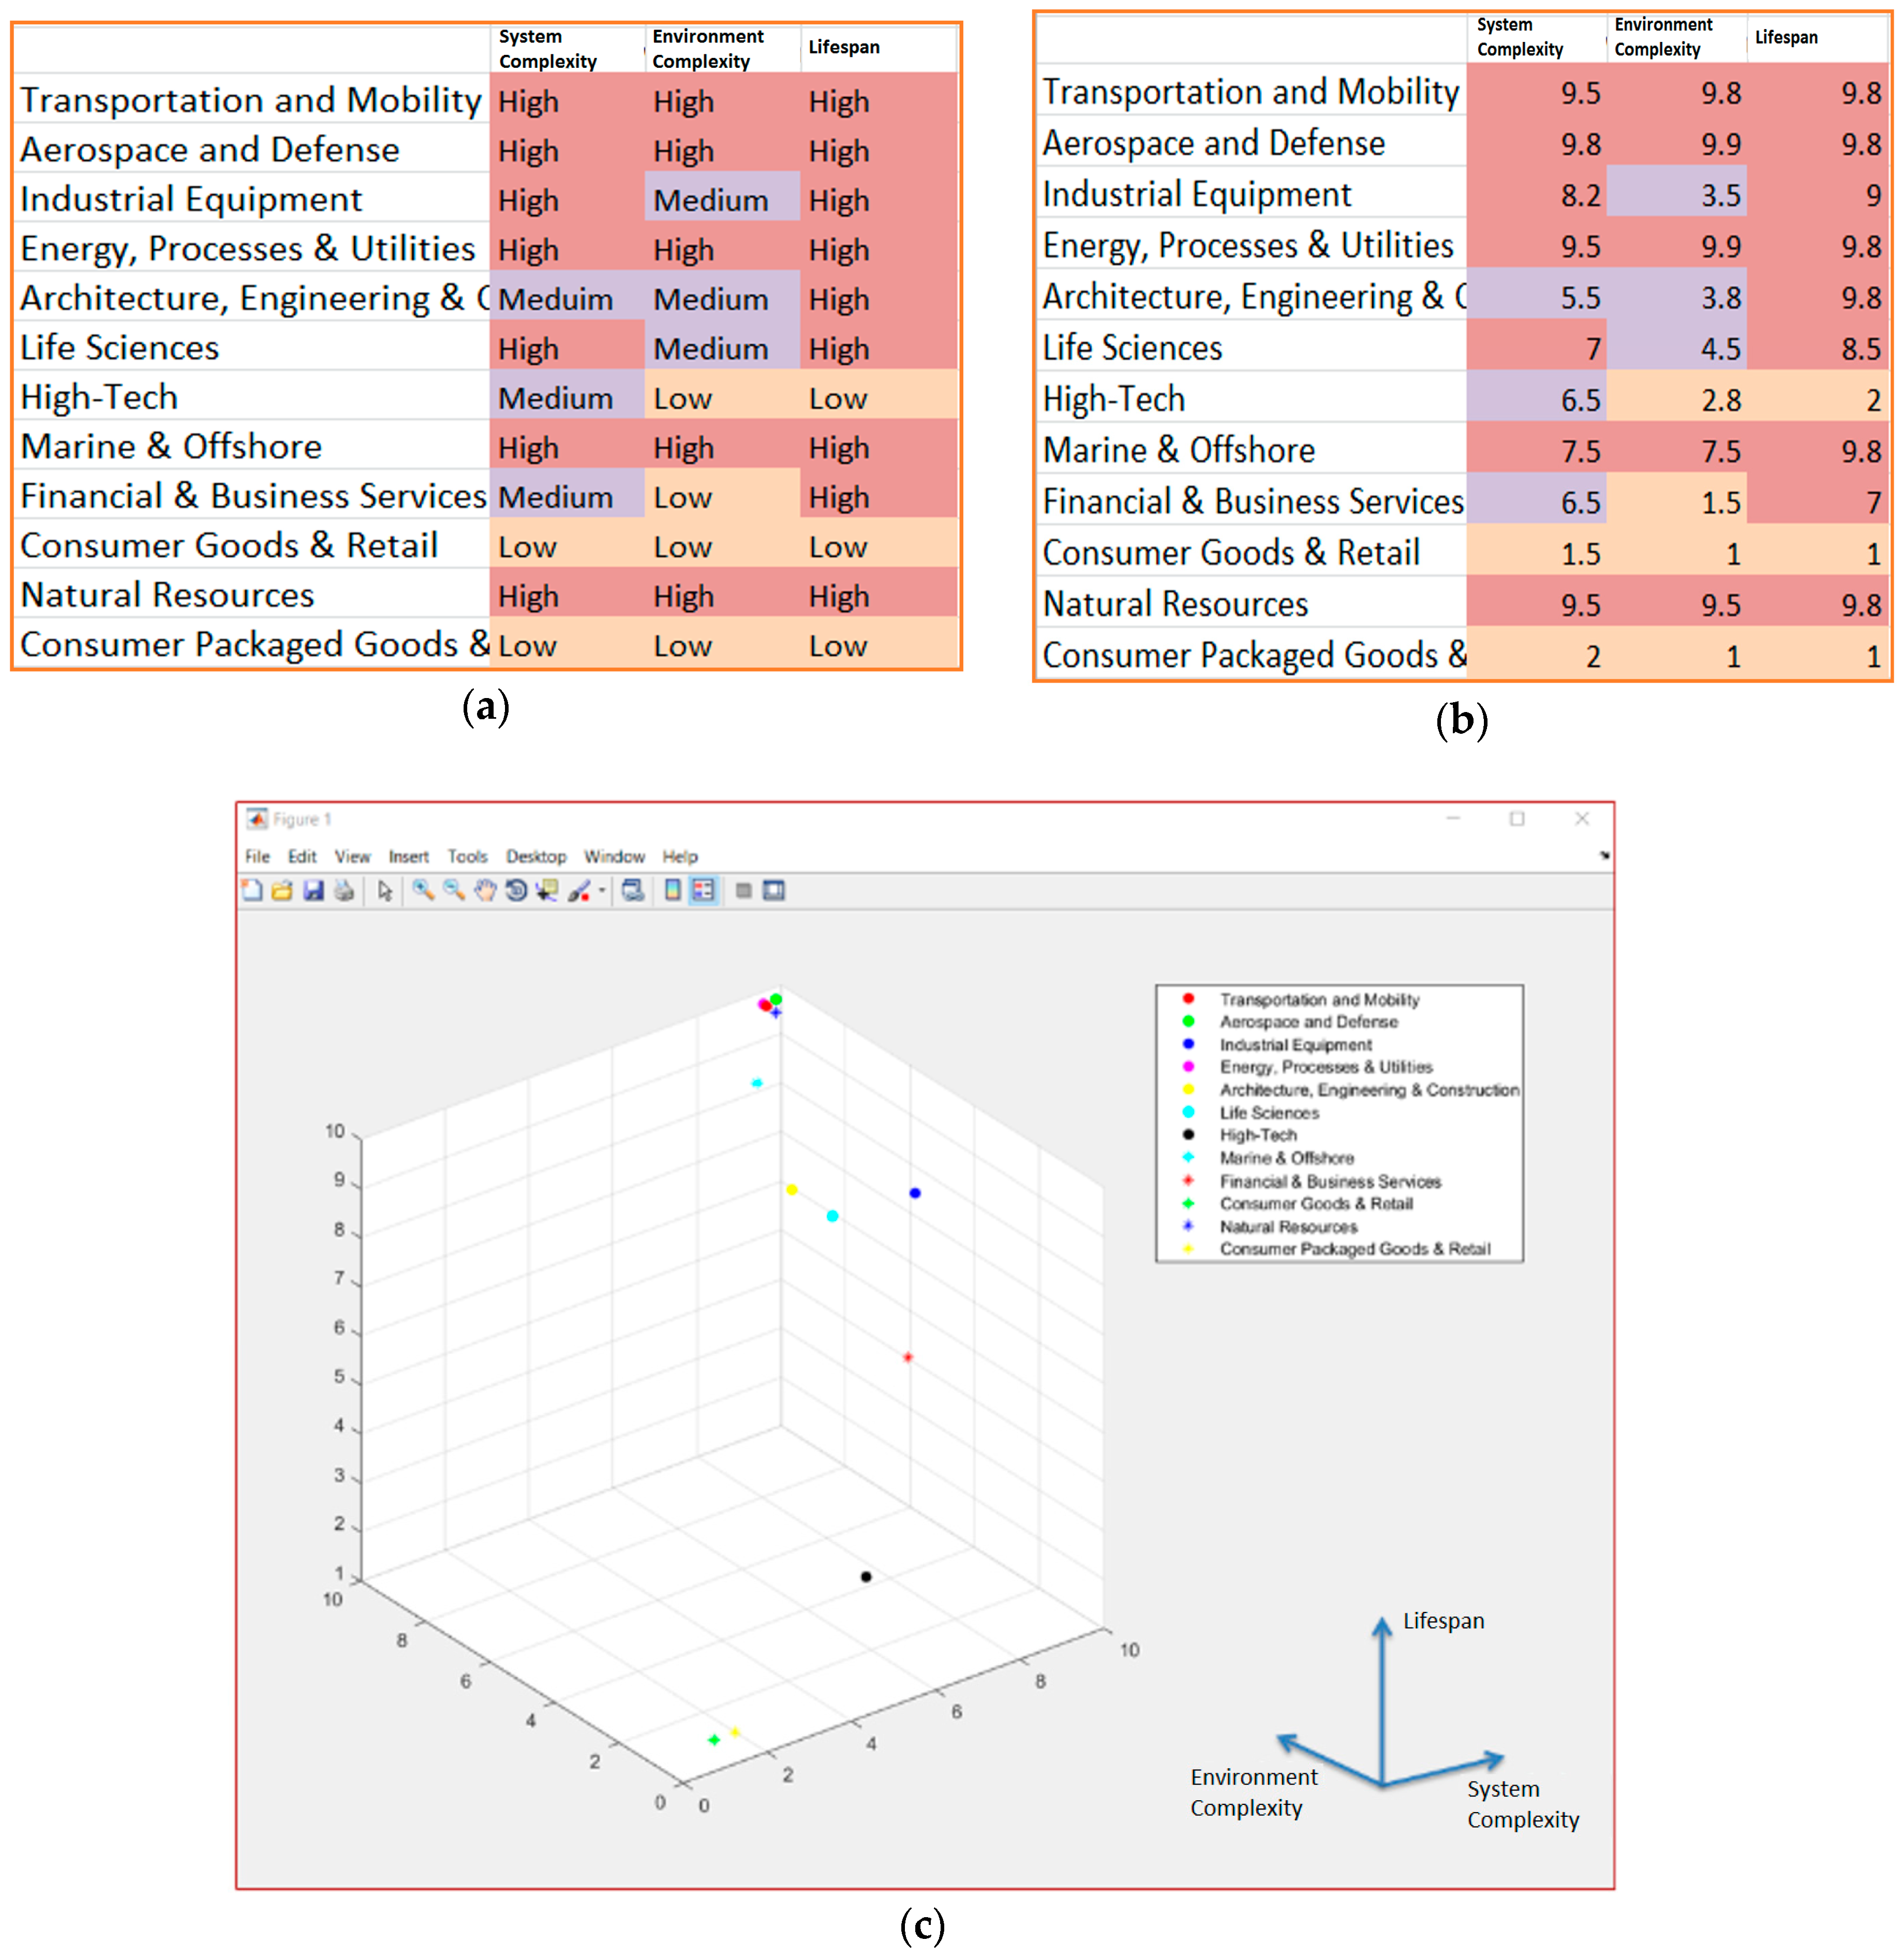
Figure 12.
3D visual representation of MBSE implementation problem in industry sectors.


Table 1.
Industry sectors relevant to systems engineering (SE) [2].
Table 1.
Industry sectors relevant to systems engineering (SE) [2].
| Industry Sectors | Associated Systems |
|---|---|
| Transportation and Mobility | Original equipment manufacturers (OEMs) of cars, light and heavy trucks, buses, trains, motorcycles, racing cars, and suppliers |
| Aerospace and Defense | Commercial and military aircrafts, satellites, and exploration systems |
| Industrial Equipment | Specialized manufacturing machinery, industrial robots, machine tools, 3D printers, power & fluidic equipment, fabricated metal & plastic products, and heavy mobile machinery |
| Energy, Processes and Utilities | Power generation and distribution systems |
| Architecture and Construction | Commercial and government infrastructures, buildings, and cities |
| Life Science | Pharmaceutical, Biotechnology, medical devices, and patient care |
| High-Tech | Consumer Electronics, telecommunication, computing & network technology suppliers, contract manufacturing services, security, control & instrumentation, and semiconductor industry |
| Marine and Offshore | Ship, yacht & workboat industry, and navy |
| Financial and Business Services | Banking, insurance and financial markets |
| Consumer and Retail | Home, lifestyle and fashion industry |
| Natural Resources | Mining, oil, gas, agriculture and forestry industry |
| Consumer Packaged Goods and Retail | Food, beverages, personal care, household products, packaging suppliers, and general retailers |
Table 2.
System life cycle ISO/IEC/IEEE 15288 2015(E): Processes in system life cycle [11].
Table 2.
System life cycle ISO/IEC/IEEE 15288 2015(E): Processes in system life cycle [11].
| Technical Processes | Technical Management Processes | Organizational Project-Enabling Processes | Agreement Processes |
|---|---|---|---|
|
|
|
|
© 2019 by the authors. Licensee MDPI, Basel, Switzerland. This article is an open access article distributed under the terms and conditions of the Creative Commons Attribution (CC BY) license (http://creativecommons.org/licenses/by/4.0/).
Share and Cite
MDPI and ACS Style
Madni, A.M.; Purohit, S. Economic Analysis of Model-Based Systems Engineering. Systems 2019, 7, 12. https://0-doi-org.brum.beds.ac.uk/10.3390/systems7010012
AMA Style
Madni AM, Purohit S. Economic Analysis of Model-Based Systems Engineering. Systems. 2019; 7(1):12. https://0-doi-org.brum.beds.ac.uk/10.3390/systems7010012
Chicago/Turabian StyleMadni, Azad M., and Shatad Purohit. 2019. "Economic Analysis of Model-Based Systems Engineering" Systems 7, no. 1: 12. https://0-doi-org.brum.beds.ac.uk/10.3390/systems7010012
Note that from the first issue of 2016, this journal uses article numbers instead of page numbers. See further details here.