Commonality in Liquidity Indices: The Emerging European Stock Markets


1
Department of Econometrics, Poznań University of Economics and Business, al. Niepodległości 10, 61-875 Poznań, Poland
2
Department of Operations Research, Poznań University of Economics and Business, al. Niepodległości 10, 61-875 Poznań, Poland
*
Author to whom correspondence should be addressed.
†
These authors contributed equally to this work.
Systems 2019, 7(2), 24; https://0-doi-org.brum.beds.ac.uk/10.3390/systems7020024
Submission received: 1 April 2019
/
Revised: 16 April 2019
/
Accepted: 24 April 2019
/
Published: 28 April 2019
(This article belongs to the Special Issue Mathematical Models of Economic Systems)
Abstract
:The aim of the paper is to examine commonality in liquidity indices across emerging European stock markets. Five markets are included in the study: Hungarian, Czech, Polish, Russian and Turkish, in the period from 2008 to 2017. We propose liquidity indices that are based on low-frequency liquidity proxies and capture both the dynamics coming from volume and price changes. We find strong commonality of the liquidity indices across all examined markets which is robust to the choice of liquidity proxy. The dependence between indices enhances in times of crisis and large market declines, and weakens when markets become stable. We also examine the interdependency between liquidity and volatility estimates and find that liquidity on the European emerging markets is related to CBOE Volatility Index (VIX). Liquidity in the whole region decreases when VIX increases, and vice versa. The liquidity indices based on the extreme market movements show that there are no differences in commonality in time of extreme negative and positive returns.
1. Introduction
There is evidence in the literature that individual stock liquidity as well as market liquidity varies over time [1]. In addition, some stocks are evidently more liquid than others; the same applies to different stock markets. There is a number of studies devoted to commonality in liquidity, that is a co-movement of liquidity measures over time [2]. This commonality might be examined for individual assets listed on a given market [3,4,5]. On the market level it is focused on the search for contemporanous co-movements in liquidities across different markets [2,6,7,8]. As the liquidity of the stocks and thus of the broader markets evolves, the important issue arises: are there any patterns in liquidity across the markets? If yes, what are the common underlying determinants of the liquidity? What drives the commonality of liquidity measures across the markets?
This study is aimed at examining the commonality in liquidity in the emerging European stock markets. We follow the MSCI Emerging Markets Europe Index (MSCI EM Europe) construction and include in the study five stock exchanges from the Czech Republic, Hungary, Poland, Russia and Turkey. The liquidity of these markets has until now not been much explored (see e.g., [9,10,11,12,13]). We calculate the liquidity indices based on the blue-chip stocks for these markets and focus on the time-varying behavior of the indices under the changing economic conditions. More specifically, we are interested in how financial crisis periods influenced liquidity of the markets and their dependency. We also examine if the Chicago Board Options Exchange Market Volatility Index (VIX) influences liquidity in emerging European stock markets.
Liquidity is unobservable and approximated with various alternative measures, focused either on the transaction costs (spread measures), or trading volume [14]. Recent papers identify some high-quality liquidity proxies that could be calculated on widely available daily data, but still there is no single winner of the race for the best liquidity proxy [15]. As we focus on different markets, an aggregated measure such as liquidity index is required. While stock indices have been introduced in the late 19th century, and volatility indices have obtained more attention since Brenner and Galai introduced in 1989 the famous “market fear” measure, VIX, less attention is paid to the aggregated liquidity measures [16]. In the literature, the most popular approach is to use simple average of individual assets proxies [12,14,17]. We propose an index that is constructed on the basis of liquidity of the biggest and the most liquid stocks. It uses weights based on the stocks’ trading volumes. The choice of the stocks is determined by the portfolio selection process of financial intermediaries—on the emerging markets they tend to invest only in the blue-chip stocks. As no single liquidity proxy is shown to be the best measure of unobservable liquidity, we examine the co-movement of indices constructed on the basis of various liquidity measures. Thus we combine information from various sources, such as trading volume or range of prices. As shown in [18] the liquidity measures consist of the systematic and the specific components. By examining co-movements in indices based on different proxies, we verify the existence of common facet of liquidity on the European emerging stock markets.
The principal findings of this study can be summarized as follows: there is a significant commonality in liquidity indices in the emerging European stock exchanges that strengthens during times of high volatility, especially during market crisis. Our study contributes in several ways to the existing literature [6,7,18,19]. First, we propose the method of liquidity index calculation and show that our indices based on different proxies display similar dynamics within each of five markets considered in the study. Market liquidity is fragile: it evaporates quickly in hectic periods [20]. Second, considering indices based on the same proxy for different markets, we find that commonality in liquidity is higher during times of high volatility (as the global financial crisis of 2008) and lower during tranquil times. Single indices show only temporary deviations from the general patterns in liquidity in the region—these result from the specific features of single markets. However, the systematic component prevails over the specific one. Our third important finding is that liquidity in emerging European markets is strongly related to volatility, and specifically to the behavior of CBOE VIX index—the correlations between liquidity indices and VIX index are high and significant. These correlations are stronger in the period of very volatile market than in the calm periods. This confirms the hypothesis of the impact of the financial intermediaries on the markets [21]—the withdrawal of the funds is almost simultaneous in the region, causing substantial liquidity drops and further price declines (so called illiquidity spiral). Our study shows that although each single market has its own dynamics, the emerging European markets considered in the study are vulnerable to the common factors. We show that volatility on the markets is one of them.
2. Literature Review
The literature on the commonality in liquidity has become a very impressive body of knowledge. For the developed markets, commonality is more intense than for the emerging ones [7,22,23]. While the individual transaction costs behave similarly for individual assets, the average level of commonality is rather weak. Commonality is said to increase substantially when best orders are omitted in the analysis—liquidity beyond best prices seem to determine the systematic risk of large trades [5]. In addition, commonality in liquidity changes over time: it increases in times of large market declines, achieving the highest level within the financial crisis period [24]. The sensitivity of a single stock’s liquidity to market liquidity shocks increases together with higher institutional ownership [25].
On the international level, some studies compare the commonality in liquidity for stocks listed on different markets [6,7,25]. They show that commonality in analyzed markets is higher during periods of high volatility. Commonality might be perceived from two perspectives [7]: supply-side and demand-side. Within the first one the funding liquidity of financial intermediaries is affected by the overall market conditions and specifically by highly volatile markets—the intermediaries withdraw the funds at the same time from different markets, both affecting badly market liquidity and increasing commonality in liquidity. This is in line with the evidence showing that liquidity is particularly low in falling markets [26]. The transaction costs are asymmetric: they increase more in falling market than they decrease in rising markets. Within the demand-side explanation, three hypotheses are examined [7]: the correlated trading of institutional investors, the demand for liquidity which is correlated across the stocks, and the investor sentiment. We examine the commonality in liquidity across different markets in a given region, so we focus on the supply-side as it seems to be more appropriate and reasonable.
The supply-side is similar to the collateral-based approach described in [27]. The fall in prices forces financial intermediaries to close their positions and induces higher transaction costs (higher bid-ask spreads). This phenomena generates “a spiraling fall” in liquidity measures. Thus market liquidity is very much related to the financial intermediaries’ situation. Another approach represented in a “fire-sale” theory explains further this mechanism: outside buyers provide additional liquidity during the massive sell period for additional compensation—that results in relatively higher transaction costs at the time of a total sale [27]. In a similar spirit, liquidity responds to the changes in the market value in an asymmetric way: negative market returns decrease stock liquidity more than positive returns increase liquidity and this phenomena is especially noticeable in periods of falling market [19]. The measures of stock market liquidity are the indicators for the current and future situation in the real economy [17]. Based on the US and Norway market it has been shown that the commonality in liquidity may result from the “flight-to-quality” effect, that refers to a situation where in falling market investors change their portfolios toward more liquid and thus less risky stocks [17]. In a similar manner, noise traders (speculators) reduce the supply of the liquidity during times of market declines because they require higher returns [21]. In addition, liquidity is lower during financial crises because of the adverse selection problems [19].
By using a data set from relatively less examined countries from emerging Europe this paper aims to shed further light on this phenomena. We extend the concept of commonality in liquidity: originally commonality, understood as a common underlying determinants of liquidity [22], was considered on a given market [22,24,28] or compared on different markets [7,17]. In this paper we focus on commonality in liquidity within single markets (within-country) as well as between whole markets (cross-country) in the emerging European region. In the era of globalization of financial markets, funds are easily moved across the borders. The financial intermediaries invest part of the portfolios into emerging markets, including European ones. The existence of commonality across different markets might be perceived as an evidence of systematization of liquidity risk [28]. Thus we examine the global volatility measured by the VIX index as the determinant of commonality in liquidity, that occurs to be important for the emerging countries. The focus of the paper on a different set of countries, the application of more than one liquidity measure and the examination of the interdependencies with VIX index, allow to fulfill the gap in the literature.
3. Data and Methods
In order to examine commonality in liquidity we first define and calculate liquidity index for each emerging market. In this section we describe our sample, the liquidity proxies and the methodology used for the calculation of liquidity indices.
3.1. Data Source and Sample Preparation
We include the five most important emerging stock markets in Eastern Europe: the Czech Republic, Hungary, Poland, Russia and Turkey. This selection originates in the composition of the MSCI EM Europe Index that captures large and mid-cap representatives across six European emerging markets and as such the selection is similar to other studies [29,30]. Although MSCI EM Europe Index includes Greece, we do not consider the Greek stock market in our study as it has joined this index recently.
The data are from Refinitiv (former EIKON Thomson Reuters®) database and include all listed and delisted common stocks that have been the constituents of the main blue chip indices listed in these markets. These are: BIST30 (the Borsa Istanbul), BUX (the Budapest Stock Exchange), PX (former PX50, the Prague Stock Exchange), RTS (the Moscow Exchange) and WIG20 (the Warsaw Stock Exchange). We focus on these particular countries and blue-chip stocks that are listed in these stock markets because the financial intermediaries that operate on the European emerging markets tend to invest: (1) in countries from which the constituents of well-known indices come; and (2) mainly in the most liquid stocks that are listed in these markets.
The sample period starts in January 2008 and ends in December 2017 and thus includes at least two financial turmoils—it allows to evaluate commonality on the financial markets when the market fundamentals change. The calculations are based on the daily (low-frequency) data. We collect four prices, high, low, open and close, as well as volume for each stock in the sample. All prices are expressed in the USD currency to allow for comparisons across the markets. A company is included in the sample within the period if it was a constituent of the index—this issue is determined on the basis of “leavers and joiners” information available in Refinitiv. We control for so-called penny stocks, but as we focus on the most liquid ones which are the constituents of the main indices, they are eliminated systemically. We have also screened the data for suspicious events and outliers [31].
Our original sample together with the number of stocks included in each of the five indices within the whole period and number of quotations are summarized in Table 1. Between 2008 and 2017 there have been 53 different stocks which were or still are the constituents of the BIST30 index, 24 stocks from BUX, 18 from PX, 64 from RTS and 37 from WIG20. For the further analysis we need the sample with observations recorded on the same days for all markets. In fact, the working days on different exchanges vary. Removing all these days, for which we did not have the listings for all indices, would have resulted in reducing the size of the sample (see Table 1). Thus, similarly to what has been done in [32], we removed only these days, for which at least three out of five markets did not operate. The missing data were added in such a way, that for each stock for which data were missing, the prices were taken the same as in the previous observation, while volume has been set to zero. These data have been used for index calculation. In case of missing data in index, prices were treated as for a single stock, while volumes have been obtained from interpolation based on the previous and the next day.
Finally, in order to assess the commonality of the indices with volatility index, we use daily quotes of CBOE VIX index as a proxy. These data are from www.cboe.com.
3.2. Liquidity Measures and Index Calculation Methodology
Our choice of liquidity measures are driven by the availability of the data. Although some liquidity measures used in the literature require intra-day data, measures based on low-frequency have been shown to be satisfying [14,15]. Further, the choice of our proxies is practically justified: managers rarely use sophisticated models or measures to gauge liquidity [33]. We are interested in the simple measures that are calculated on the basis of daily data and proxy for liquidity in a single day (in contrast to some measures extensively used in the literature that are averaged within a month [12,15]). All liquidity measures and indices are in fact the proxies for “illiquidity”—the higher the values of measures and indices, the more illiquid the market is, and vice versa. The choice of the measures depends on the spectrum of comparison: price-based liquidity measures perform better than volume-based measures at representing cross-country liquidity effects, while on the within-country comparison the volume-based measures are better than price-based [12]. We consider both within-country and cross-country comparisons, so we employ three liquidity measures based on daily data and that are widely employed in the studies for the developed markets: two bid-ask spread proxies, the high-low spread estimator [34] and the adjusted quoted close spread [35], as well as volume-based Amihud illiquidity [36], which is a price-impact (elasticity) measure.
The idea of high-low spread estimator of [34] is based on the notice that the high price within a day is related to a buyer-initiated trade, whereas the low price comes from a seller-initiated trade. The range between these two prices, the high and the low, encompasses the volatility of a stock as well as the transaction costs of trades. As shown in [37], volatility reflects liquidity—in a cross-section the deep markets are usually less volatile than the thin ones. The high-low spread estimator (henceforth CS) is calculated using the following formula
where , is the high price in day t, is the low price in day t, and . As the high-low spread calculation is based on the high and the low prices from two consecutive days and its variance, the ratio estimated within two days will incorporate the variability of the overnight returns. Therefore, following [34] we adjusted high-low spread estimator for overnight returns.
The second estimate of the bid-ask spread used in the study is the quoted close spread proposed by [35]. It has been adjusted by replacing the ask and the bid prices with the high and the low prices, respectively. The reason for this adjustment is similar to one presented in [34]—while the high and the low prices are widely available, bid and ask data are rarely offered. Thus, we calculate this proxy called here high-low range, HLR, as follows:
As the high price and the low price are buyer and seller initiated prices respectively, the high-low range shows what is the biggest distance between these prices within a day. The denominator facilitates the comparisons between the stocks [38]. The third liquidity proxies used in the study, Amihud illiquidity [36], is the ratio of the daily absolute return , to the logarithm of trading turnover:
This ratio follows the price impact definition of liquidity [39] and captures how much price moves with a given trading volume. On the basis of these measures obtained for each stock separately, we construct liquidity index for each country. The liquidity index on a given day t is defined as follows:
where: is a liquidity proxy for stock i at a time t, is a weight of an individual stock i at a time t, and n is the number of stocks. The weights are based on the turnover of a given stock i on day t, with respect to all remaining components’ turnover, and are daily updated. Thus the liquidity index is a turnover-weighted average of all stocks, which were components of a given market index (BIST30, BUX, PX, RTS, WIG20) on day t. Because liquidity proxies are not continuous in time and indicate jumps, we propose to smooth a weighted spread proxy in order to reduce the noise. The method which is often applied when volatile data is analyzed, is exponentially weighted moving average, EWMA [40]. The smoothing constant equal to 0.05 has been chosen within the simulation experiment. On the one hand, such value allows to smooth the series effectively, on the other hand, it does not distort the weighted spread. As a liquidity measure we take into account previously listed proxies: high-low spread estimator (CS), high-low range (HLR), and Amihud illiquidity (ILLIQ).
Various approaches might be used in commonality examination. The most popular one is to measure contemporaneous co-movements by calculating correlation coefficients. Some papers use linear regression approach and check, if the parameters in these “commonality regressions” are statistically significant [22] or examine the determination coefficients in such regressions [7,41]. Alternatively, one may also consider partial correlation analysis as proposed in [32,42,43]. As the liquidity indices display non-linear features, we decided to use the Spearman rank correlations and Kendall’s tau instead of the Pearson correlation coefficient.
All graphs presented in the paper are prepared in OxMetrics7 [44], whereas the calculations are done in R.
4. Empirical Results
In the empirical part of this paper we consider dynamics of indices based on stocks listed on five emerging European markets. First we examine the cross-sectional patterns in the liquidity indices based on different liquidity proxies within the markets, then we study the commonality in these indices across the markets in the region. Second, we propose a modification of liquidity index methodology that include the extreme value approach. Third, we present ARMA-GARCH specifications for relative changes in liquidity proxies and VIX index in order to indicate the possible determinant of the liquidity dynamics.
4.1. Cross-Sectional Patterns within Liquidity Indices
We start the analysis with descriptive statistics of the liquidity indices in the sample. The overall differences in magnitude of different aggregate measures within the sample are reasonable, since these liquidity proxies gauge different concepts of latent liquidity. However, they can be compared among the markets. Table 2 presents the descriptive statistics of the indices based on the three proxies, ILLIQ, CS and HLR. It shows that when ILLIQ is taken into account, the highest mean value of the index, and thus the lowest liquidity, is observed for liquidity indices obtained for the constituents of BIST30 and RTS (LI_BIST and LI_RTS respectively), while the remaining indices are characterized by similar average level of liquidity. However, if medians are considered, both indices, LI_BIST30 and LI_RTS, have the lowest values. In all pairs the equality of means and medians are verified with standard t test and Mann-Whitney U test, respectively. For the sake of brevity the results are not presented here. However, the means and medians are not statistically different from each other. The similar results have been achieved for HLR and CS.
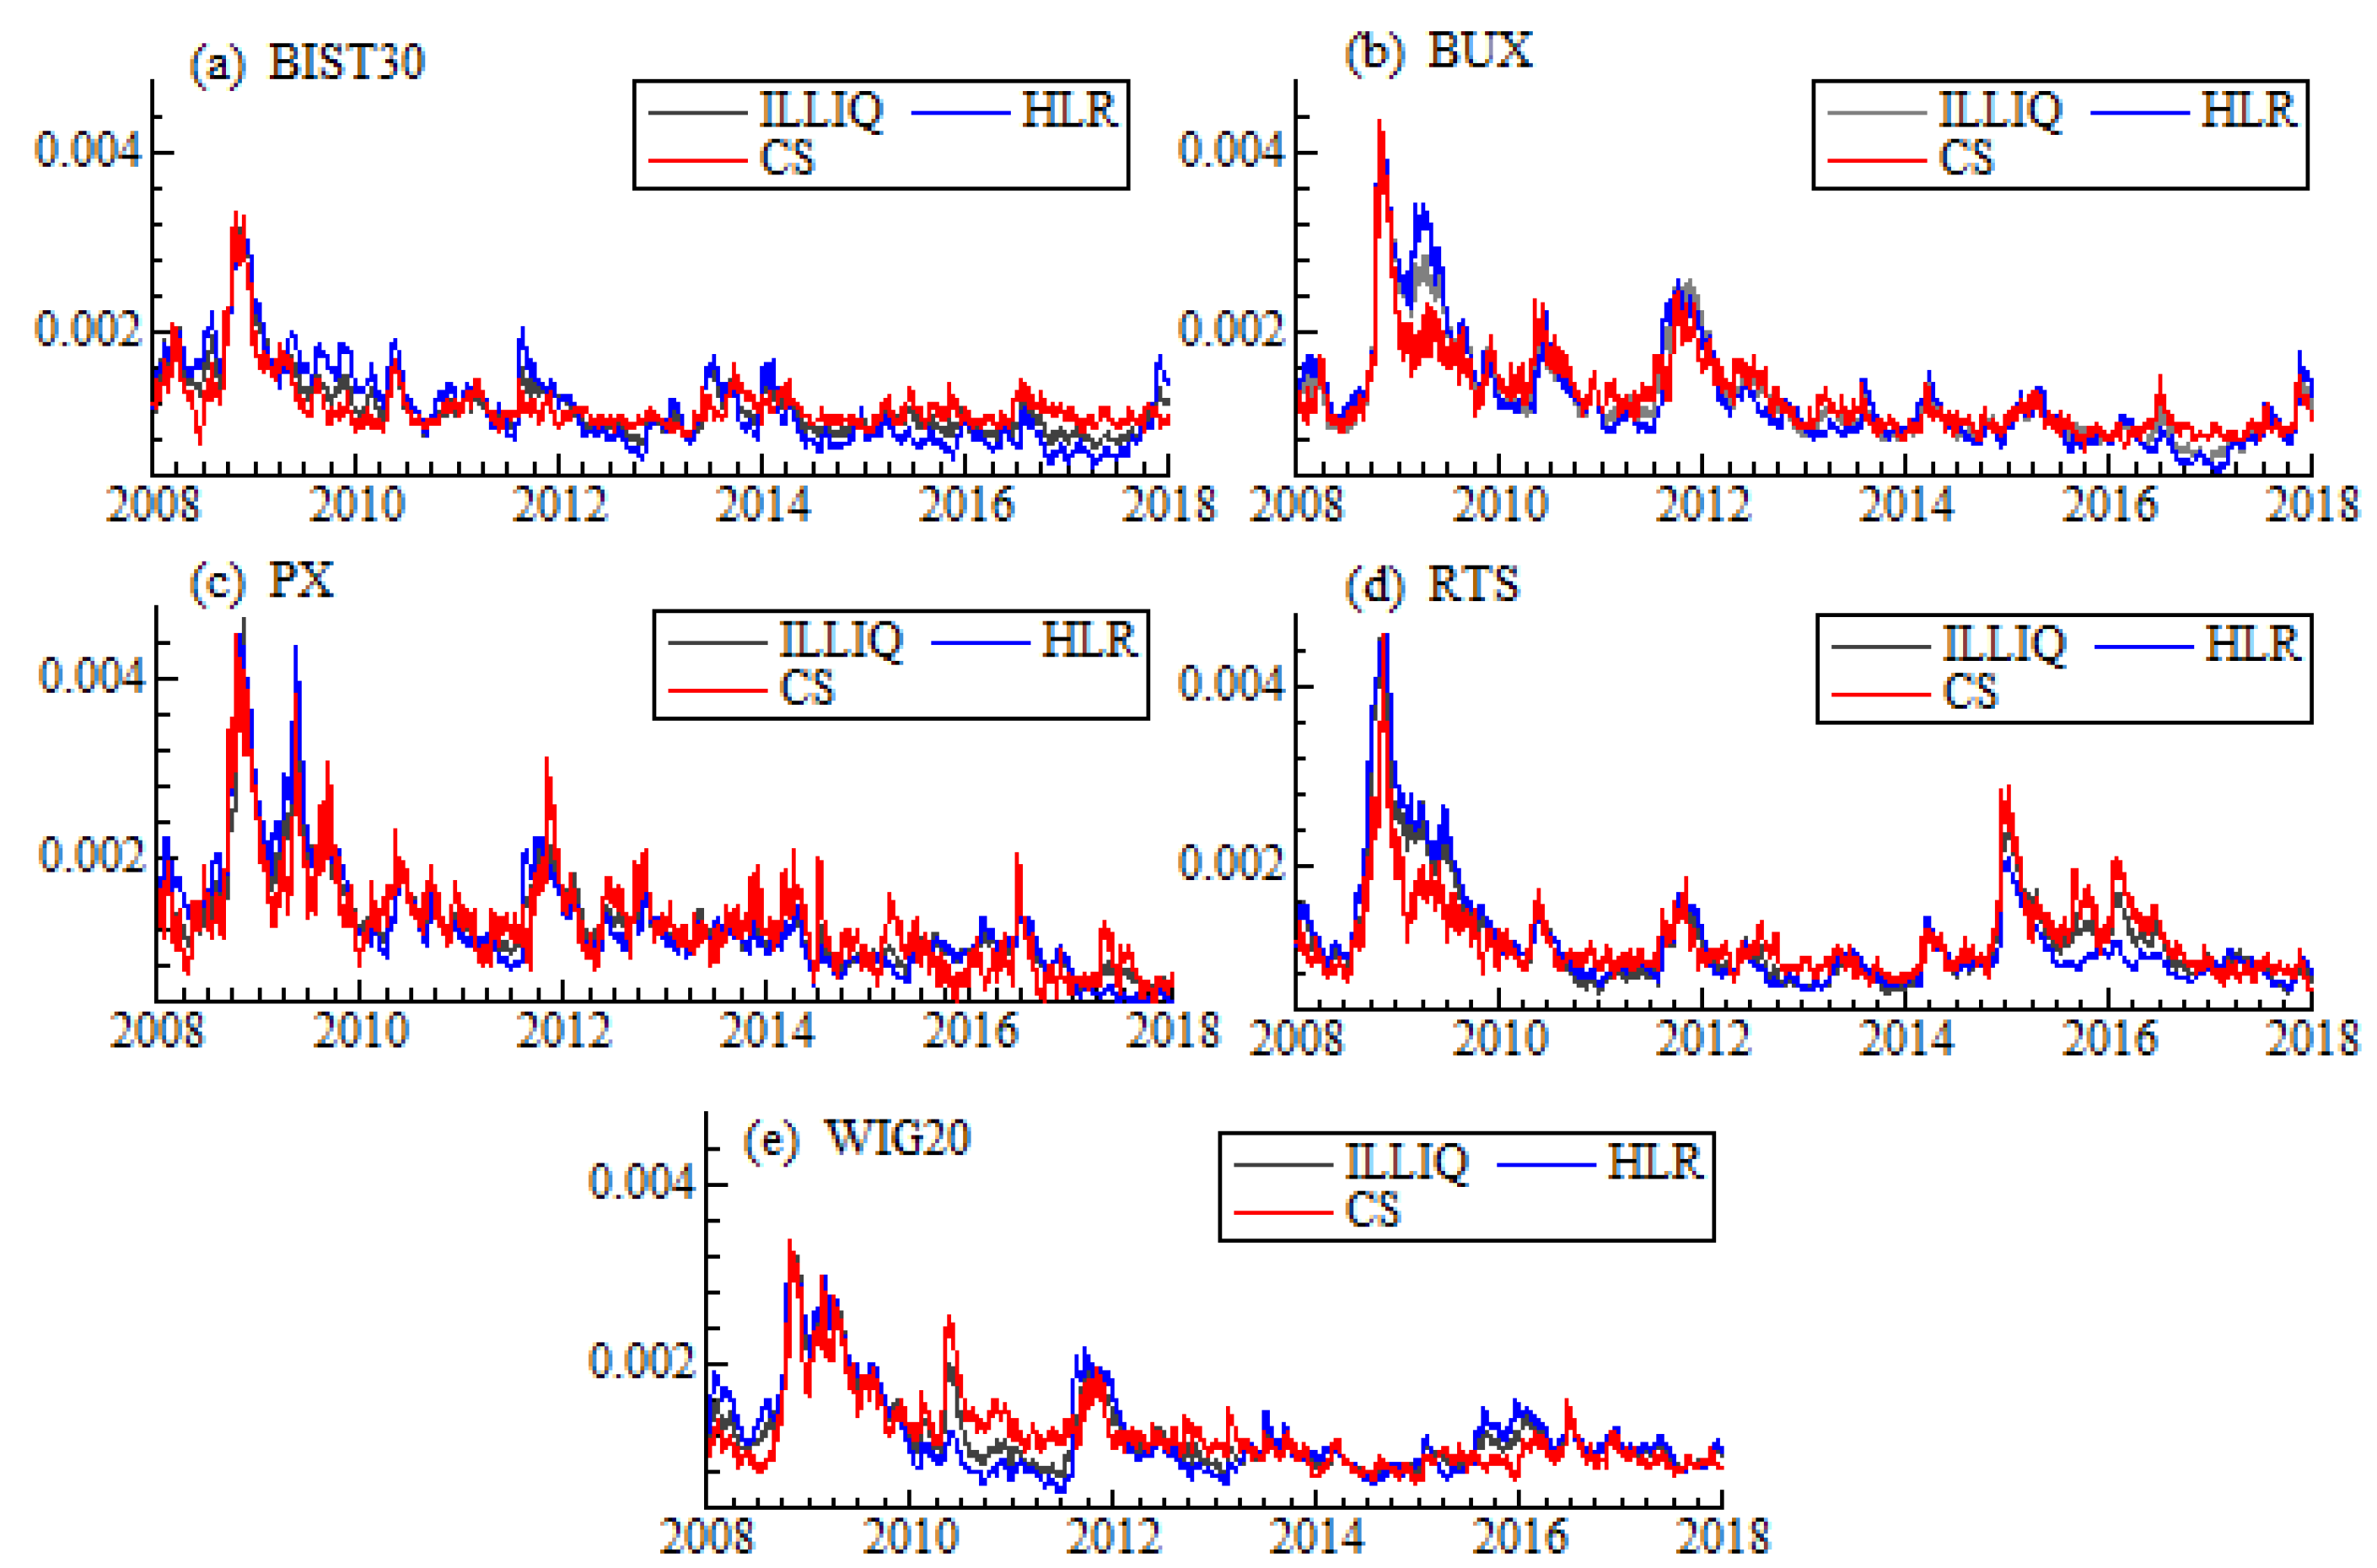
Figure 1 shows the dynamics of the indices based on three different liquidity proxies: taking into account each market these proxies behave quite similarly. The indices based on spread measures, HLR and CS, as well as on price impact measure, ILLIQ, increase in September 2008 due to the financial crisis and decrease within 2009. Further, liquidity in the markets improves as the values of all liquidity indices decline.
In order to examine, if there is the commonality in liquidity in each of the European emerging markets, we calculate the correlation coefficients for the liquidity indices. Additionally we extend this analysis by considering the relation of liquidity with volatility of these stock markets. Thus we obtain the estimates of the conditional variance from ARMA(0,0)-GARCH(1,1) models for the returns of the stock market indices (BIST30, BUX, PX, RTS and WIG20). As such the conditional variances might be perceived as markets’ volatility estimates. Then we calculated the correlations between liquidity indices and the estimates of volatility (VOLAT).
Table 3 includes the correlation coefficients for different liquidity proxies and volatility estimates. Both values of Kendall tau and Spearman rho confirm our initial conclusions based on the visual inspection: the correlation coefficients between liquidity indices are positive and in most cases relatively high. Surprisingly, due to the construction, HLR and CS are expected to behave similarly, but in our sample the correlations in pairs ILLIQ- HLR or ILLIQ-CS are higher than the correlations between HLR and CS themselves. All three indices in each market are also very strongly correlated with the conditional volatility, VOLAT, showing interdependency between liquidity and volatility known from the literature [45]. Summing up, we find the co-movement of the liquidity indices based on different measures in all five markets, as well as strong dependency between liquidity and volatility on these markets.
4.2. Commonality in Liquidity Indices Across the Markets
As a next step we focus on the commonality between liquidity indices from different markets in the emerging Europe region. According to the supply theory presented in the literature, the behavior of financial intermediaries is dictated by the situation on the markets: they withdraw the funds from the markets when prices go down suddenly. This rapid action causes the increase in spreads (and decrease in liquidity). In addition, as the financial intermediaries enter the market at some point in time, their presence causes the reduction of spreads and increase in liquidity. If these inflows and outflows are observed at the same time in a given region, then the spread measures (and indices) on different markets should be correlated. Thus we calculate the correlation coefficient (Kendall tau and Spearman rho) of aggregated liquidity indices and VIX index, that stands for the global volatility, and thus show the overall sentiment on the markets.
Table 4 presents the results: the correlations between liquidity indices constructed on the basis of constituents of BIST30, BUX, PX and WIG20 are positive and high. The decrease of the spreads on one of these markets is accompanied by the spread decrease on other markets. The relatively weakest dependencies are observed between RTS spread and BIST30 or PX (Spearman rho) as well as RTS spread and BIST30 or WIG20 (Kendall tau). These results are consistent for all liquidity indices based on different proxies.
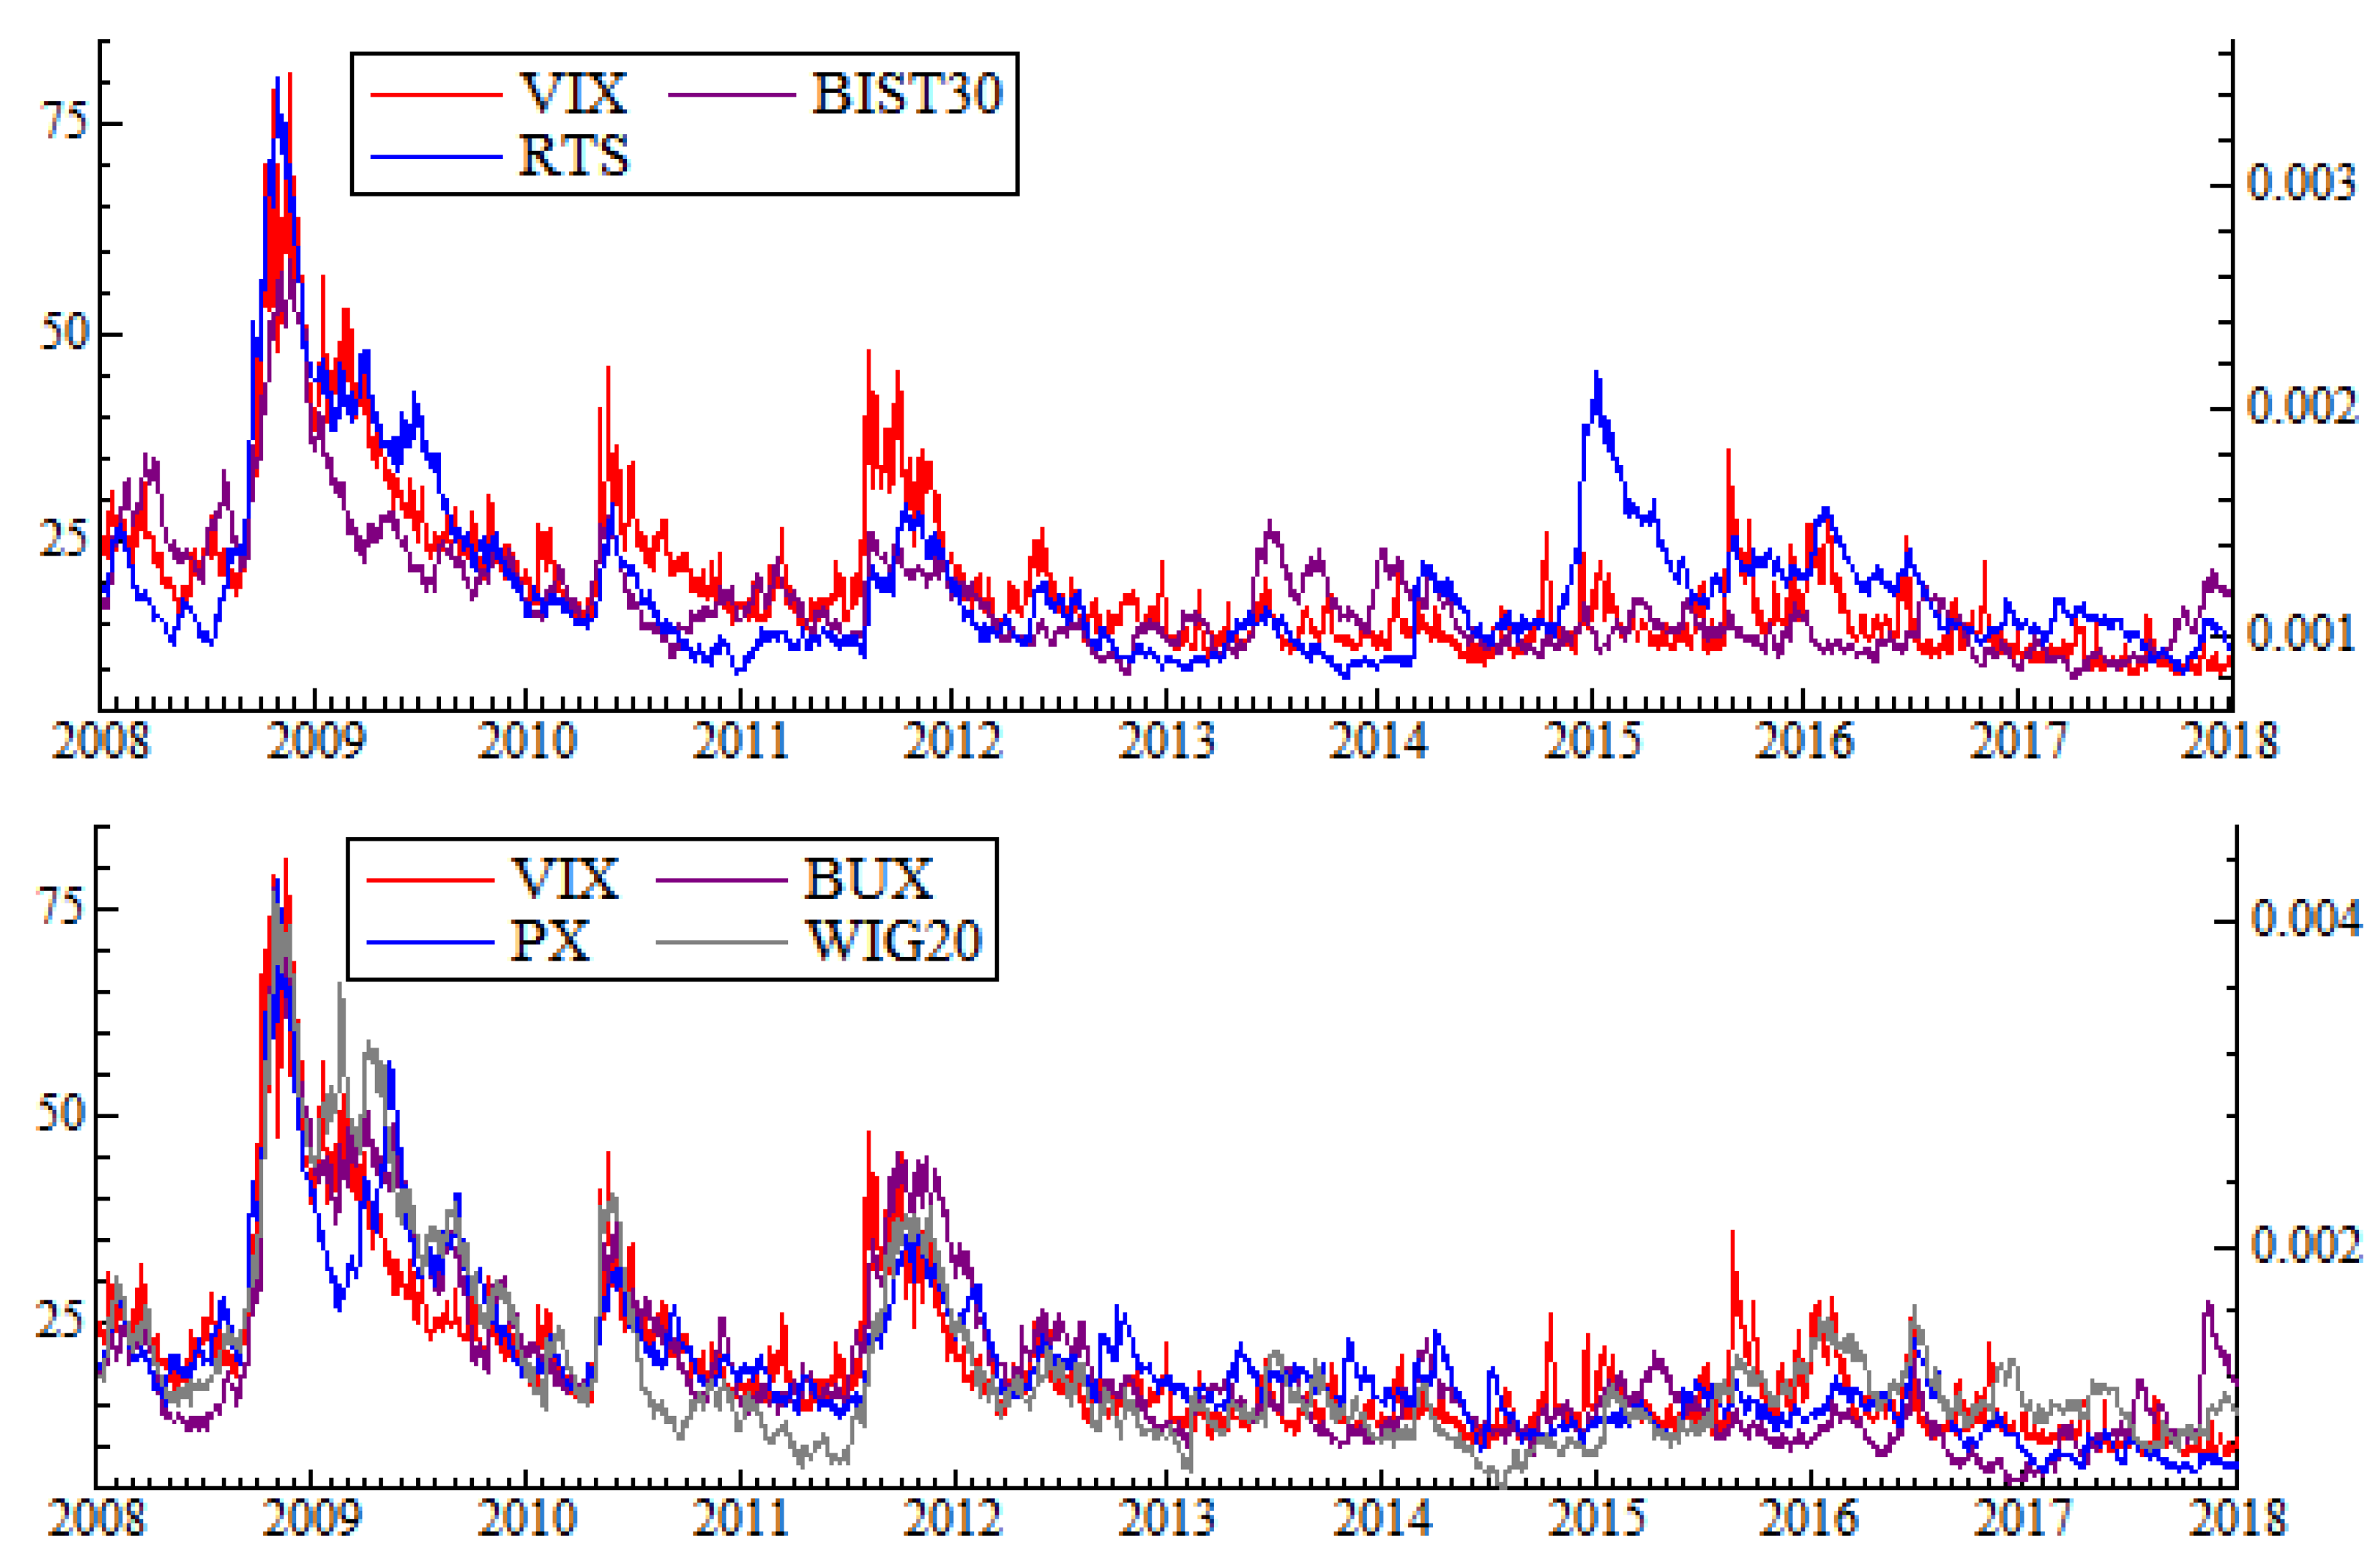
Figure 2 shows the dynamics of the liquidity indices based on ILLIQ and VIX index. In the upper panel LI_BIST30 and LI_RTS are presented, while in the bottom panel we show the remaining indices. The comparison of these two panels shows that the liquidity indices based on the constituents of BIST30 and RTS react much less to the sovereign debt crisis in EU in the second half of 2011 than the UE member countries, Hungary, Czech Republic and Poland, for which the decrease in liquidity is stronger and almost overlaps with the increase in VIX. For the Russian index there is an illiquidity peak in early 2015 which is exceptional in the whole region and might be connected with the political affairs as the third round of sanctions that resulted from Russian military intervention in Ukraine started in this period.
We find that on the European emerging markets, liquidity depends on the market situation: in a falling market when the fear index, VIX, gets the highest values, liquidity dries up, while in the growing market liquidity improves. It is in line with earlier findings from developed markets [7,26].
We also look for the evidence, if the co-movement in liquidity measures is different in declining market from that observed in the rising one. As our sample covers the financial crisis period as well as quite tranquil times, we divide the sample into five two-year long subsamples. It allows us to compare the interdependencies between liquidity indices in the changing market conditions. Each period belongs to one of three categories: very volatile, volatile and normal. The division is conditioned on the behavior of the VIX index and specifically its mean values and standard deviations. The first period (2008–2009) falls on the global financial crisis and thus is considered as very volatile. The second one (2010–2011) is considered as volatile, the remaining periods (2012–2013, 2014–2015 and 2016–2017), despite the turbulences in the end of 2015, are considered as normal (the mean values and standard deviations in the consecutive periods are the following: (32;13), (23;7), (16;3), (16;4), (13;4)).
Table 5 presents the Spearman rho and Kendall tau for VIX and liquidity indices based on ILLIQ. The results for the remaining indices are similar and thus not presented here. The correlations, which are the highest in the first most volatile period, decrease in the second, and are less volatile. Further, they are the lowest and often not significantly different from zero in the next three periods, that are considered as normal in our sample. The finding that the correlations are the highest at the time of the greatest volatility, can be interpreted as an evidence in favor of supply-side hypothesis: the commonality of liquidity depends on the market situation—it is stronger at the time the market crashes and weaker at the calm times.
4.3. Extreme Liquidity Index
When financial market becomes violent, its statistical and dynamic properties change dramatically. The bid-ask spreads tend to rise rapidly. Extreme dependence between returns and liquidity is evidenced by [46]. They analyze the Swiss stock market and use Lower Tail Dependence (LTD) concept to measure common exceedances of high level quantile. The investigation of extreme downside liquidity (EDL) risk is provided by [47]. The EDL risk is decomposed into three factors: (1) individual stock liquidity and market liquidity; (2) the individual stock return and market liquidity and (3) individual stock liquidity and market return. They capture these lower tail dependencies with copulas and find that cross-section of expected returns reflects a premium for EDL risk [47]. In particular, the main driver of premium for EDL risk is the stock return and market liquidity.
Following these results we propose another concept of liquidity index, which measures liquidity of the whole financial market, but only when the market is facing extreme situations. We construct two extreme liquidity indices, downside and upside, that are based on the negative and positive extreme returns. By decomposing returns into negative and positive ones, we are able to separate the effect of bad or good news on liquidity. The extreme liquidity indices are defined as follows:
where LID is a downside index, LIU is an upside index, I is an indicator function, is the 5th and is the 95th percentile of returns. As with the original liquidity index (Equation (4)) the exponentially weighted moving average was used in order to smooth the index series.
In case of extreme liquidity index, the above formulas take liquidity proxy into account only if the high level quantile of returns is exceeded. We interpret it in the following way: as long as the prices are stable, investors do not focus on liquidity risk. Of course, there is no unambiguous quantile from which returns are considered as extreme ones. Our choice coincides with [40,48], who use 5% threshold to separate the tail from the central part of the distribution.
Table 6 presents the correlations of indices based on ILLIQ for each market and period separately. More specifically, it reports the Spearman rho between absolute returns of market indices and liquidity indices (in rows). When compared between sub-periods, it turns out that the dependence is the strongest in the first sub-period (financial crisis in 2008–2009) and either in the second (BIST30, BUX and WIG20) or in the last period (PX and RTS). Such findings are similar to many empirical studies documenting the increasing dependency between financial returns, especially during crisis periods in the markets [3,49,50,51]. We conclude that the more extreme events appear, the more correlated are the absolute returns and liquidity.
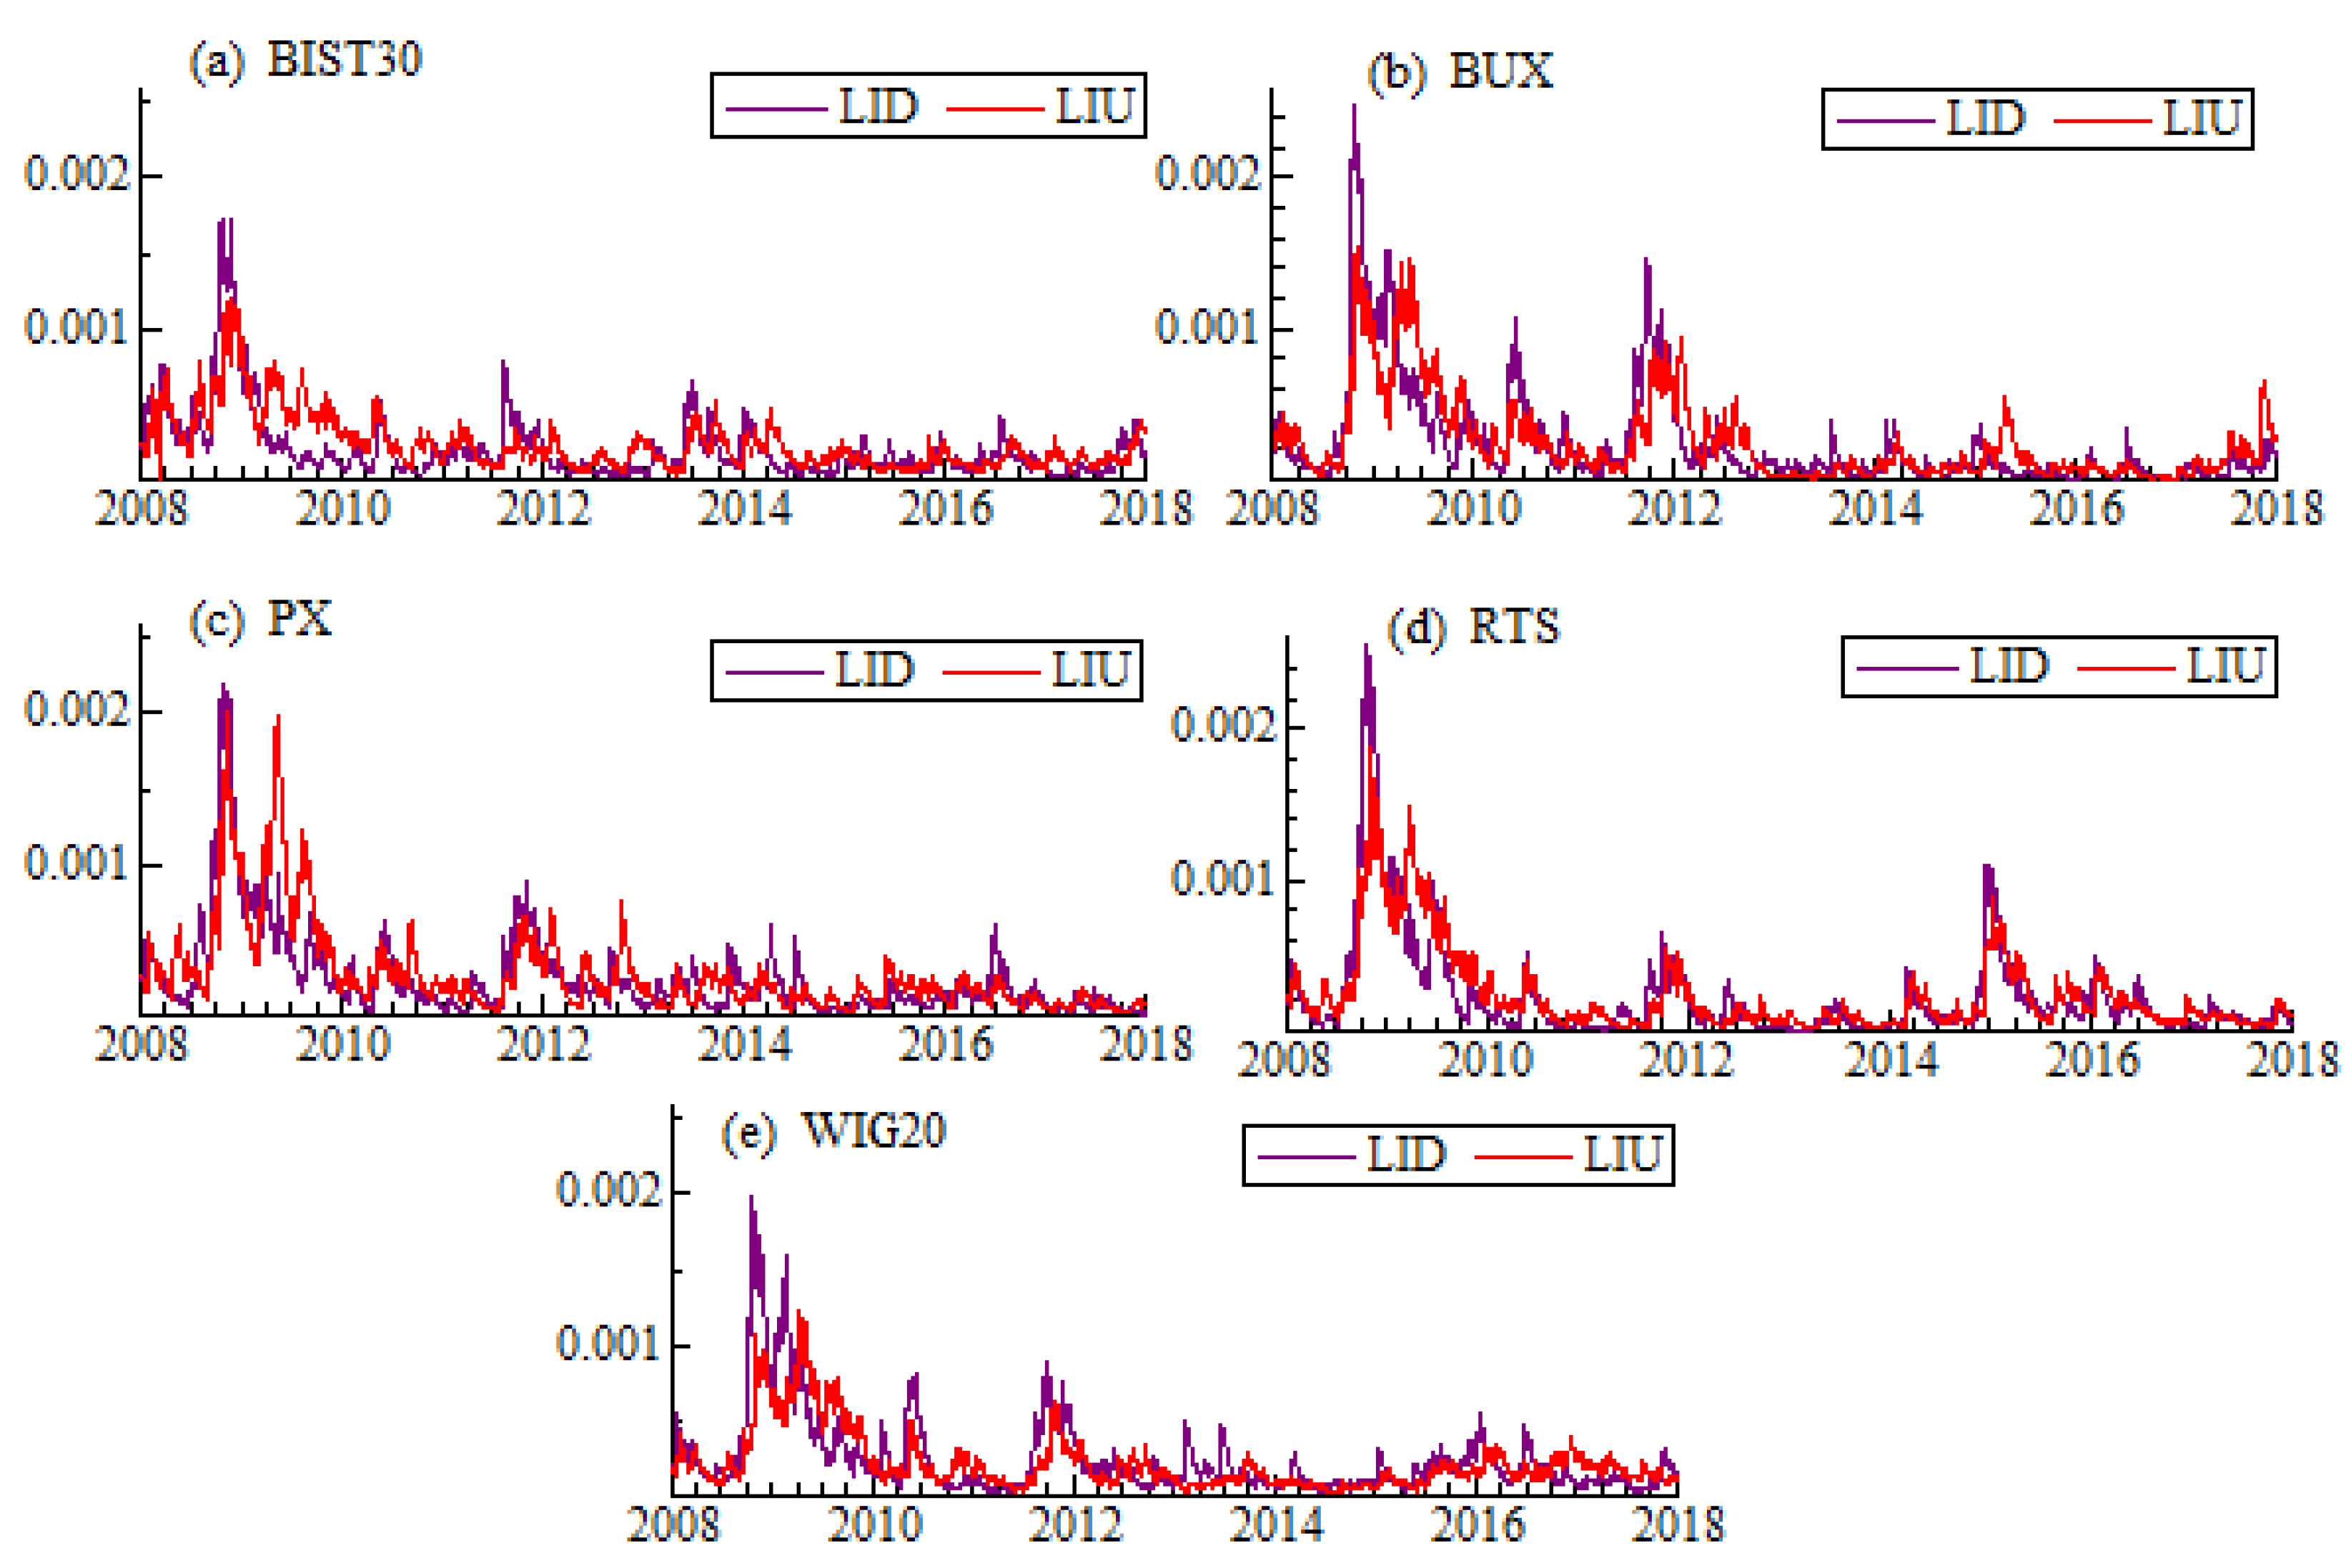
Figure 3 presents the evolution of indices over time. Tail behavior of liquidity indices is different for lower and upper tails. The variation of downside extreme liquidity indices is higher than that of upside ones. The only exception is PX, which has the same amplitude for both tails. Such a result suggests that illiquidity expands quicker and stronger for extreme negative returns. The result is closely related to the concept of tail behavior: left tails of the stock returns distribution are heavier than the right ones as a natural consequence of crashes perception [52,53]. There is the asymmetry in price declines and increases: the crashes develop in shorter time intervals than booms. In addition, the changes of prices are significantly bigger in case of a market decrease than during an increase.
We measure the co-movement for downside and upside indices across the markets with Kendal tau and Spearman rho correlations. The results are presented in the Table 7.
Our results show that the dependence between left-tail (downside) and between right-tail (upside) liquidity indices are similar across the markets. Only for liquidity index for WIG20 the correlations with other indices are higher for downside index comparing to upside one. To explore this problem deeper we conduct the calculations for five two-year sub-periods. Similarly to whole period analysis, it is not possible to recognize any co-movement pattern. For the sake of brevity, the results are not reported here.
4.4. Garch Models for Spreads and VIX
We examine whether commonality in liquidity is related to the changes in volatility index VIX. It is our robustness check to the results based on the correlations measures. In order to estimate the impact of global (systematic) volatility on the spreads observed on the emerging Europe countries, we estimate ARMA(1,0)-GARCH(1,1) models with additional variables. We model the relative changes in liquidity measures, , where is one of the liquidity indices based on the measures described in Section 3.2 on day t. We also include the relative change in VIX, , both in the conditional mean and the conditional variance equations. This allows us to check if the changes in VIX influence the changes in liquidity indices and the variability of them (e.g., the tendency for liquidity measures to move faster or slower). The AR(1) controls for the autocorrelation in the relative liquidity measures. We also introduce the indicator variable in order to control for the impact of Lehman Brothers collapse—this variable is equal to unity from 15 September 2008 to 22 September 2008 and zero otherwise. Our aim is to answer, if the crisis period influences the liquidity indices immediately following this event. The models are estimated separately for each country index, i, in two steps: in the first one the pure model is estimated, while in the second step the additional explanatory variables are added. The conditional mean equations are modeled with the ARMA(1,0) process. At the second step we add two explanatory variables: DVIX and dummy variable, DV standing for the Lehman Brothers collapse:
where is i.i.d. process with Student t distribution. The innovations are modeled with the plain vanilla GARCH (1,1) process:
where in the second step we add the additional explanatory variable, DVIX:
The estimates of pure ARMA-GARCH models are presented in the first two lines of each panel of Table 8 (M1). To capture the kurtosis in the indices, the innovation terms have Student t distributions with v degrees of freedom. The autoregressive coefficient is statistically significant for BIST and PX indices only. The parameters in the conditional variance equations are in most cases statistically significant with the values that satisfy the stationary conditions (Laurent, 2010).
Next we estimate the ARMA-GARCH models with additional explanatory variables measuring the impact of VIX changes and Lehman Brothers collapse (M2). The estimated parameters representing the effect of VIX changes in the mean equation for all indices have the same positive sign and are significant in all indices but WIG20. These results show that the changes in VIX and liquidity indices have the same direction and thus confirm our earlier findings. The Lehman Brothers collapse variable is statistically significant only for BUX index and shows that the liquidity declined in this period. In the conditional variance equation, the explanatory variable standing for the changes in VIX index, DVIX, is positive and statistically significant in all indices but PX. It shows that volatility of index changes increases together with variability of VIX index. Altogether the results from ARMA-GARCH models corroborate our previous findings: the liquidity indices are closely related to VIX changes, thus it may be considered as the significant determinant of the liquidity behaviour in the emerging European countries.
5. Conclusions and Discussion
The emerging markets, in comparison to the developed markets, are generally smaller and less liquid. They also provide the opportunity to achieve higher returns on their investments to investors. This study sheds light on the dynamics of liquidity in emerging markets in Europe. We focus on five of these: Turkish, Hungarian, Czech, Russian and Polish in the period of 2008–2017 and examine the commonality of liquidity over time.
We construct three various liquidity indices for each market—these indices employ three different proxies obtained from the widely available daily data. The liquidity indices are turnover-weighted and based only on the stocks that have been constituents of the blue chip stocks indices on a given market. Thus we treat our indices as a liquidity benchmarks for chosen market. Our first observation is that regardless of what kind of a proxy is used in the index calculation, based on volume or price range, the liquidity indices behave very similarly within each market. They capture the same type of information and show similar dynamics.
Second, we find that the liquidity indices behave similarly across the examined markets. The dependence between indices enhances in times of large market declines, and weakens when markets become stable. We support this phenomenon by evidencing a strong co-movement in liquidity indices and various volatility estimates. We also show that as the U.S. market becomes more volatile, and VIX index increases, liquidity in the emerging European markets declines. This is in line with supply-side hypothesis—as the situation on the markets is getting worse, the financial intermediaries withdraw the funds from the markets. This naturally causes serious liquidity problems in the European emerging markets.
Third, we propose the extreme liquidity index conditioned on the presence of the extreme returns. The rationale for this is that investors consider liquidity risk particularly when market becomes unstable. Again, we observe strong co-movement of extreme indices, especially during market crisis. However, in the cross-section we do not find evidence that there is a difference in commonality for extremely positive or extremely negative returns. These results are robust to our choice of liquidity proxy or choice of the market within the emerging European countries.
These findings have practical implications both for investors and for market regulators. We find strong regional (across-country) commonality in liquidity behavior in the emerging markets. We also find that there are some specific events that occasionally decrease liquidity in separate markets. The results show that there are some common determinants of liquidity, that are closely related to market volatility and institutional ownership. In our opinion the high degree of correlation is due to integration of the markets and the acting of financial intermediaries. The strong commonality in liquidity indices in the whole region suggests that liquidity is driven by shocks that affect all markets that belongs to MSCI Emerging Europe Index. We find that the worsening conditions of the U.S. market have strongly influenced liquidity in the region: the shocks in liquidity appear suddenly in all countries, which limits the ability to diversify portfolios. These results are important from the point of view of the regulators, because fast evaporation of liquidity is a threat to the stability of the financial system. Thus our findings should influence not only portfolio construction process, but also portfolio risk evaluation.
Author Contributions
Conceptualization, B.B.-S. and K.E.; methodology, B.B.-S. and K.E.; software, K.E.; formal analysis, K.E.; resources, B.B.-S. and K.E.; data curation, K.E.; supervision, B.B.-S., writing—original draft preparation, B.B.-S. and K.E.; writing—review and editing B.B.-S. and K.E.; funding acquisition, B.B.-S.
Funding
This research was funded by the Polish National Science Centre (NCN) under the grant UMO-2017/25/ B/HS4/01546.
Acknowledgments
The authors are very grateful for the insightful and beneficial comments received from two anonymous Reviewers.
Conflicts of Interest
The authors declare no conflict of interest.
References
- Wyart, M.; Bouchaud, J.P.; Kockelkoren, J.; Potters, M.; Vettorazzo, M. Relation between bid-ask spread, impact and volatility in double auction markets. Quant. Financ. 2006, 8, 41–57. [Google Scholar] [CrossRef]
- Mancini, L.; Ranaldo, A.; Wrampelmeyer, J. Liquidity in the foreign exchange market: Measurement, commonality, and risk premiums. J. Financ. 2013, 68. [Google Scholar] [CrossRef]
- Batten, J.A.; Vo, X.V. Liquidity and Return Relationships in an Emerging Market. Emerg. Mark. Financ. Trade 2014, 50, 5–21. [Google Scholar] [CrossRef]
- Chordia, T.; Roll, R.; Subrahmanyam, A. Market Liquidity and Trading Activity. J. Financ. 2001, 56, 501–530. [Google Scholar] [CrossRef]
- Kempf, A.; Mayston, D. Liquidity commonalilty beyond best prices. J. Financ. Res. 2008, 31, 25–40. [Google Scholar] [CrossRef]
- Brockman, P.; Chung, D.Y.; Prignon, C. Commonality in liquidity: A global perspective. J. Financ. Quant. Anal. 2009, 44, 851–882. [Google Scholar] [CrossRef]
- Karolyi, G.A.; Lee, K.H.; van Dijk, M.A. Understanding commonality in liquidity around the world. J. Financ. Econ. 2012, 105, 82–112. [Google Scholar] [CrossRef]
- Lee, H.C.; Tseng, Y.C.; Yang, C.J. Commonality in liquidity, liquidity distribution, and financial crisis: Evidence from country ETFs. Pac.-Basin Financ. J. 2014, 29, 35–58. [Google Scholar] [CrossRef]
- Bekaert, G.; Harvey, C.R. Emerging equity market volatility. J. Financ. Econ. 1997, 43, 29–77. [Google Scholar] [CrossRef]
- Kang, W.; Zhang, H. Measuring liquidity in emerging markets. Pac. Basin Financ. J. 2014, 27. [Google Scholar] [CrossRef]
- Kouwenberg, R.; Mentink, A. The Links between Central, East European and Western Security Markets. In Emerging European Financial Markets: Independence and Integration Post-Enlargement; Szilagyi, P., Batten, J., Eds.; JAI Press Inc.: Amsterdam, The Netherlands, 2006; Volume 6, pp. 353–381. [Google Scholar]
- Lesmond, D.A. Liquidity of emerging markets. J. Financ. Econ. 2005, 77, 411–452. [Google Scholar] [CrossRef]
- Olbryś, J. The Non-Trading Problem in Assessing Commonality in Liquidity on Emerging Stock Markets. Dyn. Econom. Model. 2018, 18, 67–79. [Google Scholar] [CrossRef]
- Goyenko, R.Y.; Holden, C.W.; Trzcinka, C.A. Do liquidity measures measure liquidity? J. Financ. Econ. 2009, 92, 153–181. [Google Scholar] [CrossRef]
- Fong, K.Y.L.; Holden, C.W.; Trzcinka, C.A. What are the best liquidity proxies for global research? Rev. Financ. 2017, 1–47. [Google Scholar] [CrossRef]
- Chen, R.R.; He, W.; Lin, W. A liquidity index. J. Fixed Income 2016, 25, 5–19. [Google Scholar] [CrossRef]
- Næs, R.; Skjeltorp, J.A.; Ødegaard, B.A. Stock Market Liquidity and the Business Cycle. J. Financ. 2011, 66, 139–176. [Google Scholar] [CrossRef]
- Korajczyk, R.A.; Sadka, R. Pricing the commonality across alternative measures of liquidity. J. Financ. Econ. 2008, 87, 45–72. [Google Scholar] [CrossRef]
- Hameed, A.; Kang, W.; Viswanathan, S. Stock market declines and liquidity. J. Financ. 2010, 65, 257–293. [Google Scholar] [CrossRef]
- Berndt, D.; Boogers, D.; Chakraborty, S.; McCart, J. Using Agent-Based Modeling to Assess Liquidity Mismatch in Open-End Bond Funds. Systems 2017, 5, 54. [Google Scholar] [CrossRef]
- Brunnermeier, M.K.; Pedersen, L.H. Market liquidity and funding liquidity. Rev. Financ. Stud. 2009. [Google Scholar] [CrossRef]
- Chordia, T.; Roll, R.; Subrahmanyam, A. Commonality in liquidity. J. Financ. Econ. 2000, 56, 3–28. [Google Scholar] [CrossRef]
- Olbryś, J. Testing Stability of Correlations between Liquidity Proxies Derived from Intraday Data on the Warsaw Stock Exchange. In Springer Proceedings in Business and Economics; Jajuga, K., Locarek-Junge, H., Orłowski, L., Eds.; Springer: Cham, Switzerland, 2018; pp. 67–79. [Google Scholar]
- Rösch, C.G.; Kaserer, C. Market liquidity in the financial crisis: The role of liquidity commonality and flight-to-quality. J. Bank. Financ. 2014. [Google Scholar] [CrossRef]
- Kamara, A.; Lou, X.; Sadka, R. The divergence of liquidity commonality in the cross-section of stocks. J. Financ. Econ. 2008, 89, 444–466. [Google Scholar] [CrossRef]
- Chordia, T.; Subrahmanyam, A.; Anshuman, V. Trading activity and expected stock returns. J. Financ. Econ. 2001, 59, 3–32. [Google Scholar] [CrossRef]
- Yeyati, E.L.; Telia, D.; Schmukler, S.L. Emfrging Market Liquidity and Crises. J. Eur. Econ. Assoc. 2008, 6, 668–682. [Google Scholar] [CrossRef]
- Beaupain, R.; Meng, L.; Marticou, M. Grass-Root Stock Market Investment and Long-Term Commonality in Liquidity: Evidence from The Shanghai Stock Exchange. In The Impact of the Global Financial Crisis on Emerging Financial Markets; Batten, J.A., Kearney, C., Eds.; Emerald Group Publishing Limited: Bingley, UK, 2011; pp. 625–643. [Google Scholar]
- Cakici, N.; Fabozzi, F.J.; Tan, S. Size, value, and momentum in emerging market stock returns. Emerg. Mark. Rev. 2013, 16, 46–65. [Google Scholar] [CrossRef]
- Zaremba, A.; Czapkiewicz, A. Digesting anomalies in emerging European markets: A comparison of factor pricing models. Emerg. Mark. Rev. 2017, 31, 1–15. [Google Scholar] [CrossRef]
- Rouwenhorst, K.G. Local Return Factors and Turnover in Emerging Stock Markets. J. Financ. 1999, 54, 1439–1464. [Google Scholar] [CrossRef]
- Sandoval, L.; Mullokandov, A.; Kenett, D.Y. Dependency Relations among International Stock Market Indices. J. Risk Financ. Manag. 2015, 8, 227–265. [Google Scholar] [CrossRef]
- Szűcs, B.Á.; Váradi, K. Measuring and managing liquidity risk in the Hungarian practice. Soc. Econ. 2014, 36, 543–563. [Google Scholar] [CrossRef]
- Corwin, S.A.; Schultz, P. A simple way to estimate bid-ask spreads from daily high and low prices. J. Financ. 2012, 67, 719–759. [Google Scholar] [CrossRef]
- Chung, K.H.; Zhang, H. A simple approximation of intraday spreads using daily data. J. Financ. Mark. 2014, 17, 94–120. [Google Scholar] [CrossRef]
- Amihud, Y. Illiquidity and stock returns: Cross-section and time-series effects. J. Financ. Mark. 2002, 5, 31–56. [Google Scholar] [CrossRef]
- Cohen, K.J.; Ness, W.L.; Okuda, H.; Schwartz, R.A.; Whitcomb, D.K. The determinants of common stock returns volatility: An international comparison. J. Financ. 1976, 31, 733–741. [Google Scholar] [CrossRef]
- Bȩdowska-Sójka, B. The coherence of liquidity measures. The evidence from the emerging market. Financ. Res. Lett. 2018, 27, 118–123. [Google Scholar] [CrossRef]
- Kyle, A.S. Continuous auctions and insider trading. Econometrica 1985, 53, 1315–1335. [Google Scholar] [CrossRef]
- Hull, J. Risk Management and Financial Institutions, 4th ed.; John Wiley & Sons: Hoboken, NJ, USA, 2010; p. 714. [Google Scholar]
- Bȩdowska-Sójka, B. Commonality in liquidity measures. The evidence from the Polish stock market. In Proceedings of the International Scientific Conference Hradec Economic Days, Hradec Králové, Czech Republic, 5–6 February 2019; University of Hradec Kralove: Hradec Kralove, Czech Republic, 2019; pp. 29–40. [Google Scholar]
- Kenett, D.Y.; Huang, X.; Vodenska, I.; Havlin, S.; Stanley, H.E. Partial correlation analysis: Applications for financial markets. Quant. Financ. 2015, 15, 569–578. [Google Scholar] [CrossRef]
- Kenett, D.Y.; Tumminello, M.; Madi, A.; Gur-Gershgoren, G.; Mantegna, R.N.; Ben-Jacob, E. Dominating clasp of the financial sector revealed by partial correlation analysis of the stock market. PLoS ONE 2010, 5, 15032. [Google Scholar] [CrossRef]
- Doornik, J.; Hendry, D. Empirical Econometric Modelling. PcGiveTM11; Timberlake Consultants: London, UK, 2005. [Google Scholar]
- Chordia, T.; Sarkar, A.; Subrahmanyam, A. Joint Dynamics of Liquidity, Returns and Volatility across Small and Large Firms; Federal Reserve Bank of New York: New York, NY, USA, 2005. [Google Scholar]
- Buhl, C.; Reich, C.; Wegmann, P. Extremal Dependence between Market and Liquidity Risk: An Analysis for the Swiss Market. SSRN Electron. J. 2002. [Google Scholar] [CrossRef]
- Ruenzi, S.; Ungeheuer, M.; Weigert, F. Extreme Downside Liquidity Risk. In Proceedings of the 26th Australasian Finance and Banking Conference 2013, Sydney, Australia, 17–19 December 2013. [Google Scholar]
- Neftci, S.N. Value at Risk Calculations, Extreme Events, and Tail Estimation. J. Deriv. 2000, 7, 23–37. [Google Scholar] [CrossRef]
- Campbell, R.; Koedijk, K.; Kofman, P. Increased Correlation in Bear Markets. Financ. Anal. J. 2002, 58, 87–94. [Google Scholar] [CrossRef]
- Karolyi, G.A.; Stulz, R.M. Why Do Markets Move Together? An Investigation of U.S.-Japan Stock Return Comovements. J. Financ. 1996, 51, 951–986. [Google Scholar] [CrossRef]
- Longin, F.; Solnik, B. Extreme Correlation of International Equity Markets. J. Financ. 2001, 56, 649–676. [Google Scholar] [CrossRef]
- Cotter, J. Extreme value estimation of boom and crash statistics. Eur. J. Financ. 2006, 12, 553–566. [Google Scholar] [CrossRef]
- LeBaron, B.; Samanta, R. Extreme Value Theory and Fat Tails in Equity Markets. Available online: https://ssrn.com/abstract=873656 (accessed on 30 October 2018).
Figure 1.
Liquidity indices based on three different liquidity proxies calculated for the stocks listed on five European emerging markets. Each graph represents the liquidity indices obtained for a given market: (a) BIST30 (Borsa Istanbul, Turkey), (b) BUX (Budapest SE, Hungary), (c) PX (Prague SE, Czech Republic), (d) RTS (Moscow Exchange, Russia), and (e) WIG20 (Warsaw SE, Poland). ILLIQ, HLR and CS are the indices calculated as the aggregate volume-weighted average liquidity measures within a given market; ILLIQ is based on [36], HLR is high-low range (adjusted quoted close spread of [35]) and CS is based on high-low spread estimator of [34]. The left-side Y axis scale is for ILLIQ, while the right-side of Y axis is for HLR and CS (and hidden here).

Figure 2.
Volatility index VIX and liquidity indices calculated for the stocks listed on European emerging markets. The upper panel shows the liquidity indices based on ILLIQ [36] obtained for two markets: BIST30 (Turkey) and RTS (Russia), and the Chicago Board Options Exchange Volatility Index, VIX. The bottom panel presents liquidity indices for BUX (Hungary), PX (Czech Republic), WIG20 (Poland) and index VIX.

Figure 3.
Extreme liquidity indices. Each graph represents two extreme liquidity indices, downside (LID) and upside (LIU) obtained for the given stock markets: (a) BIST30 (Turkey), (b) BUX (Hungary), (c) PX (Czech Republic), (d) RTS (Russia), and (e) WIG20 (Poland). The extreme indices are based on the ILLIQ proxy [36]. The extreme liquidity index is calculated as a volume-weighted average liquidity measures conditioned on the exceedance of the quantile of returns.


Table 1.
The description of the sample: numbers of stocks and number of quotations included in the empirical study with indices’ tickers.
Table 1.
The description of the sample: numbers of stocks and number of quotations included in the empirical study with indices’ tickers.
| Index and Exchange | Number of Stocks in the Sample | Number of Quotations in the Sample | Thomson Reuters Ticker |
|---|---|---|---|
| BIST30, Borsa Istanbul Index | 53 | 2514 | XUO30 |
| BUX, Budapest SE Index | 24 | 2498 | BUX |
| PX, Prague SE Index | 18 | 2507 | PX |
| RTS, Moscow Exchange Index | 64 | 2500 | IRTS |
| WIG20, Warsaw SE Index | 37 | 2504 | WIG20 |
Table 2.
Descriptive statistics of liquidity indices in different markets.
| LI_BIST30 | LI_BUX | LI_PX | LI_RTS | LI_WIG20 | |
|---|---|---|---|---|---|
| ILLIQ | |||||
| Mean | 1.17 | 1.27 | 1.28 | 1.18 | 1.23 |
| Median | 1.07 | 1.09 | 1.16 | 0.99 | 1.09 |
| St. dev. | 0.38 | 0.57 | 0.56 | 0.58 | 0.43 |
| 1st Quantile | 0.92 | 0.89 | 0.95 | 0.83 | 0.97 |
| 3rd Quantile | 1.33 | 1.42 | 1.44 | 1.31 | 1.32 |
| HLR | |||||
| Mean | 33.74 | 29.39 | 29.62 | 33.56 | 30.61 |
| Median | 31.12 | 25.68 | 26.39 | 27.74 | 27.94 |
| St. dev. | 8.75 | 12.22 | 12.36 | 17.18 | 8.97 |
| 1st Quantile | 26.91 | 21.82 | 22.60 | 24.22 | 24.40 |
| 3rd Quantile | 39.70 | 32.58 | 33.46 | 35.49 | 33.56 |
| CS | |||||
| Mean | 8.70 | 14.20 | 10.60 | 12.44 | 12.49 |
| Median | 6.61 | 11.27 | 9.84 | 9.31 | 9.91 |
| St. dev. | 7.52 | 10.17 | 5.72 | 9.45 | 9.60 |
| 1st Quantile | 4.59 | 7.21 | 6.91 | 6.47 | 6.25 |
| 3rd Quantile | 10.15 | 18.60 | 12.80 | 15.81 | 14.98 |
| Number of obs. | 2513 | 2497 | 2506 | 2499 | 2503 |
Note: The descriptive statistics are presented for the liquidity indices calculated as aggregate volume-weighted average liquidity measures within a given market. The names for indices are after liquidity proxies: ILLIQ is based on [36], HLR is high-low range (adjusted quoted close spread of [35]) and CS is based on high-low spread estimator [34]. The values of liquidity proxies are multiplied by .
Table 3.
The Kendall tau and Spearman rho of liquidity indices and volatility estimates across the sample.
Table 3.
The Kendall tau and Spearman rho of liquidity indices and volatility estimates across the sample.
| LI_BIST30 | VOLAT | ILLIQ | HLR | CS | LI_BUX | VOLAT | ILLIQ | HLR | CS | |
|---|---|---|---|---|---|---|---|---|---|---|
| VOLAT | 1 | 0.69 | 0.58 | 0.48 | VOLAT | 1 | 0.62 | 0.60 | 0.53 | |
| ILLIQ | 0.87 | 1 | 0.80 | 0.50 | ILLIQ | 0.80 | 1 | 0.79 | 0.76 | |
| HLR | 0.78 | 0.95 | 1 | 0.37 | HLR | 0.77 | 0.94 | 1 | 0.63 | |
| CS | 0.67 | 0.68 | 0.52 | 1 | CS | 0.72 | 0.93 | 0.82 | 1 | |
| LI_PX | VOLAT | ILLIQ | HLR | CS | LI_RTS | VOLAT | ILLIQ | HLR | CS | |
| VOLAT | 1 | 0.62 | 0.62 | 0.47 | VOLAT | 1 | 0.74 | 0.65 | 0.63 | |
| ILLIQ | 0.80 | 1 | 0.83 | 0.67 | ILLIQ | 0.91 | 1 | 0.75 | 0.66 | |
| HLR | 0.80 | 0.96 | 1 | 0.57 | HLR | 0.84 | 0.91 | 1 | 0.48 | |
| CS | 0.64 | 0.86 | 0.76 | 1 | CS | 0.83 | 0.84 | 0.66 | 1 | |
| LI_WIG20 | VOLAT | ILLIQ | HLR | CS | ||||||
| VOLAT | 1 | 0.71 | 0.68 | 0.39 | ||||||
| ILLIQ | 0.89 | 1 | 0.72 | 0.50 | ||||||
| HLR | 0.86 | 0.89 | 1 | 0.26 | ||||||
| CS CS | 0.55 | 0.67 | 0.37 | 1 |
Note: ILLIQ, HLR and CS are the aggregate volume-weighted average liquidity measures (indices). ILLIQ is based on [36], HLR is high-low range (adjusted quoted close spread of [35]) and CS is based on high-low spread estimator of [34]. The values of liquidity proxies are multiplied by . VOLAT stands for the conditional volatility from the ARMA(0,0)-GARCH(1,1) models for the returns of the respective market index. The Kendall tau for a pair of these variables are above the diagonal, while Spearman rho are below the diagonal. The correlations are calculated for each market separately: Turkey (LI_BIST30), Hungary (LI_BUX), Czech Republic (LI_PX), Russia (LI_RTS), and Poland (LI_WIG20).
Table 4.
The Kendall tau and Spearman rho of liquidity indices and volatility index (VIX) across the markets.
Table 4.
The Kendall tau and Spearman rho of liquidity indices and volatility index (VIX) across the markets.
| ILLIQ | VIX | LI_BIST30 | LI_BUX | LI_PX | LI_RTS | LI_WIG20 |
|---|---|---|---|---|---|---|
| VIX | 1 | 0.44 | 0.51 | 0.58 | 0.38 | 0.51 |
| LI_BIST30 | 0.61 | 1 | 0.44 | 0.49 | 0.25 | 0.38 |
| LI_BUX | 0.69 | 0.61 | 1 | 0.59 | 0.33 | 0.41 |
| LI_PX | 0.77 | 0.67 | 0.77 | 1 | 0.30 | 0.50 |
| LI_RTS | 0.54 | 0.36 | 0.46 | 0.41 | 1 | 0.50 |
| LI_WIG20 | 0.69 | 0.55 | 0.57 | 0.68 | 0.66 | 1 |
| HLR | VIX | LI_BIST30 | LI_BUX | LI_PX | LI_RTS | LI_WIG20 |
| VIX | 1 | 0.47 | 0.52 | 0.59 | 0.44 | 0.39 |
| LI_BIST30 | 0.07 | 1 | 0.53 | 0.55 | 0.35 | 0.32 |
| LI_BUX | 0.69 | 0.73 | 1 | 0.54 | 0.44 | 0.30 |
| LI_PX | 0.78 | 0.73 | 0.72 | 1 | 0.39 | 0.44 |
| LI_RTS | 0.62 | 0.52 | 0.61 | 0.53 | 1 | 0.47 |
| LI_WIG20 | 0.55 | 0.48 | 0.42 | 0.61 | 0.63 | 1 |
| CS | VIX | LI_BIST30 | LI_BUX | LI_PX | LI_RTS | LI_WIG20 |
| VIX | 1 | 0.26 | 0.48 | 0.42 | 0.35 | 0.49 |
| LI_BIST30 | 0.38 | 1 | 0.19 | 0.23 | 0.16 | 0.21 |
| LI_BUX | 0.65 | 0.28 | 1 | 0.52 | 0.25 | 0.59 |
| LI_PX | 0.59 | 0.33 | 0.70 | 1 | 0.21 | 0.46 |
| LI_RTS | 0.50 | 0.23 | 0.35 | 0.29 | 1 | 0.26 |
| LI_WIG20 | 0.66 | 0.30 | 0.78 | 0.64 | 0.36 | 1 |
Note: The table presents Kendall tau (above the diagonal) and Spearman rho (under the diagonal) correlation coefficients of three liquidity indices from emerging European countries and the Chicago Board Options Exchange Volatility Index, VIX. Five liquidity indices are taken into consideration: LI_BIST30 (Turkey), LI_BUX (Hungary), LI_PX (Czech Republic), LI_RTS (Russia), and LI_WIG20 (Poland). The correlations are calculated for each liquidity index separately. ILLIQ, HLR and CS are the aggregate volume-weighted average liquidity measures within a given market. ILLIQ is based on [36], HLR is adjusted quoted close spread of [35] and CS is based on high-low spread estimator of [34]. The values of liquidity proxies are multiplied by . All correlations are statistically significantly different from zero at significance level .
Table 5.
The Kendall tau and the Spearman rank correlations between the liquidity indices and VIX in sub-periods.
Table 5.
The Kendall tau and the Spearman rank correlations between the liquidity indices and VIX in sub-periods.
| ILLIQ | VIX | LI_BIST30 | LI_BUX | LI_PX | LI_RTS | LI_WIG20 | |
|---|---|---|---|---|---|---|---|
| Period 1 | VIX | 1 | 0.418 | 0.648 | 0.57 | 0.66 | 0.67 |
| 2008–2009 | LI_BIST30 | 0.59 | 1 | 0.31 | 0.29 | 0.34 | 0.32 |
| LI_BUX | 0.84 | 0.43 | 1 | 0.67 | 0.73 | 0.83 | |
| LI_PX | 0.78 | 0.40 | 0.86 | 1 | 0.70 | 0.70 | |
| LI_RTS | 0.85 | 0.47 | 0.90 | 0.89 | 1 | 0.76 | |
| LI_WIG20 | 0.86 | 0.44 | 0.96 | 0.88 | 0.92 | 1 | |
| Period 2 | VIX | 1 | 0.31 | 0.58 | 0.52 | 0.49 | 0.48 |
| 2010–2011 | LI_BIST30 | 0.47 | 1 | 0.27 | 0.36 | 0.40 | 0.51 |
| LI_BUX | 0.80 | 0.45 | 1 | 0.64 | 0.61 | 0.57 | |
| LI_PX | 0.74 | 0.53 | 0.82 | 1 | 0.57 | 0.61 | |
| LI_RTS | 0.70 | 0.60 | 0.80 | 0.74 | 1 | 0.60 | |
| LI_WIG20 | 0.69 | 0.70 | 0.77 | 0.79 | 0.78 | 1 | |
| Period 3 | VIX | 1 | 0.02 | 0.40 | 0.27 | 0.39 | 0.33 |
| 2012–2013 | LI_BIST30 | 0.03 | 1 | −0.07 | −0.04 | 0.06 | 0.23 |
| LI_BUX | 0.57 | −0.13 | 1 | 0.37 | 0.57 | 0.51 | |
| LI_PX | 0.40 | −0.06 | 0.52 | 1 | 0.33 | 0.32 | |
| LI_RTS | 0.55 | 0.07 | 0.76 | 0.47 | 1 | 0.53 | |
| LI_WIG20 | 0.48 | 0.38 | 0.67 | 0.47 | 0.72 | 1 | |
| Period 4 | VIX | 1 | 0.04 | −0.01 | 0.08 | 0.29 | 0.43 |
| 2014–2015 | LI_BIST30 | 0.04 | 1 | 0.30 | 0.35 | 0.05 | 0.14 |
| LI_BUX | −0.02 | 0.45 | 1 | 0.17 | 0.17 | 0.07 | |
| LI_PX | 0.11 | 0.50 | 0.25 | 1 | −0.06 | 0.22 | |
| LI_RTS | 0.42 | 0.04 | 0.27 | −0.09 | 1 | 0.34 | |
| LI_WIG20 | 0.58 | 0.22 | 0.02 | 0.35 | 0.52 | 1 | |
| Period 5 | VIX | 1 | 0.00 | −0.10 | 0.49 | 0.46 | 0.42 |
| 2016–2017 | LI_BIST30 | 0 | 1 | 0.21 | 0.11 | 0.00 | 0.08 |
| LI_BUX | −0.15 | 0.30 | 1 | 0.07 | 0.11 | 0.03 | |
| LI_PX | 0.70 | 0.12 | 0.07 | 1 | 0.53 | 0.54 | |
| LI_RTS | 0.62 | −0.00 | 0.11 | 0.73 | 1 | 0.60 | |
| LI_WIG20 | 0.58 | 0.10 | 0.02 | 0.75 | 0.80 | 1 |
Note: The table presents Kendall tau (above the diagonal) and Spearman rho (below the diagonal) correlation coefficients for liquidity indices from five emerging European countries and the Chicago Board Options Exchange Volatility Index, VIX, in five two-year-long subperiods. Five liquidity indices are taken into consideration: LI_BIST30 (Turkey), LI_BUX (Hungary), LI_PX (Czech Republic), LI_RTS (Russia), and LI_WIG20 (Poland). The correlation coefficients are calculated for liquidity index based on ILLIQ [36] for each market separately. The values of liquidity proxies are multiplied by . The correlation coefficients higher than 0.1 are statistically significant at .
Table 6.
Spearman rho between absolute returns and liquidity index based on iiliquidity (ILLIQ) proxy in sub-periods.
Table 6.
Spearman rho between absolute returns and liquidity index based on iiliquidity (ILLIQ) proxy in sub-periods.
| LI_BIST30 | LI_BUX | LI_PX | LI_RTS | LI_WIG20 | |
|---|---|---|---|---|---|
| Period 1 (2008–2009) | 0.30 | 0.34 | 0.33 | 0.48 | 0.31 |
| Period 2 (2010–2011) | 0.30 | 0.29 | 0.34 | 0.30 | 0.31 |
| Period 3 (2012–2013) | 0.29 | 0.25 | 0.14 | 0.32 | 0.16 |
| Period 4 (2014–2015) | 0.27 | 0.18 | 0.10 | 0.31 | 0.12 |
| Period 5 (2016–2017) | 0.22 | 0.16 | 0.37 | 0.39 | 0.20 |
Note: The table presents Spearman rho correlation coefficients for liquidity indices based on ILLIQ [36] and the absolute returns of stock indices from the European emerging markets in five two-year-long subperiods. Five stock indices are taken into consideration: BIST30 (Turkey), BUX (Hungary), PX (Czech Republic), RTS (Russia), and WIG20 (Poland). The correlations are calculated for liquidity index LI based on ILLIQ for each market separately.
Table 7.
The Kendall tau and Spearman rho of extreme liquidity indices across the markets.
| Downside | LID_BIST30 | LID_BUX | LID_PX | LID_RTS | LID_WIG20 |
|---|---|---|---|---|---|
| LID_BIST30 | 1 | 0.30 | 0.31 | 0.28 | 0.38 |
| LID_BUX | 0.43 | 1 | 0.41 | 0.34 | 0.41 |
| LID_PX | 0.44 | 0.57 | 1 | 0.36 | 0.47 |
| LID_RTS | 0.40 | 0.49 | 0.49 | 1 | 0.47 |
| LID_WIG20 | 0.54 | 0.56 | 0.63 | 0.64 | 1 |
| Upside | LIU_BIST30 | LIU_BUX | LIU_PX | LIU_RTS | LIU_WIG20 |
| LIU_BIST30 | 1 | 0.30 | 0.34 | 0.31 | 0.31 |
| LIU_BUX | 0.44 | 1 | 0.41 | 0.36 | 0.37 |
| LIU_PX | 0.49 | 0.57 | 1 | 0.41 | 0.41 |
| LIU_RTS | 0.44 | 0.51 | 0.56 | 1 | 0.39 |
| LIU_WIG20 | 0.45 | 0.51 | 0.57 | 0.53 | 1 |
Note: The table presents Kendall tau (above the diagonal) and Spearman rho (below the diagonal) correlations for the extreme liquidity indices from emerging European countries in the whole period. Five downside and five upside liquidity indices are taken into consideration: LI_BIST30 (Turkey), LI_BUX (Hungary), LI_PX (Czech Republic), LI_RTS (Russia), and LI_WIG20 (Poland). The indices are based on ILLIQ proxy [36].
Table 8.
Estimates from ARMA(1.0)-GARCH(1.1) models for liquidity indices.
| MM | LL | ||||||||
|---|---|---|---|---|---|---|---|---|---|
| LI_BIST30 | |||||||||
| 1 | 0.05 * | 1.78 | 0.04 | 0.70 * | 4.63 ** | −5810.88 | |||
| (0.02) | (2.11) | (0.03) | (0.33) | (0.41) | |||||
| 2 | 0.05 * | 0.02 * | 0.62 | 1.26 | 0.09 ** | 0.03 | 0.79 ** | 4.87 ** | −5801.59 |
| (0.02) | (0.01) | (0.76) | (0.92) | (0.03) | (0.02) | (0.15) | (0.45) | ||
| LI_BUX | |||||||||
| 1 | 0.03 | 1.11 | 0.04 * | 0.86 ** | 7.02 ** | −6389.46 | |||
| (0.02) | (0.81) | (0.02) | (0.09) | (0.81) | |||||
| 2 | 0.03 | 0.03 ** | 2.44 * | 0.63 | 0.11 ** | 0.02 | 0.92 ** | 7.84 ** | −6369.61 |
| (0.02) | (0.01) | (1.21) | (0.54) | (0.03) | (0.02) | (0.07) | (0.97) | ||
| LI_PX | |||||||||
| 1 | 0.10 ** | 3.43 | 0.02 | 0.61 * | 3.96 ** | −6115.42 | |||
| (0.02) | (2.38) | (0.02) | (0.26) | (0.31) | |||||
| 2 | 0.10 ** | 0.02 * | 0.64 | 2.85 | 0.06 | 0.02 | 0.67 | 4.00 ** | −6110.23 |
| (0.02) | (0.01) | (1.33) | (5.59) | (0.04) | (0.03) | (0.63) | (0.33) | ||
| LI_RTS | |||||||||
| 1 | 0.03 | 0.01 | 0.01 ** | 0.99 ** | 5.08 ** | −6186.44 | |||
| (0.02) | (0.02) | (0.00) | (0.00) | (0.50) | |||||
| 2 | 0.02 | 0.03 ** | 0.42 | 0.04 | 0.06 ** | 0.00 ** | 0.99 ** | 5.35 ** | −6172.95 |
| (0.02) | (0.01) | (0.80) | (0.02) | (0.02) | (0.00) | (0.00) | (0.54) | ||
| LI_WIG20 | |||||||||
| 1 | 0.04 | 2.86 * | 0.07 | 0.49 | 0.40 ** | −5676.06 | |||
| (0.02) | (1.46) | (0.04) | (0.25) | (0.38) | |||||
| 2 | 0.03 | 0.01 | 0.57 | 0.28 * | 0.06 ** | 0.01 | 0.95 ** | 4.62 ** | −5668.02 |
| (0.02) | (0.01) | (0.80) | (0.14) | 0.02) | (0.00) | (0.02) | (0.42) | ||
Note: The estimated parameters together with standard errors (in the brackets). The significant parameters are marked with * at = 0.05 and ** at = 0.01. Parameter stands at change in VIX, while stands at the Lehman Brothers collapse variable, and both are in the conditional mean equation, whereas stands for the VIX changes in the conditional variance equation; v stands for the degree of freedom in Student t distribution. LL shows the log value of likelihood function.
© 2019 by the authors. Licensee MDPI, Basel, Switzerland. This article is an open access article distributed under the terms and conditions of the Creative Commons Attribution (CC BY) license (http://creativecommons.org/licenses/by/4.0/).
Share and Cite
MDPI and ACS Style
Będowska-Sójka, B.; Echaust, K. Commonality in Liquidity Indices: The Emerging European Stock Markets. Systems 2019, 7, 24. https://0-doi-org.brum.beds.ac.uk/10.3390/systems7020024
AMA Style
Będowska-Sójka B, Echaust K. Commonality in Liquidity Indices: The Emerging European Stock Markets. Systems. 2019; 7(2):24. https://0-doi-org.brum.beds.ac.uk/10.3390/systems7020024
Chicago/Turabian StyleBędowska-Sójka, Barbara, and Krzysztof Echaust. 2019. "Commonality in Liquidity Indices: The Emerging European Stock Markets" Systems 7, no. 2: 24. https://0-doi-org.brum.beds.ac.uk/10.3390/systems7020024
Note that from the first issue of 2016, this journal uses article numbers instead of page numbers. See further details here.