Trends in Occurrences of Systems Engineering Topics in Literature


Department of Industrial & Systems Engineering and Engineering Management, University of Alabama in Huntsville, Huntsville, AL, 35899, USA
*
Author to whom correspondence should be addressed.
Systems 2019, 7(2), 28; https://0-doi-org.brum.beds.ac.uk/10.3390/systems7020028
Submission received: 26 March 2019
/
Revised: 3 May 2019
/
Accepted: 21 May 2019
/
Published: 30 May 2019
(This article belongs to the Collection Systems Engineering)
Abstract
:Examining past research using content analysis can provide detailed information about the trends a discipline has displayed over years or decades. Disciplines such as software engineering and hospitality management have used methods for analyzing topic frequencies in the past. This paper uses similar methods to study the presence of systems engineering topics in literature to understand the occurrence of approaches and metrics in the community over time. This paper reviews the trends of systems engineering topics over the years 1998–2016 by performing a content analysis of four systems engineering and design engineering journals. A mathematical analysis of the trends is performed using rank ordering and a rank correlation metric. The study shows that model-based approaches have grown significantly since the early 2000s, as advocated in the INOCSE MBSE initiative, while other approaches such as Taguchi’s method and axiomatic design have been seen less frequently in literature. Systems engineering metrics that have been frequently seen in literature include complexity, reliability, and quality. The results from this research provide a portrait of the systems engineering landscape.
1. Introduction
Several systems engineering (SE) approaches have been developed and tested in recent decades [1,2,3]. The origins of these SE approaches vary, including academia, industry, and government. Research in SE has taken many paths, including exploring the improvement and development of SE methods, processes, and philosophies [4,5,6], and understanding how the findings from other scientific fields can be used to inform the practice of SE [7,8,9,10,11,12,13,14]. Several SE approaches have been successfully put to practice, and are still in use; others became popular and eventually faded away; and the rest were never adopted. Understanding the reasons for the successes or failures of different SE approaches is imperative to understanding future research directions for the improvement of SE. The first step to accomplish this objective is to study the historical evolution of the occurrence of major SE approaches.
This paper takes an evidence-based approach to investigate the frequencies of occurrence of different topics in SE with time. Topics include SE methods, processes, philosophies, and performance metrics known as “ilities.” The field of SE is very broad, and thus, the goal of this paper is to examine the frequencies of occurrences of different SE related topics over the years. This examination of a diverse set of topics will illustrate the breadth of the SE field as well as enable a comparison of the diverse set through their frequencies in literature. A content analysis is performed on well-established SE and design engineering journals from the years 1998 to 2016. Journals from the design engineering community are considered because their research commonly overlaps with that of SE. This is consistent with the National Science Foundation’s merger of the ESD and SYS programs to form EDSE, indicating a connection between the communities [15]. The authors examine the trends in the frequencies of occurrence of different topics within the four journal sources. Findings from this paper will benefit the reader by providing (a) a snapshot of the evolution of frequencies of occurrence of SE topics; (b) information about currently trending topics; and (c) new research ideas stemming from the observations made in this paper.
Five sections compose the remainder of the paper. Section 2 provides an overview of SE, discusses similar studies conducted in SE and other disciplines, and includes contributions from this study. Section 3 provides a detailed description of the methodology adopted in this study. Section 4 contains the results from the different analyses. Section 5 discusses the results and the limitations of this study. The paper closes with Section 6, where conclusions from the study and future directions of research are stated.
2. Background
Three subsections form the background section. The first subsection provides a general overview of SE, and the second subsection discusses similar studies that conducted in SE and other disciplines. The last subsection discusses the contributions made by this paper to help academics and practitioners alike.
2.1. What Is Systems Engineering?
SE is defined as “the multi-disciplined application of analytical, mathematical, and scientific principles for formulating, selecting, developing, and maturing an optimal solution from a set of viable candidates that has acceptable risk, satisfies user operational needs, and minimizes development and life cycle costs while balancing stakeholder interests” [16]. The application of SE starts right at the conceptual design stage and ends at the system disposal stage. However, the field of SE is broad, and very context dependent. A standard method for performing SE does not exist, and each organization shapes the process based on their products or organizational parameters. Numerous methods, tools, and processes are involved in the application of SE, which also depend on the context, and vary from organization to organization, or product to product. This vastness associated with the field of SE thus makes it imperative to understand the evolution of the field over the years, by understanding how the occurrences of the topics associated with SE changed over time.
SE has mainly found application in fields of aerospace [17,18] and defense [19,20,21,22,23]; however, it is increasingly being used in other disciplines. These disciplines include construction, automobile, healthcare, medicine, etc. In the field of construction, SE principles are being used to improve safety practices, knowledge management, and facilities management [24,25,26]. SE principles are increasingly being applied to improve product development in the automobile industry [27,28,29]. Principles of SE are also being applied to improve healthcare delivery systems [30,31,32], to improve the performance of the healthcare industry and professionals [33,34], and to improve drug delivery systems [35]. The research paths for the improvement of the healthcare industry, by using principles of SE, are reviewed in [36]. SE is also finding use in cancer treatment research [37]. Other applications of SE can be found in [34]. With the importance of SE being progressively recognized in different fields, it becomes important to understand the evolution of SE topics to foster future research on SE applications in different disciplines.
2.2. Review of Past Studies
The focus of this paper is to examine the trends in SE topics by performing a content analysis of peer-reviewed SE and design engineering journals. Specifically, the trend in frequencies of occurrence of SE topics will be measured using frequency of occurrence as a yearly metric. Similar studies have been previously conducted in SE, but with a different scope. Sheard performed a detailed literature review comparing the years of 2000 and 2015 of the Systems Engineering journal to understand if and how the focus on software varied in the SE community over 20 years [38]. In addition to software, she also examined the change in focus on other high-level aspects such as economics, management, and systems theory. Sheard, however, only analyzed the number of papers discussing these topics. She then performed a lexicographic analysis on the Subject/Title/Abstract fields of the Compendex [39] and Inspec [39] databases to validate her findings. In separate research, Boehm identified ten commonly observed trends (such as increasing interaction of software engineering and SE and increasingly complex systems of systems) and performed a detailed literature review to understand the implications of these trends on software and SE processes [40].
In another study, Broniatowski reviewed the progress made in the field of SE by focusing on important topics such as the “ilities”, system architecture, political and social values, the need for rigor, and diversity [41]. He later performed a bibliographic analysis on abstracts from the “Web of Science” database for the years 1990–2017 using the Latent Dirichlet Allocation (LDA) method. He analyzed 15 topics in total to observe for trends. The topics included SE focus areas, domains, management approaches, and methods. The analysis validated the results obtained from the review. Only certain topics analyzed by Broniatowski overlap with the topics selected by the authors of this paper. Furthermore, the dataset used in [41] is only abstracts, whereas this paper includes the complete texts of the analyzed articles. In addition, the analysis in this paper uses different methods.
Other disciplines have conducted analyses using a similar methodology as the one employed in this paper. Such studies are especially prevalent in the field of software engineering. Kitchenham et al. performed a manual search on numerous peer-reviewed journals to identify papers that conducted systematic literature reviews and meta-analyses in order to understand the impacts of systematic literature reviews in software engineering [42,43]. Rech used Google Trends to analyze trends in software engineering [44]. Coulter et al. used the method of co-word analysis to analyze software engineering literature [45].
The field of hospitality management has also conducted such analyses. Line and Runyan reviewed 247 articles to identify trends in hospitality marketing [46]. Chon et al. performed a content analysis on 20 years of literature in hospitality management to analyze observed trends [47]. Sainaghi et al. used a computer-aided text analysis method to analyze tourism performance literature over 19 years and understand past trends and predict future ones [48]. This paper applies similar methods to the field of SE.
2.3. Contributions of This Study
The research in this paper is novel from the past research in that: (1) it examines topics from both SE and design engineering sources; (2) it provides an evidence-based mathematical analysis of the trends followed by the topics; and (3) it performs a detailed examination of all articles for the years 1998 to 2016 from four SE and design engineering journals. The results of this paper may be used to identify community interests and research gaps. The results can be used to frame future research articles, using the findings both in motivation and to corroborate independent findings. The findings of this novel, evidence-based study, resulting from content analysis, produces a portrait of the SE landscape over almost two decades.
3. Methodology
The methodology employed in this paper consists of three main activities: identify topics, identify sources, and collect and analyze data. First, selection of the topics and categorization of the topics into standard SE processes is described, followed by a discussion on the four journal sources of the data and a presentation of the analyses to obtain the frequencies of the topics.
3.1. Selection of Topics
Multiple sources, including SE textbooks, the ISO/IEC 15288 standard, the INCOSE and NASA SE handbooks, journal publications [1,16,18,49,50], and the authors’ experiences in SE and design engineering were used to derive the topics for analysis in this paper. Four life-cycle processes that support SE were used in order to categorize the topics, and are defined by the ISO/IEC 15288: technical, project, enterprise, and agreement processes [1,23]. Each of these processes has several sub-processes [1]. The four main processes capture the activities involved in the typical SE life cycle, and are thus a good criterion for the categorization of the topics analyzed in this paper.
Table 1 lists the topics selected for analysis and the SE processes under which the topics are categorized. The columns in Table 1 have no meaning, and multiple columns exist only to reduce space. Most of the topics were obtained from the INCOSE SE Handbook [1]. As mentioned earlier, the topics analyzed in this study included SE methods, processes, philosophies, and performance metrics called “ilities.” The goal is to understand the historical evolution of these different topics. The analysis of topics will help in understanding how the focus of the field of SE has changed over time.
The topics were elicited through a review of the INOCSE SE Handbook’s chapters concerning the SE processes used for categorization. A selected set of topics were identified in the handbook as inputs, outputs, controls, enablers, or activities associated with the processes. Topics not obtained directly from the handbook include Pugh, Game Theory, Axiomatic Design, and Fuzzy sets. Of these topics, optimization was obtained from [16], whereas the remaining topics were obtained from [51]. For these topics not directly mentioned in the handbook, the authors performed an interpretive analysis in order to categorize the topics under the SE processes. The interpretive analysis involved a review of the activities that characterize each SE process, following which the authors chose the most appropriate SE process for each topic for categorization. The “ilities” topics were taken to be a separate group, not part of the SE process categorization mentioned above. The INCOSE handbook grouped enterprise and agreement processes together, and the authors adopted the same categorization for this paper.
Five years were randomly selected out of the 19 years of article availability to assess if important topics had been missed. For each year, a “Word Frequency” query was performed on one of the four journals. The 250 most frequent words were obtained for each of the 5 years and studied to identify missing topics. Natural language words dominated these analyses. For example, a word frequency query performed on the articles from JOED for the year 2007 indicated that only 4 of the 250 most frequent words overlapped with the topics analyzed in this paper. These words were: (1) value; (2) optimization; (3) robustness; and (4) DSM. The top five most frequent words were: (1) design; (2) product; (3) process; (4) system; and (5) used. Thus, the authors used the list originally compiled for this study.
This study could analyze many more topics. The derivation of the topic set from standard SE references provides a grounding in community accepted handbooks and publications. The topic set generated is not exhaustive, as new SE topics are constantly being formed or terminology is changed. However, the inclusion of additional topics would not affect the frequencies observed, and hence, would not change the relative ordering of the topics. Topics not addressed in this paper can be analyzed in the future with the same methodology and be inserted into the results described in this paper.
3.2. Selection of Sources (Journals)
The topics listed in Table 1 can be categorized under both SE and design engineering. Hence, a combination of four eminent SE and design engineering journals was selected to extract articles from and examine for trends. Table 2 lists the journals, and the years that data was collected from. These specific journals were chosen due to their broad scope, the availability and continuance of the data, and the year of establishment. Choosing SE and design engineering journals enabled a comparison of the two related research fields. Domain-specific journals were not included in the analysis, with the focus instead on journals with broader scopes, since SE approaches are utilized in multiple domains such as aerospace/defense, healthcare, and automotive. Conference proceedings were excluded for the same reason, as well as due to their limited availability. These limitations are further discussed in the limitations section.
Examining the scopes of journals selected for this study, the Wiley Systems Engineering journal’s interest is not limited to just SE topics, but also includes the broader aspects of SE, such as enterprise systems, system of systems (SoS), and other complex socio-technical systems. The journal also identifies languages and models of systems, as well as agile processes, as increasingly important topics. The focus of the Springer Journal of Systems Science and Systems Engineering are the theories, methodologies, and applications related to systems science and SE, that enable better understanding of the complexity and mechanisms of systems. On the design engineering front, the Journal of Engineering Design is an all-encompassing journal for topics associated with design engineering. The journal focuses on principles, techniques and methodologies, management, and practice of design, rather than domain-specific applications. The scope of topics within the journal’s interest is broad, including design aesthetics, big data analytics, risk and uncertainty, quality, reliability, robustness, etc. Similarly, the Research in Engineering Design journal emphasizes on the fundamental theories of design, languages and modeling, and the integration of design and manufacturing. Although these journals have different scopes, the journals emphasize the foundational theories of their disciplines, as well as the currently trending topics in their disciplines. For this study, the analysis was conducted on all the articles from the four journals, over the years mentioned. In total, 1788 articles were examined. Table A2 of Appendix A provides the distribution of articles in each journal by year.
3.3. Analyses of Journals
Content analysis was selected to examine the trends followed by the SE topics through the years 1998–2016. This method enables ease of exploring data and understanding the high-level context of the data without having to manually read the entire content. This method comes especially handy when large amounts of data need to be analyzed, for studies, such as those conducted in this paper. Specifically, NVivo [52], a qualitative analysis software to record the frequency of occurrences of the topics, was used to perform the text search queries. The results of the content analyses were analyzed statistically to draw inferences. A systematic description of the procedure is listed below.
Step 1: Identify keywords for topics
The first step in performing the text search query was to identify all the keywords associated with each topic. This was important because topics may be referred to differently in different corporate cultures or industrial sectors. For example, the identified keywords associated with Analytical Hierarchy Process (AHP) were “AHP”, “Analytic Hierarchy Process”, “Analytic Hierarchical Procedure”, “Analytical Hierarchy Process”, “Analytical Hierarchical Process”, and “Analytical Hierarchical Procedure.” Keywords were found using an iterative process, where text search queries were run and the results were used to identify missing keywords. Only keywords directly associated with the topic of interest were taken into consideration; the general theme that the topic may be categorized under was not included in the list of keywords. For example, while value-driven design (VDD) is associated with decision-based design, only the following, more direct keywords were used in the search for VDD: “value-driven”, “value-based”, “value-centric”, “value-focused”, and “value-derived.” Using only closely related keywords avoids overlap of keywords between topics. For example, “decision-based design” is associated with both VDD and utility theory. To avoid double counting, the authors did not allow such overlaps. Similarly, it was not the intent of this study to take into consideration all the evolutions of a topic for the analysis. For example, specific algorithms, such as “genetic algorithm”, and result related words, such as “satisfactory”, were not associated with the topic of optimization. Thus, only the frequencies of occurrence of the keywords directly associated with the topics were considered. Table A1 in Appendix A is a complete list of keywords for each of the selected topics.
Step 2: Run “Text Search” query
Upon identification of the keywords, the next step was to perform the text search query in NVivo [52]. The query performs a search using the keywords on the selected journal articles, and outputs the number of times the keywords appear. The entire contents of the articles were analyzed. No filter was applied on the articles concerning the context in which a keyword was being addressed. Hence, when a topic is found in an article in the query, the manner in which the author addresses the topic, whether positive or negative, was not determined. Such a determination is discussed in more detail in the limitations section. Due to the large number of articles examined (1788 in total), reading each article, or topic occurrence, to understand the context in which the topic is being discussed, is beyond the scope of this paper. The analyses in this research give an understanding of the occurrences in literature of topics, and not in their use in practice. The frequencies of occurrence of the topics were obtained for each journal, for each year that the journal was available. The frequencies of the topics associated with each journal were then aggregated to obtain the total number of occurrences of the topics for each year.
Step 3: Normalize and plot data
Normalization of the data was conducted in order to reduce biases when comparing journals and comparing between years. Biases may be induced due to disparities in lengths of articles in different journals and disparities in lengths of articles in different years of the same journal. Two kinds of normalizations were conducted: (1) normalization with respect to total number of words in a journal; and (2) normalization with respect to total number of keywords. The first normalization involved dividing each topic’s frequency of occurrence for a journal by the total number of words in the journal for that year. When analyzing the population of data, which included all journals, the sum of the total words in each journal for each year was used as the denominator (see Appendix A, Table A3). For the second normalization, each topic’s frequency of occurrence for a journal was divided by the aggregated total of the frequencies of all topics for the journal for that year (see Appendix A, Table A4). For the population of data, the sum of the frequencies of occurrence of a topic for each journal for each year was divided by the total frequencies of all topics from all journals for that year.
The first normalization informs of the standing of a topic in regards to all the words used in the journals. However, this may cause a bias due to journal-specific attributes such as restrictions on the total number of pages. The second normalization overcomes this potential bias by informing the importance of a topic in regards to the total occurrences of all topics. The normalized values of the frequencies from both the normalization methods are plotted against year for each topic, examining individual journals and the collection of journals. An additional analysis involved calculating a weighted average frequency, where the normalized frequencies of a topic from each journal were assigned equal weights and then aggregated to obtain the average frequency for that topic during that year.
Step 4: Rank order data and calculate rank correlation metric
The final step in the analysis was to rank the topics and conduct rank correlation analyses. First, the normalized yearly frequencies for all topics were sorted according to ranks, both by journal and for the collection. Rank 1 corresponds to the topic that has the highest normalized frequency, rank 2 the next highest, and so on. The rank ordering enabled identification of the topics that maintained consistently higher ranks throughout the years, topics with the lowest ranks, and significant changes in ranks with time. Rank ordering the topics by source helped in identifying topics that different communities focused on. Topics were also ranked within the categories of technical processes, project processes, and “ilities.” The normalized frequencies using the first normalization method was used for the rank ordering since the normalization method would not affect the rank ordering of the topics when considering the pooled normalized frequencies from all journals.
A rank correlation metric, Kendall’s tau-b, was calculated for each pair of rank orderings between consecutive years. Kendall’s tau is commonly used to find the strength and direction of the statistical associations between rank-ordered sets of data [53]. The Kendall’s tau correlation coefficient is a nonparametric measure of association in paired observations based on the number of concordant or discordant pairs in the data [53,54]. The modified version of the Kendall’s tau, Kendall’s tau-b (), is given in Equation (1), where C is the number of concordant pairs, D is the number of discordant pairs, A0 is the pairs tied only on the A variable, and B0 is the pairs tied only on the B variable,
Tau-b has values between −1 and +1. A value of 0 indicates that there is no correlation between the variables, whereas a value of 1 indicates perfect correlation. The + and − signs indicate the direction of correlation.
Equation (1) was used to measure the rank correlation between consecutive years. This was done for the collection of the normalized frequencies of occurrence, for normalized frequencies of occurrence from individual sources, for technical and project processes, and for the “ilities.” Excel Visual Basic for Applications (VBA) was used to calculate the values for the normalized frequencies of occurrence, which were verified using SPSS. The p-values for each were calculated in SPSS to check for statistical significance. In this case, the p-values were used to accept/reject the null hypothesis that:
The alternative hypothesis for this is:
The results from this methodological process are discussed in the Results section.
4. Results
Three main subsections form the results section: (1) frequency trends, (2) rank ordering of topics, and (3) weighted average analysis. A discussion of the results pertaining to each of these focus areas follows.
4.1. Frequency Trends
An analysis of how the normalized frequencies changed from the beginning of the data (year 1998) to the end of the data (year 2016) was performed to understand the general trends in occurrences of the topics. The normalized frequencies are the ratio of the total occurrences of keywords for a topic, for a year, divided by the total number of words in that year. The averages of the normalized frequencies, using both normalization methods, for the first four years (1998–2001) and the last four years (2013–2016) for the topics were calculated, as well as the percentage change. Seven categories were established to classify the change in frequencies (). Since the frequencies for most topics using the normalization with respect to all words were extremely small, the topics were grouped by the order of the magnitude of their initial (1998–2001) frequencies to provide a deeper context to the average changes. This was performed so that an increase in 5 words for a topic that started with 10 would not be seen as the same as an increase in 500 words for a topic that started with 1000. A summary table to understand the average change in the topics’ occurrences, when normalization was performed using all words, and the categories and groupings, is shown in Table 3.
Table 4 describes the average changes in the frequencies of topics when the normalization was performed using the total number of keywords in the denominator. In this case, since the frequencies of occurrences of topics were divided by a smaller number (as compared to the total number of words in a source), the orders of magnitudes of the initial normalized frequencies of topics were larger, as seen in Table 4. To highlight the difference between the results from the two normalization methods used, topics that changed their row positions as compared to Table 3 are highlighted in green. It is noted that comparisons between Table 3 and Table 4 should be made with reservations, as the categorizations are dependent on the denominators used in the normalizations.
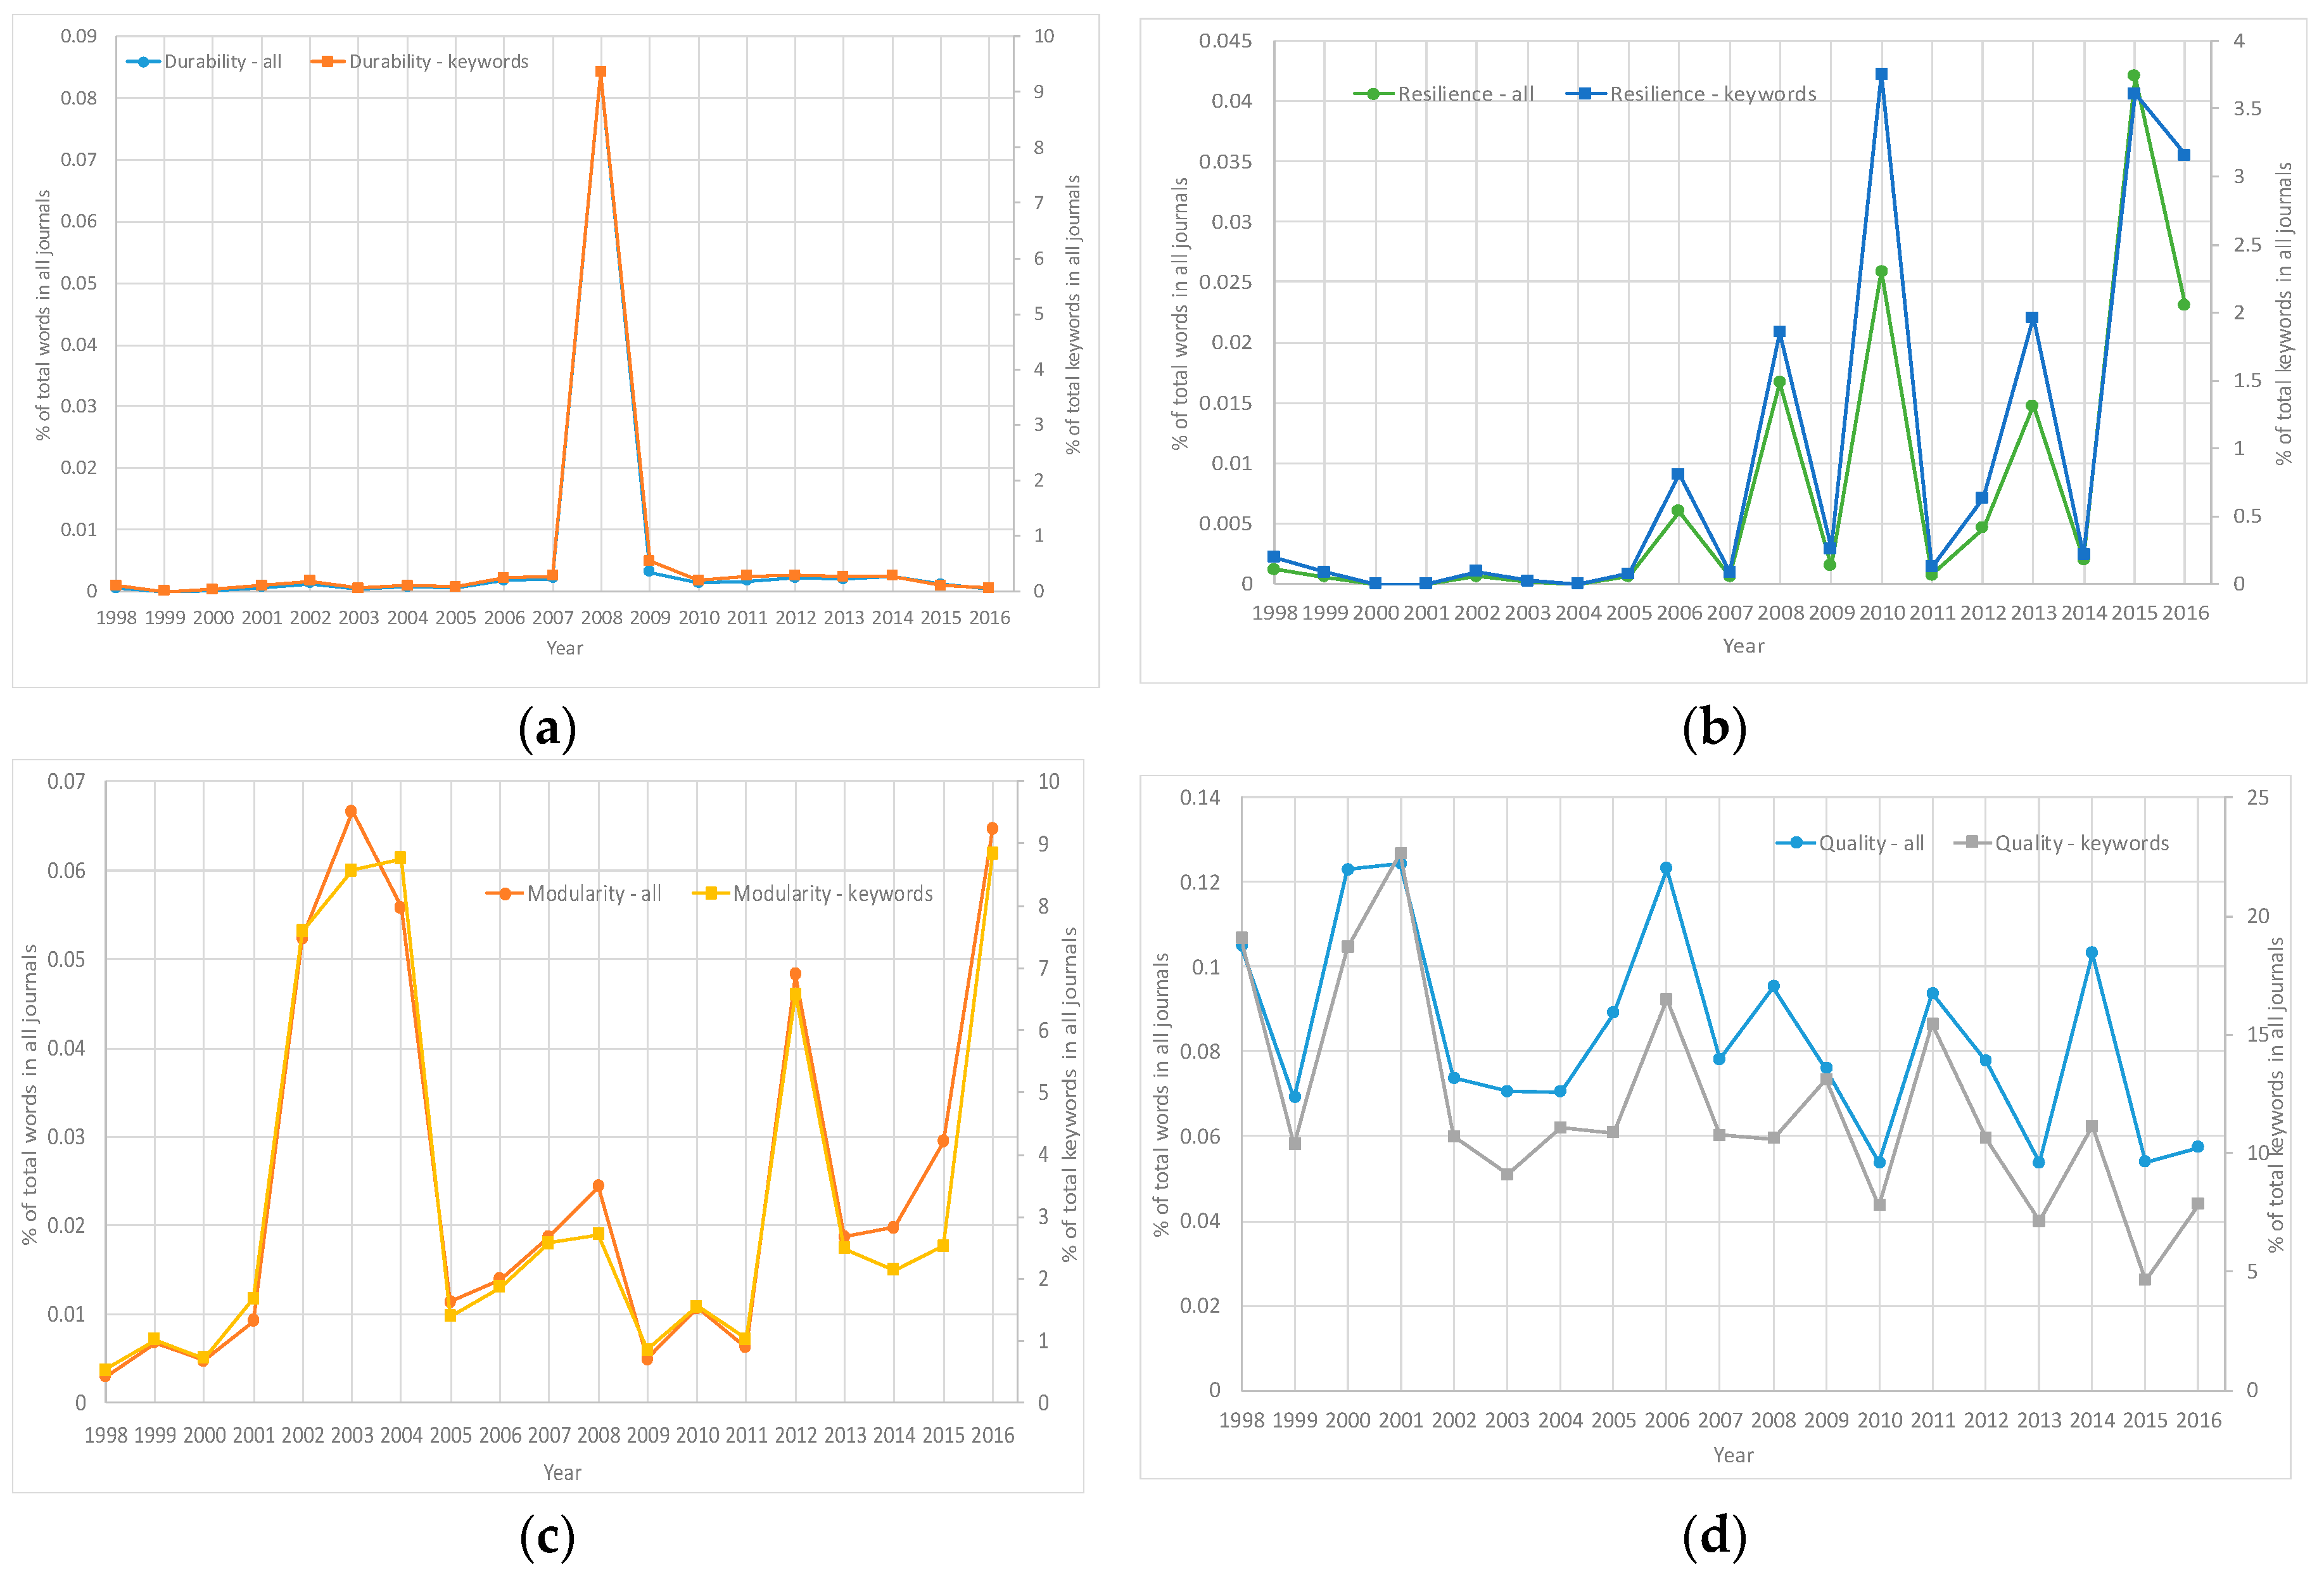
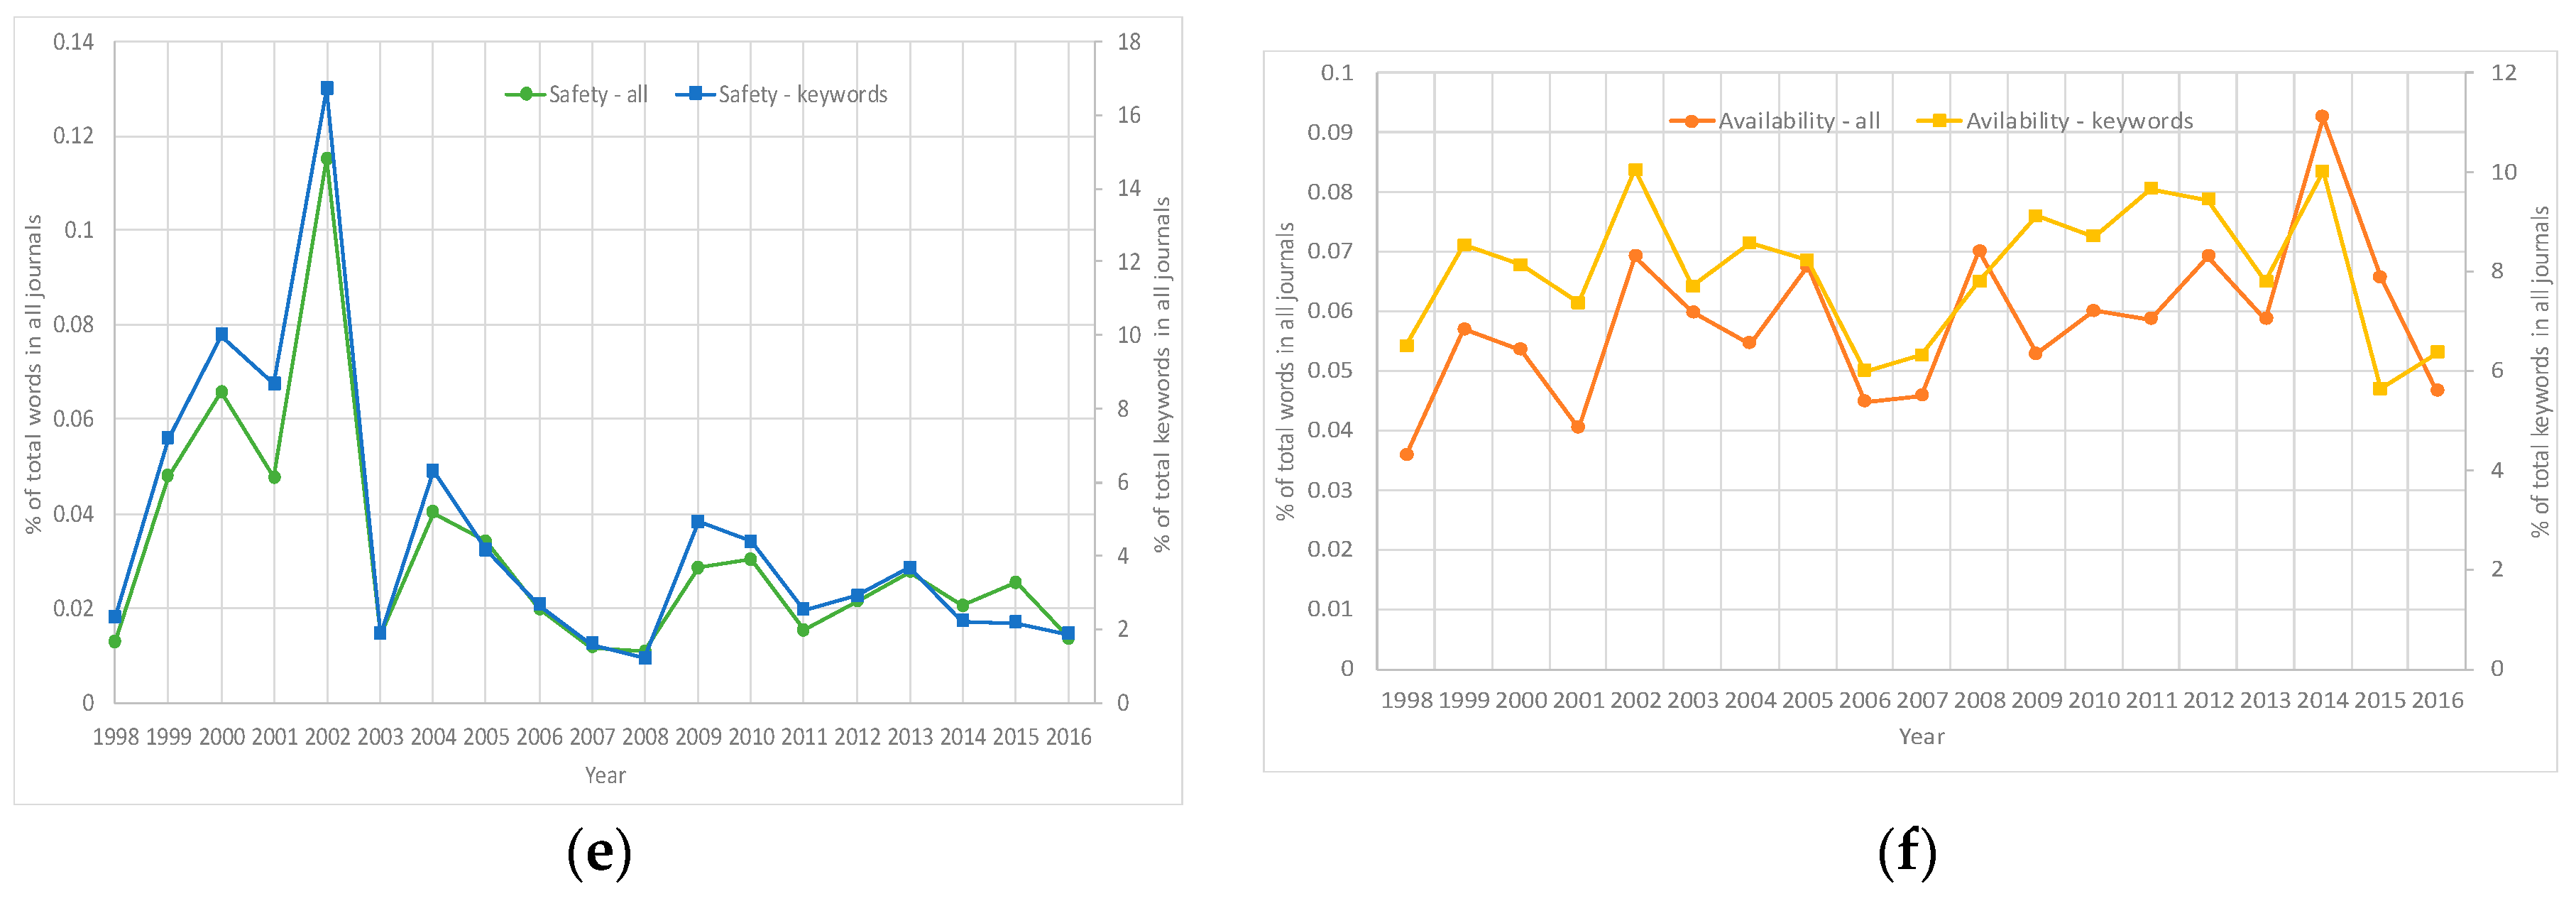
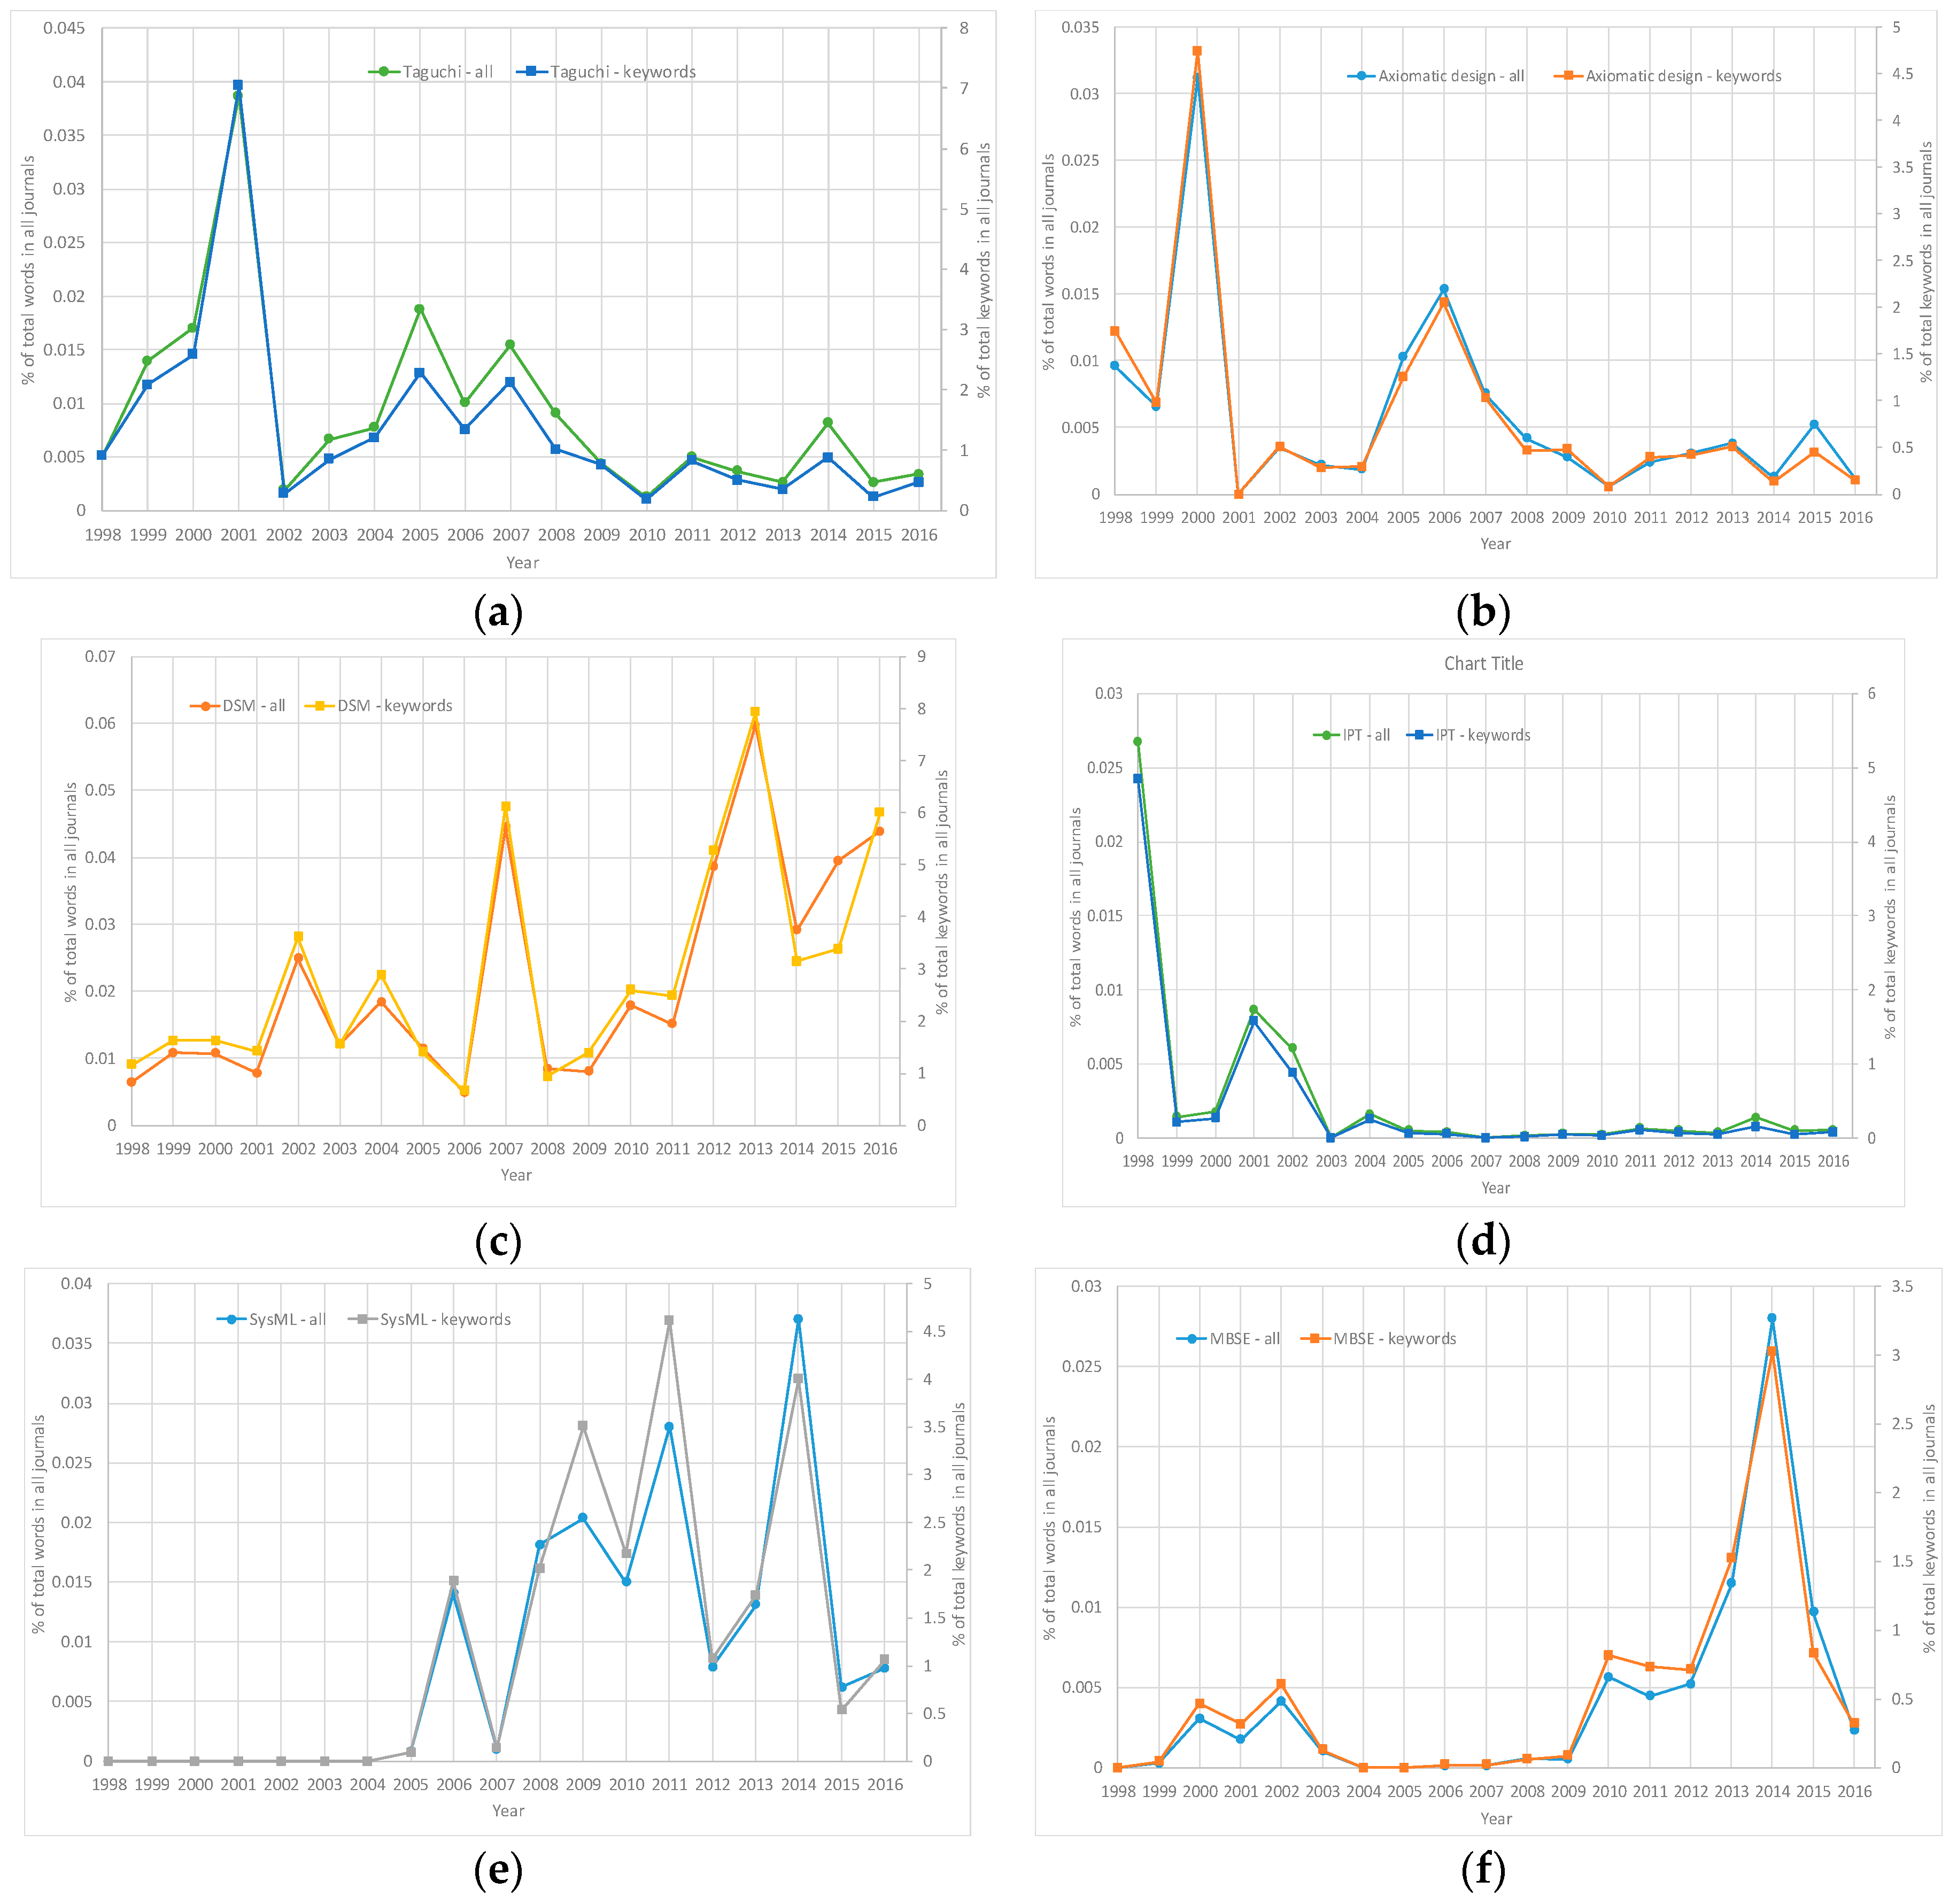
The topics had various degrees of linear trends, stability, exponential trends, etc. Examples of upward trending topics included DSM and modularity. Downward trending topics with minor fluctuations included quality, safety, Taguchi, and axiomatic design. Examples of other interesting findings included durability that peaked in 2008, availability that remained more or less consistent through the years, resilience that remained almost non-existent until 2005, and integrated product teams (IPT) that saw a downfall after 1998 and remained more or less consistent at almost zero for the years 2003–2016. Model-driven approaches such as systems modeling language (SysML) and model-based systems engineering (MBSE) remained non-existent until the mid-2000s, and then suddenly rose upwards.
All of the topics’ trends were plotted, with the “ilities” discussed above shown in Figure 1, and the other approaches discussed above shown in Figure 2. Plots of only a few selected topics are depicted in Figure 1 and Figure 2 to help the reader gauge the general nature of different trends. Topics for the figures were chosen that had unique trends; however, the plots can be generated for any topic of interest using the normalized frequencies. In both figures, the trends resulting from both normalization methods were plotted on the same graphs. From Figure 1 and Figure 2, it is evident that there was no major difference in trends for the collective data when comparing normalization methods.
It is expected that the trends in the topics will differ depending on the journals examined, especially since two communities are examined in this work. For example, Figure 3 depicts the difference in the trends of “safety” for the Wiley Systems Engineering journal and the Journal of Engineering Design. Four tables are presented in order to thoroughly investigate the difference between the journals. Table 5 and Table 6 summarize the averages of the orders of magnitudes of the topics for each journal for normalization using total number of words and normalization using total number of keywords, respectively. The categorization of magnitudes for Table 5 is the same as Table 3, and that of Table 6 is the same as Table 4. Table 7 and Table 8 summarize the percentage change of the topics’ frequencies in a method similar to that used in Table 3 and Table 4, but only using data from individual journals. Table 7 shows the percentage change for data normalized using the total number of words in a journal, whereas Table 8 describes the changes for data normalized using the total number of keywords in a journal.
Noteworthy observations in Table 5 and Table 6 are as follows: DSM and Pugh had a significantly lower occurrence (<10−5) in SS & SE as compared to the other three journals. In RED, repairability had a significantly lower occurrence (<10−5), whereas axiomatic design had a higher occurrence (10−2) as compared to JOED, SS & SE, and Wiley. Additionally, from Table 6, risk matrix had a lower presence (<10−5) in SS & SE, digital twin had a lower presence (<10−5) in RED, modifiability had a higher presence (10−2) in Wiley, and RVTM had a significantly lower presence (<10−5) in JOED as compared to the other journals.
In the comparison of the changes in average frequencies provided in Table 7, the following significant differences between the journals were observed: (1) While safety had a positive change in frequency in other journals, there was a significant drop of between −50% and −100% in the frequency of safety in JOED; (2) while other journals saw a positive change in the frequency of agile and digital twin, in RED, there was a significant decrease (−50% to −100%) in the frequency of agile, whereas there was no change in the frequency of digital twin; (3) for SS & SE, there was no change in the frequencies of evolvability, testability, and DSM, while there was a positive change in all other journals; and (4) modifiability saw a significant increase (>500%) in Wiley, whereas it remained unchanged in the other three journals.
In Table 8, in which the data was normalized using the total number of keywords, the following differences between the journals were observed: (1) in JOED, manufacturability and extensibility had a positive change (0% to 50%), whereas in the other journals there was a negative change. (2) In RED, the frequencies of scalability, interoperability, and agility decreased (−50% to 0%, −100% to −50%, and −100% to −50% respectively), in the other three journals there was an increase. (3) In SS & SE, adaptability (−50% to 0%), evolvability (−100% to −50%), flexibility (−100% to −50%), DSM (−100% to −50%), and AHP (−100% to −50%) saw a negative change in frequency and the other journals saw a positive change. Also in SS & SE, quality function deployment (QFD) and IPT saw a positive change in frequency (>500%), while there was a decrease in the other journals. In SS & SE, axiomatic design frequency remained unchanged, whereas it decreased in the other journals. (4) In Wiley, the occurrence of SysML and reliability decreased in frequency (−100% to −50% and −50% to 0% respectively), while it increased in the other journals; and the occurrences of modifiability and utility theory increased (>500% and 300% to 500%, respectively), whereas in the other journals the occurrences remained unchanged and decreased, respectively.
Although minor changes were observed between Table 7 and Table 8 (which differed due to the normalization method used), it is important to note here that the trends followed by topic saw no major changes, which is of greater relevance to this paper. It is seen that the normalization methods used in this paper did not have major effects on the results. Thus, henceforth in this paper, the first normalization method using the total number of words in the sources is used for analyses.
4.2. Rank Ordering and Rank Correlation Metric
An analysis of how the ranks changed from the beginning of the data to the end of the data was performed. The averages of the normalized frequencies for the first four years (1998–2001) and the last four years (2013–2016) for the topics were calculated, which were used to rank order the topics for each of the two periods. The differences in the ranks for the two periods were calculated to understand the change in ranks in the time duration. Seven categories were established to classify the change in ranks. Table 9 is a summary table to understand the average change in the topics’ ranks by occurrences, including the categorization. This table provides an overall picture of the changes in the occurrences of different topics. Topics can be identified that had significant increases and drops in ranks, and the topics that maintained consistency throughout the years.
The SE topics were then rank ordered based on their normalized frequencies of occurrence for each year. Four sets of topics and their rankings were examined to understand the population and groups of topics: (1) the overall rank orderings including the entire set of topics; (2) the technical processes; (3) the project processes; and (4) the “ilities.” The Kendall’s tau-b values corresponding to each pair of years, and the p-values for each of them, were also calculated. The two-sided confidence value was set at 95%.
(1) Overall Rank Ordering
The complete set of SE topics were rank ordered based on their frequency of occurrence in this analysis. The frequencies of occurrence from all four journals were aggregated. Table 10 lists the ranks of the topics through the years. The tau-b values, and their corresponding p-values, are also listed. For each pair of years, the tau-b value is listed below the smaller year. For example, the tau-b value to determine the rank correlation between 1998 and 1999, and its corresponding p-value, are listed below 1998. As seen from Table 10, all the p-values are less than 0.001, which means that the null hypothesis could be rejected in each case. This corresponds to all the Tau-b values being statistically significant, meaning that there was a strong correlation in the rank orderings between consecutive years.
Table 10 indicates the consistency and movement of different topics through the years. Optimization consistently held a high rank between 1 and 5, highlighted in green. Among the “ilities”, complexity and quality, highlighted in orange, held high ranks of 1–3 and 1–6, respectively. QFD and Taguchi dropped in ranks through the years, highlighted in red, from 8 to 19 and 14 to 20. MBSE and SysML, highlighted in purple, suddenly moved up in the early to mid-2000s, which is expected from the frequency plots discussed in the previous subsection.
(2) Technical Processes
Next, the topics that were categorized under technical processes were rank ordered within them. The aggregated normalized frequencies from all four journals were considered for this rank ordering. Optimization had high ranks, between 1 and 5, as was apparent in Table 10. Complexity, quality, availability, reliability, and robustness were among the higher ranked “ilities”, having average ranks between 2 and 8. IPT had a drastic drop in rank from 7 to 24 after the first year, and then was amongst the lowest ranked topics after 2006. The yearly tau-b values were statistically significant, meaning there was a strong correlation between the rank orderings.
(3) Project Processes
The eight topics classified under project processes were rank ordered, seen in Table 11, with the corresponding Kendall’s tau-b values. The aggregated normalized frequencies from all four journals were considered for this rank ordering. The ranks of most topics fluctuated through the years. Value-driven design (VDD), IPTs, and risk matrices had the lowest average ranks of 6, 6, and 7, respectively. DSM was consistently within the top three topics, and had a rank of 1 in 10 out of the 19 years. An interesting observation for the project processes was the tau-b values. As can be seen from the table, seven p-values were greater than the set confidence level of 0.05, which means that the null hypothesis could not be rejected, and that there was no significant correlation between the ranks in these years. The tau-b and p-values for these observations are highlighted in yellow.
(4) “Ilities”
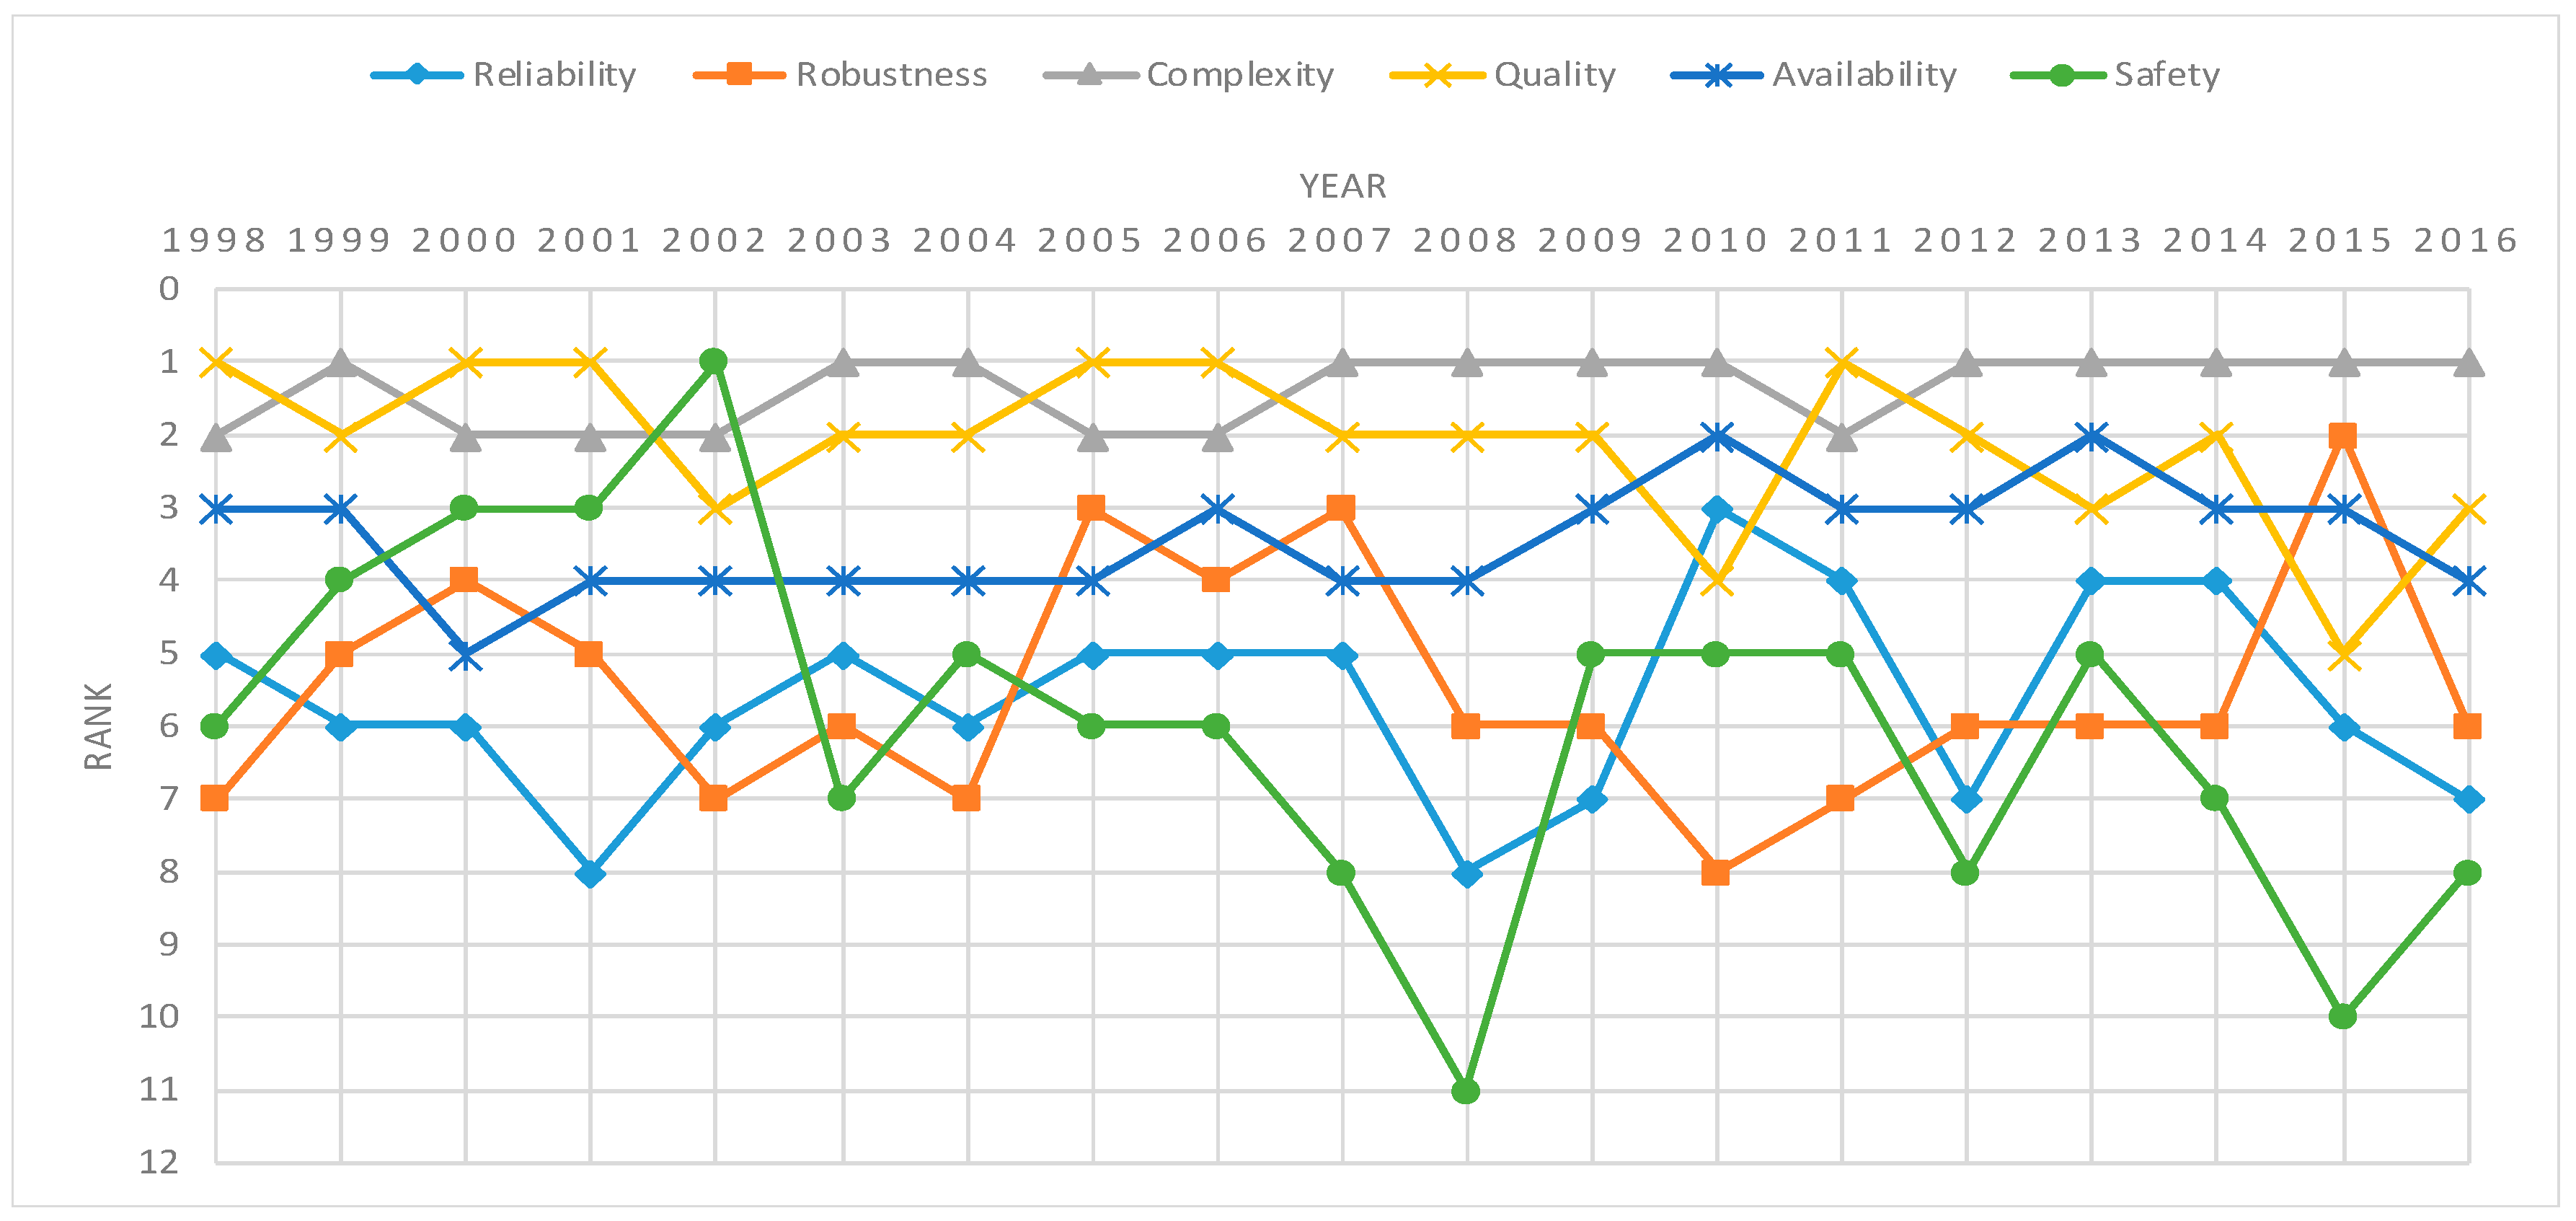
“Ilities” are a major focus in SE, often used to keep track of system performance [16,55,56] as key performance parameters (KPPs), measures of effectiveness (MOEs), measures of performance (MOPs), and technical performance measures (TPMs). Identifying the “ilities” that appear more frequently may indicate the need for new SE approaches to focus on those metrics. Table 12 shows the results of the rank ordering, including the corresponding tau-b values and p-values. The aggregated normalized frequencies from all four journals were considered for this rank ordering. Complexity, quality, reliability, robustness, availability, and safety were the higher ranked “ilities” and had the top six average ranks. The ranks of these six “ilities” are plotted against the years to attain better visualization, and are shown in Figure 4. Complexity held the rank of 1 for most years. Quality also held ranks between 1 and 5 through the years. Availability remained more or less constant, whereas safety fluctuated and eventually dropped in rank. Evolvability, repairability, and modifiability were among the lowest ranked “ilities”, having average ranks of 20, 21, and 22, respectively. The p-values corresponding to the tau-b correlation coefficients suggested that all the values were statistically significant, or that there was a strong correlation between the ranks of the consecutive years.
4.3. Weighted Average Analysis—Frequencies and Ordering
An additional analysis calculated the weighted averages of the normalized frequencies of the topics, as discussed in the methodology section. This was performed to overcome a potential bias that could have resulted from the differences in the total word counts of the journals, which could have inherently skewed the results. A weighted average analysis was performed in which the normalized frequencies of the topics from each source were assigned an equal weight and then aggregated to obtain the weighted average frequencies. The average frequency and rank change analyses discussed in Section 4.1 and Section 4.2 were performed on the weighted average frequencies. The results for the average frequency changes from the first four to the last four years are given in Table 13. Topics that changed by one or more categories as compared to Table 3 from the “unequal weight” analysis, are highlighted. Topics that moved horizontally and vertically are shown in green and those that moved only vertically are shown in red. Table 14 shows the results for the average rank changes. Topics with changes in ranks of one or more categories as compared to Table 9 from the unequal weight analysis are italicized.
5. Discussion
The results presented in the previous section show the evolution of the presence of different topics in SE and design engineering literature. This section discusses these results.
5.1. Comparison between Unequal and Equal Weight Analyses
An analysis that involved assigning equal weights to the journals was performed, as discussed in Section 4.3. This analysis was done to overcome any potential biases that may have resulted due to the inherent unequal assignment of weights in the analysis where normalized frequencies were divided by the aggregated number of words from all journals. The average distribution over the years 1998–2016 of total words in each journal in that analysis was JOED ~ 31.85%, RED ~ 21.02%, SS & SE ~ 20.07%, and Wiley ~ 27.05%. This unequal distribution may have resulted in a bias due to the greater influence of JOED; however, the averages were relatively close to each other. The equal weight analysis assigned each journal a weight of 25%. Examining Table 13 and Table 14, major shifts in results did not occur.
The number of topics that had no change in average rank reduced from 4 to 1 when comparing the unequal and equal weights analyses, as seen from Table 9 and Table 14. Maintainability saw no change in rank in the equal weights analysis, whereas it had a positive change in the unequal weight analysis. In the unequal weights analysis, lean and usability had a negative change in rank, whereas in the equal weights analysis they had a positive change. Another interesting observation was that the average rank of axiomatic design decreased between 11 and 20 in the unequal weights analysis, but decreased by greater than 20 in the weighted analysis.
5.2. Evidence of Topics Becoming Less Frequent in Occurrence
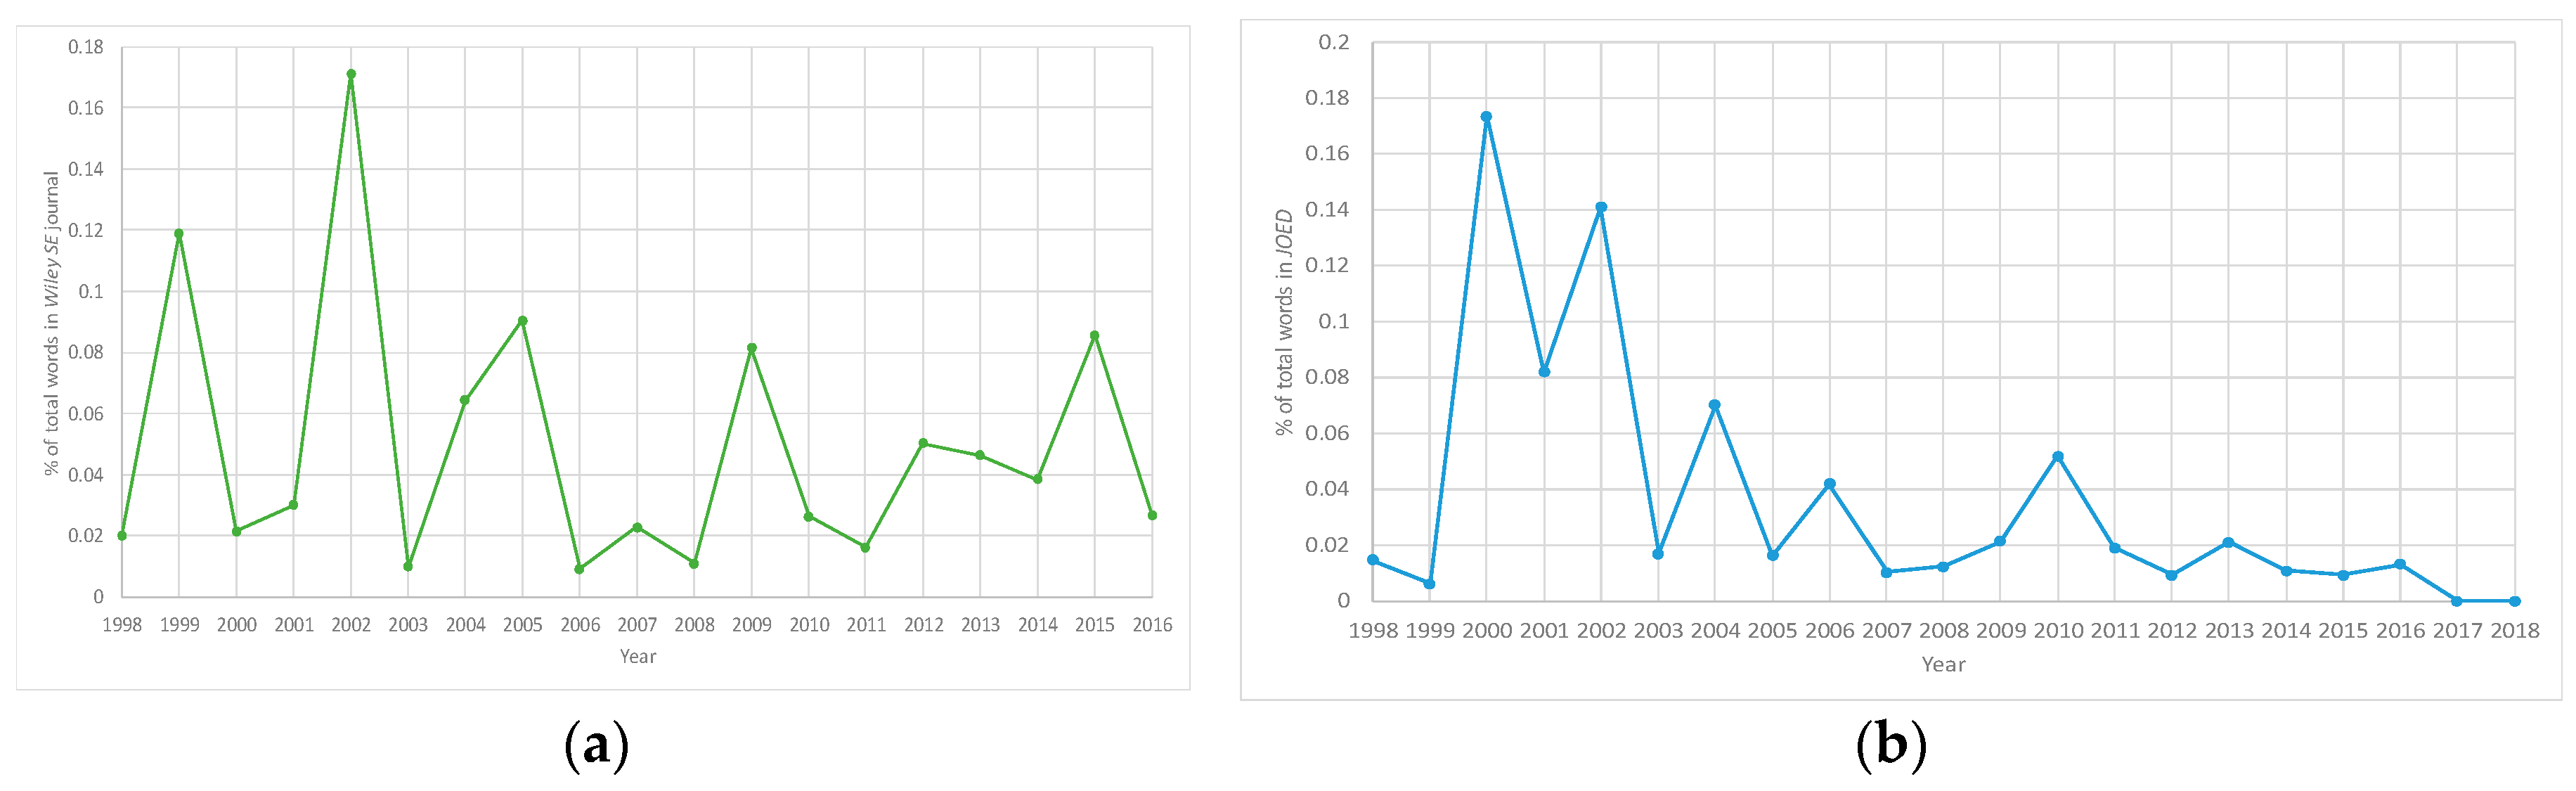
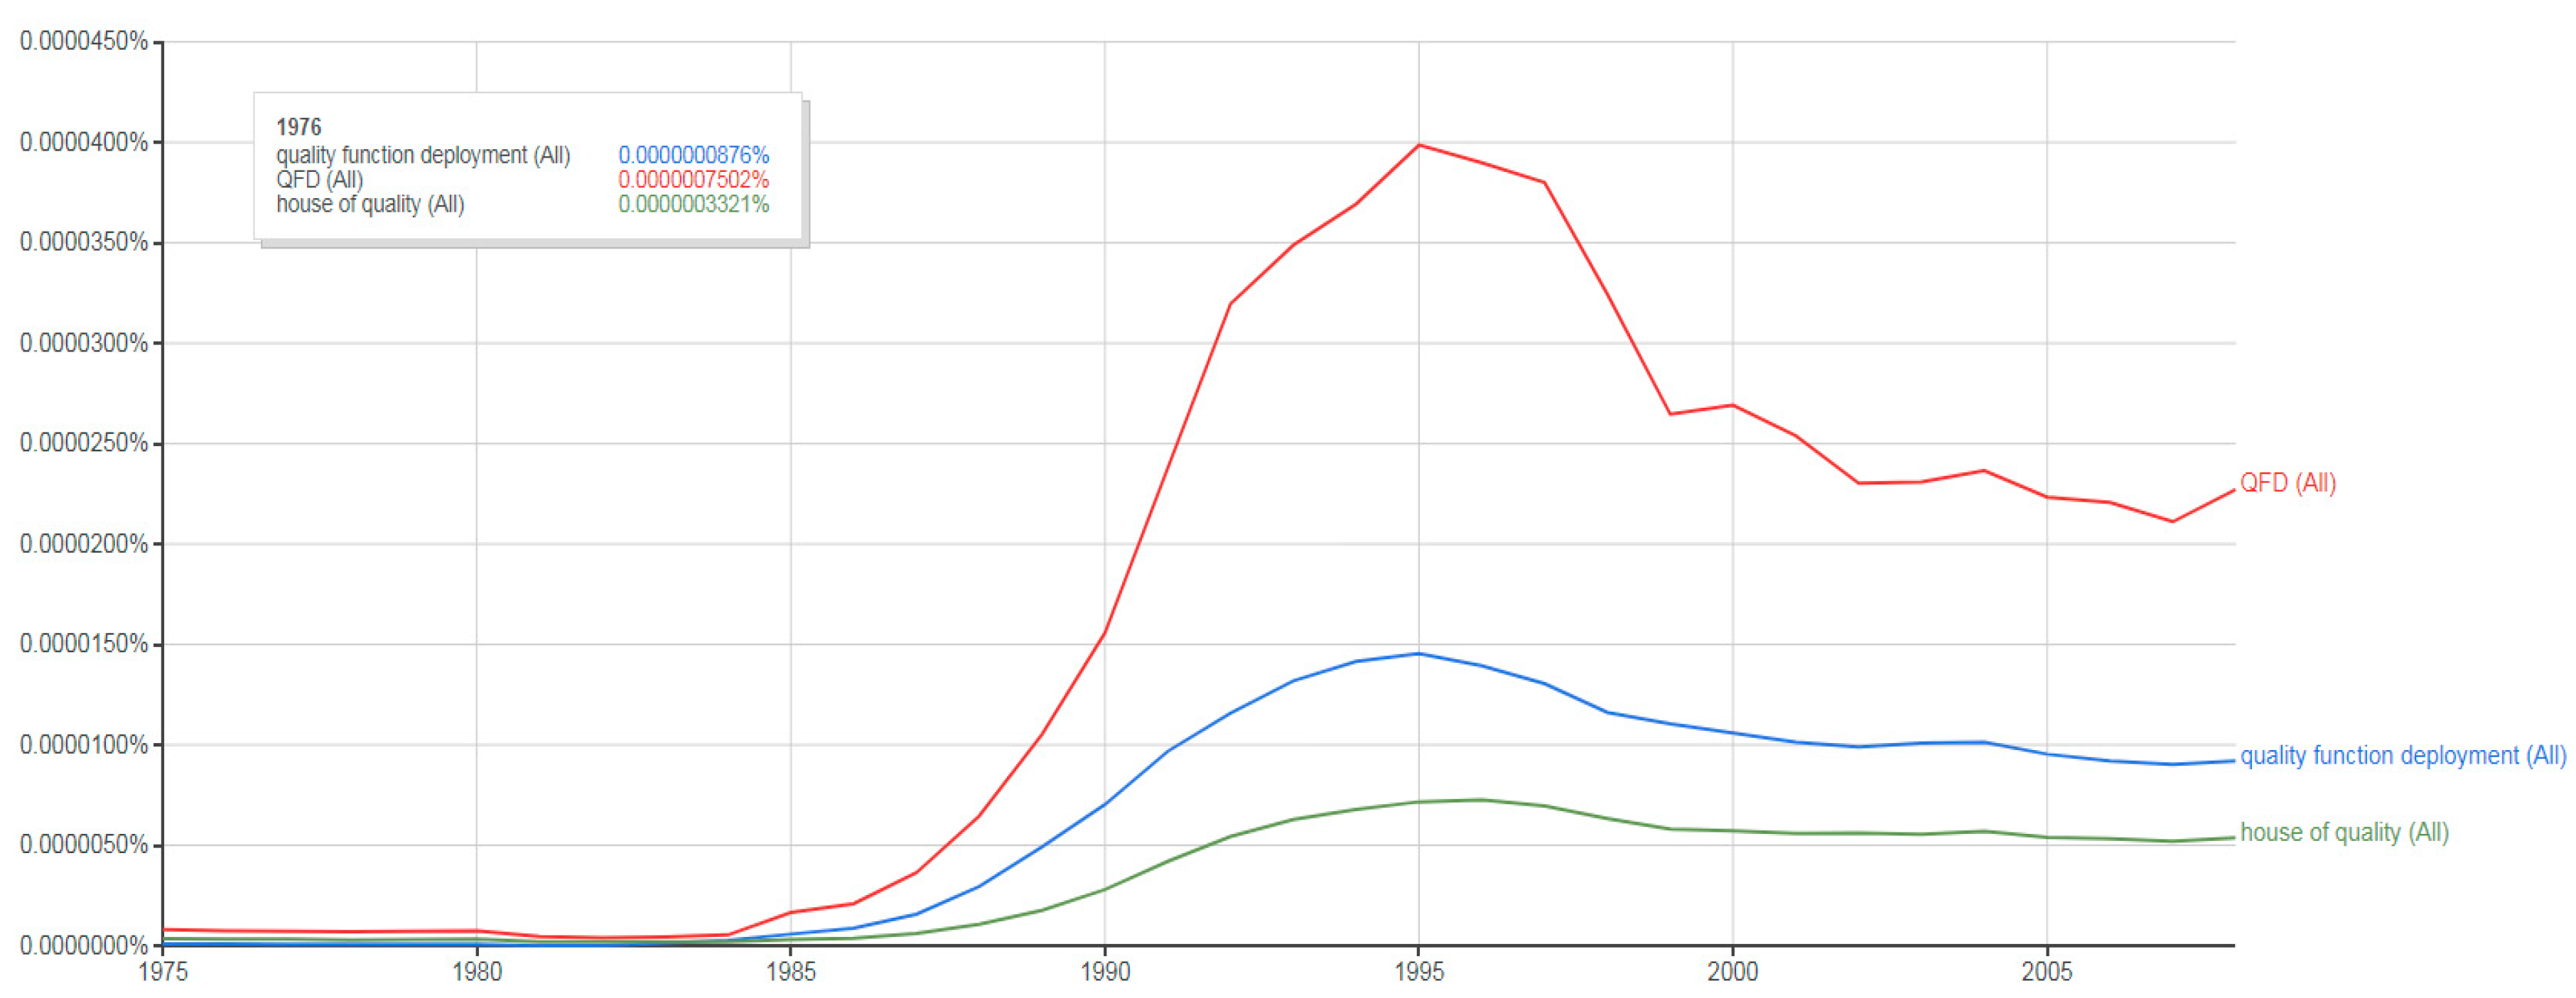
The analyses from Section 4.1 and Section 4.2 provide evidence that robust design approaches of Taguchi’s method [57] and Suh’s axiomatic design [58] became less frequent in occurrence over time. Table 9 also provides evidence of the drastic decrease in average ranks of both these approaches between the initial (1998–2001) and final (2013–2016) years. Disadvantages of Taguchi’s method can be found in [51,59,60,61] and disadvantages of axiomatic design can be found in [51,62,63]. QFD also became less frequent in the literature over the examined time period and has its share of disadvantages [51,64,65]. Figure 5 shows a supplementary analysis of QFD using Google Ngram1 with different keywords associated with QFD. The discovery of the drawbacks of these approaches as time progressed may have been one of the reasons for the decrease in the occurrences of these approaches over time, as the perceived utility of these approaches to practitioners may have reduced. Further research is needed to understand the true causes leading to these evolutionary characteristics.
5.3. Evidence of Topics Becoming More Frequent in Occurrence
MBSE and SysML were recognized by INCOSE as important topics in the mid-2000s [66,67,68]. Figure 2 shows the sudden rise of MBSE and SysML publications in the early to mid-2000s. The increase in the occurrences of these topics is also evident in Table 9, where both SysML and MBSE had significant increases in average ranks in the last four years (2013–2016), as compared to the first four year (1998–2001) period. The increase in the occurrences of these approaches could also be attributed to the onset and rise of digitalization in the last two decades. Even though the MBSE and SysML are being readily researched and applied, they are still relatively new, as compared to older topics such as QFD and optimization. In the forthcoming years these approaches may persist and continue to increase in frequency, or decrease like QFD or Taguchi’s method.
5.4. Differences in Frequencies of Occurrence of Topics between SE and Design Engineering
Both SE and design engineering use many of the topics selected for analysis in this research. However, differences exist between these two communities. The comparison of the four journals in Table 5 and Table 7 demonstrate these differences. For example, as seen in Table 5, QFD had a higher frequency of occurrence in the design engineering journals. VDD, and metrics such as complexity, flexibility, and extensibility, had a greater frequency of occurrence in the SE journals. The cultures of the communities and the cultures of the journals may be a possible reason for the differences in the topic occurrences by communities. For example, the SE community seems to be interested in system performance metrics such as “ilities” or approaches that deal with risk such as RVTM and risk matrices. The analyses suggest that the design engineering community seems to be interested in design-centric approaches such as optimization and DSM. These different focuses of the communities could inherently influence the frequencies of occurrence of these topics in the two communities. However, a more detailed understanding is required. Future research may indicate that the communities do not overlap as much as commonly believed.
Differences exist between the two design engineering journals and between the two SE journals as well. For example, in the SE journals, Wiley had higher normalized frequencies of DSM and MBSE than SS & SE. SS & SE had higher normalized frequencies of fuzzy sets and optimization. There could be many causes of these differences. One cause could be the style of the journal, where articles are templated in a certain fashion, causing certain styles by the authors of the articles to affect word usage. Another cause may be due to the journal’s scope and editorial board. Journals become known for publishing certain research, whether by design or by evolution. Authors will seek out journal scopes that fit their research, causing certain topics to be more likely to appear in certain journals. Certain observations in this study aligned with the scopes of the journals discussed in Section 3.2. For example, as seen in Table 5, both SysML and MBSE had a significant occurrence (average normalized frequency) in Wiley, a journal that considers these topics important. Similarly, JOED, which places emphasis on “ilities”, had substantial occurrences (average normalized frequencies) of reliability, robustness, and safety, as seen in Table 5.
5.5. Consistency with INCOSE Vision
The results observed in this paper can be compared to the visions laid out for the years 2020 and 2025 by the International Council on Systems Engineering (INCOSE) in the MBSE Initiative [68] and the 2025 Vision Report [69]. The MBSE Initiative, discussed at the INCOSE Symposium in 2007, laid the roadmap for MBSE, starting in 2007 and continuing to 2025 [68]. The formal report predicted that increased acceptance, use, and formalization of MBSE would be seen in the years to come. Modeling standards, including SysML, AP233, and UPDM, were also discussed. The analyses conducted in this paper showed an upward rise in the occurrences of MBSE and SysML in the early to mid-2000s, followed by a general upward trend afterward.
In 2014, INCOSE published the INCOSE 2025 vision report [69]. This report also recognized the increased use of model-based approaches in the state of SE in 2014. Topics, including game theory, value modeling, and optimization were included in the list of topics to strengthen the theoretical foundation of SE. The report stressed that the future of SE will be in resilience and resilient autonomous systems. The analysis showed an upward trend in the frequencies of occurrence of resilience, VDD, optimization, and game theory. Additionally, one of the main concerns raised in the report both for the current and future SE was the management of increasing system complexity. Complexity was among the highest ranked topics, and followed an upward trend throughout the observations in this study. There is consistency between the observations made in this paper concerning the occurrences of topics in literature, and the INCOSE reports.
5.6. Practical Implications of Findings
This study examined the evolution of different SE and design engineering topics over 19 years. Topics were identified as trending upward, downward, remaining consistent, or following unique swings. This study provides a first step, grounded in evidence from leading SE literature, to better understand the discipline of SE. This grounding in evidence provides a starting point to address complicated SE questions, such as what SE topics should be addressed in a SE theory? What SE topics should researchers consider investigating? And what SE topics should practitioners consider adopting, or renounce? While the results do not answer these questions, the study may point to some clues, and does provide an evidence-based footing. The study’s contribution to theory, research, and practice are briefly discussed below.
5.6.1. SE Theory Implications
The SE field lacks a theoretical underpinning. Methods and approaches are proposed based on heuristics, rather than a strong grounding in evidence, whether mathematical or experimental. This is worrisome, as it leaves the door open for vastly different interpretations about the fundamental topics that are needed to understand SE. It would be unwise to form a theory on a “flash in the pan” or “buzzword” topic. This study identifies topics that were once frequently seen in literature, and perhaps thought of as a critical topic to the field, but have dropped in frequency (such as Taguchi’s method). While other topics were identified, such as MBSE, that have grown rapidly in frequency. Other topics were identified as being consistent, with a relatively high frequency, in SE literature (complexity, optimization, etc.). If a theory of SE is to be formed, it should incorporate the principles and problems addressed by topics that are consistently present in SE literature. This study contributes to SE theory by identifying topics that are consistently present in literature that may provide an area of research that a SE theory or theories should address.
5.6.2. SE Research Implications
The SE research community is diverse and complex due to the vast breadth of challenges that SE is tasked to address. It is often difficult to identify challenges and topics that have a long history of being addressed in SE, those that are becoming challenges, and those that are no longer of interest to the research community. Researching meaningful challenges/topics is important in terms of acceptance into journals, obtaining funding, and establishing an impactful lab. Topics that have consistently been frequent in SE literature (complexity, optimization, reliability, etc.) may be topics that are viewed as important to the SE community, and ones that would support researching. Topics that are on the rise, in terms of frequency, may need researchers to properly investigate their effectiveness/relevance, such as MBSE. Additionally, there may be some topics that researchers think are not seen frequently enough in literature, which may be viewed as a research gap. This study contributes to SE research by identifying topics with high frequency or increasing frequency in SE literature that researchers may consider investigating, as well as low frequency topics that may indicate a research gap.
5.6.3. SE Practice Implications
SE practitioners are constantly adopting new tools to improve their efficacy and efficiency. However, it is challenging for practitioners to determine what tools to adopt, as each comes with training and a learning curve. While the benefits and costs should be analyzed for each tool, it is initially difficult to determine what tools are becoming frequent and what tools are disappearing from literature. Identifying topics that are gaining or losing frequency in literature may alert practitioners to investigate the topics in more depth. This would enable the practitioners to cut ties with a topic/tool that may have been shown to have flaws, or to adopt a topic/tool that the SE community is excited about and which may be seen in future contracts, such as MBSE. This study contributes to SE practice by identifying topics with decreasing and increasing frequencies that practitioners may want to investigate for adoption or rejection.
5.7. Limitations
This study presents two main limitations, discussed in two separate subsections. The first limitation pertains to the choice of journals and the span of years used for the analyses. The second limitation concerns the context of the topics being discussed in the articles.
5.7.1. Choice of Journals and Years
This study analyzed literature from only four journals. The authors chose systems and design engineering journals with broad scopes. Broad-scope journals were selected to understand the general landscape of the communities. The authors did not consider journals that cater to more specific application domains, such as aerospace SE, or to specific aspects of SE, such as engineering management. Specific topics may dominate these journal types, injecting bias. The number of broad-scope journals was restricted by the availability of data and/or usage rights.
Furthermore, the application of SE in contexts that are better suited for discipline-specific journals were not considered. For example, application of SE tools in board game design that may appear in a journal on gaming is outside of the boundaries of acceptable journals. This was primarily performed to reduce the noise from non-relevant papers. These discipline-specific papers published in non-SE related journals could be included by implementing a broad search for SE papers in any journals, and then conducting the analysis on that set of papers.
In addition to the number of journals, a secondary limitation was the years considered for the analysis of trends. The authors analyzed papers from the four journals over a period of 19 years, from 1998 to 2016. The inclusion of additional years would have enriched the results, especially with regards to the latest SE research. The analyses were also limited by the availability of papers. For instance, the papers published in the Wiley Systems Engineering journal after the year 2016 were neither open access nor were they available in the authors’ university database. Similarly, the usage of papers published before the year 1998 was limited by the machine-readability of the papers. Before 1998, the papers were predominantly scanned copies, which made it impossible to analyze the papers in NVivo without transcription or using optical character recognition software and reviewing for errors. Despite this limitation, the authors believe that the 19-year range is acceptable for the analysis as changes were captured in the results, such as the increase in digitalization and complexity.
5.7.2. Context of Topics in Articles
This study did not consider the context in which the topics were discussed. This may have an impact on the results observed in the study. For example, although a topic may show significant presence in an article, the topic may only be addressed in the background or in a negative context. Similarly, an article may use principles from a topic, but not mention the topic repeatedly. Additionally, when new approaches are created, articles discussing these topics will mention the drawbacks of older topics. For example, requirements will occur very frequently when VDD is nascent, as VDD papers commonly criticize the status quo. Point-based design is likely to occur very frequently in early set-based design and tradespace exploration papers. When the next approach comes, it will then criticize the limitations of tradespace, set-based design, and VDD. Furthermore, the analyses only used the keywords directly associated with a topic and not the broader area the topics were categorized under, as discussed in Section 3.3. In addition, consistency in the definition of a topic in the papers was not sought, only the occurrence of the keywords.
To examine this possible limitation of using keywords, five articles were randomly selected from the collection of data. For each article, the authors of this study identified the primary topics of the article, and represented the topics using keywords. For each article, a simple NVivo word frequency query using default parameters was performed. The most frequent words from the query were compared to the list of identified keywords. Table 15 details the results of this comparison. In Table 15, the “keywords describing article” words identified by the authors are not listed in any particular order, whereas the “word frequency query results” are listed in the order of frequency with the most frequent being first.
It was observed that for four of the five articles, the keywords identified by the authors were consistent with the most frequent keywords identified by the software. This observation provides justification for the methodology used in this study. One of the five articles did not demonstrate a consistency between keywords. In this article, game theory and principal-agent theory were used to create games and develop best strategies for quality control in supply chains by considering two players—a supplier and a buyer. Although a key topic in the article was game theory, the words “game theory” were infrequently mentioned. For this randomly selected article, “game theory” was not present in the top 50 frequent words identified in the query. While limitations of the study therefore exist, the randomized sample from Table 15 shows that frequency analyses can correspond with the essence of the articles in the data set.
6. Conclusions and Future Work
6.1. Conclusions
This paper examined the trends in occurrences of numerous SE topics for the years 1998–2016. A content analysis was performed on SE and design engineering peer-reviewed literature. Keywords were identified for each topic, and a text search was performed to evaluate the frequencies of occurrences of the keywords. Two methods of normalizing the data were used to avoid biases, and no significant differences in results between the two methods were observed. From the summary of the results shown in Table 9, changes in ranks of topics from the start to the end of the period under consideration were observed. The greatest changes in ranks were seen for SysML, resilience, and IPT, where the ranks of the first two increased by more than 20, and the rank of IPT dropped by more than 20. Other topics, such as game theory and MBSE, also saw a significant increase in ranks through the years, and topics such as Pugh and Taguchi saw a significant drop. Complexity, availability, reliability, and risk matrix saw no changes in ranks between the initial and final years. Affordability and safety did not have high ranks, even with the increasing costs and complexities of systems. Lower rankings seen in this study may also be due to articles on those topics being published in journals dedicated to the specific topics, such as “Safety” related articles being published in the Journal of Safety Research.
In recent years, the SE and design engineering communities have been merged, as seen at NSF, and have addressed each other’s topics at their respective conferences, such as Systems Engineering Information Knowledge Management sessions [70] at American Society of Mechanical Engineers International Design Engineering Technical Conferences 2018 and Decisions, Control, and Design sessions [71,72] at Conference on Systems Engineering Research 2018. The results in this research indicated similarities and differences between the SE and design engineering communities. Further research into these findings is necessary in order to determine if these two communities are as similar, or as dissimilar, as believed.
6.2. Future Work
This study has provided a first step in an evidence-based, large-scale analysis, in terms of time and topics, of SE topics. As discussed in the practical implications section, the grounding in evidence provides a starting point to address complicated SE questions, such as “What SE topics should be addressed in a SE theory?” “What SE topics should researchers consider investigating?” and “What SE topics should practitioners consider adopting, or renounce?” Future work should dissect these questions further, and provide evidence to support the conclusions. For SE theory, the topics identified in this study as having a high, consistent frequency in literature can be investigated for any underlying theories that may provide a starting point for a theory or theories of SE. The academic community should investigate why identified SE topics have a low relative frequency in literature. Is this because research is needed, signaling a research gap? Is there disagreement within the community about the relevance of a topic? The practicing community should investigate topics that have increasing or decreasing frequencies to determine their benefits and costs. For all of these analyses, the future research would start with the findings of this paper, grounding the research in evidence.
The analysis of the study can be improved by addressing the topics of the limitations section in future work. The number of journals and years investigated can be expanded to include more of the community over a longer time scale. The results of this paper suggest future work to gain a deeper contextual understanding of the topics’ occurrences. A review of the noteworthy trends, such as Taguchi, QFD, complexity, and SysML, and a deeper study of the data in them will detail the context that the approaches are being presented in the journals. It will also be interesting to see if there is an increased presence of the topics mentioned in the 2025 vision report in the upcoming years.
Author Contributions
G.B. performed the research, literature review, and analyses. The article was primarily written by G.B. with edits and suggestions by B.M. B.M. conceptualized and supervised the research and article as part of a doctoral program.
Funding
This research received no external funding.
Acknowledgments
The authors would like to acknowledge Alejandro Salado for his insight on the research.
Conflicts of Interest
The authors declare no conflict of interest.
Appendix A

Table A1.
List of keywords for systems engineering (SE) approaches.
| Approach | Keywords |
|---|---|
| Analytical Hierarchy Process (AHP) | “AHP” “Analytic Hierarchy Process” “Analytic Hierarchical Procedure” “Analytical Hierarchy Process” “Analytical Hierarchical Process” “Analytical Hierarchical Procedure” |
| Quality Function Deployment (QFD) | “QFD” “Quality Function Deployment” “House Of Quality” |
| Pugh | “Pugh” |
| Six Sigma | “Six Sigma” “6 Sigma” “6 S” |
| Game Theory | “Games” “Game” |
| Taguchi | “Taguchi” |
| Systems Modeling Language (SysML) | “SysML” “Systems Modeling Language” “Systems Modelling Language” |
| Agile | “Agile” |
| Model-Based Systems Engineering (MBSE) | “Model-Based Systems Engineering” “Model Based Systems Engineering” “MBSE” “Model-Driven Engineering” “Model-Driven Systems Engineering” |
| Lean | “Lean” |
| Value-Driven Design (VDD) | “Value-Driven” “Value-Based” “Value-Centric” “Value-Focused” “Value-Derived” |
| Axiomatic Design | “Axiomatic Design” |
| Utility Theory | “Utility Theory” “SEU” “Expected Utility” |
| Fuzzy Logic | “Fuzzy Logic” “Fuzzy Set Theory” “Fuzzy Sets” “Fuzzy Set” “Fuzzy” |
| Digital Twin | “Digital Twin” “Digital Engineering” “Digital Thread” |
| Optimization | “Optimization” “Optimized” “Optimize” “Optimal” “Optimum” “Optimizer” |
| Failure Modes And Effect Analysis (FMEA) | “Failure Modes And Effects Analysis” “Failure Mode And Effect Analysis” “Failure Mode Effects Analysis” “Failure Modes Effects Analysis” “Failure Mode And Effects Analysis” “Failure Modes And Effects Analysis” “FMEA” “Failure Modes Effects And Criticality Analysis” “FMECA” “Failure Effects And Modes Analysis” “FEMA” |
| Requirements Verification And Traceability Matrix (RVTM) | “Requirements Traceability Matrix” “RTM” “Requirements Verification And Traceability Matrix” “RVTM” “Traceability Matrix” “Trace Matrix” “Verification Requirements Traceability Matrix” “VRTM” |
| Integrated Product Teams (IPT) | “Integrated Product Team” “Integrated Product Teams” “IPT” “IPTs” |
| Risk Matrix | “Risk Matrix” “Risk Assessment Matrix” “Risk Matrices” “Risk Assessment Matrices” |
| N2 Diagram | “N2 Diagram” “N2 Chart” “N-Squared Diagram” “N-Squared Chart” “N2 Matrix” “N*N Matrix” “N*N Diagram” “N*N Chart” “N-Squared Matrix” “Design Structure Matrix” “DSM” “Dependency Structure Matrix” |
| Reliability | “Reliability” |
| Robustness | “Robustness” “Robust” |
| Complexity | “Complexity” “Complex” “Complexities” |
| Maintainability | “Maintainability” “Maintainable” |
| Sustainability | “Sustainability” “Sustainable” |
| Affordability | “Affordability” “Affordable” |
| Availability | “Availability” “Available” |
| Resilience | “Resilience” “Resilient” |
| Adaptability | “Adaptability” “Adaptable” |
| Modularity | “Modularity” “Modular” |
| Quality | “Quality” |
| Durability | “Durability” |
| Manufacturability | “Manufacturability” “Manufacturable” |
| Safety | “Safety” |
| Flexibility | “Flexibility” |
| Scalability | “Scalability” “Scalable” |
| Usability | “Usability” “Usable” |
| Interoperability | “Interoperability” “Interoperable” |
| Testability | “Testability” “Testable” |
| Extensibility | “Extensibility” “Extensible” |
| Agility | “Agility” |
| Repairability | “Repairability” “Repairable” |
| Evolvability | “Evolvability” “Evolvable” |
| Modifiability | “Modifiability” “Modifiable” |
Table A2.
Distribution of papers by year.
| Journal | Wiley SE | SS & SE | JOED | RED | |
|---|---|---|---|---|---|
| Year | |||||
| 1998 | 17 | 0 | 12 | 16 | |
| 1999 | 21 | 0 | 24 | 17 | |
| 2000 | 20 | 0 | 23 | 19 | |
| 2001 | 24 | 0 | 25 | 4 | |
| 2002 | 27 | 0 | 26 | 11 | |
| 2003 | 21 | 34 | 24 | 10 | |
| 2004 | 24 | 27 | 34 | 12 | |
| 2005 | 25 | 29 | 33 | 15 | |
| 2006 | 21 | 34 | 33 | 14 | |
| 2007 | 21 | 32 | 37 | 10 | |
| 2008 | 24 | 31 | 35 | 15 | |
| 2009 | 19 | 27 | 34 | 18 | |
| 2010 | 28 | 25 | 36 | 22 | |
| 2011 | 30 | 29 | 40 | 17 | |
| 2012 | 35 | 25 | 52 | 20 | |
| 2013 | 35 | 28 | 39 | 29 | |
| 2014 | 32 | 25 | 16 | 22 | |
| 2015 | 43 | 22 | 21 | 19 | |
| 2016 | 36 | 27 | 25 | 23 | |
Table A3.
Distribution of total number of words by year.
| Journal | Wiley SE | SS & SE | JOED | RED | |
|---|---|---|---|---|---|
| Year | |||||
| 1998 | 185,683 | 0 | 41,485 | 147,291 | |
| 1999 | 135,381 | 0 | 67,109 | 149,015 | |
| 2000 | 153,768 | 0 | 151,128 | 153,147 | |
| 2001 | 150,339 | 0 | 145,372 | 50,684 | |
| 2002 | 103,878 | 0 | 109,295 | 100,404 | |
| 2003 | 151,403 | 134,406 | 118,044 | 94,889 | |
| 2004 | 185,013 | 216,017 | 227,277 | 122,909 | |
| 2005 | 199,979 | 219,183 | 235,908 | 122,909 | |
| 2006 | 195,501 | 215,576 | 237,280 | 147,894 | |
| 2007 | 205,864 | 218,106 | 242,542 | 119,126 | |
| 2008 | 211,034 | 136,972 | 246,702 | 143,766 | |
| 2009 | 177,934 | 176,316 | 291,501 | 151,027 | |
| 2010 | 251,685 | 119,341 | 334,643 | 181,761 | |
| 2011 | 284,611 | 214,530 | 371,521 | 207,904 | |
| 2012 | 306,817 | 139,207 | 494,359 | 229,333 | |
| 2013 | 317,529 | 119,546 | 402,176 | 313,292 | |
| 2014 | 305,437 | 78,750 | 176,858 | 236,029 | |
| 2015 | 123,742 | 233,196 | 215,512 | 232,990 | |
| 2016 | 371,174 | 218,225 | 276,621 | 251,775 | |
Table A4.
Distribution of total number of keywords by year.
| Journal | Wiley SE | SS & SE | JOED | RED | |
|---|---|---|---|---|---|
| Year | |||||
| 1998 | 1077 | 0 | 291 | 697 | |
| 1999 | 959 | 0 | 422 | 963 | |
| 2000 | 710 | 0 | 1234 | 1070 | |
| 2001 | 881 | 0 | 798 | 224 | |
| 2002 | 854 | 0 | 976 | 332 | |
| 2003 | 919 | 1624 | 869 | 463 | |
| 2004 | 1656 | 1054 | 1709 | 366 | |
| 2005 | 1598 | 1332 | 2274 | 1181 | |
| 2006 | 1190 | 1660 | 2361 | 736 | |
| 2007 | 1915 | 1160 | 1704 | 922 | |
| 2008 | 1885 | 1655 | 2409 | 693 | |
| 2009 | 1300 | 1180 | 1537 | 600 | |
| 2010 | 1779 | 1101 | 2065 | 1177 | |
| 2011 | 2479 | 1274 | 1634 | 1164 | |
| 2012 | 2008 | 1778 | 3597 | 1188 | |
| 2013 | 2737 | 1362 | 3463 | 1112 | |
| 2014 | 3055 | 1727 | 1006 | 1589 | |
| 2015 | 4080 | 2055 | 1697 | 1559 | |
| 2016 | 3511 | 1250 | 1819 | 1592 | |
References
- Haskins, C.; Forsberg, K.; Krueger, M.; Walden, D.; Hamelin, D. Systems Engineering Handbook; INCOSE: San Diego, CA, USA, 2006. [Google Scholar]
- Royce, W.W. Managing the development of large software systems: Concepts and techniques. In Proceedings of the 9th International Conference on Software Engineering, Monterey, CA, USA, 30 March–2 April 1987; pp. 328–338. [Google Scholar]
- Boehm, B.W. A spiral model of software development and enhancement. Computer 1988, 21, 61–72. [Google Scholar] [CrossRef]
- Griffin, M.D. How do we fix systems engineering? In Proceedings of the 61st International Astronautical Congress, Prague, Czech Republic, 27 September–1 October 2010; pp. 1–9. [Google Scholar]
- Hazelrigg, G.A. Systems Engineering: An Approach to Information-Based Design; Prentice Hall: Upper Saddle River, NJ, USA, 1996. [Google Scholar]
- Nuseibeh, B.; Easterbrook, S. Requirements engineering: A roadmap. In Proceedings of the Conference on the Future of Software Engineering, Limerick, Ireland, 4–11 June 2000; pp. 35–46. [Google Scholar]
- Collopy, P.D.; Hollingsworth, P.M. Value-driven design. J. Aircr. 2011, 48, 749–759. [Google Scholar] [CrossRef]
- Collopy, P.; Bloebaum, C.; Mesmer, B.; Green, L. The distinct and interrelated roles of value-driven design, multidisciplinary design optimization, and decision analysis. In Proceedings of the 12th AIAA Aviation Technology, Integration, and Operations (ATIO) Conference and 14th AIAA/ISSMO Multidisciplinary Analysis and Optimization Conference, Indianapolis, Indiana, 17–19 September 2012; p. 5575. [Google Scholar]
- Delligatti, L. SysML Distilled: A Brief Guide to the Systems Modeling Language; Addison-Wesley: Boston, MA, USA, 2013. [Google Scholar]
- Friedenthal, S.; Moore, A.; Steiner, R. A Practical Guide to SysML: The Systems Modeling Language; Morgan Kaufmann: Burlington, MA, USA, 2014. [Google Scholar]
- Sobieszczanski-Sobieski, J. Multidisciplinary design optimization: An emerging new engineering discipline. In Advances in Structural Optimization; Springer: Berlin, Germany, 1995; pp. 483–496. [Google Scholar]
- Sobieszczanski-Sobieski, J.; Haftka, R.T. Multidisciplinary aerospace design optimization: Survey of recent developments. Struct. Optim. 1997, 14, 1–23. [Google Scholar] [CrossRef]
- Chapanis, A.; Garner, W.R.; Morgan, C.T. Applied Experimental Psychology: Human Factors in Engineering Design; John Wiley & Sons Inc.: Hoboken, NJ, USA, 1949. [Google Scholar]
- Sage, A.P.; Rouse, W.B. Handbook of Systems Engineering and Management; John Wiley & Sons: Hoboken, NJ, USA, 2009. [Google Scholar]
- Tilbury, “Dear Colleague Letter: Announcing Creation of the Engineering Design and Systems Engineering (EDSE) Program which Merges and Replaces the Engineering and Systems Design (ESD), System Science (SYS), and Design of Engineering Material Systems (DEMS) Programs”, National Science Foundation, 26-Sep-2017. Available online: https://www.nsf.gov/pubs/2017/nsf17146/nsf17146.jsp (accessed on 28 May 2019).
- Wasson, C.S. System Engineering Analysis, Design, and Development: Concepts, Principles, and Practices; John Wiley & Sons: Hoboken, NJ, USA, 2015. [Google Scholar]
- Monell, D.W.; Piland, W.M. Aerospace systems design in NASA’s collaborative engineering environment. Acta Astronaut. 2000, 47, 255–264. [Google Scholar] [CrossRef]
- Kapurch, S.J. NASA Systems Engineering Handbook; Diane Publishing: Collingdale, PA, USA, 2010. [Google Scholar]
- Dahmann, J.S.; Baldwin, K.J. Understanding the current state of US defense systems of systems and the implications for systems engineering. In Proceedings of the 2008 2nd Annual IEEE Systems Conference, Montreal, QC, Canada, 7–10 April 2008; pp. 1–7. [Google Scholar]
- Piaszczyk, C. Model based systems engineering with department of defense architectural framework. Syst. Eng. 2011, 14, 305–326. [Google Scholar] [CrossRef]
- Meier, S.R. Best project management and systems engineering practices in the preacquisition phase for federal intelligence and defense agencies. Proj. Manag. J. 2008, 39, 59–71. [Google Scholar] [CrossRef]
- Dahmann, J.S. Systems engineering for department of defense systems of systems. In System of Systems Engineering: Innovations for the 21st Century; John Wiley & Sons: Hoboken, NJ, USA, 2008; pp. 218–231. [Google Scholar]
- Freund, E. ISO/IEC 15288: 2002, Systems Engineering-System Life-Cycle Processes. Softw. Qual. Prof. 2005, 8, 42–43. [Google Scholar]
- Shen, W.; Hao, Q.; Mak, H.; Neelamkavil, J.; Xie, H.; Dickinson, J.; Thomas, R.; Pardasani, A.; Xue, H. Systems integration and collaboration in architecture, engineering, construction, and facilities management: A review. Adv. Eng. Inform. 2010, 24, 196–207. [Google Scholar] [CrossRef] [Green Version]
- Saurin, T.A.; Formoso, C.T.; Cambraia, F.B. An analysis of construction safety best practices from a cognitive systems engineering perspective. Saf. Sci. 2008, 46, 1169–1183. [Google Scholar] [CrossRef]
- Kamara, J.M.; Augenbroe, G.; Anumba, C.J.; Carrillo, P.M. Knowledge management in the architecture, engineering and construction industry. Constr. Innov. 2002, 2, 53–67. [Google Scholar] [CrossRef]
- Morgan, J.M.; Liker, J.K. The Toyota Product Development System; Productivity Press: New York, NY, USA, 2006; Volume 13533. [Google Scholar]
- Sobek, D.K., II; Ward, A.C.; Liker, J.K. Toyota’s principles of set-based concurrent engineering. MIT Sloan Manag. Rev. 1999, 40, 67. [Google Scholar]
- Mohanty, R.P.; Yadav, O.P.; Jain, R. Implementation of lean manufacturing principles in auto industry. Vilakshan–XIMB J. Manag. 2007, 1, 1–32. [Google Scholar]
- Fanjiang, G.; Grossman, J.H.; Compton, W.D.; Reid, P.P. Building a Better Delivery System: A New Engineering/Health Care Partnership; National Academies Press: Washington, DC, USA, 2005. [Google Scholar]
- Kopach-Konrad, R.; Lawley, M.; Criswell, M.; Hasan, I.; Chakraborty, S.; Pekny, J.; Doebbeling, B.N. Applying systems engineering principles in improving health care delivery. J. Gen. Intern. Med. 2007, 22, 431–437. [Google Scholar] [CrossRef] [PubMed]
- Rouse, W.B.; Cortese, D.A. Engineering the System of Healthcare Delivery; IOS Press: Amsterdam, The Netherlands, 2010; Volume 153. [Google Scholar]
- Fernandez, F.; Pallis, G.C. Opportunities and challenges of the Internet of Things for healthcare: Systems engineering perspective. In Proceedings of the 2014 4th International Conference on Wireless Mobile Communication and Healthcare-Transforming Healthcare Through Innovations in Mobile and Wireless Technologies (MOBIHEALTH), Athens, Greece, 3–5 November 2014; pp. 263–266. [Google Scholar]
- Jamshidi, M. Systems of Systems Engineering: Principles and Applications; CRC Press: Boca Raton, FL, USA, 2008. [Google Scholar]
- Dreher, M.R.; Chilkoti, A. Toward a Systems Engineering Approach to Cancer Drug Delivery; Oxford University Press: Oxford, UK, 2007. [Google Scholar]
- Valdez, R.S.; Ramly, E.; Brennan, P.F. Final Report: Industrial and Systems Engineering and Health Care: Critical Areas of Research; Publication No. 10-0079-EF; Agency for Healthcare Research and Quality: Rockville, ML, USA, 2010. [Google Scholar]
- Świerniak, A.; Kimmel, M.; Smieja, J.; Puszynski, K.; Psiuk-Maksymowicz, K. System Engineering Approach to Planning Anticancer Therapies; Springer: Berlin, Germany, 2016. [Google Scholar]
- Sheard, S.A. Evolution of systems engineering scholarship from 2000 to 2015, with particular emphasis on software. Syst. Eng. 2018, 21, 152–171. [Google Scholar] [CrossRef]
- Engineering Village. Engineering Village—Compendex and Inspec. 17 October 2018. Available online: https://www.engineeringvillage.com/search/quick.url (accessed on 17 October 2018).
- Boehm, B. Some future trends and implications for systems and software engineering processes. Syst. Eng. 2006, 9, 1–19. [Google Scholar] [CrossRef]
- Broniatowski, D.A. Building the tower without climbing it: Progress in engineering systems. Syst. Eng. 2018, 21, 259–281. [Google Scholar] [CrossRef]
- Kitchenham, B.; Brereton, O.P.; Budgen, D.; Turner, M.; Bailey, J.; Linkman, S. Systematic literature reviews in software engineering—A systematic literature review. Inf. Softw. Technol. 2009, 51, 7–15. [Google Scholar] [CrossRef]
- Kitchenham, B.; Pretorius, R.; Budgen, D.; Brereton, O.P.; Turner, M.; Niazi, M.; Linkman, S. Systematic literature reviews in software engineering—A tertiary study. Inf. Softw. Technol. 2010, 52, 792–805. [Google Scholar] [CrossRef]
- Rech, J. Discovering trends in software engineering with google trend. ACM SIGSOFT Softw. Eng. Notes 2007, 32, 1–2. [Google Scholar] [CrossRef]
- Coulter, N.; Monarch, I.; Konda, S. Software engineering as seen through its research literature: A study in co-word analysis. J. Am. Soc. Inf. Sci. 1998, 49, 1206–1223. [Google Scholar] [CrossRef]
- Line, N.D.; Runyan, R.C. Hospitality marketing research: Recent trends and future directions. Int. J. Hosp. Manag. 2012, 31, 477–488. [Google Scholar] [CrossRef]
- Chon, K.-S.; Evans, M.R.; Sutherlin, D. Trends in hospitality management literature: A content analysis. Hosp. Educ. Res. J. 1989, 13, 483–491. [Google Scholar] [CrossRef]
- Sainaghi, R.; Phillips, P.; Zavarrone, E. Performance measurement in tourism firms: A content analytical meta-approach. Tour. Manag. 2017, 59, 36–56. [Google Scholar] [CrossRef]
- De Weck, O.L.; Ross, A.M.; Rhodes, D.H. Investigating Relationships and Semantic Sets amongst System Lifecycle Properties (Ilities); CESUN, Delft University of Technology: Delft, The Netherlands, 2012. [Google Scholar]
- Ross, A.M.; Rhodes, D.H.; Hastings, D.E. Defining changeability: Reconciling flexibility, adaptability, scalability, modifiability, and robustness for maintaining system lifecycle value. Syst. Eng. 2008, 11, 246–262. [Google Scholar] [CrossRef] [Green Version]
- Hazelrigg, G.A. Fundamentals of Decision Making for Engineering Design and Systems Engineering, 1st ed.; Pearson Education: London, UK, 2012. [Google Scholar]
- QSR International Pty Ltd. NVivo Qualitative Data Analysis Software; Version 10; QSR International Pty Ltd.: Doncaster, Australia, 2012. [Google Scholar]
- Newson, R. Parameters behind ‘nonparametric’ statistics: Kendall’s tau, Somers’ D and median differences. Stata J. 2002, 2, 45–64. [Google Scholar] [CrossRef]
- Mayers, A. Introduction to Statistics and SPSS in Psychology; Pearson Higher Ed.: Harlow, UK, 2013. [Google Scholar]
- Roedler, G.J.; Jones, C. Technical Measurement; Technical Measurement, INCOSE, Lockhead Martin Corporation: San Diego, CA, USA, 2005; Volume 12. [Google Scholar]
- Blanchard, B.S.; Fabrycky, W.J.; Fabrycky, W.J. Systems Engineering and Analysis; Prentice Hall: Englewood Cliffs, NJ, USA, 1990; Volume 4. [Google Scholar]
- Taguchi, G. Introduction to Quality Engineering: Designing Quality into Products and Processes; Quality Resources: Clearwater, FL, USA, 1986. [Google Scholar]
- Suh, N.P. Axiomatic Design: Advances and Applications (the Oxford Series on Advanced Manufacturing); Oxford University Press: Oxford, UK, 2001. [Google Scholar]
- Tsui, K.-L. A critical look at Taguchi’s modelling approach for robust design. J. Appl. Stat. 1996, 23, 81–96. [Google Scholar] [CrossRef]
- Kim, Y.J.; Cho, B.R. Economic considerations on parameter design. Qual. Reliab. Eng. Int. 2000, 16, 501–514. [Google Scholar] [CrossRef]
- Maghsoodloo, S.; Ozdemir, G.; Jordan, V.; Huang, C.-H. Strengths and limitations of Taguchi’s contributions to quality, manufacturing, and process engineering. J. Manuf. Syst. 2004, 23, 73–126. [Google Scholar] [CrossRef]
- Frey, D.D.; Jahangir, E.; Engelhardt, F. Computing the information content of decoupled designs. Res. Eng. Des. 2000, 12, 90–102. [Google Scholar] [CrossRef]
- Fan, L.X.; Cai, M.Y.; Lin, Y.; Zhang, W.J. Axiomatic design theory: Further notes and its guideline to applications. Int. J. Mater. Prod. Technol. 2015, 51, 359–374. [Google Scholar] [CrossRef]
- Olewnik, A.; Lewis, K. Limitations of the House of Quality to provide quantitative design information. Int. J. Qual. Reliab. Manag. 2008, 25, 125–146. [Google Scholar] [CrossRef] [Green Version]
- Van de Poel, I. Methodological problems in QFD and directions for future development. Res. Eng. Des. 2007, 18, 21–36. [Google Scholar] [CrossRef] [Green Version]
- OMG. OMG Systems Modeling Language (OMG SysMLTM); OMG: Needham, MA, USA, September 2015. [Google Scholar]
- Estefan, J.A. Survey of model-based systems engineering (MBSE) methodologies. Incose MBSE Focus Group 2007, 25, 1–12. [Google Scholar]
- Friedenthal, S.; Griego, R.; Sampson, M. INCOSE model based systems engineering (MBSE) initiative. In Proceedings of the INCOSE 2007 Symposium, San Diego, CA, USA, 24–28 June 2007; Volume 11. [Google Scholar]
- INCOSE. A World in Motion: Systems Engineering Vision 2025; International Council on Systems Engineering: San Diego, CA, USA, 2014. [Google Scholar]
- IDETC/CIE. CIE-17 Systems Engineering Information Knowledge Management (SEIKM): Systems Engineering; IDETC/CIE: Quebec City, Canada, 2018. [Google Scholar]
- Buchanan, R.; Richards, J.; Rinuado, C.; Goerger, S. Integrating Set-Based Design into Cost Analysis. In Proceedings of the 16th Annual Conference on Systems Engineering Research (CSER), Charlottesville, VA, USA, 8–9 May 2018. [Google Scholar]
- Moazeni, S.; Nilchiani, R.; Pugliese, A. Effects of Uncertain Requirements on the Design Selection Problem. In Proceedings of the 16th Annual Conference on Systems Engineering Research, Charlottesville, VA, USA, 8–9 May 2018. [Google Scholar]
| 1 | Ngram Viewer is a tool that plots the frequencies of search strings using a yearly count of n-grams found in books printed between 1500 and 2008 in multiple languages that are available in Google’s database. |
Figure 1.
Frequency trend plots for (a) durability; (b) resilience; (c) modularity; (d) quality; (e) safety; and (f) availability.
Figure 1.
Frequency trend plots for (a) durability; (b) resilience; (c) modularity; (d) quality; (e) safety; and (f) availability.


Figure 2.
Frequency trend plots for (a) Taguchi; (b) axiomatic design; (c) DSM; (d) integrated product teams (IPT); (e) systems modeling language (SysML); and (f) model-based systems engineering (MBSE).
Figure 2.
Frequency trend plots for (a) Taguchi; (b) axiomatic design; (c) DSM; (d) integrated product teams (IPT); (e) systems modeling language (SysML); and (f) model-based systems engineering (MBSE).

Figure 3.
Comparison of the trends for “safety” between (a) Wiley Systems Engineering journal and (b) Journal of Engineering Design.
Figure 3.
Comparison of the trends for “safety” between (a) Wiley Systems Engineering journal and (b) Journal of Engineering Design.

Figure 4.
Year versus frequency plot for seven highest ranked “ilities.”

Figure 5.
Google Ngram Viewer results for quality function deployment (QFD).

Table 1.
List of systems engineering (SE) topics and their categorization into standard SE processes.
Table 1.
List of systems engineering (SE) topics and their categorization into standard SE processes.

Table 2.
List of journals and corresponding years of data availability.
| Journal | Years of Availability |
|---|---|
| Wiley SE—Wiley Systems Engineering | 1998–2016 |
| SS & SE—Springer Journal of Systems Science and Systems Engineering | 2003–2016 |
| JOED—Journal of Engineering Design | 1998–2016 |
| RED—Research in Engineering Design | 1998–2016 |
Table 3.
Summary of average change in frequencies of topics (normalization using total number of words).
Table 3.
Summary of average change in frequencies of topics (normalization using total number of words).
| Order of Magnitude of Initial Frequencies | |||||
|---|---|---|---|---|---|
| Game Theory Adaptability MBSE | Resilience Evolvability VDD | SysML Repairability Modifiability Digital twin | |||
| Fuzzy sets | AHP Affordability Modularity Flexibility DSM | Durability | |||
| Scalability Interoperability | Risk matrix | ||||
| Reliability Sustainability Optimization | Maintainability Lean Usability | ||||
| Complexity | Robustness Availability | Manufacturability Extensibility Agility Utility theory FMEA | Testability | ||
| Quality | QFD Safety | SixSigma Agile | |||
| Taguchi Axiomatic design | Pugh RVTM IPT | ||||
Table 4.
Summary of average change in frequencies of topics (normalization using total number of keywords).
Table 4.
Summary of average change in frequencies of topics (normalization using total number of keywords).
| Order of Magnitude of Initial Frequencies | |||||||
|---|---|---|---|---|---|---|---|
| Game Theory MBSE Adaptability | Resilience Evolvability | SysML Repairability Modifiability Digital twin | |||||
| Modularity | VDD | ||||||
| Fuzzy sets DSM | AHP Affordability Flexibility | Durability | |||||
| Optimization | Scalability Interoperability | Risk matrix | |||||
| Sustainability | Reliability | Maintainability Usability FMEA | |||||
| Complexity | Robustness Availability | Six Sigma Lean Agility Utility Theory | Testability | ||||
| Quality Safety | QFD Taguchi Axiomatic Design IPT | Pugh Agile Manufacturability Extensibility RVTM | |||||
 —Topics that changed their row positions, as compared to Table 3 —Topics that changed their row positions, as compared to Table 3 | |||||||
Table 5.
Comparison of orders of magnitude of normalized frequencies of topics between journals (normalization using total number of words).
Table 5.
Comparison of orders of magnitude of normalized frequencies of topics between journals (normalization using total number of words).
| Topic | Journal | Topic | Journal | ||||||
|---|---|---|---|---|---|---|---|---|---|
| JOED | RED | SS & SE | Wiley | JOED | RED | SS & SE | Wiley | ||
| QFD | + | + | # | # | Resilience | # | ^ | # | + |
| Reliability | + | + | + | + | Adaptability | # | # | # | + |
| Robustness | + | + | + | + | Manufacturability | # | # | ^ | ^ |
| Complexity | + | + | * | * | Flexibility | # | # | + | + |
| Taguchi | + | # | # | # | Scalability | # | # | # | # |
| DSM | + | + | ! | + | Repairability | # | ! | ^ | ^ |
| Sustainability | + | # | + | + | Axiomatic design | # | + | ~ | # |
| Availability | + | + | + | + | Utility theory | # | # | # | # |
| Modularity | + | + | # | + | FMEA | # | # | ^ | # |
| Quality | + | + | + | + | IPT | # | ^ | ~ | # |
| Durability | + | # | # | ^ | Risk matrix | # | ^ | ! | # |
| Safety | + | + | + | + | Affordability | ^ | ^ | ^ | # |
| Usability | + | # | # | # | Interoperability | ^ | # | # | + |
| Fuzzy sets | + | + | * | + | Testability | ^ | ^ | ~ | ^ |
| Optimization | + | * | * | + | Extensibility | ^ | ^ | # | # |
| AHP | # | + | + | # | Agility | ^ | # | # | # |
| Pugh | # | + | ! | # | VDD | ^ | ^ | # | # |
| SixSigma | # | ^ | # | # | MBSE | ~ | ^ | ^ | + |
| Game Theory | # | + | + | + | Evolvability | ~ | ^ | ~ | # |
| SysML | # | # | ^ | + | Digital twin | ~ | ! | ~ | ~ |
| Agile | # | # | # | # | Modifiability | ! | ! | ! | ~ |
| Maintainability | # | # | # | # | RVTM | ! | ^ | ^ | # |
| Lean | # | # | # | + | |||||
| * | ^ | ||||||||
| + | ~ | ||||||||
| # | ! | ||||||||
Table 6.
Comparison of orders of magnitude of normalized frequencies of topics between journals (normalization using total number of keywords).
Table 6.
Comparison of orders of magnitude of normalized frequencies of topics between journals (normalization using total number of keywords).
| Topic | Journal | Topic | Journal | ||||||
|---|---|---|---|---|---|---|---|---|---|
| JOED | RED | SS & SE | Wiley | JOED | RED | SS & SE | Wiley | ||
| Complexity | * | * | * | * | Lean | # | # | # | + |
| Quality | * | * | * | * | Manufacturability | # | + | ^ | # |
| Optimization | * | * | * | + | Flexibility | # | # | + | + |
| QFD | + | + | # | + | Scalability | # | # | # | # |
| Game Theory | + | + | + | + | Interoperability | # | # | # | + |
| Reliability | + | + | + | + | Repairability | # | / | # | ^ |
| Robustness | + | + | + | + | VDD | # | ^ | # | # |
| Taguchi | + | + | # | # | Axiomatic design | # | + | ^ | # |
| Sustainability | + | # | + | + | Utility theory | # | # | # | # |
| Availability | + | + | + | FMEA | # | + | ^ | # | |
| Adaptability | + | # | # | + | IPT | # | ^ | ~ | # |
| Modularity | + | + | # | + | Risk matrix | # | ^ | / | # |
| Durability | + | # | # | ^ | Affordability | # | ^ | ^ | |
| Safety | + | + | + | + | Resilience | ^ | ^ | # | + |
| Usability | + | # | # | # | Testability | ^ | # | ~ | # |
| Fuzzy sets | + | + | + | Extensibility | ^ | # | # | # | |
| DSM | + | + | ^ | + | Agility | ^ | # | # | # |
| AHP | # | + | + | # | Evolvability | ^ | # | ^ | # |
| Pugh | # | + | / | # | Digital twin | ^ | / | ~ | ~ |
| Six Sigma | # | # | ^ | # | MBSE | ~ | ^ | # | + |
| SysML | # | # | ^ | + | Modifiability | / | / | / | ^ |
| Agile | # | # | # | # | RVTM | / | ^ | ^ | # |
| Maintainability | # | # | # | # | |||||
| * | ^ | $ | |||||||
| + | ~ | / | |||||||
| # | ! | ||||||||
Table 7.
Comparison of % change in average frequencies of topics between journals (normalization using total number of words).
Table 7.
Comparison of % change in average frequencies of topics between journals (normalization using total number of words).
| Topic | Journal | Topic | Journal | |||||||
|---|---|---|---|---|---|---|---|---|---|---|
| JOED | RED | SS and SE | Wiley | JOED | RED | SS and SE | Wiley | |||
| Six Sigma | * | ^ | $ | $ | Optimization | ^ | $ | ^ | # | |
| SysML | * | * | * | * | Reliability | ~ | ^ | # | # | |
| Agile | * | / | ~ | * | Durability | ~ | * | * | * | |
| MBSE | * | * | * | * | Manufacturability | ~ | $ | / | / | |
| Sustainability | * | * | ^ | ^ | Extensibility | ~ | / | / | ~ | |
| Adaptability | * | ~ | ^ | * | Modifiability | ! | ! | ! | * | |
| Modularity | * | # | + | * | RVTM | ! | * | $ | / | |
| Scalability | * | $ | # | * | Game Theory | $ | * | ~ | * | |
| Usability | * | # | ~ | Complexity | $ | ~ | ^ | # | ||
| Interoperability | * | / | # | # | Maintainability | $ | * | * | $ | |
| Agility | * | / | # | # | Affordability | $ | * | ^ | * | |
| Repairability | * | ! | $ | * | Availability | $ | ~ | ~ | ^ | |
| Evolvability | * | * | ! | * | QFD | / | / | * | ||
| Digital twin | * | ! | * | * | Pugh | / | ~ | ! | $ | |
| Risk Matrix | * | * | ! | $ | Taguchi | / | / | ! | $ | |
| Resilience | + | ^ | + | * | Lean | / | # | ~ | + | |
| Flexibility | + | * | $ | * | Quality | / | $ | $ | $ | |
| Fuzzy sets | + | ^ | ^ | $ | Safety | / | + | ~ | ~ | |
| Robustness | # | / | # | ^ | Axiomatic design | / | / | ! | ^ | |
| Testability | # | * | ! | ~ | Utility theory | / | / | $ | + | |
| VDD | # | * | * | * | FMEA | / | + | / | ~ | |
| DSM | # | * | ! | * | IPT | / | ! | * | / | |
| AHP | ^ | + | ~ | ^ | ||||||
| ! No change | ||||||||||
Table 8.
Comparison of % change in average frequencies of topics between journals (normalization using total number of keywords).
Table 8.
Comparison of % change in average frequencies of topics between journals (normalization using total number of keywords).
| Topic | Journal | Topic | Journal | ||||||||
|---|---|---|---|---|---|---|---|---|---|---|---|
| JOED | RED | SS & SE | Wiley | JOED | RED | SS & SE | Wiley | ||||
| SysML | * | * | * | / | Reliability | ~ | # | ^ | $ | ||
| Agile | * | / | $ | * | Durability | ~ | * | * | * | ||
| MBSE | * | * | * | + | Manufacturability | ~ | $ | / | / | ||
| Sustainability | * | * | $ | $ | Extensibility | ~ | / | / | / | ||
| Adaptability | * | ~ | $ | * | Optimization | ~ | $ | ~ | ~ | ||
| Modularity | * | # | ^ | * | Modifiability | ! | ! | ! | * | ||
| Scalability | * | / | # | * | RVTM | ! | * | $ | / | ||
| Interoperability | * | / | # | ^ | Game Theory | $ | + | $ | # | ||
| Agility | * | / | # | ~ | Complexity | $ | ~ | ~ | $ | ||
| Repairability | * | ! | $ | * | Maintainability | $ | * | * | / | ||
| Evolvability | * | * | / | # | Affordability | $ | * | $ | # | ||
| Digital twin | * | ! | * | * | Availability | $ | ^ | $ | ~ | ||
| Risk matrix | * | * | ! | $ | Quality | $ | $ | $ | / | ||
| Six Sigma | + | ~ | $ | / | QFD | / | / | * | / | ||
| Resilience | + | # | # | * | Pugh | / | ~ | ! | / | ||
| Flexibility | + | * | / | # | Taguchi | / | / | / | $ | ||
| Usability | + | # | / | / | Lean | / | # | $ | ~ | ||
| Fuzzy sets | + | # | $ | / | Safety | / | + | $ | |||
| Robustness | # | $ | ~ | $ | Axiomatic design | / | / | ! | $ | ||
| Testability | # | * | ! | / | Utility theory | / | / | / | ^ | ||
| VDD | # | * | * | * | FMEA | / | * | / | / | ||
| DSM | # | + | / | # | IPT | / | / | * | / | ||
| AHP | ~ | + | / | ~ | |||||||
| ! No change | |||||||||||
Table 9.
Summary of change in average ranks of topics.
| Topics | |||||
|---|---|---|---|---|---|
| * SysML | ~ Modularity | ~ Maintainability | / Lean | / FMEA | |
| * Resilience | ~ Durability | ! Complexity | / Sustainability | / Robustness | |
| + Evolvability | ~ Flexibility | ! Availability | / Quality | # Pugh | |
| + Game Theory | ~ Scalability | ! Reliability | / Testability | # Taguchi | |
| + MBSE | ~ DSM | ! Risk matrix | / Extensibility | # Agile | |
| + Adaptability | ~Interoperability | / Usability | / Agility | # QFD | |
| + Repairability | ~ AHP | / Modifiability | / Safety | # Axiomatic design | |
| ~ Optimization | ~ VDD | / Manufacturability | / Utility theory | # RVTM | |
| ~ Affordability | ~ Fuzzy sets | / Six sigma | / Digital twin | # IPT | |
| * Increase in rank > 20 | ^ Decrease in rank >20 | ||||
| + Increase in rank between 11 and 20 | # Decrease in rank between 11 and 20 | ||||
| ~ Increase in rank between 1 and 10 | / Decrease in rank between 1 and 10 | ||||
| ! No change in rank | |||||
Table 10.
Overall rank ordering of topics.
| Year | 1998 | 1999 | 2000 | 2001 | 2002 | 2003 | 2004 | 2005 | 2006 | 2007 | 2008 | 2009 | 2010 | 2011 | 2012 | 2013 | 2014 | 2015 | 2016 | Average |
|---|---|---|---|---|---|---|---|---|---|---|---|---|---|---|---|---|---|---|---|---|
| Complexity | 3 | 1 | 2 | 2 | 3 | 2 | 1 | 3 | 3 | 2 | 2 | 1 | 1 | 3 | 1 | 2 | 1 | 2 | 1 | 2 |
| Optimization | 1 | 2 | 5 | 3 | 2 | 1 | 2 | 1 | 1 | 1 | 1 | 3 | 2 | 2 | 2 | 1 | 2 | 1 | 2 | 2 |
| Quality | 2 | 3 | 1 | 1 | 4 | 3 | 3 | 2 | 2 | 3 | 3 | 2 | 5 | 1 | 3 | 6 | 3 | 6 | 4 | 3 |
| Availability | 4 | 4 | 5 | 5 | 5 | 6 | 5 | 6 | 6 | 5 | 5 | 4 | 3 | 4 | 4 | 4 | 4 | 4 | 5 | 5 |
| Reliability | 6 | 10 | 8 | 12 | 7 | 7 | 9 | 7 | 9 | 9 | 12 | 12 | 4 | 6 | 11 | 7 | 6 | 7 | 10 | 8 |
| Robustness | 11 | 6 | 4 | 7 | 9 | 8 | 12 | 4 | 7 | 4 | 8 | 7 | 12 | 13 | 8 | 9 | 12 | 3 | 9 | 8 |
| Safety | 9 | 5 | 3 | 4 | 1 | 11 | 7 | 8 | 10 | 15 | 16 | 6 | 7 | 10 | 12 | 8 | 13 | 14 | 12 | 9 |
| Fuzzy sets | 20 | 8 | 10 | 26 | 13 | 5 | 6 | 5 | 5 | 8 | 10 | 9 | 6 | 5 | 10 | 5 | 5 | 9 | 7 | 9 |
| DSM | 12 | 12 | 13 | 12 | 8 | 12 | 11 | 12 | 22 | 6 | 20 | 15 | 10 | 11 | 6 | 3 | 9 | 11 | 6 | 11 |
| Modularity | 20 | 15 | 16 | 9 | 6 | 4 | 4 | 12 | 14 | 13 | 9 | 20 | 16 | 16 | 5 | 12 | 14 | 13 | 3 | 12 |
| QFD | 8 | 7 | 7 | 8 | 10 | 10 | 13 | 15 | 12 | 7 | 11 | 16 | 13 | 9 | 18 | 18 | 15 | 17 | 19 | 12 |
| Game Theory | 22 | 25 | 28 | 24 | 34 | 9 | 20 | 10 | 4 | 12 | 6 | 11 | 16 | 17 | 9 | 20 | 17 | 12 | 11 | 16 |
| Sustainability | 5 | 25 | 17 | 30 | 19 | 19 | 17 | 19 | 17 | 18 | 17 | 5 | 21 | 12 | 7 | 10 | 16 | 16 | 18 | 16 |
| Flexibility | 14 | 18 | 15 | 23 | 15 | 13 | 16 | 21 | 24 | 10 | 7 | 13 | 25 | 18 | 19 | 11 | 21 | 5 | 13 | 16 |
| AHP | 35 | 12 | 18 | 27 | 12 | 21 | 10 | 9 | 8 | 11 | 22 | 22 | 20 | 15 | 22 | 13 | 8 | 21 | 23 | 17 |
| Usability | 23 | 20 | 20 | 10 | 13 | 19 | 14 | 22 | 24 | 20 | 24 | 17 | 9 | 14 | 13 | 21 | 22 | 19 | 20 | 18 |
| Taguchi | 14 | 11 | 11 | 6 | 25 | 16 | 14 | 11 | 15 | 14 | 19 | 21 | 34 | 21 | 24 | 31 | 18 | 31 | 20 | 19 |
| Pugh | 13 | 14 | 14 | 27 | 18 | 23 | 21 | 25 | 26 | 27 | 17 | 10 | 11 | 22 | 29 | 28 | 23 | 40 | 28 | 22 |
| Lean | 16 | 29 | 35 | 14 | 27 | 14 | 8 | 23 | 18 | 19 | 26 | 14 | 24 | 8 | 32 | 28 | 29 | 20 | 33 | 22 |
| Adaptability | 25 | 21 | 33 | 33 | 25 | 29 | 25 | 20 | 18 | 24 | 15 | 36 | 29 | 29 | 14 | 16 | 19 | 8 | 17 | 23 |
| Interoperability | 17 | 25 | 21 | 16 | 23 | 15 | 23 | 24 | 30 | 29 | 35 | 28 | 18 | 19 | 27 | 27 | 11 | 27 | 24 | 23 |
| Axiomatic design | 10 | 16 | 9 | 38 | 22 | 24 | 23 | 14 | 11 | 17 | 27 | 24 | 39 | 26 | 26 | 24 | 36 | 26 | 30 | 23 |
| FMEA | 25 | 22 | 12 | 38 | 11 | 22 | 27 | 16 | 26 | 32 | 33 | 25 | 19 | 24 | 17 | 22 | 26 | 30 | 27 | 24 |
| SysML | 35 | 37 | 38 | 38 | 42 | 39 | 40 | 32 | 13 | 34 | 13 | 8 | 14 | 7 | 16 | 15 | 7 | 25 | 15 | 25 |
| Maintainability | 19 | 22 | 21 | 16 | 31 | 26 | 18 | 18 | 29 | 37 | 34 | 32 | 25 | 19 | 33 | 23 | 31 | 18 | 22 | 25 |
| Manufacturability | 18 | 22 | 26 | 24 | 19 | 33 | 22 | 29 | 30 | 16 | 25 | 19 | 15 | 35 | 29 | 35 | 28 | 35 | 33 | 26 |
| Scalability | 29 | 29 | 26 | 15 | 34 | 29 | 19 | 28 | 28 | 34 | 23 | 30 | 34 | 32 | 24 | 28 | 20 | 24 | 16 | 26 |
| Agile | 29 | 9 | 38 | 34 | 27 | 27 | 29 | 31 | 16 | 21 | 30 | 34 | 23 | 27 | 15 | 26 | 31 | 32 | 25 | 27 |
| Resilience | 24 | 33 | 38 | 38 | 34 | 37 | 40 | 33 | 21 | 38 | 14 | 30 | 8 | 35 | 21 | 14 | 33 | 10 | 8 | 27 |
| Utility theory | 29 | 18 | 23 | 16 | 34 | 35 | 35 | 17 | 20 | 22 | 28 | 27 | 36 | 34 | 38 | 33 | 24 | 29 | 30 | 28 |
| SixSigma | 29 | 33 | 28 | 19 | 24 | 17 | 31 | 30 | 37 | 27 | 21 | 29 | 31 | 25 | 28 | 35 | 40 | 34 | 29 | 29 |
| MBSE | 35 | 36 | 18 | 27 | 19 | 31 | 40 | 41 | 40 | 40 | 37 | 38 | 22 | 23 | 20 | 17 | 10 | 22 | 26 | 29 |
| Affordability | 29 | 37 | 28 | 21 | 29 | 18 | 33 | 35 | 33 | 34 | 36 | 26 | 38 | 30 | 39 | 32 | 27 | 23 | 14 | 30 |
| Durability | 27 | 37 | 35 | 34 | 29 | 35 | 30 | 33 | 33 | 24 | 4 | 23 | 33 | 28 | 31 | 33 | 29 | 37 | 38 | 30 |
| Agility | 27 | 17 | 28 | 37 | 31 | 31 | 37 | 26 | 23 | 29 | 30 | 39 | 37 | 31 | 23 | 25 | 43 | 35 | 40 | 31 |
| Extensibility | 29 | 32 | 35 | 19 | 34 | 28 | 28 | 27 | 36 | 40 | 38 | 33 | 27 | 32 | 34 | 40 | 34 | 38 | 38 | 33 |
| VDD | 35 | 37 | 28 | 34 | 40 | 25 | 31 | 35 | 30 | 32 | 32 | 34 | 28 | 37 | 37 | 37 | 25 | 28 | 35 | 33 |
| IPT | 7 | 29 | 25 | 10 | 16 | 39 | 25 | 35 | 38 | 43 | 41 | 43 | 40 | 37 | 40 | 42 | 35 | 42 | 36 | 33 |
| Risk Matrix | 35 | 25 | 38 | 38 | 16 | 39 | 40 | 38 | 42 | 23 | 42 | 17 | 43 | 39 | 41 | 38 | 40 | 33 | 40 | 35 |
| Testability | 35 | 33 | 33 | 30 | 34 | 37 | 33 | 41 | 35 | 39 | 38 | 39 | 32 | 39 | 36 | 39 | 37 | 39 | 37 | 36 |
| Evolvability | 35 | 37 | 38 | 30 | 40 | 39 | 37 | 39 | 40 | 24 | 40 | 36 | 40 | 42 | 35 | 43 | 39 | 15 | 30 | 36 |
| RVTM | 35 | 37 | 23 | 22 | 31 | 33 | 37 | 41 | 39 | 40 | 42 | 39 | 30 | 42 | 43 | 45 | 44 | 43 | 40 | 37 |
| Repairability | 35 | 37 | 38 | 38 | 42 | 39 | 40 | 39 | 42 | 29 | 42 | 39 | 43 | 39 | 42 | 19 | 38 | 41 | 45 | 38 |
| Modifiability | 35 | 37 | 38 | 38 | 42 | 39 | 35 | 41 | 42 | 43 | 29 | 44 | 42 | 44 | 45 | 41 | 40 | 43 | 43 | 40 |
| Digital twin | 35 | 37 | 38 | 38 | 42 | 39 | 40 | 41 | 42 | 43 | 42 | 45 | 43 | 44 | 43 | 44 | 44 | 45 | 43 | 41 |
| Tau-b | 0.596 | 0.669 | 0.555 | 0.489 | 0.596 | 0.721 | 0.698 | 0.75 | 0.64 | 0.588 | 0.602 | 0.578 | 0.647 | 0.667 | 0.714 | 0.651 | 0.572 | 0.715 | ||
| p-value | <0.001 | <0.001 | <0.001 | <0.001 | <0.001 | <0.001 | <0.001 | <0.001 | <0.001 | <0.001 | <0.001 | <0.001 | <0.001 | <0.001 | <0.001 | <0.001 | <0.001 | <0.001 |
Table 11.
Rank ordering of project processes.
| Year | 1998 | 1999 | 2000 | 2001 | 2002 | 2003 | 2004 | 2005 | 2006 | 2007 | 2008 | 2009 | 2010 | 2011 | 2012 | 2013 | 2014 | 2015 | 2016 | Average |
|---|---|---|---|---|---|---|---|---|---|---|---|---|---|---|---|---|---|---|---|---|
| Game Theory | 4 | 5 | 5 | 4 | 6 | 1 | 2 | 1 | 1 | 2 | 1 | 1 | 2 | 2 | 2 | 2 | 2 | 2 | 2 | 2 |
| DSM | 3 | 2 | 2 | 2 | 1 | 2 | 1 | 2 | 5 | 1 | 2 | 2 | 1 | 1 | 1 | 1 | 1 | 1 | 1 | 2 |
| Agile | 5 | 1 | 7 | 5 | 5 | 5 | 5 | 5 | 3 | 4 | 5 | 6 | 3 | 4 | 3 | 4 | 5 | 6 | 3 | 4 |
| Axiomatic design | 2 | 3 | 1 | 7 | 4 | 3 | 3 | 3 | 2 | 3 | 3 | 4 | 6 | 3 | 4 | 3 | 7 | 3 | 4 | 4 |
| Utility theory | 5 | 4 | 3 | 3 | 6 | 6 | 7 | 4 | 4 | 5 | 4 | 5 | 5 | 5 | 6 | 5 | 3 | 5 | 4 | 5 |
| VDD | 7 | 8 | 5 | 5 | 8 | 4 | 6 | 6 | 6 | 7 | 6 | 6 | 4 | 6 | 5 | 6 | 4 | 4 | 6 | 6 |
| IPT | 1 | 7 | 4 | 1 | 2 | 7 | 4 | 6 | 7 | 8 | 7 | 8 | 7 | 6 | 7 | 8 | 6 | 8 | 7 | 6 |
| Risk Matrix | 7 | 5 | 7 | 7 | 2 | 7 | 8 | 8 | 8 | 6 | 8 | 3 | 8 | 8 | 8 | 7 | 8 | 7 | 8 | 7 |
| Tau-b | 0.113 | 0.189 | 0.308 | 0.077 | -0.151 | 0.62 | 0.62 | 0.69 | 0.57 | 0.71 | 0.62 | 0.182 | 0.69 | 0.84 | 0.79 | 0.500 | 0.57 | 0.62 | ||
| p-value | 0.704 | 0.527 | 0.308 | 0.799 | 0.613 | 0.034 | 0.034 | 0.018 | 0.048 | 0.013 | 0.034 | 0.533 | 0.018 | 0.004 | 0.006 | 0.083 | 0.048 | 0.034 |
Table 12.
Rank ordering of “ilities.”
| Year | 1998 | 1999 | 2000 | 2001 | 2002 | 2003 | 2004 | 2005 | 2006 | 2007 | 2008 | 2009 | 2010 | 2011 | 2012 | 2013 | 2014 | 2015 | 2016 | Average |
|---|---|---|---|---|---|---|---|---|---|---|---|---|---|---|---|---|---|---|---|---|
| Complexity | 2 | 1 | 2 | 2 | 2 | 1 | 1 | 2 | 2 | 1 | 1 | 1 | 1 | 2 | 1 | 1 | 1 | 1 | 1 | 1 |
| Quality | 1 | 2 | 1 | 1 | 3 | 2 | 2 | 1 | 1 | 2 | 2 | 2 | 4 | 1 | 2 | 3 | 2 | 5 | 3 | 2 |
| Availability | 3 | 3 | 5 | 4 | 4 | 4 | 4 | 4 | 3 | 4 | 4 | 3 | 2 | 3 | 3 | 2 | 3 | 3 | 4 | 3 |
| Robustness | 7 | 5 | 4 | 5 | 7 | 6 | 7 | 3 | 4 | 3 | 6 | 6 | 8 | 7 | 6 | 6 | 6 | 2 | 6 | 5 |
| Reliability | 5 | 6 | 6 | 8 | 6 | 5 | 6 | 5 | 5 | 5 | 8 | 7 | 3 | 4 | 7 | 4 | 4 | 6 | 7 | 6 |
| Safety | 6 | 4 | 3 | 3 | 1 | 7 | 5 | 6 | 6 | 8 | 11 | 5 | 5 | 5 | 8 | 5 | 7 | 10 | 8 | 6 |
| Modularity | 12 | 7 | 8 | 6 | 5 | 3 | 3 | 7 | 7 | 7 | 7 | 11 | 10 | 9 | 4 | 9 | 8 | 9 | 2 | 7 |
| Flexibility | 8 | 9 | 7 | 14 | 9 | 8 | 9 | 11 | 12 | 6 | 5 | 8 | 13 | 10 | 11 | 8 | 12 | 4 | 9 | 9 |
| Sustainability | 4 | 14 | 9 | 16 | 10 | 11 | 10 | 9 | 8 | 10 | 12 | 4 | 12 | 6 | 5 | 7 | 9 | 12 | 13 | 10 |
| Usability | 13 | 10 | 10 | 7 | 8 | 11 | 8 | 12 | 12 | 11 | 14 | 9 | 7 | 8 | 9 | 13 | 13 | 14 | 14 | 11 |
| Adaptability | 15 | 11 | 17 | 19 | 13 | 15 | 15 | 10 | 9 | 12 | 10 | 19 | 16 | 14 | 10 | 11 | 10 | 7 | 12 | 13 |
| Interoperability | 9 | 14 | 11 | 10 | 12 | 9 | 14 | 13 | 16 | 15 | 19 | 14 | 11 | 11 | 15 | 16 | 5 | 17 | 16 | 13 |
| Maintainability | 11 | 12 | 11 | 10 | 16 | 13 | 11 | 8 | 15 | 20 | 18 | 17 | 13 | 11 | 18 | 14 | 17 | 13 | 15 | 14 |
| Manufacturability | 10 | 12 | 13 | 15 | 10 | 18 | 13 | 17 | 16 | 9 | 15 | 10 | 9 | 19 | 16 | 20 | 15 | 18 | 18 | 14 |
| Resilience | 14 | 18 | 21 | 22 | 18 | 20 | 23 | 18 | 10 | 21 | 9 | 15 | 6 | 19 | 12 | 10 | 18 | 8 | 5 | 15 |
| Scalability | 18 | 16 | 13 | 9 | 18 | 15 | 12 | 16 | 14 | 18 | 13 | 15 | 19 | 17 | 14 | 17 | 11 | 16 | 11 | 15 |
| Affordability | 18 | 20 | 15 | 13 | 14 | 10 | 18 | 20 | 18 | 18 | 20 | 13 | 21 | 15 | 22 | 18 | 14 | 15 | 10 | 16 |
| Durability | 16 | 20 | 19 | 20 | 14 | 19 | 17 | 18 | 18 | 12 | 3 | 12 | 18 | 13 | 17 | 19 | 16 | 20 | 20 | 16 |
| Agility | 16 | 8 | 15 | 21 | 16 | 17 | 21 | 14 | 11 | 15 | 17 | 21 | 20 | 16 | 13 | 15 | 24 | 18 | 22 | 17 |
| Extensibility | 18 | 17 | 19 | 12 | 18 | 14 | 16 | 15 | 21 | 23 | 21 | 18 | 15 | 17 | 19 | 22 | 19 | 21 | 20 | 18 |
| Testability | 21 | 18 | 17 | 16 | 18 | 20 | 18 | 23 | 20 | 22 | 21 | 21 | 17 | 21 | 21 | 21 | 20 | 22 | 19 | 20 |
| Evolvability | 21 | 20 | 21 | 16 | 22 | 22 | 21 | 21 | 22 | 12 | 23 | 19 | 22 | 23 | 20 | 24 | 22 | 11 | 17 | 20 |
| Repairability | 21 | 20 | 21 | 22 | 23 | 22 | 23 | 21 | 23 | 15 | 24 | 21 | 24 | 21 | 23 | 12 | 21 | 23 | 24 | 21 |
| Modifiability | 21 | 20 | 21 | 22 | 23 | 22 | 20 | 23 | 23 | 24 | 16 | 24 | 23 | 24 | 24 | 23 | 23 | 24 | 23 | 22 |
| Tau-b | 0.673 | 0.769 | 0.749 | 0.658 | 0.769 | 0.792 | 0.703 | 0.796 | 0.64 | 0.566 | 0.557 | 0.667 | 0.647 | 0.708 | 0.696 | 0.652 | 0.577 | 0.713 | ||
| p-value | <0.001 | <0.001 | <0.001 | <0.001 | <0.001 | <0.001 | <0.001 | <0.001 | <0.001 | <0.001 | <0.001 | <0.001 | <0.001 | <0.001 | <0.001 | <0.001 | <0.001 | <0.001 |
Table 13.
Summary of average change in frequencies of topics for weighted average analysis.
| Order of Magnitude of Initial Frequencies | |||||
|---|---|---|---|---|---|
| Fuzzy sets | AHP Game Theory MBSE Adaptability Flexibility | Resilience Evolvability VDD | SysML Repairability Modifiability Digital twin | ||
| Affordability Modularity | Durability | ||||
| Reliability Optimization DSM | Maintainability Lean Sustainability Interoperability | Risk matrix | |||
| Usability Scalability | Testability | ||||
| Complexity | Robustness Availability | SixSigma Agility | |||
| Quality | Safety | Agile Manufacturability Extensibility Utility theory FMEA | |||
| QFD Taguchi Axiomatic design | Pugh RVTM IPT | ||||
| —Topics that moved vertically and horizontally as compared to Table 3 | |||||
 —Topics that moved only vertically as compared to Table 3 —Topics that moved only vertically as compared to Table 3 | |||||
Table 14.
Summary of change in average ranks of topics for weighted average analysis.
| Topics | ||||
|---|---|---|---|---|
| * SysML | ~ Modularity | ~ Reliability | / Scalability | # Utility theory |
| * Resilience | ~ Durability | ~ Usability | / Sustainability | # FMEA |
| + Evolvability | ~ Flexibility | ! Maintainability | / Quality | # Pugh |
| + Game Theory | ~ Lean | / Availability | / Testability | # Taguchi |
| + MBSE | ~ DSM | / Complexity | / Extensibility | # Agile |
| + Adaptability | ~ Interoperability | / Risk matrix | / Agility | # QFD |
| + Repairability | ~ AHP | / Modifiability | / Safety | # RVTM |
| ~ Optimization | ~ VDD | / Manufacturability | / Robustness | ^ Axiomatic design |
| ~ Affordability | ~ Fuzzy sets | / Six sigma | / Digital twin | ^ IPT |
| * Increase in rank > 20 | ^ Decrease in rank >20 | |||
| + Increase in rank between 11 and 20 | # Decrease in rank between 11 and 20 | |||
| ~ Increase in rank between 1 and 10 | / Decrease in rank between 1 and 10 | |||
| ! No change in rank | ||||
Table 15.
Comparison of author-generated and NVivo-generated keywords.
| Paper Title | Journal | Year | Keywords Describing Article | Word Frequency Query Results |
|---|---|---|---|---|
| “Engineering Design Models: context, theory and practice” | JOED | 1998 | Design, engineering, model, context, product | Design, product, engineering, model, process, companies, approach, strategy |
| “Development of product design requirements using taxonomies of environmental issues” | RED | 2002 | Manufacturing, environment, taxonomy, requirements, design, DFM, DFE, safety, health, attributes | Design, requirements, products, taxonomy, environmental, manufacturing, approach, DFE, attributes, DFM |
| “System and Software Architecture Reconciliation” | Wiley | 2006 | Software, hardware, architecture, integration, layers, views, viewpoints | System, software, model, architecture, layered, views, methods, functionality, hardware, design |
| “Moral Hazard Strategy and Quality Contract Design in a Two-Echelon Supply Chain” | SS & SE | 2011 | Game theory, principal-agent theory, supply chain, quality, moral hazard, contract, buyer, supplier | Quality, product, supplier, buyer, supply chain, contract, profits, cost, inspection, hazard, moral, design, process |
| “Engineered Resilience for Complex Systems as a Predictor for Cost Overruns” | Wiley | 2016 | Complexity, resilience, MDAP, complex systems, cost overruns, SoS, PLA, SYS, cost changes | Systems, programs, SoS, SYS, PLA, cost, complex, games, effect, change, defense, acquisition |
© 2019 by the authors. Licensee MDPI, Basel, Switzerland. This article is an open access article distributed under the terms and conditions of the Creative Commons Attribution (CC BY) license (http://creativecommons.org/licenses/by/4.0/).
Share and Cite
MDPI and ACS Style
Bhatia, G.; Mesmer, B. Trends in Occurrences of Systems Engineering Topics in Literature. Systems 2019, 7, 28. https://0-doi-org.brum.beds.ac.uk/10.3390/systems7020028
AMA Style
Bhatia G, Mesmer B. Trends in Occurrences of Systems Engineering Topics in Literature. Systems. 2019; 7(2):28. https://0-doi-org.brum.beds.ac.uk/10.3390/systems7020028
Chicago/Turabian StyleBhatia, Garima, and Bryan Mesmer. 2019. "Trends in Occurrences of Systems Engineering Topics in Literature" Systems 7, no. 2: 28. https://0-doi-org.brum.beds.ac.uk/10.3390/systems7020028
Note that from the first issue of 2016, this journal uses article numbers instead of page numbers. See further details here.