Measuring the Change Towards More Sustainable Mobility: MUV Impact Evaluation Approach

 ,
,  , ,
, ,
Abstract
:1. Introduction
- to what extent can MUV change citizens’ mobility behaviors?
- to what extent can MUV lead to a reduction of urban car-dependency traffic?
- to what extent can MUV reduce the perceived gap between the use of a private car and the use of other more sustainable transport modes?
- how could different interactions among local stakeholders (i.e., citizens, local businesses, local authorities) affect the behavioral change envisaged by MUV?
- what is the added value of data collected by MUV? How can such data be used to provide insights to policymakers and mobility planners?
2. Materials and Methods
2.1. The Impact Assessment Framework
- the indicators for measuring the MUV impacts have been selected to be comparable in all the pilot cities. This selection does not prevent cities having their own additional local indicators important for the impact assessment (outside the scope of the project), but only the proposed set of impact indicators guarantees consistency in all the cities;
- the methods of measurement of indicators in cities are aligned, allowing to reveal differences in results.
- OBJ 1: Sustainable urban mobility/new mobility culture: MUV promotes a shift towards more sustainable mobility in urban contexts; individual choices are at the core of impact evaluation on behavioral change approach to reduce urban vehicle traffic;
- OBJ 2: Better health and environment: MUV raises citizens’ awareness on the quality of the urban environment and promotes healthier mobility choices, leading to a better environment;
- OBJ 3: Evidence-based and human-centered urban mobility planning: MUV promotes the integration of people and personal mobility data into urban policy-making and planning processes at the neighborhood level;
- OBJ 4: Foster local development: MUV is likely to generate positive spillover effects on the whole neighborhood and surroundings, even at the city level, involving local businesses and stimulating an innovative environment.
- IA–1 Society-People: it refers to the effects of the measure on the citizens living in the neighborhood and in the city, in terms of acceptability, mobility habits, perceived wellbeing, and new opportunities at the community level.
- IA–2 Society-Governance: it refers to the effects of the measure on the way society is organized in terms of governance, e.g., planning and urban mobility policies.
- IA–3 Economy: it focuses on the effectiveness and/or benefits derived from the measure in relation to the costs associated with its preparation, implementation, and operation, together with the economic spillover effects deriving from MUV implementation in the local development.
- IA–4 Environment: it relates to the effects on the environment of reducing the use of private motorized transport, thanks to the measure, covering both polluting emissions and energy consumption.
2.2. Impact Evaluation
2.3. Impact and Context Indicators
2.4. The Baseline
- the modal split of each user on his/her most frequent route(s);
- the length of such route(s);
- the number of times per week he/she travels this route(s).
- in the case the player uses a car on the registered frequent routes, the kind of car she/he generally uses (segment: mini/small/medium/large; fuel: petrol/diesel/petrol hybrids/LPG/CNG/electric; EURO standard); then, COPERT model [26] is used to estimate the corresponding emissions in her/his urban context;
- in the case the player uses a motorbike on the frequent routes, the kind of motorbike she/he usually drives (engine: 2 stroke/4 stroke; cubic capacity: <50 cm3/51–250 cm3/251–750 cm3/>750 cm3; EURO standard); then, COPERT model [26] is used to estimate the corresponding emissions in her/his urban context.
2.5. Process Evaluation
3. Results
- the six neighborhoods have a similar age structure of residents (C7, C8), with Ghent and Palermo having a slightly higher percentage of the young population than the other neighborhoods;
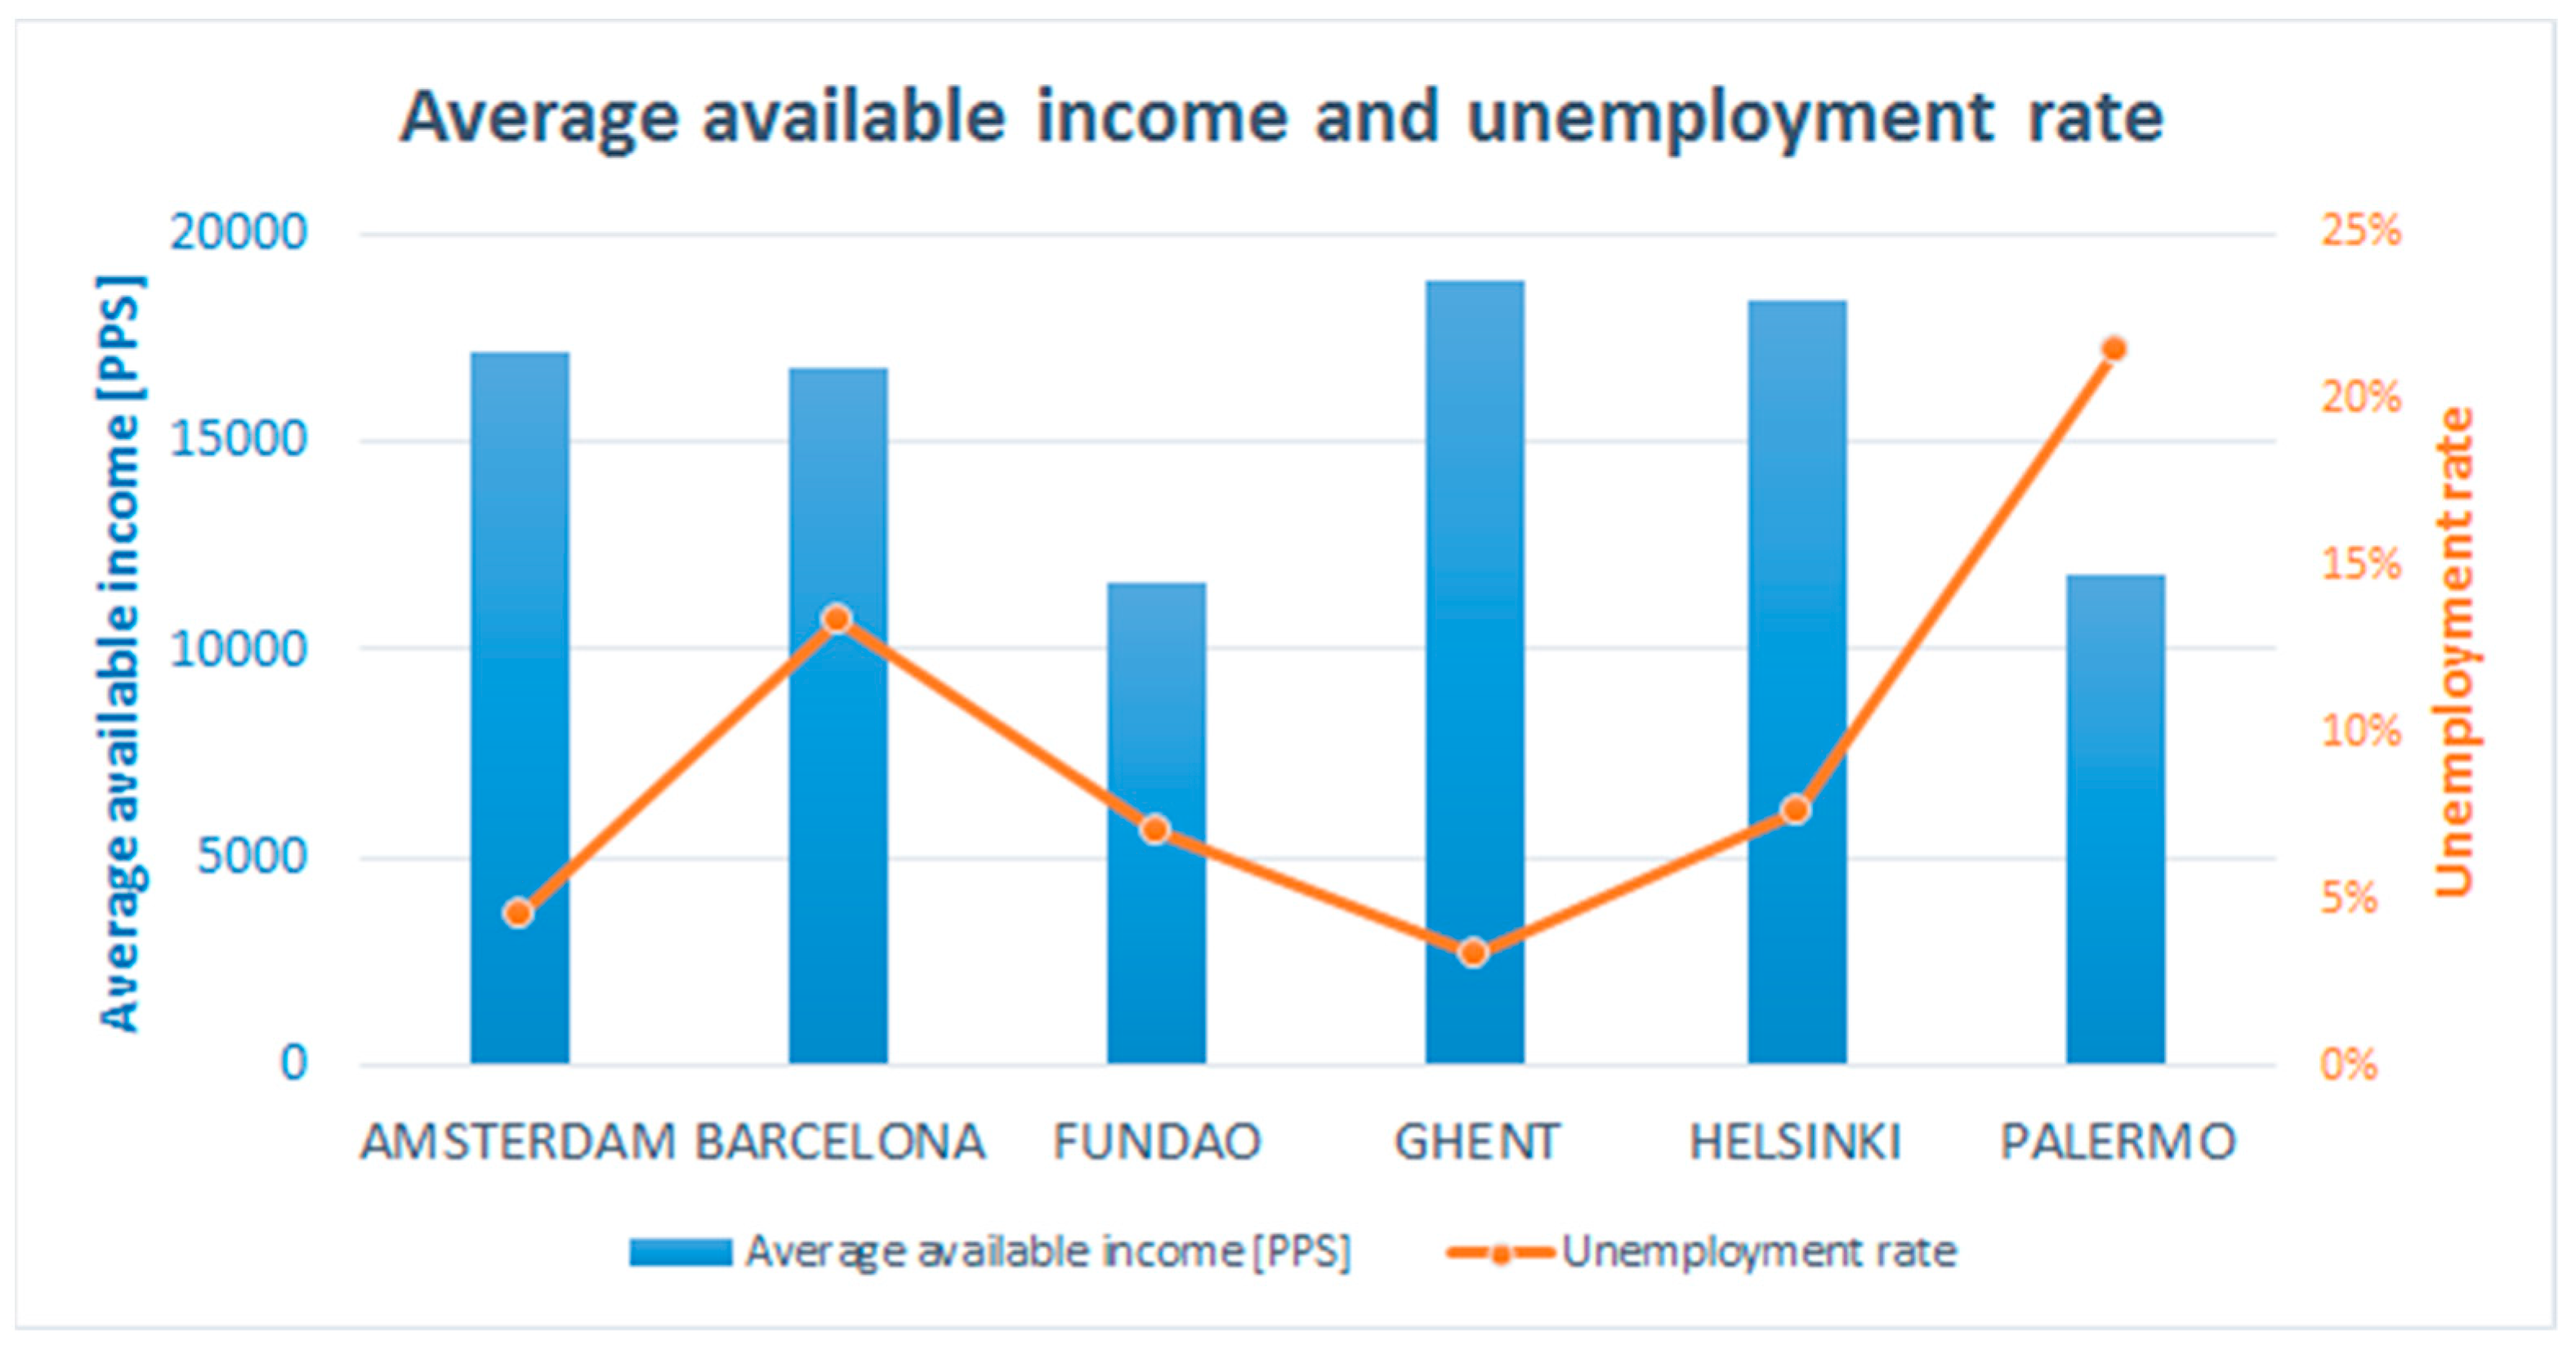
- the average available income, measured as the disposable per-capita income of private households, is expressed in PPS (Purchasing Power Standard) to make the figures comparable between regions (Figure 5). The differences in such indicator (C9) are quite relevant, varying from 11,600 PPS in Fundao to 18,900 PPS in Ghent;
- the social structure is different also in employment terms (C16), going from 3.4% of unemployment rate in Ghent to 21.5% of unemployment rate in Palermo (Figure 5);
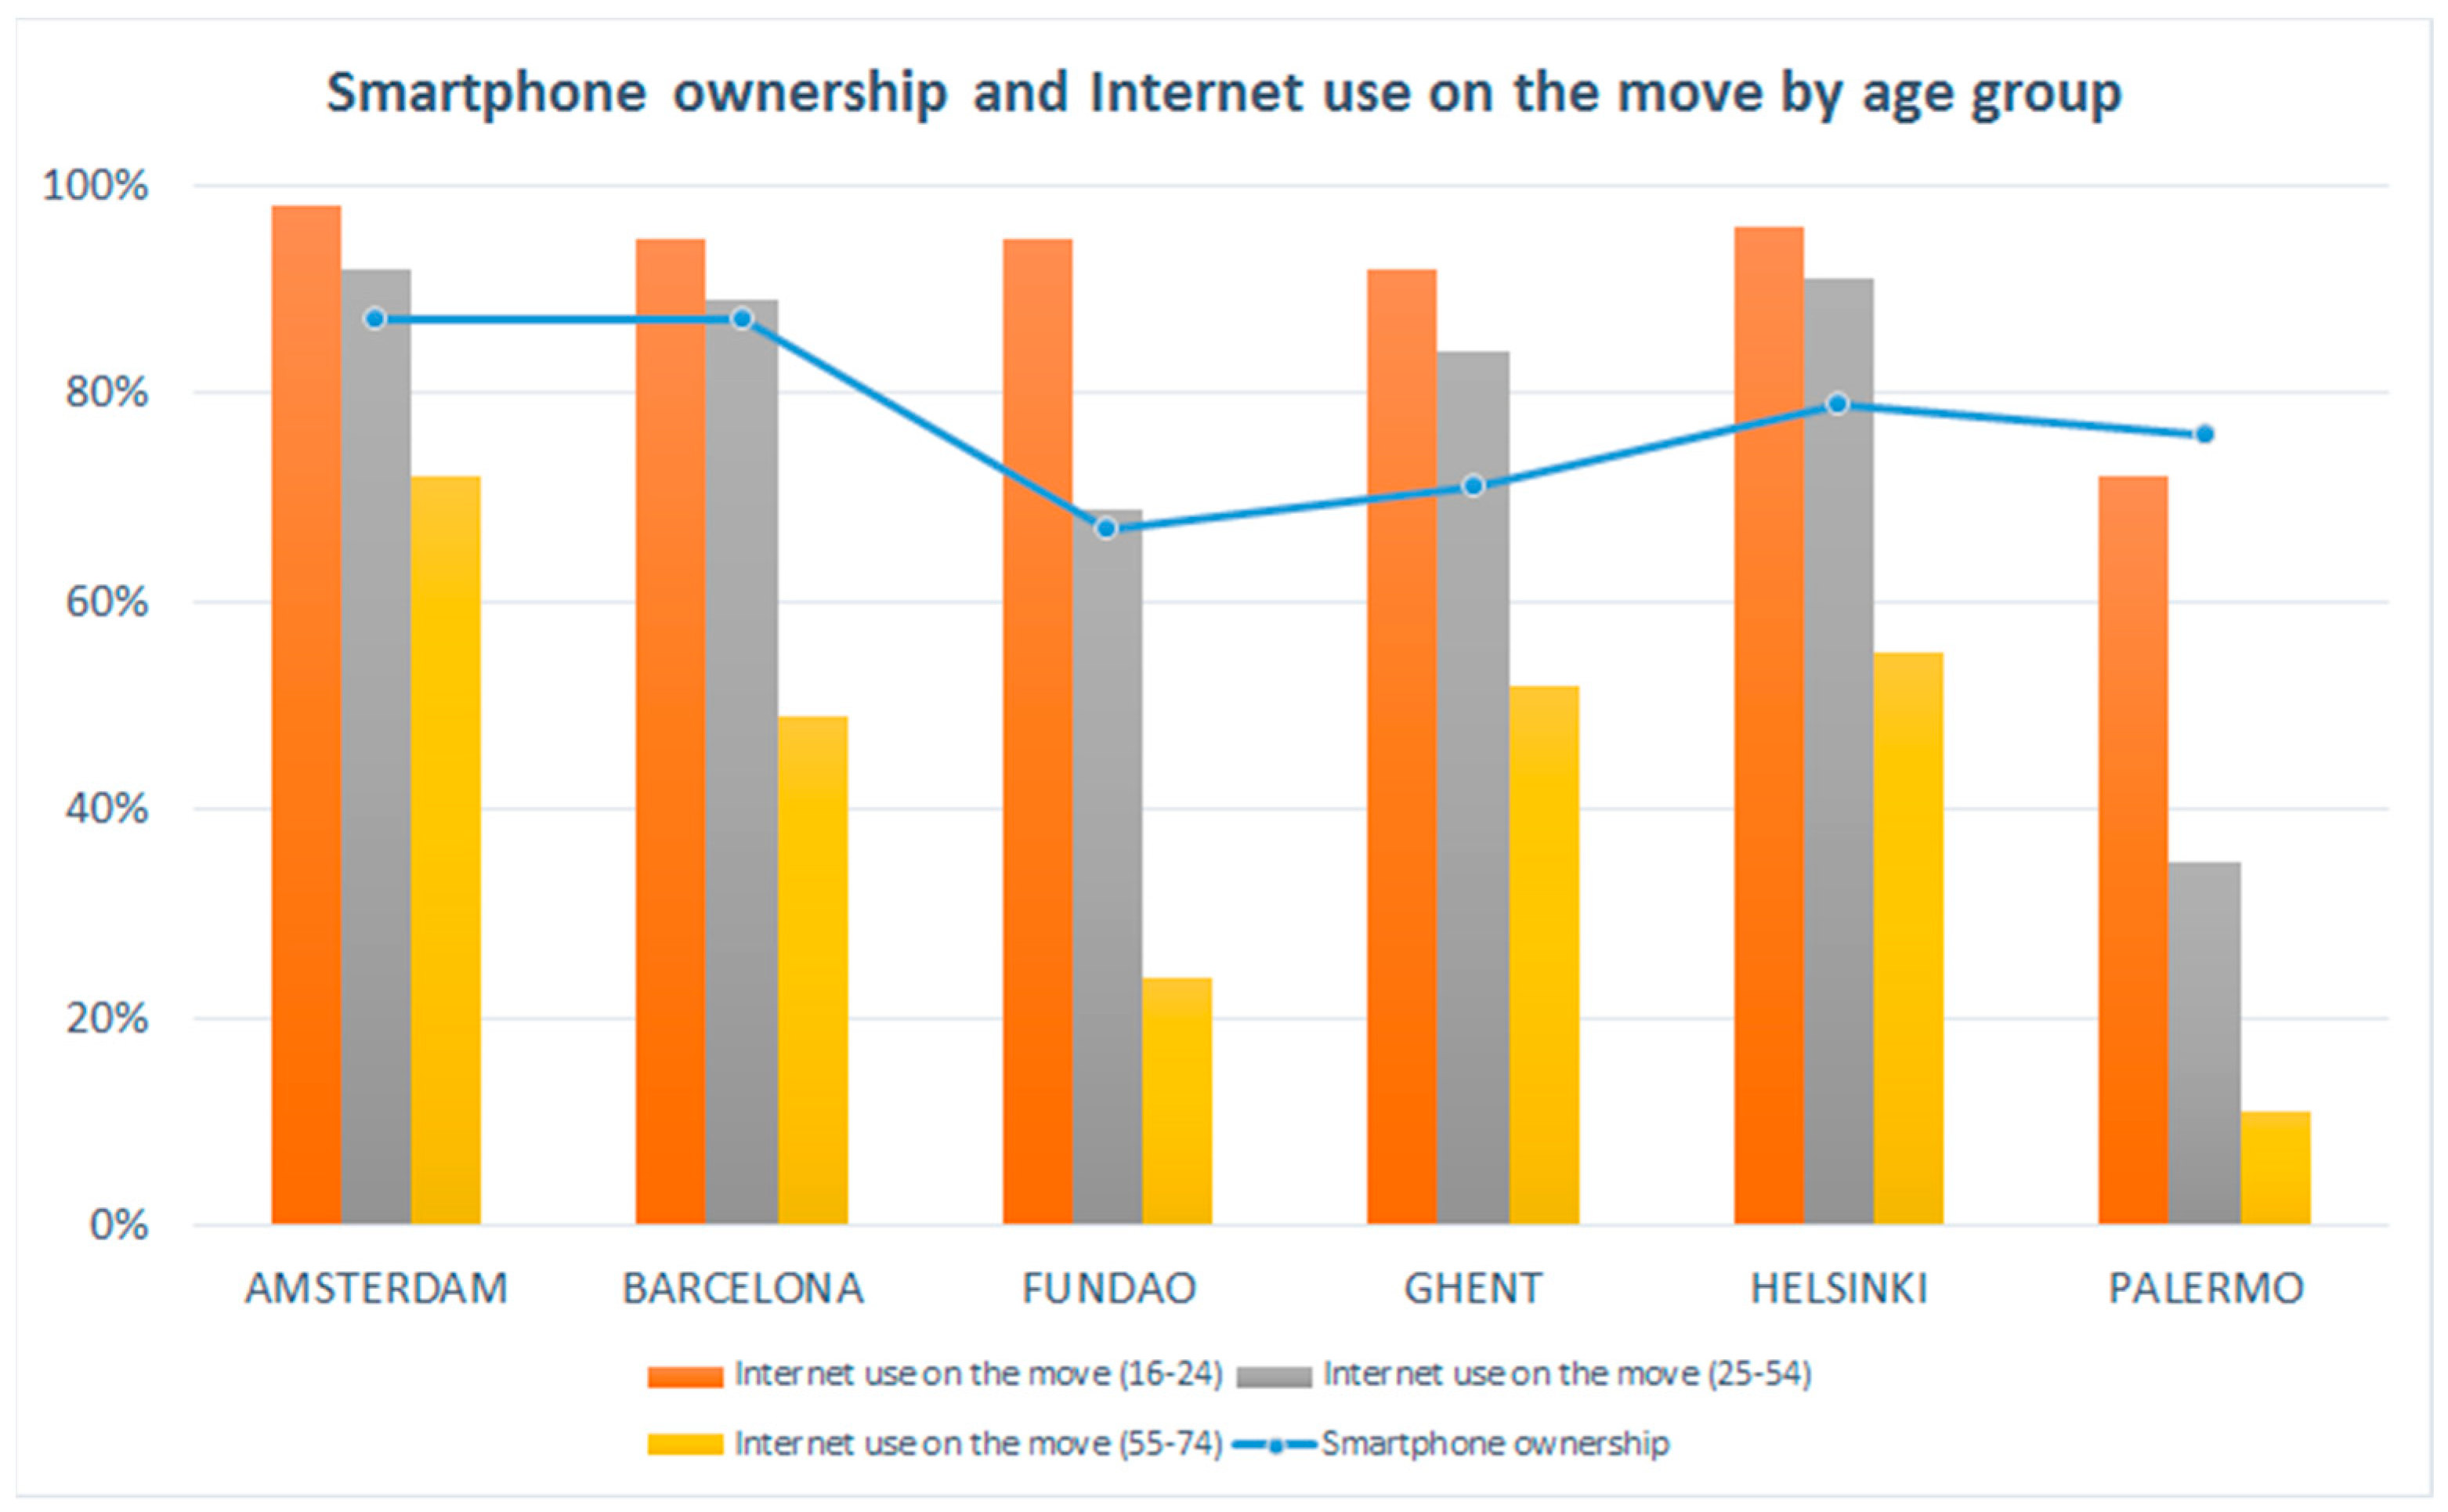
- the rate of smartphone ownership (C17) will be an important context indicator to take into account during evaluation activities, since using a smartphone constitutes a prerequisite to installing the MUV app. Apart from Fundao (67%), this rate is greater than 70% in all the pilots, with a peak equal to 87% in Amsterdam and Barcelona (Figure 6);
- even though the smartphone ownership rate is quite aligned with the other pilots, Palermo constitutes an exception for the use of the internet on the move (C18, C19). Only 72% of individuals aged 16–24 use mobile devices via mobile or wireless connection in Palermo, against over 92% of the other sites (Figure 6). The difference is even more evident getting older, with 11% of individuals aged 55–74 using the internet on the move, against over 50% of the other pilots (with the exception of Fundao);
- the average waiting time at a bus station (C25) can heavily influence the city travelers to move with public transport. The six pilots show clear differences in waiting times, with users of public transport in Helsinki waiting an average of 4 min at a standstill, against a 23–minute wait for a Palermitan;
- the traffic congestion in the cities (C46–C54) is quite different among the pilots. Consider, for example, the congestion level during evening peaks (C49), i.e., the increase in evening peak travel times when compared to a free flow situation. Palermo reaches 69% of congestion level in the evening peak (i.e., during the evening peak, it takes 69% of the extra time to travel the same route compared to a free flow situation) against the 34% of Ghent;
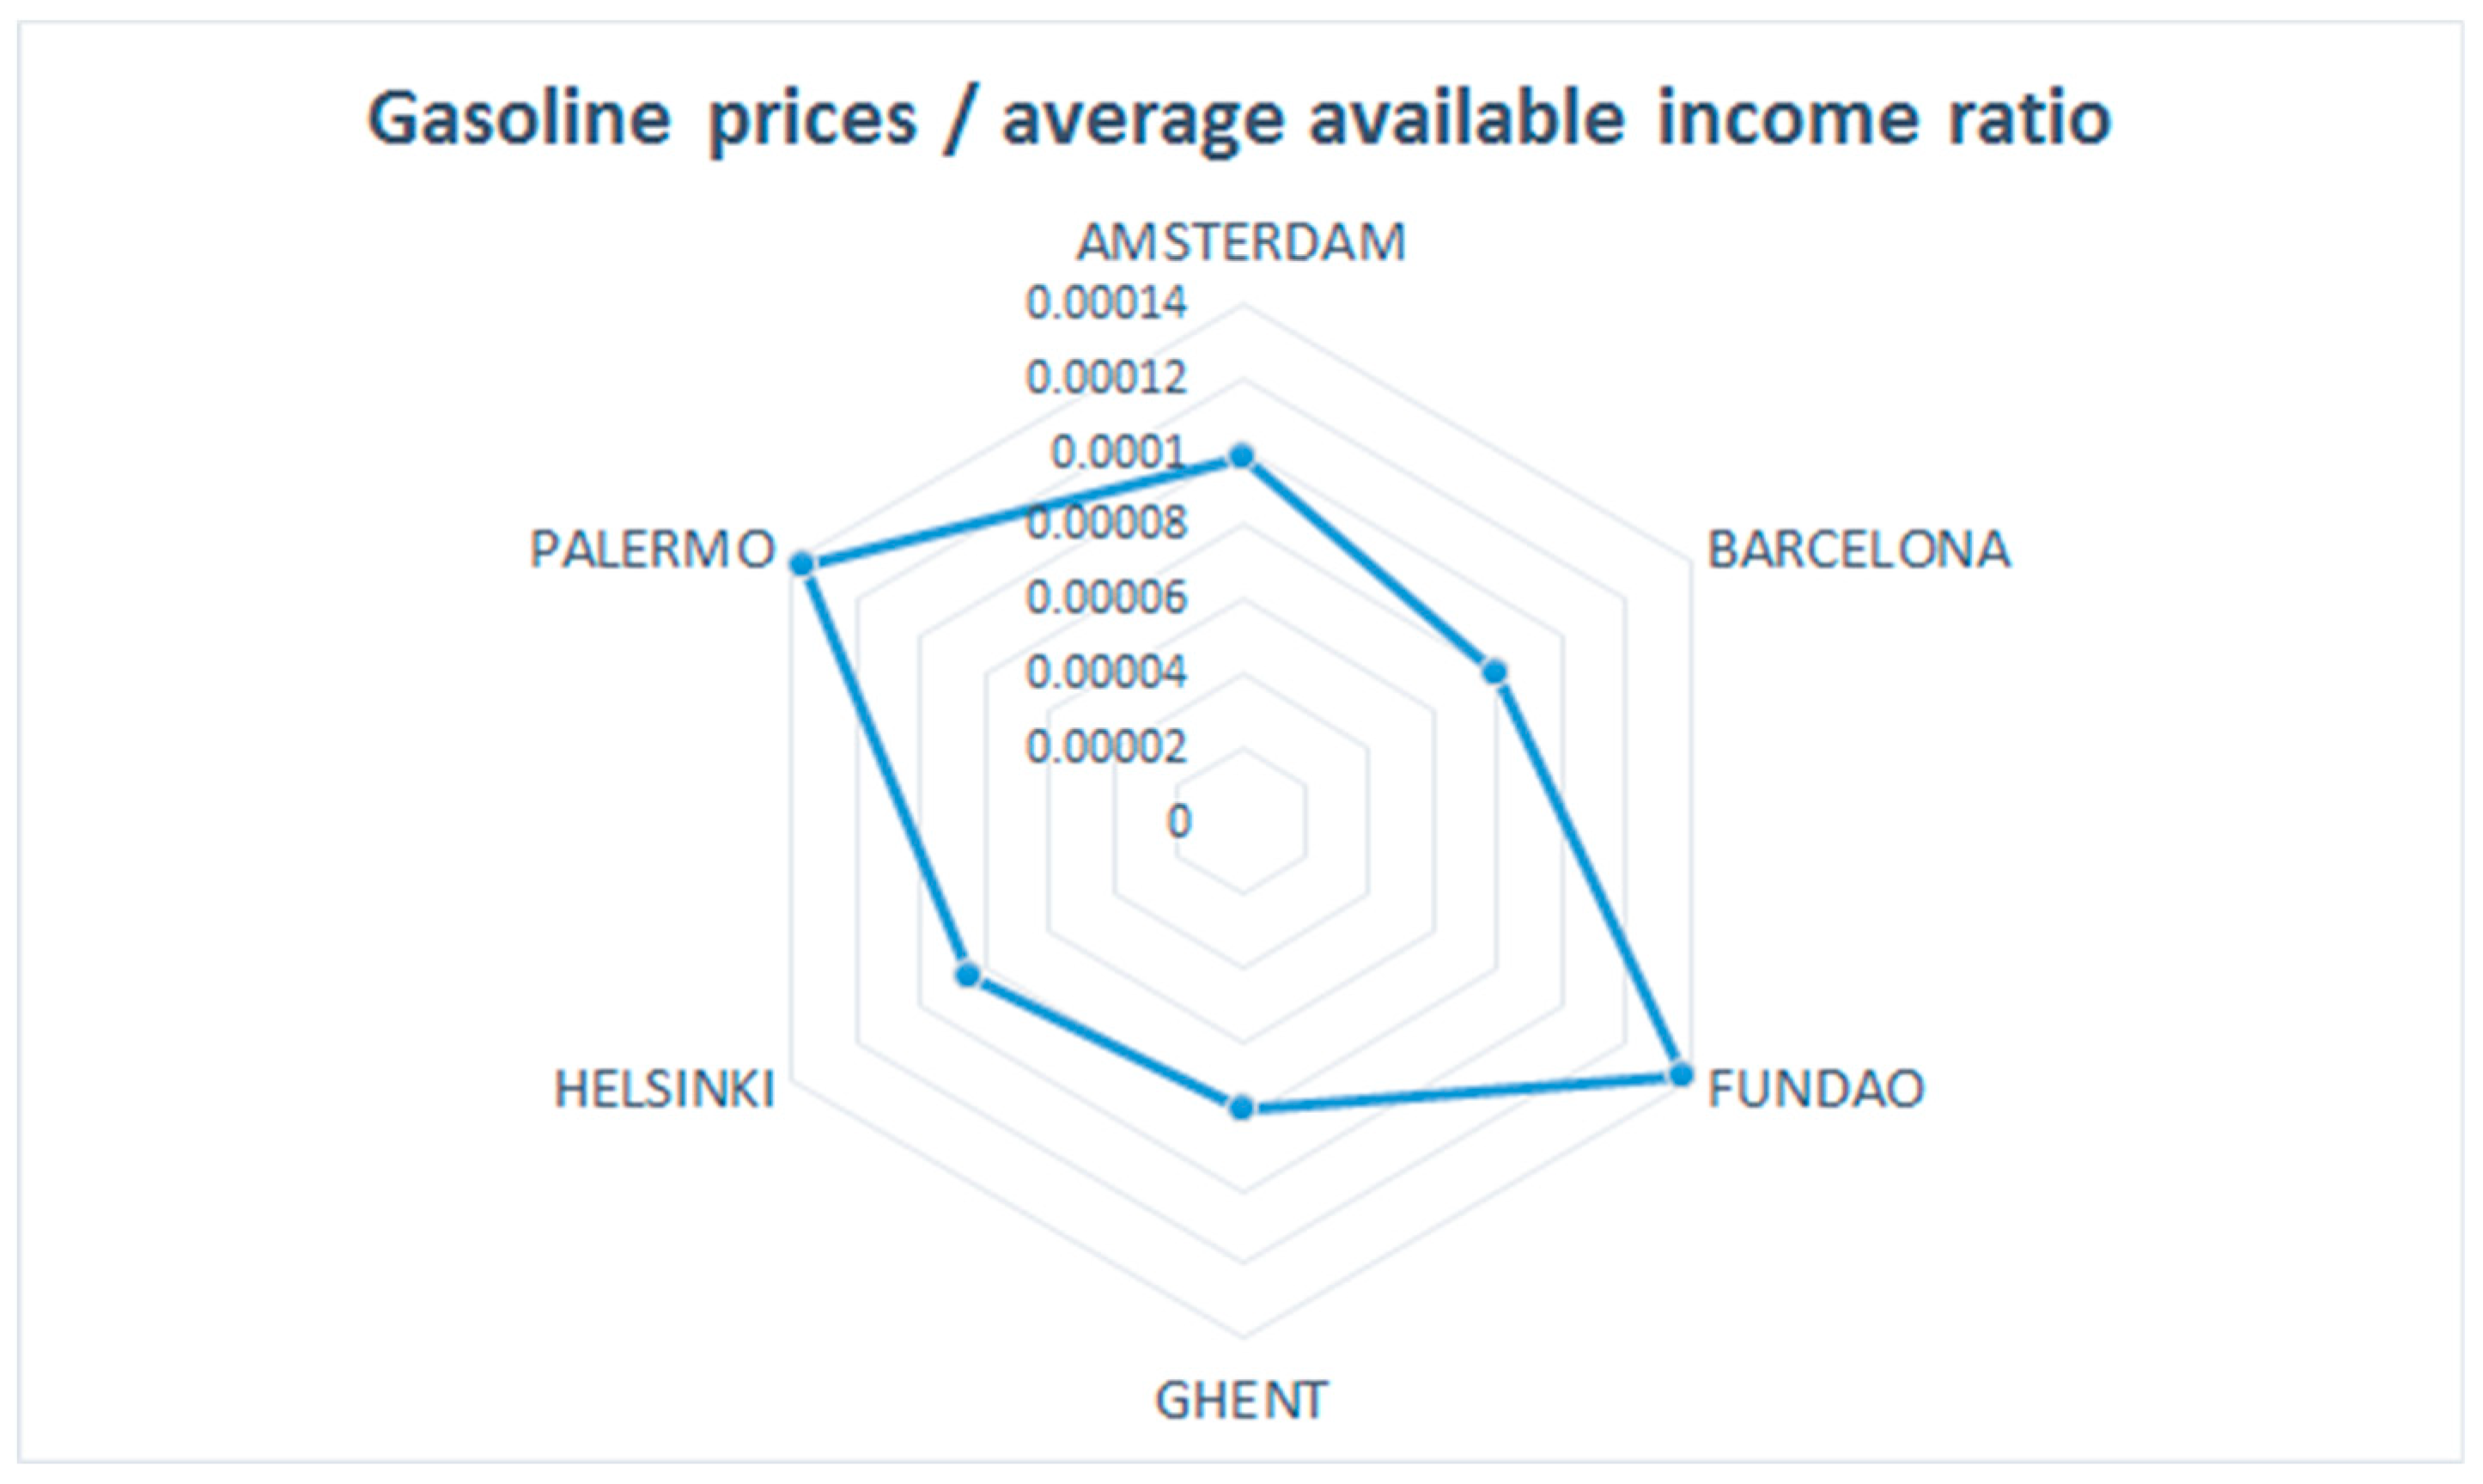
- another important factor to take into consideration when choosing the travel mode is the rate of car ownership (C36), which is among the highest in Europe in Palermo (625 cars owned per 1000 inhabitants), while it is below the European average in Amsterdam (481 cars per 1000 inhabitants). Fundao and Palermo are, among the pilots, the sites in which the gasoline is more expensive (C44) in relation to the average available income (Figure 7);
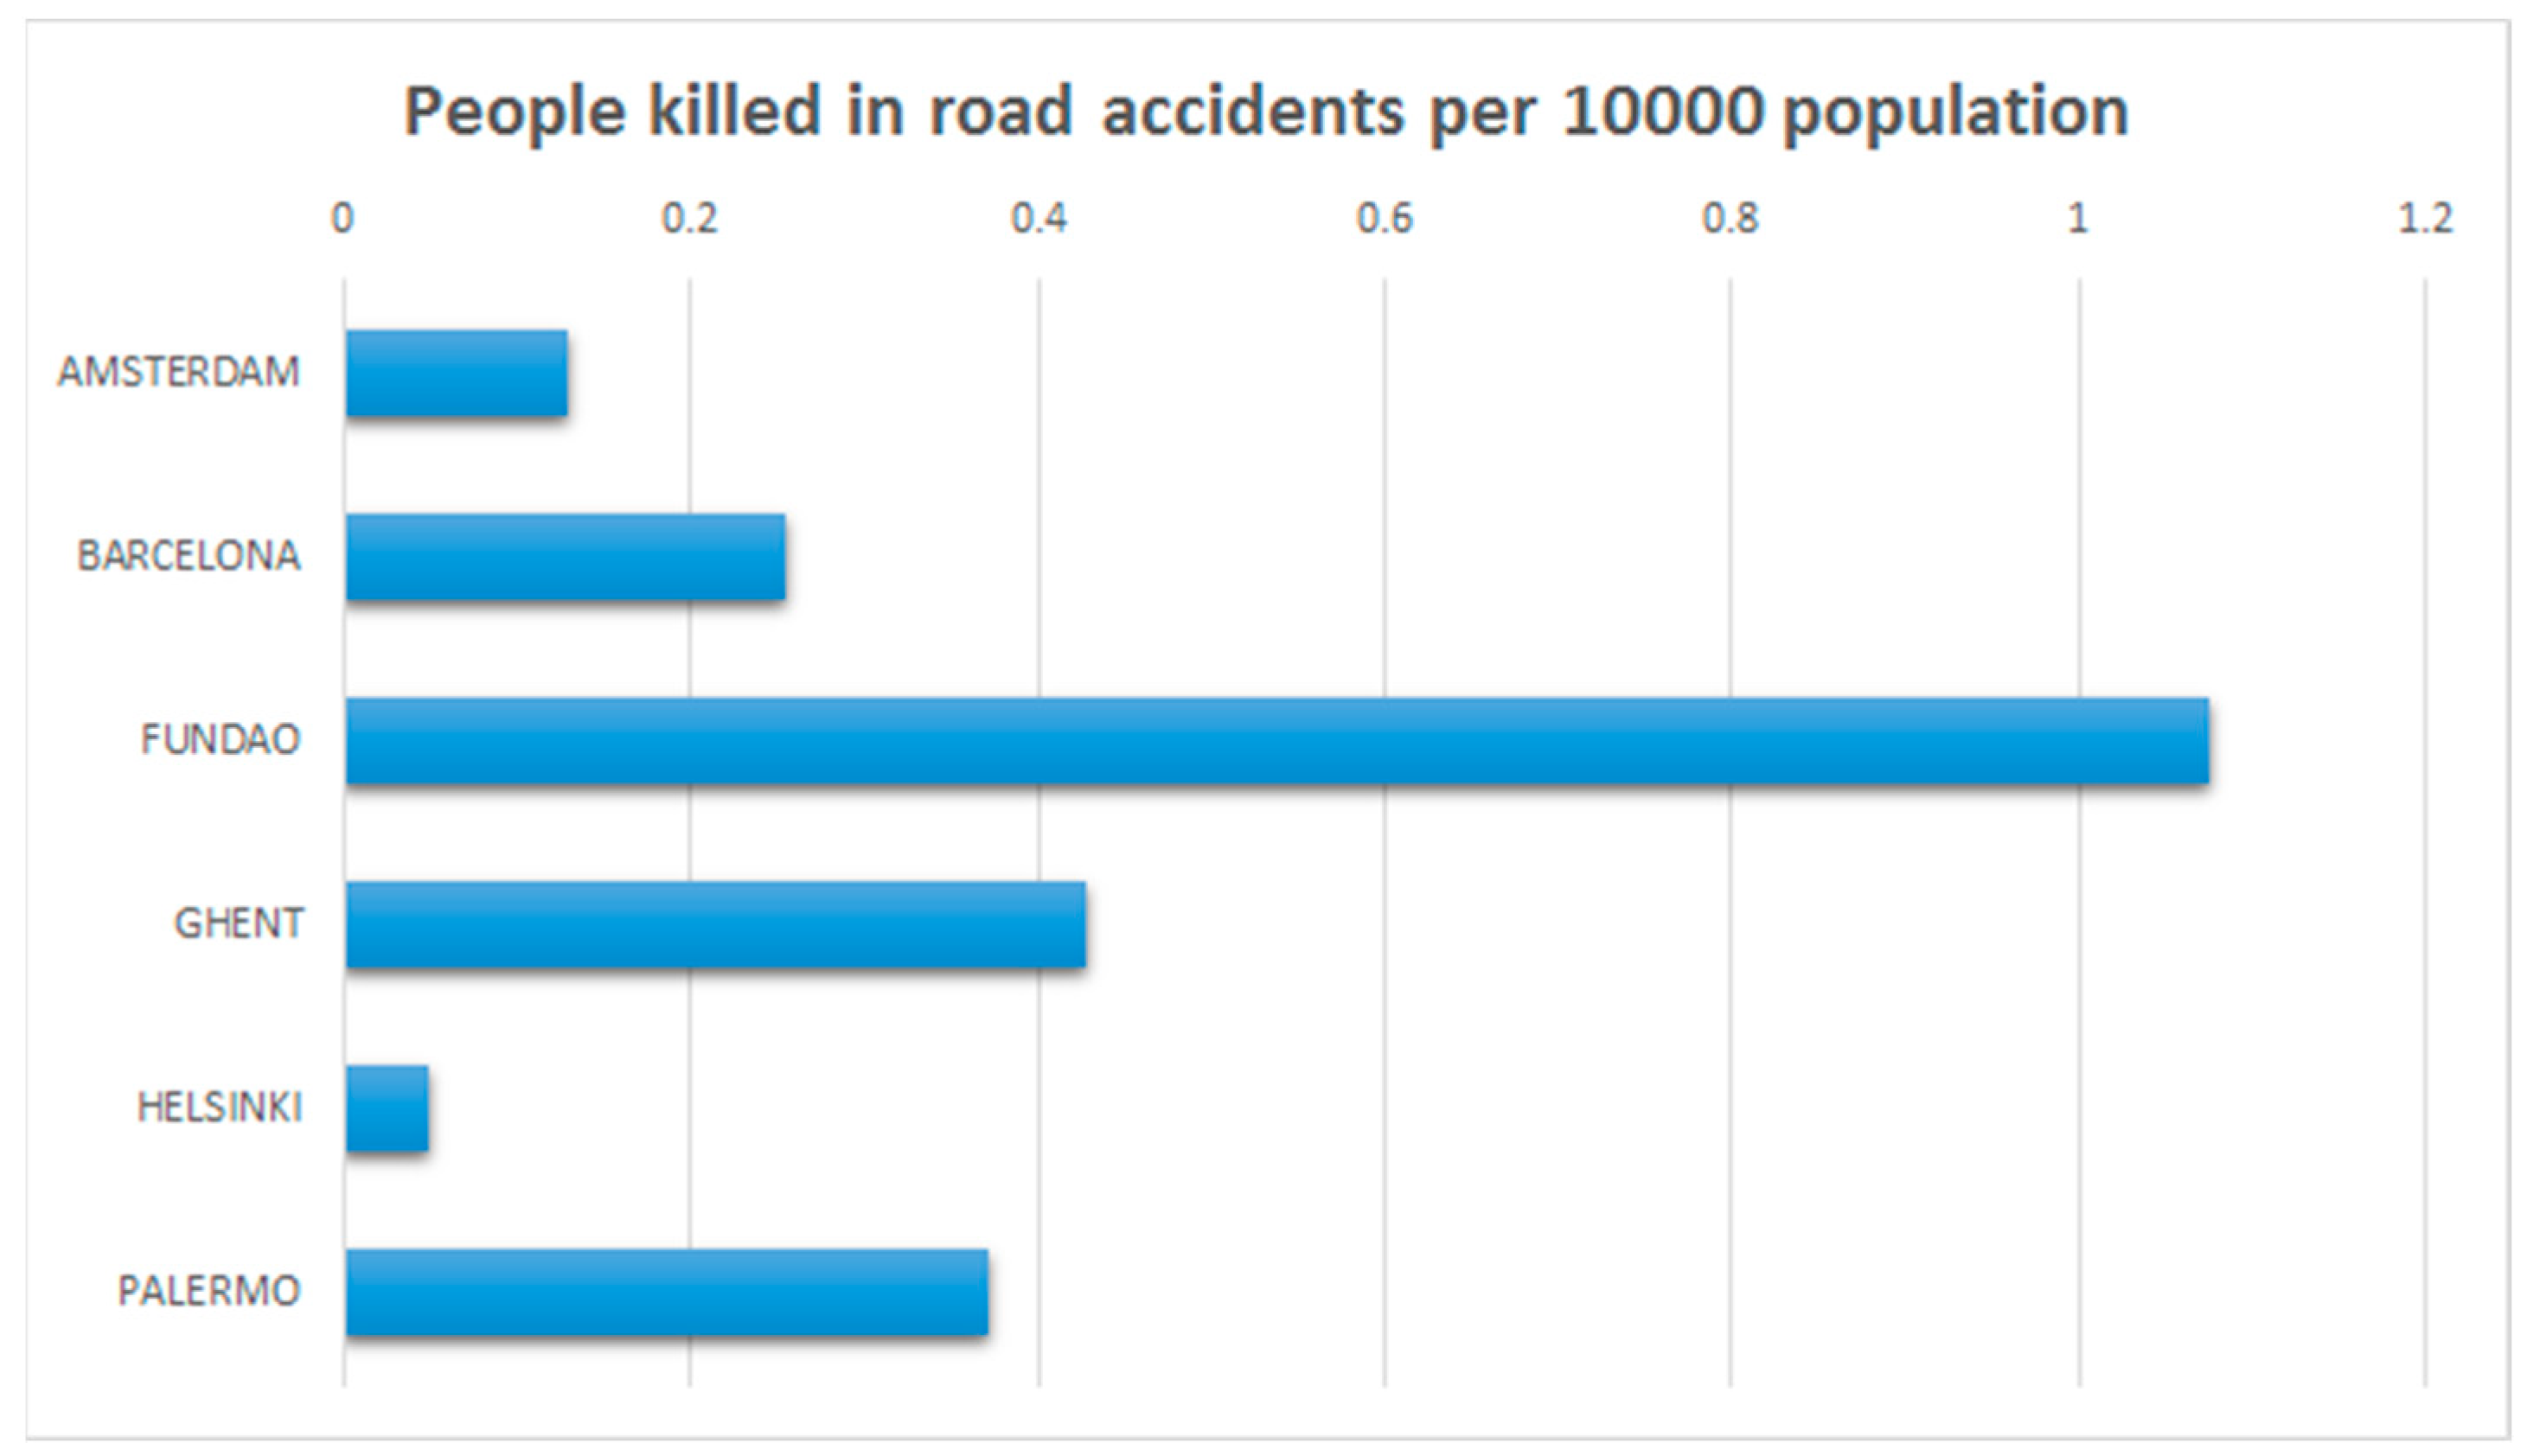
- considering the road safety dimension (C55–C59), the numbers show a huge difference in people killed in road accidents in the six sites (Figure 8). Helsinki is the safest city among the pilots (0.048 people killed per 10,000 population), while Fundao is the least secure one (1.07 people killed per 10,000 population). Unfortunately, for many pilots, it was not possible to collect information from the pilot managers about the quantity and type of road accidents (e.g., car-car/car-bike/car-people);
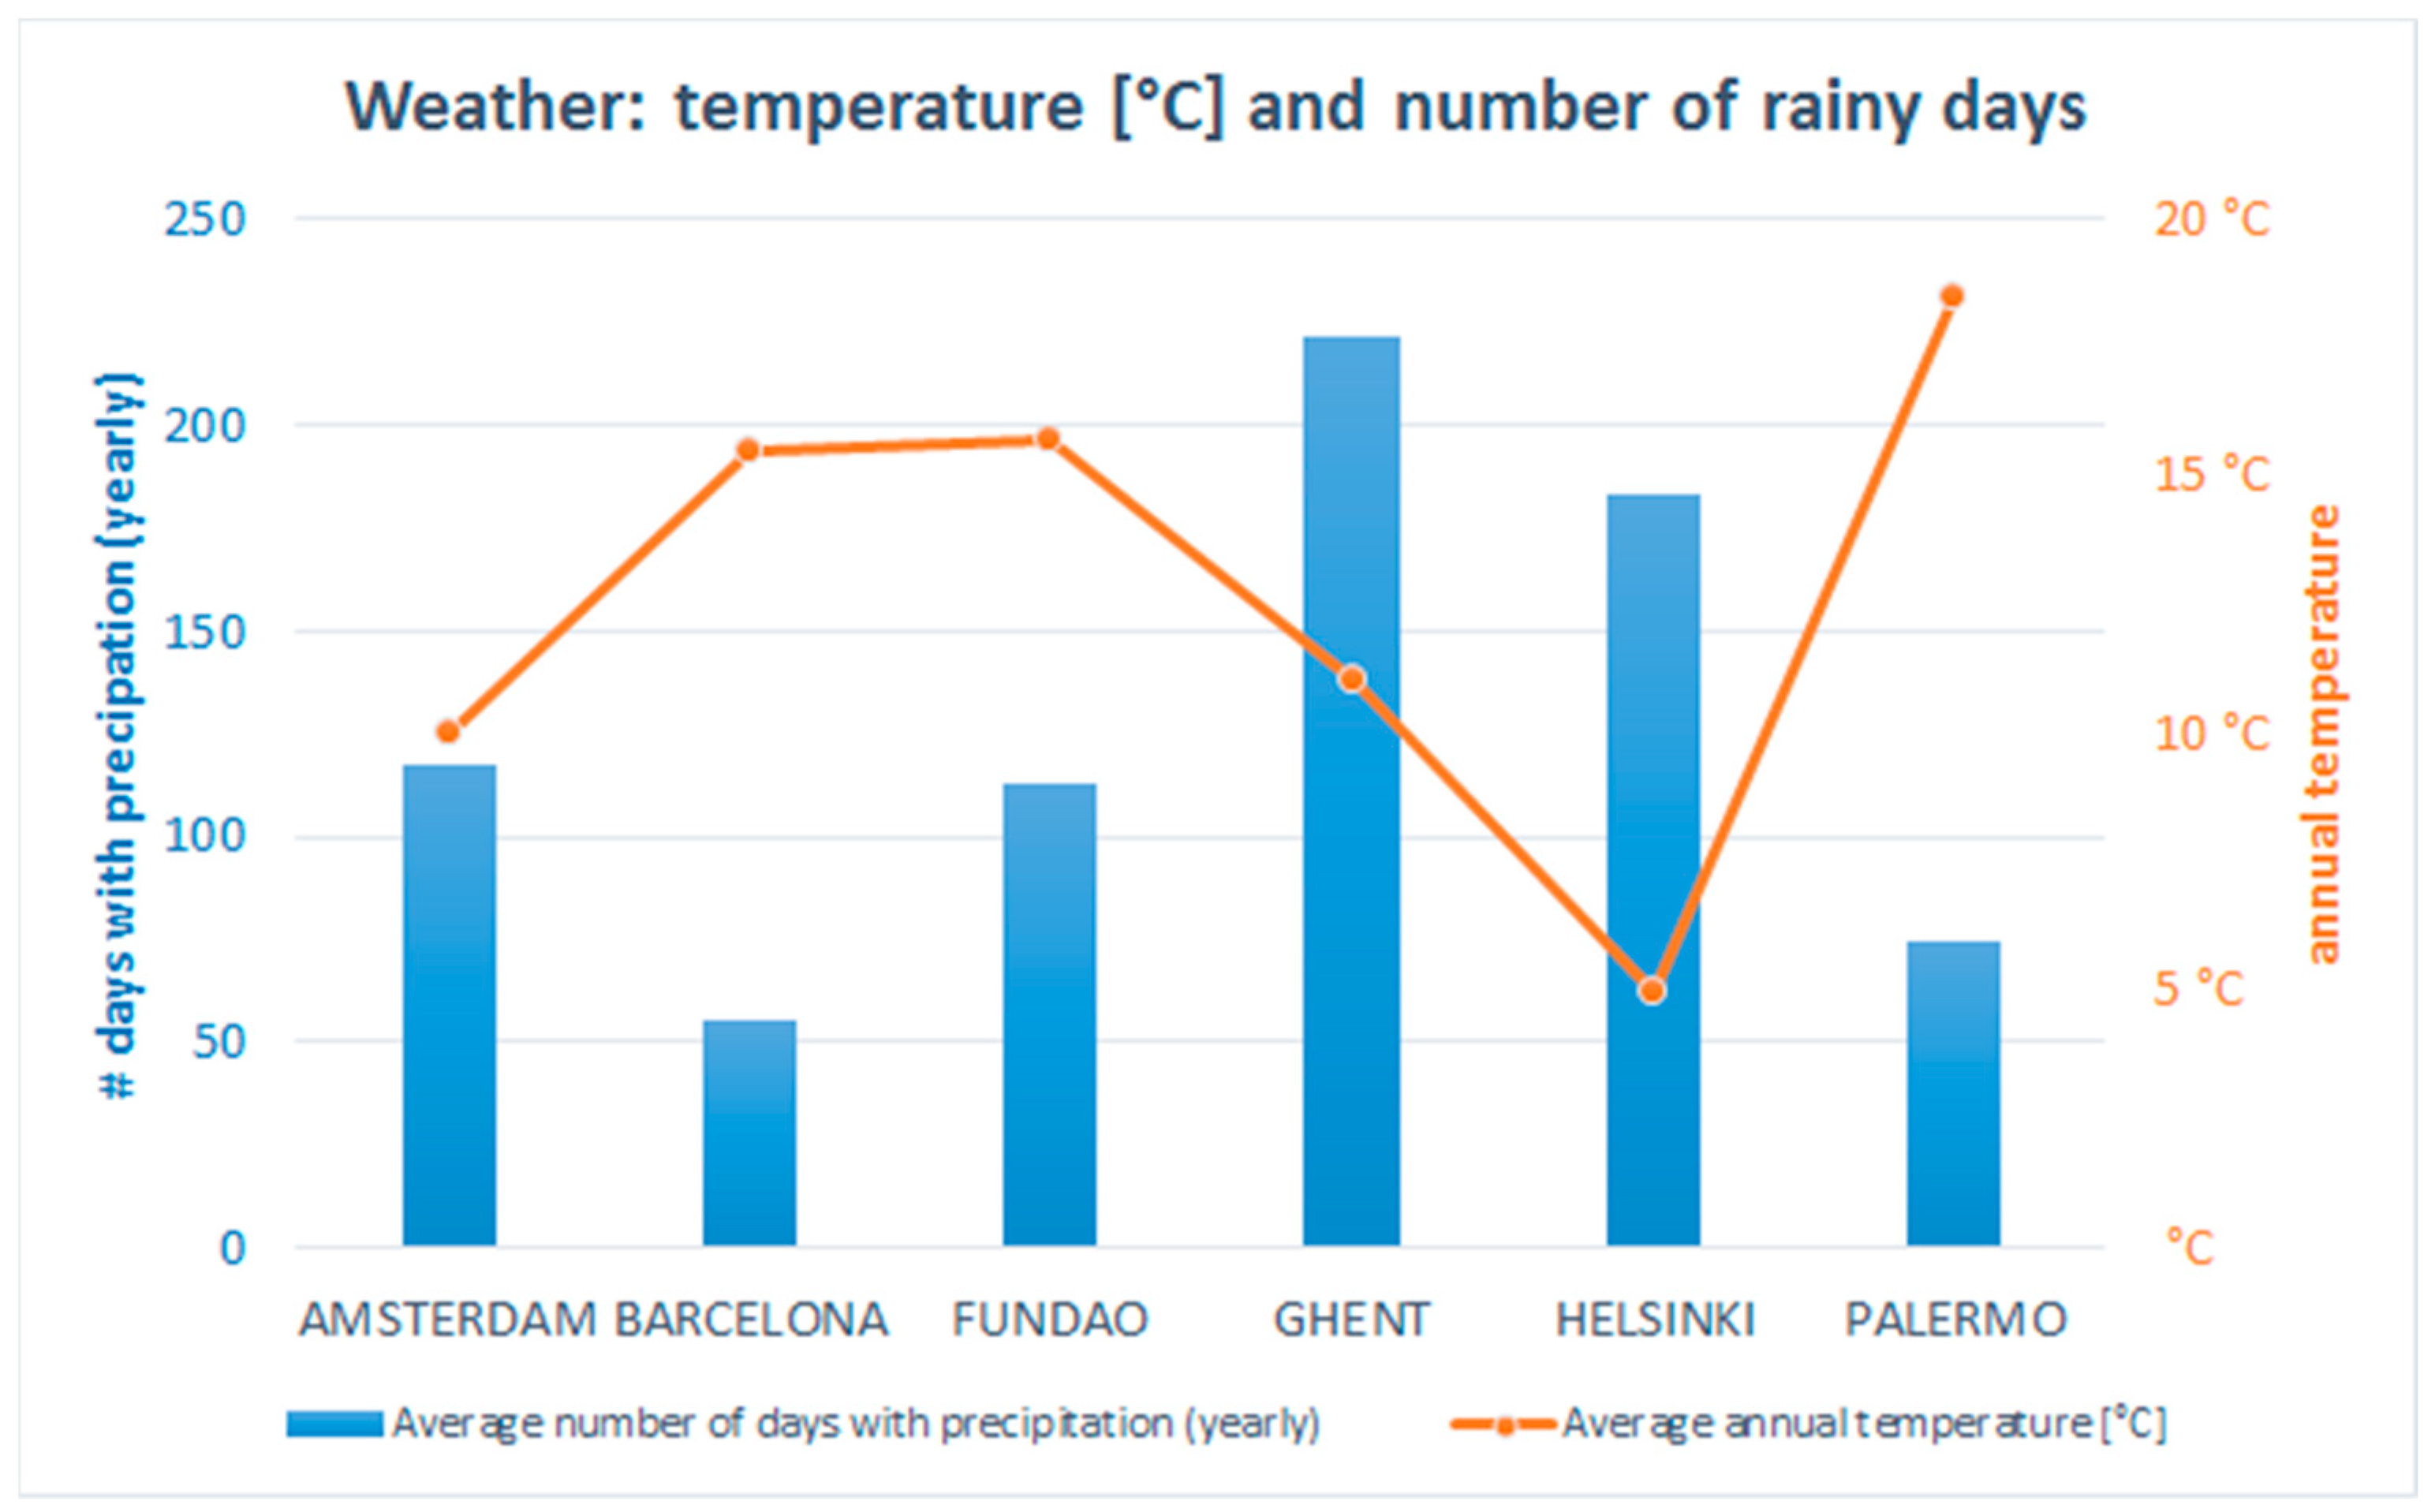
- as shown in Figure 9, the six cities are very different for their weather conditions (C60, C61), that could constitute a relevant factor in the mobility choice of each individual (e.g., walk, bike). Palermo is the hottest pilot and among the least rainy cities (average annual temperature: 18 °C; the average number of days with precipitation in the year: 74.3). In Ghent, it rains two days out of three (221 days of precipitation in one year), while Helsinki is the coldest city (average annual temperature: 5 °C).
4. Discussion
Author Contributions
Funding
Conflicts of Interest
Appendix A

| Indicator (Code, Name, Unit of Measurement, Short Description) | Baseline Value | Counter Factual | Data Source |
|---|---|---|---|
| IA1.S1.1 Awareness level [%] % of people in the pilot with knowledge of MUV | AMS 0.13% BCN 19.31% FUN 0.00% GEN 10.14% HEL 36.43% PAL 38.44% | B | pilot managers |
| IA1.S1.2 Involvement level [%] % of people in the pilot involved in the co-creation activities and/or other MUV-related activities | AMS 50.37% BCN 4.47% FUN 0.00% GEN 15.17% HEL 0.41% PAL 3.60% | B | pilot managers |
| IA1.S1.3 Acceptance level [%] % of people in the pilot registered to MUV app | AMS 11.03% BCN 0.21% FUN 0.00% GEN 0.67% HEL 0.05% PAL 0.37% | B | MUV app |
| IA1.S1.4 Activeness level [%] % of active players in the pilot | 0 (all the neighborhoods) | B | MUV app |
| IA1.S1.5 Perseverance level [%] % of players continuously active in the year | 0 (all the neighborhoods) | B | MUV app |
| IA1.S2.1 Sustainable mobility habits [%] % of kms traveled in a sustainable way (walk/bike/public transport) on frequent routes | AMS 84.77% BCN 81.78% FUN 23.66% GEN 73.27% HEL 65.95% PAL 53.97% | C | MUV app |
| IA1.S2.2 Use of private car [%] % of kms traveled by private car on frequent routes | AMS 6.21% BCN 10.12% FUN 47.03% GEN 20.37% HEL 29.33% PAL 32.22% | C | MUV app |
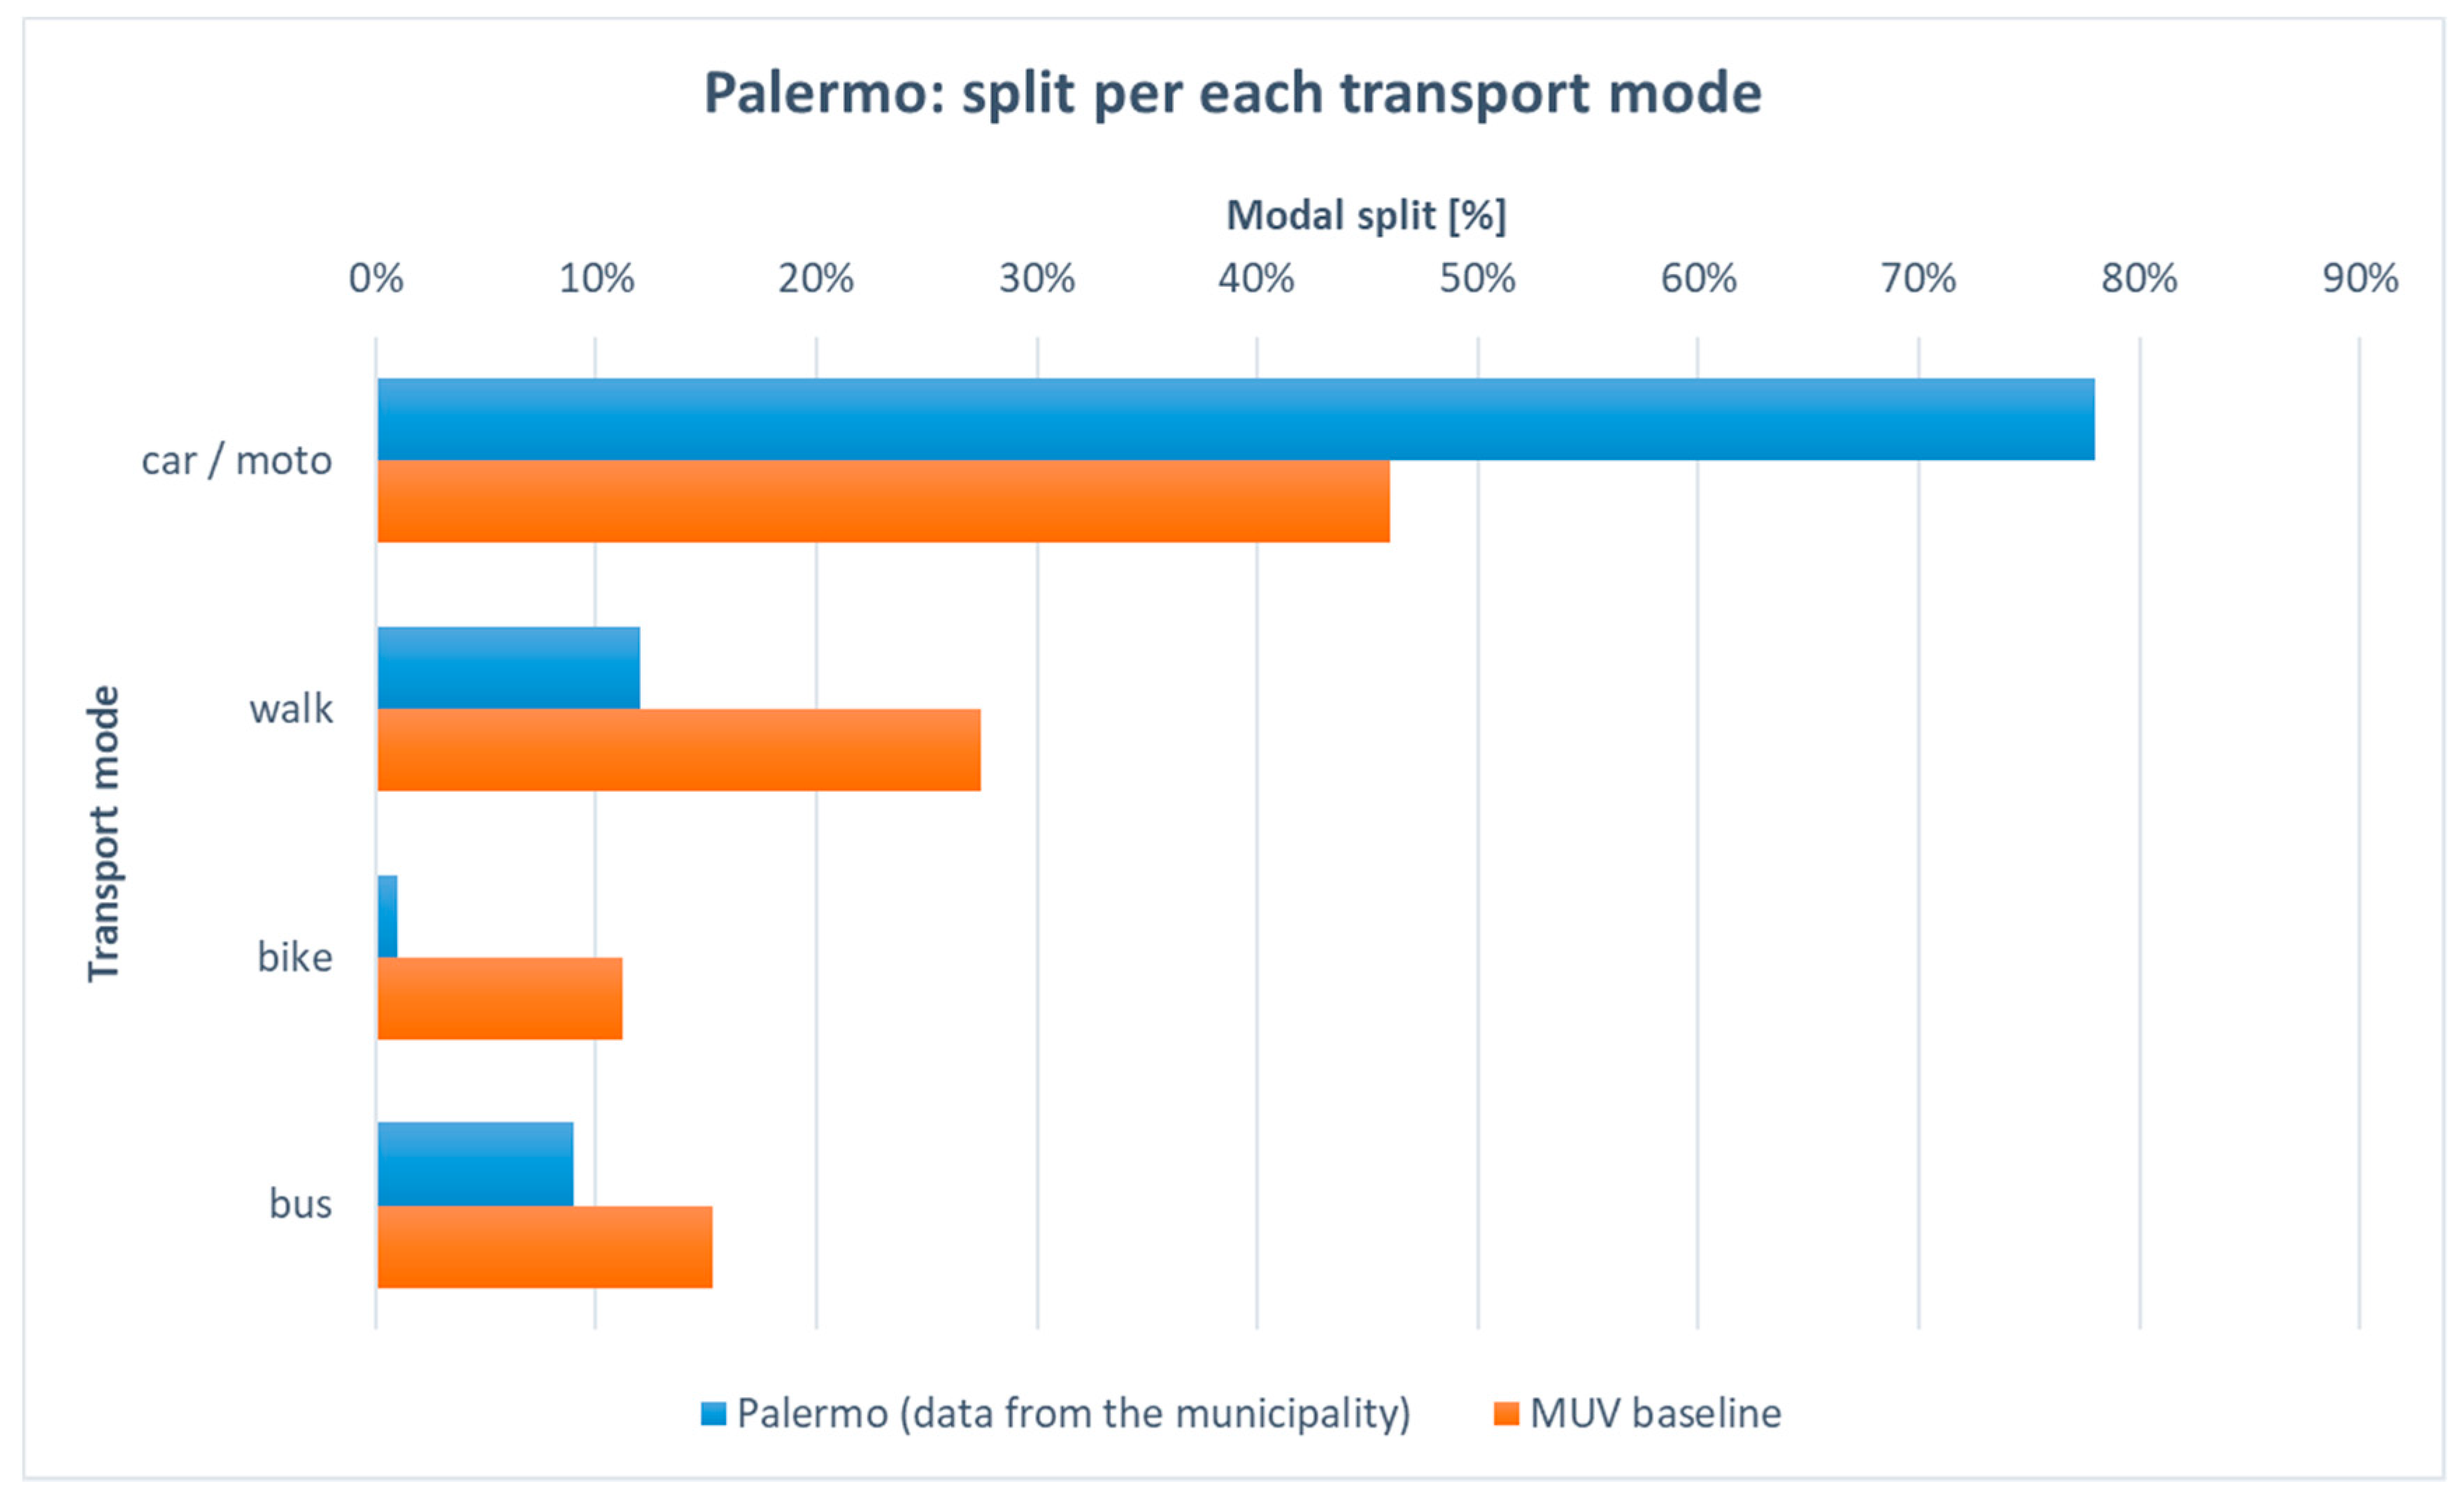
| IA1.S2.3 Modal split [%] % of kms traveled using each mode (walk, bike, public transport, private car, motorbike, carpooling) on frequent routes (6–elements array) | AMS 16.90%; 43.24%; 24.63%; 6.21%; 4.51%; 4.51% BCN 24.04%; 11.20%; 46.53%; 10.12%; 7.17%; 0.94% FUN 17.50%; 2.39%; 3.77%; 47.03%; 12.32%; 16.99% GEN 9.28%; 49.39%; 14.60%; 20.37%; 4.54%; 1.81% HEL 15.30%; 17.27%; 33.38%; 29.33%; 2.36%; 2.36% PAL 27.42%; 11.23%; 15.32%; 32.22%; 11.05%; 2.76% | C | MUV app |
| IA1.S2.4 Travel time [minutes/day] average daily time spent traveling using each mode (walk, bike, public transport, private car, motorbike, carpooling) on frequent routes (6–elements array) | AMS 64.7; 33.1; 23.2; 4.2; 5.4; 5.4 BCN 90.6; 18.5; 41.6; 11.1; 15.5; 3.9 FUN 59.4; 20.1; 21.9; 15.3; 7.9; 9.4 GEN 50.9; 32.4; 20.9; 9.3; 4.8; 3.3 HEL 32.3; 13.1; 20.0; 16.1; 5.1; 5.1 PAL 39.8; 26.4; 20.9; 13.7; 13.6; 5.3 | C | MUV app |
| IA1.S3.1 Community cohesion among travelers [people/car] level of contact between people living in the community, perception of being part of their community. Proxy: average carpooling vehicle occupancy | NA (the app does not have the carpooling functionality, yet) | - | MUV app |
| IA1.S4.1 Physical activity [cal/person*week] physical activity performed via active transport (walk and bike) on frequent routes. Proxy: average calories burned on frequent routes | AMS 1971.21 BCN 1810.68 FUN 1326.70 GEN 1518.33 HEL 877.33 PAL 849.63 | C | MUV app |
| IA2.S1.1 Planning process [5–level Likert scale] changes in the process to develop mobility plans, thanks to MUV, in terms of strategic level vision, level of public involvement, sector integration, institutional cooperation, monitoring and evaluation, finance, implementation. Linked to the indicator “public investments” (IA3.S2.1) | 1 (all the neighborhoods) | A | local decision makers |
| IA2.S1.2 Quality of policies, plans, and programs [5–level Likert scale] qualitative evaluation of the change in the process to develop policies, plans, and programs | 1 (all the neighborhoods) | A | local decision makers |
| IA2.S2.1 Rules and regulations [5–level Likert scale] the extent to which MUV has contributed to, or inspired, changes in rules and regulations (i.e., if MUV is able to change the context in which it is applied, by providing a different interpretation of existing rules and regulations) | 1 (all the neighborhoods) | A | local decision makers |
| IA2.S2.2 Policies [5–level Likert scale] the extent to which MUV has contributed to, or inspired, changes in the current urban mobility policies (e.g., update SUMP (sustainable urban mobility plan)) | 1 (all the neighborhoods) | A | local decision makers |
| IA2.S2.3 Policy making process [5–level Likert scale] the extent to which MUV has contributed to, or inspired, changes in the process to develop policies and programs, in terms of strategic level vision, level of public involvement, sector integration, institutional cooperation, monitoring and evaluation, finance, implementation | 1 (all the neighborhoods) | A | local decision makers |
| IA2.S2.4 Finance [5–level Likert scale] the extent to which MUV has contributed to—or inspired—the development of new forms of financing of mobility solutions | 1 (all the neighborhoods) | A | local decision makers |
| IA2.S2.5 Cooperation structures with stakeholders [5–level Likert scale] the extent to which MUV has changed the cooperation structures between public and private stakeholders to develop and implement sustainable mobility solutions | 1 (all the neighborhoods) | A | local decision makers |
| IA2.S3.1 Quality of open data [5–level Likert scale] the extent to which MUV has changed the level of quality of mobility open data | 1 (all the neighborhoods) | A | local decision makers |
| IA2.S3.2 Open datasets [#] # of open mobility (government) datasets born, thanks to MUV | 0 (all the neighborhoods) | A | local decision makers |
| IA3.S1.1 Global sponsors involvement [%] involvement of global sponsors in the community (global sponsor: organization providing goods and services globally or nationally) | 0 (all the neighborhoods) | B | pilot managers |
| IA3.S1.2 Community interaction with global sponsors [%] level of interaction of the community with the global sponsors. Proxy: # check–in (and all CTA–call–to–action, if any) at global sponsors/# active players | 0 (all the neighborhoods) | B | MUV app |
| IA3.S1.3 Local sponsors involvement [%] involvement of local sponsors in the community (local sponsor: public or private organization providing goods and services inside the neighborhood) | 0 (all the neighborhoods) | B | pilot managers |
| IA3.S1.4 Community interaction with local sponsors [%] level of interaction of the community with the local sponsors. Proxy: # check–in (and all CTA–call–to–action, if any) at local sponsors/# active players | 0 (all the neighborhoods) | B | MUV app |
| IA3.S2.1 Public investments [€] amount of investments of the municipality on new mobility initiatives, thanks to MUV | 0 (all the neighborhoods) | A | local decision makers |
| IA3.S2.2 Private investments [€] amount of investments of the sponsors on MUV and MUV-related initiatives | 0 (all the neighborhoods) | A | global/local sponsors |
| IA3.S3.1 Innovative environment [5–level Likert scale] the extent to which MUV increases the level of innovativeness of the urban environment, in terms of exploiting new mobility-related opportunities for helping enterprises to innovate or innovate more | 1 (all the neighborhoods) | A | local decision makers |
| IA3.S3.2 Economic activity [5–level Likert scale] the extent to which MUV impacts the economic activity of the pilot, in terms of, for instance, job creation and additional economic activity (e.g., creation of leisure-based networks) | 1 (all the neighborhoods) | A | local decision makers |
| IA3.S3.3 Open data exploitation [#] third-party developments: number of apps/services/API calls developed by third parties from MUV open data | 0 (all the neighborhoods) | A | pilot managers |
| IA4.S1.1 CO2 emissions from road traffic [g/km] average emissions of CO2 per km traveled on frequent routes | AMS 1971.2 BCN 1810.7 FUN 1326.7 GEN 1518.3 HEL 877.3 PAL 849.6 | C | MUV app |
| IA4.S1.2 CO2 level [ppm] the concentration of CO2 in the neighborhood (still unsure that monitoring stations will measure this value) | NA | - | MUV monitoring stations (still unsure) |
| IA4.S2.1 Noise level [dB] level of noise in the neighborhood | NA | - | MUV monitoring stations |
| IA4.S2.2 NOx emissions from road traffic [g/km] average emission factors of NOx per km traveled on frequent routes | AMS 0.104 BCN 0.201 FUN 0.189 GEN 0.102 HEL 0.182 PAL 0.161 | C | MUV app |
| IA4.S2.3 NO2 level [µg/m3] the average concentration of NO2 in the neighborhood | NA | - | MUV monitoring stations |
| IA4.S2.4 PM2.5 emissions from road traffic [mg/km] average emissions of PM2.5 per km traveled on frequent routes | AMS 0.752 BCN 2.300 FUN 1.958 GEN 1.512 HEL 4.079 PAL 6.490 | C | MUV app |
| IA4.S2.5 PM2.5 concentration [µg/m3] the average concentration of PM2.5 in the neighborhood | NA | - | MUV monitoring stations |
| IA4.S2.6 PM10 concentration [µg/m3] the average concentration of PM10 in the neighborhood | NA | - | MUV monitoring stations |
| IA4.S2.7 CO emissions from road traffic [g/km] average emissions of CO per km traveled on frequent routes | AMS 0.500 BCN 0.462 FUN 0.764 GEN 0.748 HEL 0.363 PAL 0.893 | C | MUV app |
| IA4.S2.8 CO level [ppm] the average concentration of CO in the neighborhood (still unsure that monitoring stations will measure this value) | NA | - | MUV monitoring stations (still unsure) |
| IA4.S3.1 Energy consumption from road traffic [kgoe/km] average energy consumption per km traveled on frequent routes | AMS 0.013 BCN 0.019 FUN 0.045 GEN 0.019 HEL 0.032 PAL 0.029 | C | MUV app |
| Code | Context Indicator | Geographic Level | Data Source |
|---|---|---|---|
| C1 | NUTS3 code | - | - |
| C2 | Neighborhood name | neighborhood | pilot coordinator |
| C3 | Area dimension | neighborhood | pilot coordinator |
| C4 | Population of the neighborhood | neighborhood | pilot coordinator |
| C5 | Population of the city | city | UrbiStat |
| C6 | Population density in the neighborhood | neighborhood | computation |
| C7 | Age structure | neighborhood | pilot coordinator |
| C8 | Age structure | city | pilot coordinator |
| C9 | Average available income (yearly) | NUTS2 | EUROSTAT (2014) |
| C10 | Driving age population | city | UrbiStat |
| C11 | Business density | neighborhood | pilot coordinator |
| C12 | Landmarks and historic features | neighborhood | pilot coordinator |
| C13 | Shopping areas/commercial centers | neighborhood | pilot coordinator |
| C14 | Neighborhood assets | neighborhood | pilot coordinator |
| C15 | Employment rate | NUTS2 | EUROSTAT (2017) |
| C16 | Unemployment rate | NUTS2 | EUROSTAT (2017) |
| C17 | Smartphone ownership | country | Google Consumer Barometer |
| C18 | Internet use on the move (total) | country | Study (2017) |
| C19 | Internet use on the move (by age group) | country | EUROSTAT (2017) |
| C20 | Public transport | neighborhood | EUROSTAT (2017) |
| C21 | Public transport | neighborhood | pilot coordinator |
| C22 | Public transport | neighborhood | pilot coordinator |
| C23 | Public transport | neighborhood | pilot coordinator |
| C24 | Public transport | neighborhood | pilot coordinator |
| C25 | Public transport | city | pilot coordinator (Moovit where available) |
| C26 | Public transport | city | pilot coordinator |
| C27 | Public transport | city | pilot coordinator |
| C28 | Public transport | city | pilot coordinator |
| C29 | Public transport | neighborhood | pilot coordinator |
| C30 | Bike | neighborhood | info will be derived from the maps |
| C31 | Bike | neighborhood | info will be derived from the maps |
| C32 | Bike | neighborhood | Computation |
| C33 | Bike | city | pilot coordinator |
| C34 | Walk | neighborhood | pilot coordinator |
| C35 | Walk | neighborhood | info will be derived from the maps |
| C36 | Private car | country | Computation |
| C37 | Private car | city, otherwise country | EUROSTAT (2016) |
| C38 | Shared services | city | pilot coordinator |
| C39 | Shared services | city | pilot coordinator |
| C40 | Shared services | city | pilot coordinator |
| C41 | Shared services | city | pilot coordinator |
| C42 | Shared services | city | pilot coordinator |
| C43 | Transport costs | city | pilot coordinator |
| C44 | Transport costs | country | pilot coordinator |
| C45 | Transport costs | neighborhood | www.globalpetrolprices.com (11 June 2018) |
| C46 | Traffic congestion | neighborhood | pilot coordinator |
| C47 | Traffic congestion | city | pilot coordinator |
| C48 | Traffic congestion | city | TomTom traffic index where available, otherwise pilot coordinator (Fundao) |
| C49 | Traffic congestion | city | TomTom traffic index where available, otherwise pilot coordinator (Fundao) |
| C50 | Traffic congestion | neighborhood | TomTom traffic index where available, otherwise pilot coordinator (Fundao) |
| C51 | Traffic congestion | neighborhood | pilot coordinator |
| C52 | Traffic congestion | city | pilot coordinator |
| C53 | Traffic congestion | city | pilot coordinator |
| C54 | Traffic congestion | city | pilot coordinator |
| C55 | Safety and security | city | pilot coordinator |
| C56 | Safety and security | city | EUROSTAT (2016) |
| C57 | Safety and security | city | pilot coordinator |
| C58 | Safety and security | city | pilot coordinator |
| C59 | Safety and security | city | pilot coordinator |
| C60 | Weather conditions | city | pilot coordinator |
| C61 | Weather conditions | city | WeatherBase |
| C62 | Sustainable urban mobility plan (SUMP) | city | WeatherBase |
| C63 | Easements | city/neighborhood | pilot coordinator |
| C64 | Mobility policies | city | pilot coordinator |
| C65 | Mobility initiatives/infrastructure already planned | neighborhood | pilot coordinator |
| C66 | Mobility initiatives/infrastructure already planned | city | pilot coordinator |
| Code | Amsterdam | Barcelona | Fundao | Ghent | Helsinki | Palermo |
|---|---|---|---|---|---|---|
| C1 | NL329 (NL326 in NUTS2013) | ES511 | PT16H | BE234 | FI1B1 | ITG12 |
| C2 | Buitenveldert | Sant Andreu de Palomar | Old Town | Muide–Meulestede | Jätkäsaari | Centro storico (Old town) |
| C3 | 6.57 | 1.84 | 2.77 | 1.51 | 1.16 | 2.50 |
| C4 | 20,219 | 57,223 | 9236 | 5729 | 3026 | 23,384 |
| C5 | 833,624 | 1,620,809 | 27,912 | 257,029 | 620,715 | 673,735 |
| C6 | 3077 | 31,099 | 3334 | 3794 | 2609 | 9365 |
| C7 | 0–14: 12.3% 15–64: 66.0% 65–74: 11.3% 75+: 10.4% | 0–14: 13.2% 15–64: 66.6% 65–74: 10.2% 75+: 10.0% | 0–14: 14.91% 15–64: 66.23% 65–74: 9.85% 75+: 9.01% | 0–14: 21,9% 15–64: 67,6% 65–74: 5,3% 75+: 5,2% | unknown | 0–14: 17.6% 15–64: 70.0% 65–74: 6.3% 75+: 6.1% |
| C8 | 0–14: 15.6% 15–64: 72.6% 65–74: 6.9% 75+: 4.8% | 0–14: 12.6% 15–64: 65.8% 65–74: 10.1% 75+: 11.5% | 0–14: 11.75% 15–64: 60.55% 65–74: 13.09% 75+: 14.61% | 0–14: 16.3% 15–64: 67.1% 65–74: 7.9% 75+: 8.7% | 0–14: 14.0% 15–64: 69.4% 65–74: 9.7% 75+: 6.9% | 0–14: 14.4% 15–64: 66.5% 65–74: 10.2% 75+: 8.9% |
| C9 | 17,200 | 16,800 | 11,600 | 18,900 | 18,400 | 11,800 |
| C10 | 684,805 | 1,376,368 | 23,905 | 207,795 | - | 556,734 |
| C11 | 177 registered firms (13.27 firms per 1000 active people) | in the CITY: 178,607 registered firms | 889 | unknown | unknown | unknown |
| C12 | Hortus Botanicus VU | - Historical memory (6 buildings) - Industrial and architectural heritage: creation factories, cultural centers - Pd: app Rutes Sant Andreu | - Municipal Museum - Moagem | - old harbor site: old crane, 19th-century harbor hangars, two small churches | None | - 95 churches - 40 convents - more than 400 aristocrats palaces |
| C13 | - shopping mall ‘Gelderlandplein’ - shopping center Rooswijk - shops in Zuidas | - commercial streets - markets | municipal market (Saturday) open-air market (Monday) supermarkets commercial streets in Old Town | - less than 10 cafes and restaurants - grocery stores (mainly run by Turkish people) - municipal market (Saturday) | - Verkkokauppa.com (home appliances and electronics outlet store) | - 4 historic markets - the high concentration of commercial activities (3 main commercial streets) |
| C14 | - 46,700 people working in the neighborhood - business district Zuidas (78% of the people working in the neighborhood) - 3 city parks - sport clubs - low key meeting facilities churches active networks international schools | Parcs Theaters Libraries Associations Strong associative community (262 associations registered). Community centres Numerous sport clubs Recreation Education and schools Churches/Religious associations Active networks | - Fablab (social/business incubator and co–working space) - Living Lab square: concerts and cultural events - two parks - Library - Bars - Moagem, cultural center - Octogono, concert hall | 2 schools, neighborhood centre, community centre, small youth centre, cultural centre (usually for small concerts/theatre plays), church might also get new possibilities for cultural events, small library mainly for kids and elderly people in local community centre | - passenger port - Kaapelitehdas event arena - Hotel Clarion (conference center, 16th floor sky bar) | - 7 theaters - nightlife (restaurants, pubs, bars) |
| C15 | 76.4% | 68.4% | 79.6% | 70.3% | 74.4% | 46.1% |
| C16 | 4.5% | 13.4% | 7.1% | 3.4% | 7.7% | 21.5% |
| C17 | 87% | 87% | 67% | 71% | 79% | 76% |
| C18 | 87% | 78% | 58% | 75% | 79% | 32% |
| C19 | 16–24: 98% 25–54: 92% 55–74: 72% | 16–24: 95% 25–54: 89% 55–74: 49% | 16–24: 95% 25–54: 69% 55–74: 24% | 16–24: 92% 25–54: 84% 55–74: 52% | 16–24: 96% 25–54: 91% 55–74: 55% | 16–24: 72% 25–54: 35% 55–74: 11% |
| C20 | 5 | 9 | 0 | 2 | 3 | 11 |
| C21 | 43 | 24 | 1 | 12 | 6 | 52 |
| C22 | 0 | 1 | 0 | 0 | 0 | 0 |
| C23 | 0 | 2 | 0 | 0 | 0 | 0 |
| C24 | 0 | 2 | 1 | 0 | 0 | 1 |
| C25 | unknown | 10 min | NA (timetabled buses). | 15 min | 4 min | 23 min |
| C26 | 220.384 | 985,066 millions trips in year 2017 (total)/365 days = 2699 millions daily trips | unknown | unknown | unknown | 280,000 |
| C27 | 20 | 4.98 users/km used 166.98 users–km/1000 Average journey in Km: 2.80 (191.22 Km bus lanes in the city) (3388.12M bus places/km) | unknown | unknown | unknown | unknown |
| C28 | 100% diesel buses (2% euro IV, 72% euro V, 26% euro VI) | 45.71% diesel buses (lower than Euro III) 34.84% of CNG buses 0.37% of electric buses 19.08% hybrid buses (diesel-electric/CNG/electric) | 100% diesel buses | 57% diesel buses (legisl. std) 43% other (hybrid buses) Remark that there are also many trams in Ghent (tram: 28% of the total amount of driven km) | unknown | unknown |
| C29 | info will be derived from the maps | info will be derived from the maps | info will be derived from the maps | info will be derived from the maps | info will be derived from the maps | info will be derived from the maps |
| C30 | info will be derived from the maps | info will be derived from the maps | info will be derived from the maps | 9 km cycling infrastructure | 2 km of cycle lanes | 4.5 km of cycle lanes |
| C31 | - | - | - | - | 0.26% | 0.27% |
| C32 | unknown | in the CITY: 27,281 (26,158 park places on the street/1123 underground parking) | 25 places | 41 places | unknown | unknown |
| C33 | 780 (from age 12+) | 106,453 biking users/6000 bikes (public) 165,499 daily trips (43,836 daily trips by biking) | unknown | 823 have at least one bike (stadsmonitor) | unknown | unknown |
| C34 | info will be derived from the maps | info will be derived from the maps | - 220 m of pedestrian streets - no pedestrian squares | info will be derived from the maps | - 1 km of pedestrian streets - no pedestrian squares | - 175,487 m2 of pedestrian squares |
| C35 | - | - | 0.03% | - | 0.34% | 7.03% |
| C36 | 481 | 492 | 470 | 503 | 604 | 625 |
| C37 | unknown | 1.6 | 1.2 (country) | 1.12 (based on MobOnderzoek 2015 - aantal autobestuurders en auto inzittenden) | unknown | unknown |
| C38 | 4000 taxis | 10,522 | 25 | 220 | 1500 | unknown |
| C39 | Yes (Uber) | Yes (Cabify) | No | No | No | No |
| C40 | Yes (Toogether) | No | Not structured | Yes | No | No |
| C41 | 4233 cars | 399 VTC (chauffeur–driven vehicles) licenses/driving age people | No | 2.04 | 250 vehicles | - 85 car sharing parking lots (300 parking spaces) - 140 cars |
| C42 | - 2 bike sharing stations, 7 fast/easy bike rentals at train stations (not for tourists) - an unknown number of bikes | - 465 bike sharing stations (45 are electric ones) - 6300 bikes (300 are electric ones) | no | 0.4 (excluding bike sharing system of national railway company) (Trapido) | 150 stations, 2550 bicycles -> 0.004 bicycles per inhabitant | - 35 bike sharing stations - 238 bikes |
| C43 | € 47.00 | € 54.00 | unknown | € 53.00 | € 54.70 | € 32.00 |
| C44 | € 1.68 | € 1.33 | € 1.60 | € 1.48 | € 1.56 | € 1.62 |
| C45 | € 1.40 | € 2.25 | € 0.90 | € 0.80 | € 4.00 | € 1.00 |
| C46 | 17–18 | 8–9; 17–20 | no (just parking) | 8–9; 16:30–18 | several short ones related to ferry schedules | 8–9/17–19 |
| C47 | 34% | 32% | unknown | 30% | 31% | 46% |
| C48 | 35% | 51% | unknown | 32% | 40% | 61% |
| C49 | 52% | 52% | unknown | 34% | 48% | 69% |
| C50 | 13433 | in the CITY: 114,105 for cars + 68,250 for motorbikes + 10,513 good distribution vehicles | unknown | 2301 | unknown | unknown |
| C51 | 764 (public parking space) | in the CITY: 591,612 off-street parking spaces | unknown | 0 | unknown | 1103 |
| C52 | 2.4 | 2.75 | 1 | 2.14 | 3.16 | unknown |
| C53 | 3.07 | 4.96 | 2 | 2.14 | 4.5 | unknown |
| C54 | 2.4 | 2.75 | 1 | 2.14 | 3 | unknown |
| C55 | 0.13 | 0.255 | 1.07 | 0.428 | 0.048 | 0.371 |
| C56 | 3474 | 1698 (2017) | 80 (2017) | unknown | unknown | 2256 (2016) The Palermo municipality provide only the aggregated data related to the number of accidents occurred. |
| C57 | 188 | 601 (2017) | unknown | unknown | unknown | |
| C58 | 96 | 650 (2017) | 6 (2017) | unknown | unknown | |
| C59 | 621 | 411 (2017) | unknown | unknown | unknown | |
| C60 | 117 | 55 | 112.5 | 221 | 183 | 74.3 |
| C61 | 10.0 °C | 15.5 °C | 15.7 °C | 11.0 °C | 5.0 °C | 18.5 °C |
| C62 | Yes | Yes | Yes | Yes | Yes | Under development |
| C63 | - subsidies for electric cars - the network of charge–stations in the public (and non–public) space - environmental zones for trucks, work-buses, taxis, and scooters - a lot of areas with max. 1 parking permit per household - park and ride facilities | - Subsidies, free surface public on the street and free tolls to buy an electric vehicle - Subsidies for electric bikes purchase (PIVE plan–AMB) - Awareness campaigns (motorcycles, Workplace Road Safety Campaign) - Incentives to renovate or sell old cars (T–Verda) | - neigh. inhabitants have a free parking pass (for one car) - national incentives for electric cars | - neigh. inhabitants have a free parking pass (for one car) - subsidies for electric car sharing, bike sharing, electric bikes, CNG | 50% discount on parking for low–emission vehicles | - Carsharing vehicles have access to the restricted traffic area and can travel along taxi lanes. - The first half hour of use of the bike sharing system is always free. |
| C64 | - policy priorities for bikes (direct and smooth bike routes, removal of unused bikes in the parking, new biking policy measure) - special attention to road safety (in particular for vulnerable users) - stimulate usage of bikes | - Reduce the number of accidents - Facilitate modal shift towards more sustainable modes. - Reduce air and noise pollution resulting from transportation - Reduce energy consumption in transportation - Ensure accessibility to the mobility system. - Increase the efficiency of transportation systems. | - parking meters to control parking spaces → little impact due to the lack of enforcement (little control of who pays and who doesn’t). | - increasing the car–parking zone outside the city center | - 5-level traffic planning guideline (pedestrians and cycling are a top priority, followed by public transport, logistics and only as of the last priority the private car traffic) | - Limited Traffic Zone (ZTL) in Centro Storico - Two free shuttles that connect the key areas of the old town with the central railway station - Pedestrianization process of streets and squares - Enhancement of bike and car sharing stations |
| C65 | Not at a neighborhood level. | Improve the infrastructure for bus and bikes: increase of bike lanes km, increase of bus lines and of bus lanes km Remarkable works in street “Carrer Gran” (May 2018–May 2019) | construction of cycling paths (in 2018) construction of new bike parking spaces | - new bridge replacing the old one (2022) - new bridge in the south (construction starts in 2019) - the whole neighborhood will become paid parking (not clear yet when) - new cycling and pedestrian areas along the canal - new housings planned | - the former logistics port is being converted into a residential area, traffic planning & construction related to ferry terminal ongoing till 2020 - two more indoor parking facilities (by 2020) - multiple mobility service trials starting summer 2018 | - Railway ring under construction with two stops inside the old town - New bicycle lanes planned |
| C66 | More railways will be built and therefore more trains will run. Several streets will become biking streets with the car being guest. In July ‘18 a new underground line is being opened, making a fast connection from north to south. | - Organization of the city’s urban pattern in superblocks - Implementation of the new orthogonal bus network - Development of the cycling network - Promotion and positive discrimination measures of high occupancy vehicles - Review of the regulation of parking on and off road | - | - car sharing - cycling infrastructure - Low Emission Zone (from 01/01/2020) | - a western extension to metro (end of 2017) - bicycle highways (year?) - new tram lines (year?) - new legislation from June 2018 (major deregulation) will pave way for new transport services, including sharing services (e.g., Lyft, Uber) | - Restricted Traffic Zone (ZTL) also outside Centro Storico - Carsharing fleet (IoGuido) will reach 555 vehicles by 2020 - Extension of cycling paths planned by PGTU, from the current 20 km to 145 km |
References
- United Nations General Assembly. Transforming Our World: The 2030 Agenda for Sustainable Development (A/RES/70/1), 21 October 2015. Available online: https://www.refworld.org/docid/57b6e3e44.html (accessed on 9 April 2019).
- Wendel, S. Designing for Behavior Change: Applying Psychology and Behavioral Economics, 1st ed.; O’Reilly Media, Inc.: Sebastopol, CA, USA, 2013. [Google Scholar]
- Strengers, Y.; Maller, C. Social Practices, Intervention and Sustainability—Beyond Behaviour Change, 1st ed.; Routledge: Oxon, UK, 2015. [Google Scholar]
- Caillois, R. Man, Play and Games; University of Illinois: Urbana, IL, USA, 2001. [Google Scholar]
- Deterding, S.; Sicart, M.; Nacke, L.; O’Hara, K.; Dixon, D. Gamification: Using game-design elements in non-gaming contexts. In Proceedings of the International Conference on Human Factors in Computing Systems (CHI 2011), Extended Abstracts Volume, Vancouver, BC, Canada, 7–12 May 2011; pp. 2425–2428. [Google Scholar]
- Hamari, J.; Koivisto, J.; Sarsa, H. Does Gamification Work?—A Literature Review of Empirical Studies on Gamification. In Proceedings of the 47th Hawaii International Conference on System Sciences, Waikoloa, HI, USA, 6–9 January 2014; pp. 3025–3034. [Google Scholar]
- Bozkurt, A.; Durak, G. A systematic review of gamification research: In pursuit of homo ludens. Int. J. Game-Based Learn. 2018, 8, 15–33. [Google Scholar] [CrossRef]
- Di Dio, S.; Peri, G.; Rizzo, G.; Vinci, I. Design, technology and social innovation: the serious game of Traffic O2. In Participatory Design Theory: Using Technology and Social Media to Foster Civic Engagement; Routledge: London, UK; New York, NY, USA, 2019; pp. 145–156. ISBN 9781138087682. [Google Scholar]
- Groos, K. The Play of Man; D. Appleton and Company: New York, NY, USA, 1901. [Google Scholar]
- Suits, B.H. The Grasshopper: Games, Life and Utopia, 3rd ed.; Broadview Press Ltd.: Peterborough, ON, Canada, 2005. [Google Scholar]
- Csikszentmihalyi, M. Flow: The Psychology of Optimal Experience, 1st ed.; HarperCollins Publishers Inc.: New York, NY, USA, 2008. [Google Scholar]
- MUV Mobility Urban Values. Available online: https://www.muv2020.eu/ (accessed on 9 April 2019).
- Lissandrello, E.; Morelli, N.; Schillaci, D.; Di Dio, S. Urban innovation through co–design scenarios. In Conference on Smart Learning Ecosystems and Regional Development; Springer: Cham, Switzerland, 2018; pp. 110–122. [Google Scholar]
- Innes, J.E.; Booher, D.E. Reframing public participation: strategies for the 21st century. Plan. Theory Pract. 2004, 5, 419–436. [Google Scholar] [CrossRef]
- Manzini, E. Making things happen: Social innovation and design. Des. Issues 2014, 30, 57–66. [Google Scholar] [CrossRef]
- Tosey, P.; Visser, M.; Saunders, M. The origins and conceptualizations of ‘triple–loop’ learning: A critical review. Manag. Learn. 2012, 43, 291–307. [Google Scholar] [CrossRef]
- Nabatchi, T.; Leighninger, M. Public Participation for 21st Century Democracy; Wiley: Hoboken, NJ, USA, 2015. [Google Scholar]
- Di Dio, S.; Lissandrello, E.; Schillaci, D.; Caroleo, B.; Vesco, A.; D’Hespeel, I. MUV: A game to encourage sustainable mobility habits. In Lecture Notes in Computer Science Vol. 11385, Proceedings of the Games and Learning Alliance Conference (GALA 2018), Palermo, Italy, 5–7 December 2018; Gentile, M., Allegra, M., Söbke, H., Eds.; Springer: Cham, Switzerland, 2019; pp. 60–70. [Google Scholar]
- CIVITAS SATELLITE D2.3—Refined CIVITAS Process and Impact Evaluation Framework (31.08.2017). Available online: http://exchange-hub.civitas.eu/system/files/satellite_d2.3_refined_evaluation_framework-final_version_2017-08-31.pdf (accessed on 9 April 2019).
- European Commission. Impact Assessment Guidelines (2009). Available online: http://ec.europa.eu/smart-regulation/impact/commission_guidelines/docs/iag_2009_en.pdf (accessed on 9 April 2019).
- Joumard, R.; Gudmundsson, H.; Folkeson, L. Framework for Assessing Indicators of Environmental Impacts in the Transport Sector. Trans. Res. Rec. 2011, 2242, 55–63. [Google Scholar] [CrossRef] [Green Version]
- Bosch, P.; Jongeneel, S.; Rovers, V.; Neumann, H.M.; Airaksinen, M.; Huovila, A. CITYkeys Indicators for Smart City Projects and Smart Cities (2017). Available online: http://nws.eurocities.eu/MediaShell/media/CITYkeystheindicators.pdf (accessed on 10 April 2019).
- Ahvenniemi, H.; Huovila, A.; Pinto–Seppä, I.; Airaksinen, M. What are the differences between sustainable and smart cities? Cities 2017, 60, 234–245. [Google Scholar] [CrossRef]
- TrafficO2. Available online: http://www.traffico2.com/data/en/index.html (accessed on 10 April 2019).
- Evaluation Unit DEVCO. Evaluation Methodological Approach (2015). Available online: https://europa.eu/capacity4dev/evaluation_guidelines/minisite/en-methodological-bases-and-approach/evaluation-tools/context-indicators (accessed on 10 April 2019).
- European Environment Agency. EMEP/EEA Air Pollutant Emission Inventory Guidebook 2016: Technical Guidance to Prepare National Emission Inventories (EEA Report No 21/2016); Publications Office of the European Union: Luxembourg, 2016. [Google Scholar]


| Label | Type of Counterfactual Estimate |
|---|---|
| A | Constructing a reference scenario together with the involved stakeholders (e.g., pilot managers, mobility experts, local decision makers). |
| B | Using the pre-MUV values at the baseline (t0) to estimate the post-MUV outcomes (counterfeit counterfactual). |
| C | Using as reference scenario the travel behavior’s information provided by the player during the registration of each frequent route (not necessarily at t0). |
| Impact Area | Impact Sub-Area | Code | Indicator |
|---|---|---|---|
| IA1 Society-People | IA1.S1 Citizens participation | IA1.S1.1 | Awareness level |
| IA1.S1.2 | Involvement level | ||
| IA1.S1.3 | Acceptance level | ||
| IA1.S1.4 | Activeness level | ||
| IA1.S1.5 | Perseverance level | ||
| IA1.S2 Behavioral change | IA1.S2.1 | Sustainable mobility habits | |
| IA1.S2.2 | Use of private car | ||
| IA1.S2.3 | Modal split | ||
| IA1.S2.4 | Travel time | ||
| IA1.S3 Community | IA1.S3.1 | Community cohesion among travelers | |
| IA1.S4 Health and wellbeing | IA1.S4.1 | Physical activity | |
| IA2 Society-Governance | IA2.S1 Planning | IA2.S1.1 | Planning process |
| IA2.S2 Governance | IA2.S1.2 | Quality of policies, plans, and programs | |
| IA2.S2.1 | Rules and regulations | ||
| IA2.S2.2 | Policies | ||
| IA2.S2.3 | Policy making process | ||
| IA2.S2.4 | Finance | ||
| IA2.S2.5 | Cooperation structures with stakeholders | ||
| IA2.S3 Open data | IA2.S3.1 | Quality of open data | |
| IA2.S3.2 | Open datasets | ||
| IA3 Economy | IA3.S1 Business network | IA3.S1.1 | Global sponsors involvement |
| IA3.S1.2 | Community interaction with global sponsors | ||
| IA3.S1.3 | Local sponsors involvement | ||
| IA3.S1.4 | Community interaction with local sponsors | ||
| IA3.S2 Investments | IA3.S2.1 | Public investments | |
| IA3.S2.2 | Private investments | ||
| IA3.S3 Innovation | IA3.S3.1 | Innovative environment | |
| IA3.S3.2 | Economic activity | ||
| IA3.S3.3 | Open data exploitation | ||
| IA4 Environment | IA4.S1 Climate change (GHG) | IA4.S1.1 | CO2 emissions from road traffic |
| IA4.S1.2 | CO2 level | ||
| IA4.S2 Pollution (emissions/noise) | IA4.S2.1 | Noise level | |
| IA4.S2.2 | NOx emissions from road traffic | ||
| IA4.S2.3 | NO2 level | ||
| IA4.S2.4 | PM2.5 1 emissions from road traffic | ||
| IA4.S2.5 | PM2.5 1 concentration | ||
| IA4.S2.6 | PM10 1 concentration | ||
| IA4.S2.7 | CO emissions from road traffic | ||
| IA4.S2.8 | CO level | ||
| IA4.S3 Energy | IA4.S3.1 | Energy consumption from road traffic |
| Area. | Code | Context Indicator | Description/Sub-Indicators |
|---|---|---|---|
| SOCIO-ECONOMIC | C1 | NUTS3 code | – |
| C2 | Neighborhood name | name of the neighborhood | |
| C3 | Area dimension | area of the neighborhood [km2] | |
| C4 | Population of the neighborhood | number of inhabitants in the neighborhood | |
| C5 | Population of the city | number of inhabitants in the city (municipality) | |
| C6 | Population density in the neighborhood | inhabitants of the neighborhood/km2 | |
| C7 | Age structure | age of residents in the neighborhood (share of the population in four age groups: 0–14; 15–64; 65–74; 75+) | |
| C8 | Age structure | age of residents in the city (share of the population in four age groups: 0–14; 15–64; 65–74; 75+) | |
| C9 | Average available income (yearly) | disposable income pro capita of private households by NUTS 2 regions expressed in PPS (Purchasing Power Standard) per inhabitant [tgs00026] | |
| C10 | Driving age population | number of inhabitants with the minimum age for driving a car without supervision | |
| C11 | Business density | number of registered firms per 1000 active people (those aged 15–64) | |
| C12 | Landmarks and historic features | Historic point of interests in the target area (e.g., monuments, museums, ancient churches) | |
| C13 | Shopping areas/commercial centers | the concentration of shopping and service centers in the area | |
| C14 | Neighborhood assets | recreation services (e.g., community centers), recreation/culture availability, cultural facilities (e.g., libraries), schools, hospitals, etc. | |
| C15 | Employment rate | inhabitants employed/working age population (15–64) [lfst_r_lfe2emprc] | |
| C16 | Unemployment rate | inhabitants unemployed/labour force unemployment rate by NUTS 2 regions—from 15 to 74 years [lfst_r_lfu3rt] | |
| C17 | Smartphone ownership | % of smartphone users in the target area | |
| C18 | Internet use on the move (total) | % of internet users on the move (use of mobile devices via mobile or wireless connection: mobile phone (or smartphone), portable computer (e.g., laptop, tablet) or another mobile device (e.g., PDA, e-book reader) away from home or work). Base: individuals aged 16 to 74 [tin00083] | |
| C19 | Internet use on the move (by age group) | % of internet users on the move by age group (16–24; 25–54; 55–74) | |
| TRANSPORT | C20 | Public transport | public transport lines (number of bus-tram lines available) |
| C21 | Public transport | public transport stops (number of bus-tram stops available) | |
| C22 | Public transport | underground lines (number of underground lines available) | |
| C23 | Public transport | underground stops (number of underground stops available) | |
| C24 | Public transport | railway stations (number of railway stations available) | |
| C25 | Public transport | waiting time: average waiting time at a bus-tram station [min] | |
| C26 | Public transport | average number of daily users of public transport | |
| C27 | Public transport | average bus occupancy (average number of passengers on a bus on a working day) | |
| C28 | Public transport | bus fleet by fuel type: share of urban bus types operating in the city (% of diesel, CNG, electric buses) | |
| C29 | Public transport | accessibility: share of the population with appropriate access to mobility services (Population living within 500 m of a bus or metro stop) | |
| C30 | Bike | cycling paths: length of cycling path [km] | |
| C31 | Bike | cycling paths (space devoted to cycling as a proportion of the target area, assuming a width of 1.5 m) | |
| C32 | Bike | bike racks (# bike racks per 1000 inhabitants) | |
| C33 | Bike | bike ownership (bikes owned per 1000 inhabitants) | |
| C34 | Walk | pedestrian areas: – length of pedestrian streets [km] – area of pedestrian squares [km2] | |
| C35 | Walk | pedestrian areas (space devoted to the pedestrian as the proportion of the target area). For pedestrian streets (given the street length), it is supposed a 4 m width. | |
| C36 | Private car | car ownership (passenger cars per 1000 inhabitants) | |
| C37 | Private car | average car occupancy | |
| C38 | Shared services | taxi: number of taxi vehicles operating | |
| C39 | Shared services | other on-demand ridesharing services (e.g., Uber) | |
| C40 | Shared services | carpooling services (e.g., BlaBlaCar) | |
| C41 | Shared services | car sharing cars (car sharing fleet size per 1000 driving age people) | |
| C42 | Shared services | bike sharing bikes and stations (number of bike sharing bikes per 1000 inhabitants) | |
| C43 | Transport costs | cost of a combined monthly ticket (all modes of public transport) [€] | |
| C44 | Transport costs | gasoline prices (June 2018) [€/l] | |
| C45 | Transport costs | average parking cost (hourly) in the neighborhood | |
| C46 | Traffic congestion | peak hours (the peak hours during the weekday) | |
| C47 | Traffic congestion | congestion level (increase in non-highways travel times when compared to a Free Flow situation) | |
| C48 | Traffic congestion | morning peak (increase in morning peak travel times when compared to a Free Flow situation) | |
| C49 | Traffic congestion | evening peak (increase in evening peak travel times when compared to a Free Flow situation) | |
| C50 | Traffic congestion | parking: number of on-street parking spaces (on or along the curb of streets, NO parking garages) | |
| C51 | Traffic congestion | parking: number of off-street parking garages/parking lots and the aggregate number of parking spaces (both indoor and outdoor parking facilities) | |
| C52 | Traffic congestion | average time to travel 1 km by car on a working day [minutes] | |
| C53 | Traffic congestion | average time to travel 1 km by bus on a working day [minutes] | |
| C54 | Traffic congestion | average time to travel 1 km by moto on a working day [minutes] | |
| C55 | Safety and security | people killed in road accidents per 10,000 population [urb_ctran] | |
| C56 | Safety and security | number of car accidents (last year available) car/car | |
| C57 | Safety and security | number of accidents involving a bike (last year available)—car/bike | |
| C58 | Safety and security | number of accidents involving pedestrians (last year available)—car/people | |
| C59 | Safety and security | number of accidents involving a bus (last year available) | |
| ENV. | C60 | Weather conditions | average number of days with precipitation (yearly) |
| C61 | Weather conditions | average annual temperature | |
| INSTITUTIONAL | C62 | Sustainable urban mobility plan (SUMP) | does a SUMP exist? |
| C63 | Easements | mobility subsidies (e.g., for electric vehicles, discounts on parking) | |
| C64 | Mobility policies | for example, limited traffic zones, priority for pedestrians, etc. | |
| C65 | Mobility initiatives/infrastructure already planned | in the neighborhood | |
| C66 | Mobility initiatives/infrastructure already planned | in other parts of the city |
© 2019 by the authors. Licensee MDPI, Basel, Switzerland. This article is an open access article distributed under the terms and conditions of the Creative Commons Attribution (CC BY) license (http://creativecommons.org/licenses/by/4.0/).
Share and Cite
Caroleo, B.; Morelli, N.; Lissandrello, E.; Vesco, A.; Di Dio, S.; Mauro, S. Measuring the Change Towards More Sustainable Mobility: MUV Impact Evaluation Approach. Systems 2019, 7, 30. https://0-doi-org.brum.beds.ac.uk/10.3390/systems7020030
Caroleo B, Morelli N, Lissandrello E, Vesco A, Di Dio S, Mauro S. Measuring the Change Towards More Sustainable Mobility: MUV Impact Evaluation Approach. Systems. 2019; 7(2):30. https://0-doi-org.brum.beds.ac.uk/10.3390/systems7020030
Chicago/Turabian StyleCaroleo, Brunella, Nicola Morelli, Enza Lissandrello, Andrea Vesco, Salvatore Di Dio, and Stefania Mauro. 2019. "Measuring the Change Towards More Sustainable Mobility: MUV Impact Evaluation Approach" Systems 7, no. 2: 30. https://0-doi-org.brum.beds.ac.uk/10.3390/systems7020030