A Multi-Methodology Approach to Creating a Causal Loop Diagram


1
Griffith Institute for Tourism, Griffith University, Gold Coast Campus 4222, Australia
2
School of Engineering and Built Environment, Griffith University, Gold Coast Campus 4222, Australia
3
Griffith Climate Change Response Program, Griffith University, Gold Coast Campus 4222, Australia
*
Author to whom correspondence should be addressed.
Systems 2019, 7(3), 42; https://0-doi-org.brum.beds.ac.uk/10.3390/systems7030042
Submission received: 7 May 2019
/
Revised: 3 June 2019
/
Accepted: 15 August 2019
/
Published: 16 August 2019
Abstract
:Developing causal loop diagrams (CLDs) involves identifying stakeholders and endogenous variables and formulating variable causal relationships. Traditionally, the CLDs are developed mainly using a qualitative approach such as literature review, observations and interviews with stakeholders. However, modellers may question which stakeholders should be approached, whether the relevant variables are selected, and what to do when stakeholders perceive different variable relationships in the CLDs differently. Applying in a case study, this research proposes a multi-method approach by combining both quantitative and qualitative methods to select stakeholders, identify endogenous/exogenous variables, and develop the CLDs. The proposed quantitative method is expected to provide modellers with a justifiable stakeholder and variable selection process. The method also highlights possible hidden variables and relationships, which were further explored with a traditional qualitative approach.
1. Introduction
The systems thinking approach is a research lens that follows a holistic worldview and non-linear system behaviour over time [1]. Using this method, researchers can demonstrate system connectivity through modelling, and illustrate system behaviours of different scenarios [1,2,3]. The modelling process includes turning a qualitative conceptual model into a final quantitative simulation [4,5]. Experts and stakeholders are crucial to illuminating variable relationships in the system under investigation [6]. This research focuses on developing a qualitative conceptual model using causal loop diagrams (CLDs).
CLDs map the hypotheses of system structures by linking causal relationships between variables [2]. The easy-to-view CLDs help to engage stakeholders during the modelling process and facilitate their mind maps [7]. CLDs are not the final simulation and are not a mandatory part of the system dynamics modelling process [8]. However, the CLDs allow a smoother transition to the final quantitative stock-and-flow diagrams used in simulation [9].
Developing the CLDs involves identifying stakeholders and endogenous variables, and formulating variable causal relationships [2]. Modellers collect, refine and revalidate data multiple times using a mainly qualitative approach including literature reviews, observations, interviews, and consultations with stakeholders [6]. These traditional CLDs developed with stakeholders [8] limit researchers to the qualitative approach. This research contends that the paradigm is a world view [10] which, by default, can illuminate certain phenomena while concealing other paradigms [11]. Thus, combining the qualitative and quantitative approaches will complement different system aspects and deepen the modellers’ understanding and interpretation [12]. This research adopts the multimethodological approach for a systems modelling, which favours more than one methodology from different paradigms to examine an intervention more effectively [13,14,15,16,17].
We recommend integrating quantitative methods including stakeholder identification, a systematic quantitative literature review, and a structural-analysis MICMAC (Impact Matrix Cross-Reference Multiplication Applied to a Classification), with qualitative methods including the modeller’s judgement or revalidation with stakeholders. This research contributes to the multi-methodology approach from different paradigms in complex settings [18]. The next section reviews the CLDs developing process and limitations. Section 3 presents the proposed multi-methodology. Section 4 applies the methods to a case study and compares the result with relationships obtained from the literature. Section 5 concludes and suggests further work.
2. CLDs Developing Process
Developing the CLDs incorporates two steps: Problem articulation and formulation of dynamic hypothesis [2].
2.1. Step 1: Problem Articulation
Step 1: In problem articulation, modellers identify research problems and key variables or concepts [2]. Problem articulation is also called ‘conceptualisation’ [19], and ‘problem identification and definition’ [20]. Common practices to articulate problems are client interview, stakeholder engagement and data collection [2,8]. This section focuses on traditional stakeholder and variable identification, and its limitations.
First, stakeholders are human entities, as individuals, groups or organisations; non-human entities include the environment; and mental constructs such as the respect for the past generation and the future generation’s well-being [21,22,23]. In the system modelling process, stakeholders provide knowledge, develop the actual model, interpret the results, and/or create the alternate policies [24,25,26]. Modellers can involve a group of stakeholders to build a conceptual model [27], joint individual stakeholder’s models [28], or record stakeholder interactions in a simulation [26]. The review of stakeholder participation in the modelling process can be found in [26,29,30].
This research argues that despite a vast literature on stakeholder and modelling processes, the fundamental questions of ‘who’s in’ and ‘why’ are not explicit and remain a difficult issue in the systems’ thinking literature [26]. Modellers often select stakeholders on an ad hoc basis, simply because they hold a ‘stake’ in research problems or ignore them all together [22,31,32]. Unclear and unjustifiable stakeholder lists may hinder result acceptance, model boundary, and system perception [33,34].
This research does not argue why stakeholders are important, because the reasons vary according to a modeller’s stakeholder theories. Examples of stakeholder theories are: Perceiving stakeholders as an instrument to understand phenomenon versus as a ‘right thing to include them’ [35]; judging which stakeholders are more important versus avoiding this altogether; or focusing on the organisation’s interests versus engaging stakeholders [36]. This research simply calls for articulating which stakeholders are omitted. Thus, this research suggests a structured stakeholder identification method to illuminate who’s in and who’s omitted at Step 1: Problem articulation.
Following creating a stakeholder list, modellers identify relevant variables to serve as a model boundary [2]. Compiling variables reflects a modeller’s two epistemologies, both have their own limitations. Should modellers assume an objective epistemology that human knowledge reflects the reality, then the modellers’ knowledge is sufficient and does not involve stakeholders [32]. However, modellers with the objective epistemology may sweep-in many variables and create a large model to reflect reality rather than the problem [34,37]. On the other hand, should modellers assume a subjective epistemology that humans construct the realities, then modellers would appreciate different perspectives and engage stakeholders [32].
Compiling a variable glossary with stakeholders depends on ‘who’s in’ because pushing out a stakeholder list impacts how the system is perceived and which variables should be included [34]. However, extracting variables from stakeholders depends on the success of the stakeholder engagement. A structured group model building (GBM) facilitator is instructed to ask stakeholders, “What are the key variables affecting the process and outcomes of the (project name) project?”, and write on the whiteboard [38]. Yet two GBM case studies found that eliciting variables are subject to the stakeholder’s organisation’s culture, stakeholder personalities, and the problem dynamics [39]. This research suggests integrating a systematic quantitative literature review to quantify and justify a variable list. The list can be expanded when engaging stakeholders.
2.2. Step 2: Formulating a Dynamic Hypothesis
Step 2: Formulating a dynamic hypothesis aims to explain the problem dynamics [2]. Formulating a dynamic hypothesis is referred to as ‘conceptualisation’ in [19], and ‘system conceptualisation’ in [20]. Developing a dynamic hypothesis process includes: (1) Identifying endogenous variables, and (2) mapping system structures using CLD [2]. This section focuses on the limitations of variable classifications such as endogenous/exogenous, and the CLD developing process.
First, modellers and/or stakeholders must identify variables into endogenous (arising from within) and exogenous variables (beyond the system) [2]. Exogenous variables are important considerations to understanding a system, however, do not have important feedback compared to endogenous variables. Otherwise, they should be considered as endogenous variables and the model boundary must be expanded [2]. Incorrectly identified endogenous variables will result in narrow boundaries and a limited ability to propose solutions [40,41]. Despite the importance of variable classifications, how variables are classified as endogenous or exogenous is unclear and depends on the stakeholders’ and modellers’ interpretations. This leads us back to ‘who’-the-stakeholders-are argument. Furthermore, the endo/exogenous variable classifications are binomial and lead a modeller to focus on what lies within the model. The endo/exogenous classification does not discriminate the different degrees of variability that may arise within or beyond the model boundary. Such a classification could portray the importance or otherwise of variables in the decision-making process, and their opportunity to manipulate the system. However, our world is entangled with overlapped or embedded systems. Therefore, modellers must look inside, between and outside the system boundary [32].
After identifying endogenous variables, modellers map the system structure to communicate the model boundary and causal relationships between variables [2]. Mapping tools are model boundary diagrams, subsystem diagrams, CLDs, stock-and-flow maps, and policy structure diagrams, some of which have not been adopted in recent literature [2]. This research focuses on CLDs. The CLDs comprise variables connected with arrows representing causal relationships. Each arrow is assigned with ‘+’ or ‘s’ for a relationship that moves in the same direction (i.e., if A increases, then B increases and vice versa); with ‘-’or ‘o’ for the opposite direction (i.e., if A increases, then B decreases and vice versa); and with ‘//’ for the delay impact [2]. If the relationships can be traced back to the starting variable and form a feedback loop, then the loop is called either a reinforcing loop (for a loop that causes exponential growth/decay, denoted with ‘R’) or a balancing loop (for a loop that stabilises behaviour over time, denoted with ‘B’) [2]. The R and B denotations appear in a ↺ for loops that read anti-clockwise, and in ↻ for loops that read clockwise.
Modellers develop, refine, and revalidate CLDs several times through literature review, observation, interview, questionnaire and consultation [2]. This research argues that the CLDs development process and its visualisation has some limitations. For example, the CLDs’ drawing process relies on existing literature or on qualitative stakeholders/experts knowledge [2], posing challenges on emerging research topics. Some literature may explore heavily using a linear approach, or lightly, if at all, on emerging topics. Thus, solely relying on the literature may not equip modellers with the knowledge to interview stakeholders [42]. Another example is that the CLDs’ drawing process does not describe how to manage different stakeholders’ perceived causal relationships [43]. As systems thinking contends that “everything is connected to everything else” [44], all variables in CLDs could be inter-related with arrows should all the stakeholders’ opinions be considered. In addition, a consensus among stakeholders about variable relationships may reflect invisible conflict and marginalisation [45]. Finally, CLDs lack an explicit decision-making process, because they portray the system structure as several connected feedback loops [46]. Upon viewing CLDs, one cannot simply identify where the decisions start or what information is important to decision makers [46]. The ability to capture such decision-making processes is crucial to understanding the operational policies and how internal information is used [47].
Given the limitation of binomial variable classifications and the CLDs’ developing process, this research suggests the integration of a structural-analysis MICMAC method to expand the variable categories, illuminate causal relationships, and deal with causal relationship discrepancies. CLDs produced using this method are expected to assist modellers for further discussion with stakeholders.
3. Multi-Methodology Approach for CLDs’ Development
This research acknowledges a current debate on paradigm incommensurability and the multi-methodology approach. On the one hand, different paradigms cannot be merged because the underlying assumption about objective/subjective ontologies and epistemologies are irreconcilable [18]. On the other hand, the separation of paradigms is questioned altogether and the pluralist view is recommended to elucidate phenomena [48]. This research follows the latter school of thought. See [49,50] for discussion on paradigms for systems’ thinking.
This research combines the quantitative and qualitative approaches sequentially. Quantitative results provide modellers with pre-conceptual knowledge. Such knowledge will assist modellers to guide the dialogue during the qualitative approach [51]. Table 1 summarises the multi-methodology approach for the CLDs’ development proposed by this research.
3.1. Step 1: Problem Articulation
3.1.1. A Stakeholder Identification (SI)
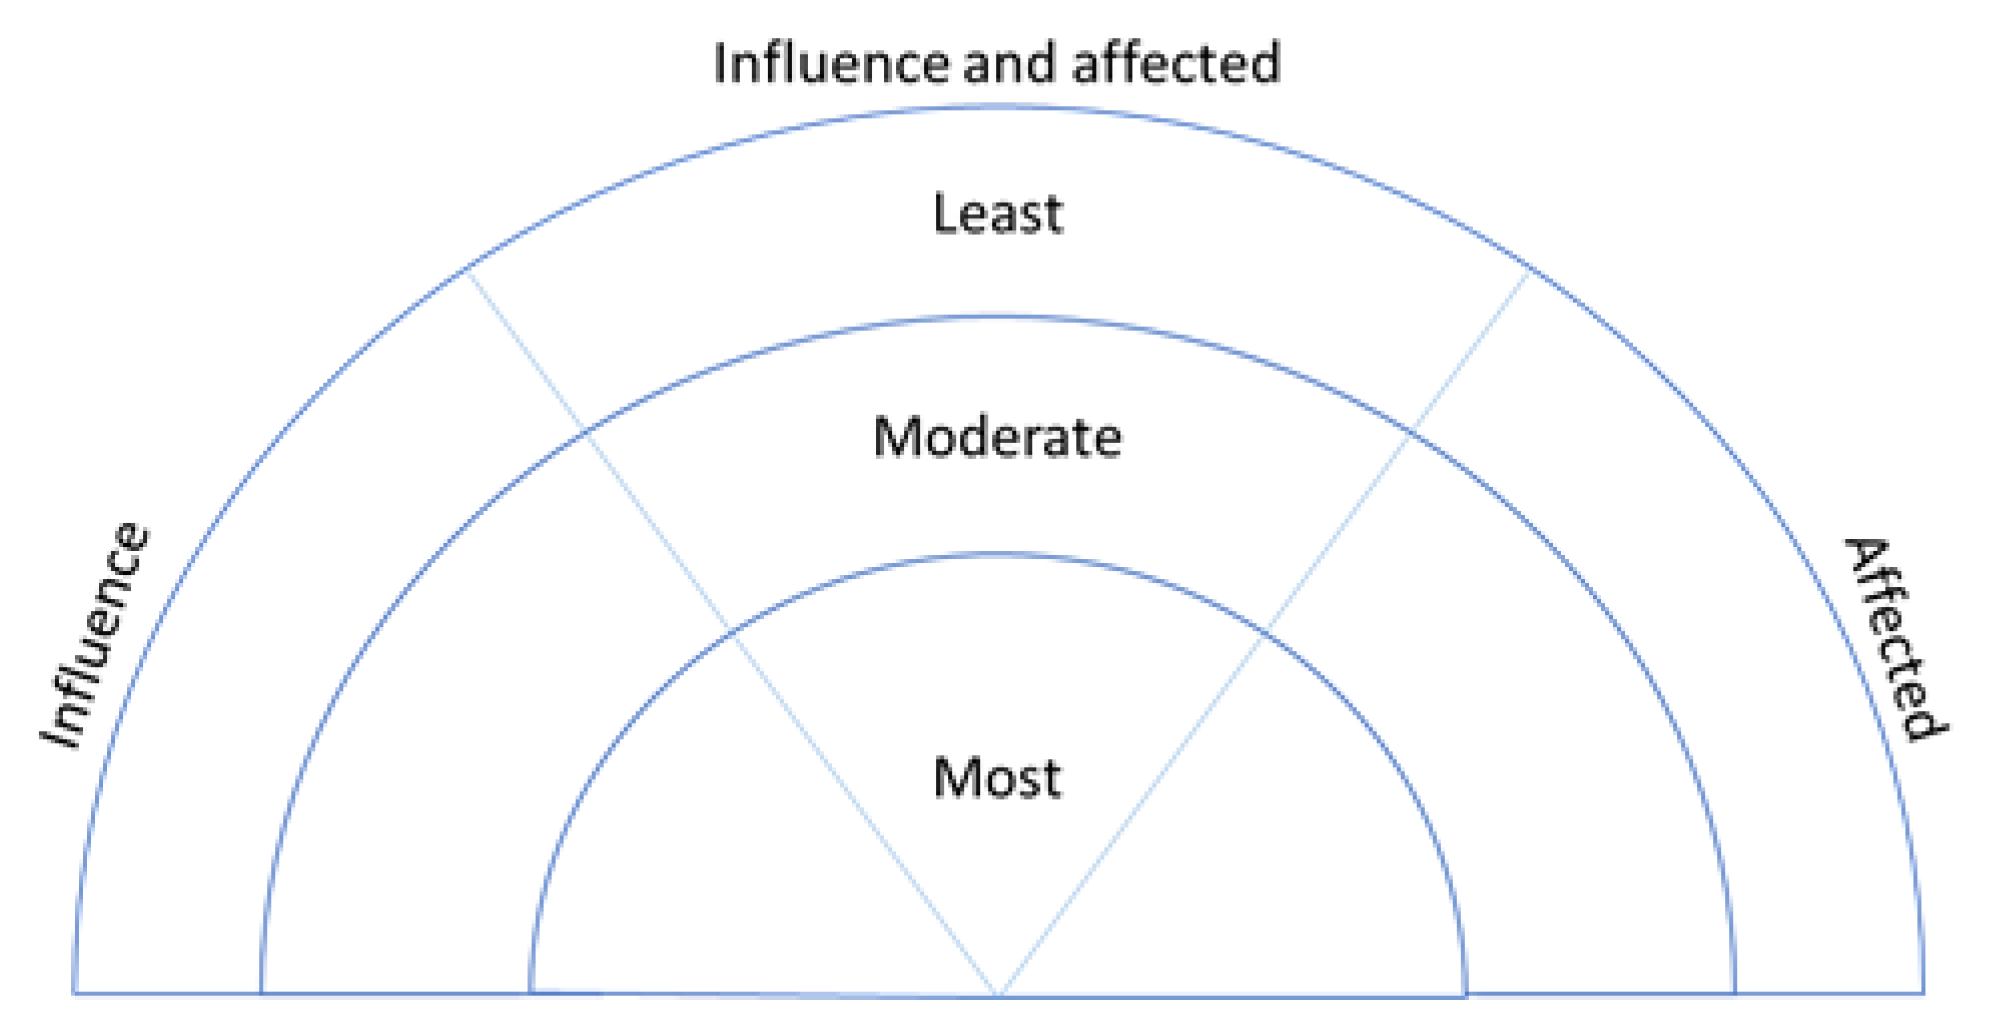
This research proposes SI to show ‘who’s in’ and who is omitted. SI [52] allows modellers to identify stakeholders through experts, other stakeholders, announcements, population records or census, oral or written accounts of major events, or using [52]’s suggested stakeholders. Modellers can group stakeholders if the list is too long. Then, modellers sort stakeholders on a rainbow diagram by whether stakeholders can (1) ‘affect’, (2) ‘are affected by’, or (3) ‘affect and are affected by’ the phenomenon; by their role degrees of ‘most’, ‘moderate’ or ‘least’ (Figure 1).
The clear stakeholder division based on their roles and role degree are flexible according to the stakeholder theories modellers may hold. For example, working on an environmental pollution, modellers may adopt an inclusive perspective and include all stakeholders in the diagram based on moral ground. If the research objective concerns the effectiveness of a given project, then stakeholders who ‘most’ and ‘moderately’ affect the project function should be included [53]. In both cases, SI illuminates which stakeholders are in/excluded with justifications. SI is limited to the subjective stakeholder selection of experts and modellers. Using several experts or multiple sources can minimise, but not completely eliminate such biases.
Other stakeholder identification methods in systems thinking exist. Vennix [54] recommends including stakeholders who can implement the decisions. Yet the process for identifying those stakeholders is rather superficial and lacks detail [55]. Müller, et al. [55] propose the four-phase stakeholder identification with a distinction between actors, experts and agents. However, their method is based on the inclusive perspective stakeholder theory and is not suitable for research adopting other stakeholder theories [55].
3.1.2. Systematic Quantitative Literature Review (SQLR)
This research proposes SQLR to create a quantifiable variable list. SQLR [56] allows modellers to assess and select literature systematically based on preset-inclusion criteria such as search keywords, databases, publication years, manuscript types, etc.
SQLR is flexible with a modeller’s epistemology. Should stakeholders be excluded, the variable list is a quantifiable and justifiable literature scope [57]. Should stakeholders be included, they can review and amend the variable list. SQLR is useful for the novice researcher and on an emerging topic [58]. However, SQLR limits the inclusion criteria leading modellers to search only relevant literature. This bias can be minimised by expanding the inclusion criteria and engaging stakeholders for they too have a mental database [59].
Other literature review methods are the narrative method and Cochrane review’s meta-analysis. With the narrative method, modellers read relevant literature as much as possible. However, selecting ‘relevant’ literature is highly subjective and relies on a modeller’s expertise [60]. The Cochrane review’s meta-analysis requires an expert team to weight the literature based on the methodology, sample size and effect size [61]. However, meta-analysis is inadequate for the sole modeller or small research team, and for an emerging topic with limited data [58]. Thus, because Step 1 evaluates the breadth rather than the depth of the research, SQLR has an advantage over a meta-analysis.
3.2. Step 2: Formulating a Dynamic Hypothesis
Structural-Analysis MICMAC
This research integrates a structural-analysis MICMAC to identify endogenous variables and develop the CLDs quantitatively. MICMAC determines variable roles and their direct and indirect influence/dependence specified by stakeholders [62]. The MICMAC process [62] includes: (1) Identifying relevant variables recommended under 80 variables for the presentation purpose; (2) arranging variables into a matrix in a horizon and vertical lines; (3) asking experts to rate a direct relationship between variables from zero (no influence), one (weak influence), two (moderate influence), and three (strong influence) line by line. Arcade et al. [63] recommends that stakeholders fill in the matrix together in seminars spread over three to six months. See the algorithm behind MICMAC in [64].
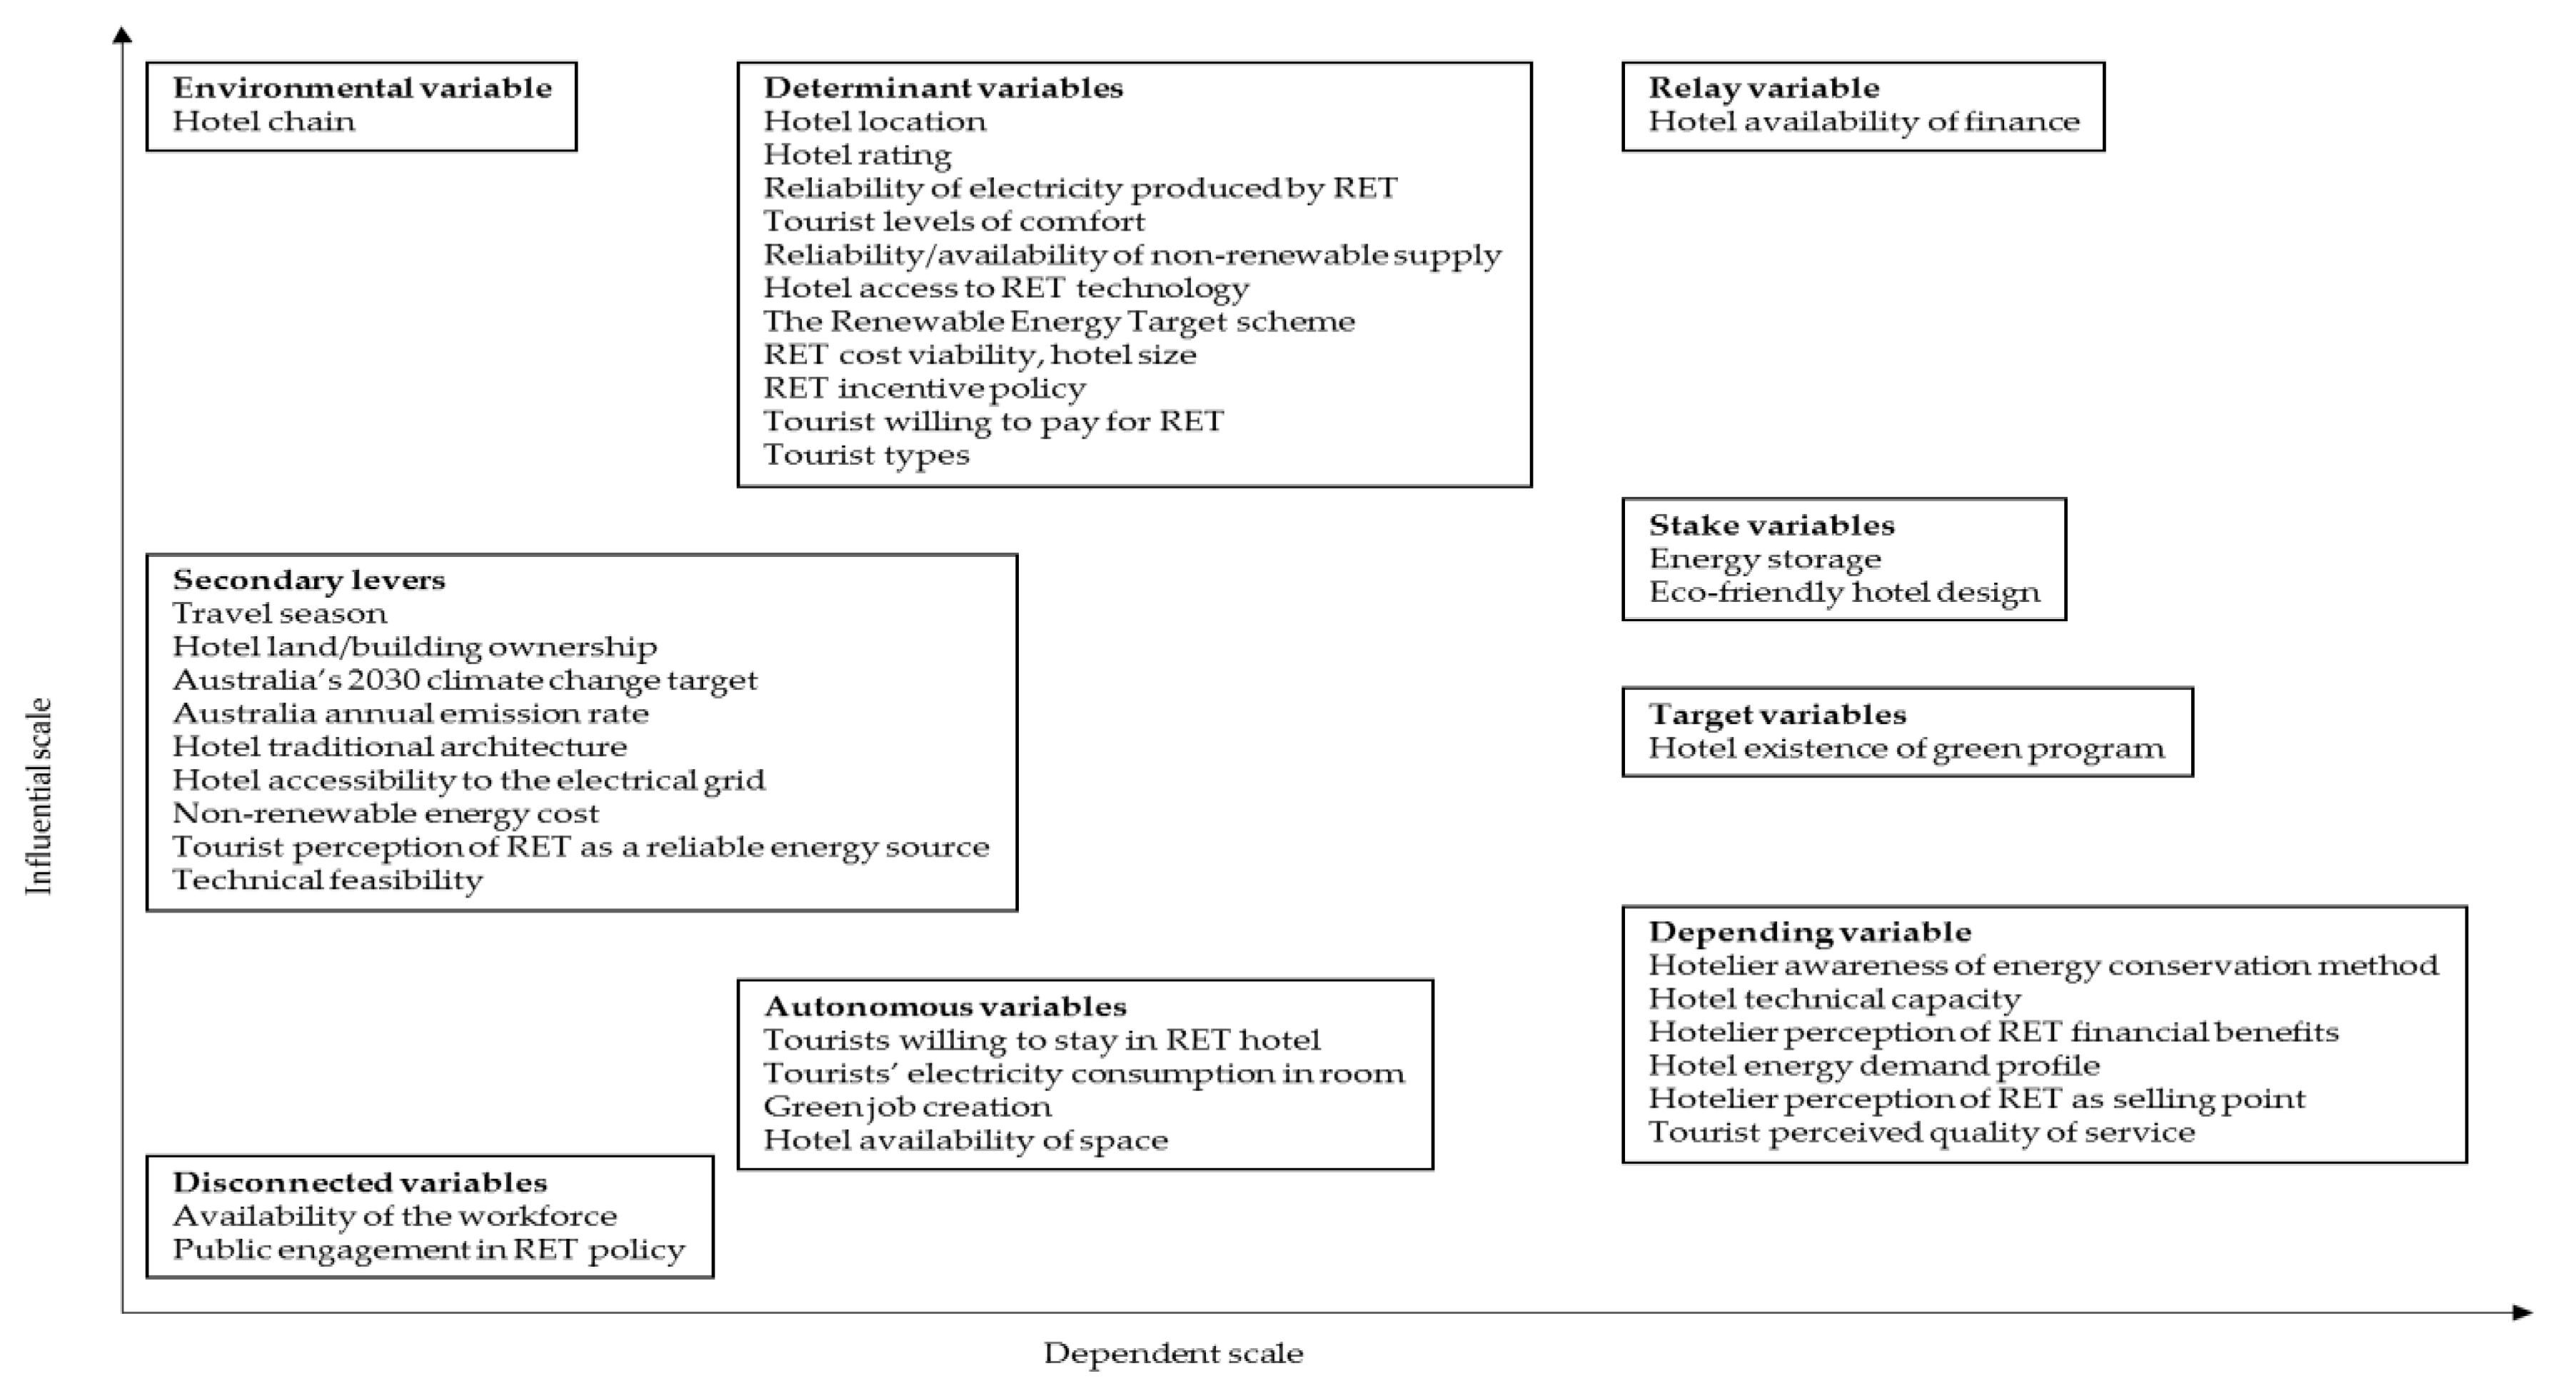
The MICMAC variable role analysis helps modellers quantify their endo/exogenous variable selection. MICMAC produces the direct influence and dependence chart and positions each variable in a quadrant based on its direct relationship. MICMAC sorts variables into four main and five sub-categories. These categories are: (1) Determinant variable, which is very influential with little dependence and can act on the system. Included in determinant variables are (1.1) environmental variable, which conditions the system and cannot be controlled; (2) relay variable, which is very influential and very dependent. Included in relay variables are: (2.1) Stake variable, that is the ‘potential breakpoint of the system’ or has a strong influence on the system; (2.2) target variable, that is more dependent than influent but influences the system if conducted in a desirable way; (3) depending variable, that is the system result, little influent, very dependent, and sensitive to the determinant and relay variable changes; (4) autonomous variable, that is incapable of changing the system or benefits from such change. Among the autonomous variables are: (4.1) Secondary lever that is more influent than dependent and is the possible secondary system actor; and (4.2) Disconnected variable whose origin is excluded from the studied system [63]. This research contends that the autonomous category, particularly the disconnected variable, is equivalent to the traditional exogenous variable. Thus, MICMAC quantifies the exogenous variable justification. This research recommends triangulating decisions to exclude any variables with stakeholders. In addition, different variable roles may illuminate where the decision starts in the system, hence, enhance the CLDs’ visualisation.
MICMAC also produces a displacement map displaying changes in variable roles under indirect relationships. Changes in variable roles may indicate possible hidden influential variables through the feedback loop. This displacement map is based on MICMAC’s principle that if A directly influences B, and B directly influences C then changes in A would influence C. Thus, A and C have an indirect relationship which is hidden in the direct influence and dependence chart above [65]. Research shows that 20% of variables would change their categories under indirect relationships, a result considered to be important [66]. Modellers should explore the hidden variables with stakeholders.
The MICMAC direct and indirect relationship analysis helps modellers develop the CLDs. MICMAC produces the direct and indirect influence graph, illustrating weak, moderate, or strong variable relationships indicated by stakeholders. Modellers may refer to these relationships when drawing the CLDs. Relationships indicated by MICMAC are provisional, unclear whether they are negative or positive relationships, and need validation with stakeholders. Yet, this research contends that variable relationships could be numerous and missed without the help of computers.
The MICMAC results limit the subject choice of stakeholders. This bias can be minimised by using a diverse stakeholder group [63]. However, stakeholder consensus could represent a mistake as a group or the silence of the minority [63]. Time consumption to complete the matrix is another limitation. Arcade et al. [63] recommends organising a two to three-day seminar for 70 variables.
Other structural-analysis approaches exist that could conceptualise the CLDs. Among these, the interactive cross impact simulation (INTERAX) and trend impact analysis (TIA) are more well-known [67]. INTERAX requires numerous experts to analyse and develop alternative future scenario databases and strategies, sometimes up to 100 events with 50 trend forecasts [68,69]. Thus, INTERAX is expensive and difficult to use [67]. TIA times future events and their impacts by combining historical data and expert identified probabilities [70]. However, TIA is inappropriate when historical data are unavailable or unreliable [67]. The previous effort to combine MICMAC and CLD can be found in [71,72,73,74]. This present research provides the justification for combining MICMAC and CLD.
4. Application in a Case Study
We demonstrate the multi-methodology approach on renewable energy technology (RET) adoption as a case study in the hotel sector in Queensland, Australia. We focus on the application of the multi-methodology approach and its contribution to the CLDs’ development. The explanations and interpretation of the social, economic and environmental impact of RET are beyond the scope of this paper. Other research that has applied the multi-methodology approach to develop a final quantitative model on renewable energy exist such as [75,76,77]. However, discussing them is beyond the scope of this paper.
Australia is the world’s 15th largest greenhouse gases (GHG) emitter mainly from burning fossil fuel for electricity [78]. As per the Paris Agreement, Australia is committed to reducing its emissions by 26–28% below the 2005 level by 2030 [79]. Promoting the RET adoption is one of Australia’s strategies to mitigate GHG emission [80]. The Australian government requires its electricity sector to source 20% of the power from renewable energy resources by 2020 [81]. Aided by some incentive policies such as Feed-in Tariff and large-scale RET investment funds [82], the national renewable energy production level has increased by 12% in 2016–2017, accounting for 16% of the total electricity production Australia-wide [83,84]. However, at the state level, Queensland has the lowest share of electricity generated by RET at 7% when compared with other states (Tasmania (87%), Southern Australia (43%), Victoria (14%), Western Australia (8%), and New South Wales (13%)) [84]. Queensland remains the largest emitter of the states/territories produced mainly by the coal-fired electricity sector [85]. Queensland needs to do more to assist Australia to meet the nation’s emissions target.
This research proposes that the hotel sector in Queensland has the potential to reduce emissions by adopting RET. This is because the hotel sector is one of the biggest electricity consumers among commercial buildings, spending approximately 10% of their budget on energy to provide 24-h services such as air-conditioning, space and water heating, lighting, lifts, and kitchen equipment [86,87]. In 2016, Queensland had 1235 establishments including hotels, motels, guesthouses, and serviced apartments with more than 15 rooms [88]. The number of hotel establishments and their energy consumption are expected to rise as the tourist visitor nights in Queensland increased by 5.7% in 2017–2018 [89]. The electrical grid distribution is not available Queensland-wide [90]. It is assumed that some hotels still rely on diesel generators, which further emit GHG through combustion. No significant findings of how many hotels are adopting RET currently worldwide, except for [91] who found that the RET adoption in the hotel sector globally is low with the exception of the thermal solar. Thus, research about the variables contributing to the RET adoption in the hotel sector in Queensland is required to promote the RET adoption.
A systems approach helps to understand different perspectives of the hotel RET adoption because the approach captures variables’ non-linear and feedback relationships. Taking a hotelier perspective, factors influencing the hotels’ RET adoption decision are: The hotelier’s perceived RET financial benefits, hotel’s organisational values, hotel size, hotelier’s beliefs of the RET usefulness [92,93,94,95]. Taking a government perspective, the policies that protect the monopoly of centralised electricity generation can hinder the RET breakthrough [96]. The RET adoption is also influenced by the energy storage price, and grid distribution and skilled workforce availability [96,97,98].
Different perspectives on the RET adoption highlight interactive components which affect an RET adoption decision, and their inherent non-linear relationships. In addition, different perspectives indicate possible multiple stakeholders and an interdisciplinary topic; warranting a systematic approach to identify stakeholders and measure the literature breadth. The given RET adoption in the hotel sector is an emerging topic, integrating that a structural-analysis would provide modellers with a system preunderstanding. Thus, this research adopts a multi-methodology approach to develop the CLDs.
4.1. Step 1: Problem Articulation
4.1.1. Stakeholder Identification
Experts identified stakeholders related to the hotel RET adoption in Queensland in this research. Experts can represent different stakeholder perspectives [55] suitable for this multi-disciplinary topic. In this research, one tourism industry and one engineering expert have identified 19 stakeholders (see Table 2), classified into seven categories: The hotel sector, tourists, the government, RET companies, the community, the financial sector and electricity providers. Both experts agree that: The RET industry can influence RET adoption the most, the hotel sector can influence and is affected by RET adoption the most, and the local community and the environment are affected by such decision the most. No stakeholder is identified in the ‘least’ category. This research aims to understand the variables contributing to the hotel RET adoption from different perspectives, thus we avoid any trade-off and include all identified stakeholders. Modellers reserve the right to represent the environment. This research does not seek expert consensus about stakeholder identification.
4.1.2. Variable Inventory
The next step is to identify variables related to the hotel RET adoption, first using the SQLR quantitative approach followed by the qualitative approach. For SQLR, original research papers published in English language academic journals were obtained by searching electronic databases including Science Direct, Scopus, ProQuest, Sage, and Web of Science. These searches were carried out between 1–28 November 2016. The keywords used in these searches were: ‘hotel’, ‘motel’, ‘caravan park’, ‘tourist accommodation’, ‘resort’, ‘guest service*’, ‘camping ground’, ‘tent’, ‘camp’, ‘lodge’, ‘inn’, ‘RV park’, ‘apartment’, ‘caravan park’, ‘bungalow’ and a combination of ‘renewable energy’, ‘solar power’, ‘wind power’, ‘hydro power’, ‘geothermal’, ‘microgrid’. Excluding criteria are: (1) Review papers, book chapters, literature review, news, bulletins, datasets and research notes. However, reference lists of these papers were used to find additional academic papers; (2) papers addressing RET and related technologies that do not result in electricity; (3) fuel cells which are hydrogen fuelled by non-renewable energy; and (4) water pumps, desalination units, and electric cars even if they are used in tourist accommodation and fuelled by renewable energy resources. Papers must collect data from existing or modelled tourist accommodation. Research on a hybrid system with RET was included. The review includes electricity generation from renewable energy resources and multi-purpose functions such as cooling and heating. Electricity produced from RET must be used to support the tourist accommodation. A total of 52 research journal papers and 81 variables related to tourist accommodation and RET were identified. Discussing the SQLR result is beyond this paper’s scope.
One tourism and two engineering experts revised the 81 variables, their names and interpretations. Experts can represent stakeholder perspectives and are appropriate for a validating task [55]. Experts merged and split some variables for clarity, resulting in 38 variables (see Appendix A). Thirty-eight variables serve as a starting point for CLDs’ development but not a final list.
4.2. Step 2: Formulating a Dynamic Hypothesis
4.2.1. Identifying Endogenous Variables
Next, we identified endo/exogenous variables by using a quantitative MICMAC method, followed by a qualitative stakeholder review. For the MICMAC method, the 38 variables identified in the previous process were arranged into a matrix, equivalent to 1444 questions (38 × 38). Two governmental departments related to energy and innovation, two RET companies, two hotel accountants, two hotel engineers, two hotel managers, and one financial institution were approached. However, we were unable to organise a workshop for the MICMAC completion due to the stakeholders’ other commitments. Therefore, we sent the matrix and variable definitions to stakeholders to be filled in individually. Space was given at the end of the matrix should stakeholders wish to add their own variables. None has taken this option. Stakeholders had 14 days to complete the matrix, with an email reminder sent on the seventh day. Two hotel accountants, two hotel engineers, and two hotel managers completed the matrix. The low response rate could be due to the length of time needed to complete the matrix. The small sample size is acceptable because the MICMAC process is based on the experts’ opinions rather than a statistical mean [63]. The stakeholders’ responses were summarised using the geometric mean and analysed in the MICMAC software version 6.1.2. The geometric mean is selected over the mean and median because it is insensitive to the skewed data and works well with the small sample size [99].
We identified endo/exogenous variables through MICMAC’s direct influence and dependence chart. Based on the stakeholders’ ranking, MICMAC classified 38 variables into nine roles (Figure 2). The MICMAC categories suggest that ‘availability of the workforce’ and ‘public engagement in RET policy’ are disconnected variables. Decisions to exclude disconnected variables were discussed during stakeholder interviews.
4.2.2. Structural-Analysis MICMAC Results
MICMAC produces a displacement map and direct/indirect influence graph, which can be used to illustrate the complex system of the RET adoption in the hotel sector. First, MICMAC’s displacement map shows that seven variables changed their categories when comparing their direct and indirect influence and dependence. These changes include: (1) ‘hotel availability of finance’ from relay to determinant variable; (2) ‘eco-friendly hotel design’ from stake to target variable; (3) ‘tourist willing to stay in RET hotel’ and ‘tourists’ electricity consumption in room’ from autonomous to depending variables; (4) ‘travel season’ from secondary to disconnected variable; and (5) ‘tourist willing to pay for RET’ from determinant to disconnected variable. These changes indicate possible hidden variables that connect between them and the hotel RET adoption. Modellers referred to this information during stakeholder interviews.
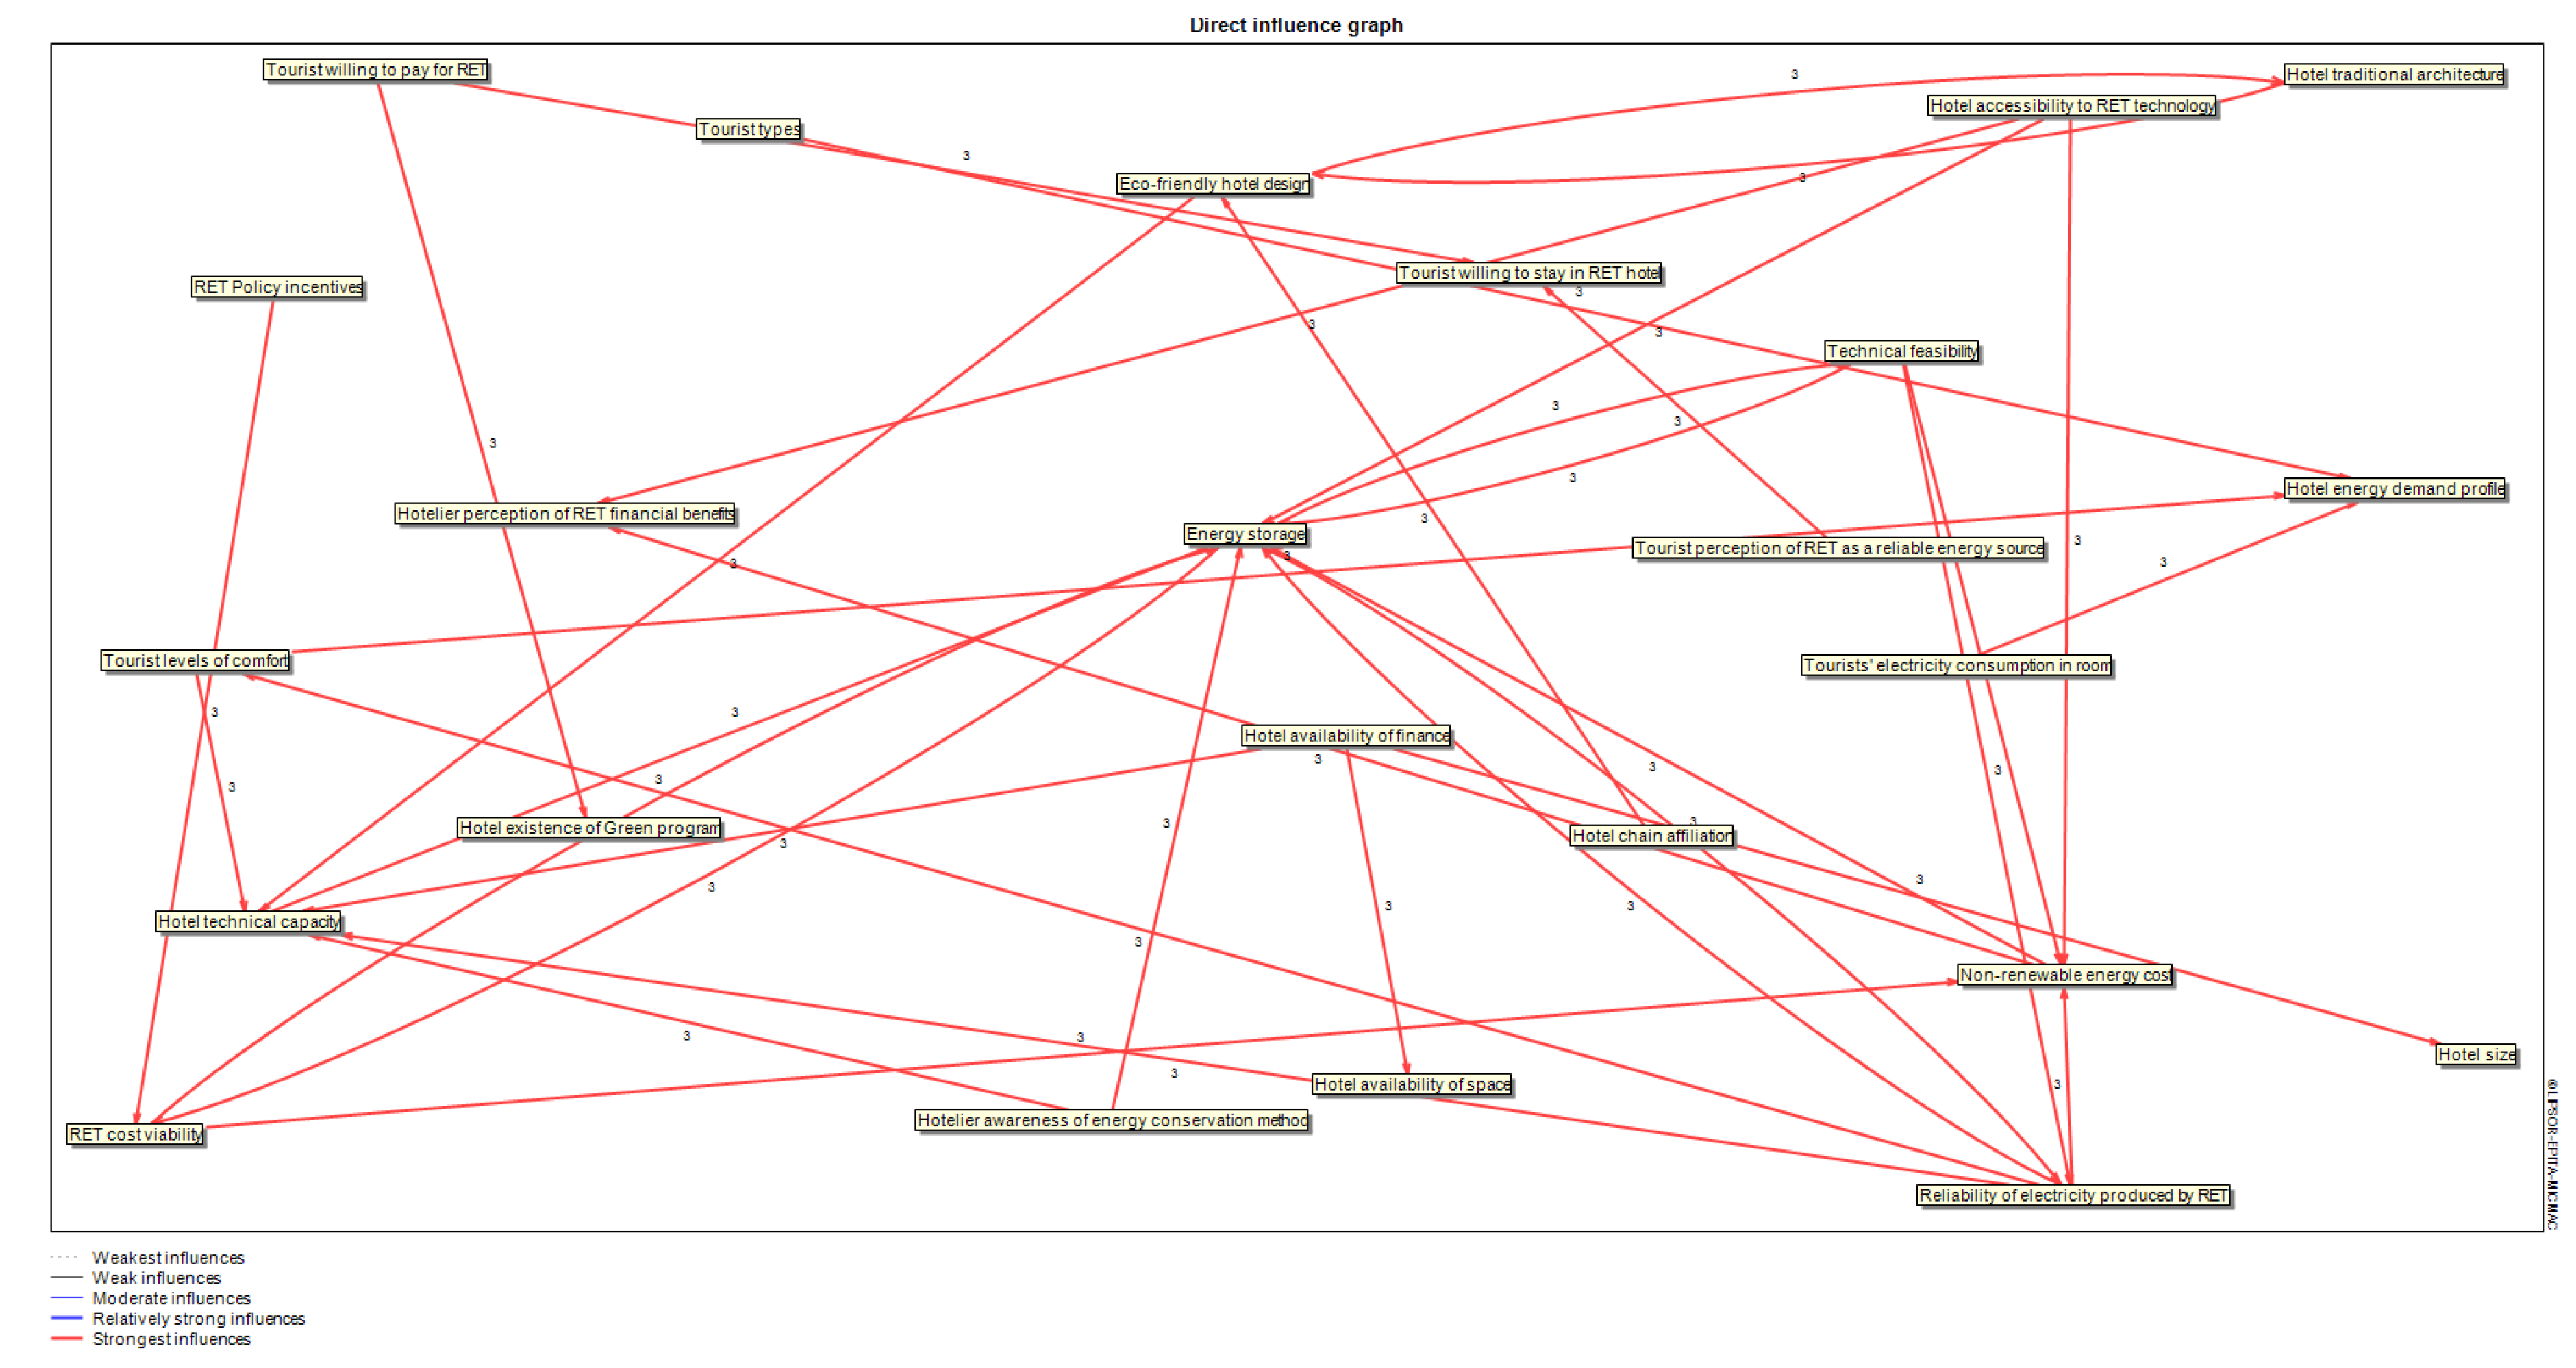
Second, MICMAC maps weak, moderate and strong direct influence relationships between variables. For clarity, Figure 3 displays only strong direct influence relationships. Figure 3 shows 24 variables are strongly related in the Queensland context. Arrows concentrate particularly on energy storage, hotel technical capacity, and non-renewable energy cost. However, MICMAC does not indicate whether the relationships are positive or negative. We used these arrows to draw the CLDs. The CLDs and direct relationships were later discussed with stakeholders.
MICMAC also indicates three strong indirect influence relationships from: (1) ‘hotel availability of finance’ to ‘existence of Green program in hotel’; (2) ‘hotel rating’ to ‘hotel energy demand profile’; (3) ‘hotel chain affiliation’ to ‘hotel energy demand profile’, indicating hidden variables between the pair. We discussed these relationships with stakeholders during interviews.
4.2.3. Mapping System Structure Using CLD
Developing the CLDs of the hotel RET adoption went through five main stages, using the VENSIM software version DSSx32 6.3E (Ventana Systems, Inc., Harvard, MA, USA.). In the first stage, we developed a preliminary CLD based on variables and relationships found in the SQLR. In the second stage, we added MICMAC’s direct strong variable relationships and marked the role of each variable, resulting in the CLD1. In the third stage, we asked individual stakeholders face-to-face to review CLD1. In these meetings, we explained the concept of systems thinking and the research problem and asked stakeholders if the CLD1 coincided with their opinions. Changes to CLD1 from one interview were incorporated to the next. Any disagreements between interviews were clarified in the stakeholder engagement workshop. Interviews results in CLD2. In the fourth stage, we organised a stakeholder engagement workshop to review CLD2. Stakeholders received an information package about systems thinking, CLD2 copied, and variable definitions one week prior to the workshop. At the workshop, CLD2 was presented and stakeholders were asked to amend variables and relationships with justifications. The stakeholder engagement workshop resulted in CLD3. At the final stage, CLD3 was presented at the 2017 International Congress on Modelling and Simulation Conference, held in Tasmania, Australia [100] and again at the 2018 Council of Australasian Tourism and Hospitality Education Conference, held in Newcastle, Australia [101]. Conference attendees were invited to amend variables and their relationship. These revisions resulted in the final CLD. No changes to CLD3 were made at either conference. Stakeholders present at each research stage are summarised in Table 3.
1. Preliminary CLD
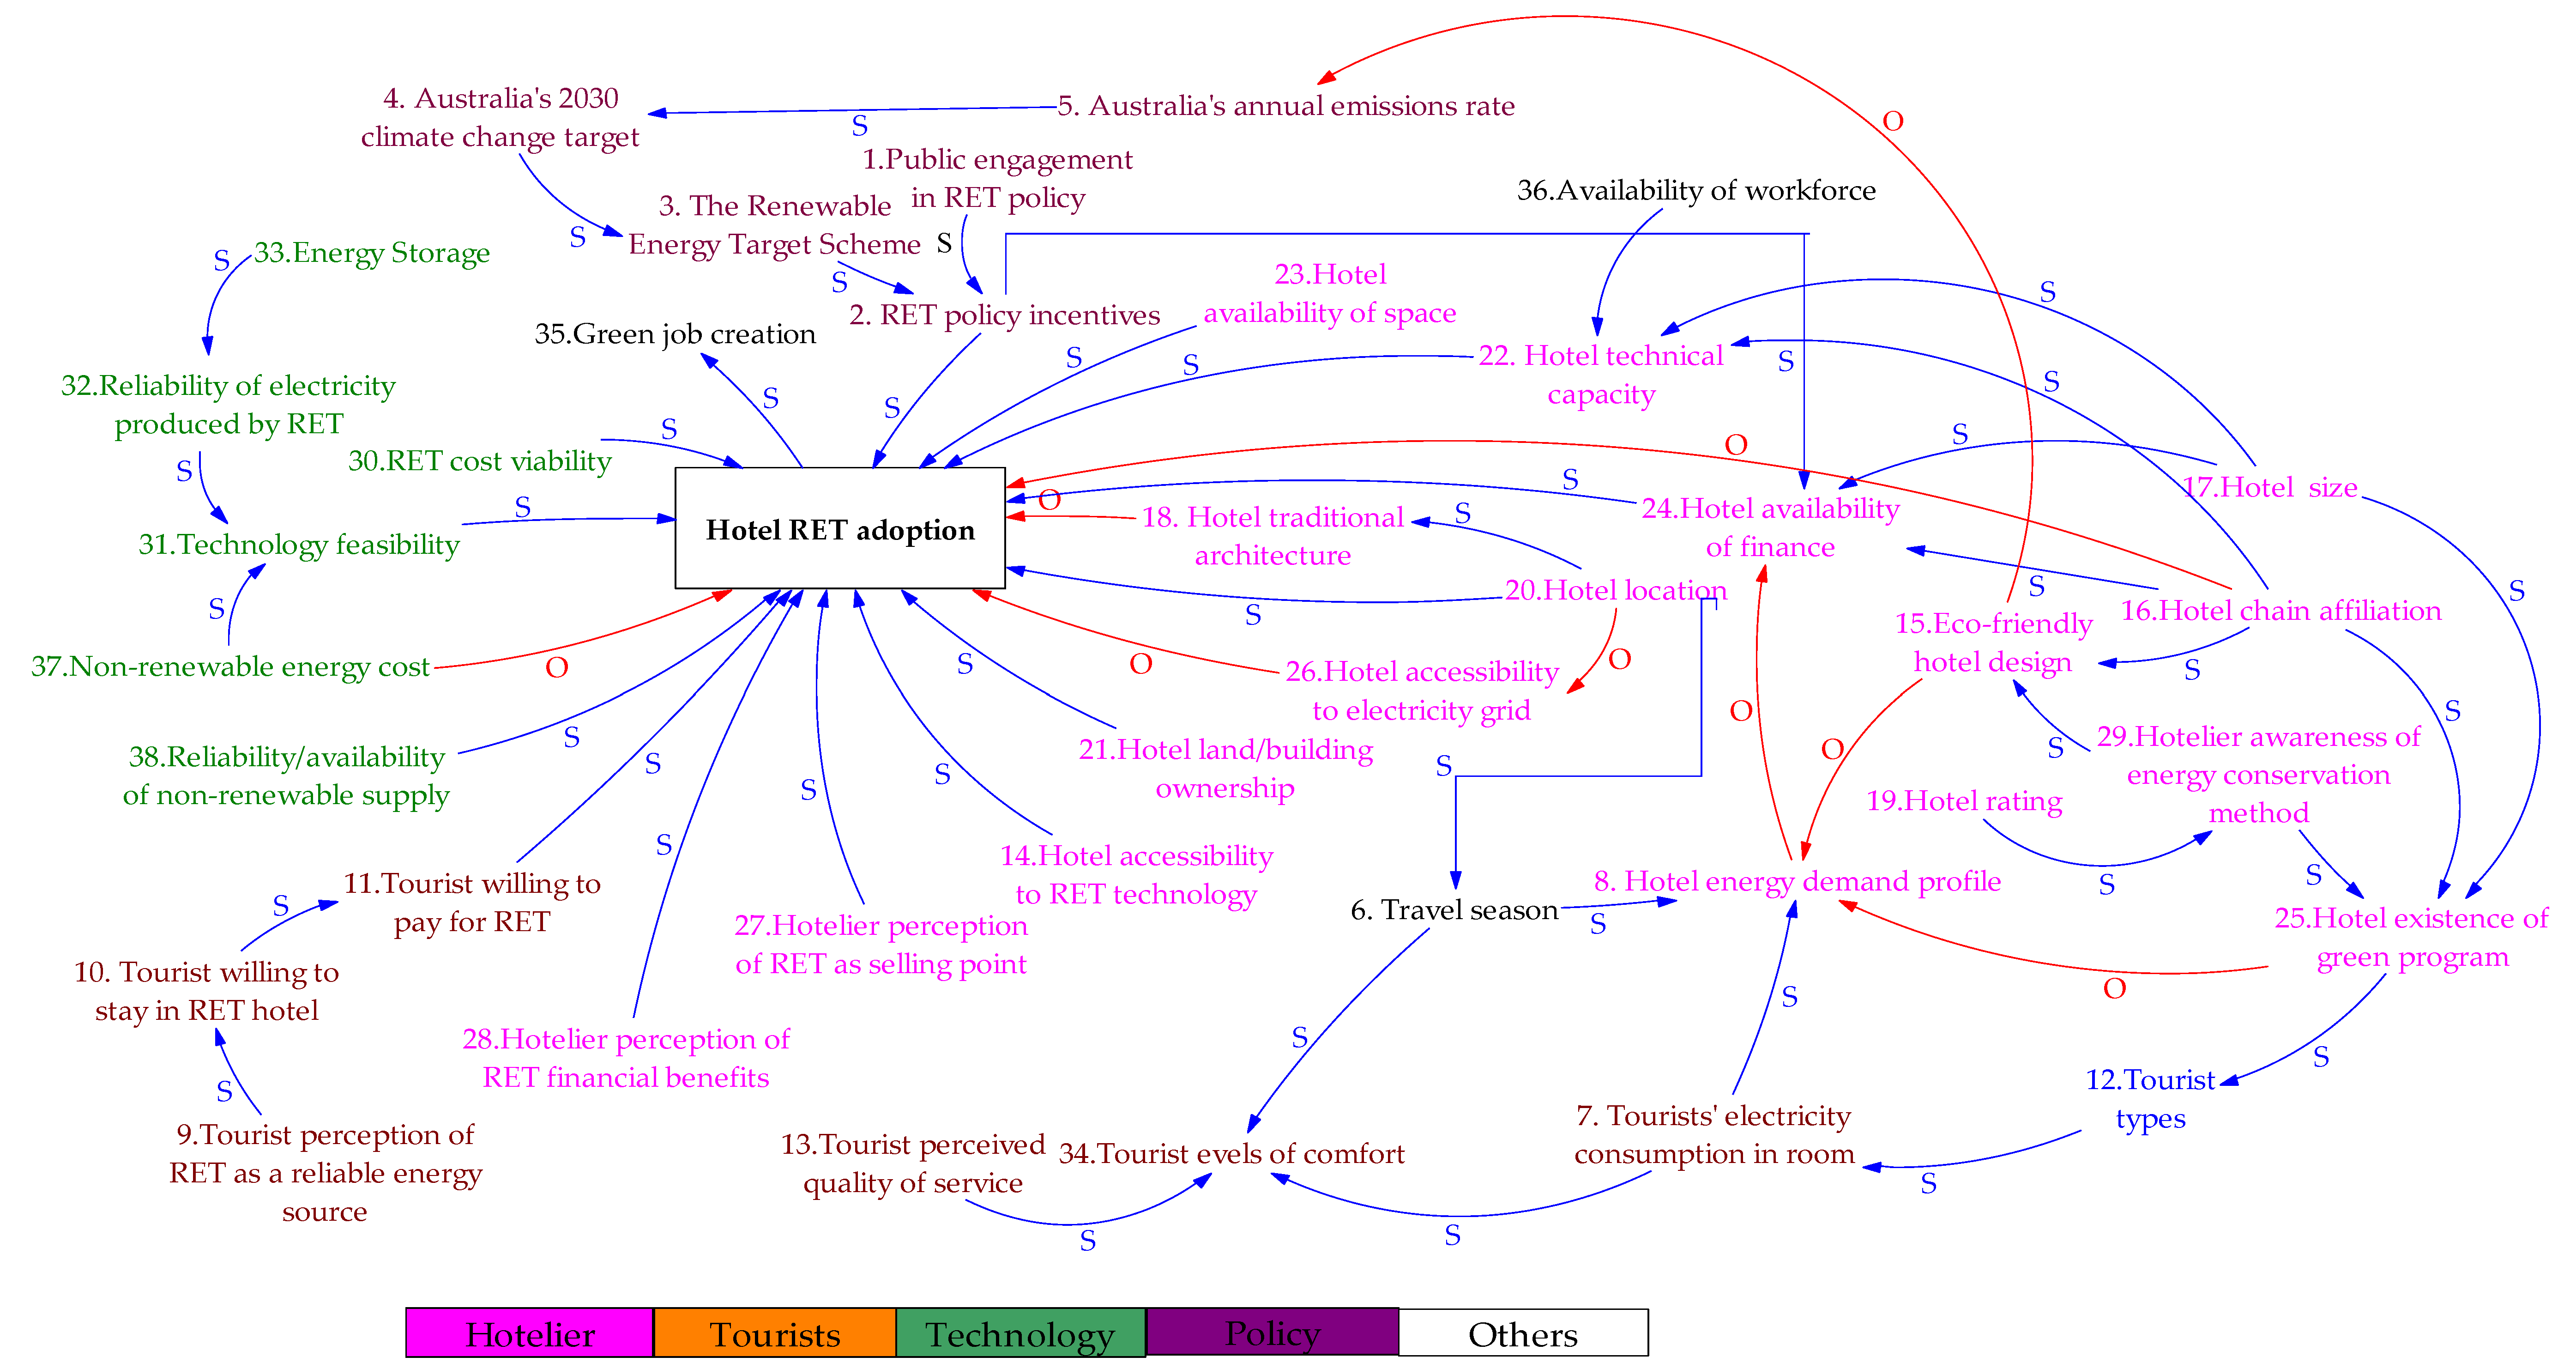
Figure 4 shows the preliminary CLD developed from the SQLR. Figure 4 contains 38 variables, grouped in five sectors including the hotel, technology, tourist, policy, and other sectors, each highlighted with different colours. The preliminary CLD shows most arrows pointed to the ‘hotel RET adoption’ without feedback loops, indicating a linear approach by the previous research.
2. CLD1
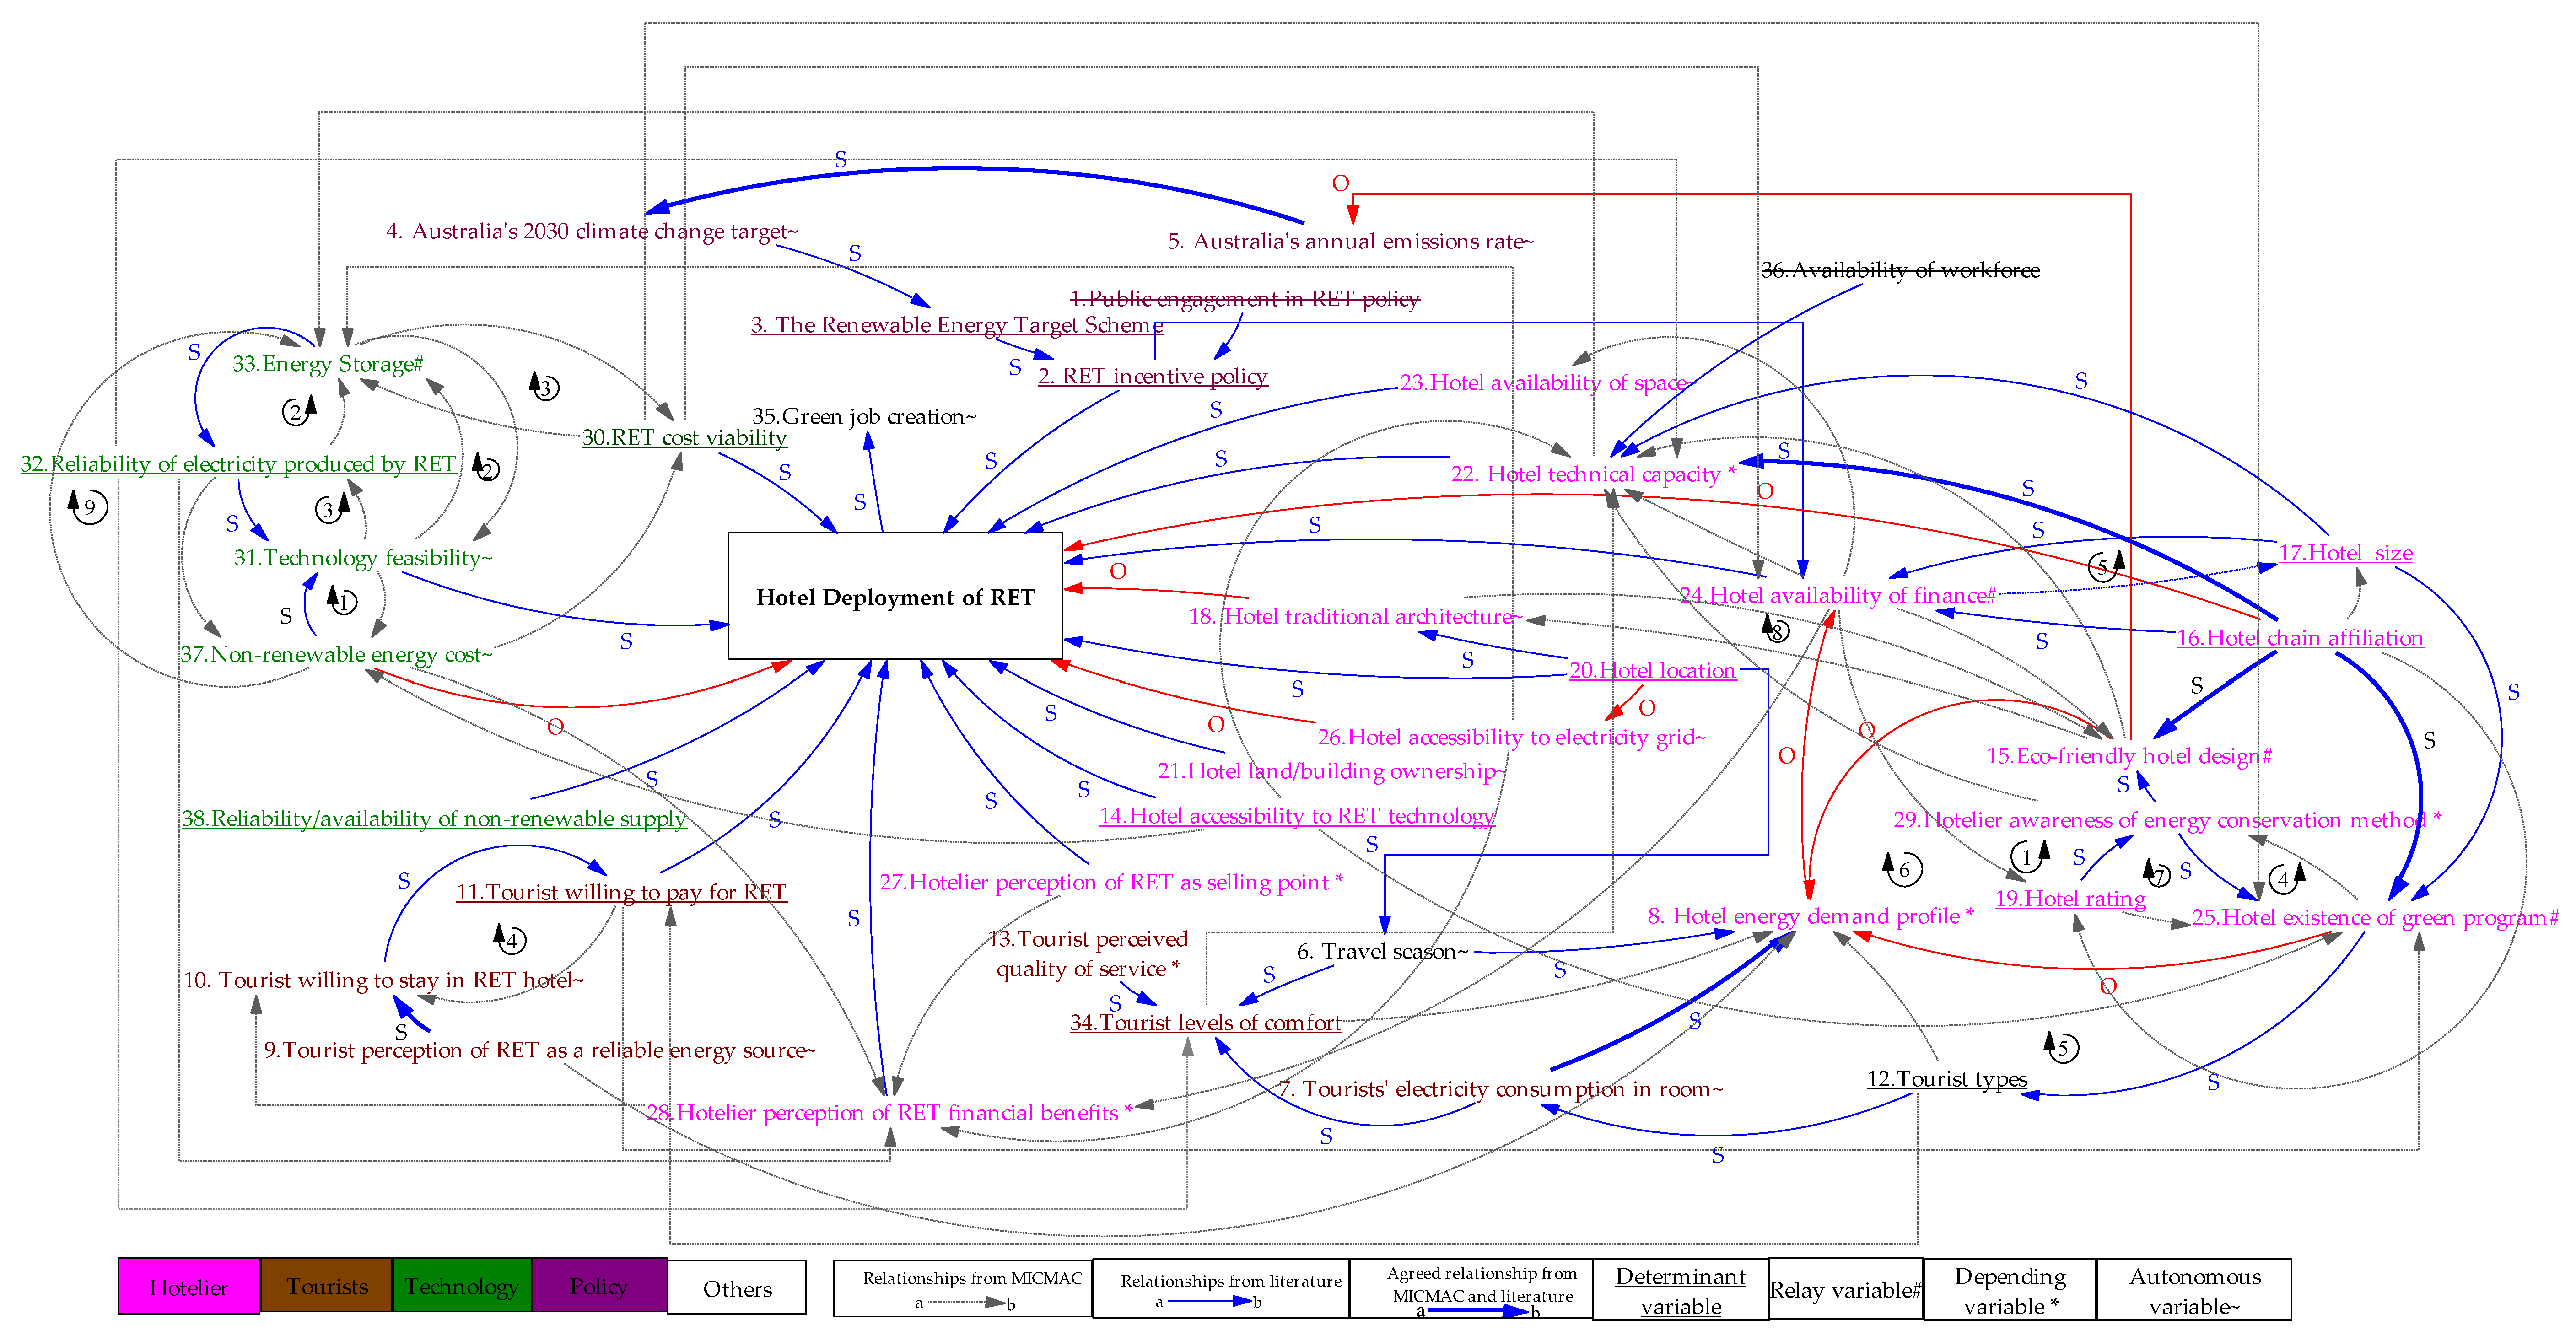
Figure 5 shows CLD1 produced by integrating MICMAC’s and SQLR’s variable relationships. The integration reveals three system complexities. First, CLD1 exposes additional relationships unexplored in the previous research (see dotted arrows), indicating limited research about the hotel RET adoption. Only six stakeholder-identified relationships have been researched previously (see thick arrows), including: Australia’s annual emission rate—Australia’s 2030 climate change target, tourists’ perception of RET as a reliable energy source—tourists willing to stay in the RET hotel, tourists’ electricity consumption in room-hotel energy demand profile, hotel chain affiliation—eco-friendly hotel design, hotel affiliation—hotel implementing a green program, and hotel chain affiliation—hotel technological capacity.
Second, CLD1 has 14 feedback loops, including five counter clockwise and nine clockwise loops (Table 4). The next stakeholder interview can illuminate whether these loops are reinforcing (creating exponential growth/decline over time) or balancing (stabilising the system overtime) loops. Third, CLD1 illuminates each variable’s role to the hotel RET adoption, enhancing the modellers’ understanding of the system.
The modellers prepared stakeholder interviews based on these insights. Careful interview preparation can actively engage and interest stakeholders [102].
3. CLD2, CLD3, and Final CLD
During the interviews and workshop, each stakeholder group had its own concerns. For example, the hotel sector prioritised customer satisfaction, and identified RET adoption drivers as ‘tourist’s levels of comfort’ and tourist’s perceived value for money, ‘the reliability of electricity produced by RET’, and ‘the hotel owner’s perceptions of RET financial benefits’. The government representatives were interested in variable contributing RET policy incentives; the electrical provider in future demand for grid electricity and RET incentive policy; and the hotel’s sustainable accreditation in reducing the hotel’s impact on the environment.
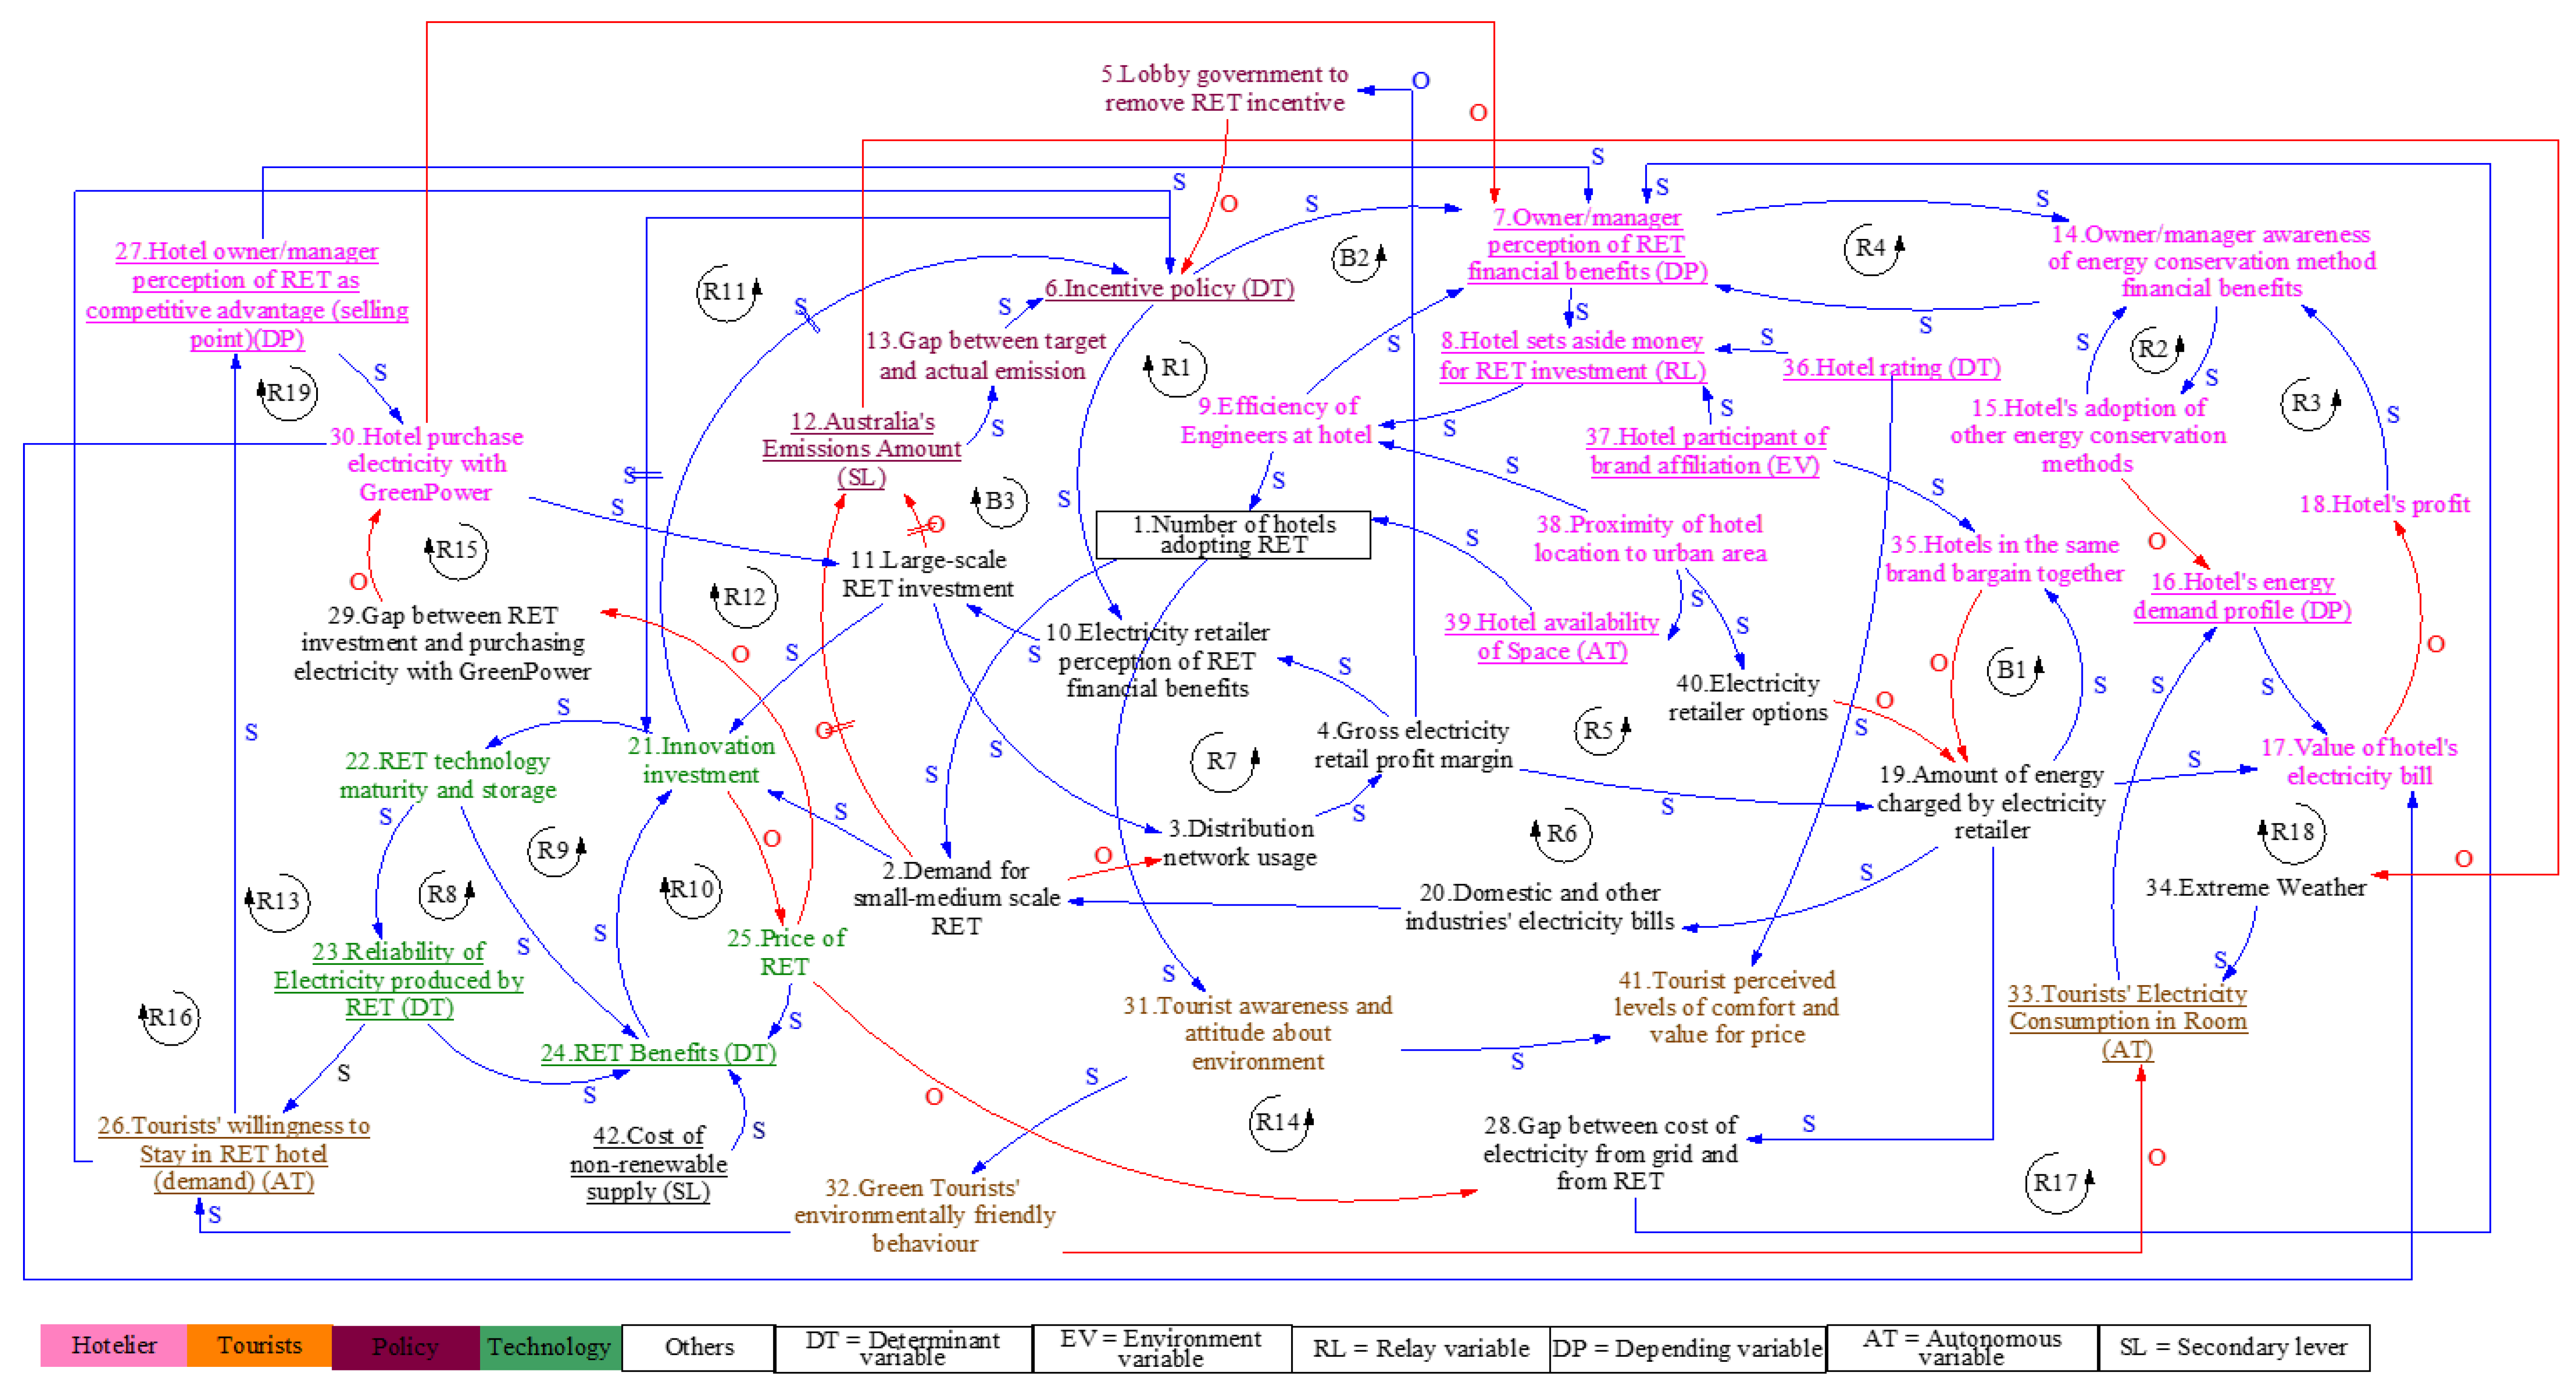
The final CLD produced from the stakeholders’ engagement workshop and conference discussion is shown in Figure 6. Many variable names changed after interviews and workshop. Only 14 out of 36 variables identified by the SQLR remained, while seven were deleted, 12 were evolved, three dissolved, and 13 newly added, resulting in a total of 42 variables in the final CLD (see list of variables in Appendix A).
The final CLD contains 22 feedback loops, including three balancing and 19 reinforcing loops (see Table 5). Several final CLD feedback loops were built on the SQLR and MICMAC’s result. These loops include: (1) The influence of energy storage on the RET electricity reliability, and the RET benefit; (2) the influence of a hotel owner/manager’s perception of the RET financial benefits on the RET adoption, and the perception’s reliance on the RET incentive policy, the RET benefits on marking and expense savings, and grid price; (3) the impact of the hotel’s electricity expense on the hotel’s revenue and the RET adoption decision; and (4) the importance of a hotel engineer’s efficiency to lead hotels to adopt RET.
Interviews and workshop revealed several hidden variables. These variables were: (1) Hotel will set aside funds for energy conservation methods only if and when the hotel is aware of its financial benefits; (2) hotel rating has an influence on hotel energy demand profile, but through tourists’ attitude towards the environment and their behaviour; (3) being part of a hotel chain affiliation has an influence on the hotel energy demand profile, but through bargaining power with electricity retailer; (4) even if the engineer is very skillful, the hotel will not be able to adopt the RET if it does not have money, and vice versa; (5) tourists would be willing to stay at the hotel with RET if its electricity is reliable; and (6) the amount of electricity consumption in a room depends on the tourists’ attitude towards the environment and their green behaviour. This indicates that some hidden variables would have been overlooked had such a systematic and exhaustive reflection not taken place.
5. Conclusions and Further Work
This research presents a multi-methodology approach to develop the causal loop diagrams (CLDs). We integrate the quantitative approach including stakeholder identification method (SI), a systematic quantitative literature review (SQLR), and a structural-analysis MICMAC, with the traditional qualitative approach including stakeholder interviews and an engagement workshop. Our proposed multimethod maintains the essence of the original CLD process but adds new stages to define stakeholders, variables, their roles and relationships in a quantitative and logical way. The key findings and main contributions to developing the CLD process are:
- Allowing detailed stakeholder identification based on their roles and the role degrees.
- Providing a quantifiable literature scope to identify relevant variables.
- Identifying endogenous and exogenous variables quantitatively.
- Illuminating possible direct and indirect relationships between variables quantitatively.
- Indicating possible hidden variables quantitatively.
The multi-methodology approach was applied to develop the CLDs in a case study. In our opinion, the case complexity illustrates the multi-methodology application advantages and may be useful for other studies.
However, the multi-methodology approach to develop the CLDs has some limitations. First, SI obscures how to deal with different identified stakeholders. In this research, both stakeholders have identified similar results. However, other research may encounter different stakeholder identification. We recommend future research to use more than two experts and seek consensus when identifying stakeholders. Second, the MICMAC matrix is time-consuming, and took more than three hours for stakeholders. Future research is recommended to reduce the variable numbers. We conclude that managing the vagueness in the stakeholder and modeller judgement will improve the CLDs developing process. Hence, the multimethod approach can be helpful.
We acknowledge that translating the CLDs to the quantitative model is a non-trivial process. Our motivation underlying this work is that modelling the quantitative model through the CLDs would benefit from engaging early with the stakeholders, understanding their mental models, and formulating the dynamic hypotheses [2]. We focus on improving the CLDs developing process before translating into the quantitative model. This research is limited to a qualitative conceptualization. Developing a quantitative model of the hotel RET adoption in Queensland is ongoing and will be published in a subsequent paper. The literature on converting the CLDs to a quantitative model can be found in [2,103].
Author Contributions
N.D. performed the literature review, collecting and analysing the data, conceptualising the model and drafting the paper. O.S. revised the manuscript.
Funding
This research received no external funding.
Acknowledgments
This research acknowledges three reviewers for their detailed comments; and Susanne Becken for her input.
Conflicts of Interest
The authors declare no conflict of interest.
Appendix A. List of Variables Related to the RET Adoption in the Hotel Sector, Queensland

| Stage Used | Variable Name | Description | References | Role (As Per MICMAC) | Action |
|---|---|---|---|---|---|
| M * | Public Engagement in RET policy | Public perception is considered when designing renewable energy policy. | [105,106] | Disconnected | Delete by researchers. |
| M * | RET incentive policy | Feed-in-tariff and investment funding through the Australia Renewable Energy Agency (ARENA). | [107,108] | Determinant | Keep. Name change to ‘Incentive policy’ as per stakeholders. |
| M * | The Renewable Energy Target scheme | The RET scheme operates in two parts: Large Renewable Energy Target (LRET) and Small-Scale Renewable Energy Scheme (SRES) The LRET creates a financial incentive for the expansion of renewable energy power stations. The new target for LRET is 33,000 GWh in 2020 or equivalent to 23.5% of Australia’s electricity generation. The SRES creates financial incentives for households, small businesses and community groups to install small-scale renewable energy system. | [109] | Determinant | Dissolve into ‘Incentive policy’, ‘Large-scale RET investment’, and ‘Demand for small-medium scale RET’ as per stakeholders. |
| M * | Australia’s 2030 climate change target | Australia will reduce emissions to 26–28% on 2005 levels by 2030. This target represents a 50–52% reduction in emissions per capita and a 64–65% reduction in the emissions intensity of the economy between 2005 and 2030. | [110] | Secondary lever | Evolve to ‘Gap between the target and actual emission’ as per modelling experts. |
| M * | Australia’s annual emissions rate | The amount of Australia’s annual emissions. For example, in 2014–2015 Australia emitted 549.3 Mt CO2-e. This figure is the second lowest emissions level since, and 1.9 per cent below, 2000 levels (560.2 Mt CO2-e) and 10.2 per cent below 2005 levels (611.4 Mt CO2-e). The level of atmospheric gases including carbon dioxide (CO2), methane (CH4), and nitrous oxide (N2O) which are responsible for the greenhouse effect and climate change. | [111,112] | Secondary lever | Keep. Name change to ‘Australia’s emission amount’ as per stakeholders. |
| M * | Travel season | Certain seasons (i.e., winter, summer) are perceived by tourists to be favourable to visit a certain destination. For example, a favourable season for a coastal hotel is summer, and winter for a ski resort. Electrical load of a hotel varies according to a variable tourist presence during travel season. | [113] | Secondary lever | Evolve to ‘Extreme weather’ as per stakeholder. |
| M * | Tourists’ electricity consumption in the room | The amount of electricity consumed by tourists during their stay at the hotel. Tourists consume higher rate of energy during their stay in the hotel when compared with when they are at home. This irrational behaviour results from tourists paying a flat rate for their room irrespective of amount of energy consumed. Tourists also wish to enjoy the hotel’s available service to the maximum during their stay. | [114] | Autonomous | Keep |
| M * | Hotel energy demand profile | The amount of electricity used by the hotel on heating, cooling and food processing. Types of hotel and star rate determine the availability of guest facilities such as a swimming pool, spa, air conditioner, heater, etc. In addition, the hotel operates 24 h per day. | [115,116] | Depending | Keep |
| M * | Tourist’s perception of RET as a reliable energy source | Tourist’s perception of RET as a reliable source of energy for the hotel. | [117] | Secondary lever | Evolve to ‘Tourists’ perceived levels of comfort and value for price’ as per stakeholders. |
| M * | Tourist willing to stay in RET hotel | Tourists willing to stay in hotels that invest in RET. | [117,118,119] | Autonomous | Keep. Name change to ‘Tourists’ willingness to stay in RET hotel (demand)’ as per stakeholders. |
| M * | Tourist willing to pay for RET | Tourists willing to pay extra for hotels that invest in RET. | [117,118,119] | Determinant | Delete as per stakeholders as it is covered in ‘Tourist willing to stay in RET hotel’. |
| M * | Tourist types | Tourists are classified as either eco-conscious or others. Eco-conscious tourists are more concerned about the environment and demand more environmentally friendly services during their vacation than other types of tourists. Targeting these eco-conscious tourists can differentiate a hotel from its competitors. The hotel can imbue this message through marketing materials, stay packages, and advertising. Eco-conscious tourists, however, are highly suspicious of a hotel’s commitment to the environment and can accuse such hotel of ‘greenwashing’. | [120,121] | Determinant | Change to ‘Tourists’ awareness and attitude about the environment’ and ‘Green tourists’ environmentally friendly behaviour’ as per stakeholders. |
| M * | Tourist’s perceived quality of service | Tourists’ cognitive perception of the hotel’s ambience including lighting, heating and cooling. This perception is influenced by the value of time travelling to and spending at the hotel, and money spent at the hotel to determine a hotel’s quality of service. Quality of service influences the tourists’ level of pleasure and perceived image of the hotel. | [114,122,123,124,125] | Depending | Evolve to ‘Tourists’ perceived levels of comfort and value for price’ as per stakeholders. |
| M * | Hotel accessibility to RET technology | RET is available and accessible to a hotel that wishes to adopt it. | [95] | Determinant | Evolve to ‘Number of hotels adopting RET’ by researchers. |
| M * | Eco-friendly hotel design | Hotel designs can conserve energy and reduce GHG emission. Examples of these hotel designs are installing thermal insulation on the external wall; improving fabric, lighting, appliances; changing heat, ventilation and air-conditioning systems. | [126,127,128] | Stake | Delete by stakeholders. |
| M * | Hotel chain affiliation | Whether a hotel is a part of a group operated by the same company or owner or not. Being part of a hotel chain influences hotel’s environmental practices, availability of financial and technical resources that influence successful environmental management such as RET adoption. Being part of hotel chain can also prevent RET adoption due to bureaucracy problems associated with chain hotels. | [95,129,130] | Environment | Keep. Name change to ‘Hotel participation of brand affiliation’ as per stakeholders. |
| M * | Hotel size | Size of a hotel influences its environmental practices, availability of financial and technical resources which further determine the success of environmental management. A smaller hotel usually has unclear green policies such as RET adaptation and has less borrowing ability than a larger hotel. | [95,129,130] | Determinant | Delete by stakeholders. |
| M * | Hotel traditional architecture | The traditional architecture of a hotel, particularly on the island, plays a dominant role in its beauty. This design becomes a challenge when integrating RET such as solar collectors. | [91,131] | Secondary lever | Delete by stakeholders. |
| M * | Hotel rating | Hotel-star rating influences its business’s environmental concern and willingness to use energy-efficient appliances. A hotel with a higher star rating has greater environmental concern and willingness to use energy-efficient appliances than a hotel with a lower star rating. | [94] | Determinant | Keep |
| M * | Hotel location | Where the hotel is situated influences the type of RET it adopts. For example, wind energy is technologically feasible and economically viable for coastal hotels, while solar energy suits a desert safari camp. Hotel location also influences accessibility to the grid. | [132,133,134,135,136] | Determinant | Evolve to ‘Proximity of hotel location to urban area’ as per stakeholders. |
| M * | Hotel land/building ownership | Hotels that do not operate on their own land or in their own building are restricted in physical development such as RET adoption. | [95] | Secondary lever | Delete by stakeholders. |
| M * | Hotel technical capacity | The hotel has engineers who support and promote energy projects. | [91,131] | Depending | Evolve to ‘Efficiency of engineers at a hotel’ as per stakeholders. |
| M * | Hotel availability of space | Available area for RET installation in a hotel. | [95,137] | Autonomous | Keep |
| M * | Hotel availability of finance | Whether or not a hotel has a fund available for RET investment in the hotel. | [91,95,131] | Relay | Keep. Name change to ‘Hotel sets aside money for RET investment’ as per stakeholders. |
| M * | Existence of a Green program at the hotel. | Whether or not a hotel has a social and environmental responsibility program. This green program can act as an environment advertising campaign and create an environmental image among tourists. This campaign is effective to target eco-conscious tourists. | [93,95] | Target | Evolve to ‘Hotel’s adoption of other energy conservation methods’ as per stakeholders. |
| M * | Hotel accessibility to the electrical grid | The electrical grid such as a transmission line is within reach of a hotel. Hotel’s location that is in a remote area or island may limit access to the grid, causing them to generate their own electricity through diesel generator or RET. | [113] | Secondary lever | Evolve to ‘Gap between the cost of electricity from the grid and from RET’ as per modelling experts. |
| M * | Hotelier perception of RET as a selling point | Hotelier perceives that adopting RET may improve their hotel image as being green and has a marketing effect. | [92] | Depending | Keep. Name change to ‘Hotel owner/manager perception of RET as a competitive advantage (selling point)’ as per stakeholders. |
| M * | Hotelier perception of RET financial benefits | Hotelier perceives that adopting RET may save hotel energy expenditure. | [95] | Depending | Keep. Name change to ‘Owner/manager perception of RET financial benefit’ as per stakeholders. |
| M * | Hotelier awareness of energy conservation methods | The hotelier is aware of methods that can be adopted in a hotel to reduce energy consumption. RET is rarely considered to reduce energy consumption. Other practices including recycling and not changing guest towels daily are perceived to reduce energy consumption. | [94,116,127] | Depending | Evolve to ‘Owner/manager awareness of financial benefits of energy conservation as per stakeholders. |
| M * | RET cost viability | The cost of making electricity from RET is less than its net present costs including capital, replacement and maintenance costs. This can be measured by, for example, money saved from using RET, revenue from selling electricity back to the grid, and simple payback period. Interest rates and inflation rates also moderate the cost of RET. | [138,139,140,141,142] | Determinant | Keep. Name change to ‘RET benefits’ as per stakeholders. |
| M * | Technical feasibility | RET adoption in a hotel is possible when measured against:
| [132,135,143,144,145,146,147,148] | Secondary lever | Dissolve into ‘Innovation investment’, ‘RET technology maturity and storage’, and ‘RET benefits’ as per stakeholders and modelling experts. |
| M * | Reliability of electricity produced by RET | The ability of RET to produce power consistently. | [149,150] | Determinant | Keep |
| M * | Energy storage | Storage such as battery increases the energy flow between the grid and intermittent renewable power in a hotel. | [151] | Stake | Evolve to ‘RET technology maturity and storage’ as per stakeholders. |
| M * | Tourist levels of comfort | Tourist levels of comfort and perceived value that are influenced by the hotel’s physical environment in the form of ambience particularly lighting, heating and cooling. Tourists’ perceived levels of pleasure influence their revisit intention. | [114,152,153] | Determinant | Evolve to ‘Tourists’ perceived levels of comfort and value for price’ as per stakeholders. |
| M * | Green job creation | Employment in an industry that is considered to produce environmental benefits such as renewable energy. Examples are jobs in RET manufacturing, installation and maintenance. Jobs in renewable energy can be found in the annual publication of the renewable energy status report such as REN21. | [106,154,155] | Autonomous | Delete by stakeholders. |
| M * | Availability of workforce | Appropriate trained workforce for the generation and distribution of the targeted RET. | [106,156,157,158] | Disconnected | Delete by researchers. |
| M * | Non-renewable energy cost | Price of non-renewable energy sources such as diesel and gas, and price of electricity purchased from centralised grid influences the feasibility of RET in a hotel and an RET adoption decision. If the price of diesel is low, hotels found that a diesel generator is more economical than RET, and the opposite when the price of diesel is high. Changes in non-renewable energy costs also determine the pace of RET development. The comparison between non-renewable and renewable energy costs determines when price subsidy and tax incentives for renewable energy electricity will be put in place. | [107,138,159,160,161,162] | Secondary lever | Keep. Name change to ‘Cost of non-renewable supply’ as per stakeholder. |
| M * | Reliability/availability of non-renewable supply | Whether a hotel has access to a reliable and continuous supply of non-renewable energy or not influences a hotel’s decision to adopt RET. | As per expert revision | Determinant | Delete by stakeholders. |
| CLDfinal ** | Number of hotels adopting RET | The number of hotels that acquire renewable energy technology to produce electricity for its own use. | Adjusted by researchers | Evolve from ‘Hotel accessibility to RET technology’. | |
| CLDfinal ** | Demand for small-medium scale RET | The quantity of a small to medium scale RET (that is not solar or wind farm) that the public and industries, including the hotel sector, are willing and able to buy. | Adjusted by stakeholders during I/WS | Dissolve from ‘The Renewable Energy Target scheme’. | |
| CLDfinal ** | Distribution network usage | The consumption of grid-based electricity between the public and industries including the hotel sector. | Added by stakeholders during I/WS | ||
| CLDfinal ** | Gross electricity retail profit margin | The financial gain for electricity retailers after deducting expenses such as operating costs. | Added by stakeholders during I/WS | ||
| CLDfinal ** | Lobby government to remove RET incentive | Industries that lose their profit to RET influence the legislator to withdraw RET incentives. | Added by stakeholders during I/WS | ||
| CLDfinal ** | Electricity retailer perception of RET financial benefits | Electricity retailer perceives that switching to RET-sourced electricity will generate them an income through government incentive policy. | Added by stakeholders during I/WS | ||
| CLDfinal ** | Large-scale RET investment | The amount of money used to establish or expand renewable energy power stations, such as wind and solar farms. | Adjusted by stakeholders during I/WS | Dissolve from ‘The Renewable Energy Target scheme’. | |
| CLDfinal ** | The gap between the target and actual emission | The difference between the amount of Australia’s target and actual emissions. Calculate by Australia’s target minus actual emissions. | Adjusted by modelling experts during I/WS | Evolve from ‘Australia’s 2030 climate change target’. | |
| CLDfinal ** | Competency of engineers at hotel | A skillful and knowledgeable engineer who works at the hotel. | Adjusted by stakeholders during I/WS | Depending | Evolve from ‘Hotel technical capacity’. |
| CLDfinal ** | Owner/manager awareness of financial benefits through energy conservation methods | Hotelier perceives that adopting energy conservation methods (other than using RET) will save the hotel energy expenditure. These methods are, for example, recycling and not changing guest towels daily. | Adjusted by stakeholders during I/WS | Evolve from ‘Hotelier awareness of energy conservation methods’. | |
| CLDfinal ** | Hotel’s adoption of other energy conservation methods | Hotel adopts energy conservation methods (other than using RET) to save the hotel’s energy expenditure. These methods are, for example, recycling and not changing guest towels daily. | Adjusted by stakeholders during I/WS | Evolve from ‘Existence of Green program in hotel’. | |
| CLDfinal ** | Value of the hotel’s electricity bill | Actual dollar value of the hotel’s electricity bill. | Added by stakeholders during I/WS | ||
| CLDfinal ** | Hotel’s profit | The differences between hotel’s earnings and expenses (including energy bills). | Added by stakeholders during I/WS | ||
| CLDfinal ** | Amount of energy charged by the electricity retailer | The amount electricity retailers charge in an energy plan for a hotel business. | Added by stakeholders during I/WS | ||
| CLDfinal ** | Domestic and other industries’ electricity bills | Actual dollar value of electricity bill for domestic and industries other than the hotel sector. | Added by stakeholders during I/WS | ||
| CLDfinal ** | Innovation investment | The monetary assistance from the public and private sectors for RET-related and development processes up until the product is commercially available. | Adjusted by stakeholders and modelling experts during I/WS | Dissolve from ‘Technical feasibility’. | |
| CLDfinal ** | RET technology maturity and storage | The availability of matured RET core technology and energy storage (i.e., battery). | Adjusted by stakeholders and modelling experts during I/WS | Evolve from ‘Technical feasibility’ and ‘Energy storage’. | |
| CLDfinal ** | Price of RET | The initial cost in dollar values of RET. | Added by stakeholders during I/WS | ||
| CLDfinal ** | The gap between the cost of electricity from the grid and from RET | The difference between the cost of electricity purchased from the grid and produced by hotel-owned RET. Calculate by grid price minus the hotel’s own. | Adjusted by modelling experts during I/WS | Evolve from ‘Hotel accessibility to the electrical grid’. | |
| CLDfinal ** | The gap between RET investment and purchasing electricity with GreenPower | The difference between the cost of electricity produced by the hotel-owned RET and purchased from the GreenPower providers. Calculate by RET investment minus purchasing electricity with GreenPower. | Added by modelling experts during I/WS | ||
| CLDfinal ** | Hotel purchases electricity with GreenPower | Hotel purchases electricity from GreenPower providers. | Added by stakeholders during I/WS | ||
| CLDfinal ** | Tourist awareness and attitude about the environment | Tourists being conscious of the environmental issues. | Adjusted by stakeholders during I/WS | Dissolve from ‘Tourist types’. | |
| CLDfinal ** | Tourists’ perceived levels of comfort and value for the price | Tourist perceives value pricing. The value indicates what tourists think they derive from consuming a service. | Adjusted by stakeholders during I/WS | Evolve from ‘Tourist levels of comfort’ and ‘Tourists’ perceived quality of service’. | |
| CLDfinal ** | Green tourists’ environmentally friendly behaviour | Environmentally-conscious tourists engage in environmentally friendly behaviours such as demanding eco-friendly accommodation and reducing their energy consumption during their stay. | Adjusted by stakeholders during I/WS | Dissolve from ‘Tourist types’. | |
| CLDfinal ** | Extreme weather | Unusual weather conditions such as heat wave or blizzard. | Added by stakeholders during I/WS | Evolve from ‘Travel season’. | |
| CLDfinal ** | Hotels in the same brand bargain together | A company or owner that operates multiple hotels negotiates with electricity providers for a cheap electricity plan. | Added by stakeholders during I/WS | ||
| CLDfinal ** | The proximity of hotel location to urban area | The distance between a hotel location and the urban area. The shorter the distance, the closer the hotel to the urban area. | Adjusted by stakeholders during I/WS | Evolve from ‘Hotel location’. | |
| CLDfinal ** | Electricity retailer options | A number of electricity retailer options available for a hotel to choose. | Added by stakeholders during I/WS |
* M = MICMAC; ** CLD final = the final CLD.
References
- Richmond, B. Systems thinking/system dynamics: Let’s just get on with it. Syst. Dyn. Rev. 1994, 10, 135–157. [Google Scholar] [CrossRef]
- Sterman, J.D. Business Dynamics: System Thinking and Modeling for a Complex World; Irwin McGraw-Hill: Boston, MA, USA, 2001. [Google Scholar]
- Meadows, D.H.; Wright, D. Thinking in Systems: A Primer; Taylor Francis [CAM]: London, UK, 2008. [Google Scholar]
- Wolstenholme, E.F. A systematic approach to model creation. In Modeling for Learning Organizations; Morecroft, J.D.W., Sterman, J.D., Eds.; Productivity Press: Portland, OR, USA, 1994. [Google Scholar]
- Wolstenholme, E.F. Qualitative vs. quantitative modelling: The evolving balance. J. Oper. Res. Soc. 1999, 50, 422–428. [Google Scholar] [CrossRef]
- Ford, D.N.; Sterman, J.D. Expert knowledge elicitation to improve formal and mental models. Syst. Dyn. Rev. 1998, 14, 309–340. [Google Scholar] [CrossRef]
- Lane, D.C. What we talk about when we talk about “systems thinking”. J. Oper. Res. Soc. 2016, 67, 527–528. [Google Scholar] [CrossRef]
- Martinez-Moyano, I.J.; Richardson, G.P. Best practices in system dynamics modeling. Syst. Dyn. Rev. 2013, 29, 102–123. [Google Scholar] [CrossRef]
- Abdelbari, H.; Shafi, K. A computational Intelligence-based Method to ’learn’ causal loop diagram-like structures from observed data. Syst. Dyn. Rev. 2017, 33, 3–33. [Google Scholar] [CrossRef]
- Creswell, J.W. Research Design: Qualitative, Quantitative and Mixed Methods Approaches, 2nd ed.; Sage Publications: Thousand Oaks, CA, USA, 2003. [Google Scholar]
- Tashakkori, A.; Teddle, C. Handbook of Mixed Methods in Social Behavioural Research; Sage Publications: Thousand Oaks, CA, USA, 2003. [Google Scholar]
- Greene, J.C. Mixed Methods in Social Inquiry; John Wiley Sons: San Francisco, CA, USA, 2007. [Google Scholar]
- Jackson, M.C. New directions in management science. In New Directions in Management Science; Jackson, M.C., Keys, P., Eds.; Gower: Brookfield, VT, USA, 1987. [Google Scholar]
- Flood, R.L. Liberating Sytems Theory; Springer: New York, NY, USA, 2013. [Google Scholar]
- Gregory, W.J. Discordant pluralism: A new strategy for critical systems thinking. Syst. Pract. 1996, 9, 605–625. [Google Scholar] [CrossRef]
- Mingers, J.; Gill, A. Multimethodology: The Theory and Practice of Combining Management Science Methodologies; Wiley: New York, NY, USA, 1997. [Google Scholar]
- Midgley, G. Systemic Intervention: Philosophy, Methodology, and Practice (Contemporary Systems Thinking); Springer Science Business Media: New York, NY, USA, 2001. [Google Scholar]
- Mingers, J. Multi-paradigm multimethodology. In Multi-Methodology: The Theory and Practice of Combining Management Science Methodologies; Mingers, J., Gill, A., Eds.; John Wiley Sons: England, UK, 1997. [Google Scholar]
- Randers, J. Elements of the System Dynamics Method; Productivity Press: Cambridge, MA, USA, 1980. [Google Scholar]
- Richardson, G.P.; Pugh, A.L. Introduction to System Dynamics Modeling with DYNAMO; Productivity Press: Cambridge, MA, USA, 1981. [Google Scholar]
- Freeman, E.R. Strategic Management: A Stakeholder Approach; Pitman: Boston, MA, USA, 1984. [Google Scholar]
- Reed, M.S.; Graves, A.; Dandy, N.; Posthumus, H.; Hubacek, K.; Morris, J.; Prell, C.; Quinn, C.H.; Stringer, L.C. Who’s in and why? A typology of stakeholder analysis methods for natural resource management. J. Environ. Manag. 2009, 90, 1933–1949. [Google Scholar] [CrossRef]
- Starik, M. Should trees have managerial standing? Toward stakeholder status for non-human nature. J. Bus. Ethics 1995, 14, 207–217. [Google Scholar] [CrossRef]
- Gaddis, E.; Vladich, H.; Voinov, A. Participatory modeling and the dilemma of diffuse nitrogen management in a residential watershed. Environ. Model. Softw. 2007, 22, 619–629. [Google Scholar] [CrossRef]
- Pretty, J.N. Participatory learning for sustainable agriculture. World Dev. 1995, 23, 1247–1263. [Google Scholar] [CrossRef]
- Voinov, A.; Bousquet, F. Modelling with stakeholders. Environ. Model. Softw. 2010, 25, 1268–1281. [Google Scholar] [CrossRef]
- Andersen, D.F.; Richardson, G.P.; Vennix, J.A.M. Group model-building: Adding more science to the craft. Syst. Dyn. Rev. 1997, 13, 187–201. [Google Scholar] [CrossRef]
- Van den Belt, M.; McCallion, A.; Wairepo, S.; Hardy, D.; Hale, L.; Berry, M. Mediated Modelling of Coastal Ecosystem Services: A Case Study of Te Awanui Tauranga Habour; Manaaki Taha Moana (MTM) Reserach Team: Palmerston North, New Zealand, 2012. [Google Scholar]
- Lynam, T.; de Jong, W.; Shell, D.; Kusumanto, T.; Evans, K. A review of tools for incorporating community knowledge, preferences, and values into decision making in natural resources management. Ecol. Soc. 2007, 21, 12. [Google Scholar] [CrossRef]
- Renger, M.; Kolshoten, G.; De Vreede, G. Challenges in collaborative modelling: A literature review and research agenda. Int. J. Simul. Process. Model. 2008, 4, 248–263. [Google Scholar] [CrossRef]
- Sedarati, P.; Santos, S.; Pintassilgo, P. System dynamics in tourism planning and development. Tour. Plan. Dev. 2018, 16, 1–25. [Google Scholar] [CrossRef]
- Williams, B.; Imam, I. Systems Concepts in Evaluation: An Expert Anthology. Available online: http://www.managingforimpact.org/sites/default/files/resource/system_concepts_in_evaluation.pdf (accessed on 16 August 2019).
- Rosenhead, J.; Mingers, J. Rational Analysis for a Problematic World Revisited: Problem Structuring Methods for Complexity, Uncertainty and Conflict; John Wiley Sons: Chichester, UK, 2001. [Google Scholar]
- Churchman, C.W. Operations research as a profession. Manag. Sci. 1970, 17, B37–B53. [Google Scholar] [CrossRef]
- Jones, T.M.; Felps, W.; Bigley, G.A. Ethical theory and stakeholder-related decisions: The role of stakeholder culture. Acad. Manag. Rev. 2007, 32, 137–155. [Google Scholar] [CrossRef]
- De Gooyert, V.; Rouwette, E.; van Kranenburg, H.; Freeman, E. Reviewing the role of stakeholders in operational research: A stakeholder theory perspective. Eur. J. Oper. Res. 2017, 262, 402–410. [Google Scholar] [CrossRef]
- Checkland, P. Systems Thinking, Systems Practice: Includes a 30 Year Retrospective; Wiley: Chichester, UK, 1999. [Google Scholar]
- Anderson, D.F.; Calhoun, A.; Hovmand, P.S.; Hower, T.; Rouwette, E.; Steins, E.; Richardson, G.P.; Rux, K. Scriptapedia. Available online: https://en.wikibooks.org/wiki/Scriptapedia (accessed on 11 April 2019).
- Richardson, G.P.; Anderson, D.F. Teamwork in group model building. Syst. Dyn. Rev. 1995, 11, 113–137. [Google Scholar] [CrossRef] [Green Version]
- Inam, A.; Adamowski, J.; Prasher, S.; Halbe, J.; Malard, J.; Albano, R. Coupling of a distributed stakeholder-built system dynamics socio-economic model with SAHYSMOD for sustainable soil salinity management—Part 1: Model development. J. Hydrol. 2017, 551, 596–618. [Google Scholar] [CrossRef]
- Wong, J.J.; McGregor, M.; Mior, S.A.; Loisel, P. Examination of the relationship between theory-driven policies and allowed lost-time back claims in workers’ compensation: A system dynamics model. J. Manip. Physiol. Ther. 2014, 37, 7–21. [Google Scholar] [CrossRef] [PubMed]
- Minard, R.A., Jr. Public Involvement in Comparative Risk Projects: Principles and Best Practices; Western Center for Environmental Decision-Making: Boulder, CO, USA, 1997. [Google Scholar]
- Richardson, G.P. Problems with causal-loop diagrams. Syst. Dyn. Rev. 1986, 2, 158–170. [Google Scholar] [CrossRef]
- Sterman, J.D. System dynamics modeling: Tools for learning in a complex world. Calif. Manag. Rev. 2001, 43, 8–25. [Google Scholar] [CrossRef]
- Midgley, G. Systemic Intervention: Philosophy, Methodology, and Practice; Kluwer Academic/Plenum Publishers: New York, NY, USA, 2000. [Google Scholar]
- Morecroft, J.D.W. A critical review of diagraming tools for conceptualizing feedback system model. Dynamica 1982, 8, 20–29. [Google Scholar]
- Mass, N.J. Methods of conceptualization. Syst. Dyn. Rev. 1986, 2, 76–80. [Google Scholar] [CrossRef]
- Gioia, D.; Pitre, E. Multiparadigm perspectives on theory building. Acad. Manag. Rev. 1990, 15, 584. [Google Scholar] [CrossRef]
- Barlas, Y.; Carpenter, S. Philosophical roots of model validation: Two paradigms. Syst. Dyn. Rev. 1990, 6, 148–166. [Google Scholar] [CrossRef]
- Vázquez, M.; Liz, M.; Aracil, J. Knowledge and reality: Some conceptual issues in system dynamics modeling. Syst. Dyn. Rev. 1996, 12, 21–37. [Google Scholar] [CrossRef]
- Luis Felipe, L.-R.; Deborah Lines, A. Collecting and analyzing qualitative data for system dynamics: Methods and models. Syst. Dyn. Rev. 2003, 19, 271–296. [Google Scholar]
- Chevalier, J.; Buckles, D. SAS: A Guide to Collaborative Inquiry and Social Engagement; SAGE Publications India Pvt Ltd.: New Delhi, India, 2008. [Google Scholar]
- Grimble, R.; Chan, M.K. Stakeholder analysis for natural resource management in developing countries: Some practical guidelines for making management more participatory and effective. Nat. Resour. Forum 1995, 19, 113–124. [Google Scholar] [CrossRef]
- Vennix, J.A.M. Group Model Building: Facilitating Team Learning Using System Dynamics; John Wiley Sons: New York, NY, USA, 1996. [Google Scholar]
- Müller, M.O.; Groesser, S.N.; Ulli-Beer, S. How do we know who to include in collaborative research? Toward a method for the identification of experts. Eur. J. Oper. Res. 2012, 216, 495–502. [Google Scholar] [CrossRef]
- Pickering, C.; Grignon, J.; Steven, R.; Guitart, D.; Byrne, J. Publishing not perishing: How research students transition from novice to knowledgeable using systematic quantitative literature reviews. Stud. High. Educ. 2015, 40, 1756–1769. [Google Scholar] [CrossRef]
- Healey, M.; Healey, R.L. How to conduct a literature search. In Key Methods in Geography; Clifford, N., French, S., Valentine, G., Eds.; Sage Publications: Los Angeles, CA, USA, 2010. [Google Scholar]
- Pickering, C.; Byrne, J. The benefits of publishing systematic quantitative literature reviews for PhD candidates and other early-career researchers. High. Educ. Res. Dev. 2013, 33, 534–548. [Google Scholar] [CrossRef] [Green Version]
- Mitchell, R.K.; Agle, B.R.; Wood, D.J. Toward a theory of stakeholder identification and salience: Defining the principle of who and what really counts. Acad. Manag. Rev. 1997, 22, 853–886. [Google Scholar] [CrossRef]
- Borenstein, M.; Hedges, L.V.; Higgins, J.P.T.; Rothstein, H.R. Introduction to Metaanalysis; Wiley: London, UK, 2009. [Google Scholar]
- Petticrew, M.; Roberts, H. Systematic Review in the Social Sciences: A Practical Guide; Blackwell Pub.: Malden, MA, USA, 2009. [Google Scholar]
- Godet, M. Integration of scenarios and strategic management: Using relevant, consistent and likely scenarios. Futures 1990, 22, 730–739. [Google Scholar] [CrossRef]
- Arcade, J.; Godet, M.; Meunier, F.; Roubelat, F. Structural Analysis with the MICMAC Method Actor’s Strategy with MACTOR Method. Futures Res. Method. 1999, 2003, 7–10. [Google Scholar]
- Saxena, J.P.; Vrat, P. Impact of indirect relationships in classification of variables—A micmac analysis for energy conservation. Syst. Res. 1990, 7, 245–253. [Google Scholar] [CrossRef]
- Sharma, H.D.; Gupta, S.; Gupta, A.D. A structural approach to analysis of causes of system waste in the Indian economy. Syst. Res. 1994, 11, 17–41. [Google Scholar] [CrossRef]
- Duperrin, J.C.; Godet, M. Methode de Hierarchisation des Elements d’un Systeme. 1973. Available online: http://lara.inist.fr/bitstream/handle/2332/1601/XX_CNE-Prospective_001414.pdf?sequence=1 (accessed on 16 August 2019).
- Amer, M.; Daim, T.U.; Jetter, A. A review of scenario planning. Futures 2013, 46, 23–40. [Google Scholar] [CrossRef]
- Huss, W.R.; Honton, E.J. Scenario planning—What style should you use? Long Range Plan. 1987, 20, 21–29. [Google Scholar] [CrossRef]
- Enzer, S. INTERAX—An interactive model for studying future business environments: Part I. Technol. Forecast. Soc. Chang. 1980, 17, 141–159. [Google Scholar] [CrossRef]
- Bradfield, R.; Wright, G.; Burt, G.; Cairns, G.; Van Der Heijden, K. The origins and evolution of scenario techniques in long range business planning. Futures 2005, 37, 795–812. [Google Scholar] [CrossRef]
- Suprun, E.; Sahin, O.; Stewart, R.A.; Panuwatwanich, K. Model of the Russian Federation Construction Innovation System: An Integrated Participatory Systems Approach. Systems 2016, 4, 29. [Google Scholar] [CrossRef]
- Onyango, E.A.; Sahin, O.; Awiti, A.; Chu, C.; Mackey, B. An integrated risk and vulnerability assessment framework for climate change and malaria transmission in East Africa. Malar. J. 2016, 15, 1–12. [Google Scholar] [CrossRef] [PubMed] [Green Version]
- Sahin, O.; Richards, R.; Sano, M. Integrated Modelling Approach for Climate Change Adaptation: The Case of Surf Life Saving Australia. In Proceedings of the 20th International Congress on Modelling and Simulation, Adelaide, Australia.
- Torres, N. ; Olaya. In C. Tackling the mess: System conceptualization through cross-impact analysis. In Proceedings of the 28th International Conference of the System Dynamics Society, Seoul, Korea.
- Ahmadian, A. System Dynamics and Technological Innovation System. Master’s Thesis, Chalmers University of Technology, Göteborg, Sweden, 2008. [Google Scholar]
- Mutingi, M. Adoption of renewable energy technologies: A fuzzy system dynamics perspective. In Energy Policy Modeling in the 21st Century; Springer: New York, NY, USA, 2013; pp. 175–196. [Google Scholar]
- Pereira, A.J.C.; Saraiva, J.T. Generation expansion planning (GEP)—A long-term approach using system dynamics and genetic algorithms (GAs). Energy 2011, 36, 5180–5199. [Google Scholar] [CrossRef]
- Friedrich, J.; Ge, M.; Pickens, A. This Interactive Chart Explains World’s Top 10 Emitters, and How They’ve Changed. Available online: http://www.wri.org/blog/2017/04/interactive-chart-explains-worlds-top-10-emitters-and-how-theyve-changed (accessed on 6 April 2019).
- Australian Government. Paris Agreement. Available online: http://www.environment.gov.au/climate-change/international/paris-agreement (accessed on 14 April 2019).
- IPCC. Summary for Policymakers In Climate Change 2014, Mitigation of Climate Chnage. In Contribution of Working Group III to the Fifth Assessment Report of the Intergovernmental Panel on Climate Change; Cambridge University Press: Cambridge, UK; New York, NY, USA, 2014. [Google Scholar]
- Australian Government. About the Renewable Energy Target. Available online: http://www.cleanenergyregulator.gov.au/RET/About-the-Renewable-Energy-Target/How-the-scheme-works (accessed on 3 March 2019).
- ARENA. What is Renewable Energy? Available online: https://arena.gov.au/about-renewable-energy/ (accessed on 1 May 2019).
- Department of the Environment and Energy. Australian Energy Update 2017. Available online: http://www.environment.gov.au/system/files/resources/f02a388d-74eb-4200-96fb-fe2a9d0caf5b/files/energy-update-report-2017.pdf (accessed on 16 August 2019).
- Department of the Environment and Energy. Australian Energy Statistics, Table O: Australian Electricity Generation, by Fuel Type, Physical Units; Australian Government, 2018. Available online: https://www.energy.gov.au/publications/australian-energy-statistics-table-o-electricity-generation-fuel-type-2016-17-and-2017 (accessed on 16 August 2019).
- QREEP. Credible Pathways to a 50% Renewable Energy Target for Queensland. Queensland Renewable Energy Expert Panel, 2016. Available online: https://www.dnrme.qld.gov.au/__data/assets/pdf_file/0018/1259010/qreep-renewable-energy-target-report.pdf (accessed on 16 August 2019).
- Lu, S.; Wei, S.; Zhang, K.; Kong, X.; Wu, W. Investigation and analysis on the energy consumption of starred hotel buildings in Hainan Province, the tropical region of China. Energy Convers. Manag. 2013, 75, 570–580. [Google Scholar] [CrossRef]
- Becken, S. Operators’ perceptions of energy use and actual saving opportunities for tourism accommodation. Asia Pac. J. Tour. Res. 2013, 18, 72–91. [Google Scholar] [CrossRef]
- Queensland Government. Tourist Accommodation: Licensed Hotels, Motels, Guest Houses and Serviced Apartments (a)(b), Queensland, 2005–06 to 2015–16 (archived). Available online: http://www.qgso.qld.gov.au/products/tables/tourism-accom-qld/index.php (accessed on 9 April 2019).
- TRA. Tourism Forecasts. Tourism Research Australia, Australian Government, 2017. Available online: https://www.tra.gov.au/ArticleDocuments/257/Tourism%20Forecasts.pdf.aspx?Embed=Y (accessed on 16 August 2019).
- Briggs, C. Power Grid May Finally be on Agenda for Locals in Queensland’s Daintree Wilderness. Australian BroadCasting, 2017. Available online: http://www.abc.net.au/news/2017-04-14/daintree-federal-minister-promises-action-on-grid-power/8444352 (accessed on 16 August 2019).
- Karagiorgas, M.; Tsoutsos, T.; Drosou, V.; Pouffary, S.; Pagano, T.; Lara, G.L.; Melim Mendes, J.M. HOTRES: Renewable energies in the hotels. An extensive technical tool for the hotel industry. Renew. Sustain. Energy Rev. 2006, 10, 198–224. [Google Scholar] [CrossRef]
- Dalton, G.J.; Lockington, D.A.; Baldock, T.E. A survey of tourist operator attitudes to renewable energy supply in Queensland, Australia. Renew. Energy 2007, 32, 567–586. [Google Scholar] [CrossRef]
- Zografakis, N.; Gillas, K.; Pollaki, A.; Profylienou, M.; Bounialetou, F.; Tsagarakis, K.P. Assessment of practices and technologies of energy saving and renewable energy sources in hotels in Crete. Renew. Energy 2011, 36, 1323–1328. [Google Scholar] [CrossRef]
- Petrevska, B.; Cingoski, V.; Serafimova, M. Sustainable tourism and hotel management in Macedonia through the use of renewnable energy sources. UTMS J. Econ. 2016, 7, 123–132. [Google Scholar]
- Mahachi, D.; Mokgalo, L.L.; Pansiri, J. Exploitation of renewable energy in the hospitality sector: Case studies of Gaborone Sun and the Cumberland Hotel in Botswana. Int. J. Hosp. Tour. Adm. 2015, 16, 331–354. [Google Scholar] [CrossRef]
- Sen, S.; Ganguly, S. Opportunities, barriers and issues with renewable energy development—A discussion. Renew. Sustain. Energy Rev. 2017, 69, 1170–1181. [Google Scholar] [CrossRef]
- Karatayev, M.; Hall, S.; Kalyuzhnova, Y.; Clarke, M.L. Renewable energy technology uptake in Kazakhstan: Policy drivers and barriers in a transitional economy. Renew. Sustain. Energy Rev. 2016, 66, 120–136. [Google Scholar] [CrossRef]
- Pável Reyes-Mercado, R. Adoption of renewable energy technologies in Mexico: The role of cognitive factors and innovation attributes. Int. J. Energy Sect. Manag. 2017, 11, 626–649. [Google Scholar] [CrossRef]
- McChesney, J. You Should Summarize Data with the Geometric Mean. Available online: https://medium.com/@JLMC/understanding-three-simple-statistics-for-data-visualizations-2619dbb3677a (accessed on 9 January 2019).
- Dhirasasna, N.; Becken, S.; Sahin, O. The Effect of Renewable Energy Technology Uptake by the Hotel Sector. In Proceedings of the 22nd International Congress on Modelling and Simulation (MODSIM2017), Tasmania, Australia, 3–8 December 2017. [Google Scholar]
- Dhirasasna, N. Addressing the Impacts of Renewable Energy Technology in the Tourist Accommodation Sector Using Systems Thinking. In Proceedings of the 28th Annual Council for Australasian Tourism and Hospitality Education (CAUTHE), Newcastle, Australia, 6–8 February 2018. [Google Scholar]
- Brinkmann, S. Qualitative Interviewing; Oxford University Press: New York, NY, USA, 2013. [Google Scholar]
- Lane, D.C. The emergence and use of diagramming in system dynamics: A critical account. Syst. Res. Behav. Sci. 2008, 25, 3–23. [Google Scholar] [CrossRef]
- Homer, J. Best practices in system dynamics modeling, revisited: A practitioner’s view. Syst. Dyn. Rev. 2019, 35, 177–181. [Google Scholar] [CrossRef]
- Aitken, M. A three-dimensional view of public participation in Scottish land-use planning: Empowerment or social control? Plan. Theory 2010, 9, 248–264. [Google Scholar] [CrossRef]
- Sheikh, N.J.; Kocaoglu, D.F.; Lutzenhiser, L. Social and political impacts of renewable energy: Literature review. Technol. Forecast. Soc. Chang. 2016, 108, 102–110. [Google Scholar] [CrossRef]
- Aagreh, Y.; Al-Ghzawi, A. Feasibility of utilizing renewable energy systems for a small hotel in Ajloun city, Jordan. Appl. Energy 2013, 103, 25–31. [Google Scholar] [CrossRef]
- Güler, Ö.; Akdağ, S.A.; Dinçsoy, M.E. Feasibility analysis of medium-sized hotel’s electrical energy consumption with hybrid systems. Sustain. Cities Soc. 2013, 9, 15–22. [Google Scholar] [CrossRef]
- Department of the Environment and Energy. The Renewable Energy Target (RET) Scheme. Available online: http://www.environment.gov.au/climate-change/government/renewable-energy-target-scheme (accessed on 27 March 2019).
- Department of the Environment and Energy. Australia’s 2030 Climate Change Target. Available online: http://www.environment.gov.au/climate-change/publications/factsheet-australias-2030-climate-change-target (accessed on 27 March 2019).
- Department of the Environment and Energy. Climate Change. Available online: http://www.environment.gov.au/climate-change (accessed on 11 April 2019).
- World Resources Institute. Emissions Intensity. Navigating the Numbers: Greenhouse Gas Data and International Climate Policy. 2005. Available online: http://pdf.wri.org/navigating_numbers_chapter5.pdf (accessed on 16 August 2019).
- Basir Khan, M.R.; Jidin, R.; Pasupuleti, J.; Shaaya, S.A. Optimal combination of solar, wind, micro-hydro and diesel systems based on actual seasonal load profiles for a resort island in the South China Sea. Energy 2015, 82, 80–97. [Google Scholar] [CrossRef]
- Borkovic, Z.H.; Kulisic, B.; Zidar, M. Energy audit-Method for energy conservation in hotels. Tour. Hosp. Manag. 2008, 14, 349–358. [Google Scholar]
- Bohdanowicz, P.; Martinac, I. Determinants and benchmarking of resource consumption in hotels-Case study of Hilton International and Scandic in Europe. Energy Build. 2007, 39, 82–95. [Google Scholar] [CrossRef]
- Knezevic, R.; Vicic, L. A survey of tourism management attitudes to renewable energy supply in primorsko-goranska county (croatia). Tour. Hosp. Manag. 2008, 14, 95–104. [Google Scholar]
- Dalton, G.J.; Lockington, D.A.; Baldock, T.E. A survey of tourist attitudes to renewable energy supply in Australian hotel accommodation. Renew. Energy 2008, 33, 2174–2185. [Google Scholar] [CrossRef]
- Kostakis, I.; Sardianou, E. Which factors affect the willingness of tourists to pay for renewable energy? Renew. Energy 2012, 38, 169–172. [Google Scholar] [CrossRef]
- Tsagarakis, K.P.; Bounialetou, F.; Gillas, K.; Profylienou, M.; Pollaki, A.; Zografakis, N. Tourists’ attitudes for selecting accommodation with investments in renewable energy and energy saving systems. Renew. Sustain. Energy Rev. 2011, 15, 1335–1342. [Google Scholar] [CrossRef]
- Becken, S.; Simmons, D.; Frampton, C. Segmenting tourists by their travel pattern for insights into achieving energy efficiency. J. Travel Res. 2003, 42, 48–56. [Google Scholar] [CrossRef]
- Shah, K.U. Strategic organizational drivers of corporate environmental responsibility in the caribbean hotel industry. Policy Sci. 2011, 44, 321. [Google Scholar] [CrossRef]
- Hooper, D.; Coughlan, J.; Mullen, M.R. The servicescape as an antecedent to service quality and behavioral intentions. J. Serv. Mark. 2013, 27, 271–280. [Google Scholar] [CrossRef] [Green Version]
- Reimer, A.; Kuehn, R. The impact of servicescape on quality perception. Eur. J. Mark. 2005, 39, 785–808. [Google Scholar] [CrossRef]
- Sureshchandar, G.S.; Rajendran, C.; Anantharaman, R.N. Determinants of customer-perceived service quality: A confirmatory factor analysis approach. J. Serv. Mark. 2002, 16, 9–34. [Google Scholar] [CrossRef]
- Sureshchandar, G.S.; Rajendran, C.; Kamalanabhan, T.J. Customer perceptions of service quality: A critique. Total Qual. Manag. 2001, 12, 111–124. [Google Scholar] [CrossRef]
- Gaglia, A.G.; Balaras, C.A.; Mirasgedis, S.; Georgopoulou, E.; Sarafidis, Y.; Lalas, D.P. Empirical assessment of the Hellenic non-residential building stock, energy consumption, emissions and potential energy savings. Energy Convers. Manag. 2007, 48, 1160–1175. [Google Scholar] [CrossRef]
- Schendler, A. Applying the principles of industrial ecology to the guest-service sector. J. Ind. Ecol. 2003, 7, 127–138. [Google Scholar] [CrossRef]
- Taylor, S.; Peacock, A.; Banfill, P.; Shao, L. Reduction of greenhouse gas emissions from uk hotels in 2030. Build. Environ. 2010, 45, 1389–1400. [Google Scholar] [CrossRef]
- Álvarez Gil, M.J.; Burgos Jiménez, J.; Céspedes Lorente, J.J. An analysis of environmental management, organizational context and performance of spanish hotels. Omega 2001, 29, 457–471. [Google Scholar] [CrossRef]
- Mensah, I.; Blankson, E.J. Determinants of hotels’ environmental performance: Evidence from the hotel industry in accra, ghana. J. Sustain. Tour. 2013, 21, 1212–1231. [Google Scholar] [CrossRef]
- Dascalaki, E.; Balaras, C.A. XENIOS—A methodology for assessing refurbishment scenarios and the potential of application of RES and RUE in hotels. Energy Build. 2004, 36, 1091–1105. [Google Scholar] [CrossRef]
- Bechrakis, D.A.; McKeogh, E.J.; Gallagher, P.D. Simulation and operational assessment for a small autonomous wind-hydrogen energy system. Energy Convers. Manag. 2006, 47, 46–59. [Google Scholar] [CrossRef]
- Dalton, G.J.; Lockington, D.A.; Baldock, T.E. Feasibility analysis of stand-alone renewable energy supply options for a large hotel. Renew. Energy 2008, 33, 1475–1490. [Google Scholar] [CrossRef]
- Dalton, G.J.; Lockington, D.A.; Baldock, T.E. Case study feasibility analysis of renewable energy supply options for small to medium-sized tourist accommodations. Renew. Energy 2009, 34, 1134–1144. [Google Scholar] [CrossRef]
- Hossain, M.; Mekhilef, S.; Olatomiwa, L. Performance evaluation of a stand-alone pv-wind-diesel-battery hybrid system feasible for a large resort center in south china sea, malaysia. Sustain. Cities Soc. 2017, 28, 358–366. [Google Scholar] [CrossRef]
- Shezan, S.A.; Saidur, R.; Ullah, K.R.; Hossain, A.; Chong, W.T.; Julai, S. Feasibility analysis of a hybrid off-grid wind-dg-battery energy system for the eco-tourism remote areas. Clean Technol. Environ. Policy 2015, 17, 2417–2430. [Google Scholar] [CrossRef]
- Chan, W.W.; Li, D.; Mak, B.; Liu, L. Evaluating the application of solar energy for hot water provision: An action research of independent hotel. Int. J. Hosp. Manag. 2013, 33, 76–84. [Google Scholar] [CrossRef]
- Anastasiadis, A.G.; Vokas, G.; Papageorgas, P.; Kondylis, G.; Kasmas, S. Effects of carbon taxation, distributed generation and electricity storage technologies on a microgrid. Energy Procedia 2014, 50, 824–831. [Google Scholar] [CrossRef]
- Zobaa, A.F.; Bansal, R.C. Handbook of Renewable Energy Technology; World Scientific: Hackensack, NJ, USA; Singapore, 2011. [Google Scholar]
- Buonomano, A.; Calise, F.; Palombo, A.; Vicidomini, M. Energy and economic analysis of geothermal-solar trigeneration systems: A case study for a hotel building in ischia. Appl. Energy 2015, 138, 224–241. [Google Scholar] [CrossRef]
- Palmero-Marrero, A.I.; Oliveira, A.C. Performance simulation of a solar-assisted micro-tri-generation system: Hotel case study. Int. J. Low Carbon Technol. 2011, 6, 309–317. [Google Scholar] [CrossRef]
- Rubio-Maya, C.; Uche-Marcuello, J.; Martínez-Gracia, A.; Bayod-Rújula, A.A. Design optimization of a polygeneration plant fuelled by natural gas and renewable energy sources. Appl. Energy 2011, 88, 449–457. [Google Scholar] [CrossRef]
- Haidar, A.M.A.; Muttaqi, K.; Sutanto, D. Smart grid and its future perspectives in Australia. Renew. Sustain. Energy Rev. 2015, 51, 1375–1389. [Google Scholar] [CrossRef]
- Kaldellis, J.K.; Kavadias, K.; Christinakis, E. Evaluation of the wind–hydro energy solution for remote islands. Energy Convers. Manag. 2001, 42, 1105–1120. [Google Scholar] [CrossRef]
- SolarCalculation. Choose Your Optimal System Size. Available online: https://solarcalculator.com.au/solar-system-size/ (accessed on 29 March 2019).
- Liu, X.; Zeng, M. Renewable energy investment risk evaluation model based on system dynamics. Renew. Sustain. Energy Rev. 2017, 73, 782–788. [Google Scholar] [CrossRef]
- Stoppato, A.; Benato, A.; Destro, N.; Mirandola, A. A model for the optimal design and management of a cogeneration system with energy storage. Energy Build. 2016, 124, 241–247. [Google Scholar] [CrossRef]
- Zhang, H.L.; Baeyens, J.; Degrève, J.; Cacères, G. Concentrated solar power plants: Review and design methodology. Renew. Sustain. Energy Rev. 2013, 22, 466–481. [Google Scholar] [CrossRef]
- Bakos, G.C.; Soursos, M. Techno-economic assessment of a stand-alone PV/hybrid installation for low-cost electrification of a tourist resort in Greece. Appl. Energy 2002, 73, 183–193. [Google Scholar] [CrossRef]
- Lofthouse, J.; Simmons, R.T.; Yonk, R.M. Reliability of Renewable Energy: Solar. Available online: http://www.usu.edu/ipe/wp-content/uploads/2015/11/Reliability-Solar-Full-Report.pdf (accessed on 16 August 2019).
- Nanaeda, K.; Mueller, F.; Brouwer, J.; Samuelsen, S. Dynamic modeling and evaluation of solid oxide fuel cell—Combined heat and power system operating strategies. J. Power Sources 2010, 195, 3176–3185. [Google Scholar] [CrossRef]
- Han, H.; Ryu, K. The roles of the physical environment, price perception, and customer satisfaction in determining customer loyalty in the restaurant industry. J. Hosp. Tour. Res. 2009, 33, 487–510. [Google Scholar] [CrossRef]
- Rapoport, A. The Meaning of the Built Environment; Sage Publications: Beverly Hills, CA, USA, 1982. [Google Scholar]
- Acey, C.S.; Culhane, T.H. Green jobs, livelihoods and the post-carbon economy in african cities. Local Environ. 2013, 18, 1046–1065. [Google Scholar] [CrossRef]
- Tsoutsos, T.; Frantzeskaki, N.; Gekas, V. Environmental impacts from the solar energy technologies. Energy Policy 2005, 33, 289–296. [Google Scholar] [CrossRef]
- Amer, M.; Daim, T.U. Application of technology roadmaps for renewable energy sector. Technol. Forecast. Soc. Chang. 2010, 77, 1355–1370. [Google Scholar] [CrossRef]
- Clancy, J.; Oparaocha, S.; Roehr, U. Gender equity and renewable energies. In International Conference for Renewable Energies; Secretariat of the International Conference for Renewable: Bonn, Germany, 2004. [Google Scholar]
- Coggeshall, C.; Margolis, R.M. Consortia Focused on Photovoltaic rd, Manufacturing, and Testing: A Review of Existing Models and Structures; University of Nevada: Las Vegas, Nevada, 2010; pp. 1–44. [Google Scholar]
- Ashourian, M.H.; Cherati, S.M.; Mohd Zin, A.A.; Niknam, N.; Mokhtar, A.S.; Anwari, M. Optimal green energy management for island resorts in Malaysia. Renew. Energy 2013, 51, 36–45. [Google Scholar] [CrossRef]
- Dalton, G.J.; Lockington, D.A.; Baldock, T.E. Feasibility analysis of renewable energy supply options for a grid-connected large hotel. Renew. Energy 2009, 34, 955–964. [Google Scholar] [CrossRef]
- Fazelpour, F.; Soltani, N.; Rosen, M.A. Feasibility of satisfying electrical energy needs with hybrid systems for a medium-size hotel on kish island, iran. Energy 2014, 73, 856–865. [Google Scholar] [CrossRef]
- Zhang, M.M.; Zhou, P.; Zhou, D.Q. A real options model for renewable energy investment with application to solar photovoltaic power generation in china. Energy Econ. 2016, 59, 213–226. [Google Scholar] [CrossRef]
Figure 1.
Stakeholder identification method’s rainbow diagram. Source [52].
Figure 1.
Stakeholder identification method’s rainbow diagram. Source [52].

Figure 2.
Roles of variables related to the renewable energy technology adoption in the hotel sector in Queensland, based on Impact Matrix Cross-Reference Multiplication Applied to a Classification (MICMAC)’s direct influence and dependence map.
Figure 2.
Roles of variables related to the renewable energy technology adoption in the hotel sector in Queensland, based on Impact Matrix Cross-Reference Multiplication Applied to a Classification (MICMAC)’s direct influence and dependence map.

Figure 3.
Direct influence graph representing the strongest influence of variables of the RET adoption in the hotel sector in Queensland.
Figure 3.
Direct influence graph representing the strongest influence of variables of the RET adoption in the hotel sector in Queensland.

Figure 4.
The preliminary CLDs of RET adoption in the hotel sector based on the systematic quantitative literature reviews.
Figure 4.
The preliminary CLDs of RET adoption in the hotel sector based on the systematic quantitative literature reviews.

Figure 5.
CLD1 of RET adoption in the hotel sector within Queensland, based on the systematic quantitative literature review and MICMAC.
Figure 5.
CLD1 of RET adoption in the hotel sector within Queensland, based on the systematic quantitative literature review and MICMAC.

Figure 6.
The final CLD for the RET adoption in the hotel sector in Queensland, Australia, developed from the systematic literature review, MICMAC, stakeholder interviews and workshop.
Figure 6.
The final CLD for the RET adoption in the hotel sector in Queensland, Australia, developed from the systematic literature review, MICMAC, stakeholder interviews and workshop.

Table 1.
The multi-methodology approach for causal loop diagrams (CLDs) development proposed by this research.
Table 1.
The multi-methodology approach for causal loop diagrams (CLDs) development proposed by this research.
| Step (1) Problem Articulation | |||||
| 1.1 Identifying stakeholders | Clients/modellers gather stakeholder lists (QL*). | → | Use the stakeholder identification method (SI) to organise stakeholders based on their roles (affect, being affected, or both) and the degree of their roles (most, moderate, least) (QL*). | → | Clients/modellers select stakeholders (QL*). |
| 1.2 Identifying relevant variables | Modellers gather variables using the systematic quantitative literature review (SQLR) (QT*). | → | Clients/stakeholders review/amend variable list (QL*). | ||
| Step (2) Formulating Dynamic Hypothesis | |||||
| 2.1 Identifying endo/exogenous variables | Stakeholders complete a structural-analysis MICMAC matrix (MICMAC) (QT*). | → | Use the direct influence and dependence chart to identify endo/exogenous variables (QT*). | → | Clients/stakeholders review/amend variables and their relationships in the CLDs (QL*). |
| 2.2 Mapping the system structure using CLD | → | Use the displacement map and the direct and indirect influence graphs to understand the possible hidden variables and relationships; and use them as a reference for drawing CLDs (QT*). | |||
* QL = Qualitative approach, QT = Quantitative approach.
Table 2.
Expert identified stakeholders influencing, both influencing and affected by, and affected by the hotel RET adoption in Queensland, Australia.
Table 2.
Expert identified stakeholders influencing, both influencing and affected by, and affected by the hotel RET adoption in Queensland, Australia.
| Expert | Influencing | Influencing and Affected | Affected | |||
|---|---|---|---|---|---|---|
| Most | Moderate | Most | Moderate | Most | Moderate | |
| Tourism | RET consulting company | -Federal Gov. * -Guest -Hotel chain head office | -Hotel engineer -Hotel manager -Hotel owner | -Bank -State Gov. -Electricity company | Atmosphere | Community |
| Engineering | RET industry | -Hotel owner -State Gov. -Financial institution | -Tourists | -Local Gov. -Local community -Koalas | ||
* Gov. = Government.
Table 3.
Involving stakeholders at each stage of the CLD’s development (MM = MICMAC, I = one-on-one interview, WS = stakeholder engagement workshop).
Table 3.
Involving stakeholders at each stage of the CLD’s development (MM = MICMAC, I = one-on-one interview, WS = stakeholder engagement workshop).
| Stakeholder Category | Stakeholder Group | Data Collection Method |
|---|---|---|
| Hotel sector | Hotel managers | MM, I |
| Hotel owners | MM, I | |
| Hotel engineers | MM, I | |
| Hotel accountants | MM, I | |
| Hotel sustainable accreditation companies | I, WS | |
| Tourists | Academic experts in tourist behaviours | I, WS |
| Government | State government | WS |
| Local government | WS | |
| Tourism organisation | WS | |
| Electricity provider | I |
Table 4.
Descriptions of the feedback loops within Figure 5.
Table 4.
Descriptions of the feedback loops within Figure 5.
| Loop Name | Reinforce/Balancing | Variables Involved |
|---|---|---|
| Counter clockwise 1 | Unknown | 19, 29, 15, 8, 24 |
| Counter clockwise 2 | Unknown | 32, 33 |
| Counter clockwise 3 | Unknown | 31, 32 |
| Counter clockwise 4 | Unknown | 25, 29 |
| Counter clockwise 5 | Unknown | 17, 24 |
| Clockwise 1 | Unknown | 37, 31 |
| Clockwise 2 | Unknown | 33, 31 |
| Clockwise 3 | Unknown | 33, 30 |
| Clockwise 4 | Unknown | 11, 10 |
| Clockwise 5 | Unknown | 25, 12, 7, 8, 24,19 |
| Clockwise 6 | Unknown | 25, 8, 24, 19 |
| Clockwise 7 | Unknown | 25, 19, 29 |
| Clockwise 8 | Unknown | 15, 18 |
| Clockwise 9 | Unknown | 37, 33, 32, 31 |
Table 5.
The feedback loop descriptions within Figure 6.
Table 5.
The feedback loop descriptions within Figure 6.
| Loop Name | Variables Involved (Number) | |
|---|---|---|
| Balancing | B1 | 19, 35 |
| B2 | 1, 2, 3, 4, 5, 6, 7, 8, 9 | |
| B3 | 1, 2, 3, 4, 10, 11, 12, 13, 6, 7, 8, 9 | |
| Reinforcing | R1 | 1, 2, 12, 13, 6, 7, 8, 9 |
| R2 | 14, 15 | |
| R3 | 14, 15, 16, 17, 18 | |
| R4 | 14, 7 | |
| R5 | 1, 2, 3, 4, 19, 17, 18, 14, 7, 8, 9 | |
| R6 | 19, 20, 2, 3, 4 | |
| R7 | 4, 10, 11, 3 | |
| R8 | 21, 22, 23, 24 | |
| R9 | 21, 22, 24 | |
| R10 | 21, 25, 24 | |
| R11 | 21, 6 | |
| R12 | 1, 2, 21, 6, 7, 8, 9 | |
| R13 | 1, 2, 21, 22, 23, 26, 27, 7, 8, 9 | |
| R14 | 1, 2, 21, 25, 28, 7, 8, 9 | |
| R15 | 1, 2, 21, 25, 29, 30, 7, 8, 9 | |
| R16 | 1, 31, 32, 26, 6, 7, 8, 9 | |
| R17 | 1, 31, 32, 33, 16, 17, 18, 14, 7, 8, 9 | |
| R18 | 1, 2, 12, 34, 33, 16, 17, 18, 14, 7, 8, 9 | |
| R19 | 1, 31, 32, 26, 27, 7, 8, 9 |
© 2019 by the authors. Licensee MDPI, Basel, Switzerland. This article is an open access article distributed under the terms and conditions of the Creative Commons Attribution (CC BY) license (http://creativecommons.org/licenses/by/4.0/).
Share and Cite
MDPI and ACS Style
Dhirasasna, N.; Sahin, O. A Multi-Methodology Approach to Creating a Causal Loop Diagram. Systems 2019, 7, 42. https://0-doi-org.brum.beds.ac.uk/10.3390/systems7030042
AMA Style
Dhirasasna N, Sahin O. A Multi-Methodology Approach to Creating a Causal Loop Diagram. Systems. 2019; 7(3):42. https://0-doi-org.brum.beds.ac.uk/10.3390/systems7030042
Chicago/Turabian StyleDhirasasna, NiNa, and Oz Sahin. 2019. "A Multi-Methodology Approach to Creating a Causal Loop Diagram" Systems 7, no. 3: 42. https://0-doi-org.brum.beds.ac.uk/10.3390/systems7030042
Note that from the first issue of 2016, this journal uses article numbers instead of page numbers. See further details here.