Operationalizing Accounting Reporting in System Dynamics Models


Atkinson Graduate School of Management, Willamette University, Salem, OR 97301, USA
Systems 2020, 8(1), 9; https://0-doi-org.brum.beds.ac.uk/10.3390/systems8010009
Submission received: 14 January 2020
/
Revised: 18 March 2020
/
Accepted: 20 March 2020
/
Published: 24 March 2020
(This article belongs to the Collection System Dynamics)
Abstract
:System dynamics implementations of financial statements are currently limited by the lack of a simple to use, yet sufficiently detailed model that operationally replicates the accounting reporting process for the income statement, balance sheet, cash flow statement, and statement of changes in owners’ equity. While system dynamics accounting structures exist, they are inconsistently applied in the literature. In this paper, we offer a comprehensive accounting model in the hope that academics and practitioners will use its structures to better represent accounting reports in their projects.
1. Introduction
Models of businesses and business processes are some of the earliest applications of system dynamics [1,2] and continue to be very influential today [3,4,5,6]. While these models often include structures that are intended to represent financial accounting reports, the way that the accounting reporting process is represented is usually highly simplistic. In some cases, a simplistic treatment of accounting is all that is needed for a model’s purpose, but it is also likely that the lack of a standard structure [7] for operationalizing accounting inside of system dynamics models leads some modelers to over-simplify what can be an opaque and detail-oriented area of management.
The most highly operational representations of accounting reporting inside of system dynamics models are the work of John Sterman and his co-authors. As early as his thesis [8,9] Sterman’s models included simple structures for endogenously representing balance sheets and income statements [10]. While his treatment of accounting is sometimes questionable (for example, the negative debt in [11]), his Analog Devices paper with Nelson Repenning and Fred Kofman [12] was the first to recognize the importance of explicitly representing accounting reporting as a discrete process.
Most system dynamics models in management accurately represent basic accounting definitions such as net income being the difference between revenue and expenses, but they almost always model the instantaneous value of these flows rather than considering the way that the process of generating accounting reports aggregates the flows over time and reports them during a single time step. The instantaneous value of the flow of revenue at the end of the year is not the same as the total revenue earned over the year, yet because it is so easy to create a flow of revenue, most system dynamics models rely on simple flows. Correct accounting reporting structures are a common thread in the work of Sterman’s coauthors and students [13,14,15], but it is exceedingly rare to see other modelers use them [16,17,18] even when their express purpose is to represent accounting reports [19,20].
Not operationalizing the accounting reporting process has the potential to cause serious problems. First, managers use accounting reports to make decisions and evaluate results. Representing the way that these reports average and lag the instantaneous values of the relevant flows is required in order to build models that replicate the decision process of managers. Second, if we want to “involve the people, one hopes to influence in the modeling process from the beginning” [21] (page 38) by building face validity, replicating the types of reports managers are used to working with is an important step. Face validity is particularly salient for applications of system dynamics in flight simulators [5,22,23,24]. Finally, any work that aims to match simulated outputs with quantitative data on financial results will be biased if it does not replicate the accounting reporting process that produced that data.
The lack of a standard structure for replicating the income statement, balance sheet, statement of cash flows, and owners’ equity statement is limiting the implementation of operational accounting structures in system dynamics models. While Repenning and Sterman [25] provide an excellent foundation for such a model, the field needs an updated effort in this direction, both because their model has been so rarely utilized, and because there are some incremental improvements that can be made. For example, Repenning and Sterman do not extend the logic of the reporting process to the cash flow statement, and so their model’s reporting of those results relies on instantaneous values of flows. They also fail to represent straight line depreciation, opting instead to model depreciation as a first order delay. These decisions are understandable given their purpose, but these omissions will stand out as incorrect to people familiar with accounting conventions.
This paper’s contribution then, is to provide an open-access, well-documented model that is both general in its ability to interface with the work of modelers unfamiliar with accounting, and operational enough to produce financial statements that look familiar to seasoned businesspeople. We build and offer a module that can be used by other modelers without any knowledge of accounting. Our model boundary uses typical variables that most system dynamics professionals will understand rather than requiring users to interface with the accounting model by breaking down individual accounting transactions (such as in Ch. 3 of [26]). We hope that this strikes an appropriate balance between usability and precision.
Yes, model structures should be determined by a model’s purpose, but this decision is always a judgement call. Since representing accounting accurately is difficult, some modelers may decide that their purpose does not really require it even when there would be a benefit. A standard structure that can be easily applied and adapted will allow far wider application of operational representations of accounting, increasing the ability of modelers to properly engage key stakeholders, build face validity, and match their models to reported accounting data.
2. Important Accounting Concepts
The outputs of the accounting reporting process are the financial statements, the most prominent way that managers understand and direct their firms. There are five financial statements companies include in their annual reports: The income statement, the balance sheet, the cash flow statement, the statement of changes in owners’ equity, and the other comprehensive income statement. Of these, the balance sheet, income statement, cash flow statement, and statement of changes in owners’ equity are the most salient to managers, and so we will limit our model to presenting only these four.
The income statement reports the net income of the firm, which is the bottom-line measure of profit, and one of the most important outputs of the accounting process [27]. The classic income statement presentation places revenue, or the flow of value created by the company’s sales, at the top, with expenses sequentially subtracted from revenue, resulting in more restrictive income figures being calculated as you move down the statement. Typical expense categories include the cost of goods sold, operating expenses like marketing and depreciation, and interest and tax expenses.
The balance sheet presents the stocks of value in the company and is organized into three sections: assets, liabilities, and equity. These three sections are related through an equation known as the balance sheet identity, which states that the assets of the company must always equal the liabilities of the company plus its owners’ equity. Some assets and liabilities on the balance sheet are called accruals [28] because they add up the difference between flows of cash, such as the collection of customer payments, and flows of value, such as the billing of customers for the shipment of goods.
Three categories of cash flows are reported on the cash flow statement: operating, investing, and financing. Operating cash flows arise from the company’s day to day operations, investing cash flows occur when the company invests in long-term assets or financial markets, and financing cash flows arise from the debt and equity used to raise cash for the other two types of activities. Due to the focus on value flows rather than cash flows in the first two financial statements, the operating cash flow of for-profit companies is presented using the indirect method, which carefully explains the differences between net income and net cash flow from operating activities. This reconciliation is accomplished by first subtracting out the impact of any non-cash expenses counted as a part of net income and then undoing the impact of the changes in each accrual account on the balance sheet.
The owners’ equity statement reports the flows in and out of each stock of equity in the firm. While this is conceptually simple for a system dynamics audience, it can often be very detailed and complex in practice. We do not implement many of the more detailed potential equity arrangements here, but they will follow the general form of the equity stocks that we have implemented.
We omitted one financial statement, the other comprehensive income statement, because it documents the impacts of particularly complex transactions like financial derivatives and revaluation of long-term pension obligations, and therefore would be much harder to create simply. Luckily, these kinds of transactions are unlikely to arise in most system dynamics modeling applications.
Incremental Improvements
Our model improves on the state of the art in system dynamics models of accounting reporting [12,15,25] in several ways. This paper is the first to calculate straight line depreciation with both the historical cost and accumulated depreciation represented explicitly, generate an indirect statement of cash flows, represent the impact of accruals on the statement of cash flows, enable quarterly reporting as an option for all financial statements, generate a statement of changes in owners’ equity, and give reported output that is constant over a period rather than a pulse during a single time step.
3. Description of the Accounting Model
3.1. Current Assets
The model includes three current asset stocks that are very typical: Cash, Accounts Receivable, and Inventory.
Cash integrates all the instantaneous cash flows in and out of the company and is initialized at a target fraction of operating cash outflows, a common way for companies to think about their desired cash on hand. We make the conscious decision not to require the stock of cash to keep a positive value so that we can preserve the balance sheet identity, but any operational financing model should cause the company to borrow or issue equity in order to keep the stock of cash above zero.
Accounts receivable is an accrual, which means that it integrates the difference between a flow of value (sales on credit) and a flow of cash (collections from customers). Sales on credit are assumed to be a constant fraction of all revenue, with the rest of revenue resulting in an immediate cash flow. Collections from customers are modeled as a first-order material delay occurring over an average collection time that is equal to the credit terms that the company offers to its customers.
Inventory is also an accrual. It accumulates the difference between the value consumed when inventory is sold, and the cash consumed when materials or labor are used to create inventory. The cost of inventory removed from this stock when goods are sold is calculated using the average cost method, which assumes that the total cost of inventory is spread evenly between each of the inventory units that the company is constructing or storing. This is not the way that most companies do their inventory accounting, but it is the only reasonable method for a system dynamics model of inventory accounting to use.
Replicating the most common method of accounting for inventory in a system dynamics context is difficult because the first-in first-out (FIFO) method,1 which is followed by most companies, is a problematically discrete process. Whenever the unit cost of inventory changes, FIFO inventory tracks how many units are produced at that cost. This accounting enables the exact cost of the oldest units in inventory to be removed whenever inventory is sold. Due to this, correctly accounting for FIFO inventory in a system dynamics model would require dynamically creating a new stock of inventory value every time the unit cost of materials or labor changed and then dynamically removing that stock of inventory value whenever those goods were sold. This might be possible,2 but it is very computationally costly for what will not be an important difference in most contexts.
3.2. Long-Term Assets
The model includes two types of long-term assets that have very similar accounting structures: Plant, Property, and Equipment (PPE), and Intangible Assets.
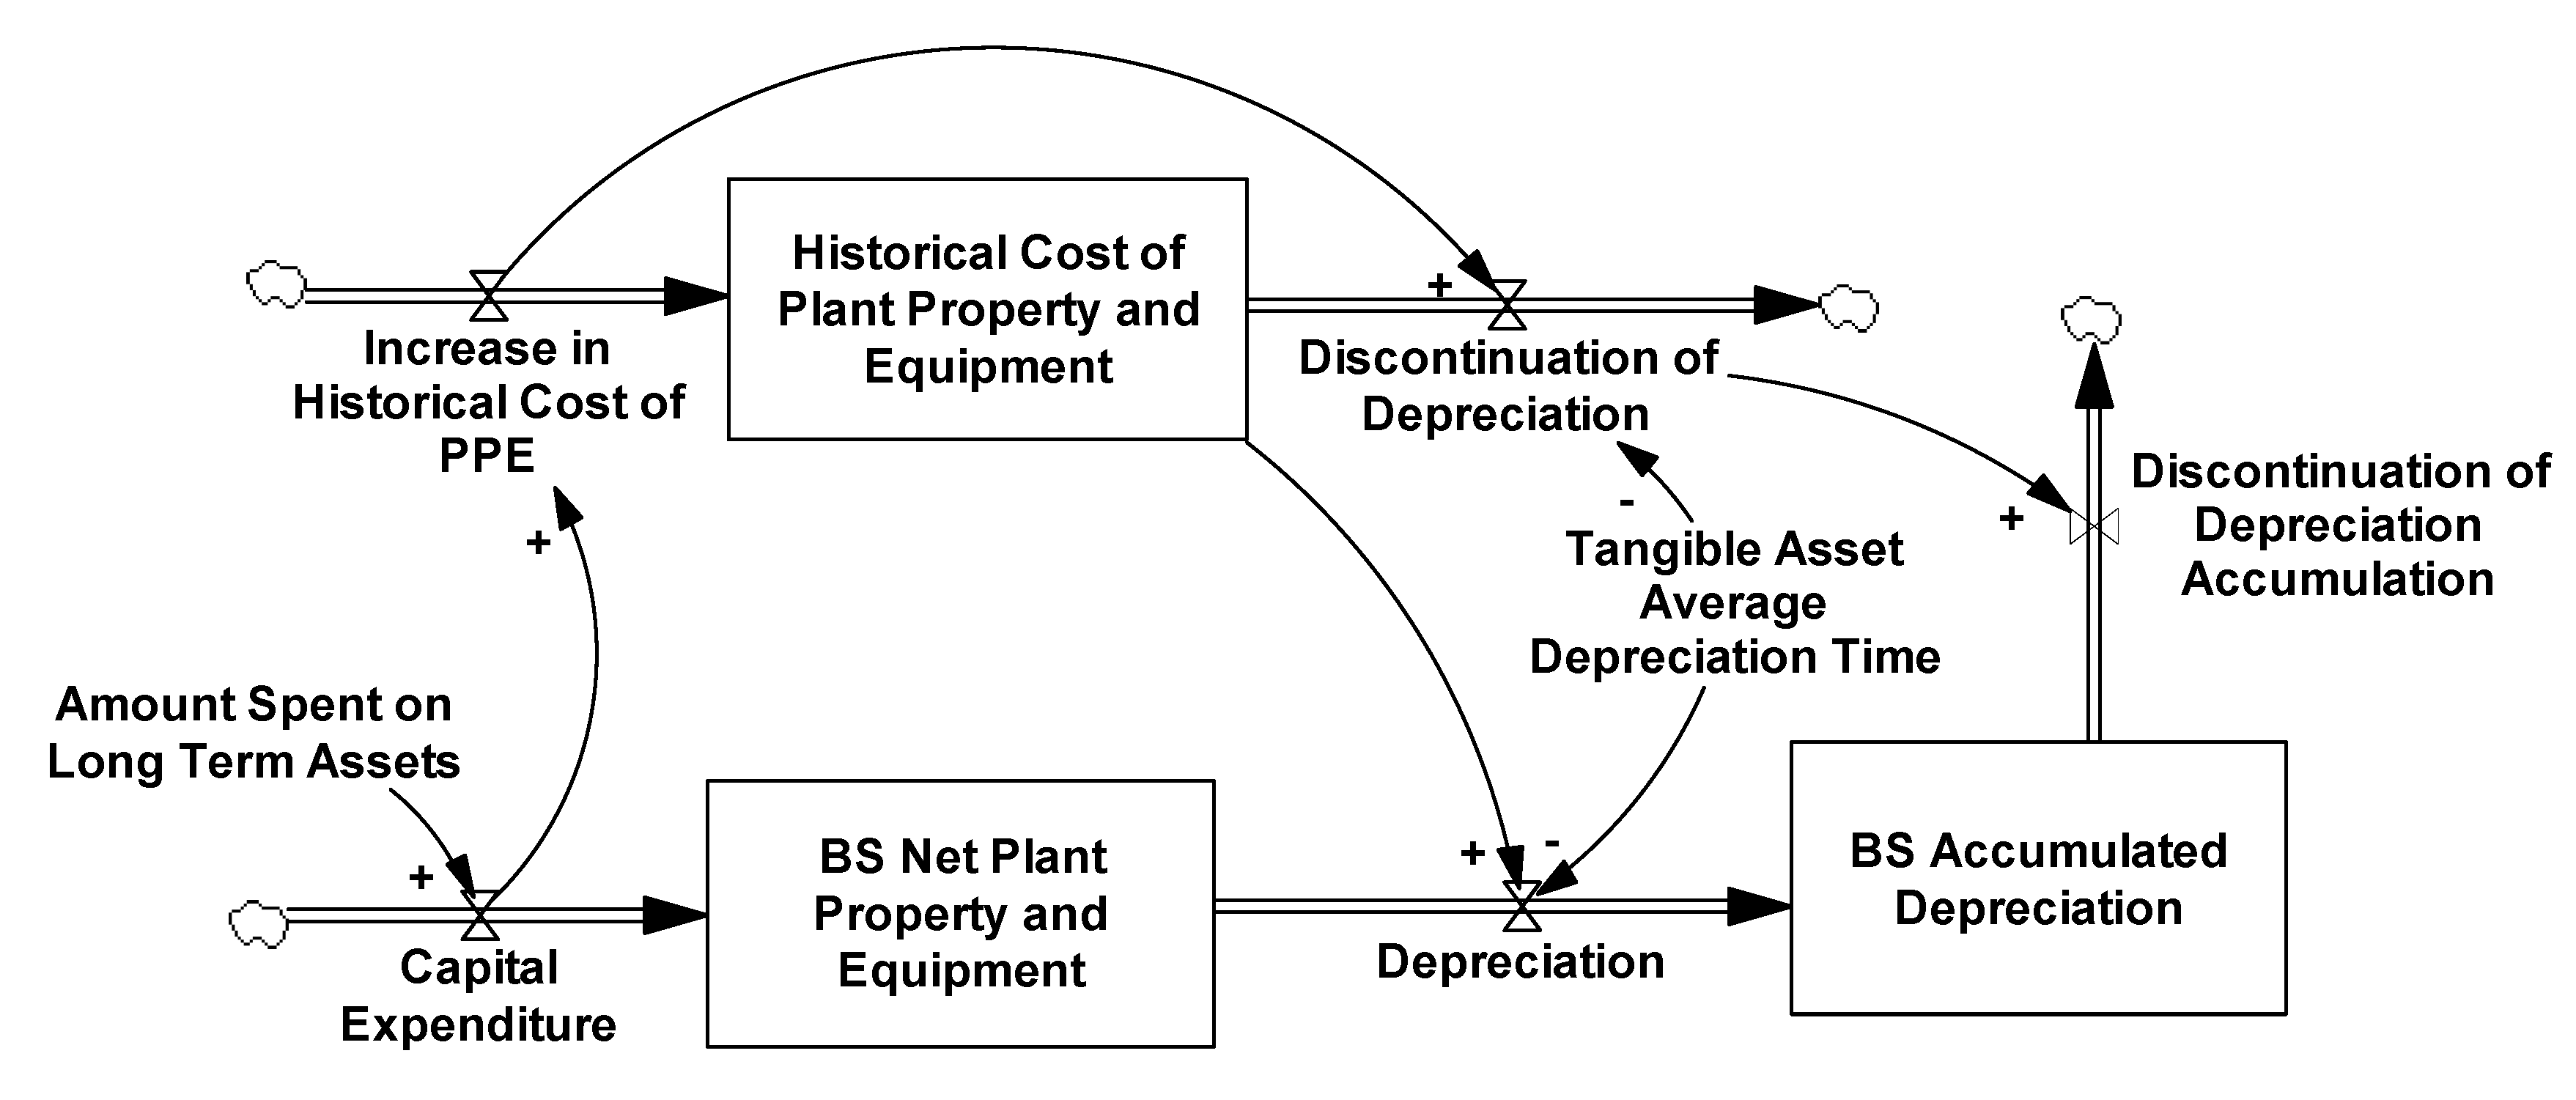
Both categories of long-term assets are reported on the balance sheet at their value net of a stock of accumulated value loss, called depreciation for PPE and amortization for intangibles. Rather than losing value in an exponential smooth, the way most system dynamics models would formulate the relationship [25], PPE and intangibles lose value according to the “straight-line” method which requires that the same value be removed each time period. This structure is shown in Figure 1.
The model accomplishes this by separating a stock of historical value from the stocks that track net value. Historical values move out of the model following a fixed delay with the specified delay time, and a constant fraction of the historical value migrates from the net value stock to the value loss stock each time step. Since the historical cost only decreases when the item is fully depreciated or amortized, the rate of value loss is constant over the item’s useful life.
It is important to note that while all tangible assets with long useful lives are added to the stock of PPE, only intangible assets that are purchased from outside of the company are recorded in the stock of intangible assets. Any intangible assets produced internally by the company should be expensed as research and development.
3.3. Liabilities
The liabilities section of the model includes accruals for accounts payable and accrued wages, as well as a structure for tracking the long-term and short-term debt of the company.
The accrual for accounts payable is very similar to the accrual for accounts receivable. Accounts payable integrates the difference between the value of the materials purchased on credit by the company (a constant fraction of the total materials purchases) and the cash paid by the company to its suppliers. The payment of accounts payable is a first-order material delay of the level of accounts payable, that uses a constant delay time determined by the credit terms offered by the company’s suppliers.
Wages accrue on the company’s balance sheet as the difference between the value of the wages earned by workers and the cash that the company pays to workers at some later date. The model allows for the separate flows of the value of labor used to create inventory and the value of labor used for selling, general, and administrative tasks to be combined in this one stock of accrued wages. The payment of wages is modeled as a first-order material delay.
The structure for debt on the company’s balance sheet connects long-term debt with short-term debt using a shared stock and flow chain. New borrowing by the company flows into the stock of long-term debt, which drains through a first-order material delay of its level. The delay time is the average loan term minus the definition of a “current” liability which is the greater of one year, or the company’s operating cycle. The stock of short-term debt is then drained with a delay time equal to the definition of current that was used. Both debt stocks accrue interest at a constant fractional interest rate, which is an input to the model. An operational financing model should consider replacing this structure.
3.4. Equity
The equity section of the model includes two balance sheet stocks, the stock of additional paid in capital that tracks the value of the cash received from sales of the company’s stock, and the stock of retained earnings that accumulates the difference between the net income of the company and the dividends paid to the owners of the company. We ignore par value for this model since it is rarely an economically significant amount. We also track the number of shares of stock outstanding for the company, but this number is not needed for any reason other than the calculation of dividends per share and earnings per share.
The stock of retained earnings uses the instantaneous rate of each flow of revenue and expense as its inflow rather than the reported revenues or expenses that the model also calculates. This ensures that the balance sheet equation holds for each time step of the model rather than only when values are reported.
3.5. Income and Expenses
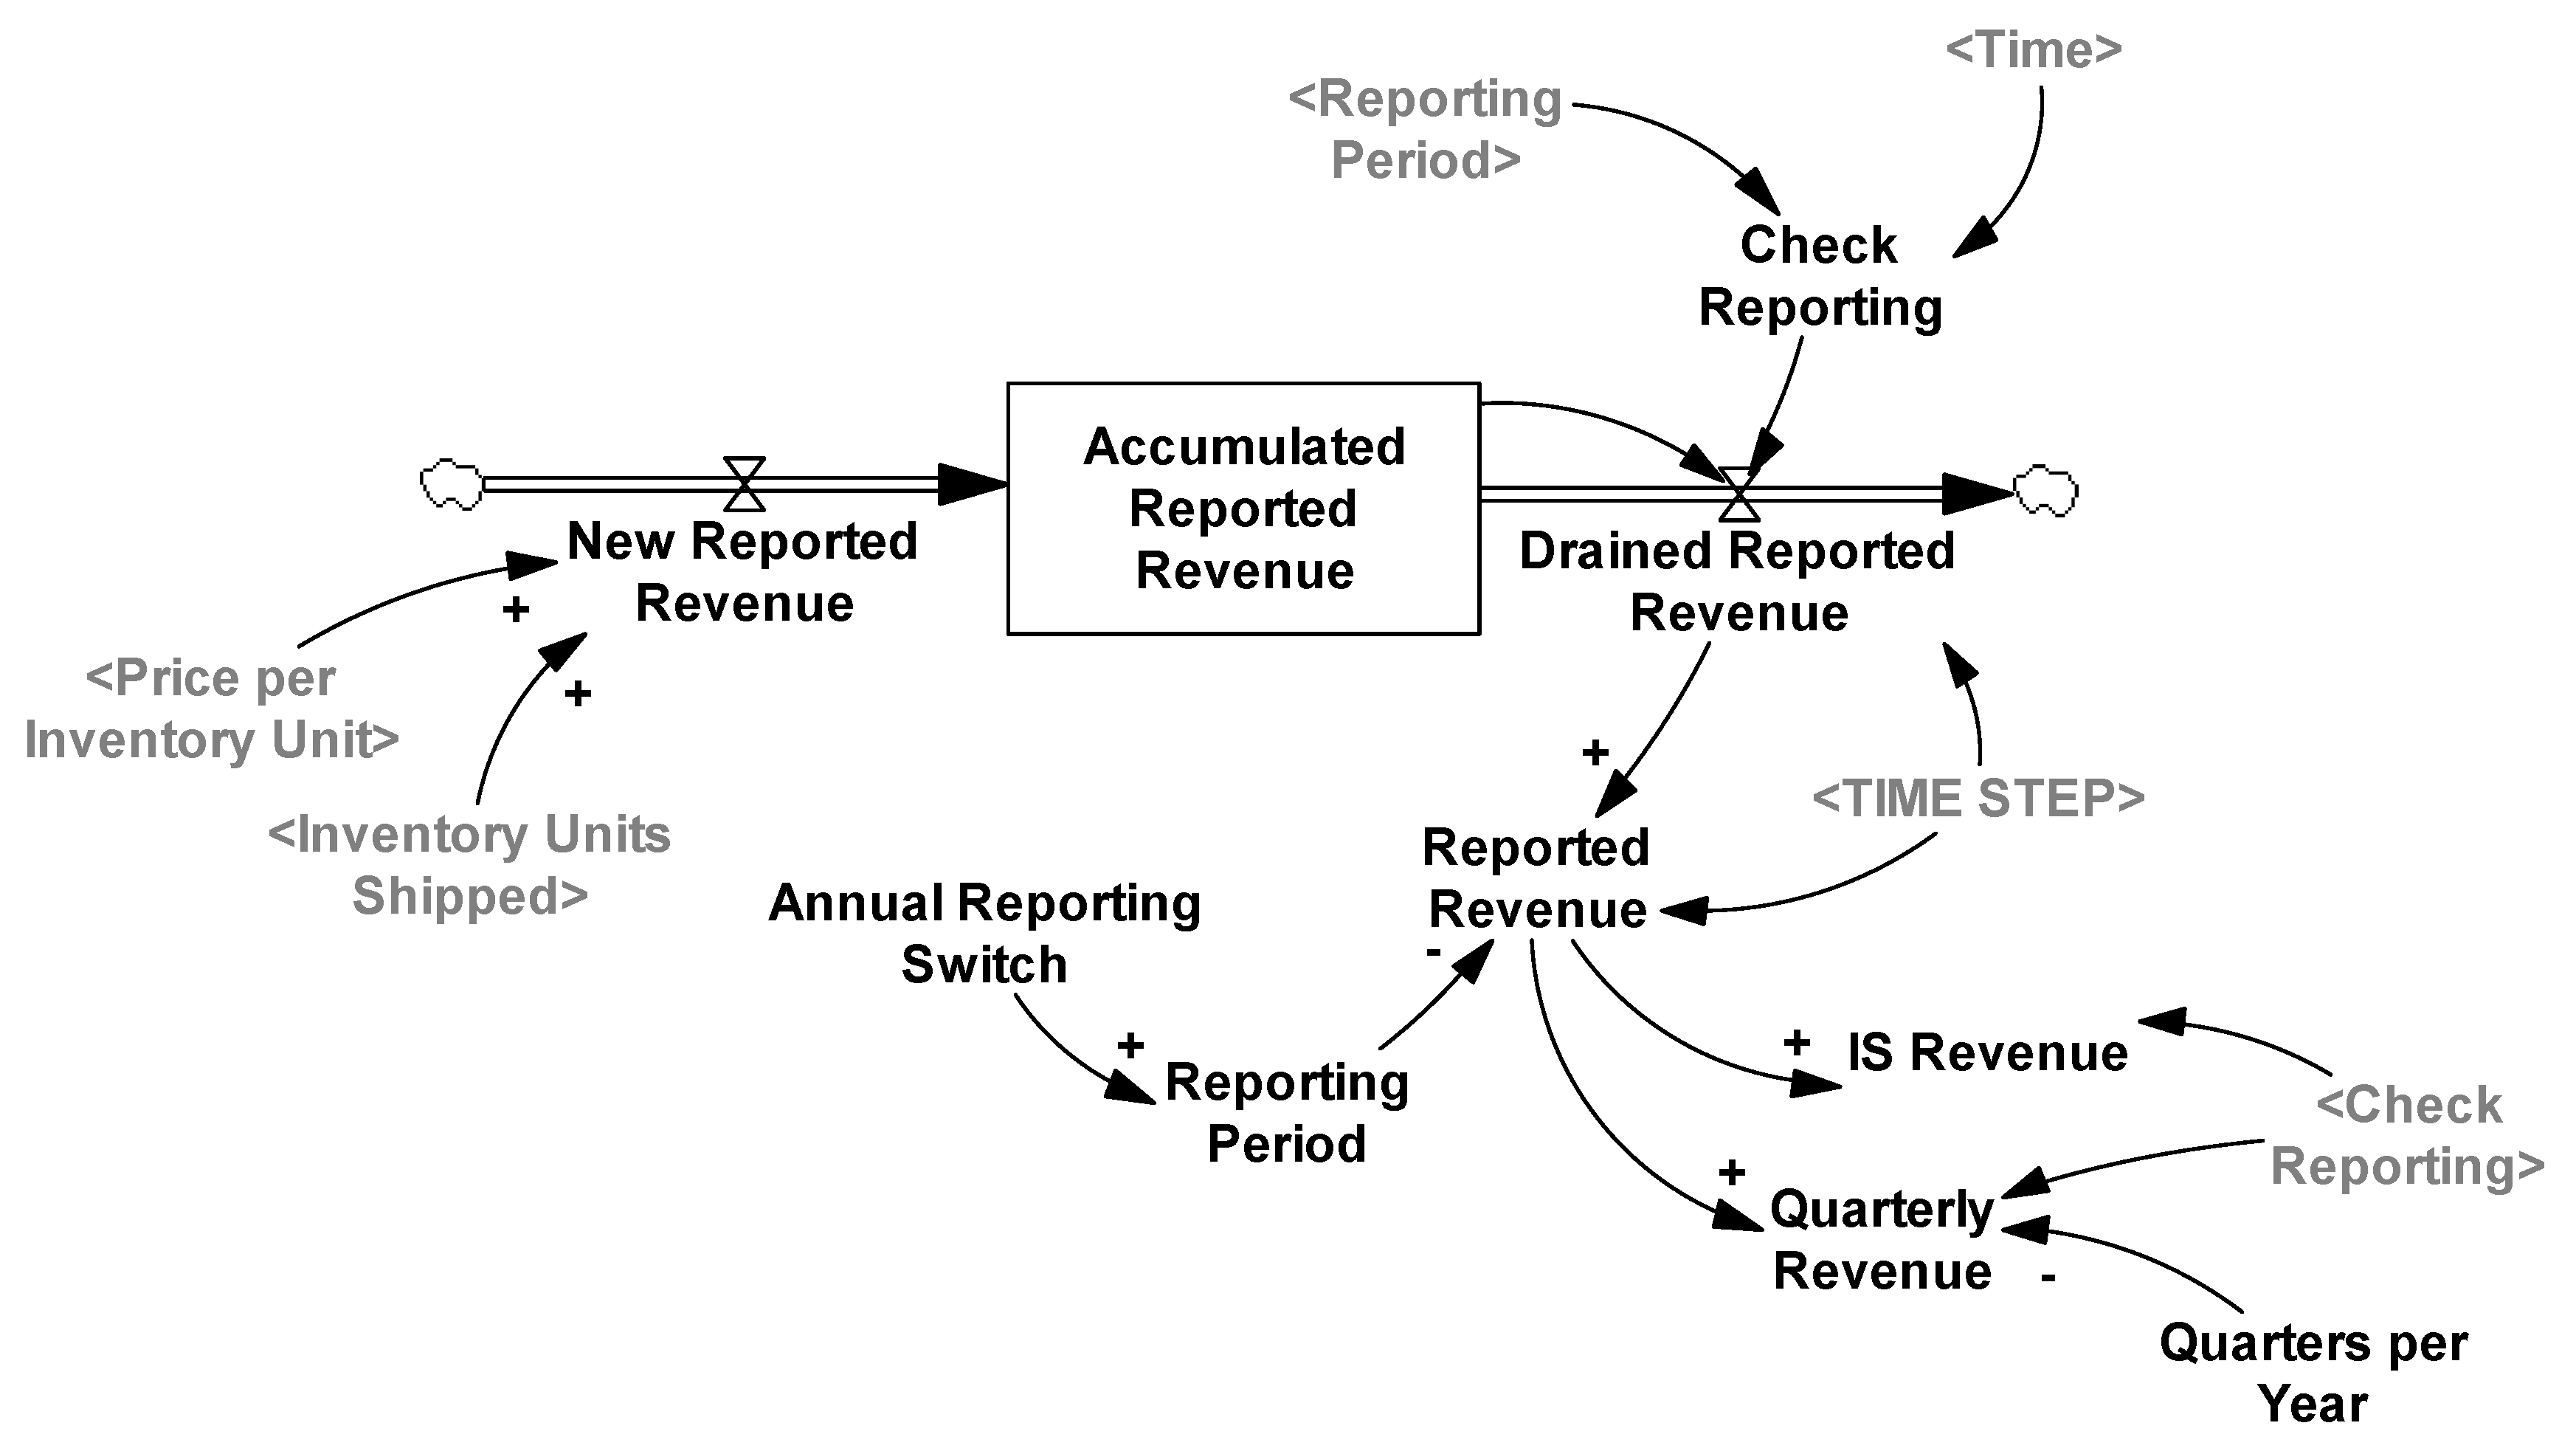
Each of the instantaneous flows of revenue and expenses created by a typical system dynamics model is subtly different from the reported revenue and expenses created as an output of the accounting process. In order to adjust for these differences and report the correct values on the income statement, we make extensive use of the formulation from Pierson and Sterman [15]. The structure accumulates the instantaneous flows over some reporting period, then when signaled to report values, it drains the accumulated stocks in a single time step, outputting the total of the instantaneous flows over the period.
We extend this structure in two important ways. First, we employ the “sample if true” function in Vensim to change the pulse output of the reporting structure into a constant output. The pulses are useful for matching a model with data, but when people make decisions based on accounting numbers, they look back at the most recently reported numbers as a basis for those decisions. This formulation stores the most recently reported numbers to replicate that information availability. Second, we include a switch that allows the reporting period of the model to change from annual reporting to quarterly reporting and adjust the reported quarterly numbers to be in units of dollars per quarter, rather than the annualized dollars per year that the original structure required. This structure is shown in Figure 2.
It is important to note that this structure replicates a source of delay that arises in the actual accounting reporting process. Accounting numbers cannot be reported until after they are realized. Thus, the profit reported at the beginning of year 3, say, is the average profit realized during year 2. This is an important consideration for modelers looking to match this module’s output with reported accounting numbers. The structure will report 2018 revenue on the first day of 2019, the same way that a company has to wait until after its fiscal year to report the results for that year.
We calculate taxes as a constant fraction of the reported earnings before taxes of the company and drain the stock of cash and the stock of retained earnings instantly in response to these reported taxes. This is an oversimplification in both the complexity and the timing of taxes, but a full treatment of the intricacies of corporate taxation is far beyond the scope of this paper. If the timing of the payment of taxes is more important in a given case, it is relatively simple to add a taxes payable accrual to the liabilities section and record its impact on the cash flow statement.
3.6. Direct Cash Flows
In order to correctly control the level of the stock of cash in the company, we must calculate the instantaneous, direct cash flows the company experiences. We follow the same categorization of cash flows into operating, investing, and financing that is used later on the indirect cash flow statement so as to not duplicate model structures.
3.7. Financial Statements
We construct each of the four most commonly used financial statements in the model, the balance sheet, the income statement, the indirect cash flow statement, and the statement of changes in owners’ equity.
3.7.1. Balance Sheet
The balance sheet reports the level of each asset, liability, and equity stock in the firm. Each of these accounts are collected together on one view of the model and annotated with the prefix “BS” for balance sheet. These accounts do not interact with the reporting process in any interesting ways because they are simply reported at their level on a specific day. The model calculates both the instantaneous balance sheet amounts and the most recently reported balance sheet values.
3.7.2. Income Statement
The income statement reports the cumulative flow of net income earned by the company over the reporting period by starting with the revenue flow and subtracting off the flow of each expense. Since we have already calculated these accumulations, the income statement view in the model simply collects each of the items typically reported on the income statement for easy viewing, labels them with the prefix “IS”, and calculates a few intermediate profit numbers.
3.7.3. Indirect Cash Flow Statement
Accountants report financing and investing cash flows as accumulated average flows over a period, analogous to the way that income is reported, but they report operating cash flows indirectly by showing a reconciliation of net income with net cash flow from operations. This reconciliation first removes all non-cash expenses from net income and then shows the impact of accumulations or consumptions of value through the various accrual stocks on the balance sheet. The accounting model needs to track two years of some reported balance sheet items in order to accomplish this task, and so the indirect cash flow statement view does so. Due to this, indirect cash flows are reported one time step after the balance sheet and income statement are reported.
3.7.4. Statement of Changes in Owners’ Equity
The presentation of the statement of changes in owners’ equity borrows some of the structure from the cash flow statement and income statement. The owners’ equity statement remembers two periods worth of the level of the equity stocks so that it can present a beginning and ending balance of each. It also accumulates reported flows for dividends and share issuance so that these flows can illustrate why each equity balance changed over the reporting period.
4. Accounting Model Boundary and Inputs Needed
The accounting model is designed to interface with an existing system dynamics model of a business. There are three general areas over which the models will connect: Business Dynamics, Accounting Constants, and Financial Decisions. Many of these inputs are not required, in that they can be freely set to zero if a model does not include them in its boundary.
4.1. Business Dynamics
The business dynamics area includes variables that track the strategic decisions and physical stocks of the company. The variables in the business dynamics area are described in Table 1.
4.2. Accounting Constants
These accounting constants are either delays that inform how long the accounting model accumulates certain variables, fractions that define where flows are accounted for, or switches that determine the method of accounting that is done. The variables in the accounting constants area are described in Table 2.
4.3. Financial Decisions
The accounting model does not specify how the decisions to finance the company’s behavior are made. The decision over how much money to raise, and whether to raise those funds through debt or equity, must be made using some decision rules that are exogenous to the model. The variables in the financial decisions area are described in Table 3.
All model structures are documented in an Appendix created with the help of the SDM-Doc tool [29]. The model is available in the Supplementary Materials or by email request.
5. Discussion
5.1. Tests of Model Behavior
Testing the validity of a system dynamics model requires assessing both its structural validity and its behavioral validity [30]. While the discussion above makes an argument for the structural validity of our model because it shows how the model structures represent the accounting reporting process, we have not yet established whether these structures behave in a valid way. If we simulate the accounting model using notional inputs, we can observe that the structures of the model create correct outputs, providing an argument for the model’s behavioral validity.
Figure 3 shows the response of the model to a pulse that simulates the purchase of a $5000 piece of equipment at the start of year 2. If users want the stock of long-term assets to increase in this way, they should use a pulse multiplied by the total cost and divided by the size of the time step. The historical cost of the equipment remains at $5000 over the entire 15-year useful life, but the net value decreases as a straight line over that period. Once the useful life has ended and the equipment is fully depreciated, the historical cost (and the accumulated depreciation which is not shown here) is removed from the model.
The balance sheet identity, or the equality of assets with the sum of liabilities plus equity, is one of the most important tests of the face validity of financial statements. As Figure 4 shows, our model produces output that comports with this identity at every time step.
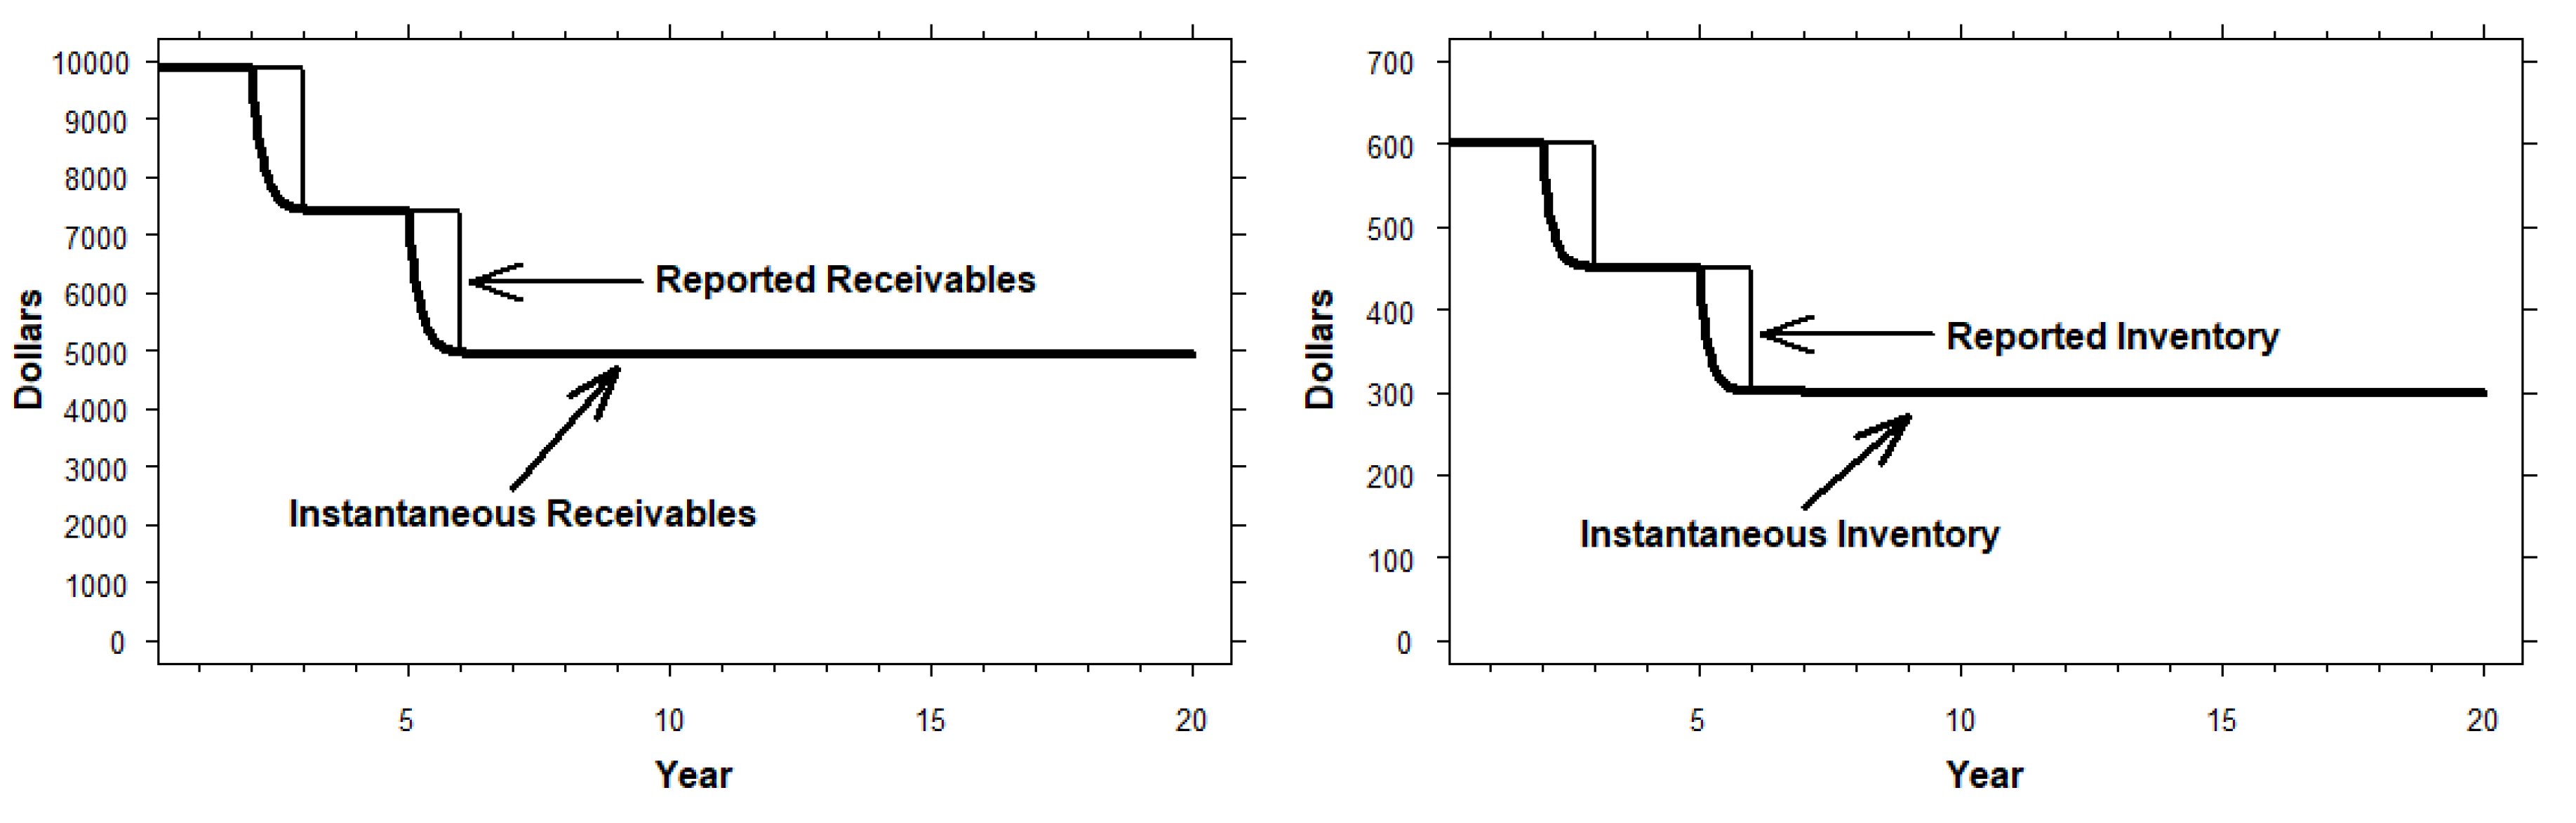
A foundational model of accruals in accounting holds that, to a first approximation, the total accruals of a business should be linearly related to the value of revenue [31]. While this is an accounting theory rather than a result of an accounting rule, any reasonable model of the accounting reporting process should show equilibrium behavior generally agreeing with this relationship.
Figure 5 shows one test of this relationship where revenue in the model decreases by 25% at the beginning of year 2 and by an additional 25% at the beginning of year 5. While the accruals for accounts receivable and inventory take some time to adjust, in equilibrium, the level of both is clearly proportional to the size of the flow of revenue.
5.2. Context within the Literature
Given the large number of system dynamics models in strategic management [32,33], improving the way that accounting reporting is represented in these models has the potential to be highly impactful. This large body of work commonly represents accounting in a relatively simplistic way [16,17,18]. As the model we provide is both freely available and easy to deploy within an existing system dynamics model, we hope that future work on the system dynamics of strategic management will choose to incorporate these structures.
Sometimes, inexact representations of accounting may be entirely appropriate for a model’s purpose [34,35], but even when accounting is an important focus of a system dynamics modeling project [19,36,37,38], authors often approach accounting by re-inventing the wheel rather than incorporating previously published models such as Repenning and Sterman [25]. In almost all cases where authors create their own accounting structures, they treat the instantaneous values of revenue, expenses, and cash flow as if they were identical to the reported values of those concepts [26]. Very few modelers have thought carefully about this important distinction, and because accounting is a poorly understood, detail-oriented subfield of management, unless a simple, standard structure is widely adopted, generating simple accounting relationships without considering whether they are operationally correct will continue to seem expedient to many system dynamics modelers.
The lack of adoption of this approach beyond Sterman and his students [13,14,15], may be because these papers address accounting reporting as an afterthought rather than a focus of their work. At a minimum then, our paper can be viewed as the first example of a paper that focuses on describing and updating Sterman’s approach to representing accounting in a system dynamics model, offering a straightforward, visible, and freely available set of structures that other modelers can adopt, if it is appropriate for their purpose.
One of our central claims in arguing for the importance of these structures is that representing only the instantaneous flows of value on the income statement will cause a bias in simulated results. Table 4 reports the results of simulation tests that illustrate the size of this bias for several different growth paths. These simulations show that models which only calculate instantaneous flows will make growing firms look larger and more profitable than they should. In general, this distortion is larger for net income than for revenue on a percentage basis, increases as the rate of growth increases, and is more pronounced for exponential growth than for linear growth paths.
The magnitude of the bias in revenue and net income is quite large in these tests. The size of the distortion supports our argument that explicitly representing the way that accounting reports aggregate flows of value is important, not just because this is an operational reflection of the accounting process but also because it makes a real difference in the numbers. Reliance on instantaneous values of revenues, expenses, and income is a serious limitation of work by Bianchi [19] and Yamaguchi [26] that otherwise does a good job of representing accounting identities.
There are several important extensions of our work that readers may consider pursuing. Extending the model so that it can be driven exclusively with publicly available accounting data would be an interesting way to study how the reported financial statements of public companies differ from the assumptions that underlie this model. Findings from such an effort could be used to improve the structures of the model, or to identify times when public companies are potentially managing earnings. Trying to replicate the financial statements of a public company could provide similar insights. These two extensions are better left to future work though, because they will involve making assumptions about the way that revenues and expenses in a company evolve, which runs counter to our current effort to provide a generic model of accounting that can be widely used.
6. Conclusions
We document a model that replicates the accounting reporting process within a system dynamics framework, allowing future modelers to incorporate these structures into projects that would benefit from more robust accounting structures. While the details of the accounting reporting process may not be important to include in all cases, these formulations will be important when modelers want to establish face validity with an audience familiar with accounting reports, in cases where modelers are attempting to match simulated output with real accounting data, or when models include decision rules that depend on reported accounting numbers. We hope that providing this model will increase the number of system dynamics projects that represent accounting reporting operationally.
Supplementary Materials
A Vensim version of the Accounting Model and its Documentation are available online at https://0-www-mdpi-com.brum.beds.ac.uk/2079-8954/8/1/9/s1, or by email request to the author.
Funding
This research received no external funding.
Conflicts of Interest
The author declares no conflict of interest.
References
- Forrester, J.W. Industrial dynamics. J. Oper. Res. Soc. 1997, 48, 1037–1041. [Google Scholar] [CrossRef]
- Forrester, J.W. Market Growth as Influenced by Capital Investment; Industrial Management Review: Cambridge, MA, USA, 1968. [Google Scholar]
- Lyneis, J.M. System dynamics for business strategy: A phased approach. Syst. Dyn. Rev. 1999, 15, 37–70. [Google Scholar] [CrossRef]
- Sterman, J.D. Business Dynamics: Systems Thinking and Modeling for a Complex World; Irwin/McGraw-Hill: Boston, MA, USA, 2000. [Google Scholar]
- Sterman, J. Interactive web-based simulations for strategy and sustainability: The MIT Sloan LearningEdge management flight simulators, Part I. Syst. Dyn. Rev. 2014, 30, 89–121. [Google Scholar] [CrossRef]
- Warren, K. Strategy Dynamics Essentials; Strategy Dynamics Limited: London, UK, 2015. [Google Scholar]
- Warren, K. Standard cases: Standard structures: Standard models. In Proceedings of the 32nd International Conference of the System Dynamics Society, Delft, The Netherlands, 20–24 July 2014. [Google Scholar]
- Sterman, J. The Energy Transition and the Economy: A System Dynamics Approach. Ph.D. Thesis, Massachusetts Institute of Technology, Cambridge, MA, USA, 1982. [Google Scholar]
- Sterman, J. Economic vulnerability and the energy transition. In Proceedings of the 1981 System Dynamics Research Conference, Institute of Management and Science, Rensselaerville, NY, USA, 14–17 October 1981. [Google Scholar]
- Sterman, J.D. The economic long wave: Theory and evidence. Syst. Dyn. Rev. 1986, 2, 87–125. [Google Scholar] [CrossRef] [Green Version]
- Sterman, J.D.; Morrison, B. People Express Management Flight Simulator; Sloan School of Management: Cambridge, MA, USA, 1988. [Google Scholar]
- Sterman, J.D.; Repenning, N.P.; Kofman, F. Unanticipated side effects of successful quality programs: Exploring a paradox of organizational improvement. Manag. Sci. 1997, 43, 503–521. [Google Scholar] [CrossRef] [Green Version]
- Oliva, R.; Sterman, J.D.; Giese, M. Limits to growth in the new economy: Exploring the ‘get big fast’ strategy in e-commerce. Syst. Dyn. Rev. 2003, 19, 83–117. [Google Scholar] [CrossRef]
- Hsueh, J.C. Dynamics of Shared Capitalism Policies in a Startup Company by Joe C. Hsueh. Ph.D. Thesis, Massachusetts Institute of Technology, Cambridge, MA, USA, 2011. [Google Scholar]
- Pierson, K.; Sterman, J.D. Cyclical dynamics of airline industry earnings. Syst. Dyn. Rev. 2013, 29, 129–156. [Google Scholar] [CrossRef] [Green Version]
- Warren, K. Improving strategic management with the fundamental principles of system dynamics. Syst. Dyn. Rev. 2005, 21, 329–350. [Google Scholar] [CrossRef]
- Strohhecker, J.; Größler, A. Implementing sustainable business strategies. Syst. Res. Behav. Sci. 2012, 29, 547–570. [Google Scholar] [CrossRef]
- Cosenz, F. Supporting start-up business model design through system dynamics modelling. Manag. Decis. 2017, 55, 57–80. [Google Scholar] [CrossRef]
- Bianchi, C. Introducing SD modelling into planning and control systems to manage SMEs’ growth: A learning-oriented perspective. Syst. Dyn. Rev. 2002, 18, 315–338. [Google Scholar] [CrossRef]
- Yamaguchi, K. Principle of accounting system dynamics–modeling corporate financial statements. In Proceedings of the 21st International Conference of the System Dynamics Society, New York, NY, USA, 20–24 July 2003. [Google Scholar]
- Sterman, J. System dynamics at sixty: The path forward. Syst. Dyn. Rev. 2018, 34, 5–47. [Google Scholar] [CrossRef]
- Morecroft, J.D. System dynamics and microworlds for policymakers. Eur. J. Oper. Res. 1988, 35, 301–320. [Google Scholar] [CrossRef]
- Gold, S. System-dynamics-based modeling of business simulation algorithms. Simul. Gaming 2005, 36, 203–218. [Google Scholar] [CrossRef]
- Gary, M.S.; Wood, R.E. Unpacking mental models through laboratory experiments. Syst. Dyn. Rev. 2016, 32, 99–127. [Google Scholar] [CrossRef]
- Repenning, N.P.; Sterman, J.D. Unanticipated Side Effects of Successful Quality Programs: Technical Documentation; Massachusetts Institute of Technology: Cambridge, MA, USA, 1994. [Google Scholar]
- Yamaguchi, K.; Home, M. Money and Macroeconomic Dynamics Accounting System Dynamics Approach, 2nd ed.; Japan Future Research Center: Awaji Island, Japan, 2013. [Google Scholar]
- Ball, R.; Brown, P. An empirical evaluation of accounting income numbers. J. Account. Res. 1968, 6, 159–178. [Google Scholar] [CrossRef] [Green Version]
- Ohlson, J.A.; Zhang, X.J. Accrual accounting and equity valuation. J. Account. Res. 1998, 36, 85–111. [Google Scholar] [CrossRef]
- Martinez-Moyano, I.J. Documentation for model transparency. Syst. Dyn. Rev. 2012, 28, 199–208. [Google Scholar] [CrossRef]
- Barlas, Y. Formal aspects of model validity and validation in system dynamics. Syst. Dyn. Rev. 1996, 12, 183–210. [Google Scholar] [CrossRef]
- Jones, J.J. Earnings management during import relief investigations. J. Account. Res. 1991, 29, 193–228. [Google Scholar] [CrossRef]
- Torres, J.P.; Kunc, M.; O’brien, F. Supporting strategy using system dynamics. Eur. J. Oper. Res. 2017, 260, 1081–1094. [Google Scholar] [CrossRef]
- Cosenz, F.; Noto, G. Applying system dynamics modelling to strategic management: A literature review. Syst. Res. Behav. Sci. 2016, 33, 703–741. [Google Scholar] [CrossRef]
- Agrawalla, R.K. A Systems Model to Make, Market, and Lead Your Way towards Sustained Growth. Systems 2017, 5, 41. [Google Scholar] [CrossRef] [Green Version]
- Langarudi, S.P.; Bar-On, I. Utility perception in system dynamics models. Systems 2018, 6, 37. [Google Scholar] [CrossRef]
- Nguyen, T.; Cook, S.; Ireland, V. Application of system dynamics to evaluate the social and economic benefits of infrastructure projects. Systems 2017, 5, 29. [Google Scholar] [CrossRef] [Green Version]
- Sana, S.S.; Ferro-Correa, J.; Quintero, A.; Amaya, R. A system dynamics model of financial flow in supply chains: A case study. RAIRO Oper. Res. 2018, 52, 187–204. [Google Scholar] [CrossRef] [Green Version]
- Mohammadifardi, H.; Knight, M.A.; Unger, A.A. Sustainability Assessment of Asset Management Decisions for Wastewater Infrastructure Systems—Implementation of a System Dynamics Model. Systems 2019, 7, 34. [Google Scholar] [CrossRef] [Green Version]
| 1 | Last-in first-out, or LIFO is the second most common method and suffers from all the same difficulties. Very few companies use the average cost method, but it is the only tractable method for most system dynamics models. |
| 2 | Users wishing to better approximate FIFO might consider creating a higher order structure, but be careful to remember that inventory does not move through those stocks with a constant delay time. Inventory is pulled through the stocks as inventory is sold to the customer. |
Figure 1.
Structure for Replicating Straight Line Depreciation or Amortization.

Figure 2.
The Modified Reporting Structure with Quarterly Output.

Figure 3.
Net Plant, Property, and Equipment and Historical Cost.
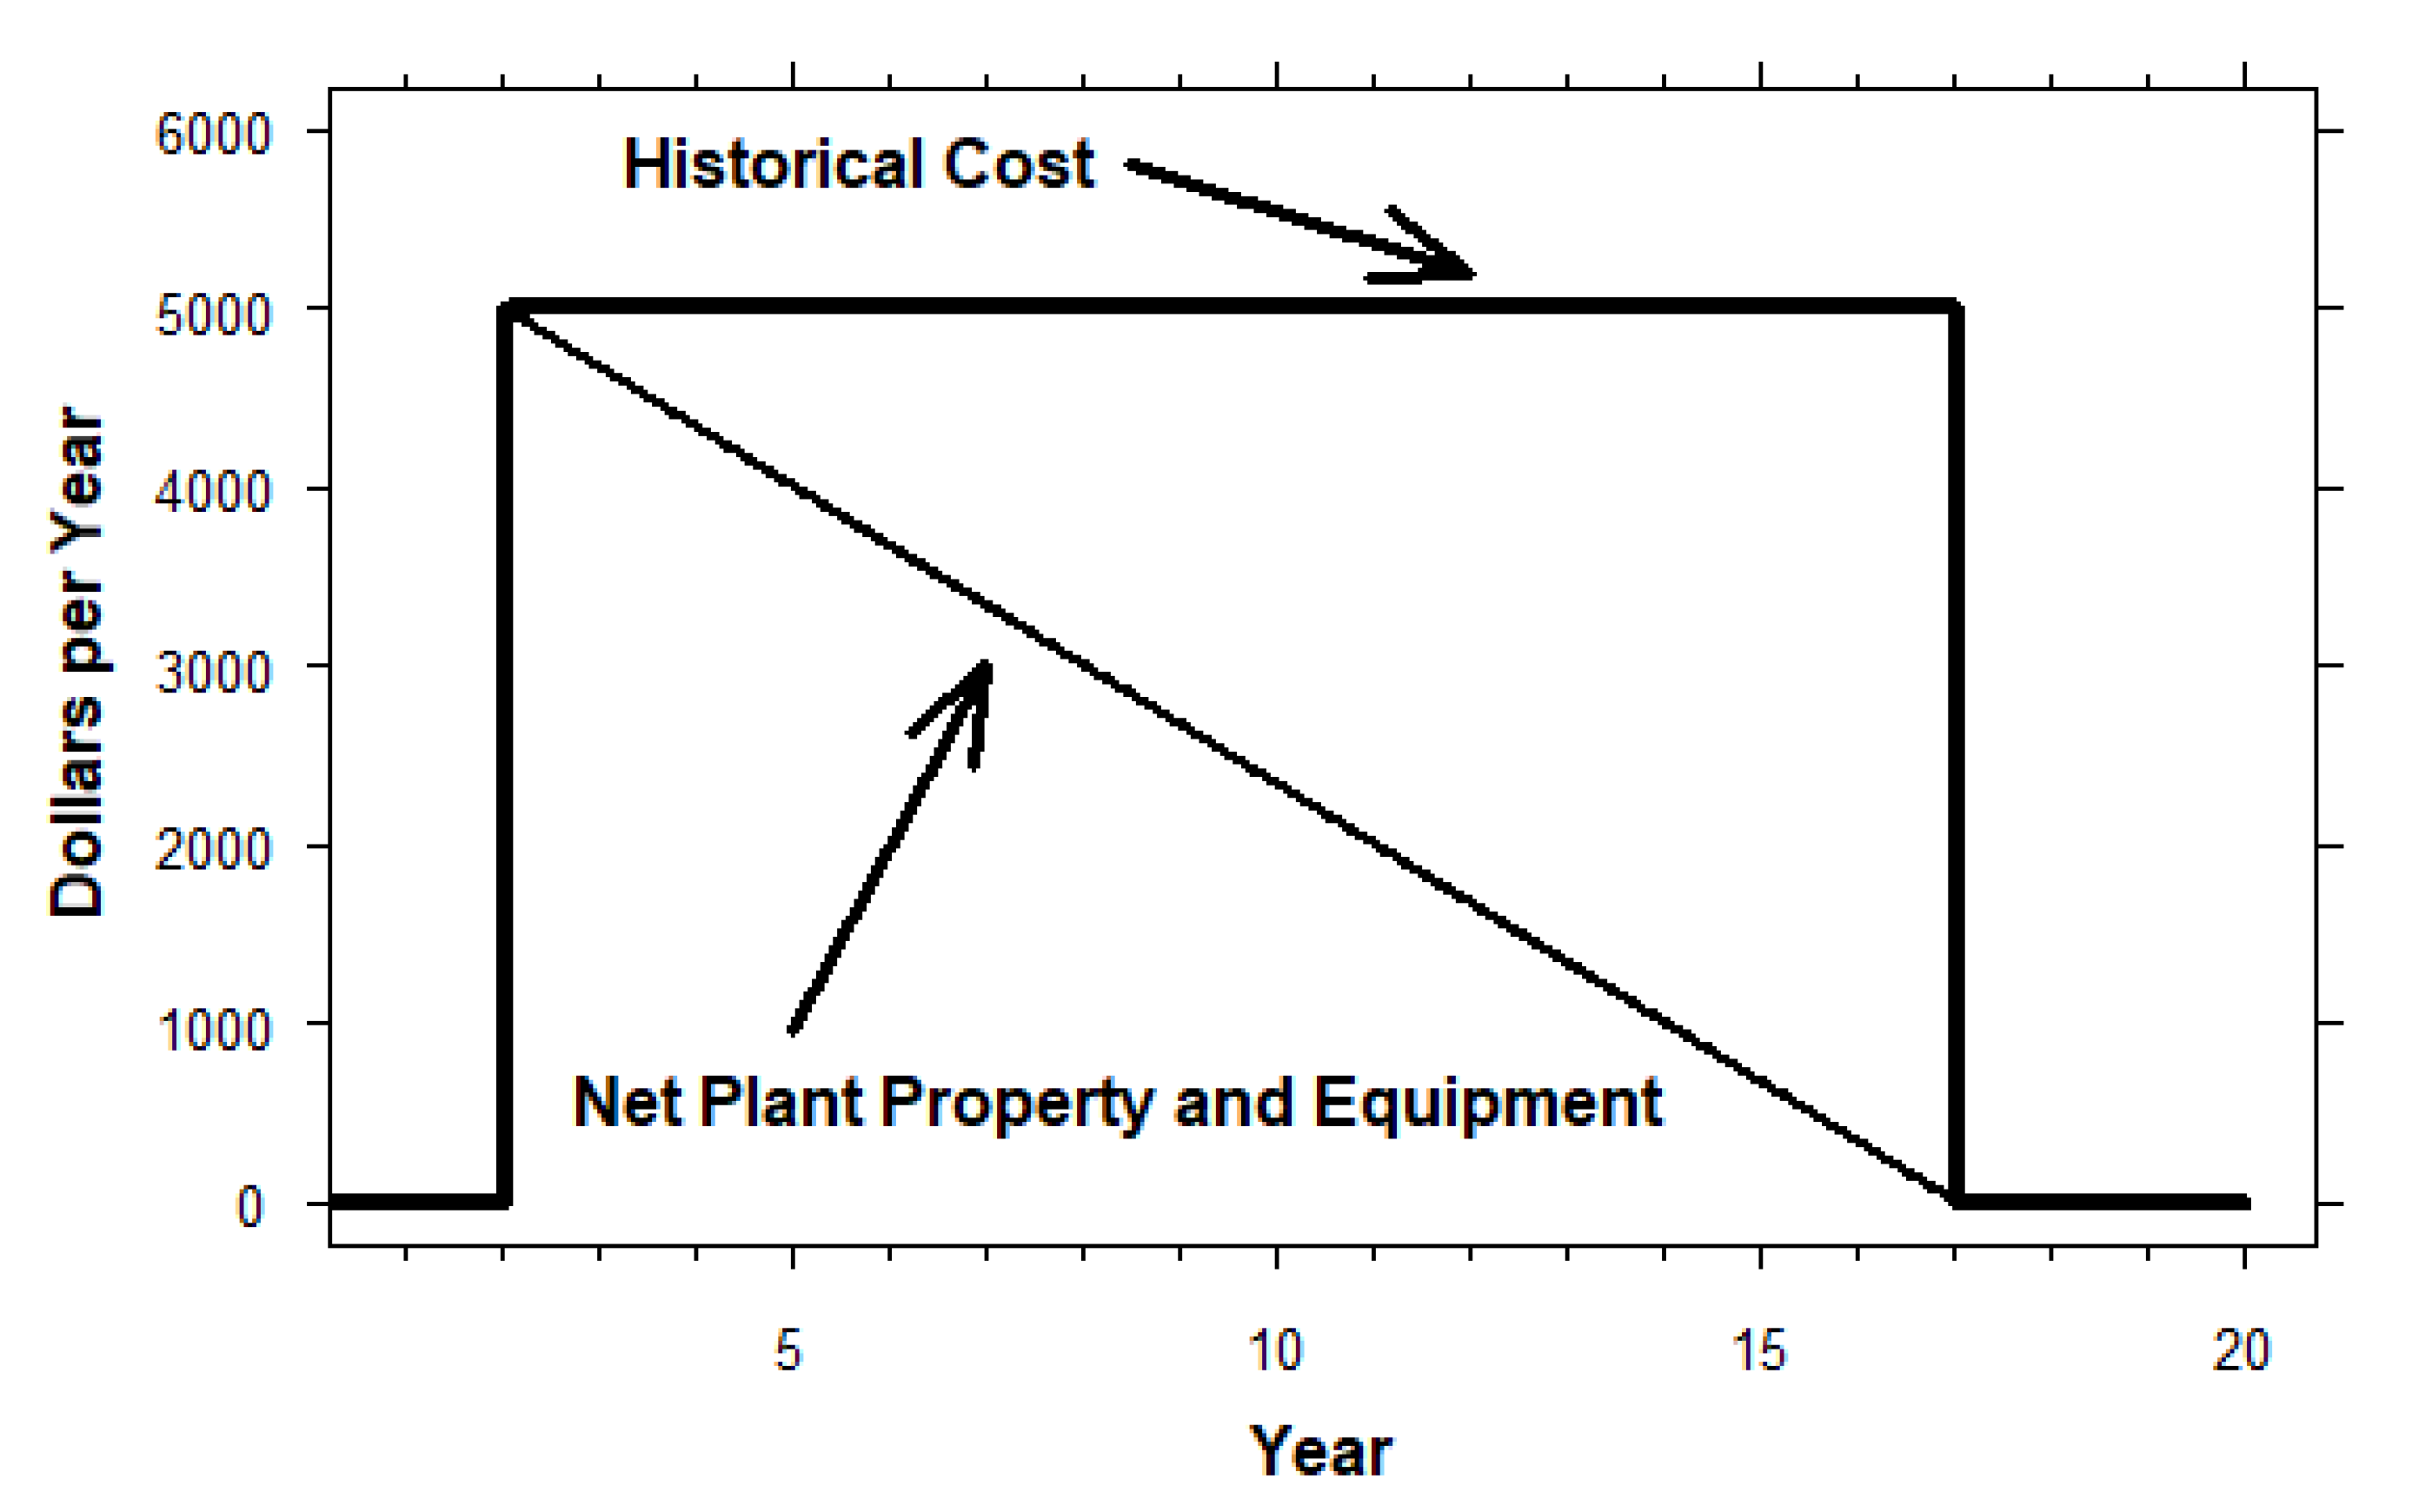
Figure 4.
Balance Sheet Assets, Liabilities, and Equity.
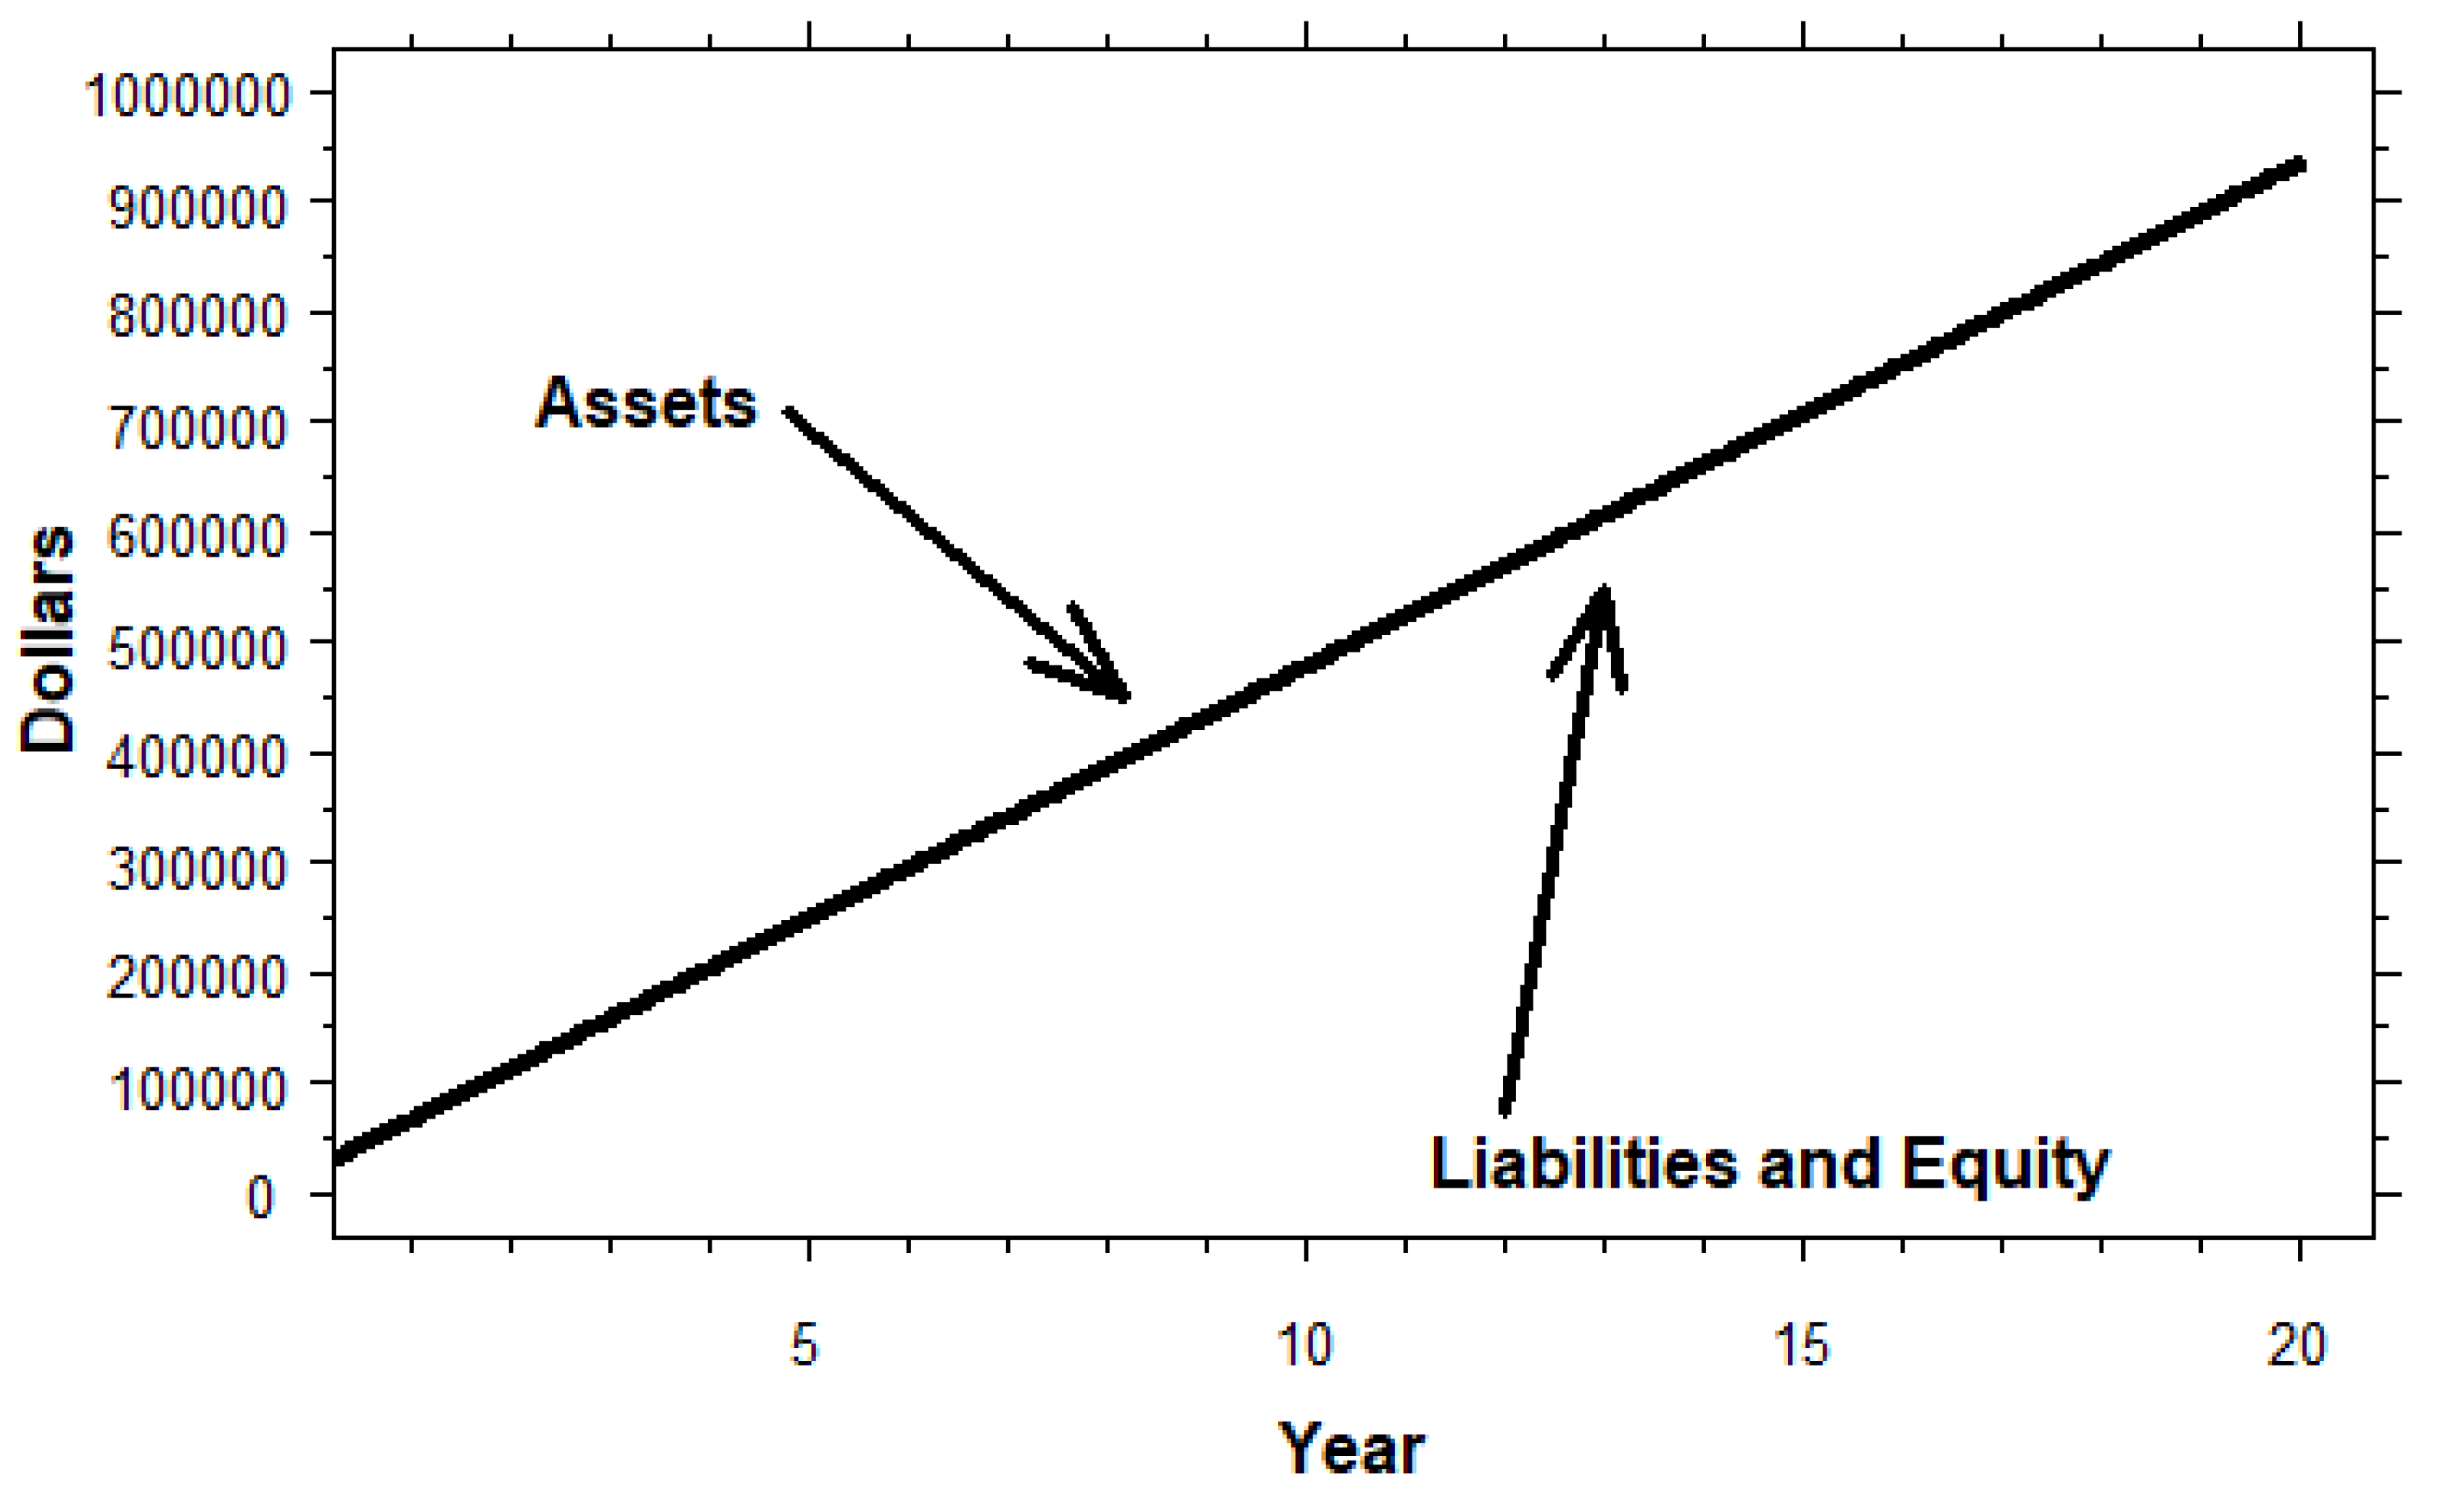
Figure 5.
Changes to Receivable and Inventory Accruals Following Changes to Revenue.

Table 1.
Description of the Business Dynamics Variables Needed to Run the Accounting Model.
| Variable | Description | Units | Required? |
|---|---|---|---|
| Price per Inventory Unit | The calculation of revenue requires information on the price of a unit of inventory. Service businesses can use the price charged per customer. | Dollars/Unit | Yes |
| Inventory Units Shipped | The calculation of revenue also requires the number of inventory units being shipped to the customer. Service businesses can use the rate of customers having their service completed. | Units/Year | Yes |
| Cost of Material Purchases | The cost of inventory is the sum of the cost of materials and the cost of labor. Material costs should be added when the materials arrive, not when they are paid for. | Dollars/Year | No |
| Cost of Labor Used to Create Inventory | The cost of inventory is the sum of the cost of materials and the cost of labor. Labor costs should be added when the workers complete their work, not when wages are paid. | Dollars/Year | No |
| Units in Inventory | We use a current count of the number of units in inventory to determine the correct cost of goods sold. | Units | Yes |
| Selling General and Administrative Salary Costs | Selling general and administrative expenses are a common expense reported on income statements, and so the accounting model includes this variable. | Dollars/Year | No |
| Research and Development | Research and development expenses are a common expense reported on income statements, and so the accounting model includes this variable. | Dollars/Year | No |
| Marketing Spend | Marketing expenses are a common expense reported on income statements, and so the accounting model includes this variable. | Dollars/Year | No |
| Amount Spent on Intangible Assets | If the company purchases intangible assets from other companies, those asset purchases can have long-term impacts on the balance sheet and income statement. | Dollars/Year | No |
| Amount Spent on Long-Term Assets | Any tangible assets that last longer than a year must be depreciated, impacting both the balance sheet and income statement of the company. | Dollars/Year | No |
Table 2.
Description of the Accounting Constants Needed to Run the Accounting Model.
| Variable | Description | Units | Required? |
|---|---|---|---|
| Days of Credit Terms Offered to Customers | The length of time, on average, that the company gives customers to pay for their goods or services. | Days | Yes |
| Supplier Credit Terms in Days | The length of time, on average, that the company’s suppliers give it to pay its bills. | Days | Yes |
| Fraction of Sales Collected in Cash | The percentage of all of the company’s sales that are conducted in cash rather than being billed. | Dimensionless | No |
| Fraction of Material Purchases Paid in Cash | The percentage of the company’s material purchases paid in cash rather than credit. | Dimensionless | No |
| Weeks Between Wage Payments | How many weeks it takes for the company to pay its workers. | Weeks | Yes |
| Intangible Asset Average Amortization Time | The length of time over which the company amortizes its intangibles assets. Intangibles are amortized using the straight-line method. | Years | Yes |
| Tangible Asset Average Depreciation Time | The length of time over which the company depreciates its tangible assets. Long-term assets are depreciated using the straight-line method. | Years | Yes |
| Tax Rate | The fraction of the company’s earnings before taxes that are paid to the government as corporate income taxes. | Dimensionless | No |
| Definition of Current | Current assets and liabilities are separated based on a time period that is the greater of one year or the operating cycle of the company. This is almost always one year in practice. | Years | Yes |
| Annual Reporting Switch | This switches the reporting period in the model from one year to one quarter. | Dimensionless | Yes |
Table 3.
Description of the Financial Decisions Needed to Run the Accounting Model.
| Variable | Description | Units | Required? |
|---|---|---|---|
| Target for Months of Operating Cash Outflows on Hand | The model initializes the stock of cash to be equal to the level targeted by the company. This is done so that the model will start in equilibrium, but is not used endogenously by the accounting model. | Months | No |
| New Debt Issued | A flow of debt issued by the company is needed to run the liabilities section of the model, but the decision of how to finance the company is left to the accounting model user. | Dollars/Year | No |
| Average Loan Term | The length of the loans taken out by the company will impact how long it takes for the debt to be paid back. | Years | Yes |
| Debt Interest Rate | Interest on the company’s debt accrues at a constant fractional rate per year. | Fraction/Year | No |
| Shares Issued | A flow of share issuance is needed to run the equity section of the model, but the decision of how to finance the company is left to the accounting model user. | Shares/Year | No |
| Share Price | If the company issues stock, the model needs to know the price per share so that the correct cash flow from share issuance can be accounted for. | Dollars/Share | No |
| Total Dividend Payment | If the company decides to pay dividends, then the model wants to know the total dollar value of the dividend payment. | Dollars | No |
| Dividend Payment Delay | The model includes the option of delaying the dividend payment rather than having it occur at the start of each payment period. | Years | No |
| Dividend Payment Frequency | This variable allows the model to pay dividends annually, semi-annually, quarterly, or at some arbitrary frequency. | Years | No |
| Initial Shares Outstanding | The company’s balance sheet may have started with shares already issued, and the number of shares issued will be recorded as the initial value of this stock. | Shares | No |
| Initial BS Additional Paid in Capital | The company’s balance sheet may have started with shares already issued, and the cash inflow from that share issuance would be recorded as the initial value of the stock of additional paid in capital. | Dollars | No |
Table 4.
Impact of Incorrectly Representing Accounting Reporting
| Treatment | Variable | Instant Value | Reported Value | Error |
|---|---|---|---|---|
| 20% Step t = 1.5 | Revenue t = 2 | $60,000 | $55,000 | 9.1% |
| Net Income t = 2 | $43,555 | $38,927 | 11.9% | |
| 5% p/y Ramp | Revenue t = 2 | $55,000 | $53,711 | 2.4% |
| Net Income t = 2 | $39,104 | $37,892 | 3.2% | |
| 10% p/y Ramp | Revenue t = 2 | $60,000 | $57,422 | 4.5% |
| Net Income t = 2 | $43,130 | $40,707 | 6.0% | |
| 5% p/y Exponential | Revenue t = 2 | $55,259 | $53,858 | 2.6% |
| Net Income t = 2 | $39,322 | $38,004 | 3.5% | |
| 10% p/y Exponential | Revenue t = 2 | $61,070 | $58,025 | 5.2% |
| Net Income t = 2 | $44,033 | $41,167 | 7.0% |
© 2020 by the author. Licensee MDPI, Basel, Switzerland. This article is an open access article distributed under the terms and conditions of the Creative Commons Attribution (CC BY) license (http://creativecommons.org/licenses/by/4.0/).
Share and Cite
MDPI and ACS Style
Pierson, K. Operationalizing Accounting Reporting in System Dynamics Models. Systems 2020, 8, 9. https://0-doi-org.brum.beds.ac.uk/10.3390/systems8010009
AMA Style
Pierson K. Operationalizing Accounting Reporting in System Dynamics Models. Systems. 2020; 8(1):9. https://0-doi-org.brum.beds.ac.uk/10.3390/systems8010009
Chicago/Turabian StylePierson, Kawika. 2020. "Operationalizing Accounting Reporting in System Dynamics Models" Systems 8, no. 1: 9. https://0-doi-org.brum.beds.ac.uk/10.3390/systems8010009
Note that from the first issue of 2016, this journal uses article numbers instead of page numbers. See further details here.