A Method for Measuring Systems Thinking Learning


1
School of Mechanical, Industrial, and Manufacturing Engineering, Oregon State University, 204 Rogers Hall, Corvallis, OR 97331, USA
2
Science and Math Investigative Learning Experiences (SMILE) Program, Oregon State University, 18 Gladys Valley Center, Corvallis, OR 97331, USA
*
Author to whom correspondence should be addressed.
Systems 2020, 8(2), 11; https://0-doi-org.brum.beds.ac.uk/10.3390/systems8020011
Submission received: 6 February 2020
/
Revised: 1 April 2020
/
Accepted: 2 April 2020
/
Published: 17 April 2020
(This article belongs to the Special Issue Advances in the Systems Sciences 2018)
Abstract
:The myriad of problems facing the world today are increasingly complex, dynamic, and transcend multiple domains. This necessitates the need for trans-disciplinary approaches capable of providing a framework to help solve these problems. Systems thinking provides the skills necessary for people to approach these types of problems. However, a lack of awareness and understanding of systems thinking hinders a potential systems-literate and systems-capable society. Systems thinking is comprised of four underlying concepts or skills: distinction-making, organizing systems, inter-relating, and perspective-taking. The path to becoming a systems thinker follows a process comprised of three levels—sensibility (awareness of systems), literacy (knowledge of systems), and capability (understanding of systems)—repeated across multiple learning phases. During this research study, a method was defined to measure whether non-experts learned the underlying systems thinking concepts according to this learning process. An experiment was conducted with 97 middle and high school students who were asked to draw a fish-tank system before and after being taught to apply the systems thinking concepts as skills for identifying elements, interactions, and roles/purposes. The results provide evidence to conclude that student learning of systems thinking significantly increased from the first drawing to the second drawing.
1. Introduction
1.1. Reductionism and Systemism
Many significant contributions to scientific practice were introduced during the philosophical movement of logical positivism by the Vienna Circle in the early 1900s [1]. Although this movement largely ceased by the 1970s, a way of thinking introduced by some Vienna Circle members called the reductionist approach is still common today as an approach to analyzing systems [2]. The reductionist approach, or reductionism, breaks a system down into constituent parts and analyzes each part separately to gain an understanding of each part. From this understanding of each part, an understanding of the whole system is formed. Reductionism can be useful as a starting point in analysis; it is a way to simplify and begin to understand the parts of a system. However, when reductionism is relied upon to explain a system (a complex interrelated whole) in terms of its parts, a fallacy is committed [3]. Systems cannot be understood simply by gaining an understanding of the parts because a system is greater than the sum of its parts [4]. In other words, a “system is an arrangement of parts or elements that together exhibit behavior or meaning that the individual constituents do not” [5] (p. 2).
The alternative to a reductionist approach (i.e., reductionism) is a systemic approach (i.e., systemism). A systemic approach allows for understanding of the network of purposeful interactions between parts and how a system emerges as a result of the interactions [4], among other things. In essence, the difference between reductionism and systemism is a matter of perspectives, or a difference in worldviews, namely a reductionist perspective and a systemic perspective. A reductionist perspective adopts a reductionism worldview where parts explain the system. Conversely, a systemic perspective adopts a systemism worldview where everything is a system and systems can explain the parts [6] as well as the parts can explain the system (explanatory arrows point both ways) [7]. If a worldview is simply a way of thinking, then systems thinking is a way of thinking about the world in terms of systems [8].
Using the reductionist approach to analyze systems is typically limited to a mono-disciplinary approach (thinking within a single discipline) [9], which often fails to provide the kind of thinking necessary to scale solutions as complexity increases [10]. Alternatively, systems thinking often encourages multi- (thinking together from different disciplines), inter- (thinking to integrate knowledge from different disciplines), and even trans-disciplinary (thinking to create new, highly integrated frameworks from different disciplines) [9] approaches, which can account for rising complexity [10]. Complex problems, such as those that span multiple disciplines and that constantly evolve, are difficult to solve by breaking down and solving each part individually. Changing from a reductionist perspective to a systems perspective is arguably one of the most crucial steps toward addressing the complex problems facing the world today and in the future. However, propagating a systems perspective is a significant challenge as systems thinking education is not widely spread nor is it well understood.
A key insight on how to gain more understanding about teaching systems thinking is by identifying the cognitive gap that exists between reductionism and systemism in dealing with increasing degrees and kinds of complexity as depicted in Figure 1. Kind of complexity refers to different kinds of systems, from simple systems like atoms and molecules to complex systems like solar systems and galaxies, which are differentiated based on properties that higher-level systems have that their parts do not (i.e., emergent properties) [7]. Degree of complexity refers to the number of parts in a system and the interactions between those parts, therefore as the number of parts and interactions increase so does the degree of complexity [7]. For example, a planet and a solar system differ in kind and degree of complexity. A solar system comprises many planets and other parts and has properties that the planets individually do not have, making it a different kind of system. Additionally, a solar system has a greater degree of complexity than a planet due to the greater number of parts and interactions between parts.
Bosch et al. [11] provide some evidence for the cognitive gap in Figure 1, citing that poor outcomes related to change implementation projects in developing countries and regions can be partially attributed to the application of traditional linear thinking to deliver simple, quick fixes to complex problems. The reliance on these traditional ways of thinking, and the reason for the cognitive gap, might be explained by theory-induced blindness, which Kahneman describes as a widespread acceptance for a particular way of thinking that makes it difficult to notice any shortcomings [12] (p. 277). Furthermore, if we posit that reductionism and systemism are just two special cases of a more general theory for problem solving, where reductionism deals with simple systems and systemism deals with complex systems, then it can be argued that systems thinking skills can be applied and thus learnt under reductionism.
1.2. Systems Literacy and Systems Education
Systems thinking helps to establish a common language for all people to collaborate and understand each other and the world as a whole. The idea of systems literacy advocated for by Crowell [13] and Tuddenham [14] is an ongoing effort to foster awareness and understanding about systems among all people by establishing a common language. Using a common ontology for talking about systems, a common language, provides a common perspective and can help align how people think real-world systems work with how systems actually work [15]. Ison and Shelley [16] posit that an investment in the fostering of systemic sensibility, or the explicit awareness of systems, is a vital first step on the path to reach systems literacy and to affect the current trajectory of many complex problems facing the world today. Reaching alignment under a common language is certainly a challenge, but like many challenges, it begins with creating awareness through education.
Arguably, the most important and critical opportunity to achieve systems literacy is the education of the next generation of thinkers and problem-solvers in primary and secondary education (K-12). The growing need to integrate systems thinking into the curriculum has been recognized in K-12 education and has been addressed in recent educational standards such as the Next Generation Science Standards (NGSS) [17]. These standards are a positive step toward growing systems literacy; the standards have the ability to create the impetus for teachers and educators to implement systems thinking concepts into their curriculum. However, more systems thinking curriculum does not equate to more systems thinkers [15]. Although increased curriculum equates to more awareness, it is still unclear whether current curriculum is creating more systems thinkers and whether current curriculum is instilling the skills necessary for individuals to become systems thinkers.
In order to measure whether systems thinking curriculum equates to more systems thinkers, the fundamental concepts necessary to foster systems thinking learning must be identified and understood. However, before the concepts can be determined, the process of how a learner learns systems thinking, especially non-expert learners, must be understood. One way to understand this process is to measure it. Hmelo-Silver, Eberbach, and Jordan [18] and Hmelo-Silver, Liu, Gray, and Jordan [19] have conducted studies to measure K-12 student’s understanding of complex systems according to a conceptual framework called the structure, behavior, function (SBF) framework. In these studies, the data shows increased student understanding of aquarium systems using the SBF conceptual framework [18,19]. These studies have provided greater understanding about how students learn systems thinking concepts, but these studies did not directly measure the underlying skills to become a systems thinker or define the systems thinking learning process. Liu and Hmelo-Silver [20] suggest that other conceptual frameworks, other than SBF, may exist to help students learn about systems. One such framework is the DSRP framework developed by Cabrera [21] which defines the four underlying, or fundamental, systems thinking rules of: distinction-making (D), organizing systems (S), inter-relating (R), and perspective-taking (P). Systems thinking appears to be a task that must be performed; however, it is actually the result of applying these four simple rules to thinking [22].
Since the systems thinking learning process is largely undefined for non-experts (who possess little to no systemic sensibility, or awareness of systems), there exists an opportunity to define and measure this process according to the underlying skills of DSRP necessary for a non-expert to become a systems thinker. Hence, the purpose of this research study was to define the initial systems thinking learning process for non-experts and to conduct an experiment to measure that process using DSRP. The results from this study can be used to support future systems thinking curriculum development by and for non-experts and to contribute to the growth of systems literacy in K-12 education.
2. Background
In this section, the background knowledge for this research study is presented. The background knowledge includes the three concepts of systems, thinking, and systems thinking, and the three ideas of systems thinking education, systems literacy, and the systems thinking learning model.
2.1. What is a System?
To understand the scope of the concept “system”, one only needs to explore the sheer number of entries for the term in the International Encyclopedia of Systems and Cybernetics by François [23]. The approach to answer the question of “what is a system” has been to create a specialized definition to suit the needs of a given context. However, the proliferation of these specialized definitions has hindered the transferability of systems knowledge and language across disciplines. This has created confusion and lack of agreement between intended users, which may be one reason why systems concepts are not widely adopted and consistently applied. In response to this problem, and in an effort to standardize the systems language, an “Ontology of Systemology” was created by Rousseau, Billingham, and Calvo-Amodio [24]. This ontology (which structures and organizes systems concepts and defines relationships between the concepts) establishes a general framework to answer this question by providing a means for users with different working definitions of a system to find a common working definition. For example, the framework allows users to define a system using general inquiries [24] (p. 20): “What is a system and how can we recognize something as a system?”; “What makes something a system and what properties are essential to systemness?”; “What systems exist and how did systems arise and develop?”; “Why are systems important?”; “What is the purpose or function or meaning of systems?”; “What can we know about systems?”.
There are two types of systems identified in the “Ontology of Systemology” framework: concrete systems and conceptual systems [24]. Concrete systems are characterized by a persistent structure or persistent process and conceptual systems are characterized by persistent meaning. Both types of systems are, at the most basic level, composed of parts (also concrete or conceptual), which give rise to a specific system based on the structure and interrelationships of the parts [24]. Each system has a boundary which separates the parts and the system from the environment and the context in which the system lies. Additionally, each system can be viewed from a certain perspective which varies based on the viewer [24]. These general systems concepts constitute the basic concepts necessary to recognize a system and were considered sufficient to establish systemic sensibility in this research study.
2.2. What is Thinking?
The scope for the concept of “thinking” is as varied as the scope for the concept of “system”. However, for the purpose of this research, only W.E. Deming [25] and Russell Ackoff’s [26] definitions for thinking were selected.
The cognitive gap between reductionism and systemism might have implications related to learning. Learning provides a way to challenge established ways of thinking. Without learning, new ways of thinking will be difficult to integrate across society. Deming [25] expressed the relationship between thinking and learning as the Theory of Knowledge. In his theory, Deming cautions that if ways of thinking about the world, or theories, are not challenged, then there is nothing to revise and therefore nothing to learn [25].
Ackoff [26] has defined the content of learning by drawing distinctions between data, information, knowledge, understanding, and wisdom. Ackoff argues that these terms are not interchangeable because each term is part of a distinct hierarchy of learning with increasing value [26]. Data is simply the basic form of learning, but data has no value until it is processed into useful information. For example, think of data as a temperature, such as 90 degrees, and information as the temperature scale. Without the scale, a temperature is not useful because 90 degrees Fahrenheit is different than 90 degrees Celsius. Therefore, without information, the right action to take based on data cannot be determined, such as what clothing to wear based on the temperature. Therefore, data and information represent answers to questions of “what” [26]. However, data and information cannot answer questions of “how” because this represents knowledge. Knowledge is obtained and revised based on experiences and theories, or ways of thinking. Therefore, knowledge represents how people think about the world and about systems [26]. The acquisition of knowledge is facilitated by understanding. Understanding is able to answer questions of “why” [26]. When current ways of thinking are not able to explain a problem, people seek to understand why in order to revise knowledge or the way of thinking about a problem. Data, information, knowledge, and understanding all contribute to wisdom, which is an evaluated understanding of our way of thinking [26]. Wisdom is knowing the best way to think about a problem and then being able to do the right things to address the problem. Wisdom can only be acquired as a result of challenging the current ways of learning and thinking, and systems thinking provides an opportunity to challenge the reductionist ways of thinking.
2.3. What is Systems Thinking?
Similar to the concept of “system” there are a significant number of specialized definitions for the concept of “systems thinking”. Buckle and Chen [27] highlighted many of the contributions made to explain the concept of systems thinking in popular literature, but they note that these contributions are vast and varied. One general definition from Jackson [4] describes systems thinking as an approach to studying all types of systems with the potential power of systems thinking resting upon its trans-disciplinary nature and how it can be used to draw from and apply ideas and concepts from all domains. Another general definition from Checkland [8] describes systems thinking as a particular way of, or a perspective for, thinking about the world; systems thinking uses the concept of a system to explain and understand complexity in the world. These two general definitions, along with the other varied contributions highlighted by Buckle and Chen [27], provide answers to the question of “what is systems thinking” and offer an excellent starting point to understand systems thinking and how the concepts of “system” and “thinking” are related. However, many of these contributions do not define the skills related to systems thinking.
A robust definition of systems thinking is not complete without considering the underlying applications for this way of thinking. Buckle and Chen [27] identified seven (7) mental stances, or orientations, to be a systems thinker, which were derived from systems thinking contributions in popular literature. Buckle and Chen [27] argue that it is not enough to only communicate (teach) system definitions and facts; more understanding about how these orientations can help create systems thinkers is needed just as more understanding is needed about the cognitive skills underlying systems thinking. Cabrera has proposed four underlying rules for systems thinking, which were derived scientifically, in a framework called DSRP [21] (p. 176): distinction-making (D), organizing systems (S), inter-relating (R), and perspective-taking (P). Cabrera and Cabrera have refined the DSRP rules to make each rule more accessible and applicable [15] (p. 52):
- Distinctions Rule (D): Any idea or thing can be distinguished from the other ideas or things it is with;
- Systems Rule (S): Any idea or thing can be split into parts or lumped into a whole;
- Relationship Rule (R): Any idea or thing can relate to other things or ideas; and
- Perspectives Rule (P): Any thing or idea can be the point or the view of a perspective.
Cabrera, Colosi, and Lobdell [22] argue that systems thinking is actually not a task to be completed, but rather, it is something achieved as a result of applying these four rules. Although people implicitly use these four rules to guide their thinking, a greater explicit understanding of these rules is a prudent challenge if the potential of systems thinking to help solve problems facing the world is to be realized. Furthermore, Cabrera, Colosi, and Lobdell [22] posit that systems thinking is easy to learn and practice, and since it is applicable to any discipline or problem situation, it can even be algorithmically applied. This definition of systems thinking in terms of DSRP was chosen as the guiding definition for this research in order to measure the impact on learning from explicitly teaching these underlying systems thinking rules as skills.
2.4. Systems Thinking Education
An effort to integrate systems thinking into the greater educational system is evident within recent educational standards such as the Next Generation Science Standards (NGSS) for primary and secondary education (K-12) [17]. The NGSS consist of three dimensions to learning: (1) practices, (2) core ideas, and (3) crosscutting concepts. Systems and systems thinking concepts appear throughout the standards, but these concepts appear mostly in the dimension of crosscutting concepts. Learning that involves patterns, systems, system models, cause and effect, and structure and function are all systems concepts expressed in the NGSS [17]. The inclusion of systems and systems thinking concepts in these standards is a positive step toward fostering systemic sensibility. However, an explicit focus on the underlying systems thinking skills is not apparent in the standards and there are no details for how to evaluate systems thinking learning. Additionally, a lack of teacher professional development for systems thinking hinders the adoption and integration of these concepts in K-12 curriculum.
Although there is no evidence yet for widespread, established systems thinking courses in K-12, three (3) localized examples of systems thinking in educational contexts are discussed here. The first example is the Creative Learning Exchange (CLE) [28]. The CLE is based in the United States and was created in 1991 by Jay Forrester, who is the founder of systems dynamics, to focus on creating systems citizens by teaching K-12 students about systems thinking and systems dynamics concepts [28]. Access to CLE curriculum is free for students and serves as an out-of-the-classroom learning opportunity. The CLE curriculum also connects to educational standards like the NGSS to complement what K-12 students learn in the classroom. The second example is the Open University (OU) [29]. The OU is based in the United Kingdom and offers several online certificates and advanced degrees for systems thinking practice as a higher education learning opportunity [29]. Although the systems thinking curriculum offered by OU is not intended for non-expert learners, this example demonstrates that systems thinking education spans all learning levels and is accessible to learners who have the drive and ability to pursue it. The third example are Learning Laboratories (LLab) described by Bosch et al. [11]. The purpose of the LLab is to help “policy makers, managers, local facilitators and researchers collaborate and learn together to understand and address complex problems of common interest in a systemic way” [11] (p. 118). The LLab is both a process and a setting where groups of people come together and solve problems using a seven-step iterative process which is general enough to be used to think about any complex issue. The use of LLabs is an ongoing effort, but early examples have been positive with applications and implementations ranging from conservation and sustainable development to child safety [11].
There are also notable research efforts on systems thinking education. One such effort is from Buckle [30] who introduced the significant idea of maturity models for competence in systems thinking. This work has outlined many fundamental questions that need to be answered to understand how to create more systems thinkers. One question proposed is “by what means could these competencies be measured?” [30] (p. 14), which potentially refers to a method for assessing a person’s learning of systems thinking. Other questions are proposed to define what immature and mature systems thinking are, or what systems thinking competencies exist for people with low and high levels of systems thinking expertise.
Other notable research efforts on systems thinking education have been made with regards to K-12 student learning. Hmelo, Holton, and Kolodner [31] designed methods of teaching to facilitate student learning about complex systems. This method centered around the framework of the SBF theory, which stands for structures (S), behaviors (B), and functions (F). Structures were defined as the physical parts of a system, behaviors were defined as the purposes of the system and of the parts, and functions were defined as the mechanisms that allow structures to fulfill their functions [31]. This theory demonstrated a promising conceptual framework to help students learn about complex systems. Jordan, Hmelo-Silver, Liu, and Gray [32] conducted a study with over one hundred middle school students to evaluate pre and post treatment understanding of an aquarium system using the SBF framework. Results from the study showed that incorporating the SBF framework into instruction and explicitly targeting system relations significantly improved student understanding of all factors, especially for behaviors and functions [32]. Hmelo-Silver, Eberbach, and Jordan [18] and Hmelo-Silver, Liu, Gray, and Jordan [19] developed and refined a scoring system to measure K-12 student’s understanding about complex systems using the SBF framework. This scoring system distinguished between lower and higher levels of understanding based on the presence or lack of structures, behaviors, and functions in student descriptions of an aquarium system.
The research studies in K-12 education [18,19,31,32] have contributed many insights into how students, or non-experts, learn systems thinking, but these studies lack both a direct connection to the systems thinking skills underlying all systems thinkers and a connection to a defined systems thinking learning process. Thus, this research study addressed the opportunity to bridge the gap between the underlying systems thinking skills described by the DSRP framework from Cabrera [21] and a systems thinking learning process. The systems literacy roadmap, discussed in the next section, represents a potential learning process to make this connection possible, and it might help provide answers to the questions posed by Buckle [30] on maturity models for systems thinking.
2.5. Systems Literacy Roadmap
The idea of systems literacy was first introduced by Crowell [13] as the capability for humans to understand and communicate about the world using systems. This paints systems literacy as a common language for all humans. Tuddenham [14] defines systems literacy as an ongoing effort to foster awareness and understanding about systems among all humans. Although not explicitly called systems literacy, Cabrera and Cabrera [15] recognize the promise that systems thinking has to establish a common language that facilitates shared understanding and collaboration. In essence, the goal of systems thinking education is to foster systems literacy. This opens the question of, how can systems literacy be achieved?
A potential roadmap for realizing systems literacy has been provided by Ison and Shelley [16], who posit that systemic sensibility is available to all humans. This idea of systemic sensibility is defined as our ability to see and be aware of systems in daily life. However, many people seem to lack this innate sensibility. Ison and Shelley [16] note that the contexts, or educational outlets, that allow systemic sensibility to be fostered for all people are missing, and that society must make a shift in thinking from sensibility, to literacy, to capability as presented conceptually in Figure 2. These three “levels” of systems thinking provide the foundation to define the systems thinking learning process.
To understand the three levels of sensibility, literacy, and capability, each level can be defined in the context of thinking and learning about systems. According to Merriam Webster [33], one of the definitions for the word sensibility is: “awareness of and responsiveness toward something”. From this definition, and from the definition of sensibility related to systems provided by Ison and Shelley [16], achieving sensibility about systems equates to achieving awareness about systems. As an example, recall the weather example presented during the discussion of data and information in Section 2.2. Given a weather forecast of 55 °F, mostly cloudy, and windy, a person might respond by wearing a short-sleeve shirt and shorts. As a result, it is likely that person will feel too cold and will revise their response the next time there is a similar weather situation. Achieving sensibility about weather systems means being aware that different weather situations require different responses to stay comfortable (i.e., not getting too hot or too cold, not getting wet, etc.), however, knowledge about how to respond based on different situations might still be limited. Therefore, knowledge about how to respond to certain weather situations requires the acquisition of literacy about weather systems.
The definition for literacy by Merriam Webster [34] is “the quality or state of being literate”, and one of the definitions for literate by Merriam Webster [35] is “having knowledge or competence”. Therefore, achieving literacy about systems equates to achieving knowledge about systems. For example, given the same weather forecast of 55 °F, mostly cloudy, and windy, a person might respond by wearing a long-sleeve shirt and pants. As a result, it is likely that person will feel more comfortable than before and will use this knowledge to inform their reactions to similar weather situations. Achieving literacy about weather systems means having knowledge about how different weather situations require different responses to stay comfortable (i.e., learning how to react to the weather system), however, understanding about why different situations require different reactions might still be limited. Therefore, understanding about why certain responses are necessary to certain weather situations requires the acquisition of capability about weather systems.
The definition of capability according to Merriam Webster [36] is “the quality or state of being capable”. The word capable has many meanings, one of which by Merriam Webster [37] is “comprehensive”. One of the definitions for the word comprehensive by Merriam Webster [38] is “having or exhibiting wide mental grasp”. The word comprehensive is an adjective and the noun form of the word is comprehension, which according to Merriam Webster [39] means “the act or action of grasping with the intellect: understanding”. Therefore, achieving capability about systems equates to achieving understanding about systems. For example, given the same weather forecast of 55 °F, mostly cloudy, and windy, a person might respond by wearing a long-sleeve shirt, a wind-breaker jacket, pants, and a hat. As a result, it is likely this person will feel even more comfortable than before and will use this enhanced knowledge to inform their understanding of why they should react a certain way to certain weather situations. Achieving capability about weather systems means having understanding about why different situations require different responses to stay comfortable, such as wearing a wind-breaker jacket and a hat to reduce heat loss due to convection (i.e., cold wind blowing against warm skin) and radiation (i.e., heat rays leaving the body).
2.6. Systems Thinking Learning Model
The systems thinking learning model, shown in Figure 3, that illustrates the systems thinking learning process was originally published by Taylor, Calvo-Amodio, and Well [40]. The model defines three distinct phases of learning along an S-shaped curve which can be explained by the logistic equation introduced by Pierre-François Verhulst [41]. The first learning phase is characterized by slow, initial learning and is defined in the model as Initial Learning (IL). The second learning phase is characterized by steep, exponential learning and is defined in the model as Rapid Learning (RL). At some point in this second phase, the learning growth reaches an inflection point that separates the initial, positive convex curvature from the emerging, negative concave curvature that creates the distinctive S-shaped curve [41]. The third learning phase is characterized by slowing, near-capacity learning and is defined in the model as Mastery Learning (ML). Although the S-shaped curve is often used to model population growth [41], it can also be used to adequately model the exponential growth associated with learning a new subject and the theoretical “limit” to the knowledge one can acquire about that subject.
Within each phase i, the systems thinking learning process goes through the three systems thinking learning levels of sensibility (S), literacy (L), and capability (C). All three levels are present concurrently during the systems thinking learning process. Therefore, a learner’s path through each phase depends on a combination of all three levels. Performance (X), or learning, in each phase i can be measured as:
A learner must demonstrate performance in all three levels to progress from one phase to the next. However, each learner is different, therefore the time spent in each phase (∆t) depends on the learner. With this model, the systems thinking learning process has been defined and a general way of measuring that process has been proposed. In the following section, the methods used to define and measure the initial learning phase for non-experts in the context of a fish-tank system are presented.
3. Methodology
In this section, the research study methodology is presented. The design of the research study began with an experiment to collect data. Then, a content analysis, with a mix of qualitative and quantitative methods, was used to analyze the collected data. A mixed-methods research study design was chosen because this study focused on human behavior [42], specifically learning.
In this study, the initial systems thinking learning process for non-experts—defined by the three levels of sensibility (awareness of systems), literacy (knowledge of systems), and capability (understanding of systems)—was measured before and after middle and high school students were taught to apply the DSRP framework from Cabrera [21] as skills for identifying elements, interactions, and roles/purposes in a fish-tank system. Students were taught the concept of distinctions (D) as the skill of identifying elements, the concept of relationships (R) as the skill of identifying interactions, and the concept of perspectives (P) as the skill of identifying roles/purposes. Students were not explicitly taught the concept of systems (S), however student learning of this concept was measured as the total of distinctions, relationships, and perspectives since systems are comprised of elements which interact in a given context based on the roles/purposes assigned by the system viewer [24].
3.1. Data Collection
Data was collected for this research study using a systems thinking workshop (i.e., an experiment) conducted during a two-day event hosted by the Science and Math Investigative Learning Experiences (SMILE) Program at Oregon State University (OSU). Since this research study involved human subjects, the study was conducted in accordance with the Declaration of Helsinki. The research protocol was submitted to the Human Research Protection Program (HRPP) and Institutional Review Board (IRB) at OSU prior to data collection and was approved on 19 April 2019 (IRB-2019-0090). During the first day of the event, the workshop was conducted with five (5) groups of high school students, and during the second day of the event, the workshop was conducted with four (4) groups of middle school students. Each of the nine (9) workshops were taught by one of two members from the research study team (i.e., Instructor 1 and Instructor 2). Both Instructor 1 and Instructor 2 taught two (2) groups of high school students and two (2) groups of middle school students individually, and Instructor 1 and Instructor 2 taught one (1) group of high school students together. The workshop did not vary between groups or vary between middle school and high school students. Each group consisted of approximately 20–25 students. Only students who provided informed assent were included in the study, however all students participated in the workshop.
For each group, the instructors used the same presentation slides to guide the workshop. The workshop began with an introduction to the instructors, a brief introduction to systems thinking, and an overview of the workshop (experiment), which included time for students to decide whether to provide informed assent for inclusion in the study. Next, for approximately five (5) minutes, students were asked to draw a fish-tank system (Drawing A) while considering this problem statement: “You recently purchased a fish tank. After two weeks, you notice the water is turning green in color.” Students were also asked to consider elements, interactions, and roles/purposes while completing their fish-tank system drawing. Drawing A served as a warm-up activity to evaluate systems thinking learning before teaching students about the systems thinking concepts.
During the next part of the workshop (experiment), students were taught about the three systems thinking concepts of distinctions, relationships, and perspectives. The first concept that students learned was distinctions, which was taught as the skill of identifying elements. After learning about distinctions, the students were asked to start a new fish-tank system drawing (Drawing B) and to draw and label only elements while considering the same problem statement as in Drawing A. This process was repeated for the concepts of relationships and perspectives. For relationships, students were taught the skill of identifying interactions and were asked to draw and label interactions for a fish-tank system in Drawing B. For perspectives, students were taught the skill of identifying roles/purposes and were asked to draw and label roles/purposes for a fish-tank system in Drawing B. Students were given approximately three to four (3–4) minutes to complete each concept in Drawing B.
3.2. Qualitative Methods
Once the data was collected, the next step for a mixed-methods research design was a qualitative analysis to extract useful information from the data in preparation for a quantitative analysis [42]. For this research study, a content analysis was used to identify patterns within the collected drawings in order to clearly define the different classifications of elements, interactions, and roles/purposes which could result from each pattern. This established a consistent and reliable classification structure, or methodology, which was used to classify each element (distinction), interaction (relationship), and role/purpose (perspective) that a student drew according to one of the three systems thinking learning levels (sensibility, literacy, or capability). Once each element, interaction, and role/purpose in a drawing was classified, the frequency of each concept was recorded for each student in both Drawing A and Drawing B. In the following three sections, the methods derived for classifying each of the three systems thinking concepts are presented.
3.2.1. Classifying Distinctions (Elements)
The process of classifying distinctions entailed classifying elements, which are the result of applying the systems thinking concept of distinctions. In the context of a fish-tank system, it was conceivable to define the elements that could be found inside the system boundary (i.e., within the fish tank) or that could interact with the system from outside the boundary. Therefore, the first step toward classifying elements was to define the elements for a fish-tank system. The forty-nine (49) elements that students could conceivably identify in a fish-tank system drawing based on an encyclopedia about marine aquariums by Mills [43] are presented in Table A1 (column 1) in Appendix A. An examination of these elements revealed five distinguishable patterns:
- Elements that are visible or invisible. For example, a plant is visibly identifiable in a fish-tank system, whereas bacteria are not visibly identifiable (i.e., cannot be seen with the naked eye).
- Elements inside or outside the system boundary (i.e., the walls of the fish tank). For example, rocks and filters are found inside the system boundary while a human and a thermostat are found outside the system boundary.
- Elements that are critical to the system’s definition. For example, a fish, a tank, and water are necessary to define a system as a fish-tank system, whereas the absence of a filter or a heater does not preclude defining a system that includes a fish, a tank, and water as a fish-tank system.
- Elements that are underlying causes of the problem situation. In the context of the green-water problem for a fish-tank system, some elements can be identified as underlying causes of that problem while many elements cannot be identified as underlying causes. The most likely underlying causes of green water in a fish-tank system include excess light or sunlight, excess fish waste, decaying organisms, overfeeding resulting in uneaten food, and a broken or dirty (ineffective) filter or filtration system [44].
- Elements that are labeled as systems. For example, the filter is only one element that can belong to the greater filtration system which may also contain filter media, filter tubes, an impeller, and other elements.
The first pattern of visible or invisible was used to classify elements as either concrete elements (visible) or conceptual elements (invisible). Rousseau, Billingham, and Calvo-Amodio [24] define concrete elements, or systems, as having a persistent structure and conceptual elements as having a persistent meaning. Conceptual elements are defined as non-physical elements which appears to conflict with this classification logic. However, elements like bacteria or electricity, although each has a physical structure at some level, cannot be seen with the naked human eye. Additional reasoning for this classification logic was drawn from a study about student learning of complex systems by Hmelo-Silver and Pfeffer [45] which found that students tend to recall “perceptually salient” structures, or elements, more readily than less salient structures or elements. Therefore, classifications to distinguish visible, more salient elements from invisible, less salient elements were needed to fully classify elements in a fish-tank system.
The second pattern of inside or outside the system boundary (i.e., the walls of the fish tank) was used to classify elements that are either internal or external. Similar to elements that are visible, elements that are inside the fish-tank system are more salient than elements that are outside the fish-tank system. When considering a fish-tank system, thinking about internal elements occurs more readily than thinking about elements in the external environment around the fish tank. Therefore, classifications to distinguish internal elements from external elements were needed to fully classify elements in a fish-tank system.
The remaining patterns of (3) elements being critical to the system definition, (4) elements being underlying causes of the problem situation, and (5) elements being sub-systems within the greater fish-tank system were used to create three more element classifications. Examining these three patterns revealed a connection to three of the ideas from the content of learning by Ackoff [26]: data and information, knowledge, and understanding. Elements that are critical to define a fish-tank system represent the essential data or information used to define what type of system is being observed [26]. Defining essential elements demonstrates an awareness of what elements are necessary to define a system as a fish-tank system. Therefore, a classification to distinguish essential elements from other elements was needed to fully classify elements in a fish-tank system. Elements that are underlying causes of the problem situation or elements that are sub-systems represent an advanced understanding of why a system behaves a certain way [26]. Defining advanced elements demonstrates an understanding of why elements might be causing the green water problem situation in a fish-tank system. Therefore, a classification to distinguish advanced elements from other elements was needed to fully classify elements in a fish-tank system. Elements that do not meet the essential or advanced classification definitions still contribute knowledge about how a system works [26]. Defining these secondary elements demonstrates knowledge about the elements needed to explain how the system is working. Therefore, a classification to distinguish secondary elements from other elements was needed to fully classify elements in a fish-tank system. The connections between the five patterns and the seven element classifications are summarized in Table 1.
In order to classify each element according to one of the three systems thinking learning levels, the combinations of classifications that belonged at each level needed to be defined. In Section 2.5, the three levels were defined as: (1) sensibility—awareness of systems, (2) literacy—knowledge of systems, and (3) capability—understanding of systems. These definitions are congruent with the three element classifications of essential, secondary, and advanced respectively. Therefore, essential elements were classified at the sensibility level, secondary elements were classified at the literacy level, and advanced elements were classified at the capability level. Since essential elements were constrained to fish, tank, and water, which are all concrete and internal elements, this resulted in only one combination of classifications for elements at the sensibility level. Secondary elements cannot be classified as conceptual, but these elements can be classified as internal or external. This resulted in two combinations of classifications for elements at the literacy level. Advanced elements can be classified as conceptual and also as concrete, and, just like secondary elements, advanced elements can be classified as internal or external elements. This resulted in four combinations of classifications for elements at the capability level. The element classification combinations for each systems thinking learning level are summarized in Table 2.
The classification structure was now used to classify each of the elements defined for a fish-tank system according to the systems thinking learning levels. The element classification flowchart used during the classification process is presented in Figure 4. Consider the element “human” as an example for how the element classification process works using the flowchart. First, ask the question “is the element visible or invisible?” A human is visible with the naked eye; therefore, a human is classified as a concrete element. Next, ask the question “is the element inside or outside of the fish tank?” A human is located primarily outside the fish tank; therefore, a human is classified as an external element. Next, ask the question “is the element an underlying cause of the problem?” Humans may play a role in causing the green water problem, but humans are not an underlying cause. Lastly, ask the question “is the element labeled or described as a system?” Technically, a human is a system, however, unless explicitly labeled as “human system” a human is not considered a sub-system in this case. Based on the answers to these questions and the flowchart, a human is classified as a concrete, external, secondary element which is classified at the literacy level of systems thinking learning. The classifications for all forty-nine (49) elements defined prior to the data analysis are presented in Table A1 in Appendix A.
The element classifications were now used to analyze each drawing and record the frequency of elements drawn according to specific rules in preparation for the quantitative analysis. The rules used to classify and record elements are described in Table A3 in Appendix B.
3.2.2. Classifying Relationships (Interactions)
The process of classifying relationships entailed classifying interactions, which are the result of applying the systems thinking concept of relationships. In the context of a fish-tank system, it was conceivable to define all the possible interactions that could take place between elements. However, defining all of these interactions was not realistic. Suppose that each of the forty-nine (49) elements defined in Table A1 in Appendix A had at least one interaction with every other element. This would result in forty-eight (48) interactions per element meaning, at a minimum, 482 = 2304 interactions would need to be defined. Instead of defining an exhaustive list of all possible interactions, the classification structure developed for interactions was based upon the simple patterns necessary to classify all potential interactions that students could conceivably identify for a fish-tank system.
The simple patterns of interactions were determined from the systems thinking concept of relationships (R) within the DSRP framework from Cabrera [21]. Cabrera and Cabrera [15] define relationships as the interplay between action and reaction, which are the two underlying concepts required for all relationships. The expression of a relationship at the simplest level implies using a line to connect two elements together. However, this connection lacks any knowledge or understanding about the action and the reaction that is occurring between the two elements. Using a line to connect two elements only demonstrates awareness that a relationship exists, which aligns with the sensibility level of systems thinking learning. To reach the upper two levels of systems thinking learning, a student must demonstrate knowledge (literacy) about how the elements are interacting or about how a relationship between elements causes an effect, and understanding (capability) about why certain actions cause certain effects (i.e., a cause-and-effect relationship). Therefore, the patterns identified for interactions represented the presence of or the lack of actions and reactions, and the combination of those two concepts for each interaction, which resulted in four patterns: (1) non-action, non-reaction interactions; (2) action, non-reaction interactions; (3) non-action, reaction interactions; and (4) action, reaction interactions.
The first pattern of non-action, non-reaction interactions established two classifications to distinguish interactions. The first classification was for non-action interactions, or an interaction that lacks a clearly defined action, and the second classification was for non-reaction interactions, or an interaction that lacks a clearly defined reaction. The combination of these two classifications is synonymous to drawing a line between two elements to demonstrate awareness of a relationship, which does not define a clear action or reaction. As explained previously, an interaction that only demonstrates awareness resides at the sensibility level of systems thinking learning. Cabrera and Cabrera [15] describe a line connecting two elements as a simple way to visualize relationships. Therefore, a classification to distinguish simple interactions from other interactions was needed to fully classify interactions for a fish-tank system.
The second pattern of action, non-reaction interactions and the third pattern of non-action, reaction interactions established two additional classifications to distinguish interactions. The first classification was for action interactions, or an interaction that includes a clearly defined action, and the second classification was for reaction interactions, or an interaction that includes a clearly defined reaction. Both of these patterns tell only half the story for an interaction, either an action without a reaction or a reaction without an action. As explained previously, these types of interactions reside at the literacy level of systems thinking learning because these interactions express knowledge about how elements are interacting or about how a relationship causes a reaction. Therefore, a classification to distinguish half-developed, or intermediate, interactions from other interactions was needed to fully classify interactions for a fish-tank system.
The fourth pattern of action, reaction interactions tells the full story for an interaction. As explained previously, interactions with both a clearly defined action and reaction reside at the capability level because these interactions express understanding of why a specific action between elements causes a specific reaction. Similar to the classification for advanced elements, this level of thinking about interactions is also advanced. Therefore, a classification to distinguish advanced interactions from other interactions was needed to fully classify interactions for a fish-tank system. The connection between the four patterns and the seven interaction classifications are summarized in Table 3.
Additional evidence for why simple, intermediate, and advanced interactions should reside at the systems thinking learning levels of sensibility, literacy, and capability respectively was drawn from a similar study by Hmelo-Silver, Eberbach, and Jordan [18] in which different structures, behaviors, and functions (SBF) were distinguished across multiple levels of thinking while classifying aquarium system drawings (see Section 2.4 for information about SBF). The lower level of thinking was classified as only the identification of some relationship between structures, but the lack of any elaboration [18]. The middle level of thinking was classified as the identification of a structure in relation to either a behavior or a function [18]. For example, a connection between a behavior and a structure described how a structure performed its function (e.g., fish swim in water) while a connection between a structure and a function described the effect of a structure’s behavior (e.g., fish move around the tank). The upper end of thinking was classified as the identification of a structure in relation to both a behavior and a function [18]. This level of thinking demonstrated both how a structure performed its function and the effect of that behavior (e.g., fish swim in water to move around the tank). From each of these levels of thinking, comparisons could be drawn to each of the systems thinking learning levels defined in this research study. From the lower level, comparisons could be drawn to awareness of simple relationships and the classification of sensibility. From the middle level, comparisons could be drawn to knowledge of separate action and reaction relationships and the classification of literacy. From the upper level, comparisons could be drawn to understanding of the cause-and-effect relationships and the classification of capability. The interaction classification combinations for each systems thinking learning level are summarized in Table 4.
The classification structure could now be used to classify potential interactions identified by students for a fish-tank system. The interaction classification flowchart used during the interaction classification process is presented in Figure 5. While analyzing each drawing, interactions were classified and recorded according to specific rules in preparation for the quantitative analysis. The rules used to classify and record interactions are described in Table A4 in Appendix B.
3.2.3. Classifying Perspectives (Roles/Purposes)
The process of classifying perspectives entailed classifying roles/purposes, which are the result of applying the systems thinking concept of perspectives. In the context of a fish-tank system, it was conceivable to define all the possible roles/purposes for each element. However, defining all of these roles/purposes, like with interactions, was not realistic. Suppose that each of the forty-nine (49) elements defined in Table A1 in Appendix A were assigned a role/purpose from each of the three systems thinking learning levels. This would result in three (3) roles/purposes per element meaning, at a minimum, 147 roles/purposes would need to be defined. Instead of defining an exhaustive list of all potential roles/purposes for each element, the classification structure developed for roles/purposes was based upon the simple patterns necessary to classify all potential roles/purposes that students could conceivably identify for a fish-tank system.
The simple patterns of roles/purposes were determined from the systems thinking concept of perspectives (P) within the DSRP framework from Cabrera [21]. Cabrera and Cabrera define perspectives fundamentally as “a point from which we are viewing and the thing or things that are in view” [15] (p. 50). In other words, perspectives are a point-of-view or a lens through which a specific element in a system is viewed. There are many perspectives that could be applied for any given situation, but what if there were only three different levels of perspective-taking, one for each systems thinking learning level, that could apply to elements in a fish-tank system? Evidence to answer that question was drawn from a related study by Hmelo-Silver, Liu, Gray, and Jordan [19] where five aquarium mental models were defined to characterize student learning outcomes for aquatic systems. The first three of these mental models characterize learning outcomes for perspectives that could be reasonably expected of learners in the initial learning phase of systems thinking. Drawing upon these three mental models informed the three patterns that were used to classify roles/purposes:
- The first pattern was drawn from the mental model called “egocentric” [19]. This mental model is characterized by adopting the perspective of an observer of a fish-tank system. In the case of this research study, the observer of the system was the student drawing the fish-tank system.
- The second pattern was drawn from the mental model called “simple healthy fish” [19]. This mental model is characterized by adopting the perspective of a fish in the fish-tank system. In other words, all roles/purposes for elements focus on helping the fish in some way.
- The third pattern was drawn from the mental model called “good tank” [19]. This mental model is characterized by adopting the perspective of the fish-tank system as a whole. In other words, all roles/purposes for elements focus on helping the fish-tank system in some way.
The first pattern describes an individual’s point-of-view of elements in a fish-tank system. This point-of-view sees elements through the lens that the role/purpose of each element is to enhance the observer’s experience with the system [19]. The second pattern describes an element’s point-of-view of other elements in a fish-tank system. This point-of-view sees elements through the lens that the role/purpose of each element is related to other elements in the system [19]. The third pattern describes the system’s point-of-view of elements in a fish-tank system. This point-of-view sees elements through the lens that the role/purpose of each element is related to the system as a whole [19]. Therefore, classifications to distinguish individualistic roles/purposes, from elementalistic roles/purposes, from systemic roles/purposes were needed to fully define roles/purposes in a fish-tank system.
Each of the three role/purpose classifications naturally align with one of the three systems thinking learning levels. An individualistic role/purpose resides at the sensibility level because this point-of-view only demonstrates an awareness that elements have a role or purpose, but this point-of-view is limited to the observer of the system. An elementalistic role/purpose resides at the literacy level because this point-of-view demonstrates knowledge about how a specific element’s role/purpose is related to other elements in the system, but this point-of-view is limited to the elements in the system. A systemic role/purpose resides at the capability level because this point-of-view demonstrates understanding about why a specific element exists in the system. The connections between the three patterns, the three classifications, and the three systems thinking learning levels are summarized in Table 5.
The classification structure could now be used to classify potential roles/purposes identified by students for a fish-tank system. The role/purpose classification flowchart used during the classification process is presented in Figure 6. While analyzing each drawing, roles/purposes were classified and recorded according to specific rules in preparation for the quantitative analysis. The rules used to classify and record roles/purposes are described in Table A5 in Appendix B.
3.2.4. Inter-Coder Agreement
An inter-coder agreement analysis was conducted for this research study to determine the extent to which two independent coders reached the same conclusions about the contents of the fish-tank system drawings using the qualitative methodology described in Section 3.2.1, Section 3.2.2 and Section 3.2.3 This type of analysis is widely considered as a critical component for research methodologies that employ a content analysis and without this analysis, any resultant data cannot be considered valid [46]. The index chosen to measure inter-coder agreement in this research study was Krippendorff’s Alpha because it accounts for chance agreements between coders and it is simple to calculate by hand using binary data from two coders with no missing data [47]. There is no established standard for the acceptable level of agreement for an inter-coder agreement analysis, but Neuendorf suggests that 90% or greater agreement “would be acceptable to all” and that 80% or greater agreement “would be acceptable in most situations” [48] (p. 145). Therefore, for this research study, the minimum acceptable level of agreement between both coders was set at 80% or greater.
The inter-coder agreement analysis was conducted in three parts with the same two independent coders. The first and second part of the analysis were conducted in order to refine the methodology and to achieve at least 80% overall agreement between the coders. The third part of the analysis was conducted with a random, representative sample of the data to ensure the refined methodology achieved at least the 80% overall agreement between the coders. The results from each part of the inter-coder agreement analysis are presented in Table 6 in terms of each drawing (Drawing A and Drawing B) and combined (A + B) for elements (E), interactions (I), roles/purposes (R), and totals (T).
The results for each part of the analysis indicate a clear distinction between Drawing A and Drawing B. Inter-coder agreement for Drawing A was always less than inter-coder agreement for Drawing B for elements. This result is likely due to the increase in labeled elements in Drawing B compared to Drawing A, meaning students used a written label to identify a drawn element instead of only drawing an element, which likely increased inter-coder agreement in those cases. Conversely, inter-coder agreement for Drawing A was always greater than inter-coder agreement for Drawing B for interactions and roles/purposes. This result was likely due to the significant difference in the number and complexity of potential interactions and roles/purposes that students drew in Drawing A compared to Drawing B. Students drew significantly less interactions and roles/purposes in Drawing A compared to Drawing B, meaning there were less opportunities for the coders to disagree for these two concepts, which may have increased inter-coder agreement for Drawing A.
The results also indicate that inter-coder agreement for interactions and roles/purposes for Drawing B only reached 76% to 80%, which barely met (or did not meet) the minimum acceptable agreement value of 80%. This result was likely due to how the worksheets used in the experiment were designed to allow for open-ended drawings, meaning students could draw, label, or describe interactions and roles/purposes in a fish-tank system in any way they wanted. Compared to elements, which were more limited in number, the potential number of possible interactions and roles/purposes that could be drawn by students were less bounded, which may have caused the inter-coder agreement to decrease for these two concepts.
Final coding for all drawings was conducted by the researchers. For the drawings included in part one and part two of the inter-coder agreement analysis, each drawing was re-coded by the researcher using the finalized methodology (presented in Section 3.2.1, Section 3.2.2 and Section 3.2.3). For the drawings included in part three of the inter-coder agreement analysis, each drawing was coded according to the results from the two independent coders with any disagreements between the two coders decided by the researchers according to the finalized methodology. The remaining drawings not included in the inter-coder agreement analysis were coded by the researchers according to the finalized methodology.
3.3. Quantitative Methods
The qualitative methods of the content analysis described in Section 3.2 resulted in recorded frequencies of elements, interactions, roles/purposes, and totals (i.e., the sum of elements, interactions, and roles/purposes) for Drawing A and Drawing B for each student. The quantitative methods of the content analysis were used to analyze the differences between the recorded frequencies between both drawings for each concept and student. The primary inferential statistical test chosen to conduct this analysis was the Wilcoxon signed ranks test, however a two-sample t-test was also used as a complementary test to provide additional perspective and analysis. An examination of the data revealed that the assumption of normality, for which the two-sample t-test relies upon [49], could not be accepted since the resultant p-values from normal probability plots were less than the chosen significance level (α) of 0.05. Therefore, the Wilcoxon signed ranks test was used to test the hypothesis that there was a statistically significant difference between the elements, interactions, roles/purposes, and totals identified by students in a fish-tank system drawing before and after students learned to apply the systems thinking concepts of distinctions, relationships, and perspectives as skills.
The Wilcoxon signed ranks test is a non-parametric statistical test used to draw inferences about differences in medians and means for situations where two samples can be paired [50]. This test begins with the calculation of the paired difference , where is defined as a sample from a systems thinking learning concept of interest for each i drawing [A,B,BA] and j student. The Wilcoxon signed ranks test, since it is a non-parametric test, does not assume an underlying population probability distribution. Instead, this test assumes that the distribution of paired differences is symmetric [50]. This assumption allows for inferences about the mean to be drawn because it coincides with the median in a symmetric distribution. Although the assumption of symmetry is not as strong as the assumption of normality for the two-sample t-test, this test is valid for situations where the underlying probability distribution is unknown or cannot be reasonably assumed as normal [50].
The test statistic for this test was calculated by determining ranks from the paired differences of (). Paired differences equal to zero (for the case when or ) were omitted from the calculation of the test statistic. Ranks were assigned to the remaining from 1 to (where = the number of pairs remaining after omitting the pairs equal to 0) based on the magnitude of the absolute differences . The rank of 1 was assigned to the pair with the smallest absolute difference and the rank of was assigned to the pair with the largest absolute difference. If any ties occurred between pairs (i.e., two or more pairs had the same absolute difference), then according to Conover, “assign to each of these pairs the average of the ranks that would have otherwise been assigned” [50] (pp. 352,353). For example, if the ranks of 10, 11, and 12 were to be assigned to three tied pairs, then each pair was assigned the average rank of . Once the ranking of each pair was complete, was used to denote either the rank assigned to () if (i.e., a positive difference) or the negative of the rank assigned to () if (i.e., a negative difference). Since the sample size > 50 for this research study, the normal approximation was used to calculate the test statistic T [50]:
To test whether the difference in medians and means between Drawing A and Drawing B were equal to zero, the two-sided null and alternative hypotheses were stated in terms of the expected value of the paired difference (d) as: and . was rejected for a specific significance level α if, where z was determined from a cumulative standard normal distribution. If was rejected, there was evidence to show that the expected value for the difference in medians and means between the two drawings was not equal to zero (i.e., the medians and means of the two drawings were different), meaning that one-sided hypothesis tests needed to be conducted to determine whether the median and mean of Drawing A or Drawing B was greater.
The null and alternative hypotheses for the one-sided test to determine whether the difference in medians and means were less than zero (or the left-tailed test) were stated as: and where was rejected for a specific significance level α if . If was rejected, there was evidence to show that the expected value for the difference in medians and means were less than zero (i.e., the median and mean of Drawing A was greater than the median and mean of Drawing B). Alternatively, the null and alternative hypotheses for the one-sided test to determine whether the difference in medians and means were greater than zero (or the right-tailed test) were stated as: and where was rejected for a specific significance level α if . If was rejected, there was evidence to show that the expected value for the difference in medians and means were greater than zero (i.e., the median and mean of Drawing B was greater than the median and mean of Drawing A).
4. Results
In this section, the results of the experiment are presented for elements (E), interactions (I), roles/purposes (R), and totals (T) (i.e., the sum of elements, interactions, and roles/purposes). The results are based on the analysis of fish-tank system drawings from ninety-seven (97) middle and high school students who provided assent to include their drawings in this research study. An additional fifty (50) students participated in the experiment, however, the fish-tank system drawings from those students were not included in the analysis because those students either did not complete both Drawing A and Drawing B of a fish-tank system or did not provide assent.
The sample statistics for elements, interactions, roles/purposes, and totals are presented in terms of the average number and the median number identified by all students for Drawing A, B, and B—A for each of the three systems thinking learning levels—[S] = sensibility, [L] = literacy, and [C] = capability—and for the totals [T] (i.e., the sum of all three learning levels). Additionally, the average score and median score for all students for Drawing A, B, and B—A are presented for the totals [T]. An element, interaction, or role/purpose classified at either the sensibility, literacy, or capability level was given a score of 1, 2, or 3 respectively.
The results of the Wilcoxon signed ranks test analysis for elements, interactions, roles/purposes, and totals are presented in terms of the methodology presented in Section 3.3. A two-tailed test was conducted first to determine whether the median and mean of the paired differences (d) between Drawing A and Drawing B for number and score for each concept were statistically different. If the null hypothesis for the two-tailed test was rejected, meaning there was statistical evidence to conclude that there was a significant difference between Drawing A and Drawing B, then both a left-tailed and a right-tailed test were conducted to determine whether the median and mean of the paired differences between Drawing A and Drawing B for number and score for each concept were greater for Drawing A or Drawing B.
4.1. Distinctions (Elements) Results
The sample statistics for the analysis of elements are presented in Table 7. During the analysis, eleven (11) additional, relevant elements drawn by students for a fish-tank system were identified, classified, and recorded according to the methodology described in Section 3.2.1. These eleven (11) additional elements are presented in Table A2 in Appendix A.
The result of the Wilcoxon signed ranks test analysis for elements is presented in Table 8.
Since for the two-tailed test with a p-value < 0.001 at a significance level (α) of 0.05, there was statistical evidence to conclude that the median and the mean of the paired differences between Drawing A and Drawing B for the number and the score for elements identified by students were not equal to zero (i.e., the number and the score for elements in Drawing A and Drawing B were different). Additionally, since for the left-tailed test with a p-value > 0.999 and since for the right-tailed test with a p-value < 0.001 at a significant level (α) of 0.05, there was statistical evidence to conclude that the median and the mean of the paired differences between Drawing A and Drawing B for the number and the score for elements identified by students were greater than zero (i.e., the number and the score for elements in Drawing B were greater than Drawing A).
4.2. Relationships (Interactions) Results
The sample statistics for the analysis of interactions are presented in Table 9.
The result of the Wilcoxon signed ranks test analysis for interactions is presented in Table 10.
Since for the two-tailed test with a p-value < 0.001 at a significance level (α) of 0.05, there was statistical evidence to conclude that the median and the mean of the paired differences between Drawing A and Drawing B for the number and the score for interactions identified by students were not equal to zero (i.e., the number and the score for interactions in Drawing A and Drawing B were different). Additionally, since for the left-tailed test with a p-value > 0.999 and since for the right-tailed test with a p-value < 0.001 at a significant level (α) of 0.05, there was statistical evidence to conclude that the median and the mean of the paired differences between Drawing A and Drawing B for the number and the score for interactions identified by students were greater than zero (i.e., the number and the score for interactions in Drawing B were greater than Drawing A).
4.3. Perspectives (Roles/Purposes) Results
The sample statistics for the analysis of roles/purposes are presented in Table 11.
The result of the Wilcoxon signed ranks test analysis for roles/purposes is presented in Table 12.
Since for the two-tailed test with a p-value < 0.001 at a significance level (α) of 0.05, there was statistical evidence to conclude that the median and the mean of the paired differences between Drawing A and Drawing B for the number and the score for roles/purposes identified by students were not equal to zero (i.e., the number and the score for roles/purposes in Drawing A and Drawing B were different). Additionally, since for the left-tailed test with a p-value > 0.999 and since for the right-tailed test with a p-value < 0.001 at a significant level (α) of 0.05, there was statistical evidence to conclude that the median and the mean of the paired differences between Drawing A and Drawing B for the number and the score for roles/purposes identified by students were greater than zero (i.e., the number and the score for roles/purposes in Drawing B were greater than Drawing A).
4.4. Totals Results
The sample statistics for the analysis of totals are presented in Table 13.
The result of the Wilcoxon signed ranks test analysis for totals is presented in Table 14.
Since for the two-tailed test with a p-value < 0.001 at a significance level (α) of 0.05, there was statistical evidence to conclude that the median and the mean of the paired differences between Drawing A and Drawing B for the number and the score for total elements, interactions, and roles/purposes identified by students were not equal to zero (i.e., the number and the score for totals in Drawing A and Drawing B were different). Additionally, since for the left-tailed test with a p-value > 0.999 and since for the right-tailed test with a p-value < 0.001 at a significant level (α) of 0.05, there was statistical evidence to conclude that the median and the mean of the paired differences between Drawing A and Drawing B for the number and the score for total elements, interactions, and roles/purposes identified by students were greater than zero (i.e., the number and the score for totals in Drawing B were greater than Drawing A).
5. Discussion
The purpose of this research study was to define and measure the initial systems thinking learning process for non-experts to support future systems thinking curriculum development by and for non-experts, and to contribute to the growth of systems literacy in K-12 education. The systems thinking learning process was defined and described in Section 2.6 using the systems thinking learning model [40] (see Figure 3). The model was used to define the systems thinking learning process in terms of three phases (Initial Learning, Rapid Learning, and Mastery Learning) each consisting of three repeated systems thinking learning levels (sensibility, literacy, and capability). Therefore, systems thinking learning can be measured for each phase as the combination of learning for all three levels. The initial systems thinking learning process was measured in this research study during an experiment conducted with ninety-seven (97) middle and high school students who were taught to apply the three systems thinking concepts of distinctions, relationships, and perspectives as skills while drawing a fish-tank system. The methodology presented in Section 3 was used to measure systems thinking learning in the context of a fish-tank system in terms of the skill of identifying elements (for the concept of distinctions), the skill of identifying interactions (for the concept of relationships), and the skill of identifying roles/purposes (for the concept of perspectives). The totals (or sum) of elements, interactions, and roles/purposes were used to measure each student’s overall improvement in systems thinking learning as a result of the experiment. The research findings, exploratory results and analysis, and future research needs are presented in this section.
5.1. Research Findings
The results from this research study provide evidence to support the hypothesis that there is a statistically significant difference between the elements, interactions, roles/purposes, and totals identified by non-experts in a fish-tank system drawing before (Drawing A) and after (Drawing B) students learn to apply the three systems thinking concepts of distinctions, relationships, and perspectives as the skills of identifying elements, interactions, and roles/purposes respectively. The results also provide evidence to conclude that the number and score for elements, interactions, roles/purposes, and totals identified by non-experts are greater in Drawing B than in Drawing A. Hence, the evidence supports the finding that student learning of systems thinking increased when students were taught to apply the systems thinking concepts of DSRP [21] as skills.
The key findings from this research study show that students identified an average of two to three (2–3) more elements, one to two (1–2) more interactions, two (2) more roles/purposes, and six (6) more total elements, interactions, and roles/purposes in Drawing B than in Drawing A. Additionally, students scored an average of five (5) points higher for elements, two to three (2–3) points higher for interactions, three (3) points higher for roles/purposes, and ten to twelve (10–12) points higher for total elements, interactions, and roles/purposes in Drawing B than in Drawing A. The most significant area of improvement for students with regards to systems thinking learning as a result of the experiment was at the literacy level. Students identified an average of four (4) more total elements, interactions, and roles/purposes at the literacy level in Drawing B than in Drawing A. This means that students demonstrated sufficient knowledge about the systems thinking concepts, however understanding about the concepts was insufficient. Therefore, future learning opportunities should focus on student understanding of the systems thinking concepts as a way to foster learning at the capability level.
Additional analyses were conducted to determine whether there were significant differences between groups, between instructors, and between middle school (MS) and high school (HS) students. The analyses for the differences between groups and between instructors were conducted using an analysis of variance (ANOVA) test [49]. The results of these tests provided statistical evidence to conclude that the only significant difference between groups was in regard to the paired differences for elements. This means that the variability between groups for elements identified by students between Drawing A and Drawing B was greater than the variability between groups for interactions, roles/purposes, and totals. Additionally, the results provided statistical evidence to conclude that there were no significant differences between instructors for the average paired difference in element, interaction, role/purpose, or total scores for each group. This means that the average scores for each group were not significantly affected by the different instructors.
The analysis for the differences between MS and HS students was conducted using a two-sample t-test [49]. The results of this test provided evidence to conclude that both MS and HS students improved statistically the same with regard to systems thinking learning from Drawing A to Drawing B. HS students did score higher overall than MS students likely because HS students can recall more information and knowledge about the elements, interactions, and roles/purposes in a fish-tank system. However, age and experience did not necessarily mean that HS students were better systems thinkers than MS students. This means that the method to measure systems thinking learning in the context of a fish-tank system was acceptable for both MS and HS students.
5.2. Systems Thinking Learning
In an effort to connect the results and findings from this research study with the systems thinking learning model [40] presented in Section 2.6 (see Figure 3), a method was developed to visually represent each student’s initial systems thinking learning as a result of the experiment. An example of this visual representation is shown in Figure 7 for student j = 11. The x-axis of the figure is time, which represents the three systems thinking learning levels (sensibility, literacy, and capability) for each drawing [A, B]. The y-axis of the figure is performance in terms of systems thinking learning, which has been normalized as the percent of the total number of elements, interactions, and roles/purposes that a student identified. For example, suppose that a student identified ten (10) total elements, interactions, and roles/purposes across all three levels for Drawing A. If three (3) of those items identified were at the sensibility level, then the number of items for sensibility was divided by the total number of items to get a normalized 30.00%. This process was repeated for the other two levels in order to plot three points on the model connected by lines to represent the student’s learning relative to each systems thinking level. The entire process was repeated to plot a line for Drawing B in order to draw comparisons between the two drawings. A similar process was also used to plot the two vertical bars shown for each learning level and drawing. However, these bars represent the average percent of the total number of elements, interactions, and roles/purposes identified by all students (the non-shaded bar on the left) and the median percent of the total number of elements, interactions, and roles/purposes identified by all students (the shaded bar on the right).
Based on Figure 7, it can be concluded that student j = 11 demonstrated significant improvement in their systems thinking learning at the literacy level indicated by the 44.02% increase from Drawing A to Drawing B. In Drawing A, this student predominantly identified items at a sensibility level and in Drawing B this student demonstrated more balanced learning between sensibility and literacy. From this visual representation it can also be concluded that this student is able to think at the literacy level of systems thinking learning, but that they need help to begin developing their thinking at the capability level which was lacking for both drawings. Once the lines reach a horizontal state, this would represent a balanced combination of each systems thinking learning level. A horizontal or positively sloped line would indicate that a student is thinking more at the literacy and capability levels and might be ready to move into rapid learning, which is the next phase of the systems thinking learning process.
5.3. Expected Learning and Systems Thinking Learning
One of the limitations for this research study was that no control group could be included in the design of the experiment since the students who participated in the experiment were part of a pre-existing event and expected to learn about systems thinking. The lack of a control group limited the separation of the results into expected learning (EL), attributable to the repeated task of drawing a fish-tank system, and systems thinking learning (STL), attributable to teaching students about the systems thinking concepts. In this section, a brief sensitivity analysis was conducted to examine the potential effects of EL upon the results presented in Section 4.
For the purpose of this analysis, it was assumed that from Drawing A to Drawing B, students should have identified at least the same elements, interactions, and roles/purposes (i.e., Drawing A and Drawing B are identical). Therefore, a student who drew identical drawings for Drawing A and Drawing B would have zero learning attributable to EL and zero learning attributable to STL. Furthermore, it was assumed that from Drawing A to Drawing B, students should have identified at least as many elements, interactions, and roles/purposes to the point where their results became statistically significant (i.e., when the test statistic was equal to the critical value, which is referred to as the “threshold” in this analysis). Therefore, a student who performed the repeated task of drawing a fish-tank system without learning about systems thinking would have had all learning attributable to EL and zero learning attributable to STL. As the results were presented in Section 4., all learning was attributed to STL since no control group was used to measure the effect of EL. Therefore, this analysis examined the necessary reduction in the results for Drawing B for element, interaction, role/purpose, and total scores in order to reach the point between significance and non-significance (i.e., the threshold) for a one-tailed (left-tailed) two-sample t-test. This test was used to complement the Wilcoxon signed ranks test and both tests provided evidence to conclude that Drawing B was greater than Drawing A for elements, interactions, roles/purposes, and totals.
The results of this analysis are presented in Table 15. The first (1) and second (2) columns of the table show the percentage of learning that was attributable to both EL and STL for each concept. STL equals the percent that the Drawing B score was reduced by for each concept to reach the threshold. Using the score for elements as an example, this means that EL attributed for 70.11% of student learning from Drawing A to Drawing B during the experiment and that STL attributed for 29.89% of student learning from Drawing A to Drawing B. Therefore, for elements, it can be concluded that student learning with respect to elements was affected more by the repeated task of drawing a fish-tank system (EL) than by learning to apply the systems thinking concept of distinctions as the skill of identifying elements (STL). For interactions and roles/purposes, however, the opposite can be concluded. Student learning with respect to interactions and roles/purposes was affected more by learning to apply the systems thinking concepts of relationships and perspectives as the skills of identifying interactions and roles/purposes respectively (STL) than by the repeated task of drawing a fish-tank system (EL). For totals, it can be concluded that overall student learning during the experiment was affected equally by EL (50.55%) and STL (49.45%).
The third (3) column in Table 15 shows the score threshold for each concept, which is the point at which the results become significant or non-significant. Using elements as an example again, this means that EL accounted for the identification of up to four (4) more elements by students from Drawing A to Drawing B during the experiment. Furthermore, this means that STL accounted for the identification of more than four (4) elements (i.e., five (5) or greater) by students from Drawing A to Drawing B. The fourth (4) column in Table 15 shows the number (and percent) of students who scored greater than the threshold for each concept. The fifth (5) and sixth (6) columns in Table 15 show the average score percentage for EL and STL respectively. These percentages represent the average student’s score composition in terms of EL and STL. For example, for elements, the average student’s score was composed of 68.41% EL and 31.59% STL, while for roles/purposes, the average student’s score was composed of 30.32% EL and 69.68% STL. These last three columns lead to the conclusion that student learning of elements and of totals was less affected by learning the systems thinking concepts, while student learning of interactions and roles/purposes was more affected by learning the systems thinking concepts. These conclusions mean that systems thinking helped students improve their scores more than if they had not learned about the concepts, but systems thinking helps improve student learning with regards to interactions and roles/purposes more than elements.
5.4. Future Research Needs
Due to the exploratory design of this research study, future research needs to focus on developing the ideas and results presented herein. This research study only begins to analyze the systems thinking learning process by defining and measuring the initial learning phase for non-experts in the context of a fish-tank system. Future research efforts should focus on replicating the results of this research with different K-12 student populations (and even with other populations of people in the greater society) and with other example systems to build upon the methodology presented herein. Future research is also needed to expand the definitions and measurements of systems thinking learning to the next two phases proposed in this research study as rapid learning and mastery learning. Another factor to consider during future research on systems thinking learning is systems thinking teaching, including professional development for teachers on systems thinking concepts, which also plays a key role in effectively fostering systems literacy.
Additionally, this research did not attempt to measure whether students retained the learning they had gained as a result of the experiment. The reinforcement of systems thinking learning throughout a student’s educational journey is arguably more important than creating initial awareness about systems thinking concepts. Therefore, future research in this area should also focus on measuring systems thinking learning over longer periods of time to determine how to retain and reinforce systems thinking learning in education. All of the future research endeavors described here will continue to support the greater objective of growth in systems literacy and systems thinking education and will continue challenging the ways in which people think about the world and the problems facing it.
Author Contributions
Conceptualization, S.T. and J.C.-A.; Data curation, S.T.; Formal analysis, S.T.; Investigation, S.T.; Methodology, S.T.; Project administration, J.C.-A. and J.W.; Resources, J.W.; Supervision, J.C.-A.; Validation, S.T.; Visualization, S.T.; Writing—Original draft, S.T.; Writing—Review & editing, J.C.-A. and J.W. All authors have read and agreed to the published version of the manuscript.
Funding
This research study received no external funding.
Acknowledgments
The authors would like to thank the students, teachers, and staff at the SMILE Program for their help and willingness to learn about systems thinking. The authors would also like to thank the two independent coders for their time and effort to improve and validate the methodology for this research study.
Conflicts of Interest
The authors declare no conflict of interest.
Appendix A
The classifications for the forty-nine (49) elements that were defined for a fish-tank system prior to analyzing the data are presented in Table A1. The columns are: (1) Element Name (alphabetical); (2) Concrete or Conceptual; (3) Internal or External; (4) Essential; (5) Underlying Problem; (6) Sub-System; (7) Essential, Secondary, or Advanced; (8) Systems Thinking Learning Level Classification.

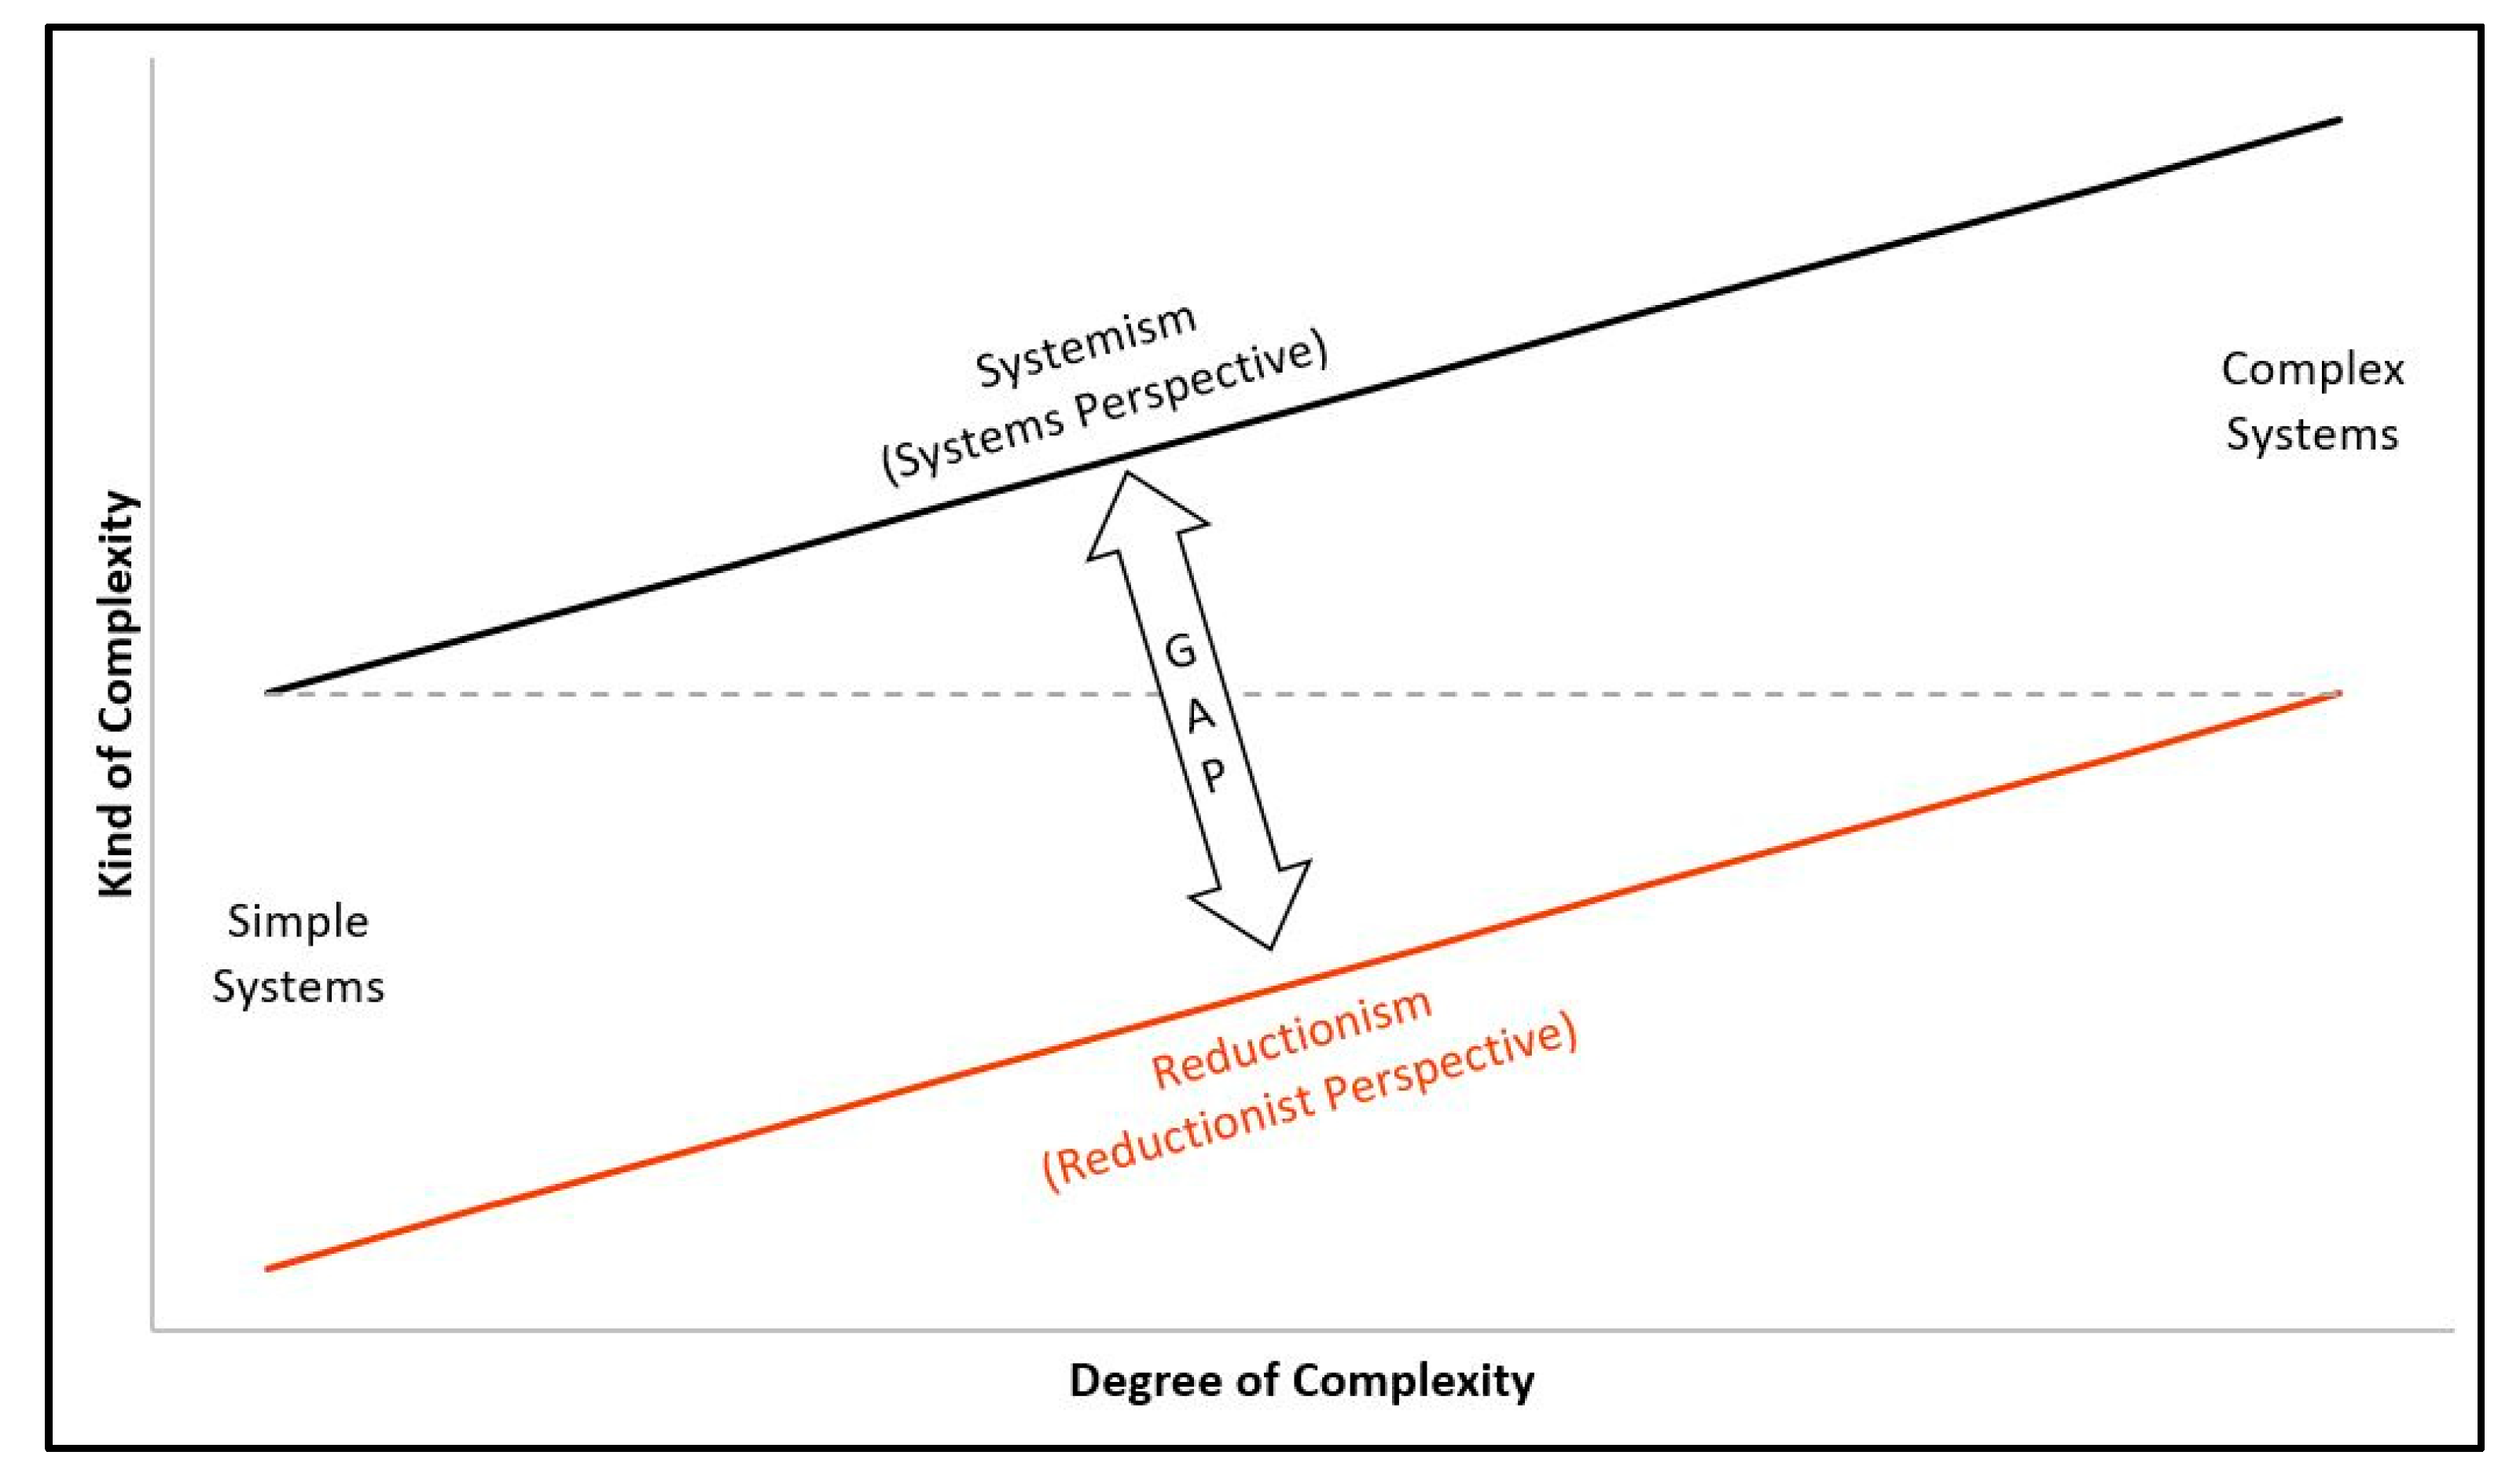
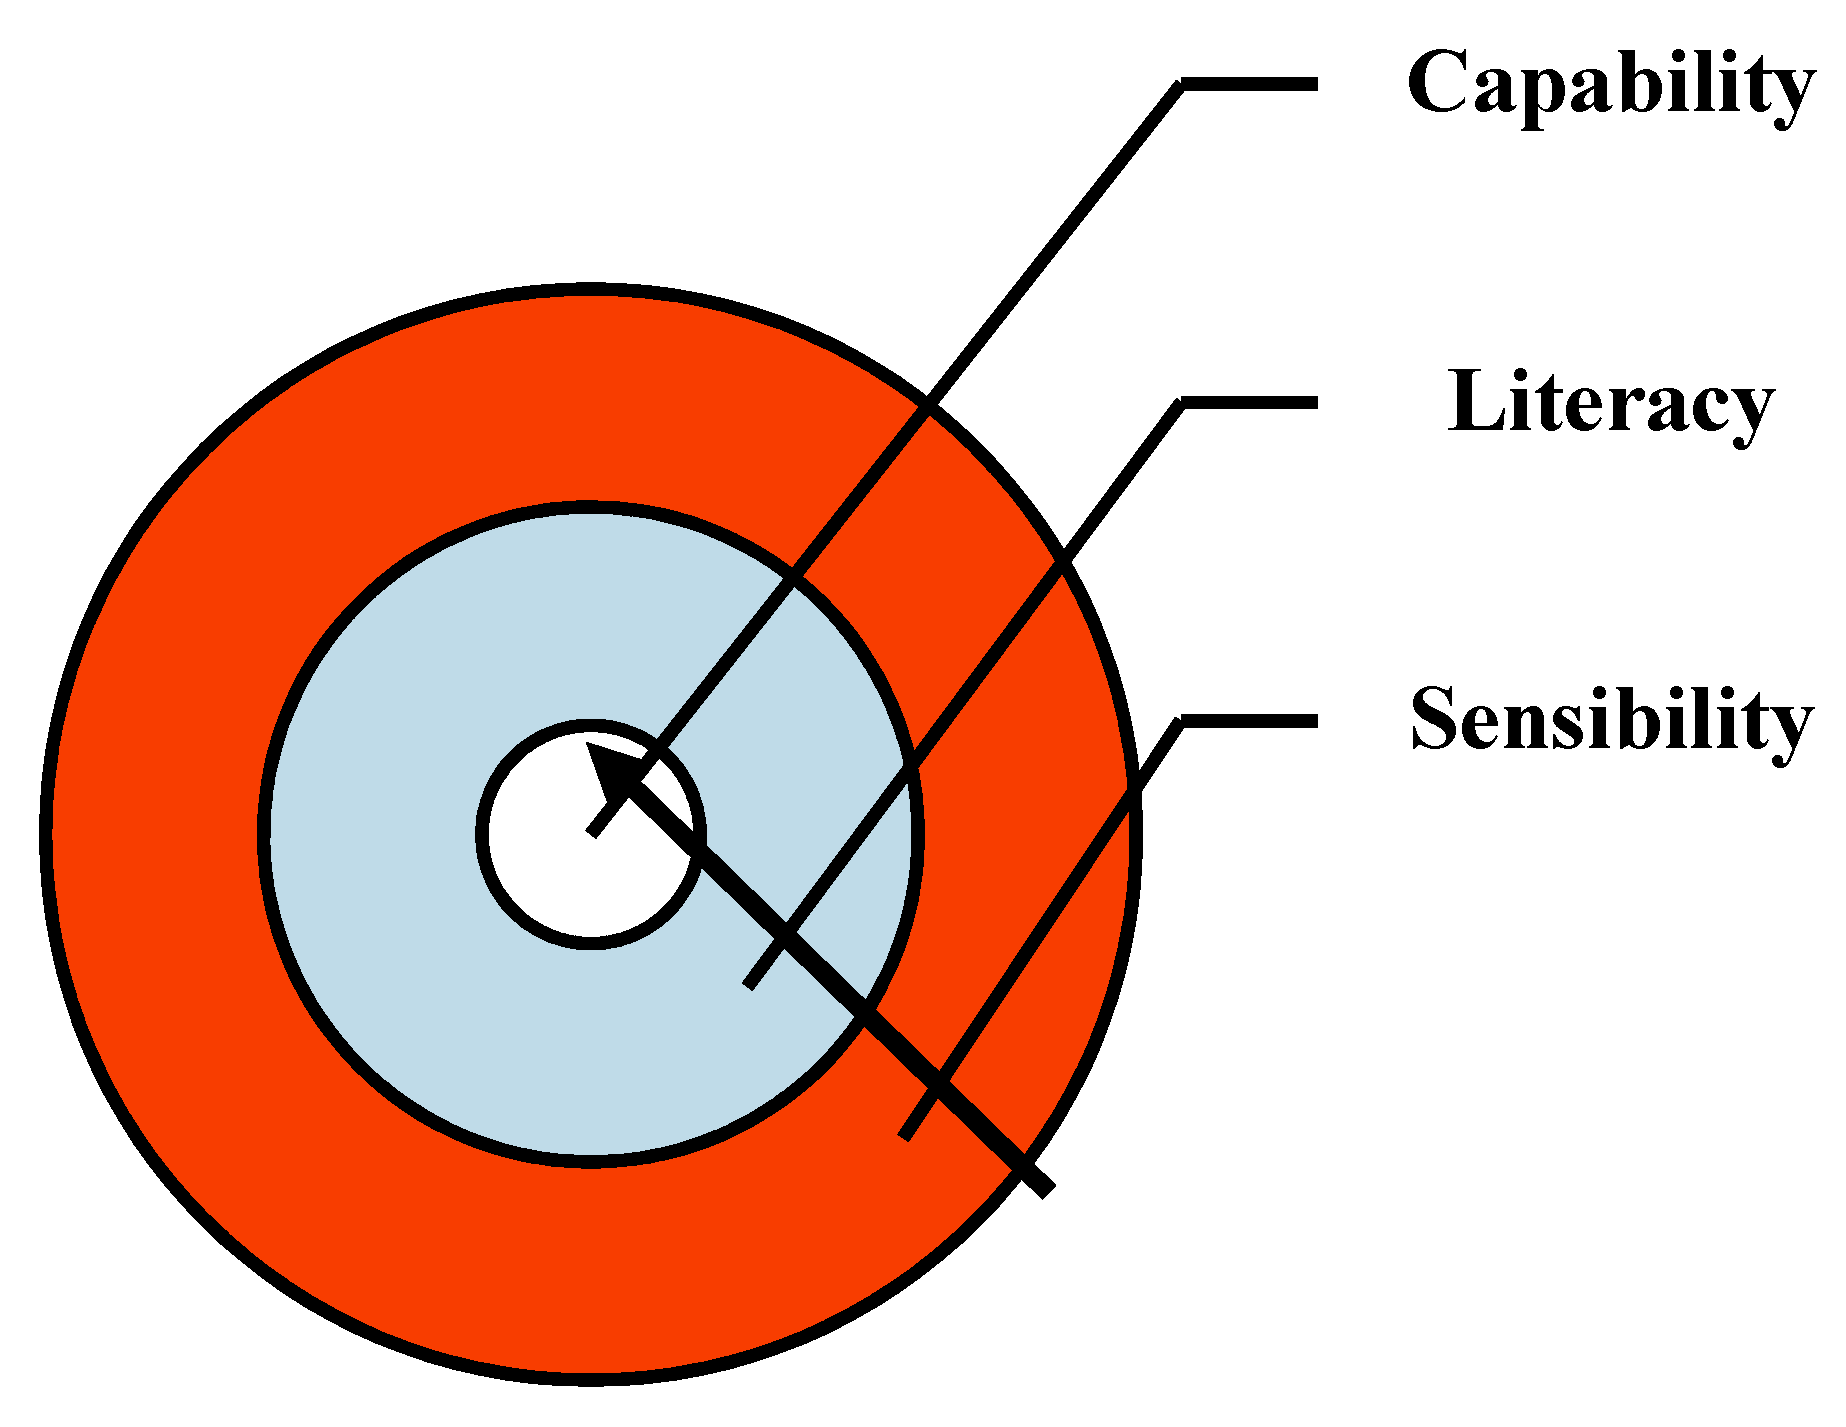
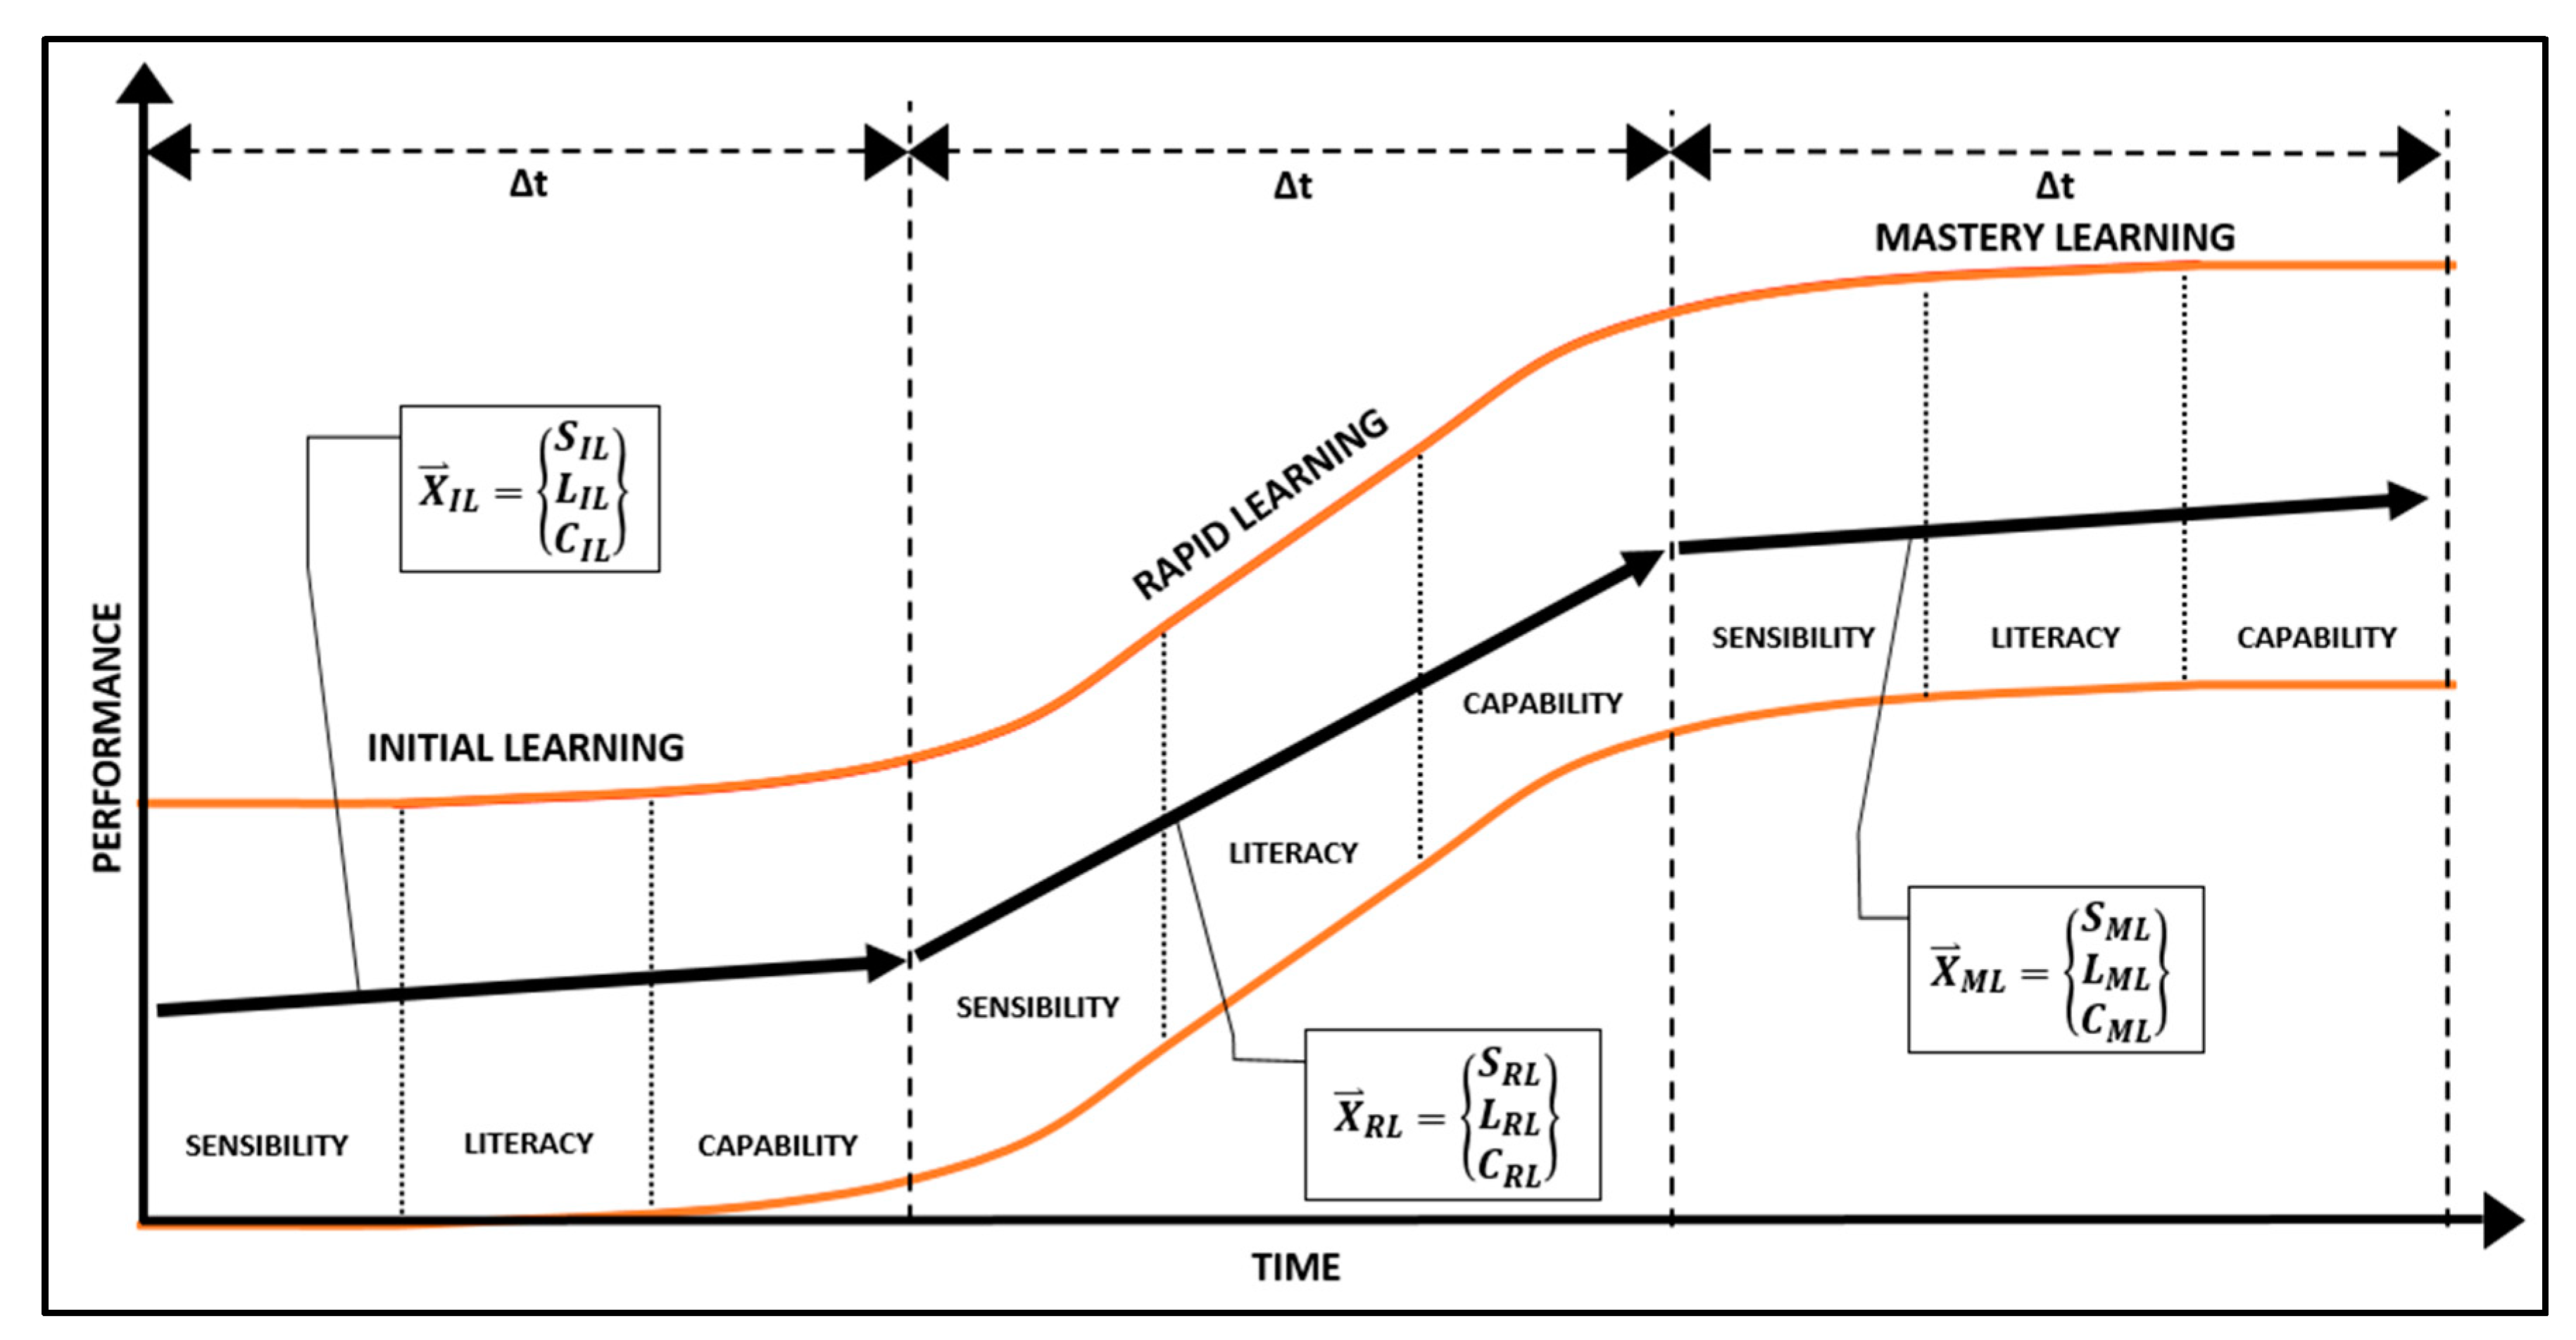
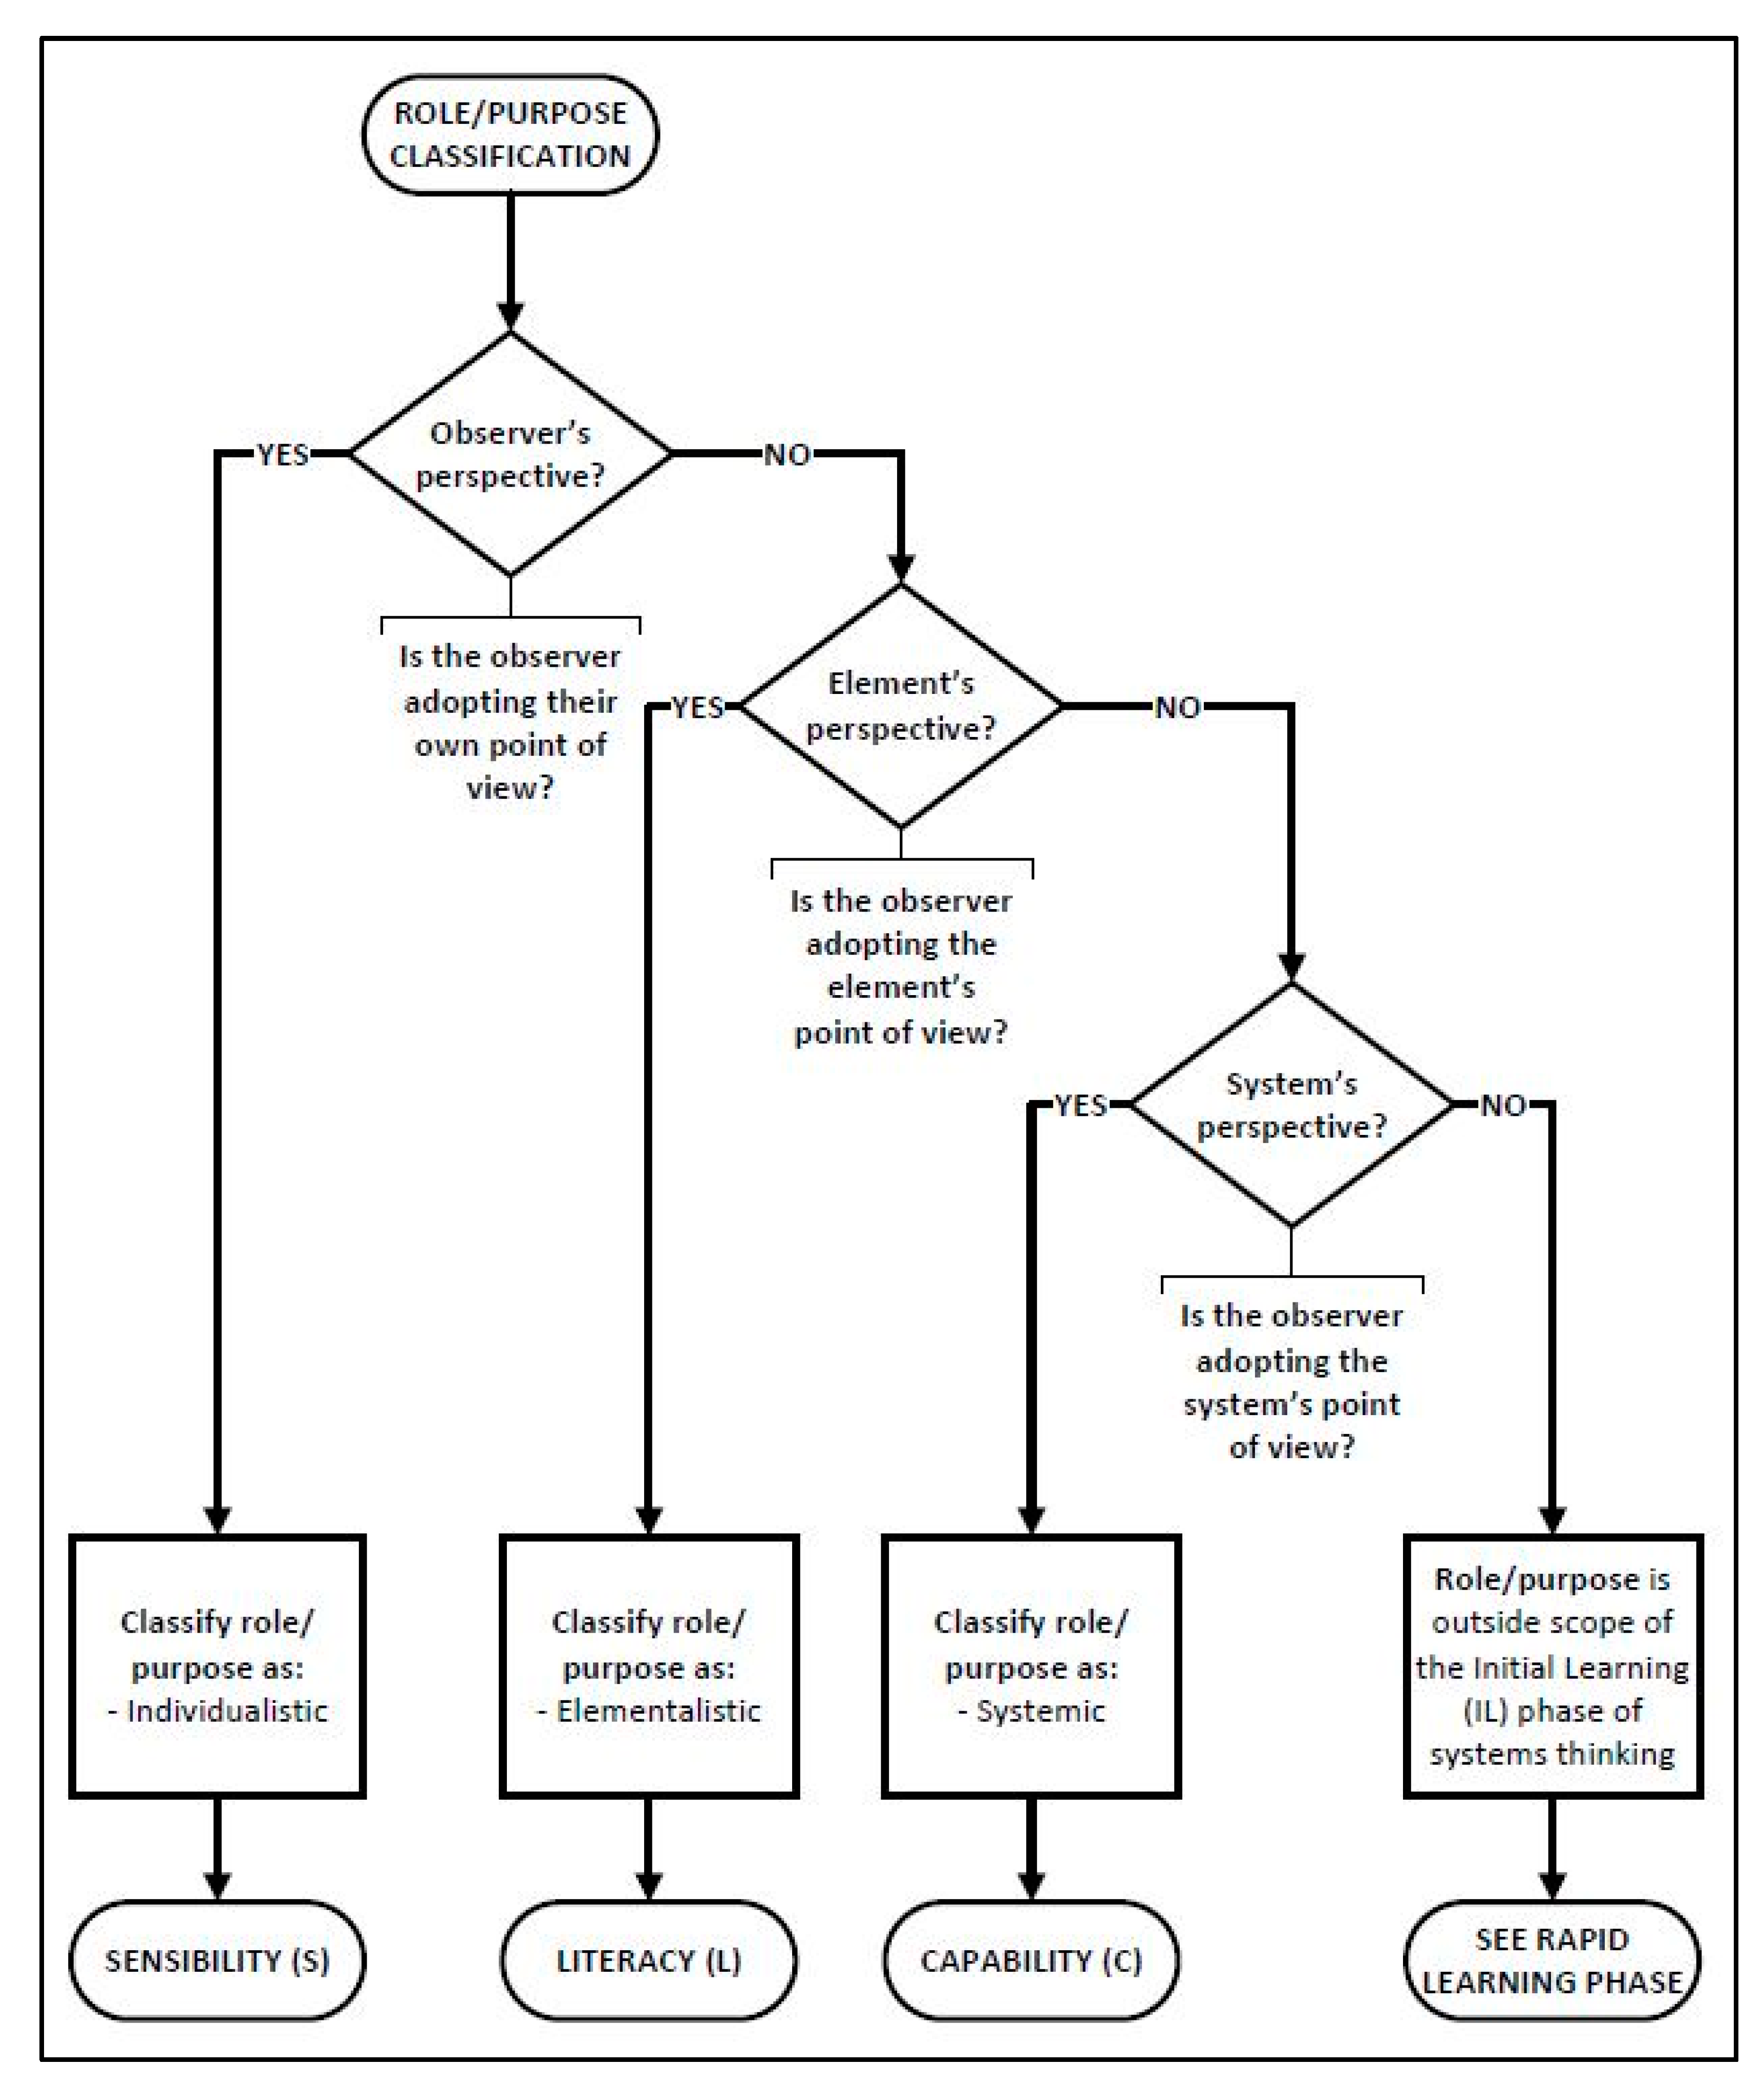
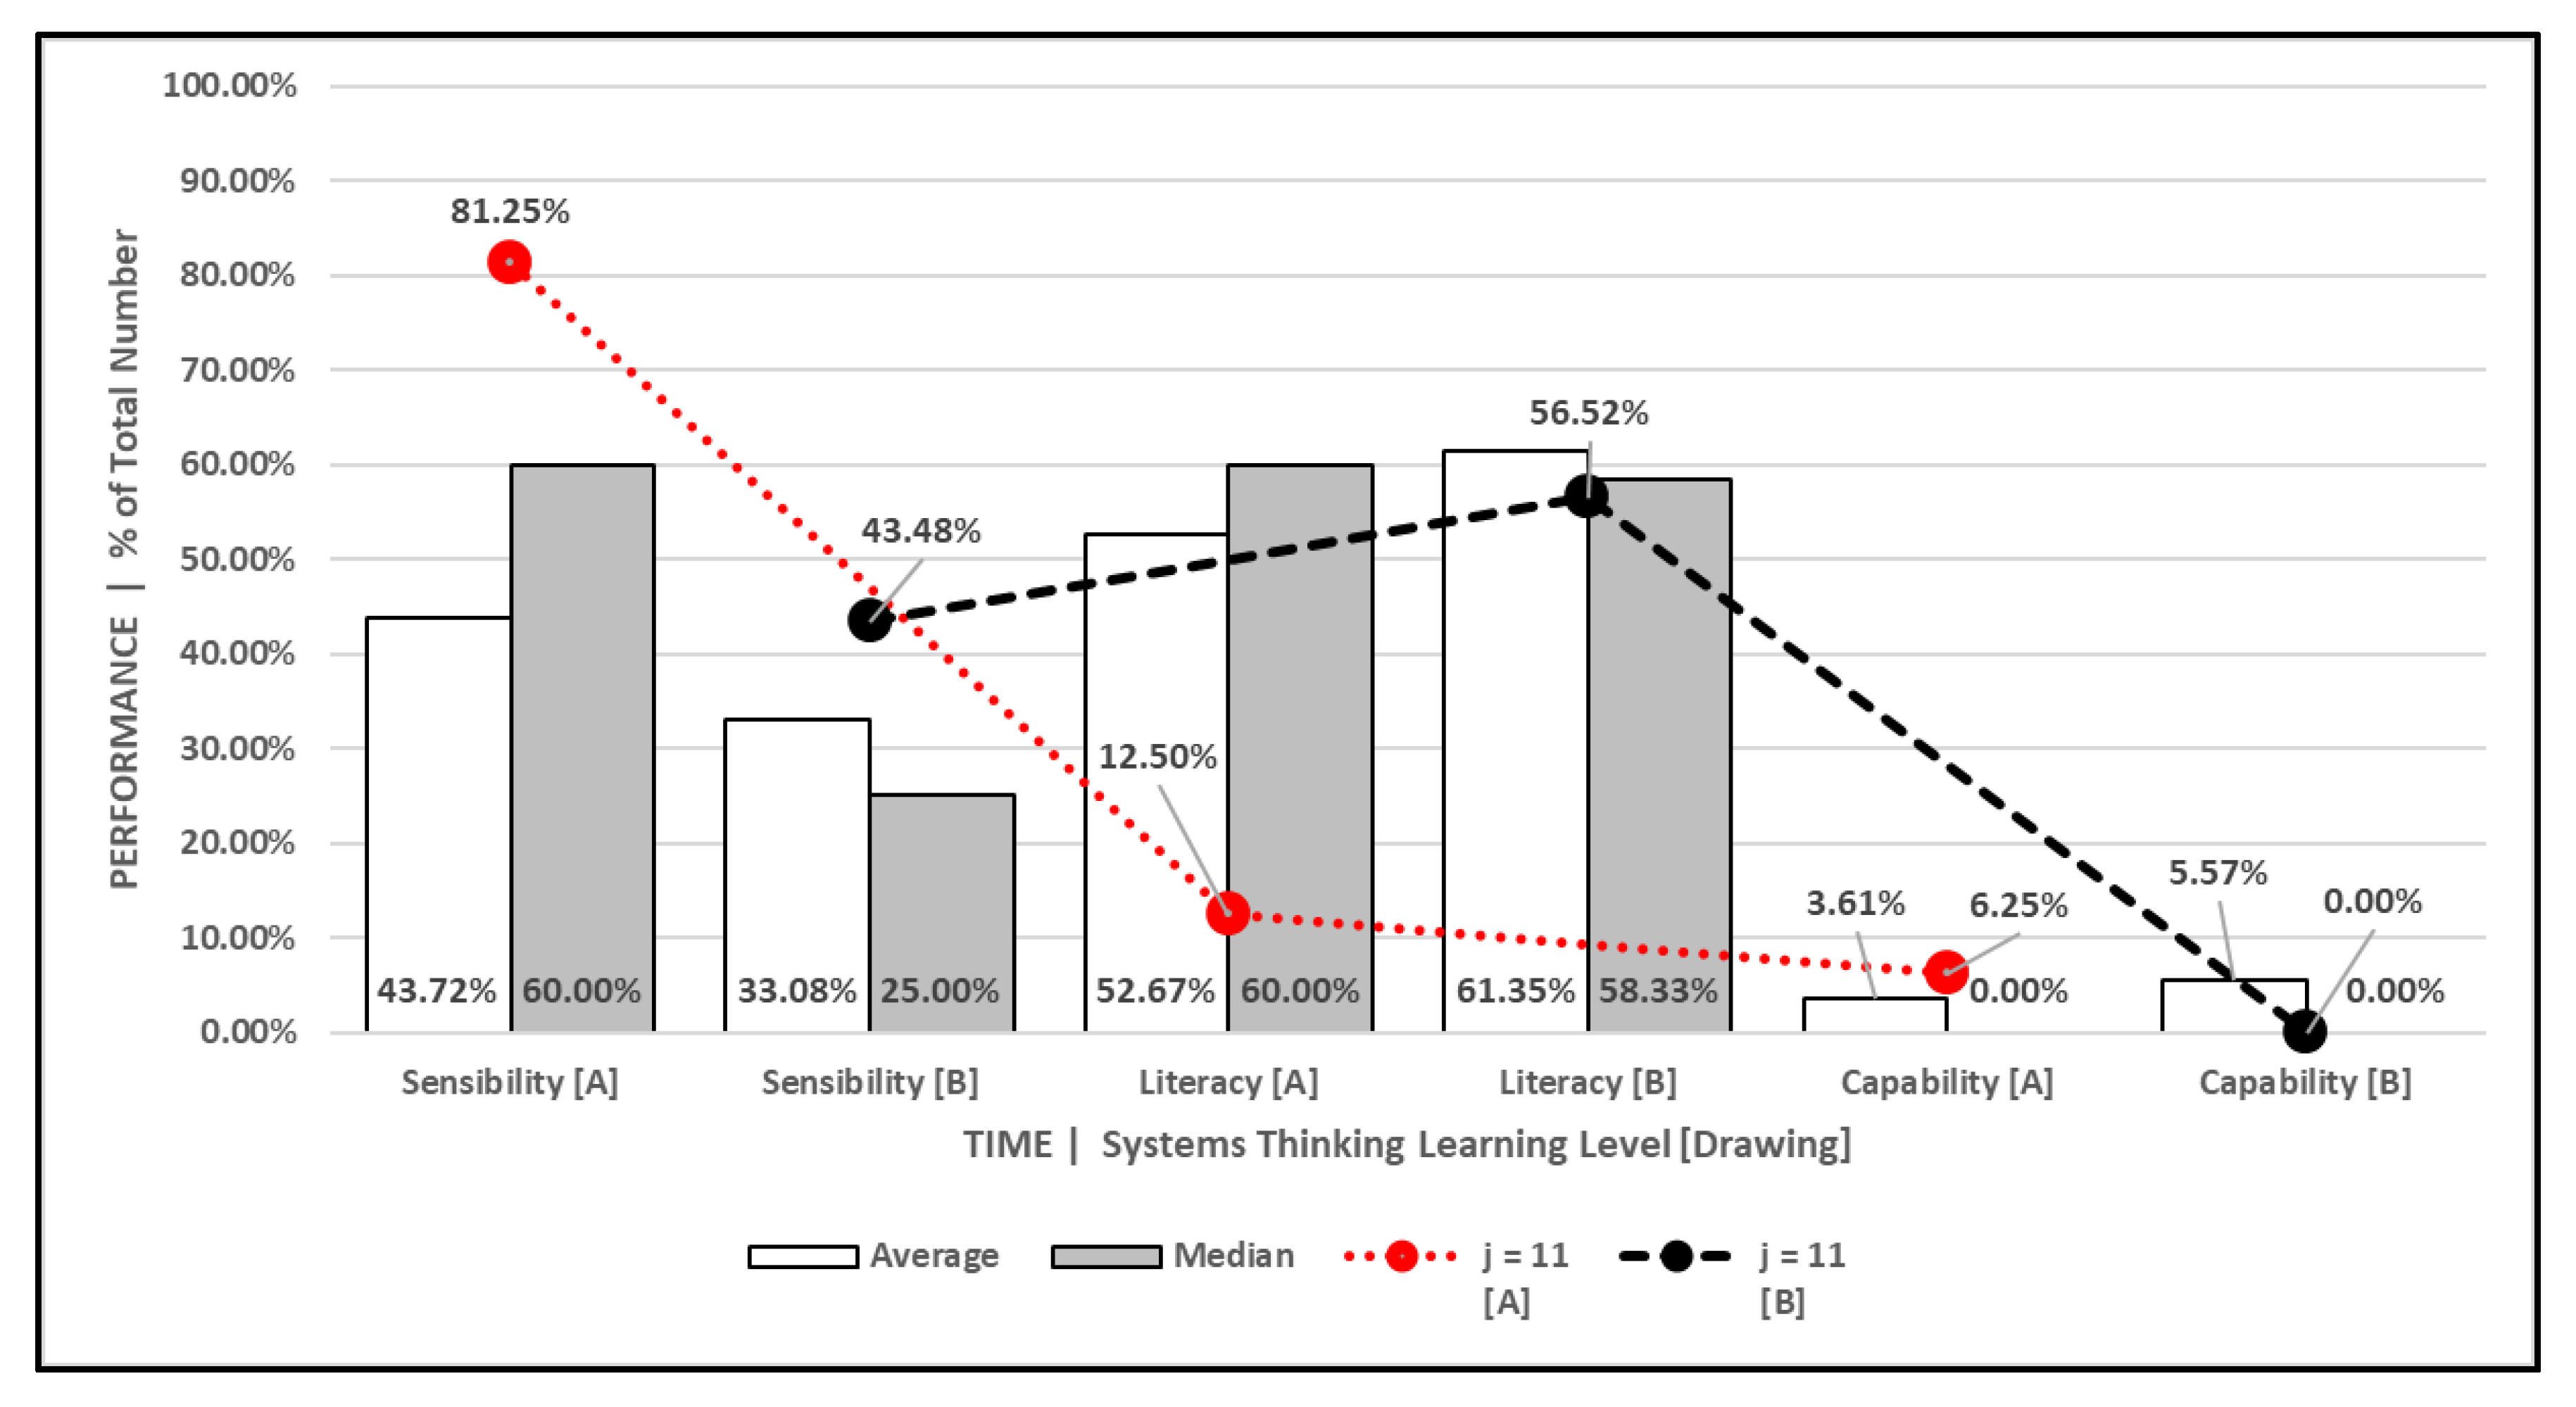
Table A1.
Fish-tank system element classifications.
| (1) | (2) | (3) | (4) | (5) | (6) | (7) | (8) |
|---|---|---|---|---|---|---|---|
| Air and/or Bubbles | Concrete | Internal | No | No | No | Secondary | Literacy |
| Air or Water Pump | Concrete | Internal | No | No | No | Secondary | Literacy |
| Algae | Concrete | Internal | No | No | No | Secondary | Literacy |
| Ammonia (NH3) | Conceptual | Internal | No | No | No | Advanced | Capability |
| Bacteria | Conceptual | Internal | No | No | No | Advanced | Capability |
| Bio-filter | Concrete | Internal | No | No | No | Secondary | Literacy |
| Broken/Dirty Filter | Concrete | Internal | No | Yes | No | Advanced | Capability |
| Carbon Dioxide (CO2) | Conceptual | Internal | No | No | No | Advanced | Capability |
| Coral | Concrete | Internal | No | No | No | Secondary | Literacy |
| Dead Organisms | Concrete | Internal | No | Yes | No | Advanced | Capability |
| Denitrifying Bacteria | Conceptual | Internal | No | No | No | Advanced | Capability |
| Dirt, Dust, and Debris | Concrete | Internal | No | No | No | Secondary | Literacy |
| Electricity | Conceptual | External | No | No | No | Advanced | Capability |
| Excess Fish Waste Products | Concrete | Internal | No | Yes | No | Advanced | Capability |
| Filter | Concrete | Internal | No | No | No | Secondary | Literacy |
| Filter Feeder Fish | Concrete | Internal | No | No | No | Secondary | Literacy |
| Filtration System | Concrete | Internal | No | No | Yes | Advanced | Capability |
| Fish | Concrete | Internal | Yes | No | No | Essential | Sensibility |
| Fish Food | Concrete | Internal | No | No | No | Secondary | Literacy |
| Fish Net | Concrete | External | No | No | No | Secondary | Literacy |
| Fish Waste | Concrete | Internal | No | No | No | Secondary | Literacy |
| Free Nitrogen Gas (N2) | Conceptual | Internal | No | No | No | Advanced | Capability |
| Fungi | Conceptual | Internal | No | No | No | Advanced | Capability |
| Green Water | Concrete | Internal | No | No | No | Secondary | Literacy |
| Heater | Concrete | Internal | No | No | No | Secondary | Literacy |
| Human | Concrete | External | No | No | No | Secondary | Literacy |
| Impeller | Concrete | Internal | No | No | No | Secondary | Literacy |
| Lighting/Lights | Concrete | External | No | Yes | No | Advanced | Capability |
| Nitrate (NO3-) | Conceptual | Internal | No | No | No | Advanced | Capability |
| Nitrate Bacteria | Conceptual | Internal | No | No | No | Advanced | Capability |
| Nitrite (NO2-) | Conceptual | Internal | No | No | No | Advanced | Capability |
| Nitrite Bacteria | Conceptual | Internal | No | No | No | Advanced | Capability |
| Oxygen (O2) | Conceptual | Internal | No | No | No | Advanced | Capability |
| Ornaments/Decorations | Concrete | Internal | No | No | No | Secondary | Literacy |
| Other Animals | Concrete | Internal | No | No | No | Secondary | Literacy |
| Plant Fragments | Concrete | Internal | No | No | No | Secondary | Literacy |
| Plants | Concrete | Internal | No | No | No | Secondary | Literacy |
| Rocks | Concrete | Internal | No | No | No | Secondary | Literacy |
| Silicone | Concrete | Internal | No | No | No | Secondary | Literacy |
| Substrate | Concrete | Internal | No | No | No | Secondary | Literacy |
| Sunlight | Concrete | External | No | Yes | No | Advanced | Capability |
| Tank | Concrete | Internal | Yes | No | No | Essential | Sensibility |
| Tank Cover (Lid) | Concrete | External | No | No | No | Secondary | Literacy |
| Tank Stand | Concrete | External | No | No | No | Secondary | Literacy |
| Tank Wall Scraper | Concrete | External | No | No | No | Secondary | Literacy |
| Thermometer | Concrete | Internal | No | No | No | Secondary | Literacy |
| Thermostat | Concrete | External | No | No | No | Secondary | Literacy |
| Uneaten Fish Food | Concrete | Internal | No | Yes | No | Advanced | Capability |
| Water | Concrete | Internal | Yes | No | No | Essential | Sensibility |
The classifications for the eleven (11) additional elements that were defined for a fish-tank system while analyzing the data are presented in Table A2. The columns are: (1) Element Name (alphabetical); (2) Concrete or Conceptual; (3) Internal or External; (4) Essential; (5) Underlying Problem; (6) Sub-System; (7) Essential, Secondary, or Advanced; (8) Systems Thinking Learning Level Classification.
Table A2.
Additional fish-tank system element classifications.
| (1) | (2) | (3) | (4) | (5) | (6) | (7) | (8) |
|---|---|---|---|---|---|---|---|
| Battery | Concrete | External | No | No | No | Secondary | Literacy |
| Bucket | Concrete | External | No | No | No | Secondary | Literacy |
| Cat | Concrete | External | No | No | No | Secondary | Literacy |
| Chemicals | Concrete | External | No | No | No | Secondary | Literacy |
| Electrical Cord/Outlet | Concrete | External | No | No | No | Secondary | Literacy |
| Kool-Aid Packet | Concrete | External | No | Yes | No | Advanced | Capability |
| Nuclear Waste | Concrete | External | No | Yes | No | Advanced | Capability |
| Oil | Concrete | Internal | No | No | No | Secondary | Literacy |
| Smoke | Concrete | External | No | No | No | Secondary | Literacy |
| Trash | Concrete | External | No | No | No | Secondary | Literacy |
| Tree | Concrete | External | No | No | No | Secondary | Literacy |
Appendix B
Table A3.
Rules for classifying and recording elements.
| Rule # | Rule Description for Classifying and Recording Elements | Example (If Necessary) |
|---|---|---|
| 1 | An element must be drawn or described using words to be recorded. | |
| 2 | An element does not need to be labeled using words to be recorded. | |
| 3 | An element must be drawn, labeled, and/or described in a “distinguishable” manner to be recorded. A “distinguishable” element is recognizable or identifiable at first glance without extra effort. | |
| 4 | An element that is drawn and labeled using words shall be recorded exactly as the label is written. | Suppose the element “air/bubbles” are drawn and labeled as “oxygen”. Therefore, the element “oxygen” is recorded and not the element “bubbles”. |
| 5 | Elements must be classified independently for each drawing (i.e., elements classified in Drawing A cannot influence the elements classified in Drawing B, and vice versa, for the same student or between students). | Suppose student j draws an undistinguishable “blob” in Drawing A with no label. In Drawing B, the student draws the same “blob” with the label of “food”. The “blob” in Drawing A should not be recorded as the element “food” since it is an undistinguishable element when evaluated independently |
| 6 | If an element is not drawn, labeled and/or described in a distinguishable manner, or if the element is not relevant for a fish-tank system, the element shall not be recorded. | The element “cat” is not considered relevant to a fish-tank system unless it is explicitly connected to other elements or the system. For example, if a student describes how a “cat” tries to get the fish, this means the cat is relevant to the system and can be classified (if necessary) and recorded. |
| 7 | If two (2) or more instances of the same element are drawn, labeled, and/or described, only one (1) instance of that element shall be recorded per drawing. | If a student draws multiple elements that look like “plants”, only one (1) instance of the element “plants” is recorded. |
| 8 | If an element that is not included in the defined list of elements (see Table A1 and Table A2 in Appendix A) prior to analysis is drawn, labeled, and/or described, and the element is relevant to a fish-tank system, the element shall be classified using the flowchart (Figure 3) and recorded. | The element “cat” as described in rule #5. |
| An element classified at the sensibility level is assigned a score of one (1). | For sensibility: fish, tank, water | |
| An element classified at the literacy level is assigned a score of two (2). | For literacy: filter, human, fish food, plants, etc. | |
| 9 | An element classified at the capability level is assigned a score of three (3). | For capability: electricity, bacteria, broken filter, filtration system, etc. |
| 10 | The “tank” element shall always be recorded for Drawing B because it is pre-drawn on the worksheet, even if the “tank” is not labeled and/or described. | |
| 11 | The “tank cover (lid)” element shall only be recorded if it is described or labeled in words as “tank cover” or “tank lid”. A “tank cover (lid)” element that is only drawn shall not be recorded. | |
| 12 | The “filtration system” element shall only be recorded if it is described or labeled in words as “filter system” or “filtration system”. | |
| 13 | The “impeller” element shall only be recorded if it is drawn, labeled, or described separately from a “filter” or “filtration system” element. | Suppose an impeller is drawn inside a filter, therefore the “impeller” element shall not be recorded as a separate element. |
Table A4.
Rules for classifying and recording interactions.
| Rule # | Rule Description for Classifying and Recording Interactions | Example (If Necessary) |
|---|---|---|
| 1 | An interaction must involve two (2) or more distinguishable elements to be recorded. | “The fish swims” is not an interaction because only one element (“fish”) is involved. This statement would not be recorded as an interaction. |
| 2 | An interaction must be denoted (drawn) either with arrows/lines or described using words to be recorded (an interaction might be denoted using both arrows/lines and written descriptions). | A line drawn between the elements of “fish” and “food” denotes an interaction between these two elements (at the sensibility level). The description “the fish eats the food” also denotes an interaction between the elements of “fish” and “food” (at the literacy level). |
| 3 | An interaction must be drawn and/or described in a “distinguishable” manner to be recorded. A “distinguishable” interaction is recognizable or identifiable at first glance without extra effort. | |
| 4 | Only one (1) interaction shall be assigned between two elements. If multiple interactions are assigned between two elements, then only the interaction classified at the higher systems thinking learning level shall be recorded. | Suppose two interactions, “fish eat food to gain energy” and “fish play with food”, have been assigned between the two elements of “fish” and “food”. Since the interaction of “fish eat food to gain energy” is classified at a capability level (both an action and a reaction are defined), only this interaction shall be recorded between the two elements “fish” and “food”. |
| 5 | Interaction descriptions must be phrased using verbs, with the exception of the verbs: add, make, give, gave, get, got, keep, help, is, are, allow, or provide. Descriptions using these verbs shall be recorded as a role/purpose and not an interaction. | The description “the fish swims in the water” is recorded as an interaction. However, the description “the fish is swimming in the water” is recorded as a role/purpose because the linking verb “is” is used in the description. |
| 6 | A part of a drawing or a description that is recorded as an interaction cannot also be recorded as a role/purpose unless both an interaction and a role/purpose are distinguishable. | Suppose a student includes two descriptions that are identical, such as “fish eat food”, where one description is denoted using the word “interaction” and the other description is denoted using the words “role/purpose”. Therefore, the interaction between the elements “fish” and “food” is recorded as “fish eat food” and the role/purpose of the element “fish” is recorded as “fish eat food”. |
| 7 | If two (2) or more instances of the same interaction are drawn and/or described, only one (1) instance of that interaction shall be recorded per drawing. | If a student draws multiple “fish” elements and connects them all to the element of “food”, only one (1) instance of the “fish-food” interaction is recorded. |
| An interaction classified at the sensibility level is assigned a score of one (1). | For sensibility: A line connecting the elements “fish” and “food”. | |
| An interaction classified at the literacy level is assigned a score of two (2). | For literacy: A line connecting the elements of “fish” and “food” and the description “eating” which defines an action between the elements. | |
| 8 | An interaction classified at the capability level is assigned a score of three (3). | For capability: A line connecting the elements of “fish” and “food” and the description “eats to get energy” which defines an action and a reaction between the elements. |
Table A5.
Rules for classifying and recording roles/purposes.
| Rule # | Rule Description for Classifying and Recording Roles/Purposes | Example (If Necessary) |
|---|---|---|
| 1 | A role/purpose must be assigned to at least one (1) distinguishable element or system to be recorded. | The description “the tank is for holding everything” can be recorded as a role/purpose, whereas the statement “holds everything” cannot be recorded as a role/purpose unless the statement is assigned to a distinguishable element (see Rule #2). |
| 2 | A role/purpose must be written in words. A role/purpose can either be assigned as a written label connected to a distinguishable element using lines/arrows or as a written description next to a distinguishable element. | |
| 3 | A role/purpose must be labeled and/or described in a “distinguishable” manner to be recorded. A “distinguishable” role/purpose is recognizable or identifiable at first glance without extra effort. | |
| 4 | Only one (1) role/purpose shall be assigned to each element. If multiple roles/purposes are assigned to the same element, then only the role/purpose classified at the higher systems thinking learning level shall be recorded. | Suppose the element “fish” has been assigned both the role/purpose of “to swim around the tank” and “to be a pet”. Since the role/purpose of “to swim around the tank” is classified at a literacy level (from the element’s point-of-view), only this role/purpose shall be recorded for the element “fish”. |
| 5 | A label or description that includes the prepositions to or for or the pronoun so is always recorded as a role/purpose. | A line connecting the distinguishable element of “fish” to the description “to swim” is recorded as “the role/purpose of the fish is to swim”. The description of “so fish can live” written next to the distinguishable element of “water” is recorded as “the role/purpose of water is so fish can live”. |
| 6 | Descriptions that include the verbs add, make, give, gave, get, got, keep, help, is, are, allow, or provide are recorded as a role/purpose. Descriptions using other verbs are recorded as an interaction and not a role/purpose. | The description “the fish swims in the water” is recorded as an interaction. However, the description “the fish is swimming in the water” is recorded as a role/purpose because the linking verb “is” is used in the description. |
| 7 | A part of a drawing or a description that is recorded as a role/purpose cannot also be recorded as an interaction unless both a role/purpose and an interaction are distinguishable. | Suppose a student includes two descriptions that are identical, such as “fish eat food”, where one description is denoted using the word “interaction” and the other description is denoted using the words “role/purpose”. Therefore, the interaction between the elements “fish” and “food” is recorded as “fish eat food” and the role/purpose of the element “fish” is recorded as “fish eat food”. |
| 8 | If two (2) or more instances of the same role/purpose are labeled or described, only one (1) instance of that interaction shall be recorded per drawing. | If a student draws multiple “fish” elements and labels each with the description “fish make waste”, only one instance of the role/purpose of a fish is to “make waste” is recorded. |
| A role/purpose classified at the sensibility level is assigned a score of one (1). | For sensibility: “Rocks are decoration” is a role/purpose assigned to the element “rocks” from the observer’s point-of-view. | |
| A role/purpose classified at the literacy level is assigned a score of two (2). | For literacy: “Rocks allow fish to hide” is a role/purpose assigned to the element “rocks” from the element’s point-of-view. | |
| 9 | A role/purpose classified at the capability level is assigned a score of three (3). | For capability: “The air pump helps circulate the water to improve tank and water health” is a role/purpose assigned to the element “pump” from the system’s point-of-view. |
References
- Suppe, F. The Structure of Scientific Theories, 2nd ed.; University of Illinois Press: Urbana, IL, USA, 1977. [Google Scholar]
- Uebel, T. Vienna Circle. In The Stanford Encyclopedia of Philosophy; Zalta, E.N., Ed.; Available online: https://plato.stanford.edu/archives/spr2019/entries/vienna-circle/ (accessed on 6 August 2019).
- Sloane, E.H. Reductionism. Psychol. Rev. 1945, 52, 214–223. [Google Scholar] [CrossRef]
- Jackson, M.C. Systems Thinking: Creative Holism for Managers; John Wiley & Sons Ltd.: Chichester, UK, 2003. [Google Scholar]
- Dori, D.; Sillitto, H.; Griego, R.M.; McKinney, D.; Arnold, E.P.; Godfrey, P.; Martin, J.; Jackson, S.; Krob, D. System definition, system worldviews, and systemness characteristics. IEEE Syst. J. 2019, 1–11. [Google Scholar] [CrossRef]
- Bunge, M. Systemism: The alternative to individualism and holism. J. Socio-Econ. 2000, 29, 147–157. [Google Scholar] [CrossRef]
- Rousseau, D. Three general systems principles and their derivation: Insights from the philosophy of science applied to systems concepts. In Disciplinary Convergence: Implications for Systems Engineering Research, Proceedings of the 15th Annual Conference on Systems Engineering Research, Redondo Beach, CA, USA, 23–25 March 2017; Madni, A.M., Boehm, B., Erwin, D.A., Ghanem, R., Wheaton, M.J., Eds.; Systems Engineering Research Center (SERC): Hoboken, NJ, USA, 2017. [Google Scholar]
- Checkland, P.B. Systems Thinking, Systems Practice; John Wiley & Sons Ltd.: Chichester, UK, 1981. [Google Scholar]
- Stember, M. Advancing the social sciences through the interdisciplinary enterprise. Soc. Sci. J. 1991, 28, 1–14. [Google Scholar] [CrossRef]
- Hofkirchner, W. Transdisciplinarity needs systemism. Systems 2017, 5, 15. [Google Scholar] [CrossRef] [Green Version]
- Bosch, O.J.H.; Nguyen, N.C.; Maeno, T.; Yasui, T. Managing complexity issues through evolutionary learning laboratories. Syst. Res. Behav. Sci. 2013, 30, 116–135. [Google Scholar] [CrossRef] [Green Version]
- Kahneman, D. Thinking Fast and Slow; Farrar, Straus, and Giroux: New York, NY, USA, 2011. [Google Scholar]
- Crowell, F.A. Systems Literacy and the Literate Design of Educational Systems. In Proceedings of the Thirty-Sixth Annual Meeting for the International Society for the System Sciences (ISSS), Denver, CO, USA, 12–17 July 1992. [Google Scholar]
- Tuddenham, P. Observations on systems literacy at the international society for systems sciences (ISSS) 2016 conference. Syst. Res. Behav. Sci. 2017, 34, 625–630. [Google Scholar] [CrossRef]
- Cabrera, D.; Cabrera, L. Systems Thinking Made Simple: New Hope for Solving Wicked Problems; Odyssean Press: Ithaca, NY, USA, 2015. [Google Scholar]
- Ison, R.; Shelley, M. Governing in the anthropocene: Contributions from systems thinking in practice? Syst. Res. Behav. Sci. 2016, 33, 589–594. [Google Scholar] [CrossRef]
- NGSS Lead States. Next Generation Science Standards: For States, By States; The National Academies Press: Washington, DC, USA, 2013. [Google Scholar]
- Hmelo-Silver, C.E.; Eberbach, C.; Jordan, R. Technology-supported inquiry for learning about aquatic ecosystems. Eurasia J. Math. Sci. Technol. Educ. 2014, 10, 405–413. [Google Scholar] [CrossRef] [Green Version]
- Hmelo-Silver, C.E.; Liu, L.; Gray, S.; Jordan, R. Using representational tools to learn about complex systems: A tale of two classrooms. J. Res. Sci. Teach. 2015, 52, 6–35. [Google Scholar] [CrossRef]
- Liu, L.; Hmelo-Silver, C.E. Promoting complex systems learning through the use of conceptual representations in hypermedia. J. Res. Sci. Teach. 2009, 46, 1023–1040. [Google Scholar] [CrossRef]
- Cabrera, D.A. Systems Thinking. Ph.D. Thesis, Cornell University, Ithaca, NY, USA, 2006. [Google Scholar]
- Cabrera, D.; Colosi, L.; Lobdell, C. Systems thinking. Eval. Program Plan. 2008, 31, 299–310. [Google Scholar] [CrossRef] [PubMed]
- François, C. International Encyclopedia of Systems and Cybernetics, 2nd ed.; K.G. Saur Verlag GmbH: München, Germany, 2004. [Google Scholar]
- Rousseau, D.; Billingham, J.; Calvo-Amodio, J. Systemic semantics: A systems approach to building ontologies and concept maps. Systems 2018, 6, 32. [Google Scholar] [CrossRef] [Green Version]
- Deming, W.E. The New Economics: For Industry, Government, Education, 2nd ed.; Massachusetts Institute of Technology, Center for Advanced Educational Services: Cambridge, MA, USA, 1994. [Google Scholar]
- Ackoff, R.L. On learning and the systems that facilitate it. Reflect. Soc. Organ. Learn. J. 1999, 1, 14–24. [Google Scholar] [CrossRef]
- Buckle, P.B.; Chen, W.-C. Systems thinking: Common ground or untapped territory? Syst. Res. Behav. Sci. 2012, 28, 470–483. [Google Scholar] [CrossRef]
- Creative Learning Exchange (CLE). In Creative Learning Exchange Brochure; Available online: http://static.clexchange.org/ftp/CLEBrochure_2013.pdf (accessed on 7 August 2019).
- HeHfafOpen University (OU). In MSc in Systems Thinking in Practice; Available online: http://www.openuniversity.edu/courses/postgraduate/qualifications/f47 (accessed on 7 August 2019).
- Buckle, P. Maturity models for systems thinking. Systems 2018, 6, 23. [Google Scholar] [CrossRef] [Green Version]
- Hmelo, C.E.; Holton, D.L.; Kolodner, J.L. Designing to learn about complex systems. J. Learn. Sci. 2000, 9, 247–298. [Google Scholar] [CrossRef]
- Jordan, R.C.; Hmelo-Silver, C.; Liu, L.; Gray, S.A. Fostering reasoning about complex systems: Using the aquarium to teach systems thinking. Appl. Environ. Educ. Commun. 2013, 12, 55–64. [Google Scholar] [CrossRef]
- Sensibility. In Merriam Webster; Available online: https://www.merriam-webster.com/dictionary/sensibility (accessed on 30 July 2019).
- Literacy. In Merriam Webster; Available online: https://www.merriam-webster.com/dictionary/literacy (accessed on 30 July 2019).
- Literate. In Merriam Webster; Available online: https://www.merriam-webster.com/dictionary/literate#h1 (accessed on 30 July 2019).
- Capability. In Merriam Webster; Available online: https://www.merriam-webster.com/dictionary/capability (accessed on 30 July 2019).
- Capable. In Merriam Webster; Available online: https://www.merriam-webster.com/dictionary/capable (accessed on 30 July 2019).
- Comprehensive. In Merriam Webster; Available online: https://www.merriam-webster.com/dictionary/comprehensive (accessed on 30 July 2019).
- Comprehension. In Merriam Webster; Available online: https://www.merriam-webster.com/dictionary/comprehension (accessed on 30 July 2019).
- Taylor, S.; Calvo-Amodio, J.; Well, J. A Proposed Methodology for Developing Systems Thinking Lessons By and For Non-Experts. In Proceedings of the American Society for Engineering Management (ASEM) 2018 International Annual Conference, Coeur d’Alene, ID, USA, 17–20 October 2018; Ng, E.-H., Nepal, B., Schott, E., Keathley, H., Eds.; American Society for Engineering Management (ASEM): Huntsville, AL, USA, 2018. [Google Scholar]
- Bacaër, N. Verhulst and the logistic equation (1838). In A Short History of Mathematical Population Dynamics; Springer: London, UK, 2011; pp. 35–39. [Google Scholar]
- Leedy, P.D.; Ormrod, J.E. Practical Research Planning and Design, 11th ed.; Pearson Education, Inc.: New York City, NY, USA, 2016. [Google Scholar]
- Mills, D. The Encyclopedia of the Marine Aquarium; Crescent Books: New York, NY, USA, 1987. [Google Scholar]
- Sharpe, S. Causes and cures for green aquarium water. The Spruce Pets. Available online: https://www.thesprucepets.com/causes-and-cures-for-green-aquarium-water-1378633 (accessed on 27 July 2019).
- Hmelo-Silver, C.E.; Pfeffer, M.G. Comparing expert and novice understanding of a complex system from the perspective of structures, behaviors, and functions. Cogn. Sci. 2004, 28, 127–138. [Google Scholar] [CrossRef]
- Lombard, M.; Snyder-Duch, J.; Bracken, C.C. Content analysis in mass communication: Assessment and reporting of intercoder reliability. Hum. Commun. Res. 2002, 28, 587–604. [Google Scholar] [CrossRef]
- Krippendorff, K. Computing Krippendorff’s Alpha-Reliability. In University of Pennsylvania Scholarly Commons: Annenberg School of Communication; Available online: https://repository.upenn.edu/asc_papers/43/ (accessed on 10 September 2019).
- Neuendorf, K.A. The Content Analysis Guidebook; Sage: Thousand Oaks, CA, USA, 2002. [Google Scholar]
- Montgomery, D.C. Design and Analysis of Experiments, 8th ed.; John Wiley & Sons, Inc.: Hoboken, NJ, USA, 2013. [Google Scholar]
- Conover, W.J. Practical Nonparametric Statistics, 3rd ed.; John Wiley & Sons, Inc.: Hoboken, NJ, USA, 1999. [Google Scholar]
Figure 1.
Gap between reductionism and systemism.

Figure 2.
The systems literacy roadmap (adapted from Ison and Shelley [16]).
Figure 2.
The systems literacy roadmap (adapted from Ison and Shelley [16]).

Figure 3.
Systems thinking learning model [40].
Figure 3.
Systems thinking learning model [40].

Figure 4.
Element classification flowchart.

Figure 5.
Interaction classification flowchart.

Figure 6.
Role/purpose classification flowchart.

Figure 7.
Systems thinking learning model example.

Table 1.
Element patterns and element classifications.
| Pattern | Classification | Definition |
|---|---|---|
| (1) Elements that are visible or invisible | Concrete Elements | A concrete element is visible (i.e., can be seen with the naked human eye). Examples: fish, plants, filter. |
| Conceptual Elements | A conceptual element is invisible (i.e., cannot be seen with the naked human eye). Examples: bacteria, oxygen, nitrogen. | |
| (2) Elements inside or outside the system boundary | Internal Elements | An internal element is located primarily inside of the system boundary (i.e., the walls of the fish tank). Examples: rocks, fish food, air/water pump. |
| External Elements | An external element is located primarily outside of the system boundary (i.e., the walls of the fish tank) in the environment. Examples: fish net, sunlight, tank stand. | |
| (3) Elements that are critical to the system’s definition | Essential Elements | An essential element is crucial data or information used to define what a fish-tank system is. Without an essential element, the system cannot be defined as a fish-tank system. For a fish-tank system, the essential elements are fish, tank, and water. |
| (4) Elements that are underlying causes of the problem situation | Secondary Elements | A secondary element enhances knowledge about how a fish-tank system works. The addition or removal of a secondary element does not affect the definition of a fish-tank system. Examples: filter, algae, human. |
| (5) Elements that are labeled as systems | Advanced Elements | An advanced element enhances understanding about why the fish-tank system is behaving a certain way. Advanced elements include all conceptual elements, elements that are underlying causes of the problem situation, and elements that are labeled as sub-systems within the greater fish-tank system. Examples: ammonia, bacteria, filtration system, dead organisms. |
Table 2.
Element classifications and systems thinking learning levels.
| Learning Level | Classification | Description |
|---|---|---|
| Sensibility | 1. Concrete, Internal, Essential Elements | All elements at the sensibility level are essential meaning these elements are necessary for defining what a fish-tank system is. Additionally, all elements at this level are visible and are found inside the fish-tank system boundary. |
| Literacy | 1. Concrete, Internal, Secondary Elements | All elements at the literacy level are secondary meaning these elements enhance knowledge about how the fish-tank system works. Additionally, all elements at this level are visible and can be found both inside and outside the fish-tank system boundary. |
| 2. Concrete, External, Secondary Elements | ||
| Capability | 1. Concrete, Internal, Advanced Elements | All elements at the capability level are advanced meaning these elements enhance understanding about why the fish-tank system is behaving the way it is. Additionally, elements at this level can be either visible or invisible and can be found both inside and outside the fish-tank system boundary. |
| 2. Concrete, External, Advanced Elements | ||
| 3. Conceptual, Internal, Advanced Elements | ||
| 4. Conceptual, External, Advanced Elements |
Table 3.
Interaction patterns and interaction classifications.
| Pattern | Classification | Definition |
|---|---|---|
| (1) Non-action and non-reaction interactions | Non-action Interactions | A non-action interaction does not explain how or why two or more elements are interacting. No clear action is defined. |
| Non-reaction Interactions | A non-reaction interaction does not explain the effect(s) of an interaction between two or more elements. No clear reaction is defined. | |
| Simple Interactions | A simple interaction demonstrates awareness that two or more elements relate, or that the elements are interacting in some way, but no clear action and no clear reaction is defined. | |
| (2) Action and non-reaction interactions | Action Interactions | An action interaction does explain how two or more elements are interacting. A clear action is defined. |
| (3) Non-action and reaction interactions | Intermediate Interactions | An intermediate interaction demonstrates awareness that two or more elements relate, or that the elements are interacting in some way, and also demonstrates knowledge about either the action (how two or more elements are interacting) or the reaction (the effect(s) of an interaction between two or more elements). |
| Reaction Interactions | A reaction interaction does explain the effect(s) of an interaction between two or more elements. A clear reaction is defined. | |
| (4) Action and reaction interactions | Advanced Interactions | An advanced interaction demonstrates both the awareness that two or more elements relate and the knowledge of actions and reactions, and also demonstrates the understanding of the interplay between the action and reaction (i.e., the cause-and-effect relationship). |
Table 4.
Interaction classifications and systems thinking learning levels.
| Learning Level | Classification | Description |
|---|---|---|
| Sensibility | 1. Non-action, Non-reaction, Simple Interactions | All interactions at the sensibility level are simple, meaning interactions only demonstrate an awareness that two or more elements relate. Interactions at this level do not explain how two or more elements are interacting or the effect(s) of the interaction between two or more elements. No clear action or reaction is defined. |
| Literacy | 1. Action, Non-reaction, Intermediate Interactions | All interactions at the literacy level are intermediate, meaning interactions demonstrate awareness that two or more elements relate and knowledge about either how two or more elements are interacting or the effect(s) of the interaction between two or more elements. In case (1) where a clear action is defined, no clear reaction is defined. Conversely, in case (2) where a clear reaction is defined, no clear action is defined. |
| 2. Non-action, Reaction, Intermediate Interactions | ||
| Capability | 1. Action, Reaction, Advanced Interactions | All interactions at the capability level are advanced, meaning interactions demonstrate both awareness that two or more elements relate and knowledge about the actions and reactions between two or more elements, and also an understanding of why the action causes the reaction. A clear cause-and-effect relationship is defined. |
Table 5.
Role/purpose classifications and systems thinking learning levels.
| Pattern | Classification | Learning Level | Definition |
|---|---|---|---|
| (1) Observer’s point-of-view | Individualistic Roles/Purposes | Sensibility | A role/purpose at the sensibility level demonstrates awareness that an element in a fish-tank system has a role/purpose, but that role is individualistically focused. Roles/purposes at this level are viewed from the observer’s point-of-view of the fish-tank system. |
| (2) Element’s point-of-view | Elementalistic Roles/Purposes | Literacy | A role/purpose at the literacy level demonstrates knowledge about the role/purpose of an element in a fish-tank system, but that role or purpose is elementalistically focused. Roles/purposes at this level are viewed from the element’s point-of-view to explain how that role/purpose relates to other elements in the fish-tank system. |
| (3) System’s point-of-view | Systemic Roles/Purposes | Capability | A role/purpose at the capability level demonstrates understanding about the role/purpose of an element in a fish-tank system, but that role is systemically focused. Roles/purposes at this level are viewed from the system’s point-of-view and explain why elements exist in the fish-tank system. |
Table 6.
Inter-coder agreement results.
| Item Coded | Part #1 | Part #2 | Part #3 | |||
|---|---|---|---|---|---|---|
| (5 Students; 10 Drawings) | (5 Students; 10 Drawings) | (25 Students; 50 Drawings) | ||||
| Elements (E) | A: 67% | A + B: 70% | A: 88% | A + B: 91% | A: 90% | A + B: 91% |
| B: 74% | B: 95% | B: 93% | ||||
| Interactions (I) | A: 100% | A + B: 68% | A: 100% | A + B: 87% | A: 96% | A + B: 85% |
| B: 37% | B: 73% | B: 74% | ||||
| Roles/Purposes (R) | A: 80% | A + B: 65% | A: 100% | A + B: 72% | A: 96% | A + B: 88% |
| B: 50% | B: 44% | B: 80% | ||||
| Totals (T) | A: 82% | A + B: 68% | A: 96% | A + B: 83% | A: 94% | A + B: 88% |
| B: 53% | B: 71% | B: 82% | ||||
Table 7.
Sample statistics for the analysis of distinctions (elements).
| Drawing | [S] | [S] | [L] | [L] | [C] | [C] | [T] | [T] | [T] | [T] |
|---|---|---|---|---|---|---|---|---|---|---|
| A | 2.47 | 3 | 2.97 | 3 | 0.19 | 0 | 5.63 | 5 | 8.97 | 8 |
| B | 2.92 | 3 | 4.73 | 4 | 0.63 | 0 | 8.28 | 8 | 14.27 | 13 |
| B—A | 0.44 | 0 | 1.76 | 2 | 0.44 | 0 | 2.65 | 3 | 5.30 | 5 |
Table 8.
Wilcoxon signed ranks test results for distinctions (elements).
| Test | Null Hypothesis | Test Statistic (T) | Critical Value (zcritical) | p-Value | |
|---|---|---|---|---|---|
| Two-tailed (x) | 81 | 7.35 | 1.96 | <0.001 | |
| Two-tailed (z) | 86 | 7.45 | 1.96 | <0.001 | |
| Left-tailed (x) | 81 | 7.35 | 1.64 | >0.999 | |
| Left-tailed (z) | 86 | 7.45 | 1.64 | >0.999 | |
| Right-tailed (x) | 81 | 7.35 | 1.64 | <0.001 | |
| Right-tailed (z) | 86 | 7.45 | 1.64 | <0.001 |
Table 9.
Sample statistics for the analysis of relationships (interactions).
| Drawing | [S] | [S] | [L] | [L] | [C] | [C] | [T] | [T] | [T] | [T] |
|---|---|---|---|---|---|---|---|---|---|---|
| A | 0.14 | 0 | 0.07 | 0 | 0.03 | 0 | 0.25 | 0 | 0.38 | 0 |
| B | 0.66 | 0 | 1.30 | 0 | 0.06 | 0 | 2.02 | 1 | 3.44 | 2 |
| B—A | 0.52 | 0 | 1.23 | 0 | 0.03 | 0 | 1.77 | 1 | 3.06 | 2 |
Table 10.
Wilcoxon signed ranks test results for relationships (interactions).
| Test | Null Hypothesis | Test Statistic (T) | Critical Value (zcritical) | p-Value | |
|---|---|---|---|---|---|
| Two-tailed (x) | 57 | 6.61 | 1.96 | <0.001 | |
| Two-tailed (z) | 60 | 6.72 | 1.96 | <0.001 | |
| Left-tailed (x) | 57 | 6.61 | 1.64 | >0.999 | |
| Left-tailed (z) | 60 | 6.72 | 1.64 | >0.999 | |
| Right-tailed (x) | 57 | 6.61 | 1.64 | <0.001 | |
| Right-tailed (z) | 60 | 6.72 | 1.64 | <0.001 |
Table 11.
Sample statistics for the analysis of perspectives (roles/purposes).
| Drawing | [S] | [S] | [L] | [L] | [C] | [C] | [T] | [T] | [T] | [T] |
|---|---|---|---|---|---|---|---|---|---|---|
| A | 0.00 | 0 | 0.11 | 0 | 0.00 | 0 | 0.11 | 0 | 0.23 | 0 |
| B | 0.53 | 0 | 1.58 | 1 | 0.00 | 0 | 2.10 | 2 | 3.68 | 4 |
| B—A | 0.53 | 0 | 1.46 | 1 | 0.00 | 0 | 1.99 | 2 | 3.45 | 3 |
Table 12.
Wilcoxon signed ranks test results for perspectives (roles/purposes).
| Test | Null Hypothesis | Test Statistic (T) | Critical Value (zcritical) | p-Value | |
|---|---|---|---|---|---|
| Two-tailed (x) | 74 | 7.37 | 1.96 | <0.001 | |
| Two-tailed (z) | 74 | 7.32 | 1.96 | <0.001 | |
| Left-tailed (x) | 74 | 7.37 | 1.64 | >0.999 | |
| Left-tailed (z) | 74 | 7.32 | 1.64 | >0.999 | |
| Right-tailed (x) | 74 | 7.37 | 1.64 | <0.001 | |
| Right-tailed (z) | 74 | 7.32 | 1.64 | <0.001 |
Table 13.
Sample statistics for the analysis of totals.
| Drawing | [S] | [S] | [L] | [L] | [C] | [C] | [T] | [T] | [T] | [T] |
|---|---|---|---|---|---|---|---|---|---|---|
| A | 2.62 | 3 | 3.15 | 3 | 0.22 | 0 | 5.99 | 5 | 9.58 | 8 |
| B | 4.10 | 3 | 7.61 | 7 | 0.69 | 0 | 12.40 | 12 | 21.39 | 19 |
| B—A | 1.48 | 1 | 4.45 | 4 | 0.47 | 0 | 6.41 | 6 | 11.81 | 10 |
Table 14.
Wilcoxon signed ranks test results for totals.
| Test | Null Hypothesis | Test Statistic (T) | Critical Value (zcritical) | p-Value | |
|---|---|---|---|---|---|
| Two-tailed (x) | 94 | 8.42 | 1.96 | <0.001 | |
| Two-tailed (z) | 95 | 8.46 | 1.96 | <0.001 | |
| Left-tailed (x) | 94 | 8.42 | 1.64 | >0.999 | |
| Left-tailed (z) | 95 | 8.46 | 1.64 | >0.999 | |
| Right-tailed (x) | 94 | 8.42 | 1.64 | <0.001 | |
| Right-tailed (z) | 95 | 8.46 | 1.64 | <0.001 |
Table 15.
Expected learning (EL) compared to systems thinking learning (STL).
| Systems Thinking Concept | (1) Expected Learning (EL) | (2) Systems Thinking Learning (STL) | (3) EL/STL Score Threshold | (4) Number (%) of Students with Score > Threshold 1 | (5) EL Average Score % 2 | (6) STL Average Score % 2 |
|---|---|---|---|---|---|---|
| Elements | 70.11% | 29.89% | 3.72 = 4.00 | 53 (54.64%) | 68.41% | 31.59% |
| Interactions | 18.65% | 81.35% | 0.57 = 1.00 | 53 (54.64%) | 34.19% | 65.81% |
| Roles/Purposes | 10.77% | 89.23% | 0.37 = 1.00 | 71 (73.20%) | 30.32% | 69.68% |
| Totals | 50.55% | 49.45% | 5.97 = 6.00 | 78 (80.41%) | 58.91% | 41.09% |
1 Total number of students in the analysis = ninety-seven (97). 2 Students with a difference in score (Drawing B–Drawing A) less than or equal to zero were omitted.
© 2020 by the authors. Licensee MDPI, Basel, Switzerland. This article is an open access article distributed under the terms and conditions of the Creative Commons Attribution (CC BY) license (http://creativecommons.org/licenses/by/4.0/).
Share and Cite
MDPI and ACS Style
Taylor, S.; Calvo-Amodio, J.; Well, J. A Method for Measuring Systems Thinking Learning. Systems 2020, 8, 11. https://0-doi-org.brum.beds.ac.uk/10.3390/systems8020011
AMA Style
Taylor S, Calvo-Amodio J, Well J. A Method for Measuring Systems Thinking Learning. Systems. 2020; 8(2):11. https://0-doi-org.brum.beds.ac.uk/10.3390/systems8020011
Chicago/Turabian StyleTaylor, Seth, Javier Calvo-Amodio, and Jay Well. 2020. "A Method for Measuring Systems Thinking Learning" Systems 8, no. 2: 11. https://0-doi-org.brum.beds.ac.uk/10.3390/systems8020011
Note that from the first issue of 2016, this journal uses article numbers instead of page numbers. See further details here.