Article

Effectiveness of the Early Response to COVID-19: Data Analysis and Modelling

by
Edoardo Bertone
1,2,*,
Martin Jason Luna Juncal
1,
Rafaela Keiko Prado Umeno
3,
Douglas Alves Peixoto
3,
Khoi Nguyen
2,3 and
Oz Sahin
2,3
1
School of Engineering and Built Environment, Griffith University, Southport, QLD 4222, Australia
2
Cities Research Institute, Griffith University, Southport, QLD 4222, Australia
3
KODE Consulting, Parkwood, QLD 4214, Australia
*
Author to whom correspondence should be addressed.
Submission received: 6 May 2020 / Revised: 3 June 2020 / Accepted: 16 June 2020 / Published: 18 June 2020

Abstract

:
Governments around the world have introduced a number of stringent policies to try to contain COVID-19 outbreaks, but the relative importance of such measures, in comparison to the community response to these restrictions, the amount of testing conducted, and the interconnections between them, is not well understood yet. In this study, data were collected from numerous online sources, pre-processed and analysed, and a number of Bayesian Network models were developed, in an attempt to unpack such complexity. Results show that early, high-volume testing was the most crucial factor in successfully monitoring and controlling the outbreaks; when testing was low, early government and community responses were found to be both critical in predicting how rapidly cases and deaths grew in the first weeks of the outbreak. Results also highlight that in countries with low early test numbers, the undiagnosed cases could have been up to five times higher than the officially diagnosed cases. The conducted analysis and developed models can be refined in the future with more data and variables, to understand/model potential second waves of contagions.

1. Introduction

Based on official estimates, as of early May 2020, there are over 3,000,000 cases of COVID-19 worldwide with over a quarter of a million deaths. Such numbers are the result of a disease with a much higher (around 1%) fatality rate than a typical seasonal influenza [1]. Furthermore, it is caused by a virus (SARS-CoV-2) that is transmitted very efficiently, including by people who are only mildly ill or presymptomatic [2]. This high transmission ability by relatively healthy people makes it very difficult to contain the COVID-19 outbreak.
At the time of writing, most governments around the world have taken numerous actions in response to the COVID-19 pandemic to try to “flatten the curve”, i.e., reduce the transmission rate in order to have a number of cases spread over a longer period of time. This is to avoid overcrowding hospitals over a short-term period, while also buying time to better prepare the country through more dedicated tools and facilities and better testing/tracing capabilities, with the end goal of “holding on” until a vaccine or an effective cure is developed. The magnitude and timing of government responses have varied remarkably. Countries such as Italy established a very heavy lockdown, with significant economic consequences, while other countries such as Sweden have adopted a lighter approach, with very limited restrictions and in turn, lower direct economic impacts. Of equal importance, is how society, and each individual, has reacted to the pandemic threat and adapted their lifestyle to the newly imposed rules or recommendations. Although it is proven that residents of heavily affected areas suffered from anxiety, stress, and other mental health issues [3], recent research also shows that the community response to COVID-19-related physical distancing measures is not necessarily high, and can vary considerably based, for instance, on a community’s education and trust in science [4].
In synthesis, it is sensible to state that the effectiveness of a government response to the COVID-19 outbreak relies on its people, and that in turn, the community response is affected by the way their government handles the pandemic crisis, starting from how much and how consistently the importance of respecting restrictions is highlighted through different media outlets.
These complex interactions and the interconnectedness between government response, population response, COVID-19 cases, and deaths, and in turn, community mental health, country economy, climate, pollution, education system, population density, population age distribution, global travels, etc., makes understanding the causes and effects of the COVID-19 pandemic almost impossible with traditional approaches and with available data. Consequently, a systems thinking approach [5] is recommended to better quantify and understand such complex behaviours. This has been previously used by some authors to model complex multi-disciplinary problems [6,7]. A conceptual model, i.e., casual loop diagram, illustrating all the factors affecting the COVID-19 pandemic system, has been developed elsewhere [8]. Several of the aforementioned variables across the environmental-health-socio-economic subsystems are inherently difficult to numerically quantify; however, for some key variables, such as government and community responses, data currently exist through a number of online resources or other research studies. Therefore, by using a combination of traditional data-driven analyses and more complex systems approaches, such as Bayesian Networks [9], it was possible to model a small sub-system within the larger, overall COVID-19 pandemic network, to gain a better understanding and quantification of why certain countries have faster outbreaks and/or more deaths at this point in the pandemic crisis.

2. Results

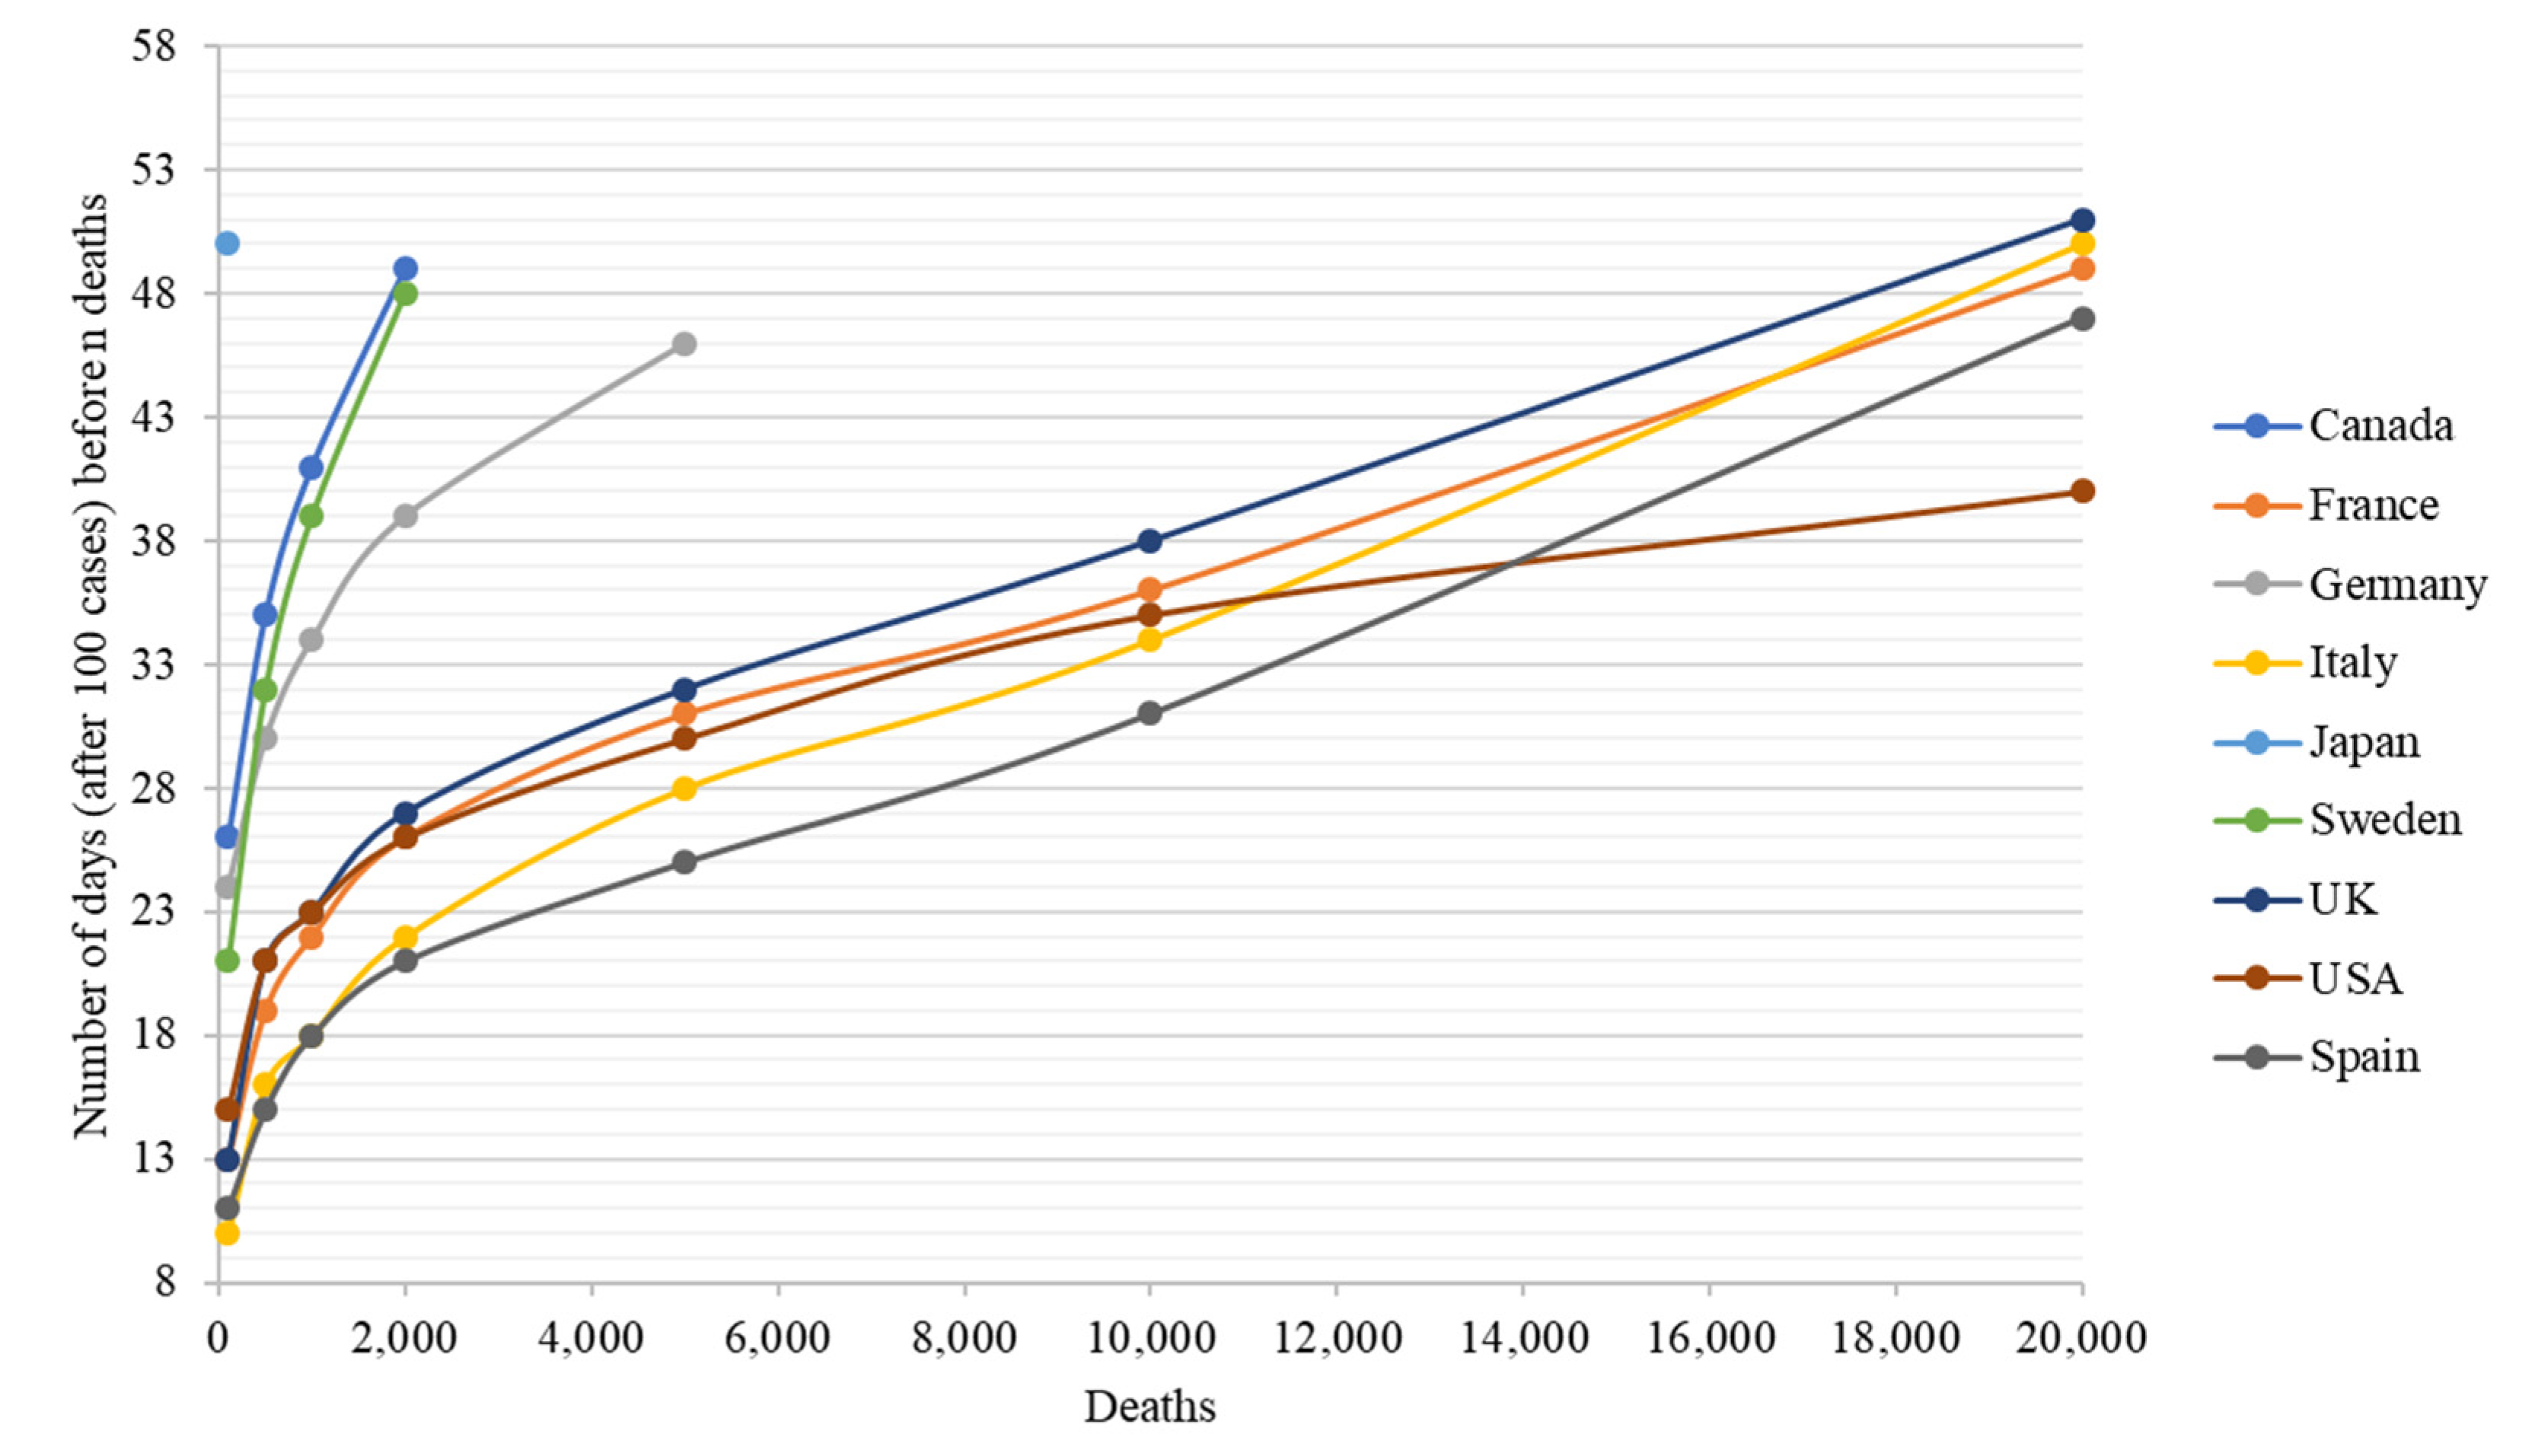
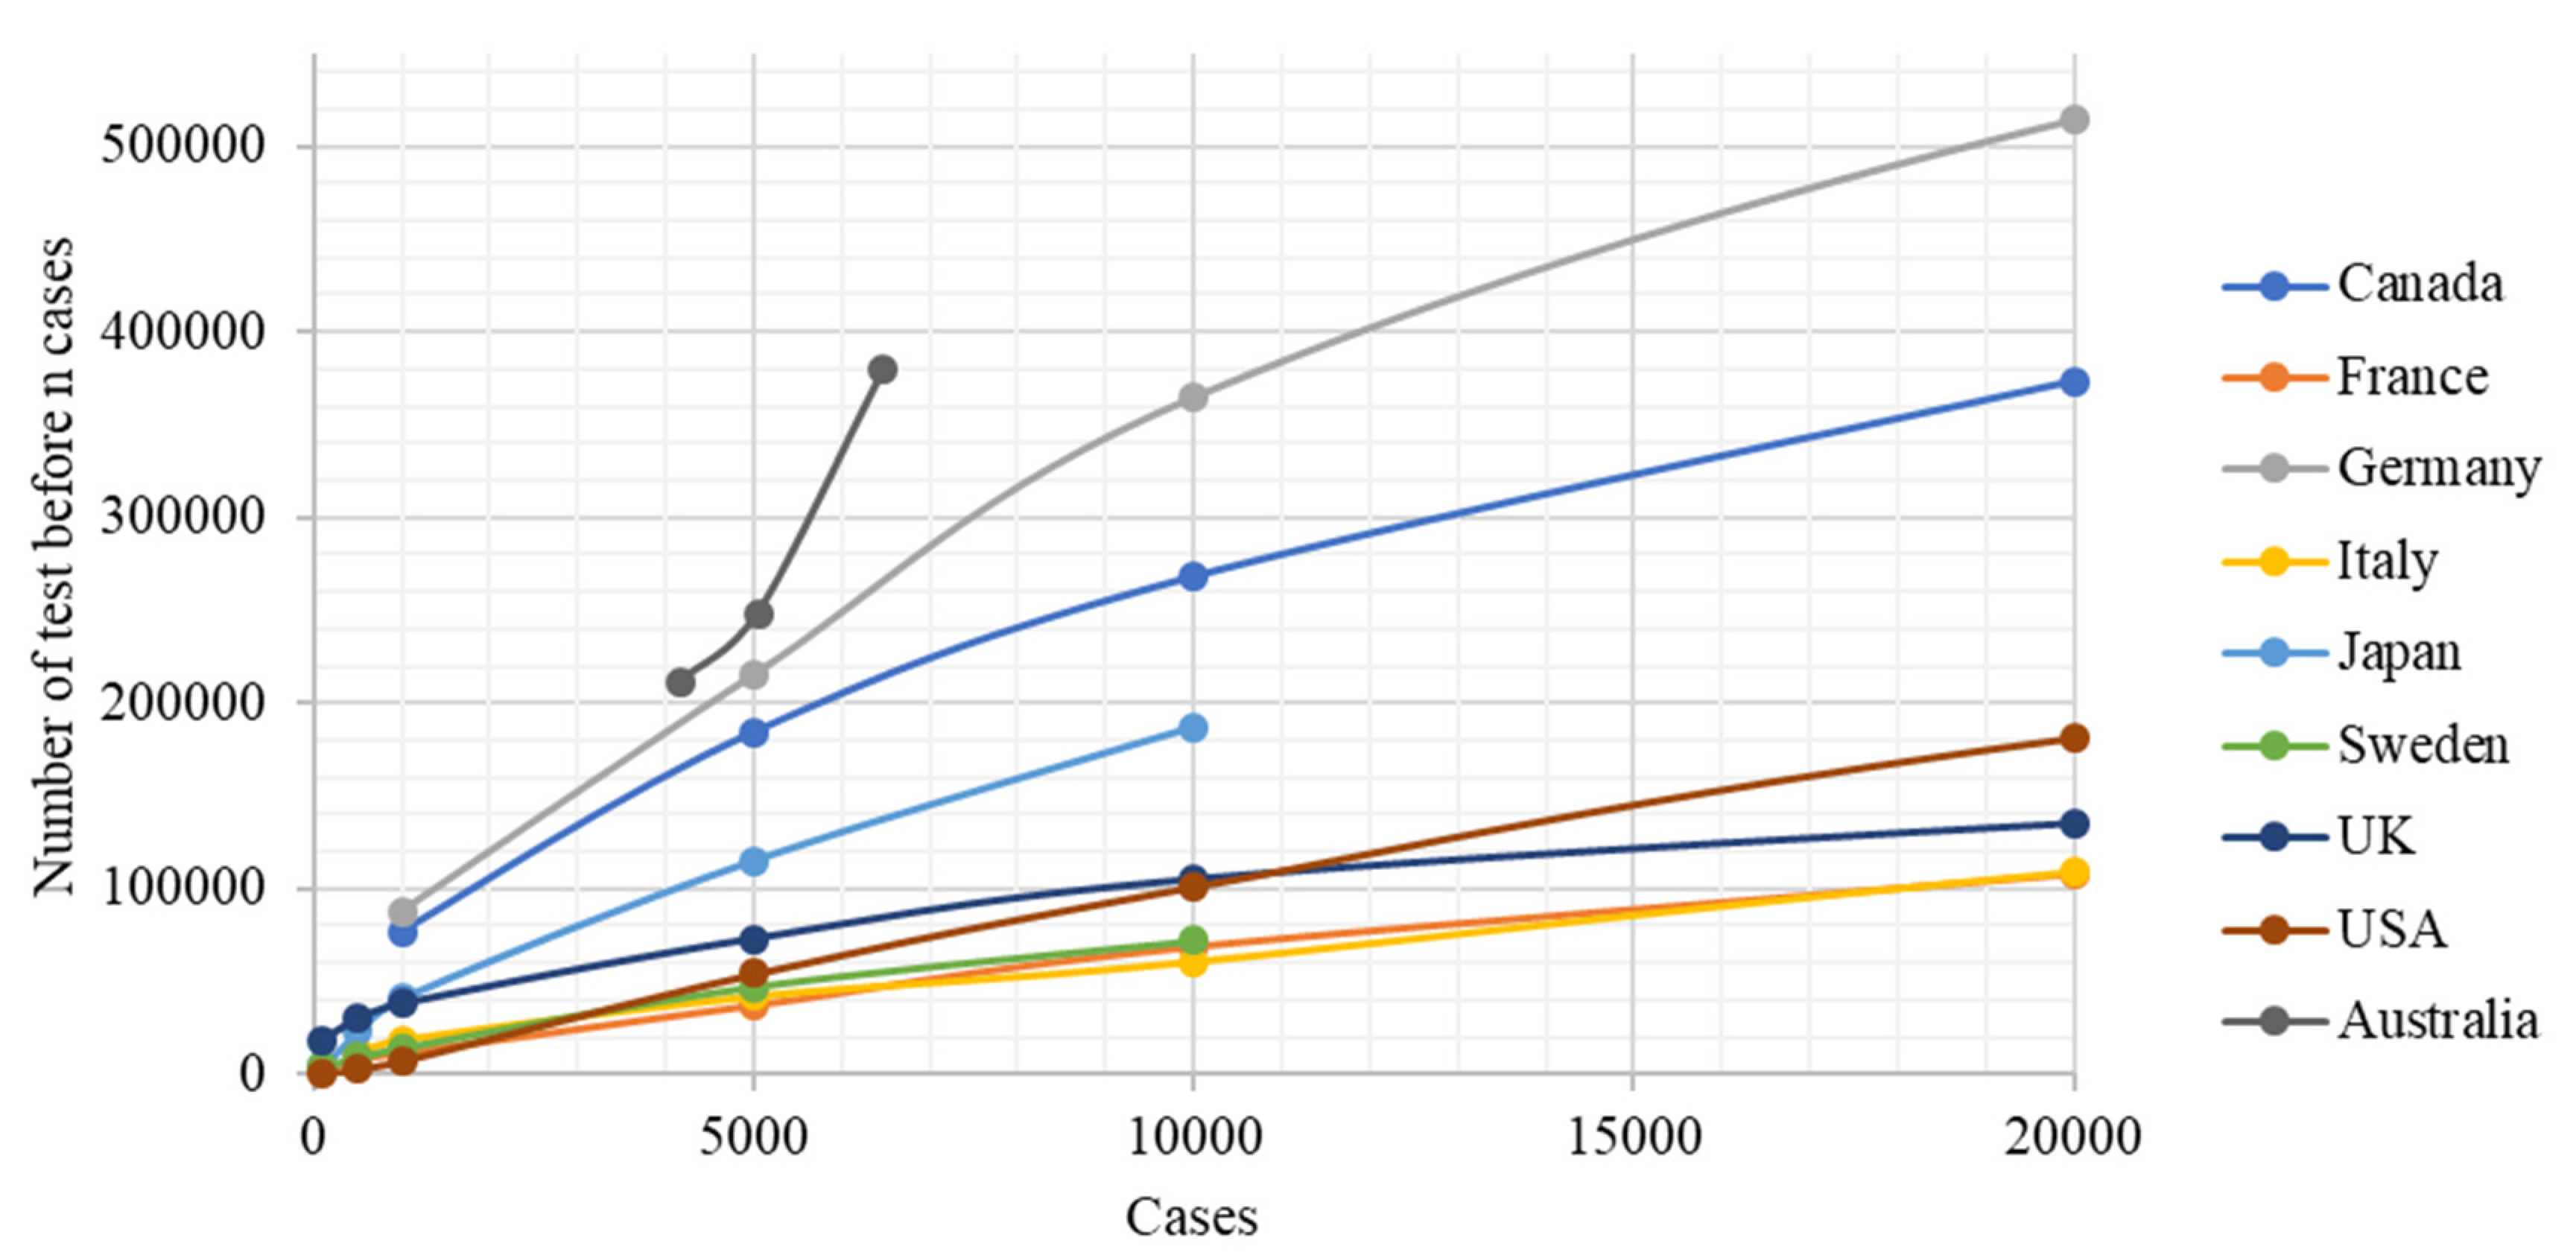
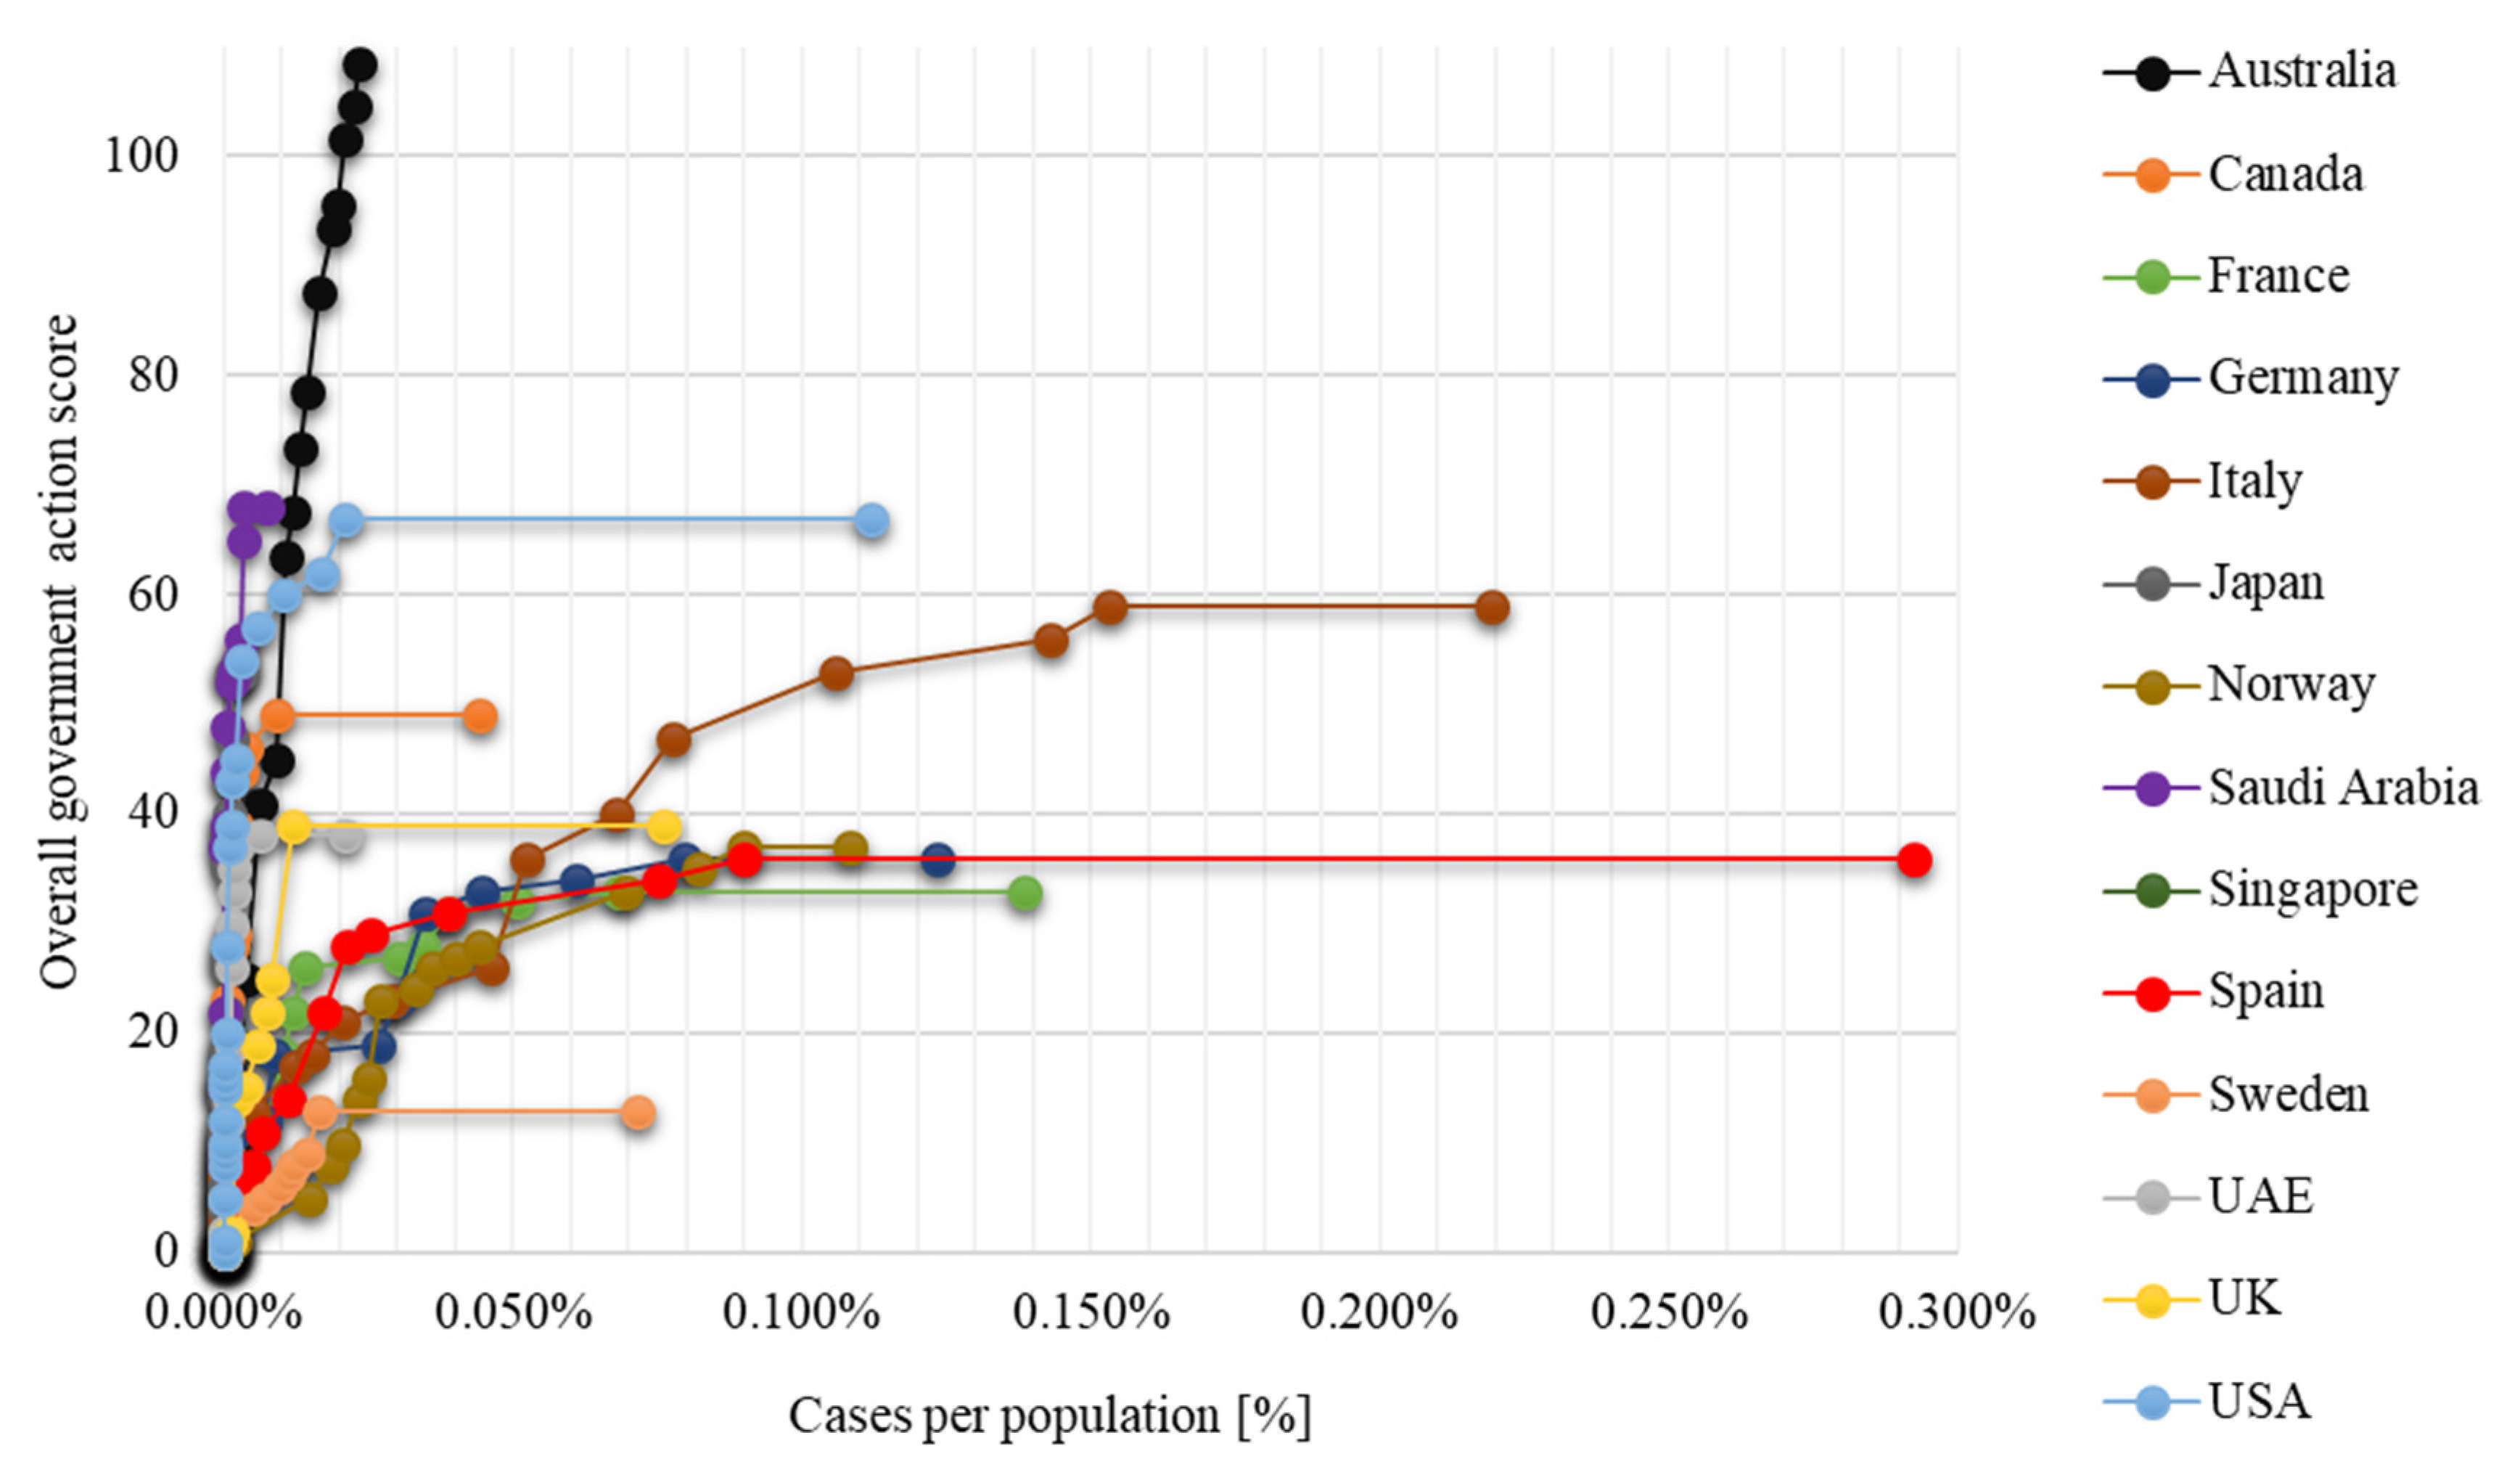
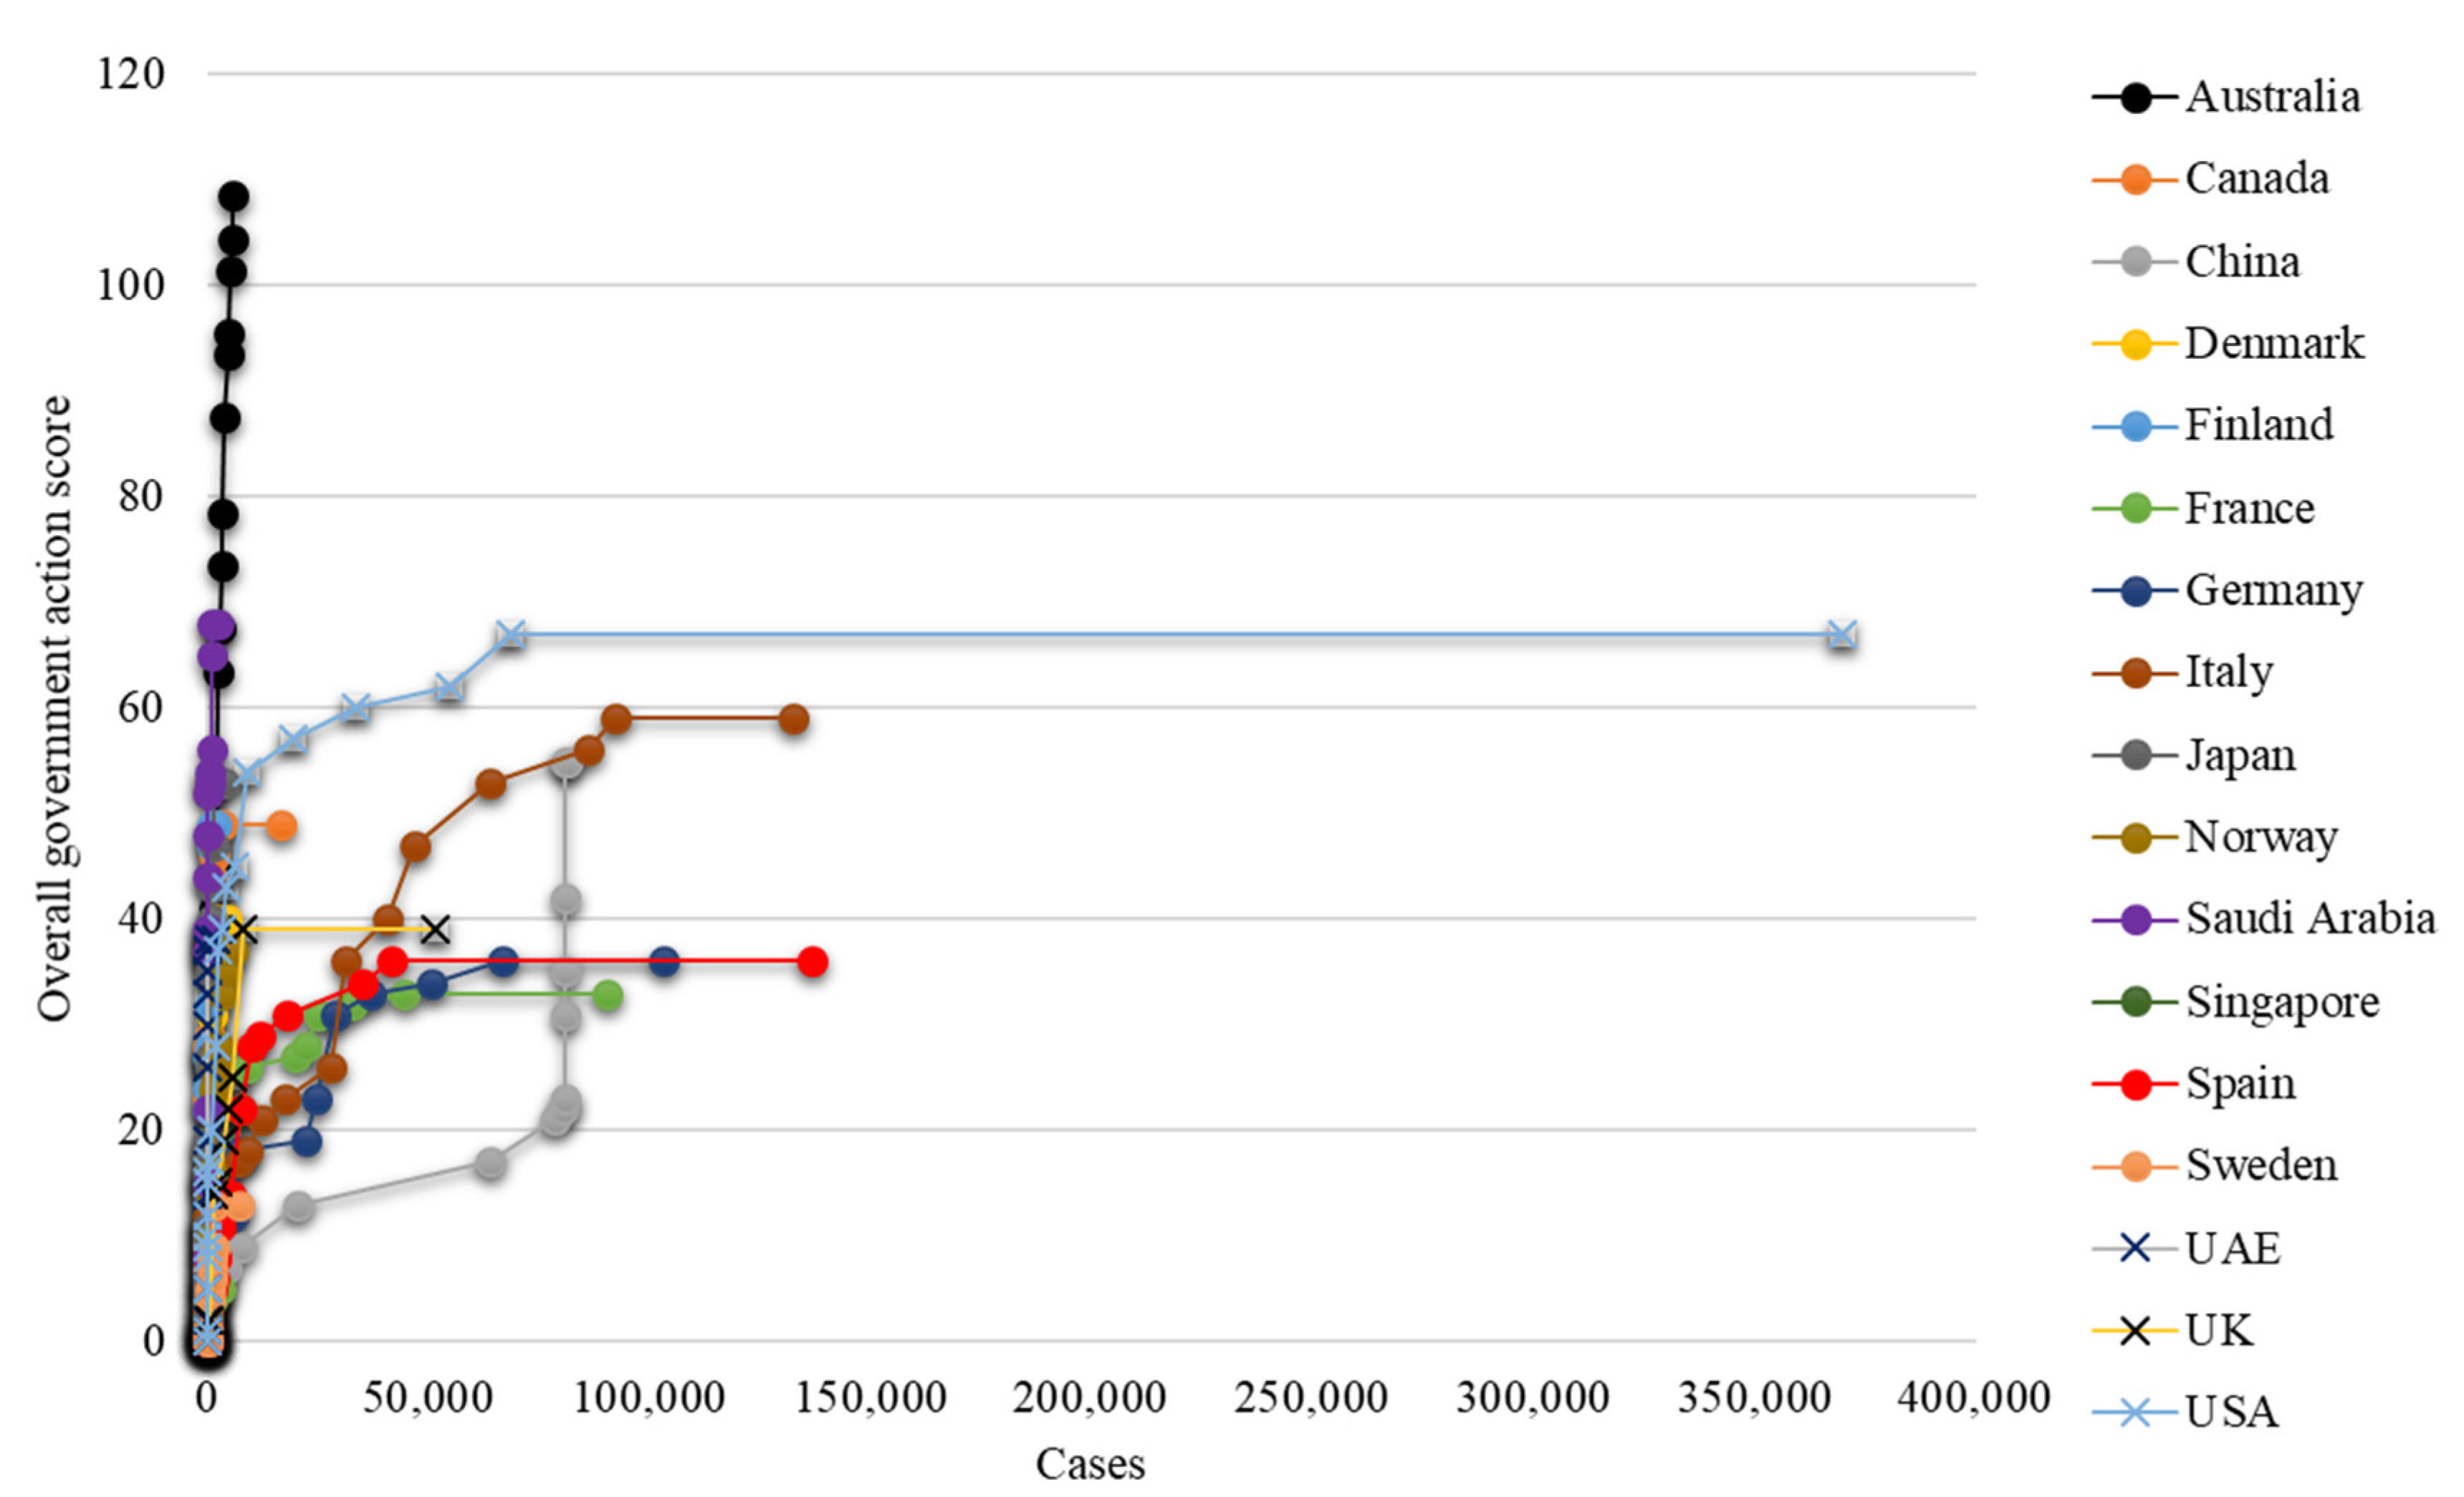
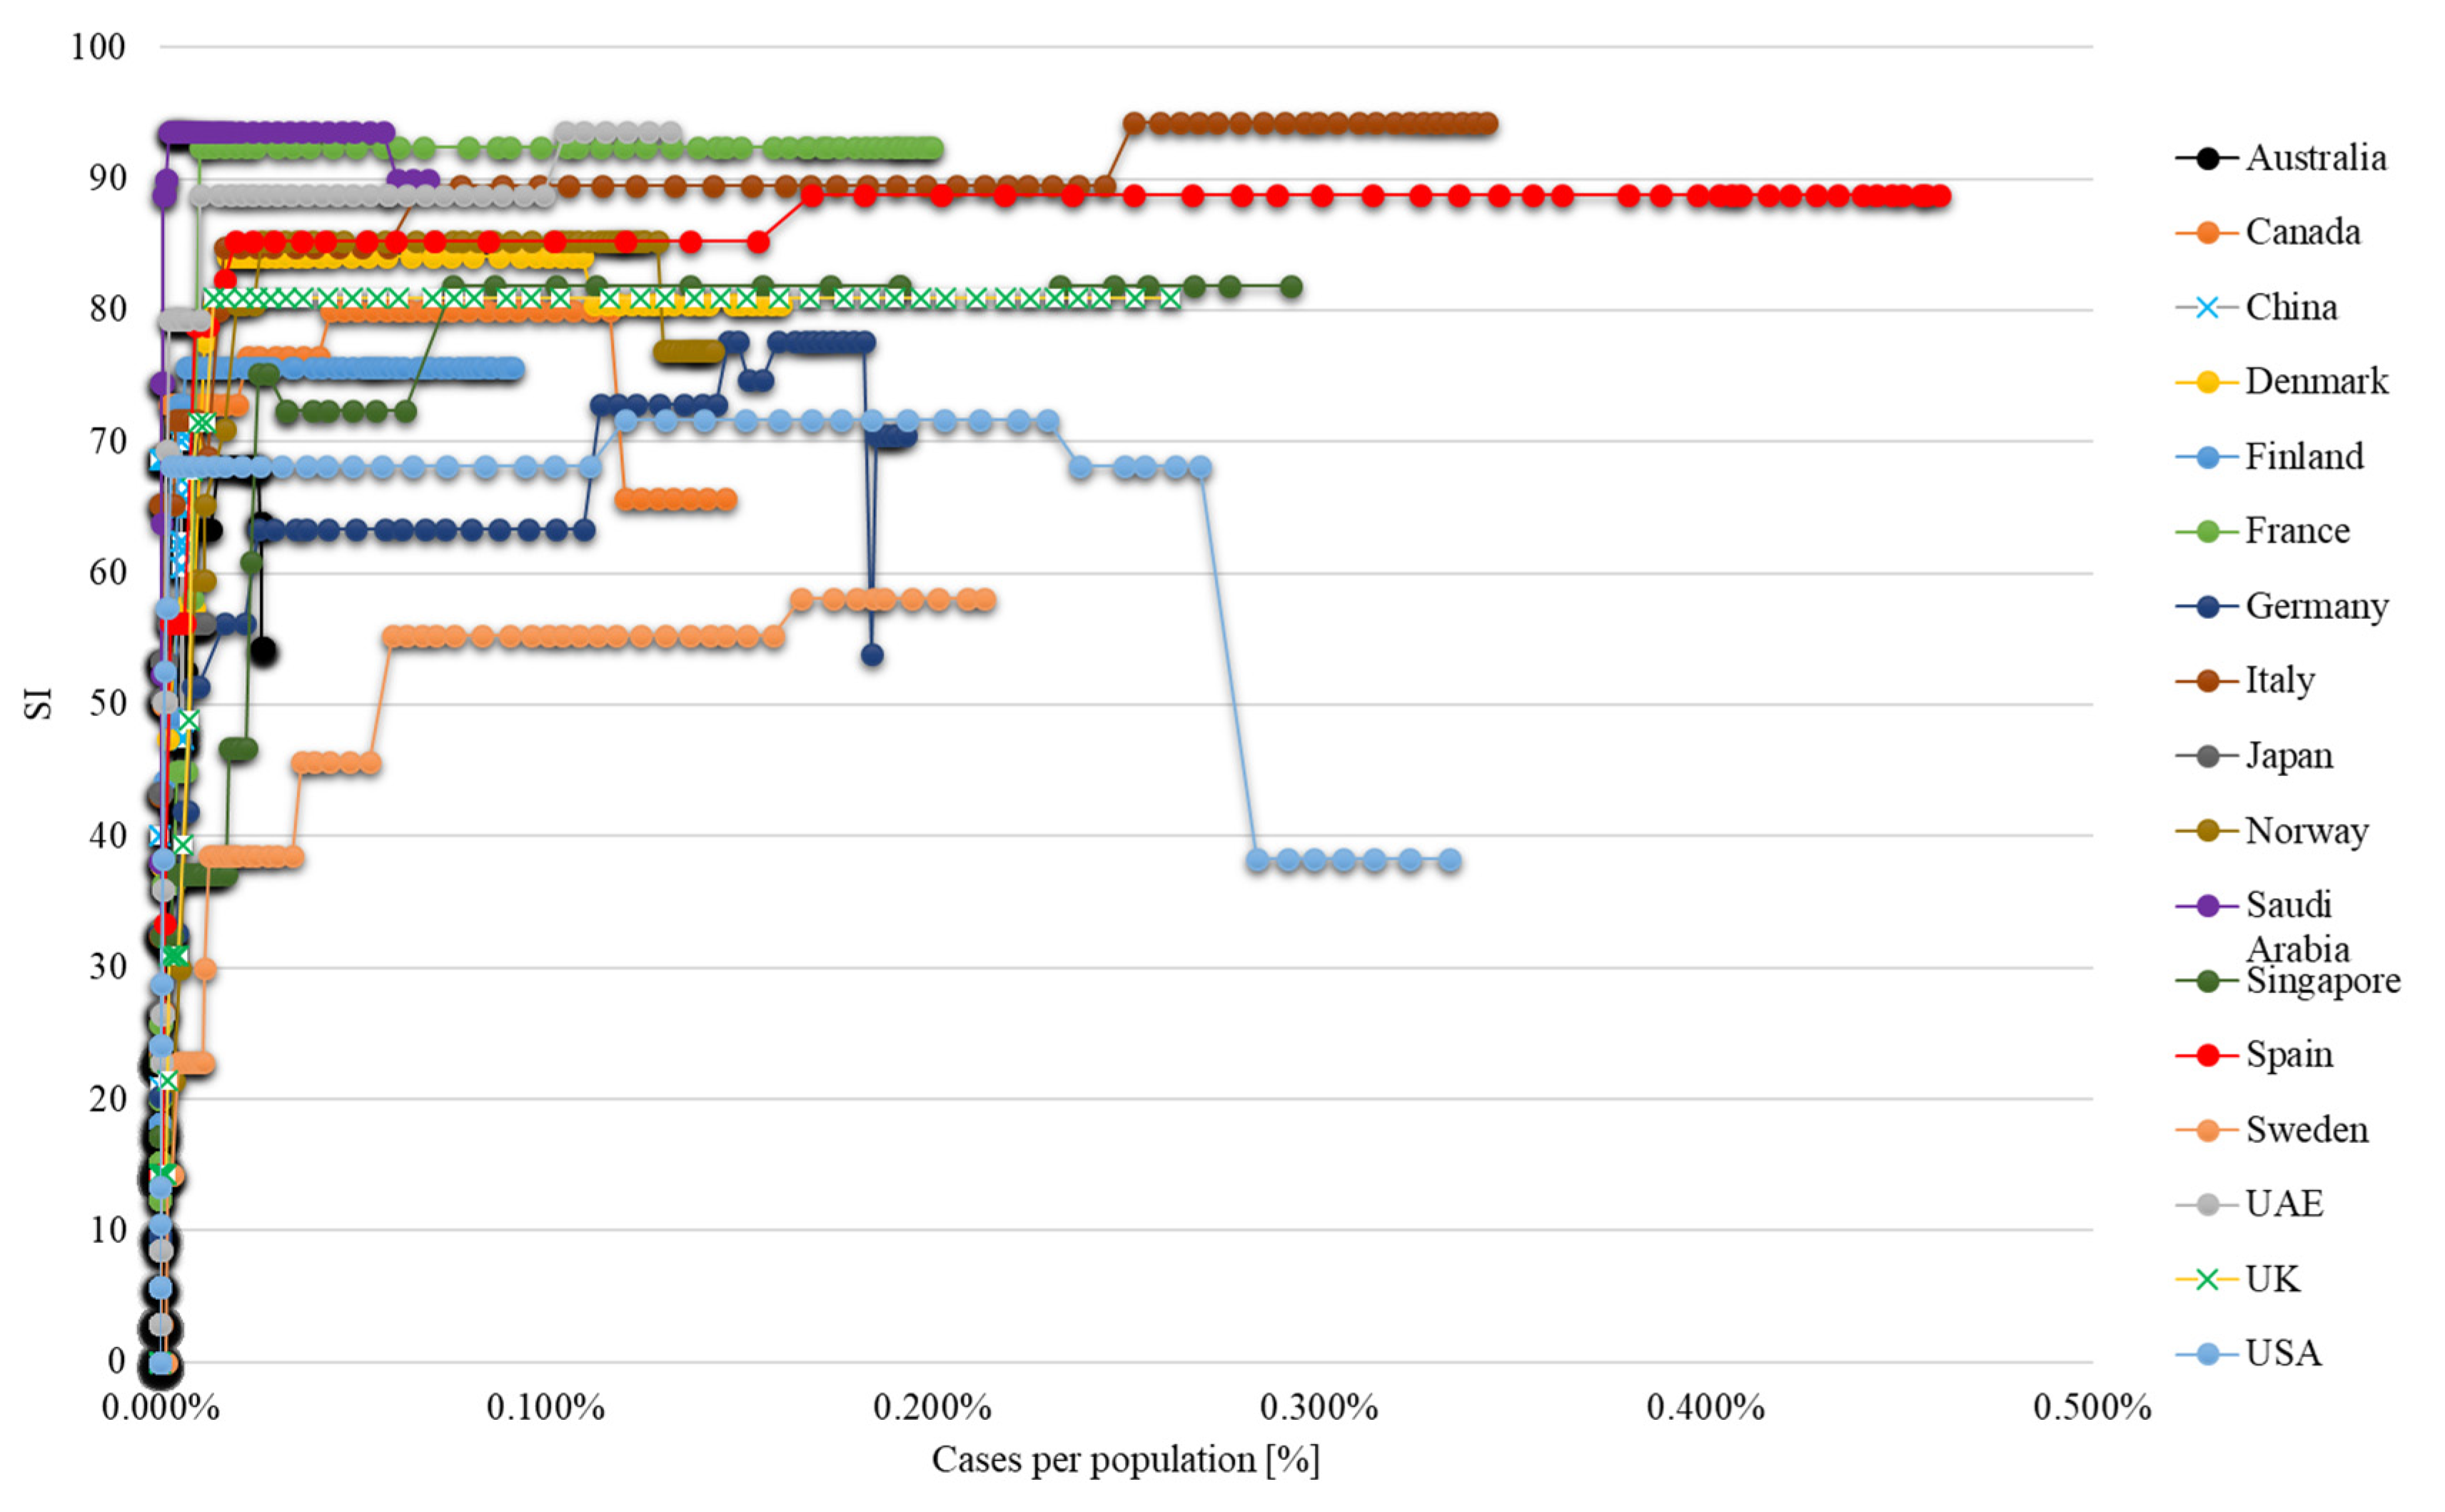
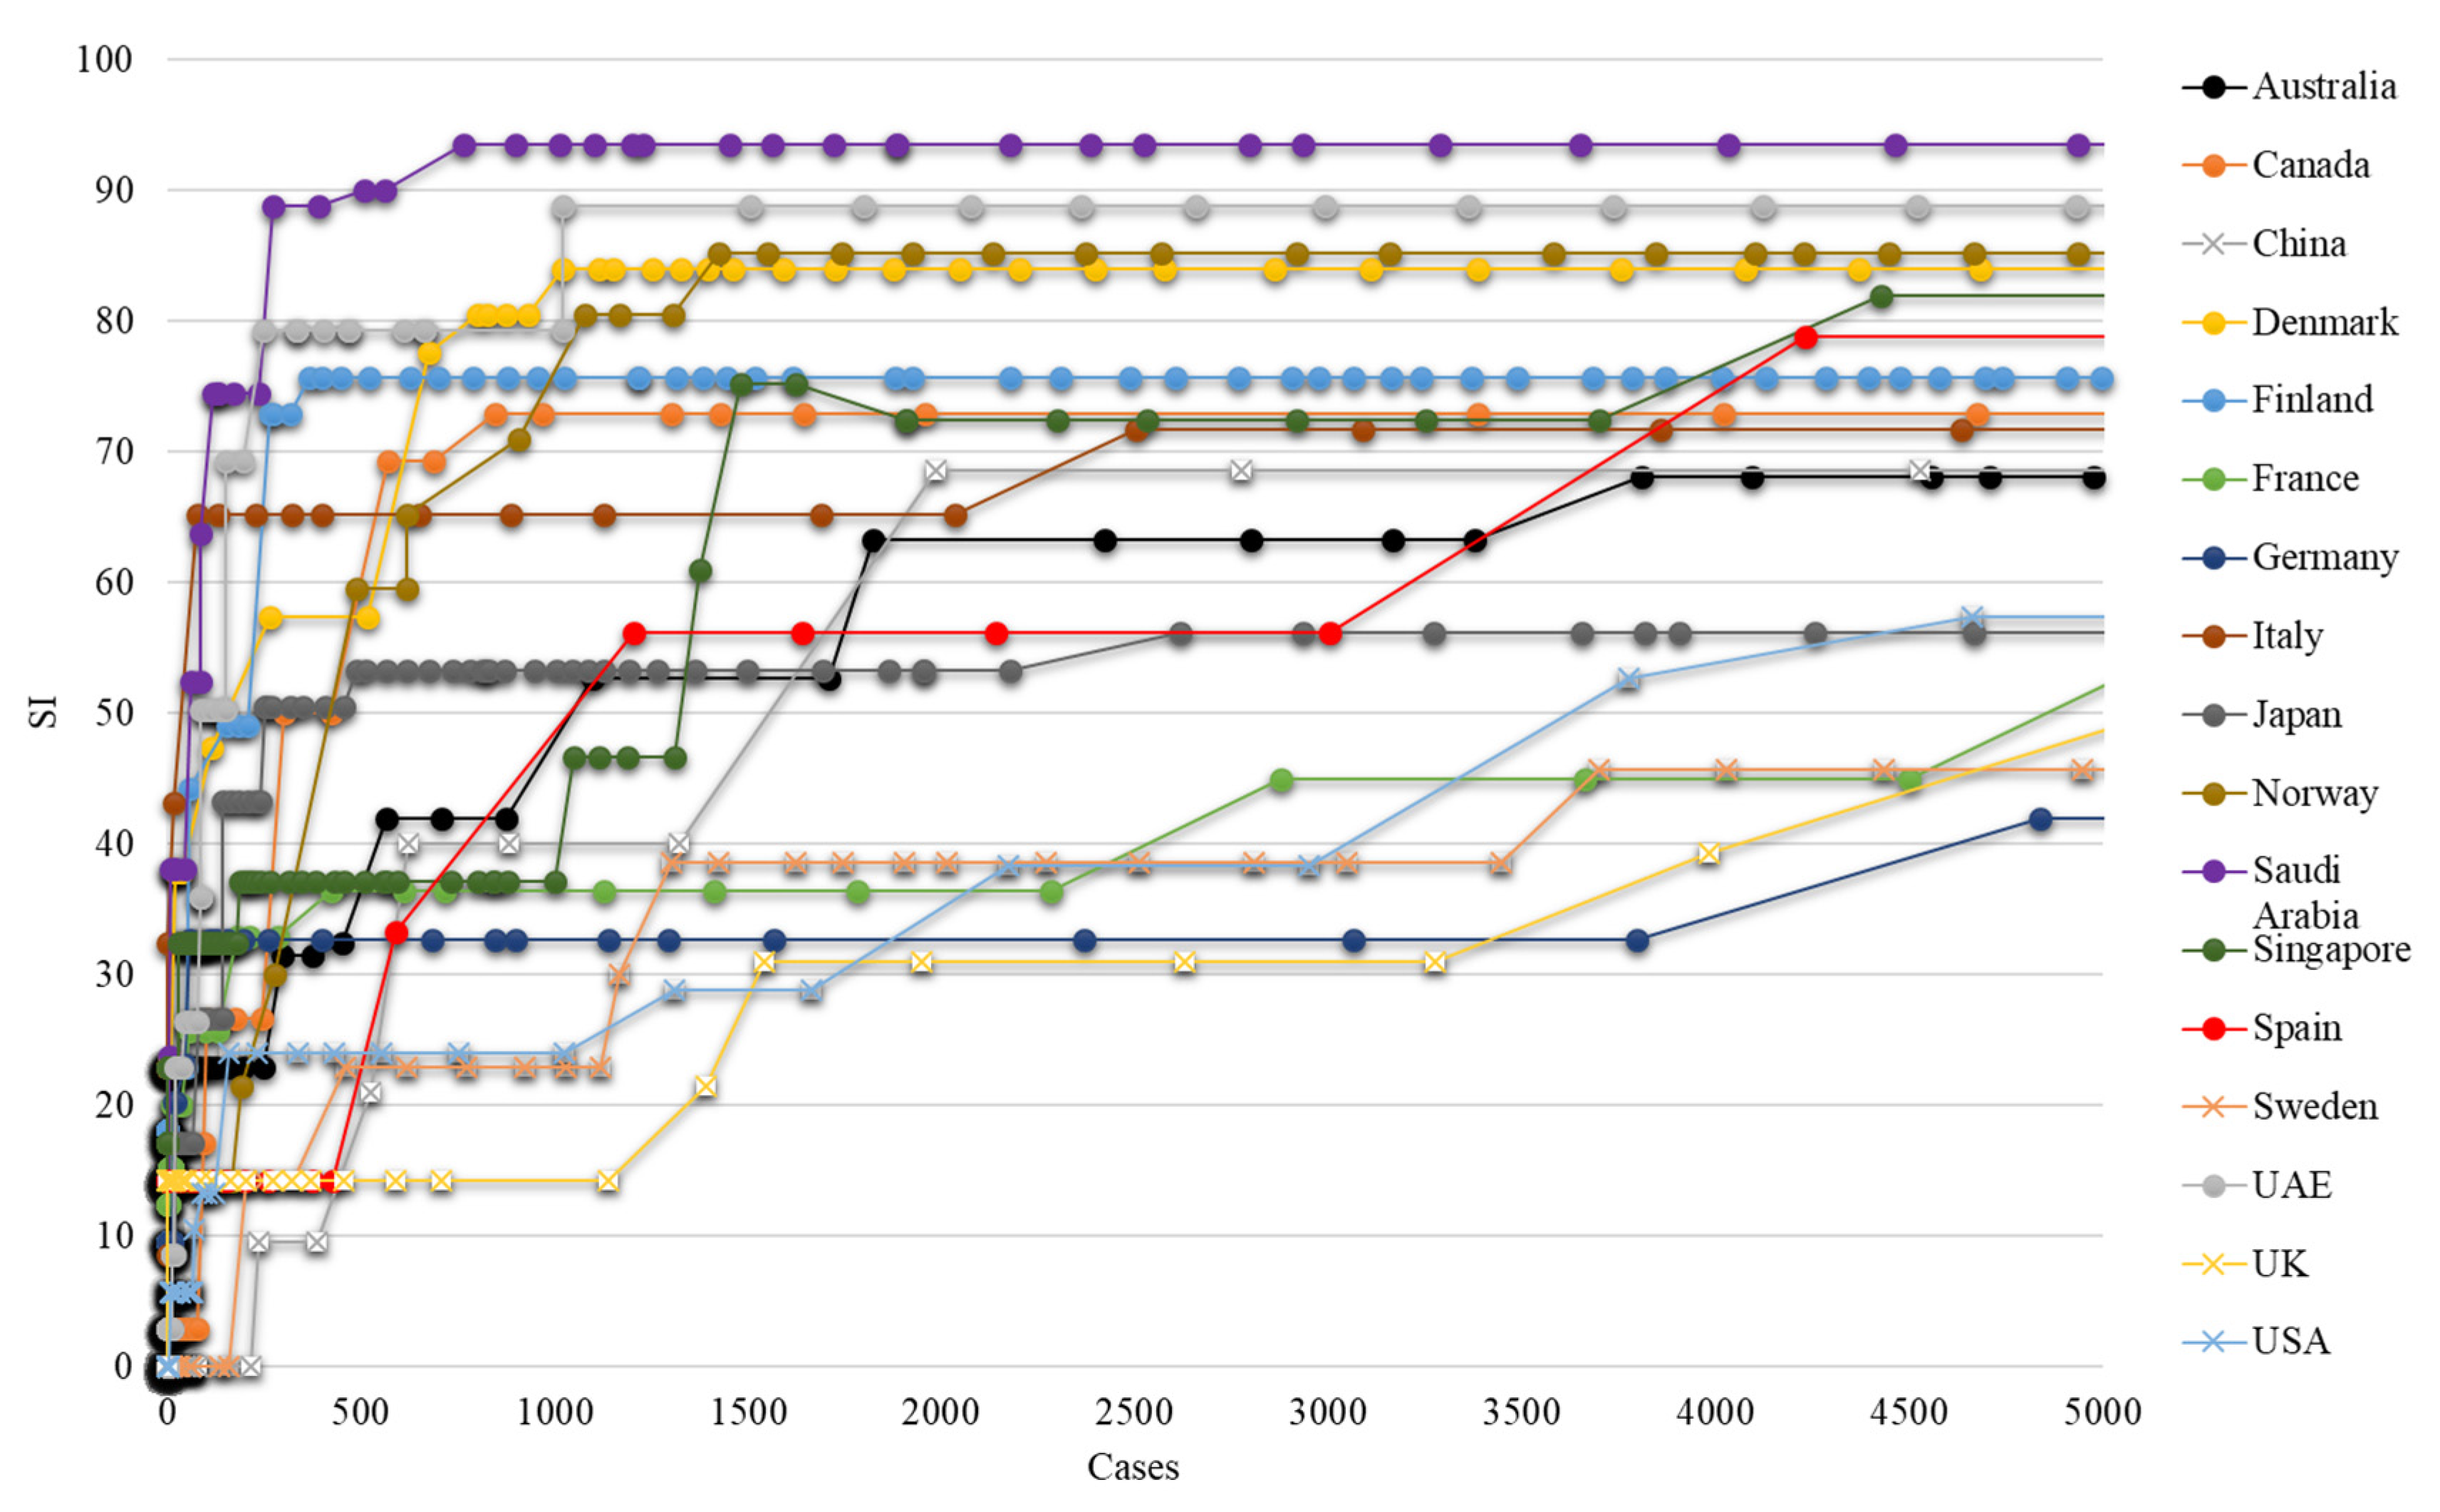
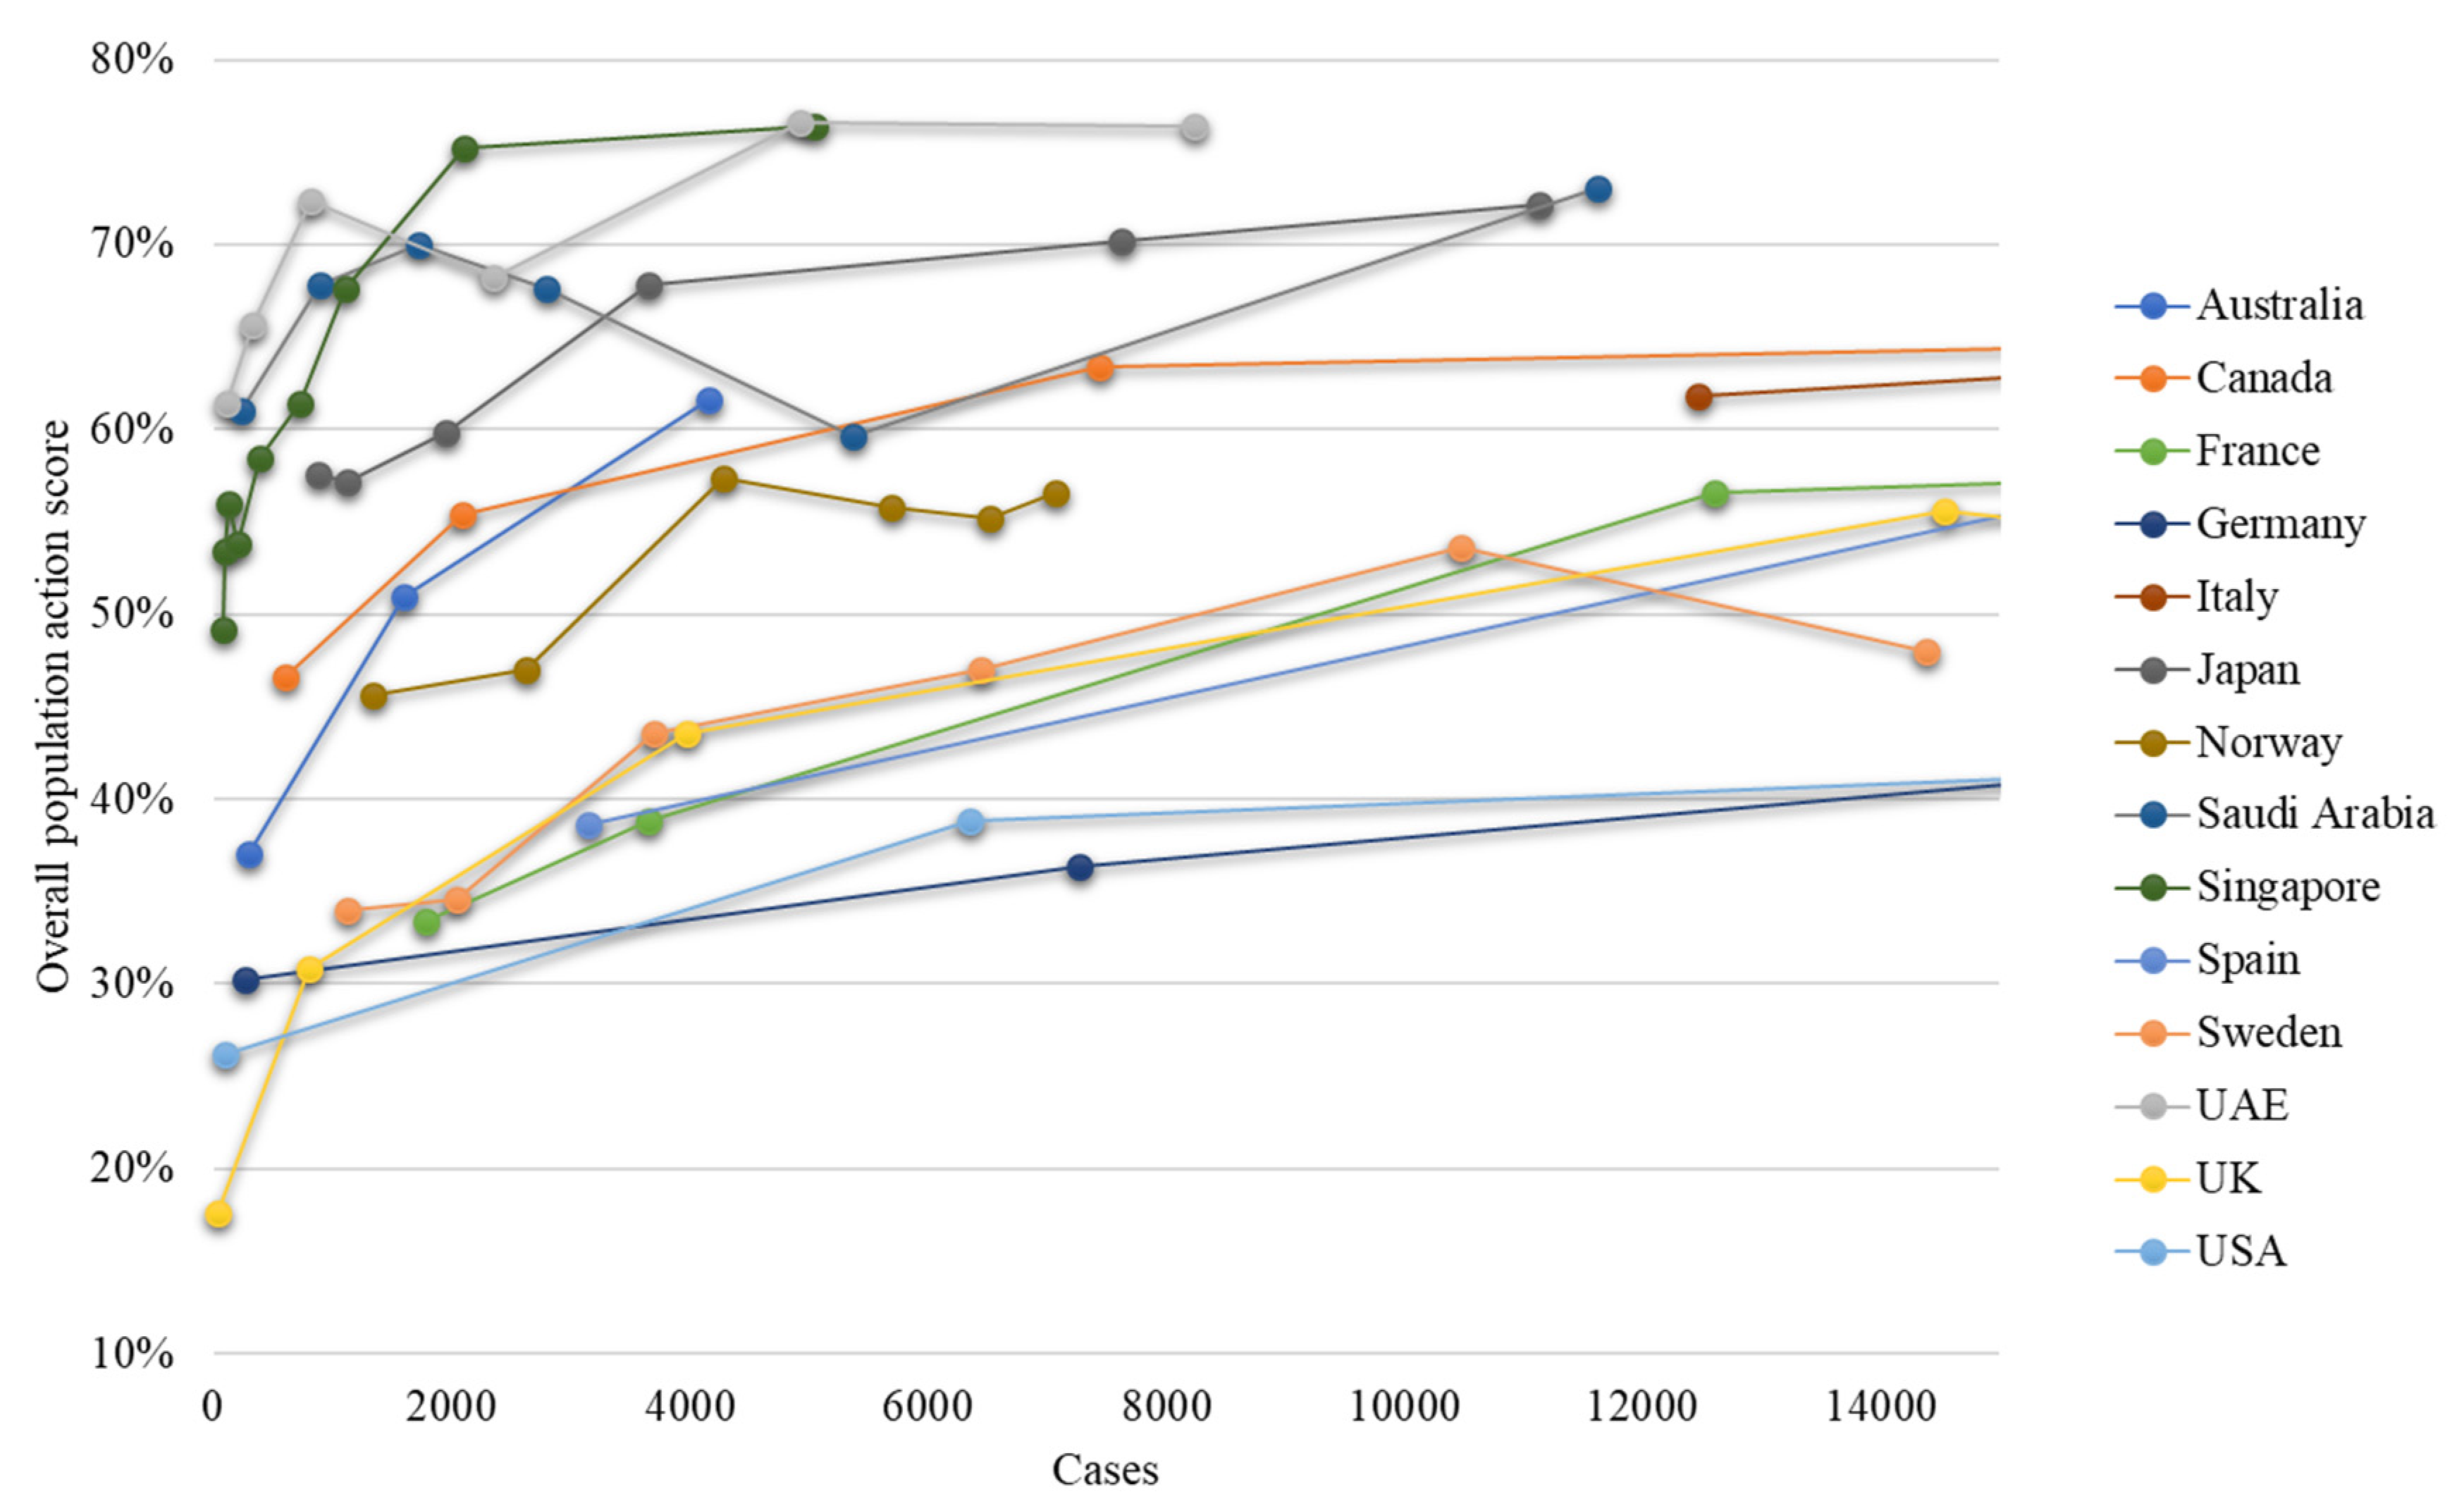
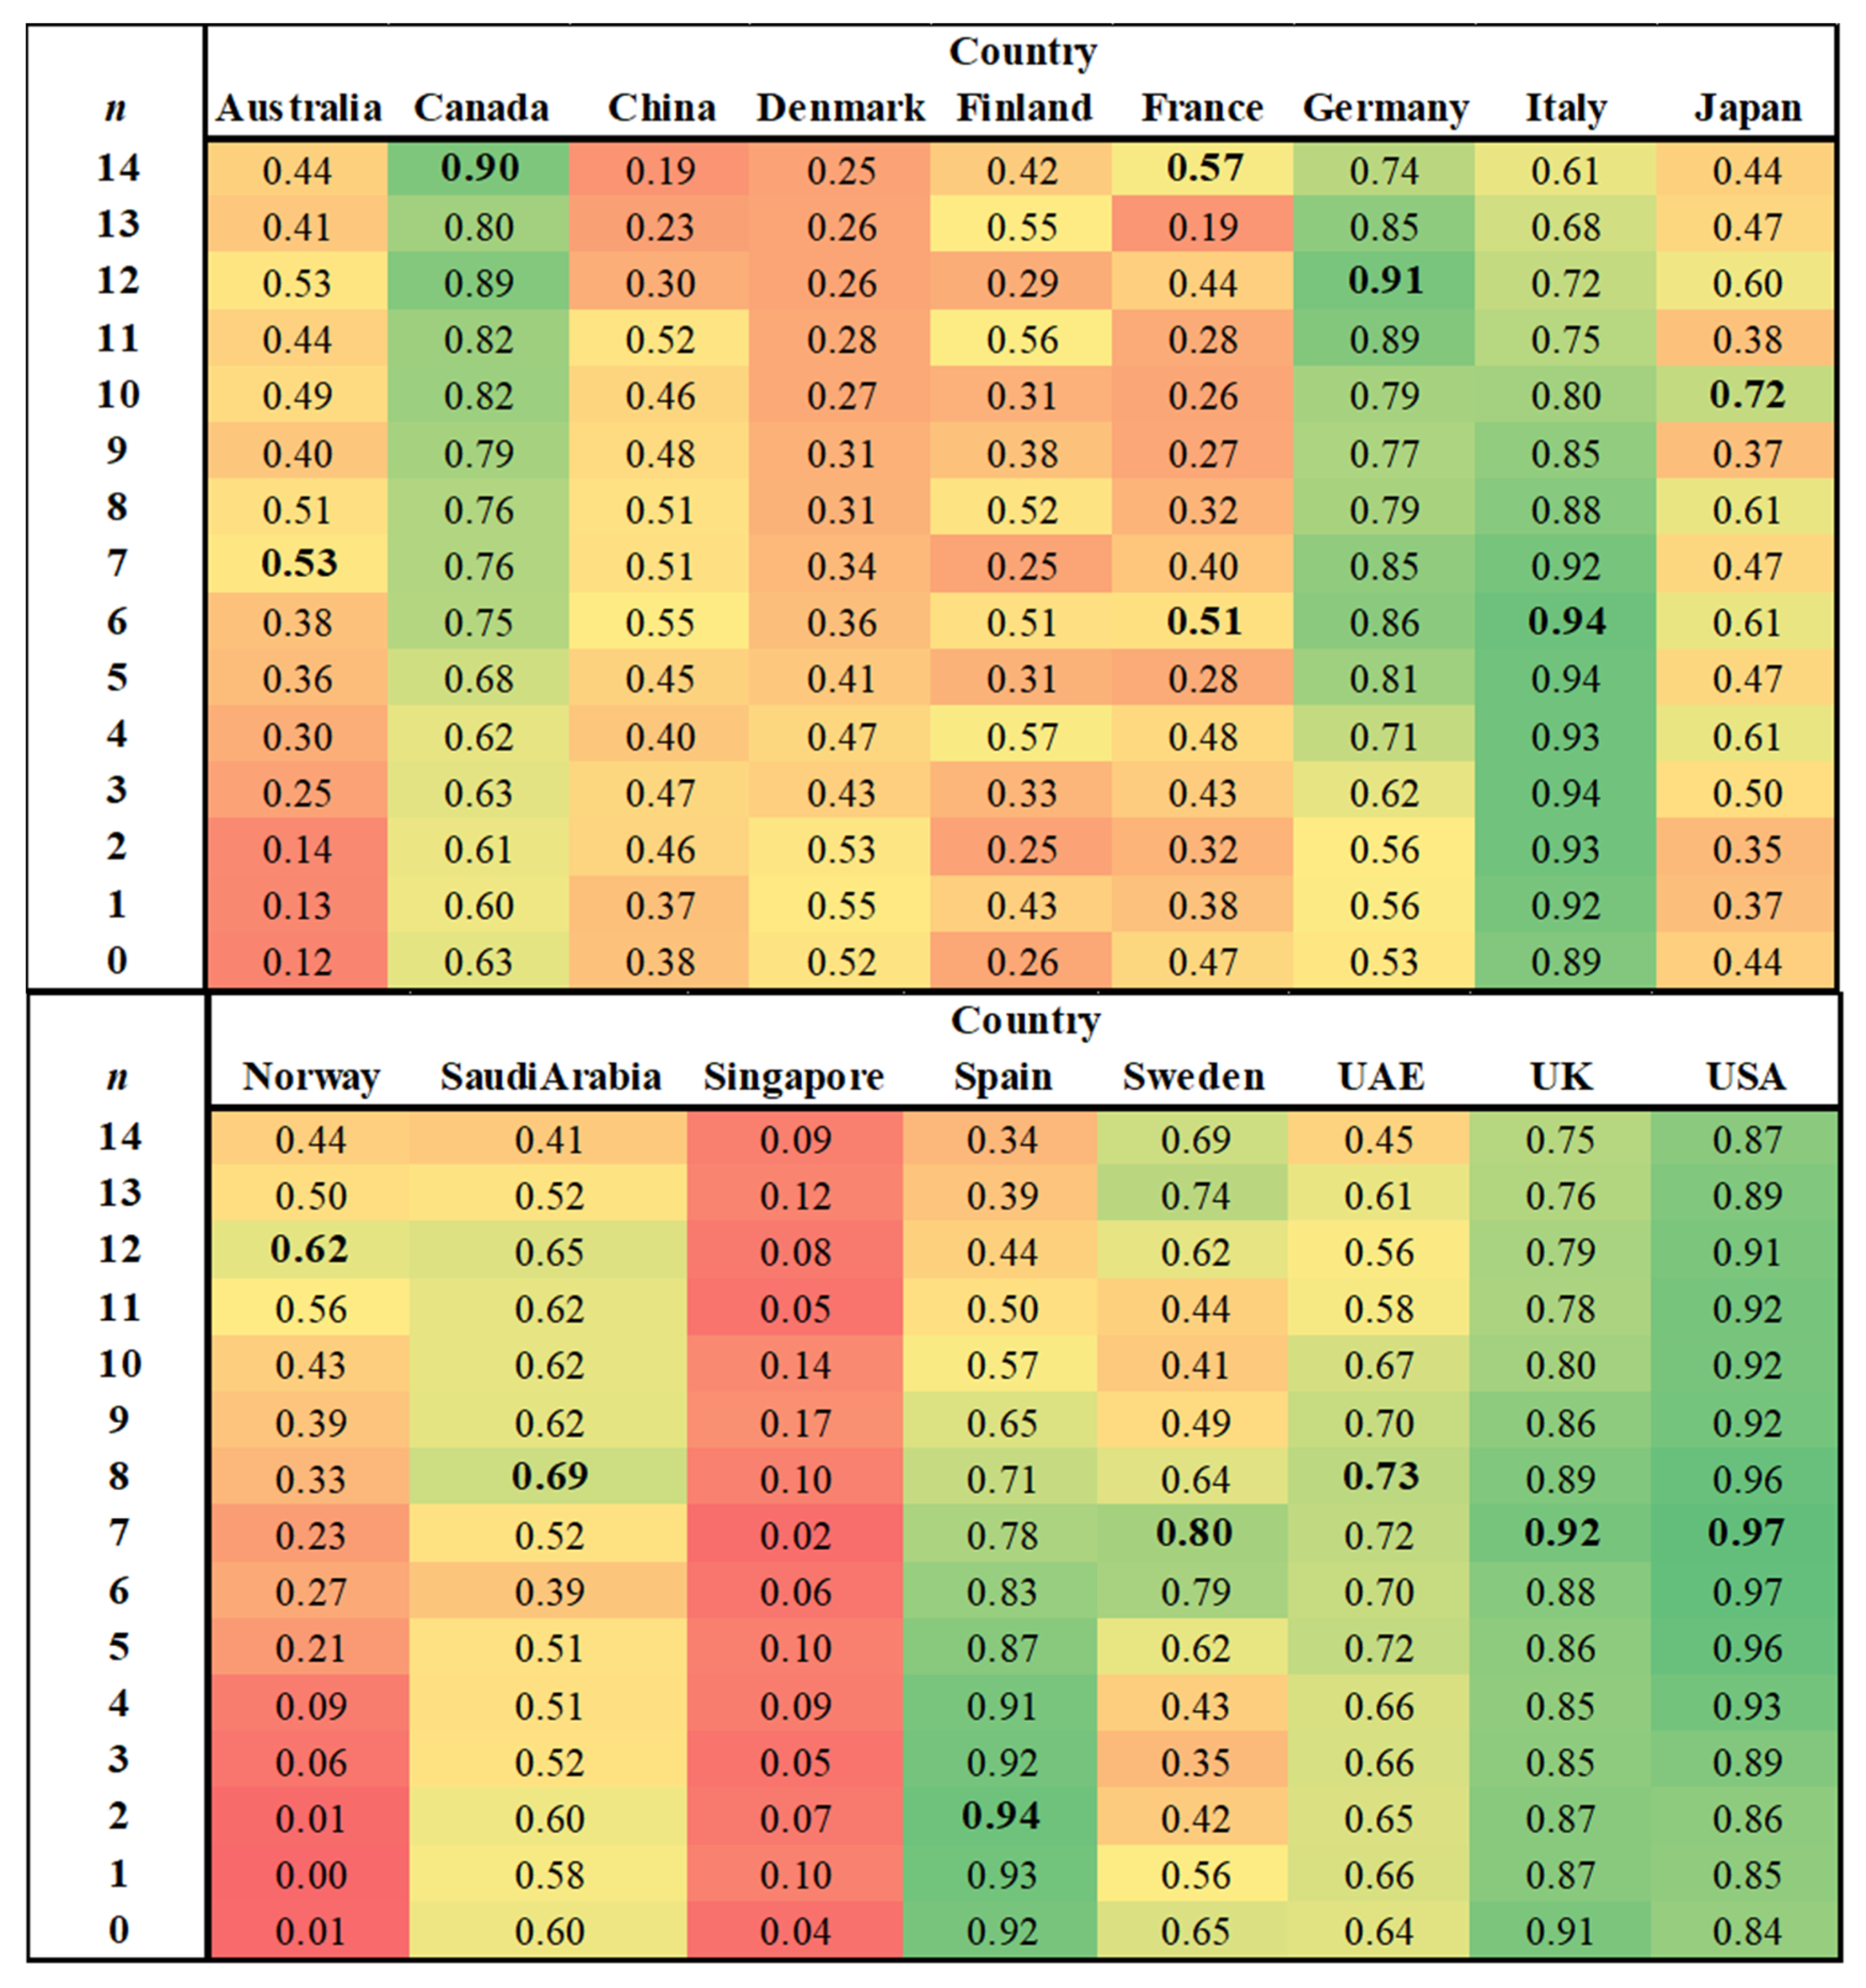
2.1. Data Analysis Outputs

Firstly, Figure 1 illustrates a breakdown of countries hit the most by COVID-19 as of mid-April, based on how quickly the virus went out of control and caused several deaths. Specifically, it shows how many days passed before significant negative milestones, in terms of death counts, were reached. For every figure presented, the bullets represent the actual measurements whilst the lines are simply connecting the bullets for visual clarity.
Spain was the country that recorded the fastest spike in deaths, with only 31 days between recording the 100th case and 10,000 official deaths. Following Spain, Italy recorded the second quickest high death count, followed by the USA, France, and the UK, respectively. Following the 10,000 deaths milestone in Europe, both Italy and Spain were more successful than the UK and France in slowing down the death rate. Similarly, though the USA trajectory was the same, the exponential increase in deaths continued past the first 10,000 deaths, reaching the sad milestone of 20,000 deaths far quicker than any other country. In contrast, Germany recorded lower and later deaths at the beginning of the outbreak, as well as a slower increase in death count. Canada and Sweden had even an even slower and more delayed death count, while at the time of writing, Japan recorded only a few hundred deaths, which also started to accumulate well after the first few registered COVID-19 cases.
Figure 2 illustrates how prompt the overall response of different governments was in the early stages of their respective national COVID-19 outbreaks. A complete figure showing the overall time series based on normalized (Figure A1) and overall (Figure A2 and Figure A3) number of cases, as per 10 April 2020 is provided in the Appendix A.
The lowest government action (GA—refer to Section 4.2) early scores were from Scandinavian governments, such as in Sweden and Norway. Spain, Italy, France, and Germany followed thereafter. The quickest countries to implement measures were Saudi Arabia, UAE, Japan, the USA, and Canada. Australia had a moderate early response, though a constant stepwise introduction of new measures quickly made it the country with the highest GA score. Noticeably, these charts put the government action in perspective, based on the country population. Australia has a population which is about 13 times lower than the USA; hence, if the government action score was compared against the absolute number of cases, Australia would comparatively have a much prompter and earlier response, while the USA would plummet in this ranking (Figure A2 and Figure A3). In Appendix A, the same charts for the Stringency Index [10,11] are presented for comparison purposes (Figure A4, Figure A5 and Figure A6). The trends are quite similar with the main differences being France, Italy, and Spain having comparatively a higher early SI than GA, while the USA, UAE, and Australia had lower SI scores in comparison to their respective GA results.
Figure 3, in contrast, displays the calculated overall population action score (refer to Section 4.2), and its variation over time during the early stages of the outbreak.
Both the UK and the USA started with very low scores, with values increasing over time to low-to-medium range values, with the UK score then decreasing again. Despite appearing to have an early and steep score increase, the large populations of the USA and UK compared to the other countries shown in Figure 3 highlights that their increase in population score was not particularly prompt when considering the absolute number of cases (Appendix AFigure A7), but instead it occurred when several cases were already recorded. Germany and Sweden, although slightly better, recorded low scores and little improvement over time, while France started low but had a more significant improvement as cases increased. Canada, Italy, and Singapore had moderate initial scores, with improvements over time (Italy did not have early data as the outbreak in the country began before the survey study commenced). Japan, the UAE, and Saudi Arabia all had very high scores, although the latter showed a decrease over time.
Figure 4 displays the total number of reported tests performed over time in relation to the number of recorded cases.
A stark difference can be noticed between Australia, Germany, and Canada, and other countries such as the UK, USA, Sweden, Italy, and France. By the time 5000 cases were recorded in each country of the former group, approximately three times more tests were performed than by the countries in the latter group. Japan’s testing numbers fall between the two aforementioned groups. Countries with no or limited data to more recent days (e.g., Spain or UAE) are not shown in Figure 4.
Relating to the above figure, Figure 5 displays the relationship between the amount of testing performed and the number of patients recovered in intensive care units (ICUs) at a specific point in time, when 5000 cases were officially recorded.
A non-linear negative relationship is evident, illustrating that countries with very low number of patients in ICUs, such as Australia, Germany, and the UAE, were, with the exception of the USA, those who performed the highest number of early tests. All countries recording high numbers of ICUs (e.g., Italy, Sweden, France) also performed the lowest number of early tests. As shown in later tables (Table 1) and Appendix charts (Figure A9), those countries with higher patients in ICUs and lower testing had a shorter time delay between the number of cases and number of deaths.

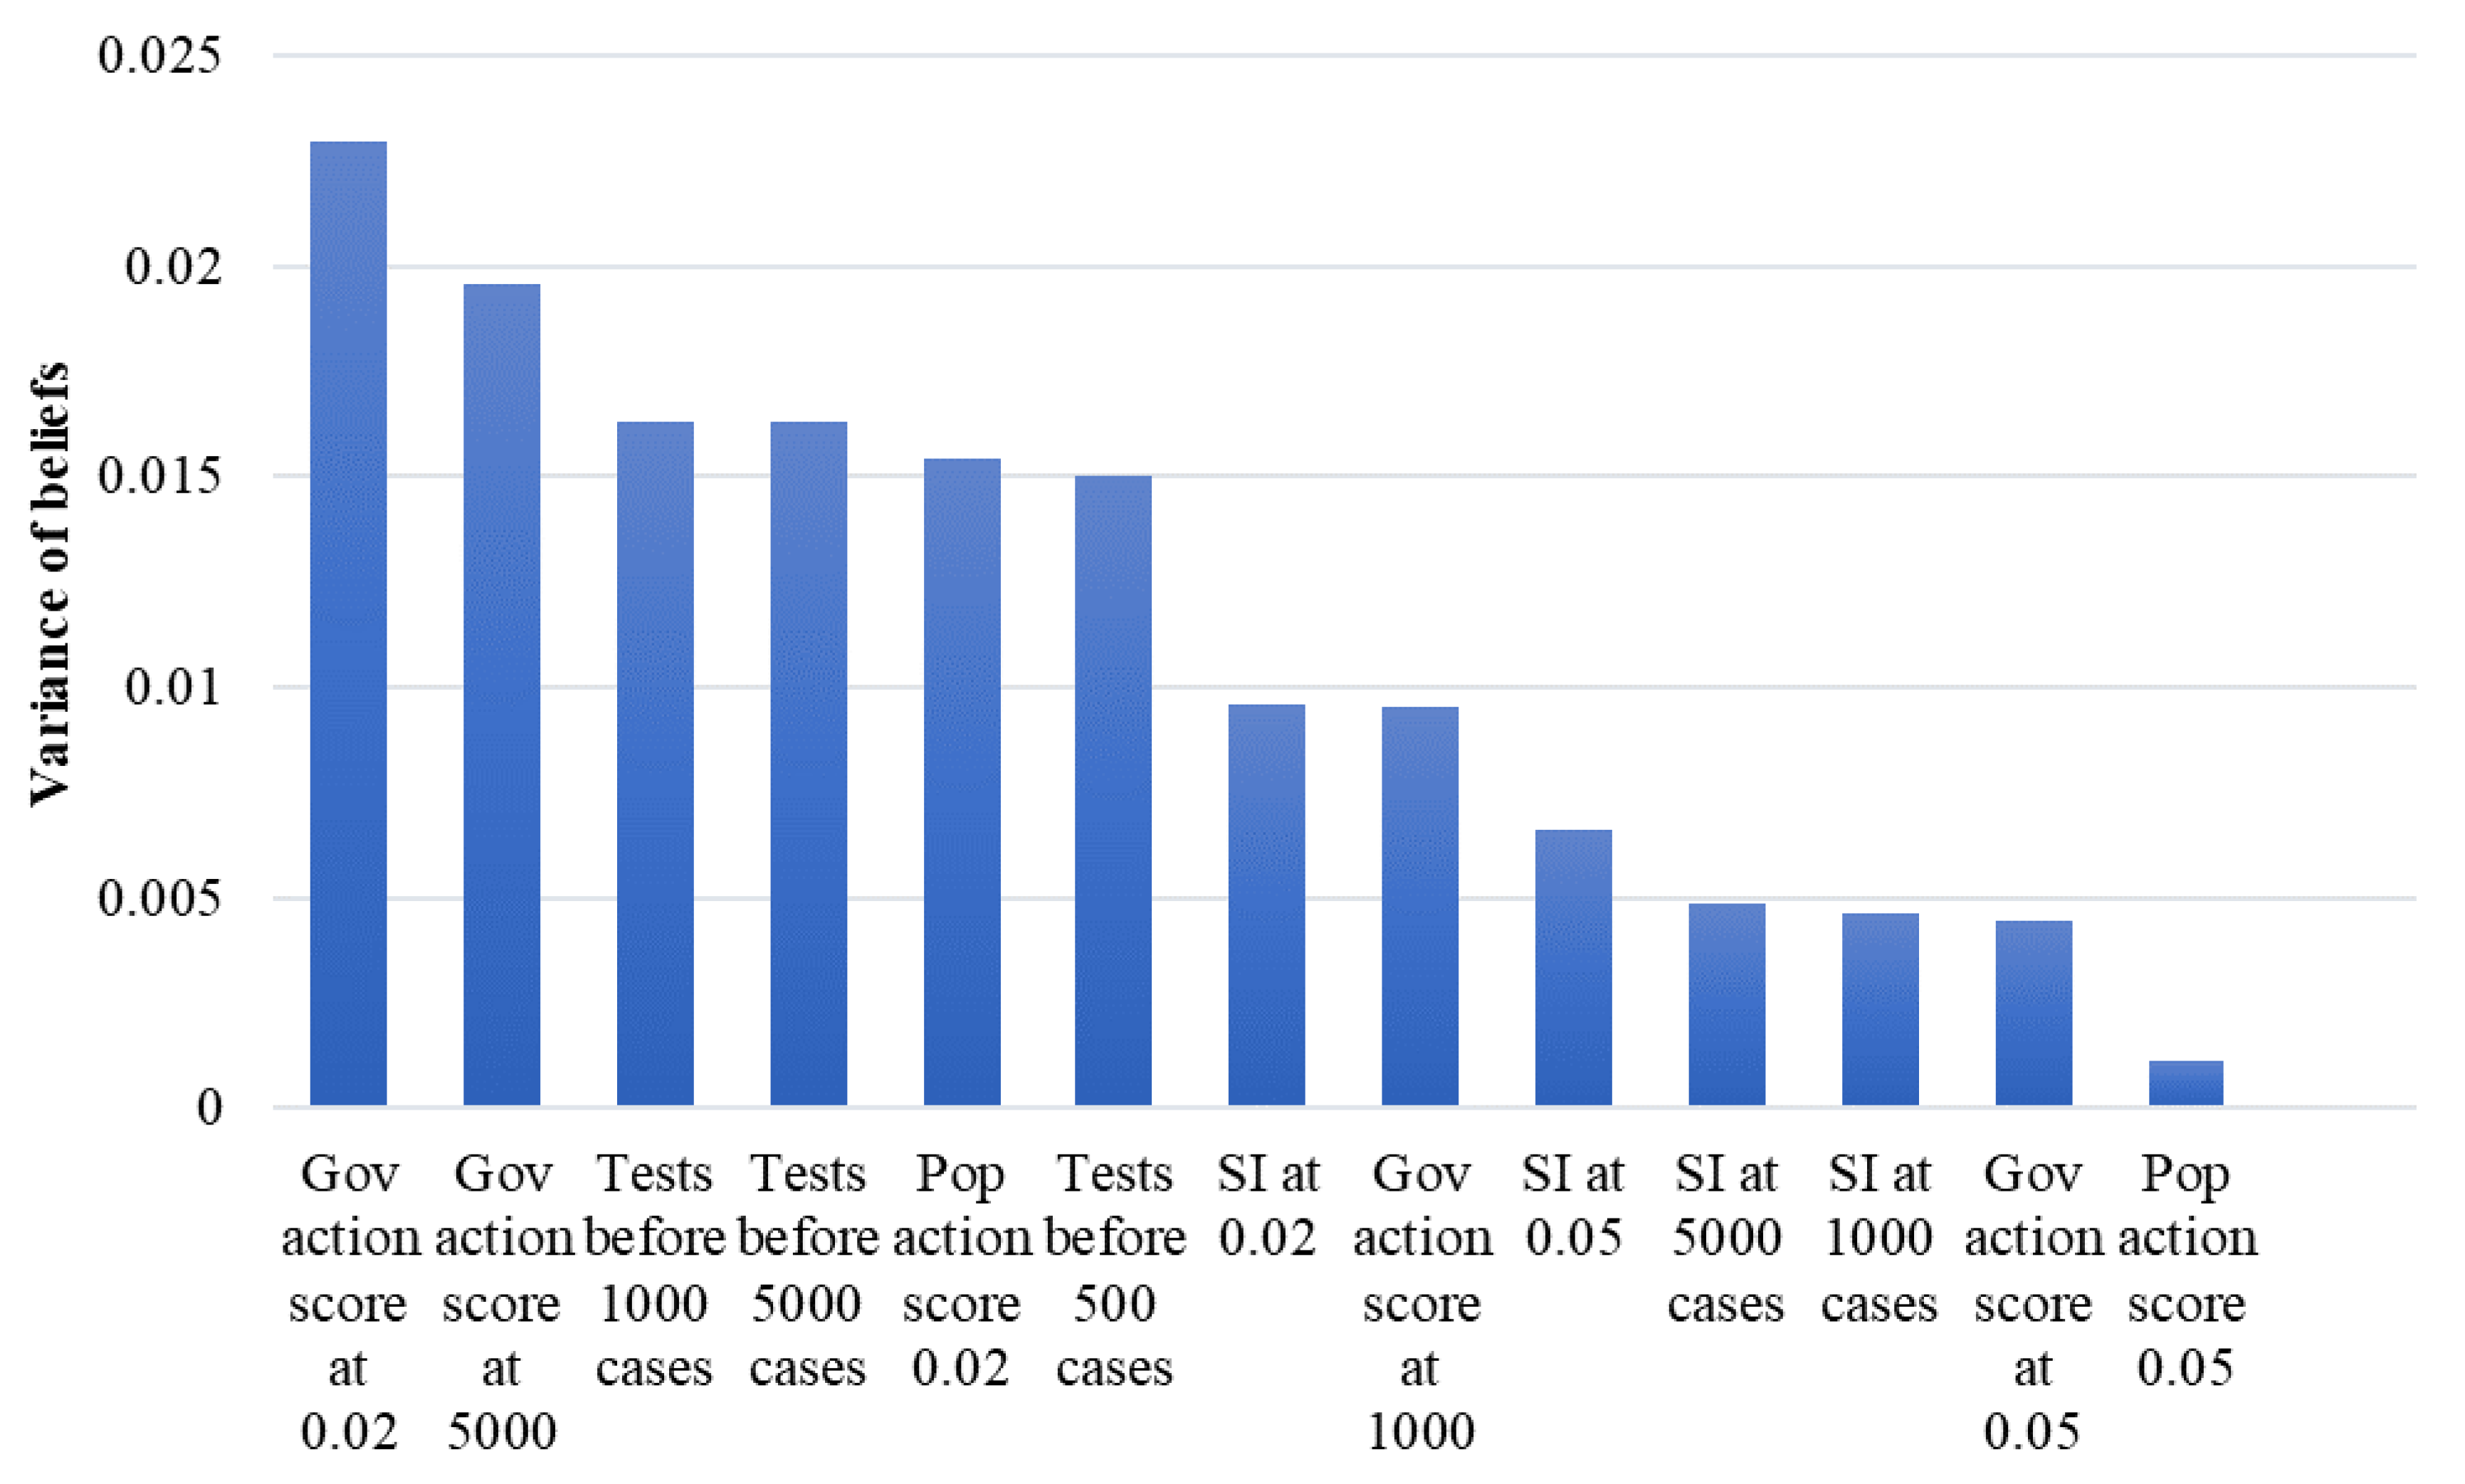
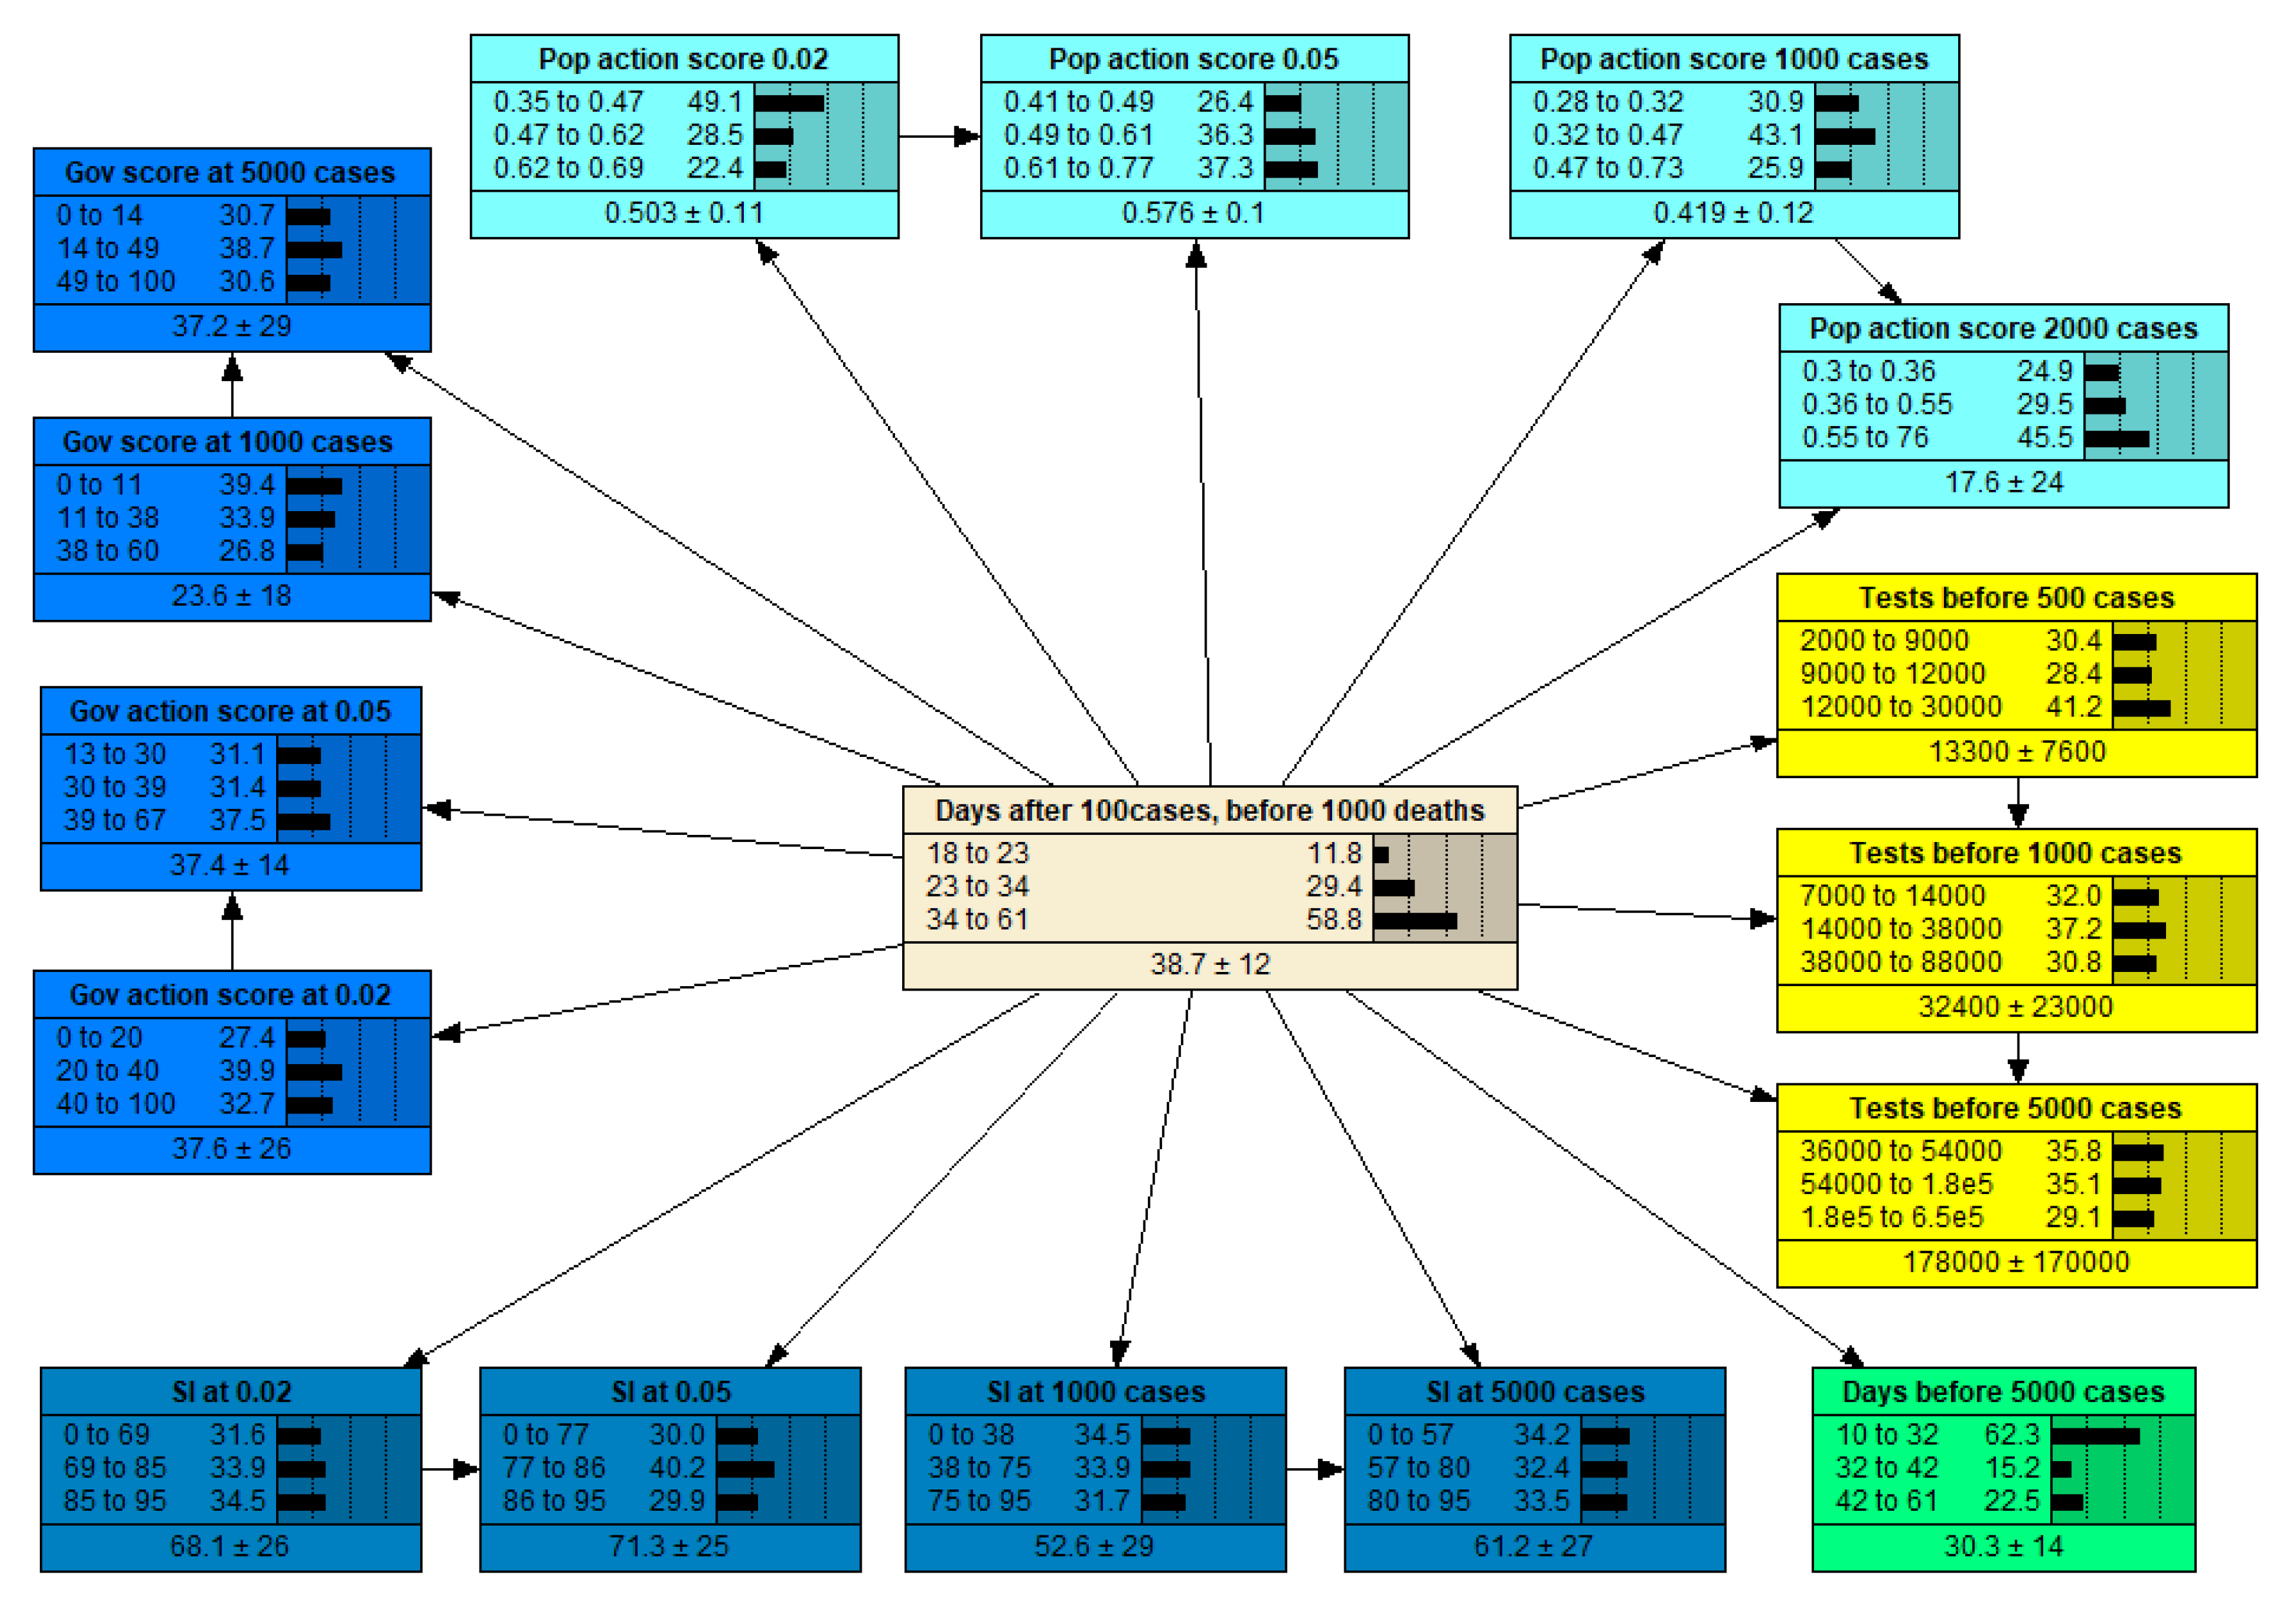
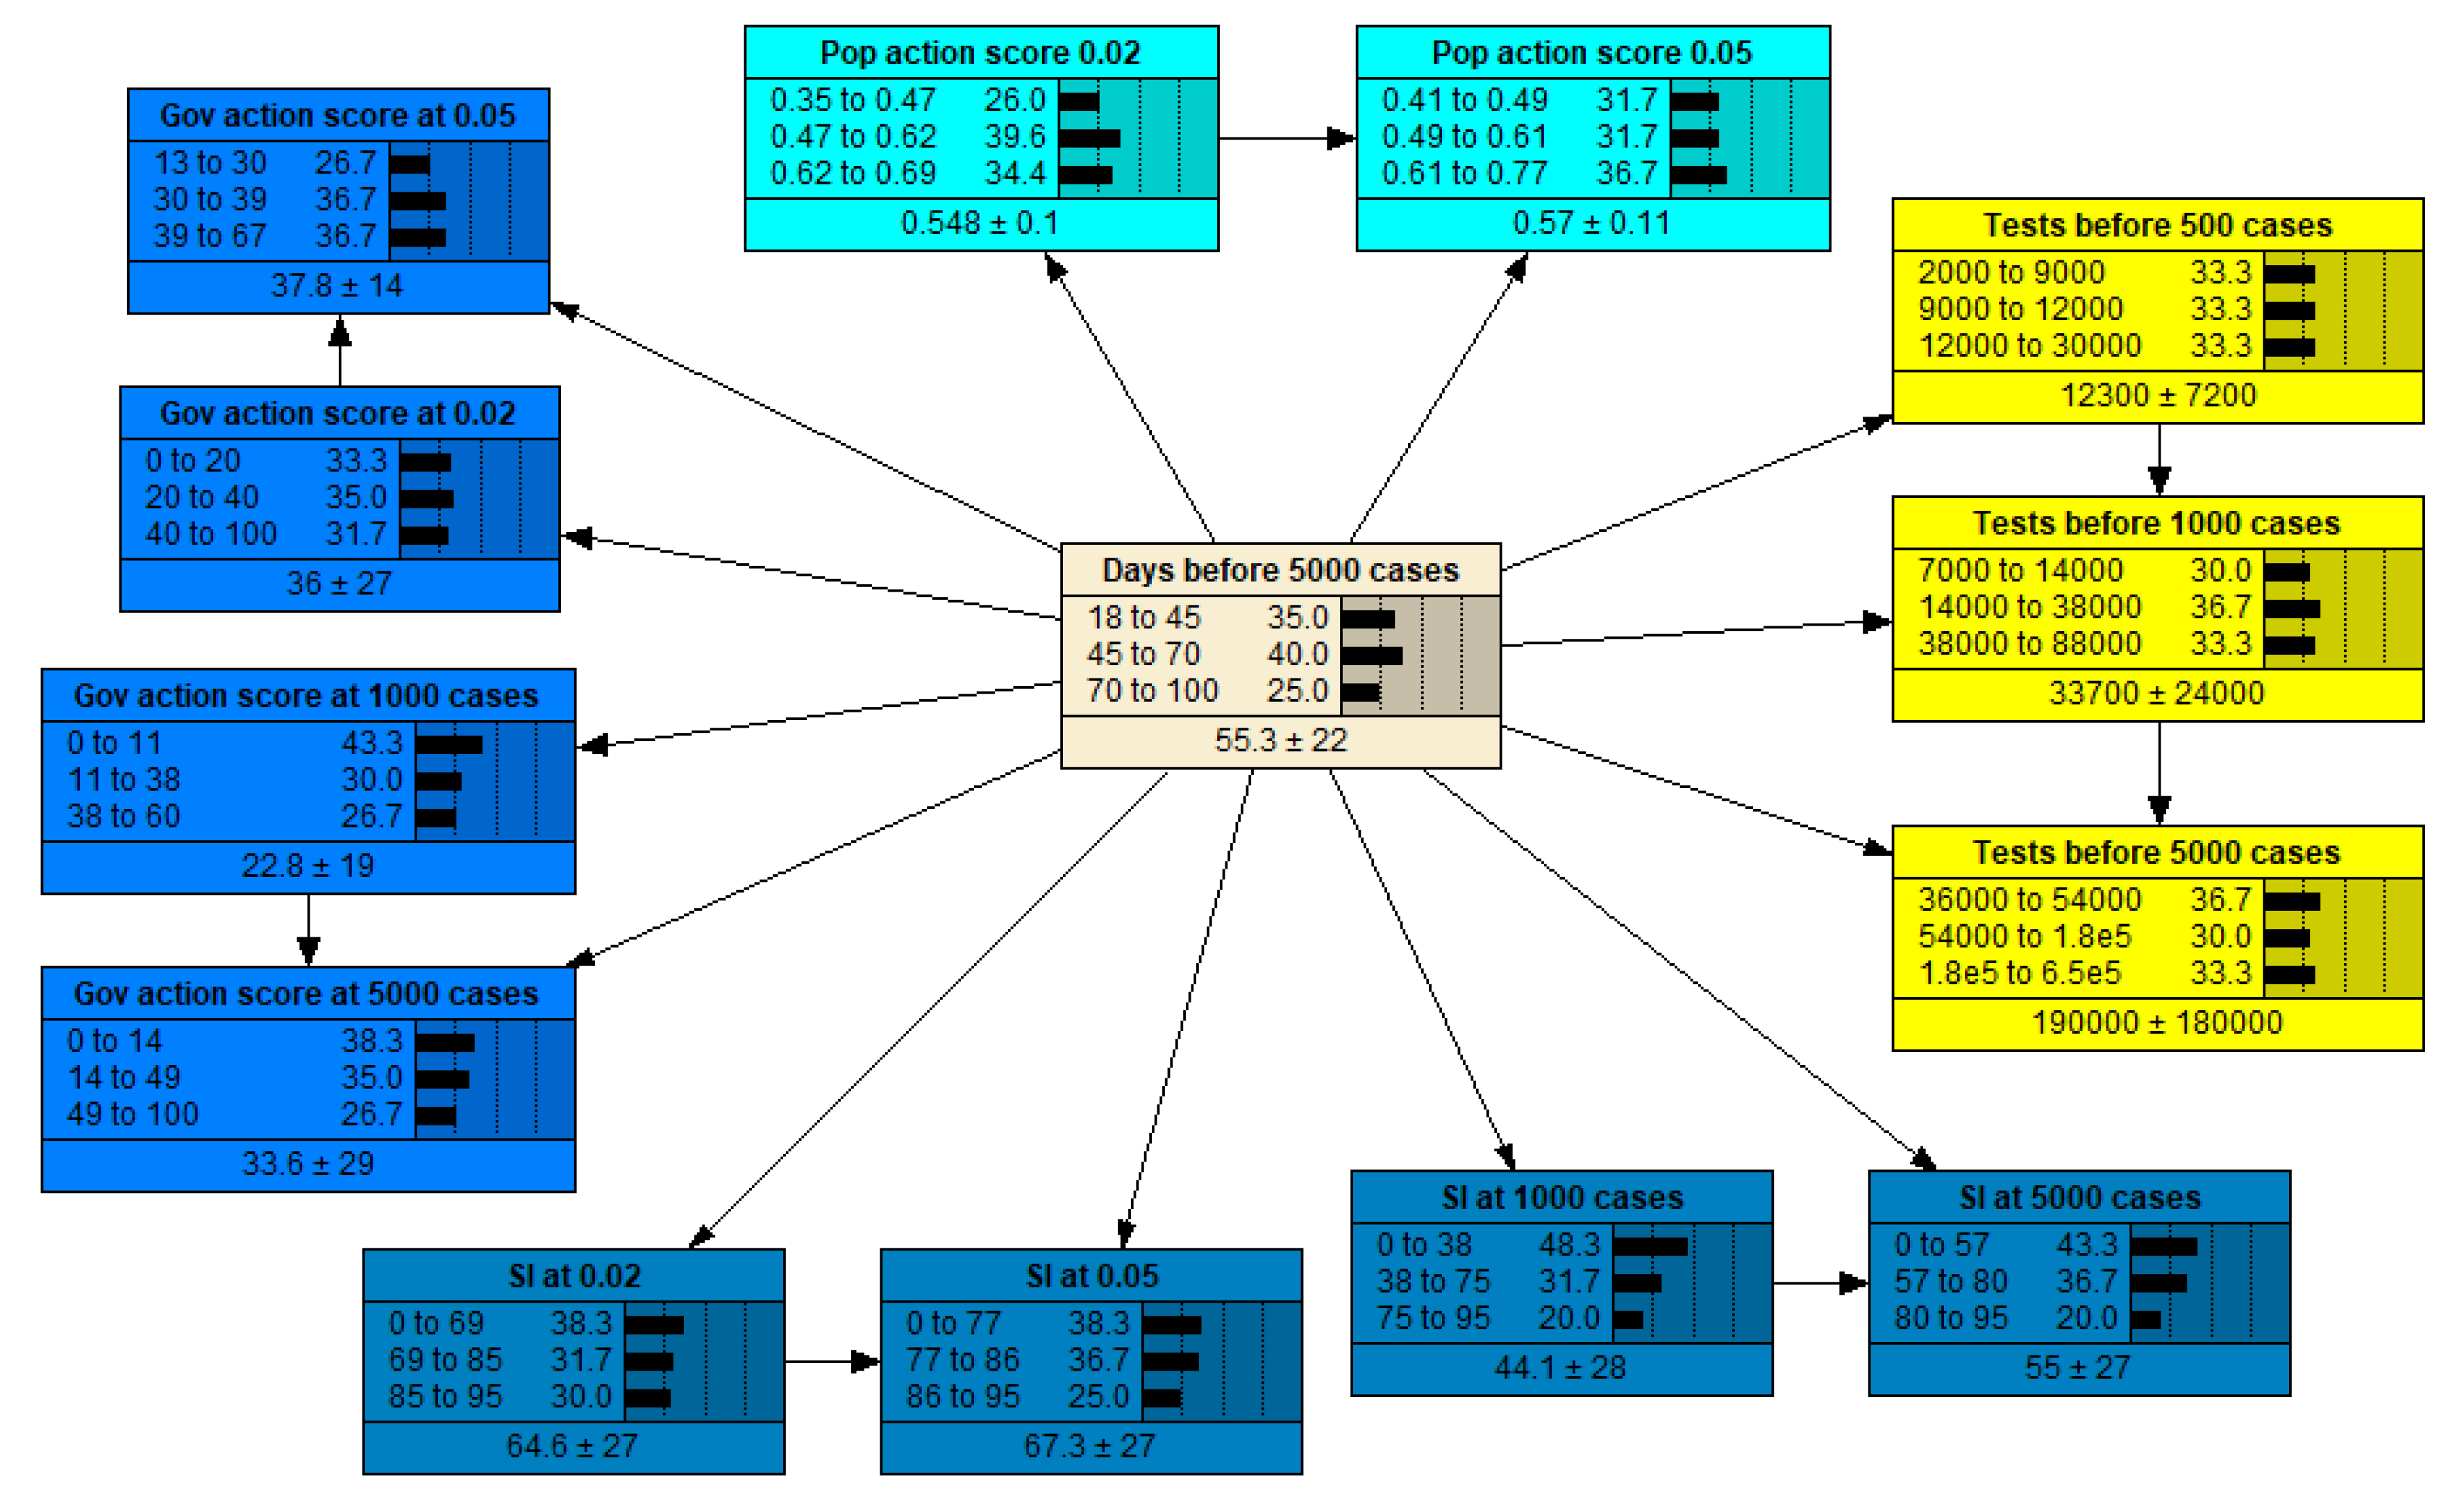
2.2. Bayesian Network Outputs

Figure 6 and Figure 7 show the sensitivity analysis outputs of the Bayesian Network (BN) models, which were developed to predict the number of days before 5000 cases were reached (BN 1), and the number of days (starting from the day when 100 cases were recorded) before 1000 deaths were reached (BN 2). The numbers “0.02” and “0.05” relate to the % of cases (0.02% and 0.05%) against the total country population, as per Figure 2 and Figure 3. In the figures, variables are ranked from those having the highest variance of beliefs (thus higher sensitivity) to those having the lowest one. Although the two BNs can be used to predict the two aforementioned variables, the focus in this section is on the sensitivity analysis since, rather than predicting, the main objective was to try to understand what factors cause a more (or less) rapid spread of the virus in the analysed countries. Sensitivity analysis made it possible to rank the different input variables in terms of their importance in affecting such spread, and thus they fulfil the purpose of identifying those population/government actions that most successfully helped reduce the diffusion rate of the virus.
It can be noticed that early (i.e., at 0.02% and at 5000 cases) government action is the most important factor in predicting the number of days before 5000 cases are recorded, since they are the two variables with the highest variance of beliefs. Conversely, the very early population action (0.02%) was much more important than population action at 0.05%, meaning that the way individuals behaved since the very beginning of the outbreak was crucial in establishing the transmission rate of the virus; however, the government response was even more crucial. Importantly, three out of the six most important variables were related to early number of tests. Finally, SI related variables were less important compared to the equivalent GA ones, providing an indication that the herein developed GA better captures the relevance of government actions in relation to the early transmission rate of the virus.
In relation to Figure 7, the three most important variables (i.e., with highest variance of beliefs) were all related to an early population response. Very early testing and stringency related variables followed, but with considerably lower importance (i.e., lower variance of beliefs). Overall, it appears that, while early testing amount emerged as important for predicting both early cases and early deaths, early government action was found to be significant in predicting/controlling early cases, while early population action was more important in predicting the early number of deaths.

3. Discussion

The table below (Table 1) qualitatively summarises the data presented in the Results section for each country. At the time of writing, only France, Italy, Spain, the UK, and USA had reached 10,000 COVID-19 related deaths. Interestingly, all of them have a very low amount of early testing performed, as well as poor government or population responses (or both). Lack of early high testing numbers seems to emerge as a crucial, missing action that resulted in an uncontrolled, rapid spread of the virus. The more early, timely, and targeted tests, the more people with mild symptoms could be identified, thus isolating them before they could spread the virus further. Unlike previous outbreaks such as Ebola, the lethality of COVID-19 is significantly lower and usually results in mild to no symptoms for most infected people. As a result, it is much more difficult to identify and control. Therefore, it is logical that a lack of appropriate amounts of testing in the early days of the outbreak did not allow those countries to contain the virus. The under-detection of infected patients is clear from the significantly higher number of patients in ICUs, given the same overall number of cases diagnosed. Early studies [12] showed that approximately 4% of symptomatic patients in different Asian countries had to go through the ICU; in Italy, once the number of daily tests was finally boosted throughout April, the proportion of ICU patients compared to the total active cases followed a decreasing trend, from 4% towards 2%. With statistical studies and early serological surveys showing that the true number of infected, and particularly asymptomatic patients being significantly higher than reported through tests [13], it is safe to say that the number of patients in ICU would represent much less than 2% of the real, total amount of infected people. Regardless, even if 2% is taken as a reference, given 462 patients had already recovered in Italian ICUs at the time 5000 cases were detected, this translates to a more realistic figure of infected patients being over 23,000, which is almost five times higher than the official 5000 recorded cases, resulting from only 42,000 tests. With over 18,000 untested cases and the vast majority of them most likely having mild or no symptoms, while also being able to move around for several days before the first major lockdown rules were established on 9 March 2020, the Italian COVID-19 outbreak was already well underway and unnoticed before significant action could be taken. Our results from Figure 6 illustrate that early government action is crucial in controlling the speed of the outbreak, especially if early tests were limited: this is sensible since early government responsiveness could have helped in Italy and other countries to better control the untested, infected citizens who likely contributed significantly to the spread. Instead, the consequence was an early overcrowding of hospitals, leading to an extremely high number of deaths. The shorter lag between the time series of daily cases and daily deaths supports this hypothesis, since it seems that due to overcrowding and unpreparedness, hospitalised and ICU patients had less support and lower chances of survival, with only a week passing between the peaks in cases and peaks in deaths. This is similar for the other hard-hit European countries. Our findings from Figure 7 point at the early response of the population as critical in limiting the number of deaths within the first few weeks of the outbreak; with the death toll being a more robust measure of the diffusion of the virus, compared to the number of cases (biased and proportional to the number of tests performed), the citizen’s risk perception of the virus, and the way they abide to the restrictions and rules established by their respective governments emerged as crucial indicators of the severity of the early spread of the COVID-19 outbreaks.
Interestingly, the population’s response is itself affected by the government response; countries such as the UK and USA, whose initial public messages seemed to downplay the severity of the COVID-19 emergency, had a low initial population response (Figure 3), with citizens not feeling particularly worried and in turn, not practicing increased personal hygiene or wearing face masks. A systems thinking approach is crucial for understanding all these interconnections; the proposed BN models provide a first step in this direction. With a greater quantity of more reliable data becoming available, these models can be improved and refined over time.
Germany is the only large European country that successfully contained the outbreak from a death toll perspective; despite limited government action aside testing, the very high number of early tests allowed them to more effectively control the outbreaks and individual clusters, since a higher number of infected people with mild symptoms were detected and isolated. The delay between recorded number of cases and recorded number of deaths for this country is two weeks, resulting from an early testing response, an excellent healthcare system and a younger average population than Italy [14]. All other countries with a high amount of early tests, such as Australia and Canada, were able to control the outbreak and, in the case of Australia, completely “flatten the curve” at the time of writing, thus managing to contain the number of cases and deaths, as it can be seen from the data we collected and analysed. Hence, it seems that early government action becomes crucial only if early testing was limited (leading to several untested, infected people, free to spread the virus in their communities if no strict rules are imposed). This seems to be validated by the example of South Korea, which is not analysed in this study due to partial lack of necessary data, where government measures were limited, but the country managed to control the outbreak and flatten the curve by establishing an aggressive testing and contact tracing regime, while also enforcing quarantine policies [15].
An interesting case is provided by Sweden. Sweden is well-known for having adopted a “relaxed” approach to dealing with the COVID-19 pandemic [16]. In order to avoid catastrophic economic consequences, they did not impose a full lockdown, with very mild restrictions put in place instead. Although the government view suggested that they would rely on the citizens to do the right thing, the surveys highlight that the population response was instead quite poor. This unexpected response is then aggravated by a very low number of early tests performed. Although the number of cases and deaths seem to be relatively low, they are comparatively much higher than neighbouring Scandinavian countries such as Norway and Finland, and still rising at the time of writing. The high number of early patients in ICUs, coupled with low testing, seems to point at a higher number of actual infected cases (as high as 13,000 undetected) which, with more delay compared to other European countries, is now causing a gradual spread.
There are obviously several other factors that might play a role in the spread of COVID-19, which were not analysed here due to the lack of data or scientific evidence, such as population density and age distribution, or climate [17,18]. The developed BNs provide a way to quantify the importance of the analysed factors and provide a probabilistic prediction of the speed of the spread of COVID-19. Once more research consistently highlights the importance of other factors; these and related data can be easily incorporated in the BN structure and algorithms to reduce uncertainty.

4. Materials and Methods

4.1. Data Collection

The data used in this study were collected from numerous freely available online sources. Data for number of cases, deaths, cases in serious conditions, and tests were collected from Worldometers.info. As the website states, Worldometer is run by a team of international researchers, developers, and volunteers without any political, governmental, or corporate affiliation. With regards to COVID-19 data, the data are collected regularly from official Government sources or reliable media outlets. The data is then validated by a team of researchers before being published online. The data were collected for the February 1–April 16 period, i.e., from the onset of the outbreak to the time where the exponential trajectory of many European countries started to slow down, and in turn, where the effects of certain government measures became evident. The data were collected during a specific day, and when time series versions were not available, we accessed archived versions of the Worldometer COVID-19 main webpage through websites such as web.archive.org. Data about number of COVID-19 tests were also collected, or validated against, data from ourworldindata.org. Population behavioural response data were collected from a publicly available dataset, illustrating the results of a research work, conducted by YouGov and the Imperial College London—over population samples from 29 different countries. The data is in the form of weekly survey responses to 18 questions in relation to COVID-19 [19]. All the available data up to April 16 were collected. Regarding the quantification of the response of different governments, a full database of descriptive information consisting of a range of government actions around the world was available and downloaded from the ACAPS Government Measure Dataset [20] and other available online sources, as of 2 April 2020.

4.2. Data Pre-Processing and Analysis

The government action data were grouped into one of the following categories: visa restrictions, additional health documents required on arrival, border closure, domestic travel restrictions, emergency administrative structures, economic measures, restriction enforcement and surveillance, health protection, health screenings in airports and borders, lockdown, limit public gatherings, public services closures, psychological support, quarantine policies, schools closure, state of emergency declared, strengthening public health system, and testing policy. Once the category was chosen, each intervention was then assigned a degree of severity, on a scale from 1 to 4 (maximum). For instance, discouraging certain travel types was classified as a visa restriction Level 1, while a complete travel ban was denoted as Level 4. In addition, since certain measures were location-specific, this was incorporated within the severity degree. For instance, a strict lockdown on a specific region was given a score of 2, similar to a mild lockdown that was enforced over an entire nation. A strict, nationwide lockdown would be a Level 3 out of 3. Subsequently, since some of the categories could be cross-correlated, 5 wider groups were created by summing the scores of the relevant categories. These 5 groups were: (1) Political (e.g., special structures and enforcement groups); (2) coping/curing (e.g., testing measures, health facilities); (3) external control (e.g., border closures, visa restrictions); (4) internal control (e.g., lockdown, no public gatherings, school closures); and (5) socio-economic (e.g., government support to unemployed). Finally, an overall “government action score” GA was also calculated for each country by summing all the five individual scores. All such scores were calculated over the entire analysed time period, daily. These scores were then analysed over time, and in relation to the number of normalised cases (i.e., in relation to the nation’s population).
Similar indexes, at the time of writing, have been developed elsewhere such as the Stringency Index (SI), which relies on a slightly different set of government response indicators and aggregated indices [10,11]. Such SI was also analysed in a similar fashion to the herein developed government action score for comparison purposes; this was done towards the end of our research work, hence SI data were collected from [10] and analysed as of 2 May 2020. SI-related variables were included in the developed Bayesian Networks, as explained in Section 4.3.
With regards to the population behavioural response, an overall “Population Action Score” was also calculated by averaging the survey results to a number of relevant questions, specifically: % of people (1) with fear of catching the virus, (2) avoiding crowds, (3) wearing a face mask, (4) practicing improved personal hygiene, and (5) not touching objects outside. This overall score was also analysed against the normalised number of cases. Analyses on results for individual survey questions, not shown here, was also conducted before calculating the overall Population Action Score.
Visual data inspection and time series analyses were performed to check the rapidity of the spread of the virus, by calculating the number of days before a country reached certain milestones with regards to cases and deaths. For these days, the number of tests conducted, as well as the number of patients in ICUs, was collected when available and used to understand their relationships with the rate of the virus spread, along with the other data. Furthermore, the time series for number of cases and the time series for number of deaths were analysed, and the time delay (lag) between them, which maximised the coefficient of determination (R2), was also calculated for each country. Twenty-nine countries were initially selected, though not all were fully or partially analysed, due to either missing data or due to having, at the time of writing, limited cases and deaths. Figure A9 shows the results for the final set of the 17 countries analysed where data availability was sufficient at the time of writing.

4.3. Model Development and Application

Following the outcomes of the data analysis, a number of candidate input variables were selected and used to develop data-driven naïve and Tree-Augmented Naïve (TAN) Bayesian Network models, to try to predict critical variables linked to an early spread of the virus, specifically (1) Number of days before 5000 cases were reached (BN 1); and (2) number of days (after 100 cases) before 1000 deaths were reached (BN 2). Bayesian Networks rely on Bayesian theory, which in turn implies that the Bayes’ theorem [21] can be used to infer or also update the degree of ‘belief’ given new information. They are made of variables called “nodes”; each variable is discretised in a number of “states”. An “arc” connects a “parent” node to a “child” node. The relationship between a child node and its parent node(s) is quantified through a so-called conditional probability table (CPT). Populating CPTs can be performed based on either numerical, or qualitative (e.g., expert opinion), data. Bayesian Networks are an increasingly popular probabilistic modelling approach, which is well suited when only limited, uncertain, and incomplete data are available, such as for this case [9,22,23]. Figure 8 illustrates the structure of one of the developed BN.
Node discretisation and conditional probability table elicitation was performed and optimised from the data. In general, a naïve BN consists of only one parent node with multiple child nodes; more theoretical details can be found elsewhere, e.g., [9,24]; a TAN BN instead relaxes the strong independence assumption between all the child nodes given the parent [25], and thus arcs between child nodes are added. This can be noticed in Figure 8, where obvious links were added between those child nodes logically dependant on each other (from a temporal point of view). The final TAN structures were preferred to the naïve BN structures as typically they perform better [26] and they add logical connections between, in this case, temporally related nodes. The software used was Netica 5.22 32 bit (Norsys Software Corp, Vancouver, BC, Canada); the Netica API is available for download from their website [27]. Sensitivity analyses were completed using the in-built Netica algorithms; specifically, the sensitivity of different nodes was quantified by the “variance of node beliefs” (formerly named “quadratic score” in older Netica versions): this is defined as the expected change, squared, of the beliefs of the target node, taken over all of its states, due to a finding at the node in consideration [28]. It varies between 0 and 1, where 0 would represent that the target node is independent of the node in consideration, while the higher the value, the more sensitive the target node is to the node in consideration.

5. Conclusions

A number of data analysis and modelling approaches were deployed to understand the importance and effectiveness of early government and population responses to COVID-19 outbreaks in several countries. Out of all the data and variables considered, high numbers of early tests emerged as the most crucial measure to control the transmission rate, as greater numbers of earlier tests lowered the number of undiagnosed and non-isolated cases. We estimated that countries with a low initial testing regime, such as Italy, might have had five times more actual cases than what was diagnosed. Following testing, early effective government responses were strongly related to slowing down the number of new recorded cases. Finally, the level of early population response, which in many ways is related to the type of government approach, was strongly related to the number of early deaths, which is a more reliable indicator of the spread of the virus. These conclusions point at the equally important contribution of a rapid government response and an early population-based behavioural change to abide with the new rules and health recommendations, which, in conjunction with aggressive early testing policies, assisted in controlling and managing early COVID-19 outbreaks. Due to the interconnectedness of the study’s variables, a systems thinking approach is recommended for future studies to capture the inherent complexities of such a multidisciplinary problem. The developed Bayesian Network models have the ability to capture some of this complexity and related uncertainty, and can be refined and expanded to include more variables and data in the future, when they become available, to gain an even better understanding and improvement of the early management COVID-19 outbreaks. This will be of crucial importance as governments have started to lift some of the restrictions and are preparing for a potential “second wave” of infections.

Author Contributions

Conceptualization, E.B.; methodology, E.B., O.S.; software, K.N., D.A.P.; validation, E.B., M.J.L.J.; formal analysis, E.B., M.J.L.J., and R.K.P.U.; data curation, E.B., M.J.L.J., and R.K.P.U.; writing—original draft preparation, E.B.; writing—review and editing, M.J.L.J., R.K.P.U., O.S., K.N., and D.A.P. All authors have read and agreed to the published version of the manuscript.

Funding

This research received no external funding.

Acknowledgments

We are thankful to all the contributors to the online resources used for this research, and to KODE Consulting for providing a prototype version of the BN software SAMBA for validation purposes.

Conflicts of Interest

The authors declare no conflict of interest.

Appendix A

Figure A1. Overall government action score for different countries vs. recorded number of cases in proportion to country’s population.
Systems 08 00021 g0a1
Figure A2. Overall government action score for different countries vs. recorded number of cases.
Systems 08 00021 g0a2
Figure A3. Overall government action score for different countries vs. recorded number of cases (limited to 5000).
Systems 08 00021 g0a3
Figure A4. Stringency Index for different countries vs. recorded number of cases in proportion to country’s population (limited to 0.05%). Updated 2 May 2020.
Systems 08 00021 g0a4
Figure A5. Stringency Index for different countries vs. recorded number of cases in proportion to country’s population. Updated 2 May 2020.
Systems 08 00021 g0a5
Figure A6. Stringency Index for different countries vs. recorded number of cases (limited to 5000). Updated 2 May 2020.
Systems 08 00021 g0a6
Figure A7. Overall population action score for different countries vs. recorded number of cases (limited at 15,000).
Systems 08 00021 g0a7
Figure A8. Bayesian Network structure for “days before 5000 cases”. Blue nodes: Government action score variables. Dark blue nodes: Stringency Index variables. Yellow nodes: Testing variables. Light blue nodes: Population action score variables. “at 0.02” or “at 0.05”: the day that 0.02% or 0.05% of the country’s population tested positive.
Systems 08 00021 g0a8
Figure A9. Coefficient of determination R2 between time series of number of daily deaths at time t and number of daily cases at time (tn), where n is in days.
Systems 08 00021 g0a9

References

  1. Gates, B. Responding to Covid-19—A once-in-a-century pandemic? N. Engl. J. Med. 2020, 382, 1677–1679. [Google Scholar] [CrossRef] [PubMed]
  2. Hoehl, S.; Rabenau, H.; Berger, A.; Kortenbusch, M.; Cinatl, J.; Bojkova, D.; Behrens, P.; Böddinghaus, B.; Götsch, U.; Naujoks, F.; et al. Evidence of SARS-CoV-2 infection in returning travelers from Wuhan, China. N. Engl. J. Med. 2020, 382, 1278–1280. [Google Scholar] [CrossRef] [PubMed]
  3. Wang, C.; Pan, R.; Wan, X.; Tan, Y.; Xu, L.; Ho, C.S.; Ho, R.C. Immediate psychological responses and associated factors during the initial stage of the 2019 coronavirus disease (COVID-19) epidemic among the general population in China. Int. J. Environ. Res. Public Health 2020, 17, 1729. [Google Scholar] [CrossRef] [PubMed] [Green Version]
  4. Brzezinski, A.; Deiana, G.; Kecht, V.; Van Dijcke, D. The COVID-19 Pandemic: Government vs. Community Action across the United States. Covid Econ. Vetted Real-Time P. 2020, 7, 115–156. [Google Scholar]
  5. Sterman, J.D. Business Dynamics: Systems Thinking and Modeling for a Complex World; The McGraw-Hill Companies: New York, NY, USA, 2000. [Google Scholar]
  6. Bertone, E.; Sahin, O.; Richards, R.; Roiko, A. Extreme events, water quality and health: A participatory Bayesian risk assessment tool for managers of reservoirs. J. Clean. Prod. 2016, 135, 657–667. [Google Scholar] [CrossRef] [Green Version]
  7. Bertone, E.; Sahin, O.; Stewart, R.A.; Zou, P.X.; Alam, M.; Hampson, K.; Blair, E. Role of financial mechanisms for accelerating the rate of water and energy efficiency retrofits in Australian public buildings: Hybrid Bayesian Network and System Dynamics modelling approach. Appl. Energy 2018, 210. [Google Scholar] [CrossRef] [Green Version]
  8. Sahin, O.; Suprun, E.; Richards, R.; Salim, H.; MacAskill, S.; Heilgeist, S.; Stewart, R.; Rutherford, S.; Beal, C. Navigating the Wicked Complexity of the COVID-19 Pandemic. Syst. Commun. 2020. accepted for publication. [Google Scholar]
  9. Fenton, N.; Neil, M. Risk Assessment and Decision Analysis with Bayesian Networks; CRC Press: New York, NY, USA, 2013. [Google Scholar]
  10. Hale, T.; Webster, S.; Petherick, A.; Phillips, T.; Kira, B. Oxford COVID-19 Government Response Tracker, Blavatnik School of Government. 2020. Available online: https://www.bsg.ox.ac.uk/research/research-projects/coronavirus-government-response-tracker (accessed on 5 June 2020).
  11. Hale, T.; Petherick, A.; Kira, B.; Angrist, N.; Phillips, T. Variation in Government Responses to COVID-19; BSG Working Paper Series; Blavatnik School of Government: Oxford, UK, 2020. [Google Scholar]
  12. Wilson, N.; Kvalsvig, A.; Barnard, L.T.; Baker, M. Estimating the Case Fatality Risk of COVID-19 using Cases from Outside China. medRxiv 2020. [Google Scholar] [CrossRef] [Green Version]
  13. Bendavid, E.; Mulaney, B.; Sood, N.; Shah, S.; Ling, E.; Bromley-Dulfano, R.; Lai, C.; Weissberg, Z.; Saavedra, R.; Tedrow, J.; et al. COVID-19 Antibody Seroprevalence in Santa Clara County, California. medRxiv 2020. [Google Scholar] [CrossRef]
  14. Volpato, S.; Landi, F.; Incalzi, R.A. Frail Health Care System for an Old Population: Lesson form the COVID-19 Outbreak in Italy. J. Gerontol. Ser. A 2020. [Google Scholar] [CrossRef] [PubMed] [Green Version]
  15. Pueyo, T. Coronavirus: The Hammer and the Dance. Available online: https://medium.com/@tomaspueyo/coronavirus-the-hammer-and-the-dance-be9337092b56 (accessed on 5 May 2020).
  16. Hensvik, L.; Skans, O. COVID-19 Crisis Response Monitoring; IZA Institute of Labor Economics: Bonn, Germany, 2020. [Google Scholar]
  17. Wang, J.; Tang, K.; Feng, K.; Lv, W. High temperature and high humidity reduce the transmission of COVID-19. SSRN 2020. [Google Scholar] [CrossRef] [Green Version]
  18. Rocklöv, J.; Sjödin, H. High population densities catalyse the spread of COVID-19. J. Travel Med. 2020, 27. [Google Scholar] [CrossRef] [PubMed]
  19. YouGov. YouGov International COVID-19 Tracker. 2020. Available online: https://yougov.co.uk/topics/international/articles-reports/2020/03/17/YouGov-international-COVID-19-tracker (accessed on 5 June 2020).
  20. Acaps. #COVID19 Government Measures Dataset. 2020. Available online: https://www.acaps.org/covid19-government-measures-dataset (accessed on 5 June 2020).
  21. Bayes, M.; Price, M. An essay towards solving a problem in the doctrine of chances. By the late Rev. Mr. Bayes, F.R.S. communicated by Mr. Price, in a letter to John Canton, A.M.F.R.S. Philos. Trans. 1763, 53, 370–418. [Google Scholar]
  22. Chen, S.; Pollino, C. Good practice in Bayesian network modelling. Environ. Model. Softw. 2012, 37, 134–145. [Google Scholar] [CrossRef]
  23. Uusitalo, L. Advantages and challenges of Bayesian networks in environmental modelling. Ecol. Model. 2007, 203, 312–318. [Google Scholar] [CrossRef]
  24. Langarizadeh, M.; Moghbeli, F. Applying naive bayesian networks to disease prediction: A systematic review. Acta Inform. Med. 2016, 24, 364. [Google Scholar] [CrossRef] [PubMed]
  25. Solares, C.; Sanz, A.M. Different Bayesian network models in the classification of remote sensing images. In Proceedings of the Intelligent Data Engineering and Automated Learning-IDEAL 2007, Birmingham, UK, 16–19 December 2007. [Google Scholar]
  26. Friedman, N.; Geiger, D.; Goldszmidt, M. Bayesian network classifiers. Mach. Learn. 1997, 29, 131–163. [Google Scholar] [CrossRef] [Green Version]
  27. Norsys. Netica APIs (Application Programmer Interfaces). Available online: https://www.norsys.com/netica_api.html (accessed on 6 March 2020).
  28. Neapolitan, R. Probabilistic Reasoning in Expert Systems: Theory and Algorithms; John Wiley: New York, NY, USA, 1990. [Google Scholar]
Figure 1. Number of days (starting from the day when 100 COVID-19 cases were recorded) before n COVID-19 deaths were recorded, where n is displayed along the x-axis (capped at 20,000 deaths).
Systems 08 00021 g001
Figure 2. Overall government action score for different countries vs. recorded number of cases in proportion to country’s population, limited to 0.05%.
Systems 08 00021 g002
Figure 3. Overall population action score for different countries vs. recorded number of cases in proportion to country’s population.
Systems 08 00021 g003
Figure 4. Number of COVID-19 tests performed by different nations before n cases were recorded, where n varies along the x-axis.
Systems 08 00021 g004
Figure 5. Relationship between the number of tests performed at the time 5000 COVID-19 cases were recorded, and the number of patients in ICUs at the time 5000 cases were recorded. Only countries with available data that recorded at least 5000 cases at the time of writing were included.
Systems 08 00021 g005
Figure 6. Sensitivity analysis outputs from BN 1, for the target node (days before 5000 cases). BN child nodes ordered from left to right based on variance of beliefs score.
Systems 08 00021 g006
Figure 7. Sensitivity analysis outputs from BN 2, for the target node (days before 1000 deaths following 100 cases). BN child nodes ordered from left to right based on variance of beliefs score.
Systems 08 00021 g007
Figure 8. TAN Bayesian Network structure for “days after 100 cases before 100 deaths” (BN 2). Blue nodes: Government action score variables. Dark blue nodes: Stringency Index variables. Light green nodes: Cases variables. Yellow nodes: Testing variables. Light blue nodes: Population action score variables. “at 0.02” or “at 0.05”: the day that 0.02% or 0.05% of the country’s population tested positive.
Systems 08 00021 g008
Table 1. Qualitative summary of the results and data for each analysed country.
CountryDays Before 10,000 DeathsEarly ICUEarly Gov ActionEarly SIEarly Pop ActionEarly TestingLag to Death
(R2)
Australia LHML but +H7 (0.53)
Canada MHHMH14 (0.9)
France36HLMLL6, 14 (~0.5)
Germany LLLLH12 (0.91)
Italy34HLHHL6 (0.94)
Japan ML but +MHM10 (0.71)
Norway MML but +L 12 (0.62)
Saudi Arabia HHH but − 8 (0.69)
Spain31 LML 2 (0.94)
Sweden HLLLL7 (0.79)
UAE LMHHH8 (0.74)
UK38HMMLL7 (0.92)
USA35LHMLL7 (0.97)
“H” = high; “M” = medium; “L” = low; “+” = increasing with time; “−” = decreasing with time; blank = no data. “Lag to death” = number of days between number of cases and number of death providing the highest correlation. R2 = coefficient of determination.

