A Rapid Improvement Process through “Quick-Win” Lean Tools: A Case Study
by
 , , , and
Jorge Rodrigues
1, 
José Carlos Sá
1 ,
,
Francisco J. G. Silva
1,
Luís Pinto Ferreira
1,
Genett Jimenez
2 and
Gilberto Santos
3,* 1
School of Engineering, Polytechnic of Porto, 4249-015 Porto, Portugal
2
Department of Industrial Process Engineering, Institución Universitaria ITSA, Barranquilla 080002, Colombia
3
School of Design, Polytechnic Institute Cavado e Ave, 4750-810 Barcelos, Portugal
*
Author to whom correspondence should be addressed.
Systems 2020, 8(4), 55; https://0-doi-org.brum.beds.ac.uk/10.3390/systems8040055
Submission received: 18 October 2020
/
Revised: 27 November 2020
/
Accepted: 1 December 2020
/
Published: 14 December 2020
(This article belongs to the Collection Systems Engineering)
Abstract
:The main purpose of this paper was to introduce procedural changes based on a type of human resources management tool using Lean Leadership (LL). We sought to determine which Lean Tools (LTs) are able to promote a rapid impact on a company; namely, we aimed to determine which LTs are able to facilitate fast and positive results for companies after their implementation, thus allowing for quick wins. This study was conducted at a medium-sized Portuguese company in the metalworking sector. Results were assessed from two surveys (involving 17 people) regarding perceptions of employee awareness in the machining area for Quality, Maintenance/Equipment, Process/Products, Leadership/Management by Objectives, and Trust and Training. The surveys were conducted at the beginning of the study and at the end of a quarterly period. LTs were used over a period of three months, thus enabling changes to the company’s manufacturing processes which could lead to improved organization, orientation, consistency and viability. Three months were considered an adequate time period to measure whether the tools were effective in the production of quick wins or not. LL allowed for greater awareness of the importance of LTs, the most important feature of which is the aggregation of all of the employees’ energies, which culminates in better operational efficiency and an increase in the employees’ overall positive perceptions of their company’s principles and mindset. The introduction of LL, as well as the implementation of 10 LTs, which are considered to be Quick-Win Tools, enabled employees to improve their perceptions of their company by 6.1%. Lean tools can be implemented quickly and are easily understood by their intended users. These benefits provide additional motivation for their use and for the achievement of highly satisfactory operating results across production areas. This study aims to identify which lean tools allow companies to obtain benefits/gains quickly. This outcome is the main contribution of this study to the scientific community and to companies. A Quick Win means a rapid improvement in a short period of time. As such, lean tools that provide Quick Wins also contribute to economic development. Due to the restricted time period imposed by the main purpose of this study, statistical analysis of the results was unfeasible.
1. Introduction
This case study aimed to study and implement the Lean Management model using Lean Tools (LTs) in a Portuguese metalworking company that would be considered to fit into the Small and Medium-Sized Enterprise (SME) sector. In this company, the design and development of fluid control valves are carried out in various sectors, including the oil and gas industries, as well as the pharmaceutical industry. This study was conducted during a phase when this company intended to implement LTs, therefore allowing us to assess the immediate results obtained in organizational and, consequently, operational terms. We were also able to evaluate the ways that LTs enhanced motivation amongst all of the company’s employees, which can be presented as a “Quick Win” [1]. At the same time, Lean Leadership (LL) models were incorporated across the company’s entire hierarchical chain, allowing for greater interaction between its management and the technical and operational areas. Implementing LL in association with LT has been proven to be able to produce a major impact on companies in the metalworking industry [2,3,4,5]. This impact was shown to have positive repercussions on the behavioral and commitment levels of employees in the company, which may lead to more efficient operating results. Thus, we determined that the best general approach was to start with the selected appropriate LT based on the relevant company’s state of maturity, followed by the application of each tool at the appropriate time. Lean tools are identified and described in this paper as procedures that allow companies to obtain benefits/gains quickly. This is the main contribution of this study to the scientific community and to companies. LTs that offer a Quick Win are the best lean tools, i.e., those that cause a rapid improvement in the production abilities of the company using them over a short period of time. The main purpose of this paper was to introduce procedural changes based on LTs as human resources management tools through LL and, simultaneously, to study which LTs are able to promote a rapid impact on companies; that is, the paper assesses which LTs are able to provide fast and positive results for companies after their implementation, thereby enabling Quick Wins.
2. Literature Review
LL is a meticulous system used for the sustainable implementation and continuous improvement of Lean Production [6]. It describes the cooperation of company officials and leaders in their mutual pursuit of perfection [7]. The link between the applicability of LTs and their application in practice is affected by human/psychological issues. As mentioned by Pierce et al. [8], psychological ownership is a psychological state in which an individual aims to obtain a type of membership (which could be a material or immaterial form) or experiences a sense of entitlement to some of the benefits of membership. According to Avey et al. [9], these feelings are a very real phenomenon that many recognize and comment on as being related to a person’s work and organizational environment. Pierce et al. [10] suggest that the feeling of belonging can be found in three human motives: self-efficacy, self-identity and “owning a house”.
The development of a sense of belonging promotes a climate of continuous effort towards achieving the goals associated with inclusion. Workers’ interest in their work and performance is stimulated by this sense of belonging, thereby providing organizational advantages at all levels [11]. In this context, Avey et al. [9] proposed applying a Psychological Ownership Questionnaire, which was used to evaluate a person’s sense of belonging by providing support of relevant concepts and revealing the five dimensions of this feeling (self-efficacy, self-identity, “owning a house”, responsibility and territoriality).
SMART is an acronym for goal-setting practices. The associated objectives are determined as follows: “S,” specific, “M,” measurable, “A,” attainable/achievable, “R,” relevant and “T,” timely. Its origin is attributed to the Management by Objectives model developed by Peter Drucker. The focus of the Management by Objectives model is to ensure that an organization’s teams are working towards the same goals, while SMART sets out the associated action plan. Although SMART is often a contributor to business management plans, it has also been used in the formulation of personal development plans [12]. The measurement of key performance indicators is an instrument of widespread use in the detection of changes in the performance of the production system in order to coordinate and undertake appropriate countermeasures [13] (Ferreira et al., 2019a). The main challenge of the KPI (Key Performance Indicator) systems coordinator is to determine relevant KPIs [14,15]. The absence of adequate productivity measurement indicators leads to disoriented performance [16]. Daily Kaizen meetings are the main subsystem of corporate accountability; they enable a culture of continuous improvement, working efficiently under a visual management system, analyzing and acting based on data and root cause analysis, thereby seeking to continually improve operations in a structured and visible manner [17,18]. Integrated with the internal communication project, the intention is for the entire company to be provided with daily data for decision making. This communication is performed transversally and vertically, based on the LL project, in which communication constitutes one of the pillars for the development of employees [19,20,21] at a time when customers are increasingly more demanding [22,23,24].
Visual management is, in itself, the management tool that quickly informs its stakeholders about the state of a process, and which actions can be taken in a timely manner [25]. It allows team leaders to better engage in problem-solving and in the practice of continuous improvement with their teams [26,27,28,29,30].
PDCA (Plan–Do–Check–Act) is a system used for the continuous improvement of an organization. The “Plan” phase initiates the PDCA process by identifying the problem clearly and objectively. The “Do” phase takes the hypothesis and tests it by means of a scientific method. The “Check” phase is begun to study the effects of the “do” phase. The “Act” phase is sometimes referred to as “do it” because it is designed to identify what must be worked on [31,32]. The Gemba Walk concept refers to when top management goes to the actual place where the work is performed [33,34,35] and to the location where value is created [36,37,38,39,40]. This is also an opportunity for leaders to communicate and build trust with the team, thus enhancing corporate culture, with a focus on people and processes [41,42,43]. This has an immediate and significant influence on organizational activity [44,45,46,47,48], where management systems [49,50], namely quality management [51,52,53,54,55] as well as environmental management and sustainability [56,57,58,59,60], play an important role [43,61,62,63] in the way Industry 4.0 principles are implemented [64].
The 5S system is a rule designed to create a clean and safe working environment; hence, there is a commitment to safety [65] and production, leading to the efficient and effective fulfillment of business tasks [66]. The 5S tool is divided into five steps, which can be enumerated as follows: Seiri (Sort), Seiton (Set in Order), Seiso (Shine), Seiketsu (Standardize) and Shitsuke (Sustain) [67]. Implementing the 5S method is one of the first steps in the Lean Manufacturing strategy, and impacts the behavior of the Lean System method. Dana [45] and Veres et al. [68] have determined, as a result, that there is an increase in organizational productivity, accompanied by improvements in operational and profitability indicators in the short, long and medium terms, as well as in manufacturing costs, with a positive impact on profitability [69,70,71,72]. The “5 Whys” is a technique that uses a systematic approach to problem-solving in order to find the root cause of a defect or problem [73]. The goal is to identify the negative event factors, determine what needs to change and avoid similar future occurrences [74,75,76,77,78,79].
Literature Review—Comparative Earnings
A review of several articles that have pointed to the gains derived from the implementation of selected LT was carried out. However, there was no exact basis of comparison with the 10 LTs implemented in the 3 months of the study, which would have allowed one to compare the gains ensuing from the implementation of these tools in other contexts. Neves et al. (2018) carried out work in the textile industry with the aim of identifying problems and finding solutions through a combination of the PDCA cycle, 5S and 5W2H (Where, When, What, Why, Who; How, How much). The association of these Lean methodologies showed an important impact in the weaving production process, with gains of 10% in the time available to the operator. Rosa et al. (2019) developed a study on production lines and the assembly of automotive components, which aimed to apply LT to eliminate wasted time and increase productivity. The focus of this research was to increase the output on lines A and B, reduce the setup times on line C and increase overall productivity. There was a 41% increase in productivity on line A and 43% on line B. The weekly setup time for line C was also reduced by 58.3%. Another article by Costa et al. [67] presented a study developed at a company that manufactures handling and lifting equipment. The aim was to implement 5S methodology on a manufacturing cell, with the purpose of enhancing its efficiency and safety. The results obtained allowed for the reduction of waste, as well as a decrease in operating times and labor. It thereby improved reliability of delivery dates and, ultimately, greater customer satisfaction. On the other hand, Pombal et al. [25] presented a study, using lean methodologies, which led to increased operational efficiency, better quality and productivity and reduced costs. This is in line with other authors, such as Santos and Barbosa [80] and Rebelo et al. [81]. The methodologies selected were Visual Management, 5S and Kanban. This allowed for a reduction in the time needed to locate consumable material of around 70%, an increase in stock control of about 30% and a decrease in the time required to replenish material in the consumables cabinet, with an expected improvement of approximately 50%. Another study carried out on the production line of a company in the automotive sector [82] resulted in an increase in production capacity from 1200 to 2000 parts/day. Several LTs were used in this study, such as 5S, Kaizen, Yokoten and PDCA, among others. The observed result was a 37% increase in capacity and a 22% improvement in OEE (Overall Equipment Effectiveness).
There are many LTs, some of which we will attempt to describe as follows. The first of these, QFD—Quality Function Development [83] is a structured method that uses seven management and planning tools to identify and prioritize customer expectations quickly and effectively. Yokoten [84] is the sharing of good practices with others, which is observed in the Gemba, namely in the place where they were implemented. PDCA (plan–do–check–act) [85] is an iterative four-step management method used in business for the control and continuous improvement of processes and products. Another one of these tools is the Milkrun [3,86], which refers to the logistics train that supplies the production line, collects the materials that will be needed and delivers them within predetermined time cycles and by following predefined circuits. The implementation of this tool presents some advantages, including reduced transport costs. Six Sigma [87] is a disciplined approach that aims to dramatically reduce defects and produce measurable financial results. The goal of Poka-Yoke [3] is to prevent the occurrence of errors in all activities and to reduce the MUDA, that is any constraint or impediment that causes waste to occur. The 5 Whys method [88] consists of a questioning process, which is used to bore deeply into a problem (and the five how’s are used to develop the details of a solution to a problem). VSM (value stream mapping) [89] is a method which is implemented to analyze the current state and to design a future state for the series of events, taking a product or service from its beginning through to the customer with reduced lean wastes compared to the current map. 5S [90] is a methodical way to organize the workplace so as to turn it into a safer, ergonomic and more efficient environment through the organization of the layout and the introduction of visual management and standard ways of working. SIPOC [91] is a tool that summarizes the inputs and outputs of one or more processes in a table format. The acronym SIPOC stands for suppliers, inputs, process, outputs and customers, which form the columns of the table. Jidoka [92] deals with quality at the source or built-in quality: no company can survive without the excellent quality of the product and service, and Jidoka is the route through which this is achieved. DMAIC [93] (define, measure, analyze, improve and control) is used in association with Six Sigma (SS) to improve projects of existing products or processes, where incremental improvement is sufficient. Kaizen [94] is a method of involving the workforce in order to generate many ideas for improvement. Each employee is expected to come up with (and implement) 3–5 improvement ideas each and every month. The Kanban [95,96] method consists of promoting the restock of materials only when required by receiving and sending signals, usually in the form of cards. SMED (single-minute exchange of dies) [88] is one of the many lean production methods used to reduce waste in the manufacturing process. It provides a fast and efficient way of converting a manufacturing process from running the current product to running the next product. This rapid changeover is key to reducing production lot sizes and thereby improving flow, thus minimizing production loss and output variability.
3. Methodology
The company where the study took place belongs to the metalworking industry, where the design and development of fluid control valves are carried out for the oil and gas industry, as well as for the pharmaceutical industry. Throughout the case study, several consulted articles were considered, namely the five LL principles [7,97,98,99,100]. In this analysis, we selected ten Lean and Quality tools, which were expected to create an impact within a 3-month period. All philosophies, techniques, technologies and work processes are only successful if all the stakeholders are involved in the project and have the same common goal, namely, that of introducing procedural changes to human resources through LL and LTs.
3.1. Employee Survey
Before proceeding with the implementation of LTs, it is important to understand employees’ perceptions at the beginning of the case study in order to understand their evolution throughout the process. For this purpose, a survey was created, which would be answered in two phases: during the 1st week of January, at the beginning of the project, and then the 1st week of April, thus assessing the impact of the implementation of the first LTs, such as the methodologies of Lean management. The Survey Preparation Methodology was carried out anonymously, comprising the coordinators of the four work cells and their collaborators, with a total of 17 individuals in each survey. The questions were organized and based on a six-point “Likert” scale [101] for which scores were attributed as follows: 1—Totally disagree; 2—Strongly disagree; 3—Disagree; 4—Agree; 5—Strongly agree; 6—Totally agree. For the interpretation of the collected data, a scale from 0 to 1 was used, which corresponds to the conversion of data as a percentage. The ranges of results were established as: ≥0.83—Excellent; >0.67 to 0.83—Good; >0.50 to 0.67—Medium; >0.33 to 0.50—Insufficient; >0.17 to 0.33—Weak; ≤0.17—Inadmissible.
3.2. Survey Dimensions—“Awareness”
For the case study, a six-dimensional survey was created as the base and was targeted as follows:
The “Quality Awareness” dimension aims to understand whether the concepts of quality are understood properly; this is mainly related to the NCs produced and whether operators have the training and capacity to solve them.
The “Quality Awareness” dimension comprises five items:
- Q1—I produce more conforming parts than my cell colleagues;
- Q2—My cell produces more conforming parts than other cells;
- Q3—I can identify the root causes of the NCs (non-conformities) produced;
- Q4/F1—I have adequate training to solve the NCs; (This same question was used to answer two perceptions, namely, the area of Quality (Q4) and also, the area of training (F1)).
- Q5—I implement improvement actions.
The “Consciousness of Maintenance/Equipment” dimension, which comprises five items, aims to provide an insight into whether employees have the perception that the equipment is in good condition, both in terms of functionality and appearance, if the amount of damage is the same as that on other cells, and whether operators are prepared to solve problems on the equipment.
- M1—The machines and cell under my care are in good maintenance;
- M2—The number of breakdowns corresponds to the company average;
- M3—The repair intervention time is adequate;
- M4—The equipment produces many defective parts;
- M5/F2—I feel able to solve equipment problems and I have the training to do so; (This same question was used to answer two perceptions, namely, the area of maintenance and equipment (M5) and also, the area of training (F2)).
The “Process/Production Awareness” dimension, which comprises seven items, aims to understand if workers have the perception of whether LTs such as 5S and work balancing are implemented and understood.
- P1—My workload is balanced;
- P2—The workload on my cell is balanced;
- P3—I could produce more parts if I had other types of tools or equipment;
- P4—My cell is clean and organized (5S);
- P5—I am totally comfortable when working in my cell (5S);
- P6—I know what I have to do during my shift;
- P7—I always have immediate access to the programs and tools used.
The “Leadership Awareness/Goal Management” dimension, which comprises four items, aims to perceive whether the Goal Management Process (GPO) constitutes a useful tool in the company’s management, and whether it is implemented in a transparent, fair and easy manner.
- G1—The Goal Management Process (GPO) has been presented in a transparent manner and the reward method is understandable;
- G2—The percentages of each GPO line are proportional to the main tasks to be performed;
- G3—The GPO helps me to guide the company’s overall goals;
- G4—I believe I will be rewarded for achieving the cell goals.
The “Consciousness of Personal Confidence” dimension, which comprises five items, aims to interpret employees’ perception of which factors have contributed to the company’s general improvement, as well as that of their own work cell, the aspect of teamwork and their self-motivation.
- E1—I am confident of my abilities to contribute to the success of my field;
- E2—I am confident that I can make a positive contribution in my area;
- E3—I am confident about setting performance goals in my area;
- E4—I feel the need to defend my cell when it is criticized;
- E5—I feel that we can improve steadily, in a process of continuous improvement.
The “Awareness of Training” dimension, which comprises four items, aims to understand employees’ perception of their level of training, both in solving problems and NCs.
- F1/Q4—I have adequate training to solve the NCs; (This same question was used to answer two perceptions, namely, the area of training (F1) and also, the area of Quality (Q4)).
- F2/M5—I feel able to solve equipment problems and I have the training to do so; (This same question was used to answer two perceptions, namely, the area of training (F2) and also, the area of maintenance and equipment (M5)).
- F3—I have been trained for my day to day work;
- F4—I need more training in other areas to improve my efficiency.
3.3. Characterization of Work Cells
Depending on the product to be processed, the production cells respond effectively and efficiently to fluctuations in product variety. The concept of value is the basis of this philosophy, which aims to increase competitiveness and maintain a mindset of continuous improvement. The company has structured its equipment into four cells, as is shown in Figure 1 as well as in Table 1. Table 1 shows the number of machines per cell, as well as the maximum capacity per cell, namely, the quantity of machines and the maximum diameter of machinery per cell. Each cell is grouped according to each type of equipment, depending on its mechanical cutting typology, its cutting volume capacity and the materials to be worked. The numbering in Figure 1 corresponds to the identification of each piece of equipment, with the green one corresponding to newly acquired equipment. In terms of organizational positioning, the cells and their equipment present the following layout.
4. Results
Due to the fact that the time required to promote this kind of study was rather limited, a statistical analysis could not be applied since the number of samples collected was reduced. This being the case, the statistical significance would be low, although improvements were clearly achieved.
4.1. Initial Perceptions
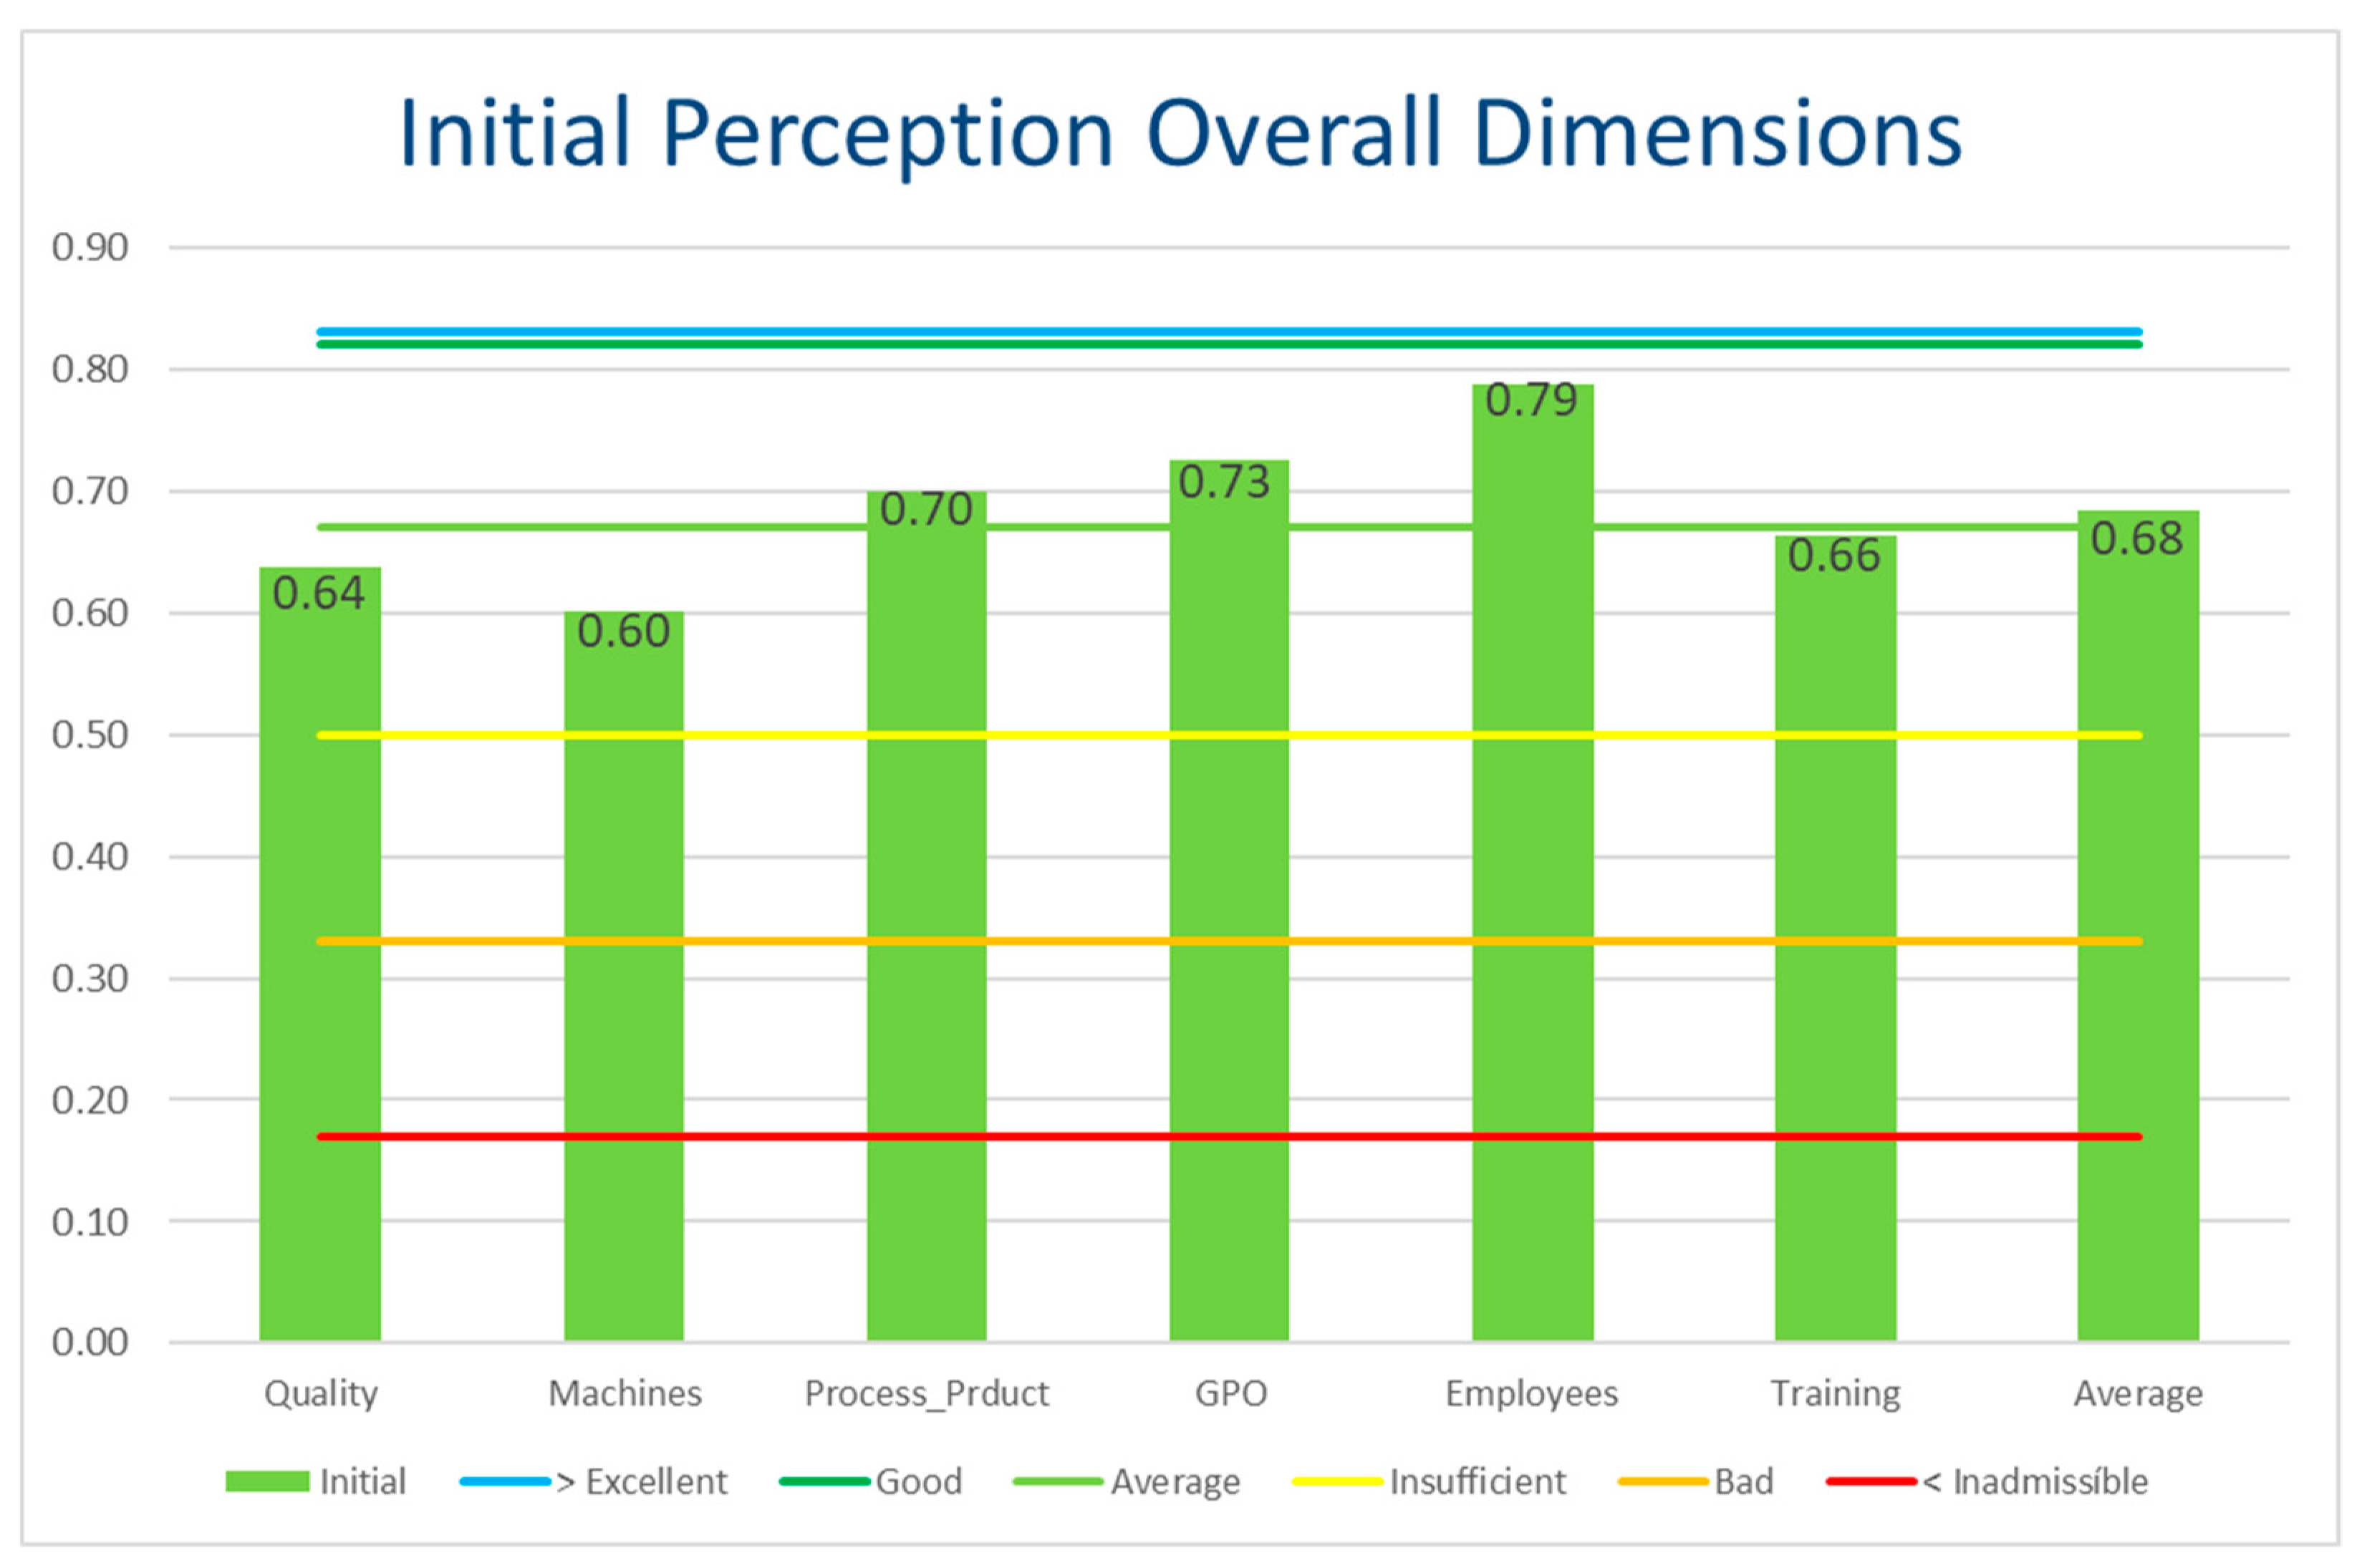
Perception of Overall Dimensions: in this first section, the intention was to obtain an overall view of the company. The questionnaire was subdivided into six individual perceptions, with the final average being the essential indicator for the final comparison of results. Overall data from the first survey, shown in Figure 2, resulted in a Good score (68%). The most significant contributions ensued from the perception of Personal Confidence and Management by Objectives, which correspond to employees’ self-confidence in their abilities, and that the GPO project could improve their conditions. Conversely, the perceptions that contributed less to the final score were “Consciousness of Maintenance/Equipment” and “Quality Awareness”. These factors were based on the care and time spent on the repair and maintenance of equipment, as well as the training provided in the area of quality.
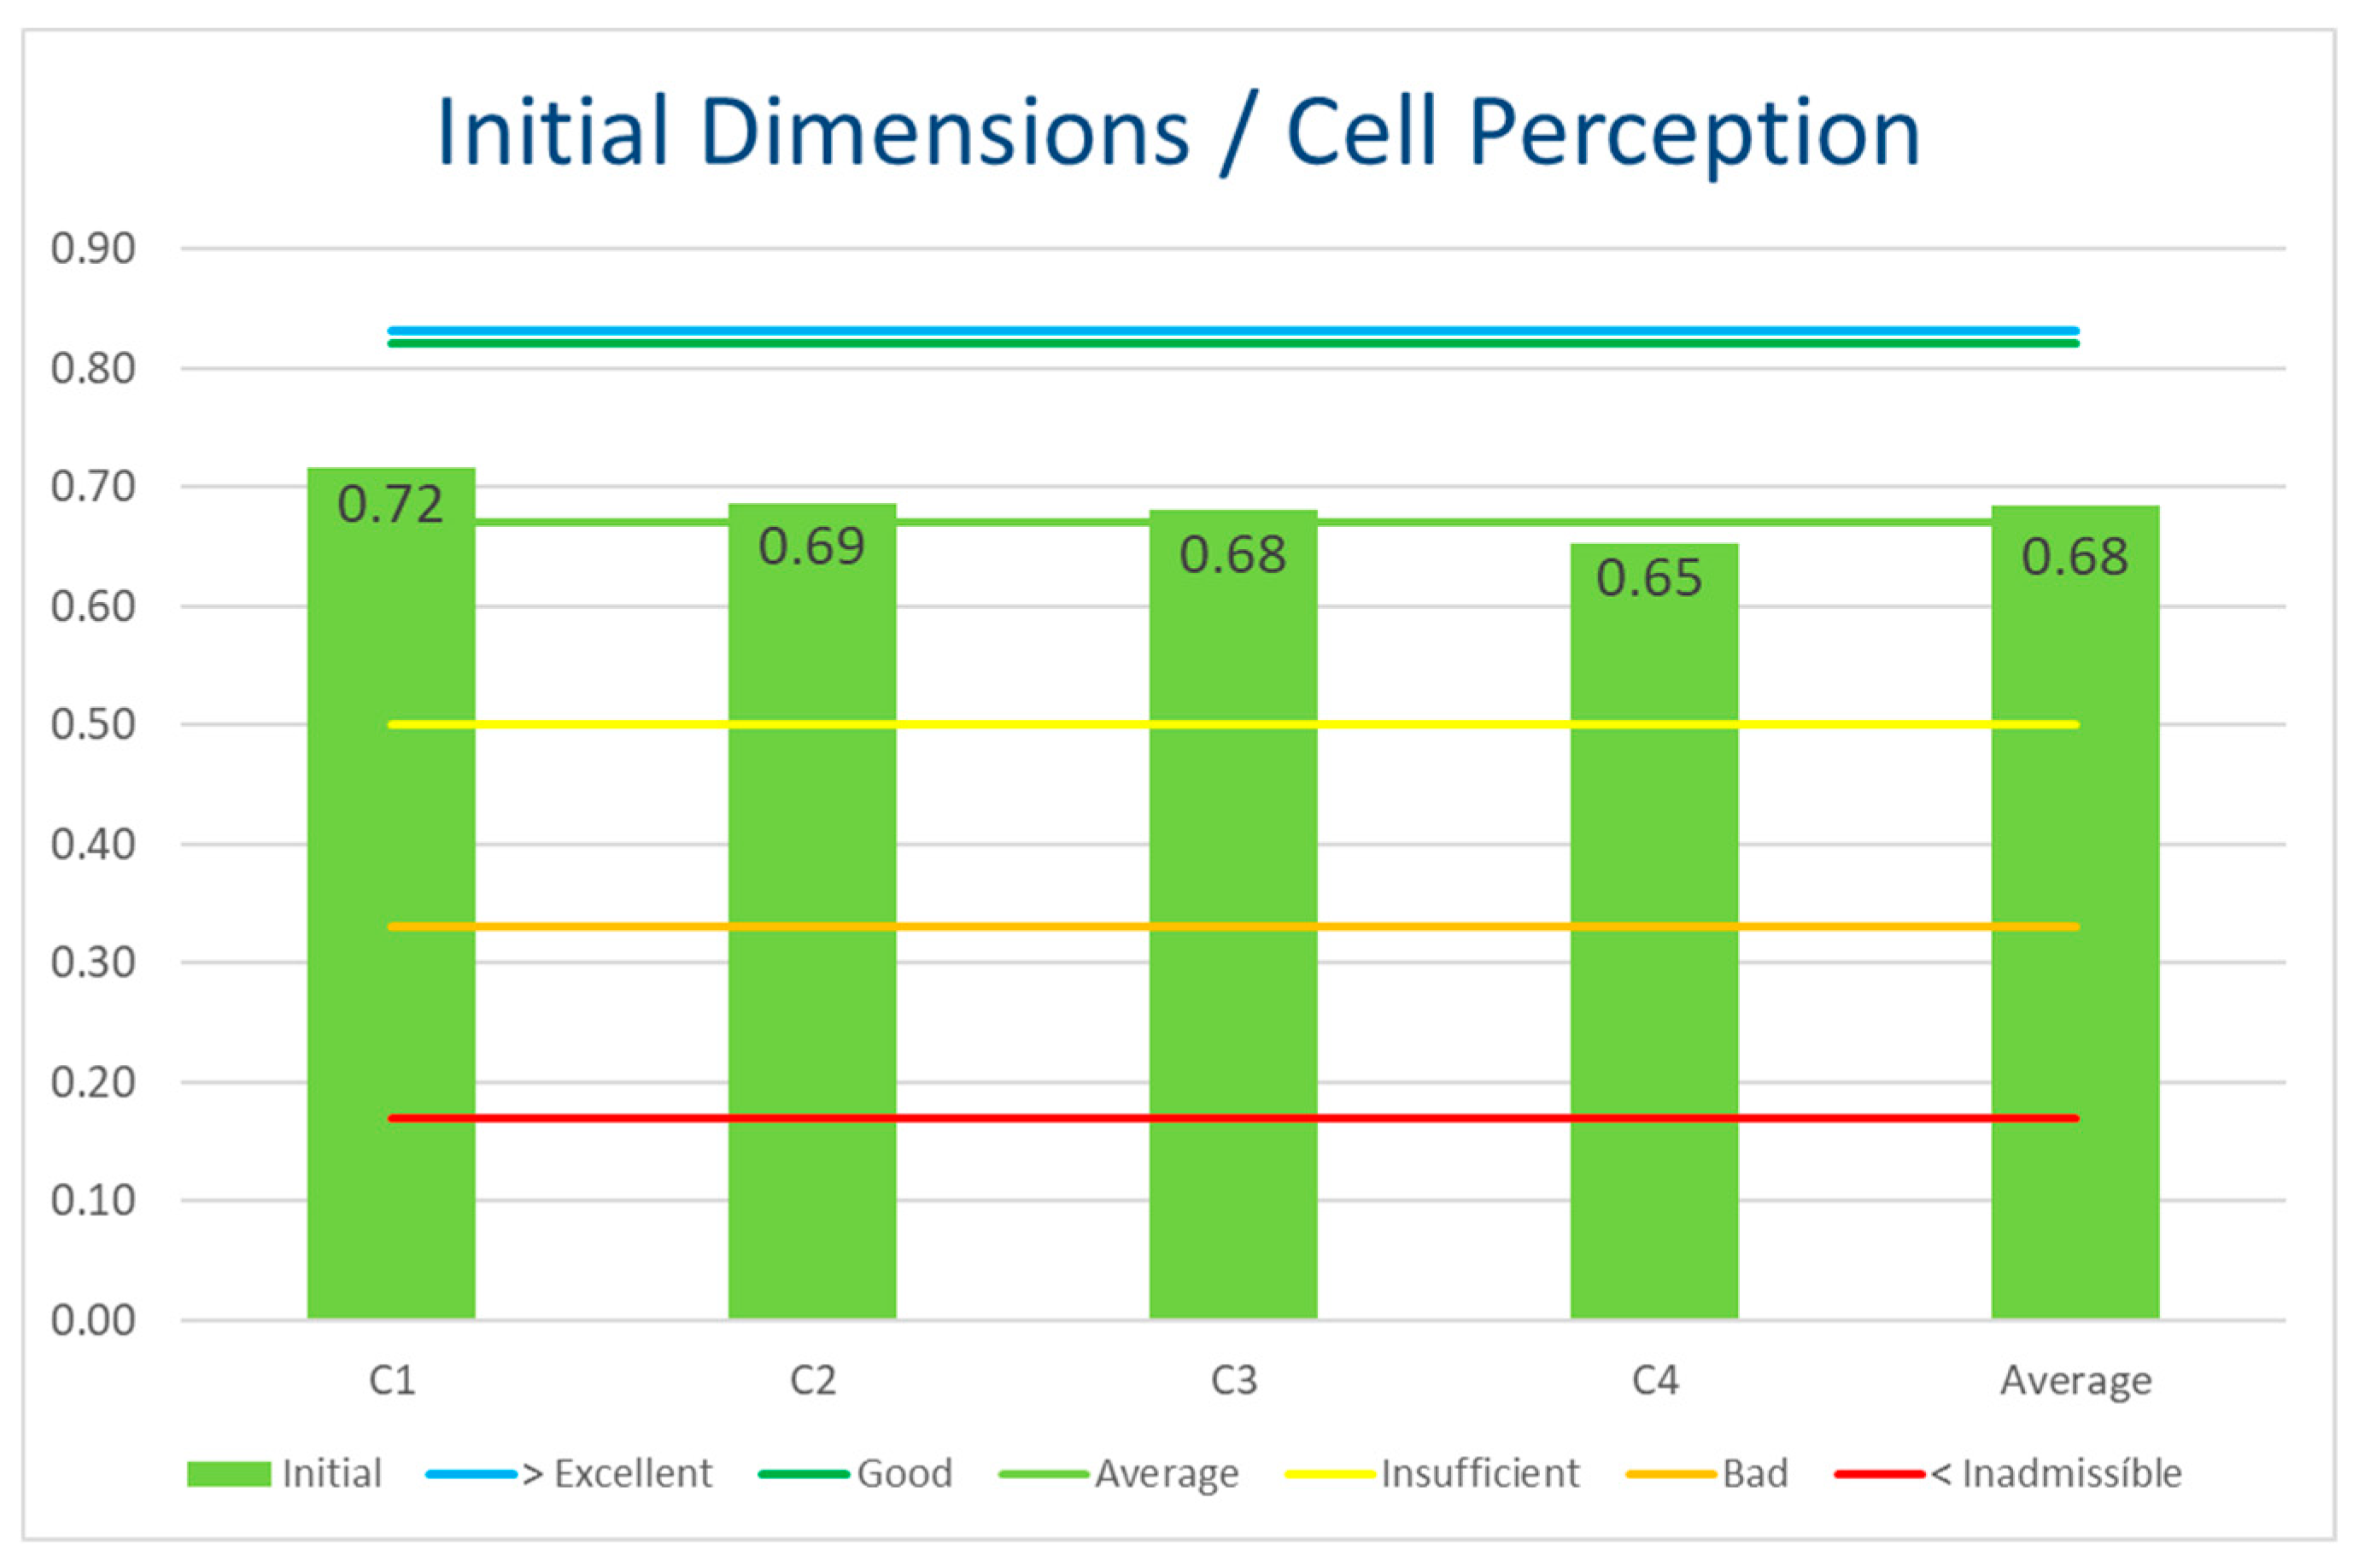
Overall Perception/Cell: once the final value of the survey was obtained, it was necessary to understand how each cell contributed to the outcome. The lathe cells (1, 2 and 3) presented better results than milling cell, Cell 4. As is visible in Figure 2, Cell 1 stands out positively from the others, and Cell 2 also contributed to an increase in the final average. Cell 3 also presented a Good result, with an average value of 68%. Only Cell 4, with a score of Average (65%), showed a lower final value. The difference in values between the lathe cells and the centers is essentially due to the diversity of jobs that have centers and thus require new programming, in comparison with the more routine jobs produced on the lathes. This is the initial perception of all the dimensions, and Figure 3 represents the same perspective but is cell-oriented; that is, it relates to the means of perceptions per cell.
4.2. Application of LT and LL
Ten tools were selected for this study (Lean and Quality) which, in association with the employees, were expected to generate a great impact within a 3-month period. The chosen tools allowed for changes in processes, manufacturing methods and cooperative management. After analysis of scientific articles and determination of the company’s stage of maturity, the following tools were selected for implementation: (1) Management by Objectives/SMART Objectives—each worker’s objectives were controlled weekly; (2) KPI—the data were transmitted to each team of employees; (3) Daily Kaizen—besides being implemented in the main production area, it was also replicated in small areas (cells of production); (4) Visual Management—reformulated to include cells; (5) PDCA—tool used in daily Kaizen to progress in problem solving; (6) Gemba Walk—the process was performed to include the entire hierarchy, including the CEO; (7) 5S—introduction of the first 3 Ss to enable organization of spaces; (8) The 5 Whys—to address the production of NCs (Non-Conformities) which require more complex solutions; (9) Yokoten—used to disseminate actions determined in the 5 Whys throughout the manufacturing area; (10) Brainstorming—working with cell operators to find proposals for continuous improvement.
4.3. Management by Objectives/SMART Objectives
The objectives are usually defined for one-year time periods in the articles studied. However, for this study, we decided to establish quarterly targets for the machining area with the purpose of ensuring an immediate reward for the results achieved, thus constituting one of the main advantages. SMART goals are ambitious and achievable. In this sense, they were proposed for acceptance by collaborators, with subsequent objectives set up for the first quarter. An easy-to-read form was developed, which established an “agreement” between the manager and the employee for the time period, in this case, the established quarter. The file presented pre-established formulas which, according to the income the employee earns and depending on the objectives achieved, results in a bonus value.
- (1)
- KPI (Key Performance Indicators)
All ten processes of the company’s Quality Management System have their corresponding indicators, increasing to 32 KPIs (Key Performance Indicators) for the company in 2019, because that which cannot be measured cannot be improved. In line with LL philosophy, the company started to disclose all the KPIs (Key Performance Indicators) on the company’s dashboard, with access and explanations being provided to all its employees.
- (2)
- Daily Kaizen in the machining area
A Daily Kaizen meeting was established, counting on the participation of the following collaborators: machining coordinator, planning manager, cells manager, times and methods manager and the maintenance manager. This took place every day from 9:50 a.m. to 10:00 p.m., and its purpose was to transmit daily information from the four Kaizen factory cells. This meeting occurred at the beginning of the shift and would feed relevant information to the next “operations” meeting.
- (3)
- Visual Management
Visual management allows for a quick indication of the productive state almost in real-time, and the data are made available on the next business day. All employees, from top management to operators, were provided with important information in a simple and effective way. Graphs and data were easily perceived from a three-meter distance, thus allowing for their easy assimilation.
- (4)
- PDCA (Plan–Do–Check–Act)
The PDCA tool was embedded in the Daily Kaizen panel, which allowed the company to have a perception of whether results were within the objective. Possible proposals for improvements or sector needs were recorded as a plan of action, for which evolution of the work performed was verified daily by the person responsible for surpassing the problems. Through the target objective, decisions and actions were carried out when the expected results were considered inappropriate or when actions exceeded the established timings.
- (5)
- Gemba Walk
Even though the Gemba Walk was implemented unofficially, it was undertaken in a structured manner. The various levels of Gemba Walk involvement allowed for issues to be treated from a more technical level to a management level, depending on the hierarchy of the participants. The Gemba Walk rules and corresponding descriptions are shown in Table 2.
The appendix of the Gemba Walk is an optional section that can contain details and data that supplement the main text. For example, one might include: explanations of experimental details that would disrupt the flow of the main text, but nonetheless remain crucial to understanding and reproducing the research shown; brief figures of replicates for experiments, the representative data of which are shown in the main text. The mathematical proof of results that are not central to the Gemba Walk can be added as an appendix to the main document.
- (6)
- 5S
This process was relatively easy to implement and is coupled with the need for operational improvement. All the employees became involved immediately and had clear ideas regarding the organization of their workstation, thus becoming more efficient. The simplicity of the implemented actions was inversely proportional to the gains.
- (7)
- The 5 Whys
After the project started, and with the advent of the first non-conformities (NCs), as well as the conventional process of treating these (NC registering), we had to improve the analysis of the root-causes regarding possible complex problems. A new form was created to include the identification of these problems where the 5 Whys methodology was followed in an attempt to find the root cause of the problem. This procedure was used twice in eight exercises.
- (8)
- Yokoten
This tool is usually used to disseminate actions resulting from use of the 5 Whys tool. One of the tools that drew the most attention was the Yokoten philosophy. “Yokoten” is a Japanese term meaning “sharing information”. It is the practice of sharing the information “horizontally” across the different sectors, areas and departments of the organization, such as good ideas, important practices and solutions to problems that can be replicated. It takes advantage of the knowledge acquired or developed, by passing it systematically and horizontally; thus, session partners do not make mistakes or apply something which was already tested incorrectly on another working cell. The concept is to present the problems solved through the 5 Whys to one of the working cells where the problem has already been worked on. When the real root cause is detected, these corrective actions are transferred to other manufacturing cells. The analysis and actions required are implemented locally so that the potential problem does not occur again.
- (9)
- Brainstorming
This refers to a dynamic group used as a problem-solving technique, which develops ideas or improvements in processes or products; fundamentally, it is used to stimulate creative thinking. In this sense, in the middle of January 2019, a brainstorming session was held with cell coordinators, who are responsible for the productive sector and maintenance. This meeting resulted in 24 proposals being signed, which were divided into 8 families. Most of the proposals were oriented towards the improvement of processes and waste reduction. At the end of the study, 71% of the proposals were implemented.
4.4. Data Analysis
In the first week of April, the same survey was distributed to the same employees, in order to gauge their perception of the LTs implemented, as well as that of the changes introduced in terms of LTs. The analysis involved understanding the evolution of the general dimensions, the overall progress of cells and, finally, the development of each dimension.
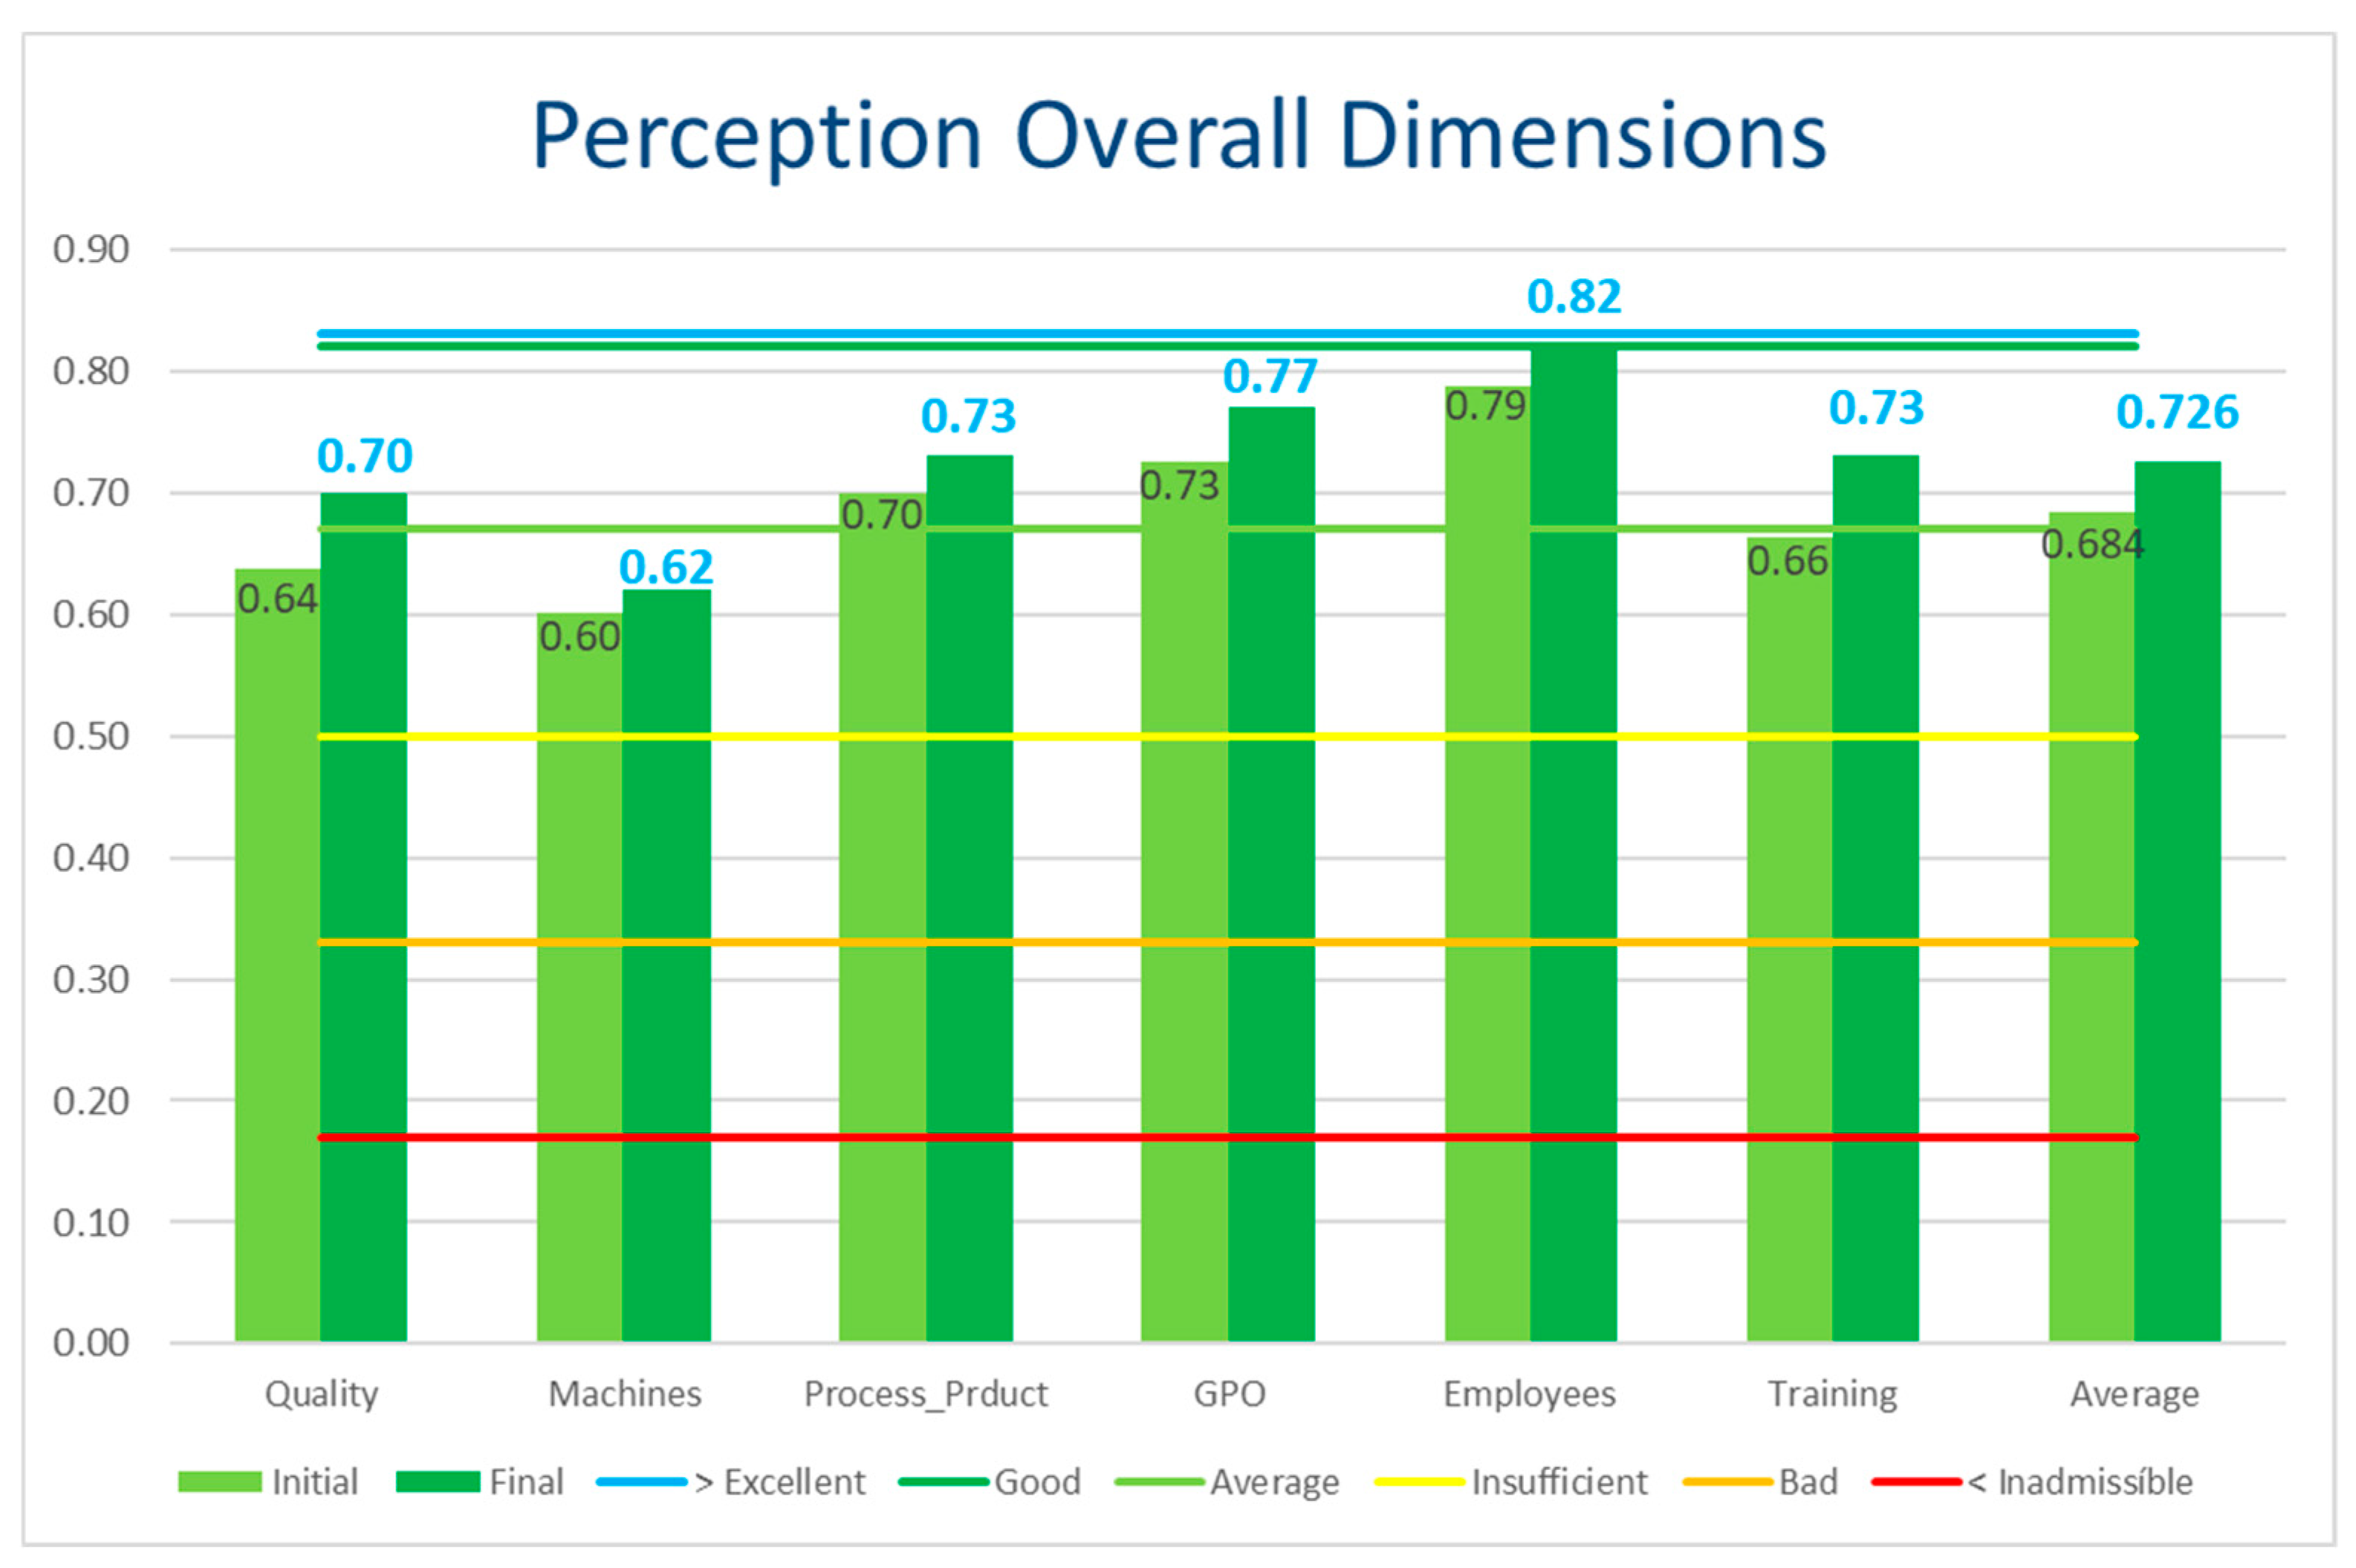
Perception of Overall Dimensions: As shown in Figure 4, the final values rose from 68.4% to 72.6%, i.e., an increase of 6.14%. i.e., [(72.6 − 68.4):68.4 = 6.14%].
The dimensions that increased most in terms of employee perception was Training, which increased by 9.58%, i.e., a difference between the initial perception 66% and the final perception of 73% [(73 − 66):73 = 9.58%].
For Quality we have an initial value of 64% and a final value of 70%, which gives an increase of 8.57% i.e., [(70 − 64):70 = 8.57%]
The dimension Leadership/GPO showed an increase of 5.5%. Values that were below average, but positive compared to the initial survey, were 4.3% for the Product Process dimension, 3.8% for the Personal dimension and 3.4% for the “Maintenance and Equipment” dimension.
In all of the dimensions, there was an improvement in employees’ perception, which was 6.1% higher in the three months after the initial data was obtained, which represented the involvement of all the organization’s staff members. The main conclusion to be drawn from the various dimensions is the high perception that employees have of “Personal Confidence” which, at the end of the study, was very close to excellent. Furthermore, one observed an acceptance of the implementation of the GPO process which, even without clear final data, allowed employees to realize that the data available within that period would allow them to obtain rewards/bonuses associated with their salaries.
The Product Process and Training dimensions both contributed a final score of 73%, slightly above average, which emphasized that the effort made in providing training to employees improved the initial result from 68% to 73%.
The short implementation time of the tools was not enough to see a clear shift of employees’ perceptions regarding the changes made in the Quality dimension and the Maintenance and Machines dimension, thus raising the scores in the same way. However, other dimensions, such as Quality, rose from Average to Good in the final assessment.
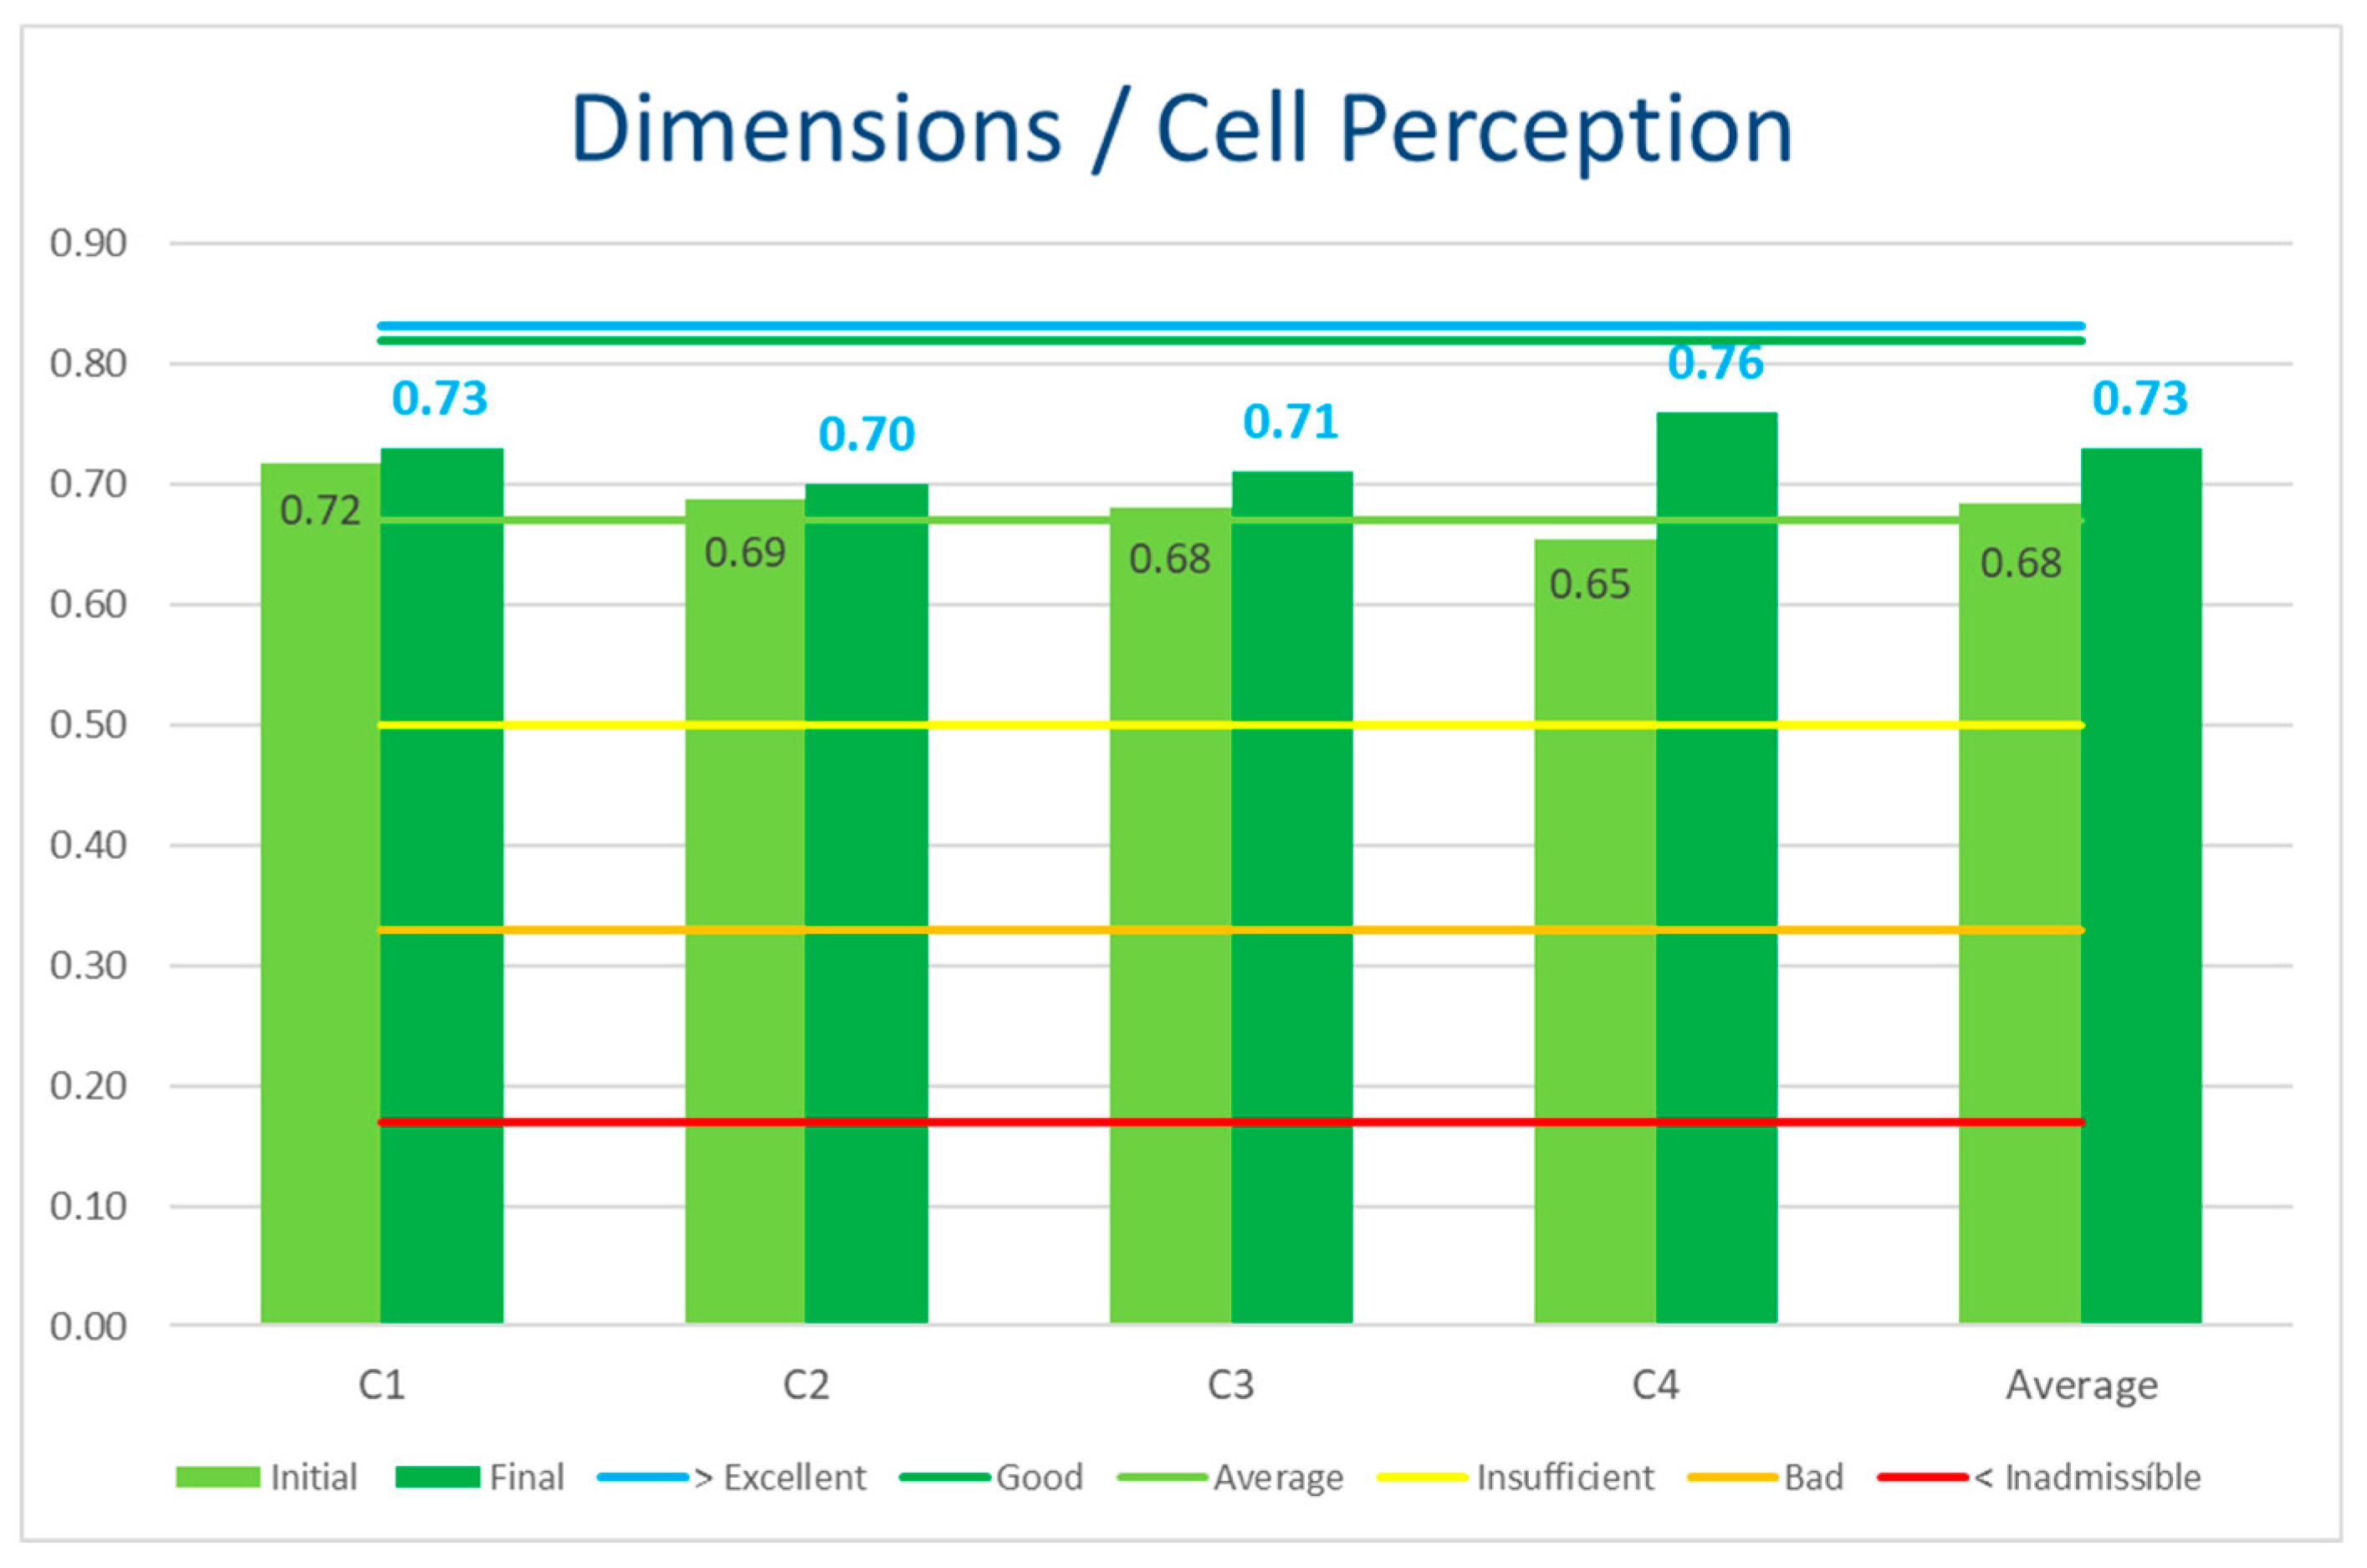
Perception of Overall Cell Dimension: there was an overall increase of 6.1% over the review period, as is verified in Figure 4, which shows the increase achieved by each of the cells in comparison to the initial data, which represent the staff’s initial perception. Some new machines were purchased, and the employees were aware of the fact that the old machines did not meet the operators’ expectations, hence the rise in value.
In the analyzed period, an increase was achieved for each of the cells compared to the initial data. This average increase was 6.1%, as can be observed in Figure 4. In this case, SMED was not applied, because the company was involved in the development phase of the CNC program (FANUC). SMED would be applied in the next step, although this article does not cover this phase.
Along with an overall increase in all the cells, Figure 5 shows that Cell 4 presented the highest contribution at 16.9%; this was followed by Cell 3, which improved by 4.4% from its initial perception. Cells 1 and 2 each showed a 1.4% increase. The effort made on Cell 4, which showed the lowest value in early January, completed the process, obtaining the best score of 76%. The main contributors were the dimensions of Awareness of Personal Confidence and Leadership Awareness/GPO, which managed to link LT with LL and worked together with employees to achieve the ultimate goals. Cell 3 followed the same pattern. Cell 2 remained very stable in its final behavior. In contrast, even though Cell 1 increased from 72% to 73%, it presented other dimensions that lowered the score, specifically the dimensions of Consciousness of Maintenance and Equipment and of Consciousness of Personal Confidence.
Quality Awareness Perception: This perception showed the highest growth of 9.4%, moving from the Average to Good category. The highest growth in percentage level was recorded in Cell 2 at 15.3%, followed by Cell 4 with an increase of 12.3%, which scored the highest value of 73%. Cell 3 increased by 9.8%, and cell 1 grew 2.9%.
The questions Q3—“Can I identify the root causes of the NCs produced” and Q5—“I implement improvement actions,” were given the highest scores by employees. For question Q4 referring only to quality “I have adequate training to solve the NCs”, there was a significant increase during the first investigation. It was concluded that the Lean concept implemented was perceived, accepted and developed by the collaborators, namely the LTs: the 5 Whys and PDCA. This increase in the score allowed the rating to rise from the Average to the Good category.
Perception of “Consciousness of Maintenance and Equipment”: The perception of Consciousness of Maintenance and Equipment increased by 3.3%, remaining at the same level at Average. The 10.3% increase in Cell 4 should be highlighted, serving as an example of improvement, followed by Cell 2 with a 6.9% increase. Cell 3 presented the same value, and in Cell 1 the values decreased by about 1.6%.
The existence of other LTs like TPM, specific to maintenance and equipment, were not implemented due to the need for more resources, which explains why this dimension did not grow as much as the others. The work carried out by the 5S team, which included maintenance members, helped to increase the final perception by 2%, with Cell 1 showing a different perception compared to the others.
In questions M1—“The machines you take care of and the cells are in good repair and maintenance” and “The machines that you take care of, as well as the cell operations are in good repair and maintenance is up to date” and M5 —“I feel able to solve equipment problems and I have the training to do so” presented the highest scores and had the highest values, which validates the perception that the implemented LTs were oriented towards management/leadership, and not directed at equipment and maintenance.
Perception of Consciousness of the Product Process: In the perception of Consciousness of the Product Process, the final value increased by 4.3% for Cell 3. There was also a residual increase for Cell 1 of 1.4%. In turn, Cell 2 decreased its score by 1.5%. Based on the same principle as the previous point, LT was not product-driven, allowing the percentage to rise from 70% to 73%. Validating this statement are the scores of 79% for the question P5—“I’m totally comfortable when working on my cell,” which went up by 8%, as well as question P6—“I know what I have to do during my shift,” with a final score of 78% and a 3% increase. The LTs that supported this increase in score were 5S, Management by Objectives, the Kaizen Diary and Visual Management.
Perception of Leadership Awareness/GPO: On average, this dimension increased by 5.5%. On observing the four cells, one can see that Cell 4 had a major impact, with a contribution of 25%. Cell 1 helped the overall climb, with 3.8%. However, Cell 3 kept its score, and Cell 2 dropped 5.1% between January and April of 2019. This dimension scores second in the ranking of the most valued, at 77%. The LTs: GPO/SMART Objectives and Gemba Walk, as well as KPI and Daily Kaizen, Visual Management and Yokoten, were involved in the process, allowing all cells to contribute to the higher scores observed from Cell 4. The questions G1—“Was the Goal Management Process (GPO) presented in a transparent manner and is the method of rewarding understandable?” and G4—“I believe I will get a good reward for achieving the cell’s goals?” were both valued at 78%.
Perception of Personal Confidence: With an increase of 3.8% at the end of the study, Cell 4 increased by 15.6%, which was the only area where Excellent was achieved. Additionally, Cell 3 presented an increase of 3.8% and was close to this Excellent level. The values decreased for Cells 2 and 1 by 3.8% and 1.2%, respectively. The dimension with the best result (82%) was Personal Confidence, with the result within just 1.3% of the Excellent level. This reference was obtained from Cell 4. The questions E5—“I feel we can get better and better in a process of continuous improvement”, with 87%, presented the highest score of all the questions in the survey. The team was generally involved in all of the LTs, such as Brainstorming, Yokoten, 5S, Daily Kaizen and Visual Management, within the LL philosophy. The data were recorded in the form of KPI in Daily Kaizen and through the Gemba Walk process, thus engaging the entire company.
Perception of Training Awareness: A similar growth rate of 10.6% was achieved for the perception of Training Awareness. Its growth was generic for all cells, with Cell 4 highlighted at 13.8%. Cell 2 recorded the second-best growth of 8.7%. Similar growth values were presented for Cells 3 and 1, at 7.6% and 7.5%, respectively.
The results obtained validate the company’s involvement in creating better conditions through LL, namely in the training and follow-up of all its employees. All the LTs were explained and recorded in the training form, allowing for a better understanding of the actions undertaken during the period. The Gemba Walk was fundamental in the consolidation of the tools. The generic growth for all cells, ranging from 5% to 9%, establishes the average at 6%, with 76% as the final score.
4.5. Data Analysis—Cronbach’s Alpha
Analysis of the internal consistency of the questionnaires using Cronbach’s alpha was undertaken. In order to assess the characteristics that constitute each of the dimensions of the employees’ perceptions, an analysis of internal consistency was carried out. Cronbach’s Alpha intends to assess the extent to which items in a given set measure the same dimension, being directly related to the relationship between those same items, and varying numerically between 0 and 1 [102]. The greater the correlations between the items, the greater the homogeneity of the items and, in turn, the greater the consistency with which they measure the same dimension or construct.
With regard to the questionnaire that was carried out in January, Cronbach’s alpha generated a value of 0.802. Regarding the questionnaire carried out in April, Cronbach’s alpha produced a value of 0.849, so it can be concluded that the level of consistency of the questionnaires is good.
5. Conclusions
The implementation of LT and LL over a short period of time, which is the case in this study (just three months), validates that it can be implemented and understood quickly by employees. Although LT applied to promote Quick Wins were used during a short period of three months, it was able to promote some changes in the manufacturing processes, leading to better organization, focus, consistency and viability. Since Quick Wins were the main focus of this study, the period of three months was considered to be the minimum time interval required to obtain clear results; thus, we did not overextend the interval in order to maintain evidence of the “Quick” factor.
The way to measure a company’s overall results is through financial means; however, employee satisfaction can be measured by the workers’ turnover, as well as by using satisfaction surveys. The results which ensued from the surveys of the employees regarding the various perceptions were highly positive, with an increase of 6.1% during a period of a mere 3 months. These tools created an additional motivation for employees, and there was greater involvement in all the sectors to achieve common goals, which is the great challenge of LL. Hence, this study aims to identify which lean tools allow companies to obtain benefits/gains quickly. The authors hope this study is a contribution to the scientific community and to companies.
Another conclusion was a significant increase in the effect of the correlation between the perception of Personal Confidence and of Consciousness of the Product Process, which moved from an association of a positive mean correlation (0.40) to a strong correlation (0.64) with the implementation of the Lean processes. This drew the value close to its maximum value of 1, pointing to an increase of 68%, as is shown in the results. Future development is expected to be positive through the implementation of other LTs, such as the milk run, one-point lesson and Poka-Yoke, which are always accompanied by the Gemba carried out by top management. In symbiosis with all the employees, all of these procedures will enable sustainable growth. In sum, this research study will undoubtedly contribute to the company’s economic development.
Author Contributions
Conceptualization, J.R. and J.C.S.; methodology, F.J.G.S. and G.J.; investigation, J.R. and J.C.S.; formal analysis J.C.S., L.P.F. and F.J.G.S.; supervision: F.J.G.S. and G.S.; validation: F.J.G.S., L.P.F., J.C.S., G.J. and G.S.; writing—original draft, reviewing and editing, J.R., J.C.S., F.J.G.S., G.S., G.J. and L.P.F.; resources, J.R.; project administration, J.R. and J.C.S. All authors have read and agreed to the published version of the manuscript.
Funding
This research received no external funding.
Acknowledgments
The authors would like to thank the company where the study took place.
Conflicts of Interest
The authors declare no conflict of interest.
References
- Rodrigues, J.; de Sá, J.C.V.; Ferreira, L.P.; Silva, F.J.G.; Santos, G. Lean management “quick-wins”: Results of implementation. A case study”. Qual. Innov. Prosper. 2019, 23, 3–21. [Google Scholar] [CrossRef] [Green Version]
- Ribeiro, P.; Sá, J.C.; Ferreira, L.P.; Silva, F.J.G.; Pereira, M.T.; Santos, G. The impact of the application of lean tools for improvement of process in a plastic company: A case study”. Procedia Manuf. 2019, 38, 765–775. [Google Scholar] [CrossRef]
- Santos, G.; Sá, J.C.; Oliveira, J.; Ramos, D.; Ferreira, C. Quality and Safety Continuous Improvement through Lean Tools. In Lean Manufacturing—Implementation, Opportunities and Challenges; Silva, F., Ferreira, L., Eds.; Nova Science Publishers: New York, NY, USA, 2019; Chapter 8; pp. 165–188. [Google Scholar]
- Azevedo, J.; Sá, J.C.; Ferreira, L.P.; Santos, G.; Cruz, F.M.; Jimenez, G.; Silva, F.J.G. Improvement of production line in the automotive industry through lean philosophy. Procedia Manuf. 2019, 41, 1023–1030. [Google Scholar] [CrossRef]
- Vieira, T.; Sá, J.C.; Lopes, M.P.; Santos, G.; Félix, M.J.; Ferreira, L.P.; Silva, F.J.G.; Pereira, M.T. Optimization of the cold profiling process through Lean Tools. Procedia Manuf. 2019, 38, 892–899. [Google Scholar] [CrossRef]
- Bäckström, I.; Ingelsson, P. Is there a relationship between Lean Leaders and healthy co-workers? Qual. Innov. Prosper. J. 2015, 19, 123–136. [Google Scholar] [CrossRef] [Green Version]
- Dombrowski, U.; Mielke, T. Lean Leadership—15 Rules for a Sustainable Lean Implementation. Procedia CIRP 2014, 17, 565–570. [Google Scholar] [CrossRef] [Green Version]
- Pierce, J.L.; Kostova, T.; Dirks, K.T. Toward a theory of psychological ownership in organizations. Acad. Manag. Rev. 2001, 26, 298–310. [Google Scholar] [CrossRef] [Green Version]
- Avey, J.B.; Avolio, B.J.; Crossley, C.D.; Luthans, F. Psychological ownership: Theoretical extensions, measurement and relation to work outcomes. J. Organ. Behav. 2009, 30, 173–191. [Google Scholar] [CrossRef]
- Pierce, J.L.; Kostova, T.; Dirks, K.T. The state of psychological ownership: Integration and extending a century of research. Rev. Gen. Psychol. 2003, 7, 84–107. [Google Scholar] [CrossRef]
- Pinto, H.; Pimentel, C.; Cunha, M. Implications of Total Productive Maintenance in Psychological Sense of Ownership. Procedia Soc. Behav. Sci. 2016, 217, 1076–1082. [Google Scholar] [CrossRef] [Green Version]
- Campbell, J. SMART Criteria; Salem Press Encyclopedia: New York, NY, USA, 2018. [Google Scholar]
- Ferreira, S.; Silva, F.J.G.; Casais, R.B.; Pereira, M.T.; Ferreira, L.P. KPI development and obsolescence management in industrial maintenance. Procedia Manuf. 2019, 38, 1427–1435. [Google Scholar] [CrossRef]
- Stricker, N.; Minguillon, F.E.; Lanza, G. Selecting key performance indicators for production with a linear programming approach. Int. J. Prod. Res. 2017, 55, 5537–5549. [Google Scholar] [CrossRef]
- Zhu, L.; Johnsson, C.; Varisco, M.; Schiraldi, M. Key performance indicators for manufacturing operations management—Gap analysis between process industrial needs and ISO 22400 standard. Procedia Manuf. 2018, 25, 82–88. [Google Scholar] [CrossRef]
- Azizi, A. Evaluation Improvement of Production Productivity Performance using Statistical Process Control, Overall Equipment Efficiency, and Autonomous Maintenance. Procedia Manuf. 2015, 2, 186–190. [Google Scholar] [CrossRef] [Green Version]
- Zarbo, R.; Varney, R.; Copeland, J.; D’Angelo, R.; Sharma, G. Daily Management System of the Henry Ford Production System. Am. J. Clin. Pathol. 2015, 144, 122–136. [Google Scholar] [CrossRef] [PubMed] [Green Version]
- Verbano, C.; Crema, M.; Nicosia, F. Visual management system to improve care planning and controlling: The case of intensive care unit. Prod. Plan. Control 2017, 28, 1212–1222. [Google Scholar] [CrossRef]
- Correia, D.; Silva, F.J.G.; Gouveia, R.M.; Pereira, T.; Ferreira, L.P. Improving manual assembly lines devoted to complex electronic devices by applying lean tools. Procedia Manuf. 2018, 17, 663–671. [Google Scholar] [CrossRef]
- Carvalho, F.; Santos, G.; Gonçalves, J. The disclosure of information on Sustainable Development on the corporate website of the certified Portuguese organizations. Int. J. Qual. Res. 2018, 12, 253–276. [Google Scholar]
- Santos, G.; Bravi, L.; Murmura, F. Fabrication laboratories: The development of new business models with new digital technologies. J. Manuf. Technol. Manag. 2018, 29, 1332–1357. [Google Scholar] [CrossRef]
- Bravi, L.; Murmura, F.; Santos, G. Attitudes and behaviours of Italian 3D prosumer in the Era of Additive Manufacturing. Procedia Manuf. 2017, 13, 980–986. [Google Scholar] [CrossRef]
- Marinho, A.; Silva, R.G.; Santos, G. Why most university-industry partnerships fail to endure and how to create value and gain competitive advantage through collaboration—A systematic review. Qual. Innov. Prosper. 2020, 24, 34–50. [Google Scholar] [CrossRef]
- Jiménez-Delgado, G.; Santos, G.; Félix, M.J.; Teixeira, P.; Sá, J.C. A combined ahp-topsis approach for evaluating the process of innovation and integration of management systems in the logistic sector. In International Conference on Human-Computer Interaction, Proceedings of the HCII 2020: HCI International 2020—Late Breaking Papers: Interaction, Knowledge and Social Media, Copenhagen, Denmark, 19–24 July 2020; Springer: Cham, Switzerland, 2020; pp. 535–559. [Google Scholar]
- Pombal, T.; Ferreira, L.P.; Sá, J.C.; Pereira, M.T.; Silva, F.J.G. Implementation of Lean Methodologies in the Management of Consumable Materials in the Maintenance Workshops of an Industrial Company. Procedia Manuf. 2019, 38, 975–982. [Google Scholar] [CrossRef]
- Bateman, N.; Philp, L.; Warrender, H. Visual management and shop floor teams – development, implementation and use. Int. J. Prod. Res. 2016, 54, 7345–7358. [Google Scholar] [CrossRef] [Green Version]
- Araújo, R.; Santos, G.; Costa, J.B.; Sá, J.C. The quality management system as a driver of organizational culture: An empirical study in the Portuguese textile industry. Qual. Innov. Prosper. 2019, 23, 1–24. [Google Scholar] [CrossRef] [Green Version]
- Félix, M.J.; Silva, S.; Santos, G.; Doiro, M.; Sá, J.C. Integrated product and processes development in design: A case study. Procedia Manuf. 2019, 41, 296–303. [Google Scholar] [CrossRef]
- Sá, J.C.; Barreto, L.; Amaral, A.; Carvalho, F.; Santos, G. Perception of the importance to implement ISO 9001 in organizations related to people linked to quality—An empirical study. Int. J. Qual. Res. 2019, 13, 1055–1070. [Google Scholar] [CrossRef]
- Jimenez, G.; Santos, G.; Félix, M.; Hernández, H.; Rondón, C. Good Practices and Trends in Reverse Logistics in the plastic products manufacturing industry. Procedia Manuf. 2019, 41, 367–374. [Google Scholar] [CrossRef]
- Rosa, C.; Silva, F.J.G.; Ferreira, L.P. Improving the quality and productivity of steel wire-rope assembly lines for the automotive industry. Procedia Manuf. 2017, 11, 1035–1042. [Google Scholar] [CrossRef]
- Schwagerman, W., III; Ulme, J.M. The A3 Lean Management and Leadership Thought Process. J. Technol. Manag. Appl. Eng. 2013, 29, 1–10. [Google Scholar]
- Gesinger, S. Experiential Learning: Using Gemba Walks to Connect with Employees. Prof. Saf. 2016, 61, 33–36. [Google Scholar]
- Southworth, T. Gemba walks. Label Narrow Web 2012, 17, 38–39. [Google Scholar]
- Ahmed, M. Daily walks train future leaders. Ind. Manag. 2014, 56, 22–27. [Google Scholar]
- Nestle, M. Gemba is Gold. Six Sigma Forum 2013, 13, 32–36. [Google Scholar]
- Santos, G.; Gomes, S.; Braga, V.; Braga, A.; Lima, V.; Teixeira, P. Value creation through quality and innovation - a case study on Portugal. TQM J. 2019, 31, 928–947. [Google Scholar] [CrossRef]
- Félix, M.J.; Gonçalves, S.; Jimenez, G.; Santos, G. The contribution of design to the development of products and manufacturing processes in the Portuguese industry. Procedia Manuf. 2019, 41, 1055–1062. [Google Scholar] [CrossRef]
- Doiro, M.; Santos, G.; Felix, M.J. Machining operations for components in kitchen furniture: A comparison between two management systems. Procedia Manuf. 2019, 41, 10–17. [Google Scholar] [CrossRef]
- De Soete, W. Towards a Multidisciplinary Approach on Creating Value: Sustainability through the Supply Chain and ERP Systems. Systems 2016, 4, 16. [Google Scholar] [CrossRef] [Green Version]
- Minter, S. What Leaders Should Do on the Gemba. Ind. Week/IW 2015, 264, 26. [Google Scholar]
- Santos, G.; Murmura, F.; Bravi, L. Developing a model of vendor rating to manage quality in the supply chain. Int. J. Qual. Serv. Sci. 2019, 11, 34–52. [Google Scholar] [CrossRef]
- Africano, N.; Rodrigues, A.S.; Santos, G. The main benefits of the implementation of the quality management system in higher education institutions in Angola. Qual. Innov. Prosper. 2019, 23, 122–136. [Google Scholar] [CrossRef] [Green Version]
- Barbosa, L.C.F.M.; de Oliveira, O.J.; Santos, G. Proposition for the alignment of the integrated management system (quality, environmental and safety) with the business strategy. Int. J. Qual. Res. 2018, 12, 925–940. [Google Scholar]
- Dana, B. The Gemba Walk—A Tool for Management and Leadership. Ovidius Univ. Ann. Ser. Econ. Sci. 2015, 15, 450–455. [Google Scholar]
- Santos, D.; Rebelo, M.; Santos, G. The Integration of certified Management Systems. Case Study—Organizations located at the district of Braga, Portugal. Procedia Manuf. 2017, 13, 964–971. [Google Scholar] [CrossRef]
- Bravi, L.; Murmura, F.; Santos, G. The ISO 9001:2015 Quality Management System Standard: Companies’ Drivers, Benefits and Barriers to Its Implementation. Qual. Innov. Prosper. J. 2019, 23, 64–82. [Google Scholar] [CrossRef] [Green Version]
- Santos, G.; Doiro, M.; Mandado, E.; Silva, R. Engineering learning objectives and computer assisted tools. Eur. J. Eng. Educ. 2019, 44, 616–628. [Google Scholar] [CrossRef]
- Santos, G.; Rebelo, M.; Ramos, S.; Silva, R.; Pereira, M.; Ramos, G.N.L. Developments regarding the integration of the occupational safety and health with quality and environment management systems. In Occupational Safety and Health; Kavouras, I.G., Chalbot, M.-C.G., Eds.; Nova Publishers: New York, NY, USA, 2014; pp. 113–146. [Google Scholar]
- Rebelo, M.F.; Santos, G.; Silva, R. Integration of Standardized Management Systems: A Dilemma? Systems 2015, 3, 45–59. [Google Scholar] [CrossRef] [Green Version]
- Peldschus, F. The Analyses of the Quality of the results obtained with the methods of multi-criteria decisions. Technol. Econ. Dev. Econ. 2009, 15, 580–592. [Google Scholar] [CrossRef]
- Silva, S.; Sá, J.C.; Silva, F.J.G.; Ferreira, L.P.; Santos, G. Lean Green—The Importance of Integrating Environment into Lean Philosophy-A Case Study. In European Lean Educator Conference, Proceedings of the ELEC 2019: 6th European Lean Educator Conference, Milan, Italy, 11–13 November 2019; Springer: Cham, Switzerland, 2020; Volume 122, pp. 211–219. [Google Scholar] [CrossRef]
- Urban, W. Service Quality Gaps and their role in service enterprises development. Technol. Econ. Dev. Econ. 2009, 15, 631–645. [Google Scholar] [CrossRef]
- Sá, J.C.; Vaz, S.; Carvalho, O.; Lima, V.; Morgado, L.; Fonseca, L.M.; Doiro, M.; Santos, G. A model of integration ISO 9001 with Lean six sigma and main benefits achieved. Total Qual. Manag. Bus. Excell. 2020, in press. [Google Scholar] [CrossRef]
- Santos, G.; Millán, A.L. Motivation and benefits of implementation and certification according ISO 9001—The Portuguese experience. Int. J. Qual. Res. 2013, 7, 71–86. [Google Scholar] [CrossRef] [Green Version]
- Rebelo, M.; Santos, G.; Silva, R. Conception of a flexible integrator and lean model for integrated management systems. Total Qual. Manag. Bus. Excell. 2014, 25, 683–701. [Google Scholar] [CrossRef]
- Ribeiro, F.; Santos, G.; Rebelo, M.F.; Silva, R. Integrated Management Systems: Trends for Portugal in the 2025 horizon. Procedia Manuf. 2018, 13, 1191–1198. [Google Scholar] [CrossRef]
- Bravi, L.; Santos, G.; Pagano, A.; Murmura, F. Environmental management system according to ISO 14001:2015 as a driver to sustainable development. Corp. Soc. Responsib. Environ. Manag. 2020, 27, 2599–2614. [Google Scholar] [CrossRef]
- Cordeiro, P.; Sá, J.C.; Pata, A.; Gonçalves, M.; Santos, G.; Silva, F.J.G. The Impact of Lean Tools on Safety—Case Study. In Occupational and Environmental Safety and Health II. Studies in Systems, Decision and Control; Springer: Cham, Switzerland, 2020; Volume 277, pp. 151–159. [Google Scholar] [CrossRef]
- Zgodavova, K.; Bober, P.; Majstorovic, V.; Monkova, K.; Santos, G.; Juhaszova, D. Innovative Methods for Small Mixed Batches Production System Improvement: The Case of a Bakery Machine Manufacturer. Sustainability 2020, 12, 6266. [Google Scholar] [CrossRef]
- Santos, G.; Mendes, F.; Barbosa, J. Certification and integration of management systems: The experience of Portuguese small and medium enterprises. J. Clean. Prod. 2011, 19, 1965–1974. [Google Scholar] [CrossRef] [Green Version]
- Talapatra, S.; Santos, G.; Uddin, K.; Carvalho, F. Main benefits of integrated management systems through literature review. Int. J. Qual. Res. 2019, 13, 1037–1054. [Google Scholar] [CrossRef]
- Carvalho, F.; Santos, G.; Gonçalves, J. Critical analysis of information about integrated management systems and environmental policy on the Portuguese firms’ website, towards sustainable development. Corp. Soc. Responsib. Environ. Manag. 2020, 27, 1069–1088. [Google Scholar] [CrossRef]
- Mohelska, H.; Sokolova, M. Management Approaches for industry 4.0—The organizational perspective. Technol. Econ. Dev. Econ. 2018, 24, 2225–2240. [Google Scholar] [CrossRef] [Green Version]
- Czifra, G. Implementation Process of 5S for a Company in Real Life-Problems, Solutions, Successes. Res. Pap. Fac. Mater. Sci. Technol. Slovak Univ. Technol. 2017, 25, 79–86. [Google Scholar] [CrossRef] [Green Version]
- Santos, G.; Afonseca, J.; Lopes, N.; Félix, M.J.; Murmura, F. Critical success factors in the management of ideas as an essential component of innovation and business excellence. Int. J. Qual. Serv. Sci. 2018, 10, 214–232. [Google Scholar] [CrossRef]
- Costa, C.; Ferreira, L.P.; Sa, J.C.; Silva, F.J.G. Implementation of 5S Methodology in a Metalworking Company, Chapter 01. In DAAAM International Scientific Book; Katalinic, B., Ed.; DAAAM International: Vienna, Austria, 2018; pp. 1–12. ISBN 978-3-902734-19-8. ISSN 1726-9687. [Google Scholar] [CrossRef]
- Veres, C.; Marian, L.; Moica, S.; Al-Akel, K. Case study concerning 5S method impact in an automotive company. Procedia Manuf. 2017, 22, 900–905. [Google Scholar] [CrossRef]
- Todorovic, M.; Cupic, M. How Does 5s Implementation Affect Company Performance? A Case Study Applied to a Subsidiary of a Rubber Goods Manufacturer from Serbia. Eng. Econ. 2017, 28, 311–322. [Google Scholar] [CrossRef]
- Bravi, L.; Murmura, F.; Santos, G. Manufacturing labs: Where new digital technologies help improve life quality. Int. J. Qual. Res. 2018, 12, 957–974. [Google Scholar]
- Jimenez, G.; Santos, G.; Sá, J.C.; Ricardo, S.; Pulido, J.; Pizarro, A.; Hernández, H. Improvement of productivity and quality in the value chain through lean manufacturing—A case study. Procedia Manuf. 2019, 41, 882–889. [Google Scholar] [CrossRef]
- Doiro, M.; Fernández, J.F.; Félix, M.; Santos, G. ERP-machining centre integratin: A modular kitchen production case study. Procedia Manuf. 2017, 13, 1159–1166. [Google Scholar] [CrossRef]
- Neves, P.; Silva, F.J.G.; Ferreira, L.P.; Pereira, T.; Gouveia, R.; Pimentel, C. Implementing Lean tools in the manufacturing process of trimmings products. Procedia Manuf. 2018, 17, 696–704. [Google Scholar] [CrossRef]
- Braglia, M.; Frosolini, M.; Gallo, M. SMED enhanced with 5-Whys Analysis to improve set-upreduction programs: The SWAN approach. Int. J. Adv. Manuf. Technol. 2016, 90, 1845–1855. [Google Scholar] [CrossRef]
- Marques, C.; Lopes, N.; Santos, G.; Delgado, I.; Delgado, P. Improving operator evaluation skills for defect classification using training strategy supported by attribute agreement analysis. Measurement 2018, 119, 129–141. [Google Scholar] [CrossRef]
- Costa, A.R.; Barbosa, C.; Santos, G.; Alves, M.R. Six Sigma: Main Metrics and R Based Software for Training Purposes and Practical Industrial Quality Control. Qual. Innov. Prosper. J. 2019, 23, 83–99. [Google Scholar] [CrossRef]
- Rebelo, M.; Silva, R.; Santos, G.; Mendes, P. Model Based Integration of Management Systems (MSs)-Case Study. TQM J. 2016, 28, 907–932. [Google Scholar] [CrossRef]
- Wells, S.; McLean, J. One Way Forward to Beat the Newtonian Habit with a Complexity Perspective on Organisational Change. Systems 2013, 1, 66–84. [Google Scholar] [CrossRef] [Green Version]
- Silva, A.; Sá, J.; Santos, G.; Silva, F.; Ferreira, L.; Pereira, M. Implementation of SMED in a cutting line. Procedia Manuf. 2020, 51, 1355–1362. [Google Scholar] [CrossRef]
- Santos, G.; Barbosa, J. Qualifound—A modular tool developed for quality improvement in foundries. J. Manuf. Technol. Manag. 2006, 17, 351–362. [Google Scholar] [CrossRef] [Green Version]
- Rebelo, M.F.; Santos, G.; Silva, R. A generic model for integration of quality, environment and safety management systems. TQM J. 2014, 26, 143–159. [Google Scholar] [CrossRef]
- Dias, P.; Silva, F.J.; Campilho, R.D.; Ferreira, L.P.; Santos, T. Analysis and Improvement of an Assembly Line in the Automotive Industry. Procedia Manuf. 2019, 38, 1444–1452. [Google Scholar] [CrossRef]
- Yoji, A. Quality Function Deployment: Integrating Customer Requirements into Product Design; Productivity Press: New York, NY, USA, 1990. [Google Scholar]
- Ferreira, C.; Sá, J.C.; Ferreira, L.P.; Lopes, M.P.; Pereira, T.; Silva, F.J.G. iLeanDMAIC: A methodology for implementing the lean tools. Procedia Manuf. 2019, 41, 1095–1102. [Google Scholar] [CrossRef]
- Deming, W.E. Out of the Crisis. [S.l.]; MIT Center for Advanced Engineering Study: Cambridge, MA, USA, 1986; ISBN 0-911379-01-0. [Google Scholar]
- Castro, C.; Pereira, T.; Sá, J.C.; Santos, G. Logistics reorganization and management of the ambulatory pharmacy of a local health unit in Portugal. Eval. Program Plan. 2020, 80, 101801. [Google Scholar] [CrossRef]
- Hoerl, R.W. Six Sigma and the future of the quality profession. Qual. Prog. 1998, 31, 35–42. [Google Scholar]
- Ohno, T. Toyota Production System: Beyond Large-Scale Production, English Translation ed.; Productivity Press: New York, NY, USA, 1988; ISBN 0-915299-14-3. [Google Scholar]
- Jones, D.T. Corporate renewal through lean design. World Class Des. Manuf. 1995, 2, 6–9. [Google Scholar] [CrossRef]
- Peterson, J.; Smith, R. O Guia de Bolso do 5S; Productivity Press: New York, NY, USA, 1998; ISBN 0-527-76338-1. [Google Scholar]
- Werkema, M. Criando a Cultura Seis Sigma, 1st ed.; Qualitymark: Rio de Janeiro, Brazil, 2002. [Google Scholar]
- Monden, Y. Toyota Production System, 3rd ed.; Chapman & Hall: New York, NY, USA, 1995; ISBN13:9780412839306. [Google Scholar]
- Fonseca, L. In search of Six Sigma in Portuguese SMEs. Int. J. Ind. Eng. Manag. 2017, 8, 31–38. [Google Scholar]
- Imai, M. Kaizen, the key to Japan’s competitive success. In Total Quality Handbook; McGraw-Hill: New York, NY, USA, 1990; p. 32. [Google Scholar]
- Oliveira, J.; Sá, C.S.; Fernandes, A. Continuous improvement through “Lean Tools”: An application in a mechanical company. Procedia Manuf. 2017, 13, 1082–1089. [Google Scholar] [CrossRef]
- Rosa, C.; Silva, F.J.G.; Ferreira, L.P.; Sá, J.C. Lean manufacturing applied to the production and assembly lines of complex automotive. In Lean Manufacturing: Implementation, Opportunities and Challenges; Silva, F.J.G., Ferreira, L.P., Eds.; Nova Science Publishers: New York, NY, USA, 2019; pp. 189–224. [Google Scholar]
- Alefari, M.; Salonitis, K.; Xu, Y. The role of leadership in implementing lean Manufacturing. Procedia CIRP 2017, 63, 756–761. [Google Scholar] [CrossRef]
- Blöchla, S.J.; Michalickib, M.; Schneider, M. Simulation Game for Lean Leadership—Shopfloor Management combined with Accounting for Lean. Procedia Manuf. 2017, 9, 97–103. [Google Scholar] [CrossRef]
- Sadiq, S.; Amjad, M.S.; Rafique, M.Z.; Hussain, S.; Yasmeen, U.; Khan, M.A. An integrated framework for lean manufacturing in relation with blue ocean manufacturing—A case study. J. Clean. Prod. 2019, 279, 123790. [Google Scholar] [CrossRef]
- Solaimani, S.; Talab, A.H.; Rhee, B. An integrative view on Lean innovation management. J. Bus. Res. 2019, 105, 109–120. [Google Scholar] [CrossRef]
- Likert, R. A technique for the measurement of attitudes. Arch. Psychol. 1932, 22, 5–55. [Google Scholar]
- Tavakol, M.; Dennick, R. Making sense of Cronbach’s alpha. Int. J. Med Educ. 2011, 2, 53–55. [Google Scholar] [CrossRef] [PubMed]
Figure 1.
Shop floor divided into four cells and respective machines per cell.
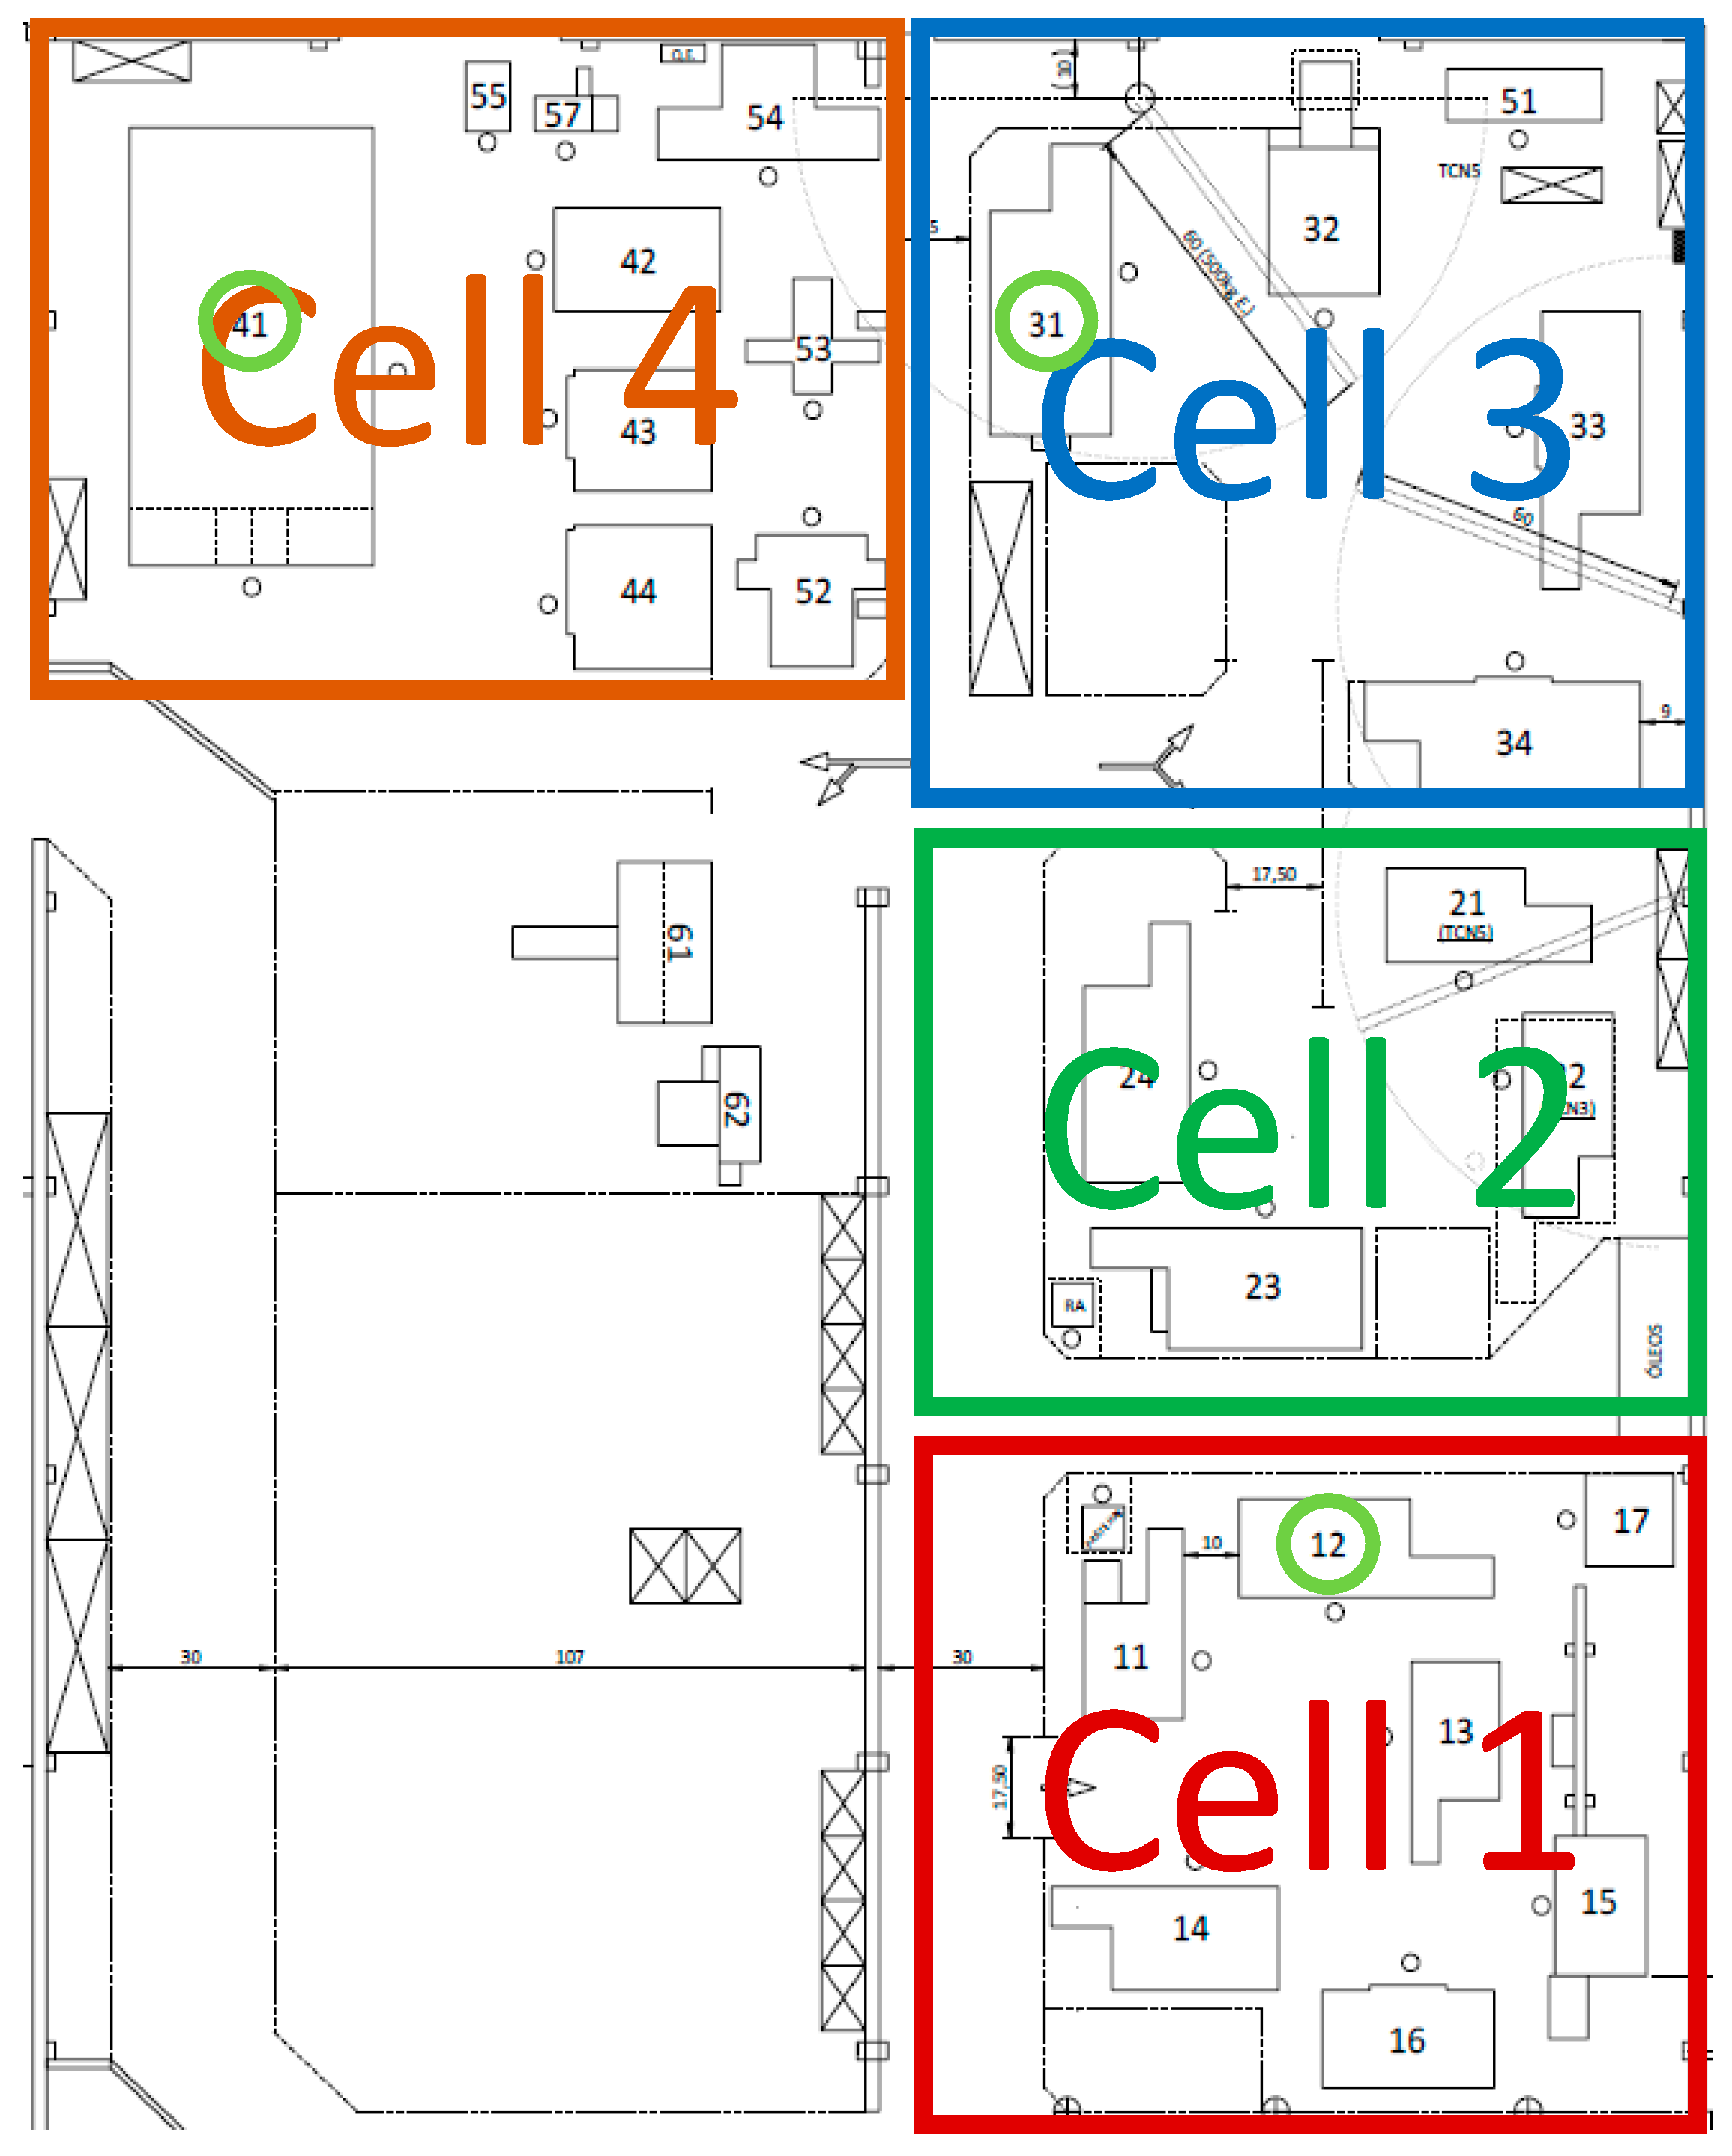
Figure 2.
Initial Results: Initial Perception Overall Dimensions.

Figure 3.
Initial Results: Dimensions/Cell Perception.

Figure 4.
Perception of Results of the Overall Dimensions.

Figure 5.
Dimension Results—Cell Perception.


Table 1.
Equipment divided into 4 cells.
| CNC (Computer Numeric Control) | Quantity of Machines | Max Diameter of Machining | |
|---|---|---|---|
| Cell 1 | Lathes | 6 | 400 mm |
| Cell 2 | Lathes | 4 | 400 mm |
| Cell 3 | Lathes | 5 | 800 mm |
| Cell 4 | Milling Centers | 4 | 800 mm |
| Total | 16 | max. diameter = 800 mm |
Table 2.
Gemba Walk Rules.
| Frequency | Hierarchy | Goal |
|---|---|---|
| Daily | Session head | KPI, verification, action plan, problem-solving |
| Weekly | Production/Quality Director | KPI, verification, improvement proposals |
| Monthly | CEO | Monitoring Projects, KPI, verification of evolution, feedback from employees and managers |
Publisher’s Note: MDPI stays neutral with regard to jurisdictional claims in published maps and institutional affiliations. |
© 2020 by the authors. Licensee MDPI, Basel, Switzerland. This article is an open access article distributed under the terms and conditions of the Creative Commons Attribution (CC BY) license (http://creativecommons.org/licenses/by/4.0/).
Share and Cite
MDPI and ACS Style
Rodrigues, J.; Sá, J.C.; Silva, F.J.G.; Ferreira, L.P.; Jimenez, G.; Santos, G. A Rapid Improvement Process through “Quick-Win” Lean Tools: A Case Study. Systems 2020, 8, 55. https://0-doi-org.brum.beds.ac.uk/10.3390/systems8040055
AMA Style
Rodrigues J, Sá JC, Silva FJG, Ferreira LP, Jimenez G, Santos G. A Rapid Improvement Process through “Quick-Win” Lean Tools: A Case Study. Systems. 2020; 8(4):55. https://0-doi-org.brum.beds.ac.uk/10.3390/systems8040055
Chicago/Turabian StyleRodrigues, Jorge, José Carlos Sá, Francisco J. G. Silva, Luís Pinto Ferreira, Genett Jimenez, and Gilberto Santos. 2020. "A Rapid Improvement Process through “Quick-Win” Lean Tools: A Case Study" Systems 8, no. 4: 55. https://0-doi-org.brum.beds.ac.uk/10.3390/systems8040055
Note that from the first issue of 2016, this journal uses article numbers instead of page numbers. See further details here.