Cancer as a System Dysfunction


1
Departments of Social Science & Policy Studies, Worcester Polytechnic Institute, Worcester, MA 01609, USA
2
Biology and Biotechnology, Worcester Polytechnic Institute, Worcester, MA 01609, USA
*
Author to whom correspondence should be addressed.
Systems 2021, 9(1), 14; https://0-doi-org.brum.beds.ac.uk/10.3390/systems9010014
Submission received: 21 November 2020
/
Revised: 13 January 2021
/
Accepted: 5 February 2021
/
Published: 9 February 2021
(This article belongs to the Special Issue System Dynamics: Insights and Policy Innovation)
Abstract
:In this paper, we describe a system dynamics model that views cancer as a dysfunction of the cellular system rather than as an ailment of cells. Our experiments with the model replicate the propagation of the ailment and the impacts of the treatments. It presents a concept that deviates from the pervasive view of cancer as a cell malfunction that has led to treatments aiming to destroy the rogue cells. It points to more holistic treatment options aiming at reforming cell interaction so the system can contain the growth of cancer cells. Further research is needed to explore the details for such options.
1. Introduction
In addition to a disease of cells in the human body, the term cancer has often been used to also describe many social ailments. Corruption, crimes, and terrorism, have all been called cancers in the context of how they affect other populations in society. Models exist of the interaction between normal and rogue social institutions [1], of the interaction between sick and healthy populations in the spread of infectious diseases [2] and of the propagation of chronic ailments from the perspective of patient management [3]; however, this perspective has not been extended to the behavior of populations of cells in the human body for disease management. While cancer was first described as a systemic ailment as long as two centuries ago, the remedies arising out of this perspective have advocated even more radical treatments targeting the rogue cells [4].
Despite being known for inventing Stella software, Barry Richmond, who had a background in biology, constructed a system dynamics model some 45 years ago to understand the propagation of cancer [5]. Barry focused on cell deformation process instead of on the interaction of cell populations; we attempt to focus on the latter in this paper. Our model views cancer cells as a part of an interconnected system of the various cell populations. Our experiments with this model attempt to understand the propagation of the disease and the impact of the various current and experimental remedies on exploring future directions for the treatment strategies.
2. Methodology
The idea of this paper originated from the first author’s brush with cancer and the resulting conversations with his physicians and biologist colleagues. The diverse backgrounds of the authors subsuming computational biology, cancer biology, economics, and system dynamics, together with the participant observer experience of one of the authors in the remediation process, helped to conceptualize the structure underlying cellular interaction that was consistent from both the operational and theoretical perspectives. Thus, the decision rules governing cell behavior incorporated in our model are based on both clinical and experimental explanations of cancer propagation1. Additionally, the model’s information base subsumes both operational and theoretical perspectives that were considered to be important by Jay Forrester for creating a system dynamics model of a problem [6].
We view cancer as a dysfunction of the cell interactions and regulatory processes, analogous to those of human societies in which institutions or population cross-sections interact to create a variety of functional and dysfunctional outcomes such as political instability, organizational demise, and the proliferation of non-legitimate activities [1,7,8,9]. The last two papers reduce the model of dysfunctional societies to a metaphorical state consisting of farmers, bandits, and soldiers, addressing a class of problems rather than a single manifestation. This metaphor served as an inspirational template for the formulation of the model of cancer propagation that describes the transformation of healthy cells into pre-cancerous and cancerous factions while the immune system cells strive to control the proliferation of cancerous cells for sustaining the organism. Our model is programmed in Stella Architect2.The simulation experiments we conduct are designed to understand the behavioral patterns arising out of the model structure rather than making point predictions of the future outcomes [10].
3. A Dynamic Model of the Cellular Society
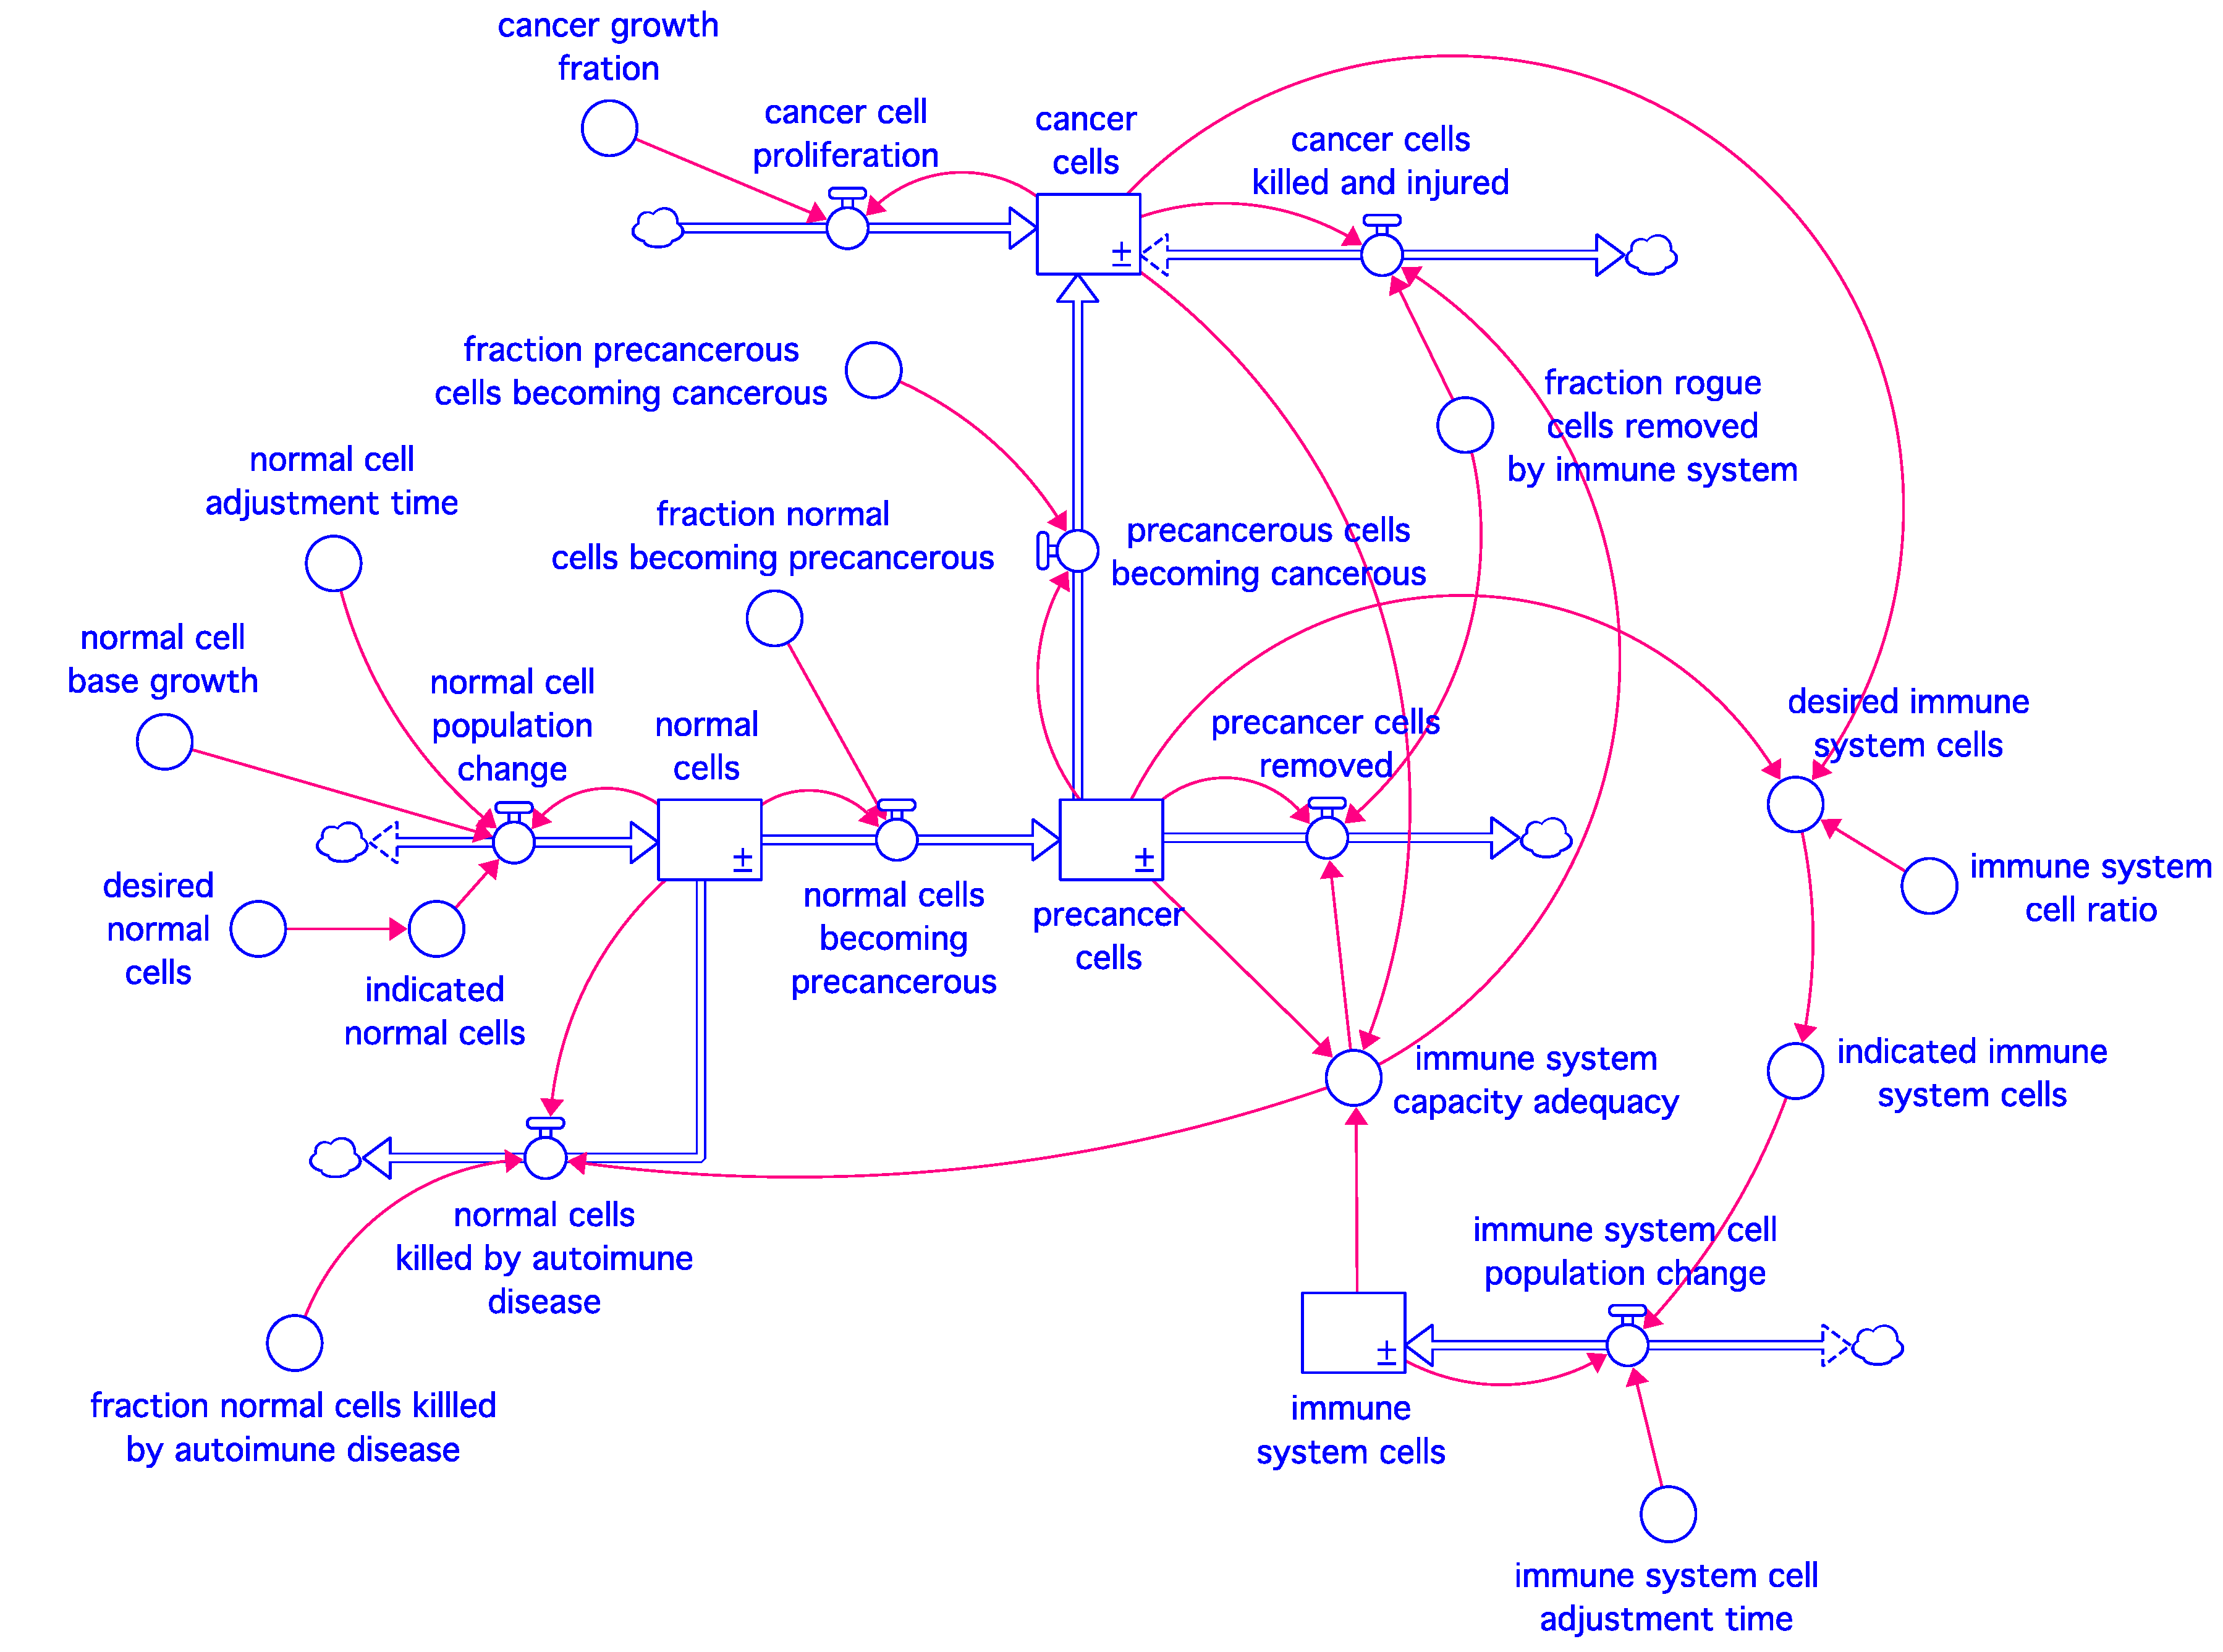
Our model represents the interaction between the various types of cells in an organ or a subsystem of the body. It depicts the common structure in the simplest possible terms. It defines a generic system that can be applied to solid as well as blood-and bone-related diseases, although we mainly address our experiments with the model to proliferation of solid cancers and their response to treatments. Whether viewed in the context of an afflicted organ or a body subsystem, the interacting cell populations can be placed in four broad categories: normal cells, pre-cancer cells, cancer cells, and immune system cells. Thus, our model contains four stocks connected by the flows and information links shown in Figure 1. To facilitate communication to a wide audience, the variables of the model are represented by their complete definitions rather than being abbreviated into Greek symbols.
Normal cells and immune system cells have disciplined growth dynamics in that they tend to grow to their indicated levels—the goal of the former is determined by the internal intelligence of the cell, while that of the latter arises from the surveillance need created by the existence of the unwanted cells in the body. The unwanted cells only include pre-cancer and cancer cells in our model, although this is a simplification since other infectious and bacterial elements may also activate the immune system. Unregulated proliferation is a hallmark of cancer [11] and unlike the normal and the immune system cells, where cell proliferation and turnover rates balance to maintain their populations at their respective goal levels, cancer cells grow exponentially to outpace cell death.
Our baseline model is described by four integral equations shown in Table 1. The normal and immune system cell populations remain in a dynamic balance through cellular births and deaths, but those two rates are aggregated in the model into net population change rates (Equations (1.1) and (4.1)).
Decades of clinical and experimental evidence support a role for the immune system in controlling cancer and have spurred clinical trials into cancer immunotherapeutic approaches. However, recent data demonstrates that the immune system activity is correlated with both suppression and progression of cancer, which highlights the complexity of the relationship between the immune system and cancer cells [12,13]. Our model recapitulates these dynamics, in part, by enabling a fraction of the pre-cancer cell population to be killed by the immune system. The pre-cancer cell population is therefore a feature both of transformation of normal cells to a pre-cancerous state and the level of immune system activity (Equations (2.1) and (2.2)). When immune activity is reduced below a given threshold, cancer cell net growth may seem to be enhanced instead of being limited, since the cancer growth rate exceeds the kill rate of the immune system. Due to rising immune activity, normal cells also become susceptible to immune system surveillance, as is seen in hyperactive immune system disorders (Equation (1.3)).
The cancer cell stock is initially populated by a transformation of pre-cancerous cells meant to reflect the accumulation of tumor-promoting mutations that increase with age [14], which is captured in Equation (2.2). Once transformed, the cancerous cells exhibit unregulated proliferation and thus the cancer cell population grows exponentially (Equation (3.1)). The immune response increases to combat the rising cancer cell population (Equation (3.2)), and it is ultimately the imbalance of tumor growth and immune response that yields a proliferation of cancerous cells.
The immune system stock strives to adjust to the need indicated by the populations of pre-cancer and cancer cells (Equations (4.1) and (4.2)), while the immune system capacity enhances or inhibits the rogue cell removal (Equation (4.3)), while also influencing autoimmune activity (Equation (1.3)).
The processes incorporated into our model reflect widely recognized features of cancer cell behavior and immune response. However, technical and experimental limitations have deterred evaluation of them as an interconnected system. We have attempted to integrate these processes into an interconnected system to be able to better understand the dynamics of cancer cell growth, the impacts of its treatments, and the side effects of these treatments.
4. Model Behavior
The model is not calibrated for any specific case but is supplied with an internally consistent set of parameters and initial conditions, so under normal circumstances, all cell populations except for cancer cells are maintained in a dynamic equilibrium or homeostasis. The cancer cell population is initialized at a zero value. In view of the internally consistent calibration seeking a dynamic equilibrium, a variety of parameter sets can be used to represent specific cases, hence Table 1 omits parameter values. Thus, the model behavior described in this section must be viewed as a qualitative interpretation of the simulated patterns rather than as a numerical forecast. Interested readers are encouraged to reconstruct our model from equations in Table 1 and simulate it with their own parameter sets pertaining to specific cases.
The simulation time is set at 1000 months (about 83 years), which approximates the average life expectancy of a healthy individual. It should be noted that despite the equilibrium, all cell populations constantly turn over rather than remaining constant, meaning the in- and out- flows tied to each stock continue while the stocks remain in a dynamic balance.
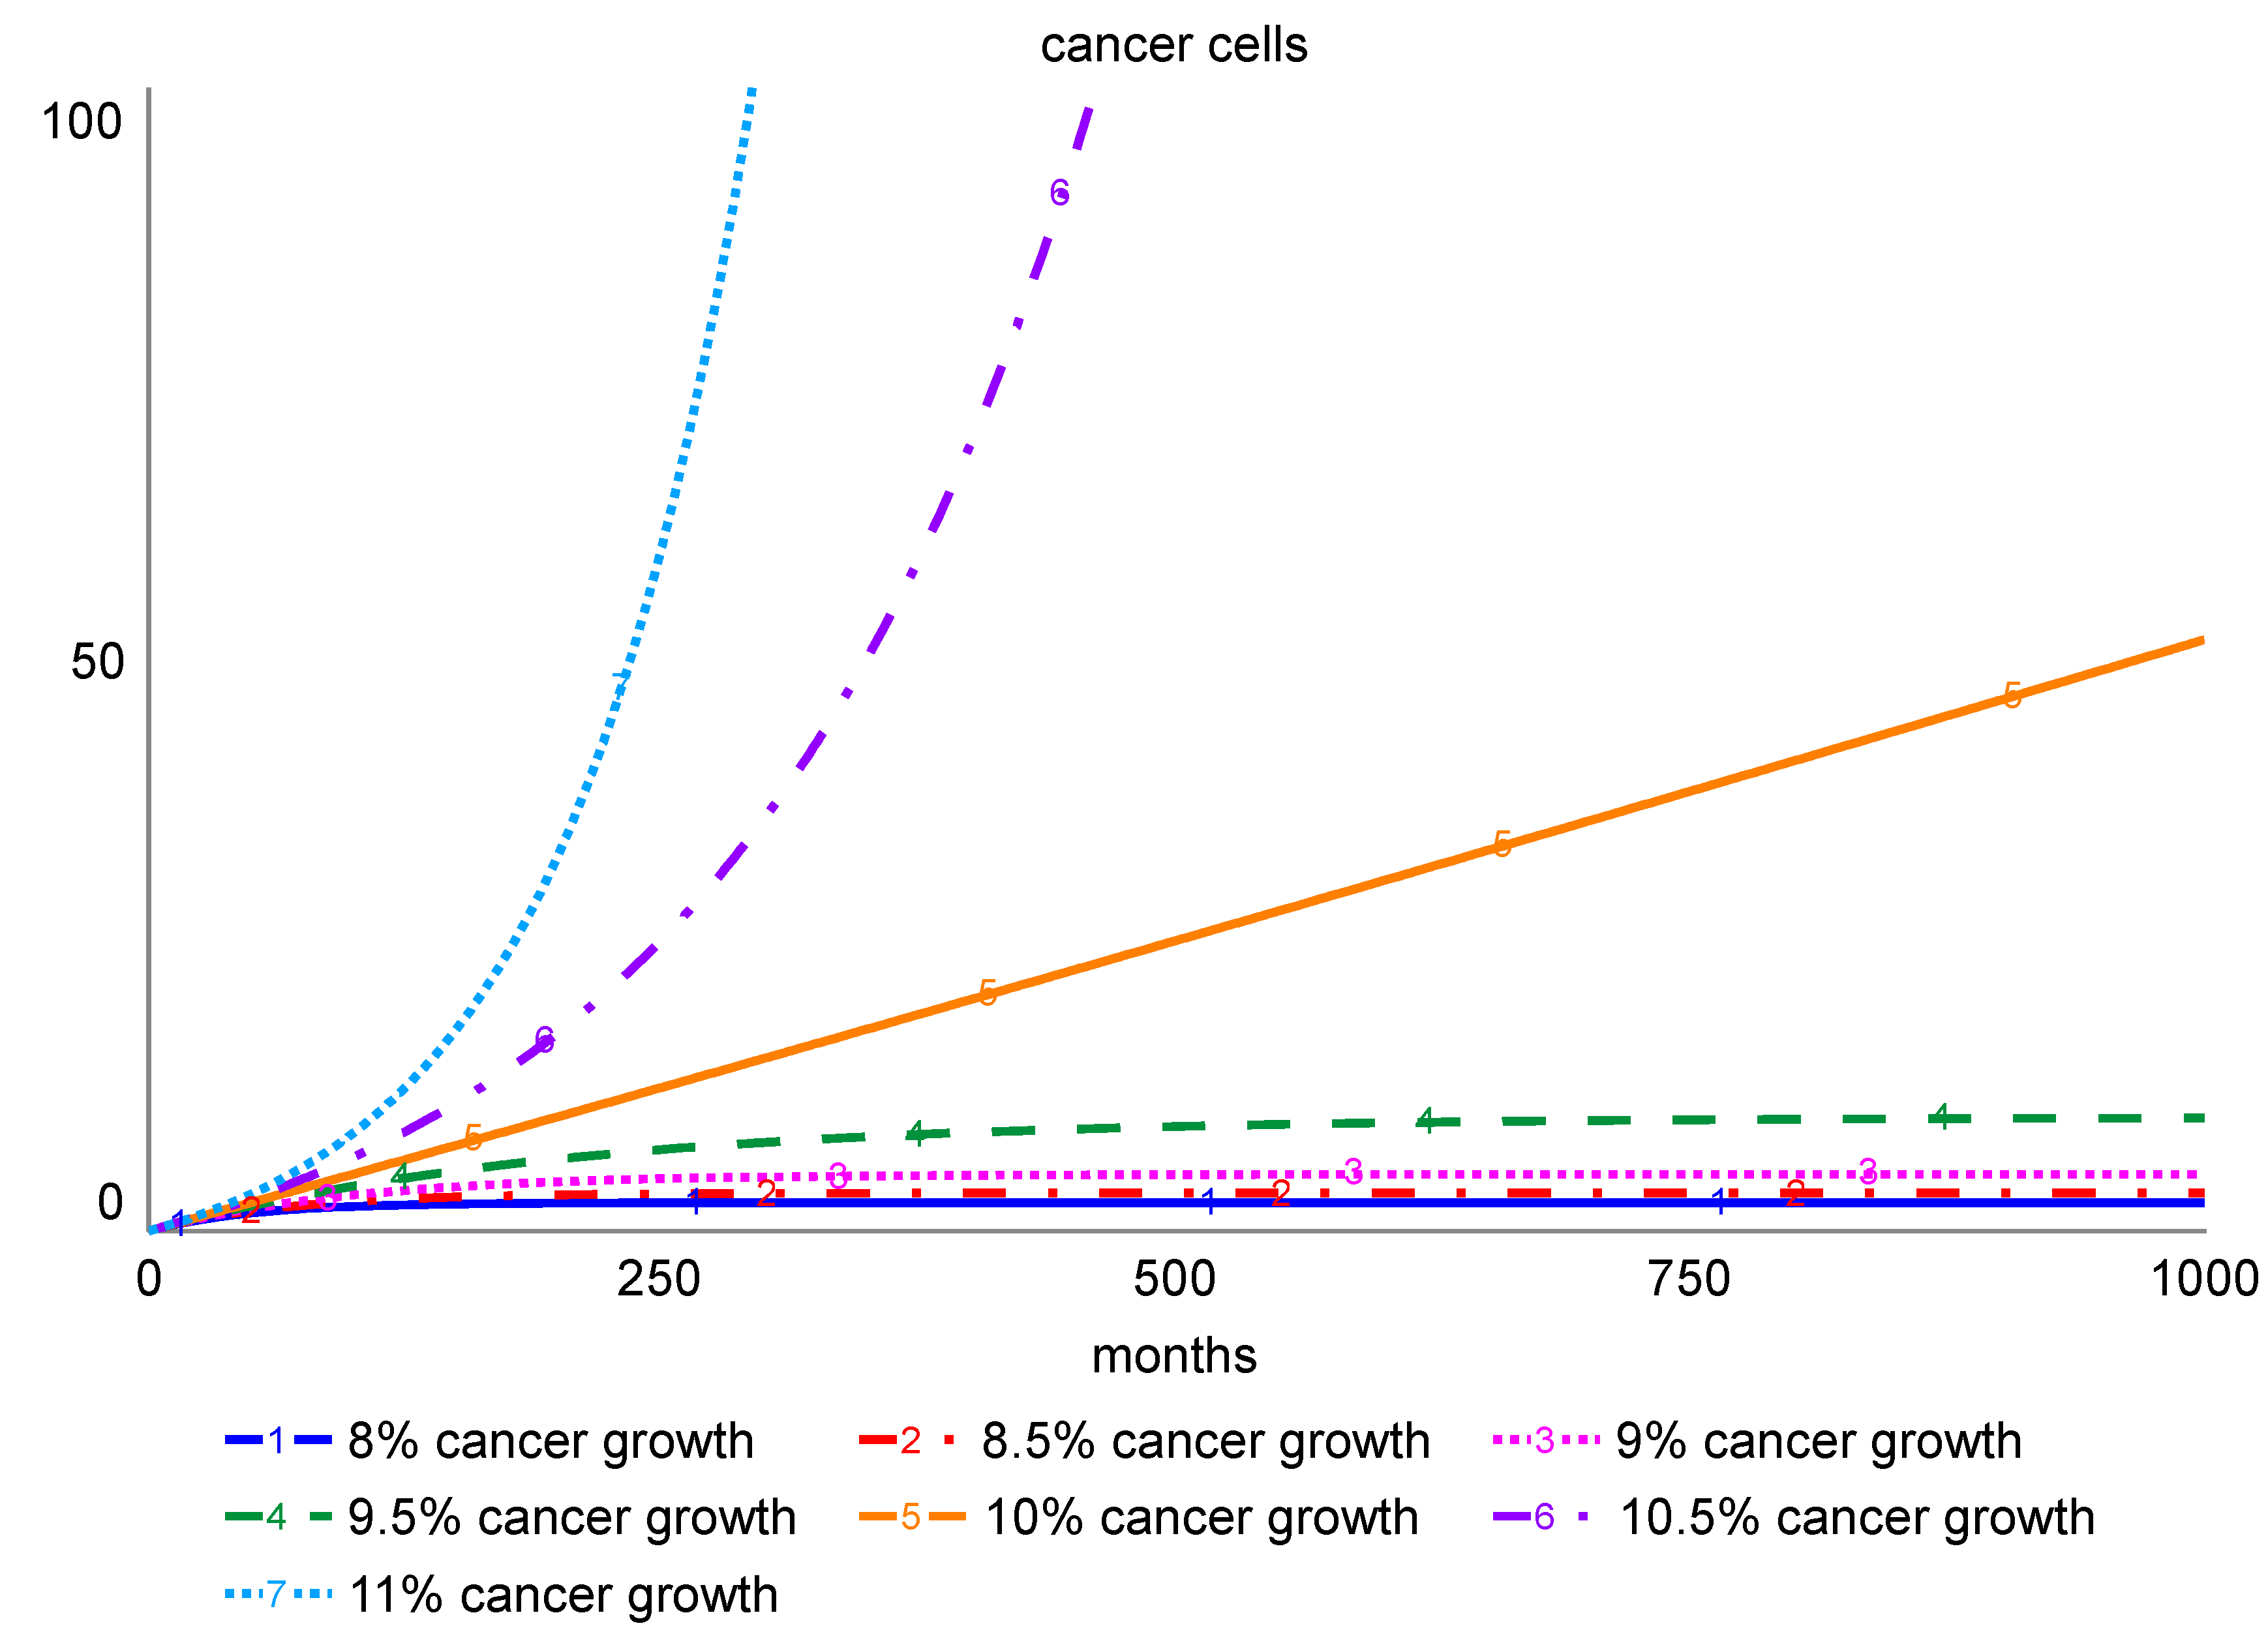
When initially populated by the transformation of a small number of pre-cancer cells, the cancer cells begin to grow exponentially. Low and intermediate rates of growth of cancer are however contained by a concomitant increase in the immune activity that constantly kills the cancer cells and keeps their population under control. The absolute number of cancer cells is influenced by cancer cell proliferation, as well as the rate at which normal cells acquire pre-cancerous characteristics and then are ultimately transformed into cancer cells.
To model rates of proliferation that may differ between aggressive and slow growing tumors, the model allows for variation of cancer cell proliferation rates. To permit incorporation of the potential impact of carcinogenic exposure, the model also allows for modulation of the rate at which normal cells are transformed to cancer cells. Simulations showing system response to the various rates of increase in the cancer cell number are shown in Figure 2. As expected, the model response shows that low growth and transformation rates can be contained by the immune system, while cancer cells are able to grow exponentially when their growth exceeds the expansion in the immune system capacity.
Since slow cancer growth rates are likely contained by the immune system, they may not offer fatality risk over a person’s lifetime, and therapeutic intervention may not be necessary. However, as genetic, environmental, or behavioral factors may alter this balance, even when treatment options are not pursued, cancer patients are monitored carefully for changes in tumor growth and aggressiveness that would warrant further intervention. Cancer aggressiveness is determined through a pathological examination of samples extracted through a biopsy [15]. Specific indicators differ for different types of cancers. For example, Gleason scores that measure cellular differentiation, cancer cell infiltration into normal tissue, and cellular proliferation are used to assess the aggressiveness of prostate cancer in a pathological examination [16].
5. Testing Hypotheses about Lifetime Risk of Cancer
Several hypotheses have been advanced about the increased risk of onset of cancer over an individual’s lifetime. These include (1) a gradual increase in transformation of pre-cancer cells into cancer; (2) a decline in the efficacy of the immune system such that immune cells are present but are less effective at clearing pre-cancer and cancer cells, (3) a slowing down of the adjustment of the immune system cell population to a needed level, and (4) a gradual reduction in the population of immune system cells [14,17].
These hypotheses can be translated into metrics affecting our model parameters that may change gradually over time. Figure 3 shows the growth of cancer in response to the lifetime changes suggested by these hypotheses compared to a base case that assumes a slow transformation of pre-cancer to cancer with no change in immune system response. Trend slopes are arbitrarily chosen in our experiments to accommodate all cases in the same ballpark range, although our model allows their determination to reflect genetic instability as influenced by genetic and environmental factors (i.e., cigarette smoking, pollution, UV, and other forms of carcinogen exposure) in a real case.
All simulations pertaining to the four hypotheses show a rising trend that becomes uncontrollable over time, with the rate of rise depending on the slope of the lifetime trends.
Recent data indicate that the rate at which tumor-promoting mutations are acquired declines with age [18]. As new mutations are acquired in a proliferation-dependent manner, these data suggest that proliferation of cancer or pre-cancer cells may similarly slow with age. While the potential impact of such changes on age-related cancer occurrence is not known and are therefore not considered in our model, further exploration of this relationship is highly recommended.
6. Cancer Treatments and Their Performance
Most treatments for solid cancer aim at either surgically removing the affected organ or a part of it, subjecting it to drugs (nutrient blockers as well as lethal chemicals) and external or internal radiation. Hematologic and Musculoskeletal cancers have been treated with chemotherapy and most recently by immunotherapy.
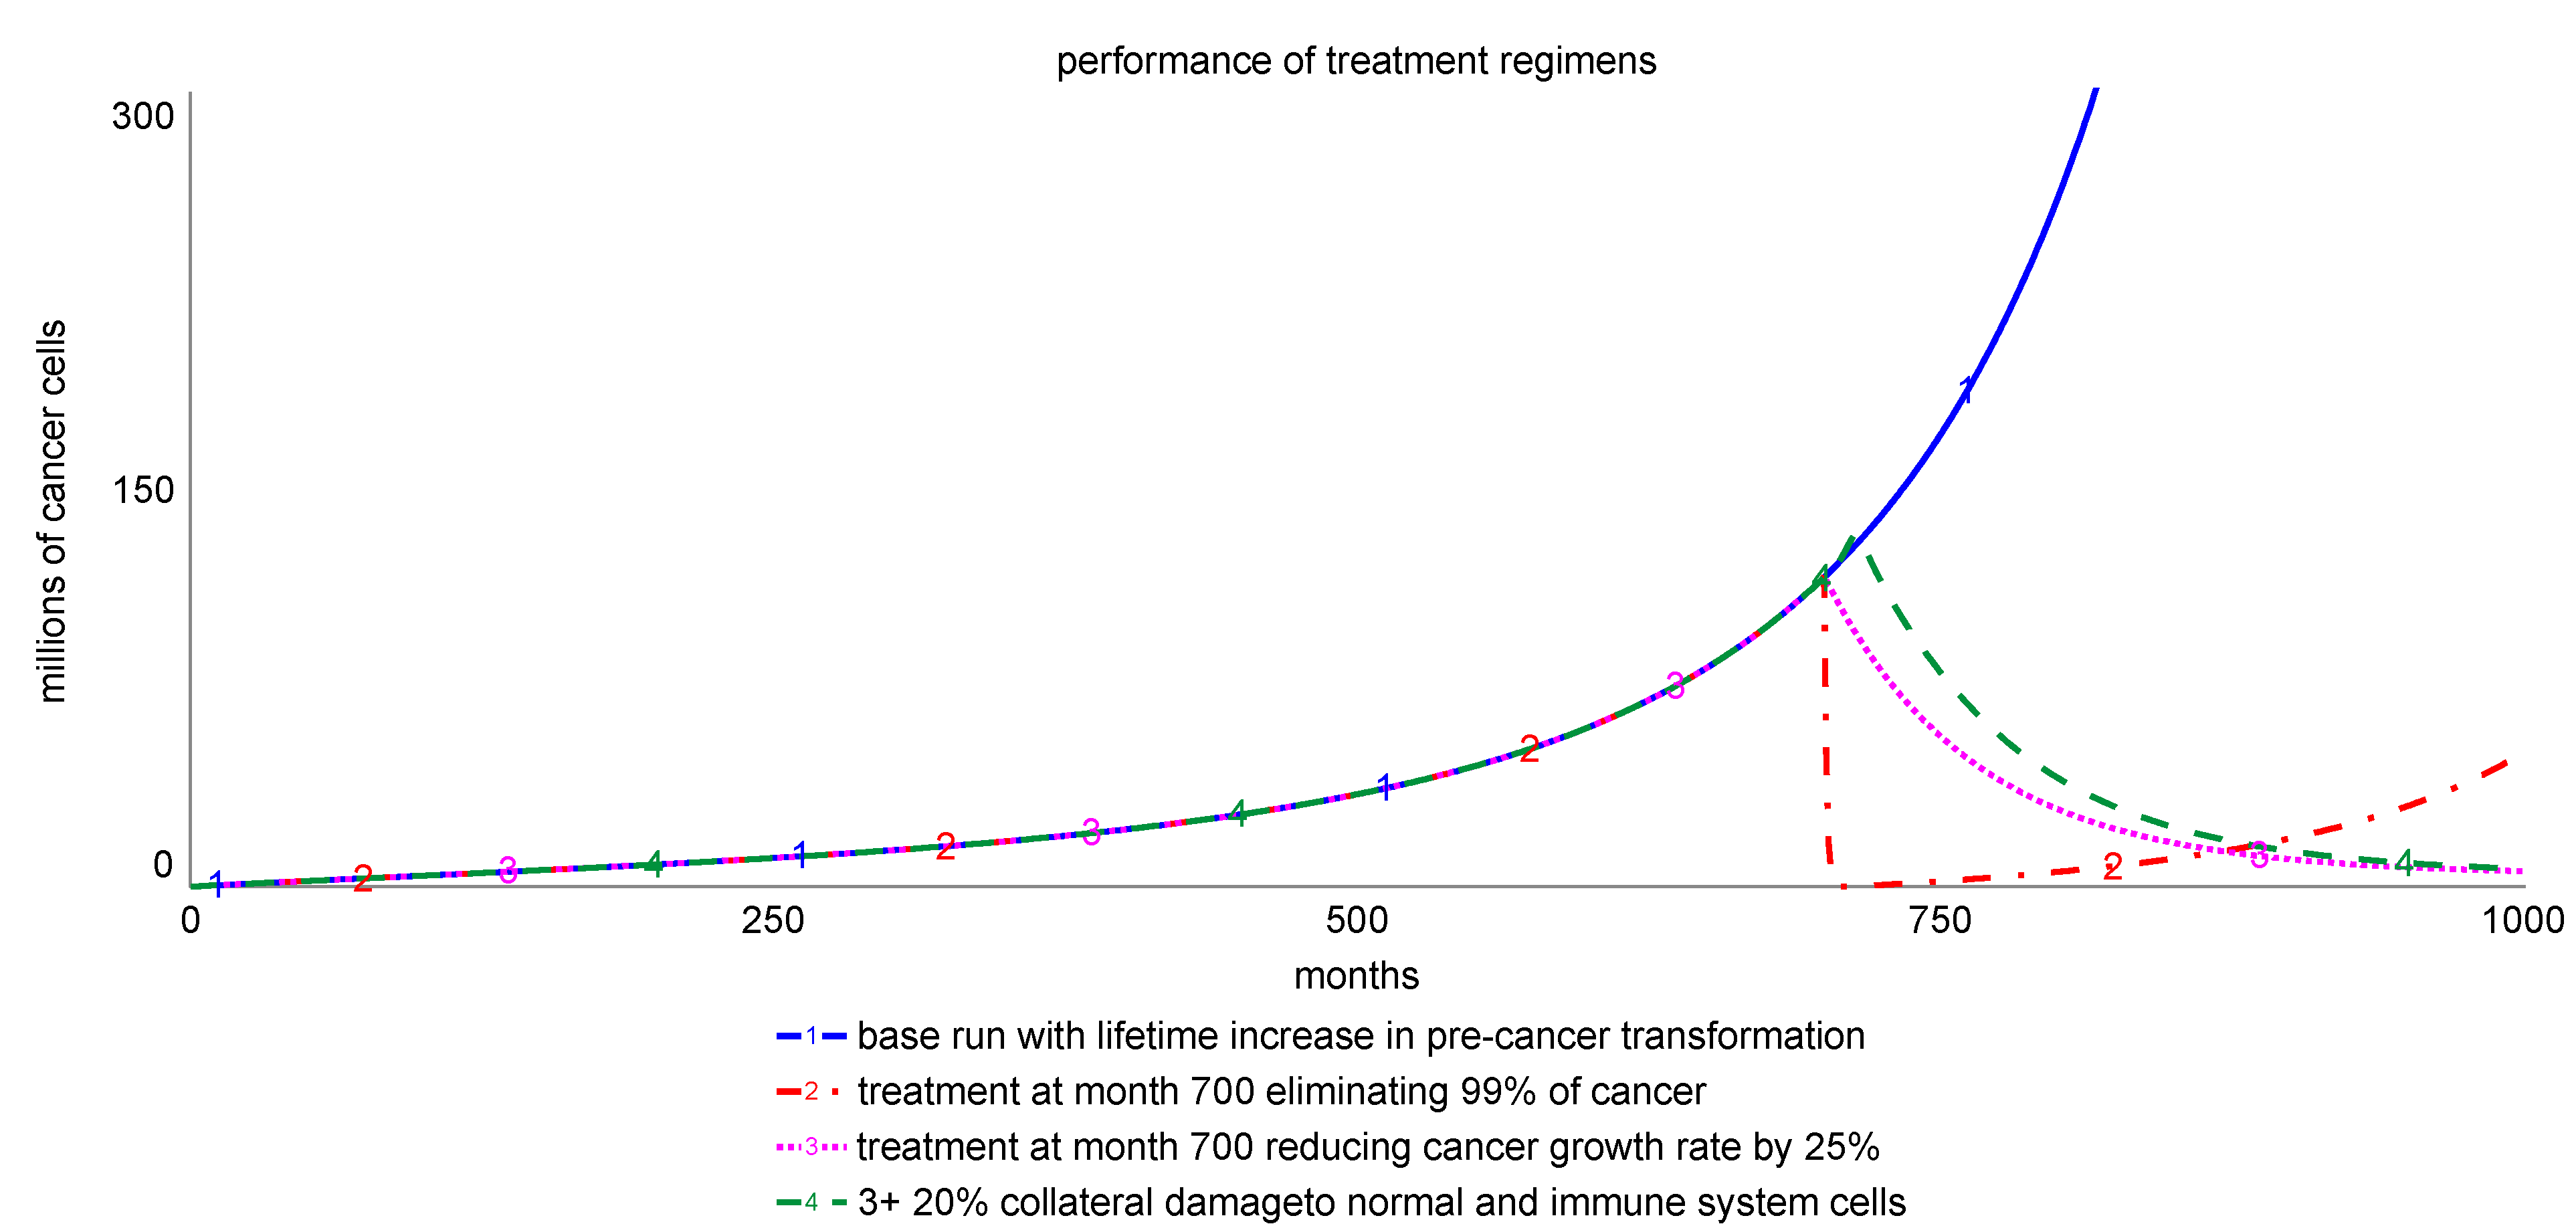
These treatments are often administered in combination based on the pathological stage and genetic makeup of the cancer. Conservative surgical approaches are limited by a desire to obtain complete resection of the tumor, while minimizing collateral damage to healthy tissue. Similarly, chemotherapeutic approaches must balance efficacy in killing cancer cells and potential off-target effects on healthy cells. Even so, tumor relapse and drug resistance remain challenges in the clinic. Figure 4 shows simulations comparing the impact of prevalent treatments with different effectiveness targets using our model and assuming reasonable achievement of intended targets. All treatments are invoked at month 700 and last for 12 months.
Graph 1 represents the baseline simulation showing the average cancer growth risk over a lifetime due to an increasing transformation of pre-cancer cells to cancer, with all other assumptions subsumed in the Equations of Table 1 remaining unchanged. Graph 2 simulates a treatment regimen implemented at month 700 on top of this trend, lasting for 12 months and eliminating 99% of the remaining malignancy each month, which is assumed to be the median achievable target of the treatment, even if the treatment intent is to eliminate 100% of cancer. The sensitivity of the achievement fraction can be tested. In this simple model, a smaller achievement fraction would slow the initial decline. The simulation shows that cancer resumes its exponential growth profile after the treatment ends, although it might impose a lower threat for the patient since the resurging cancer cell population is now much smaller. The model assumes that treatment eliminates 99% of the cancer cells, but that remaining cells can resume proliferation after treatment concludes. Two potential outcomes not modeled here include that (1) the remaining cells are injured and disabled such that their proliferative capacity is drastically reduced—a preferred outcome, and (2) that the remaining cells have acquired resistance to the therapeutic intervention and as such may be resistant to subsequent therapeutic approaches—an unintended consequence [19].
Graph 3 shows an interesting treatment scenario whereby the reduction of cancer cell proliferation, in the absence of therapy-induced cancer cell death, is sufficient for complete and sustained remission. In this scenario, the immune system is able to keep cancer cell proliferation at bay following therapeutic intervention to reduce cancer cell proliferation by only 20%, which can be achieved by targeting the small cancer cross-section that reproduces most prolifically. Graph 4 models off-target effects of the therapeutic intervention in Graph 3 such that normal and immune cell replenishment is also reduced by 20%; showing that such damage only has a moderate impact on the timing of remission. Populations of normal and immune cells recover after the treatment concludes since both populations must adjust to their respective indicated values determined by their internal intelligence.
Preclinical approaches to identify novel therapeutics often focus on agents that achieve maximum cancer cell death, with the expectation that efficacy of a therapeutic approach corresponds to the cytotoxicity of the drug. Our simulation however suggests instead that approaches to reduce cancer cell proliferation, when coupled with an appropriate immune response, may also be an effective treatment strategy. Thus, treatments aimed at altering proliferation without inducing cell death warrant further exploration.
The model also allows testing of immunotherapy regimens. Two options were tested: (a) increasing immune cell potency, which has recently been attempted through targeted immunotherapies [12], and (b) stimulating the immune system in general [20], one manifestation of which is the non-specific immunotherapies which include the use of drugs like cytokines that help immune system cells grow and divide more quickly 3.
Figure 5 shows sensitivity runs comparing the targeted and non-specific immunotherapies. The sensitivity parameter in the former case is the normal fraction rogue cells removed by the immune system, which raises immune cell effectiveness. That in the latter case is the immune system cell ratio that returns the indicated immune system population, which increases immune cell reproduction. It is observed that the impact on cancer cell population is quite comparable in the two approaches. In both cases, the treatment becomes effective after a threshold where the killing rate of cancer cells affected by the immune system response can exceed the cancer proliferation rate.
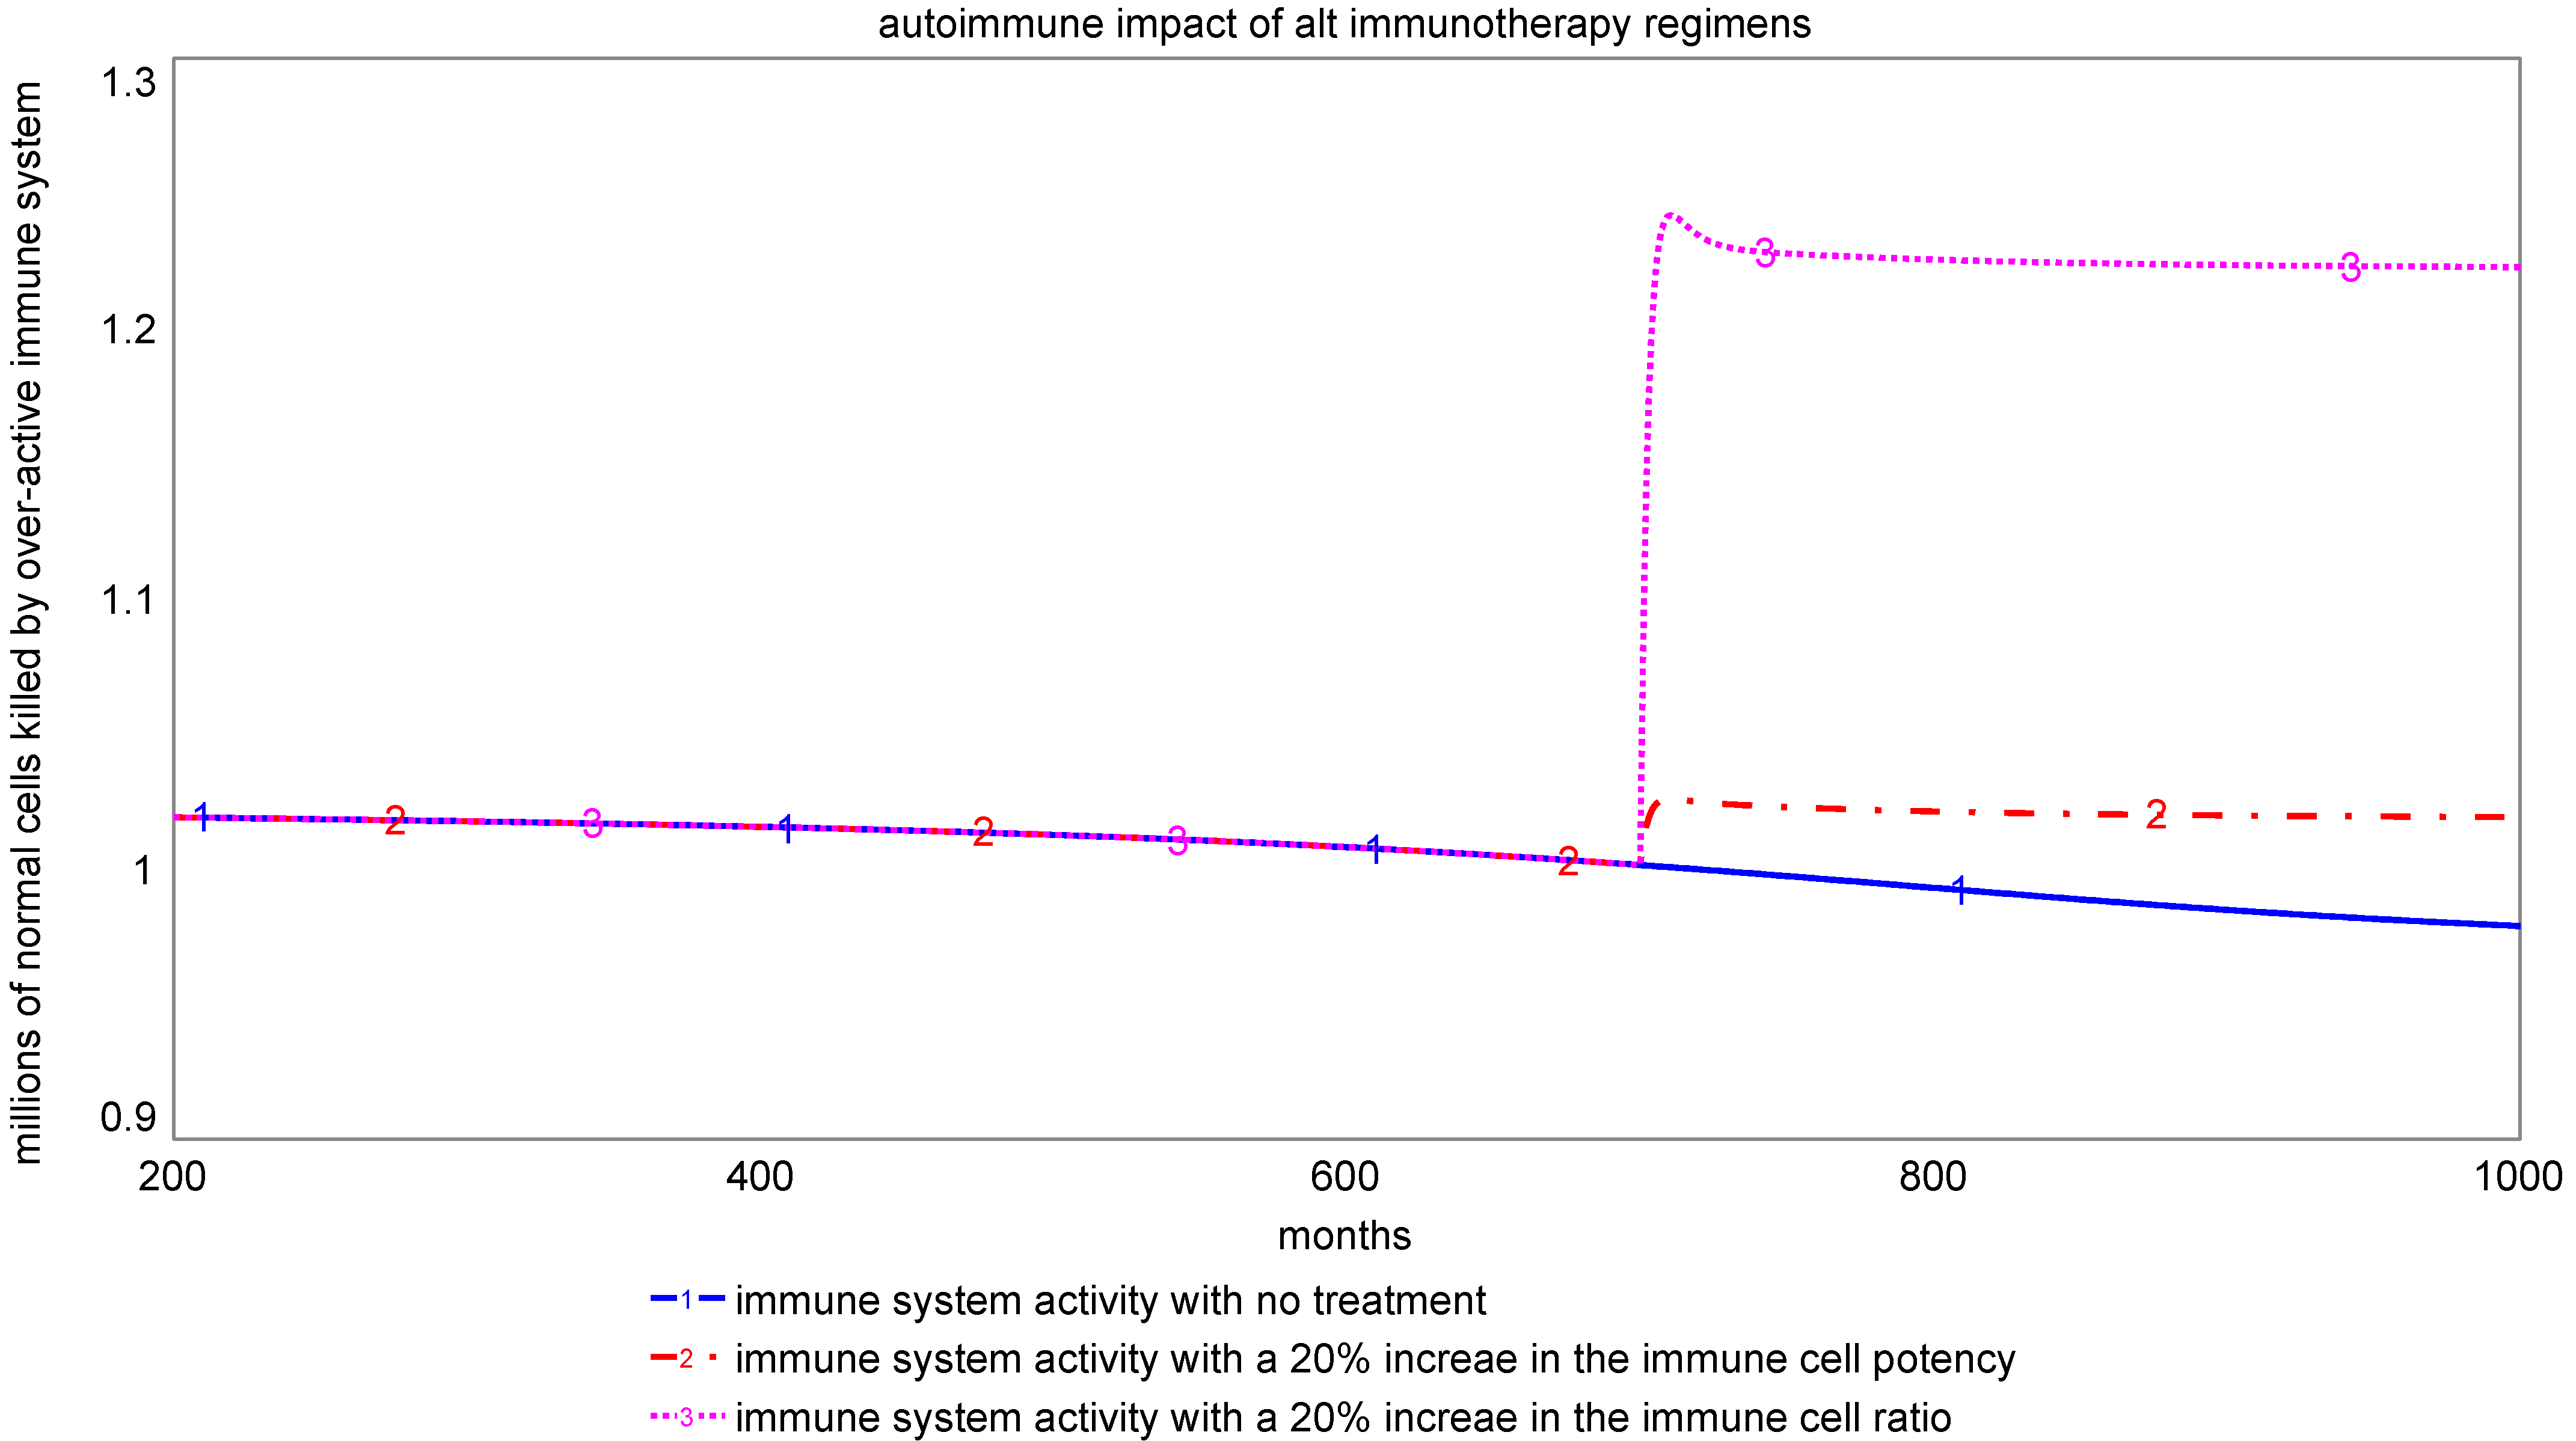
Cancer growth is able to overcome a marginal change (5%) in either the immune system potency or the population goal of the immune system cells. However, a moderate change (10%) in either case can reverse the cancer growth trend leading to remission. Also, a moderate to high change (15–20%) in both cases can even create sustained remission. We should add that the percentages are not cast in stone and should be seen only as points on an ordinal scale. Both approaches can have undesirable and deleterious impacts on other body systems, contributing to autoimmune responses.
Figure 6 compares the level of autoimmune response for the two immunotherapy options. Consistent with previous experience [21], our model indicates that non-specific therapies may create greater risk for autoimmune disorders than targeted therapies. The autoimmune impact of targeted immunotherapies is much lower, as they are intended to raise the productivity of targeted cells, rather than the overall population of immune system cells. Therefore, there is a need to explore ways to enhance the immune system potency instead, such as through cancer vaccines, immune checkpoint inhibitors, and monoclonal antibodies.
7. Model Limitations and Further Research Questions
The aggregate model we present in this paper integrates fragmented concepts from the literature but has several limitations. First, it considers the various cell populations as undifferentiated aggregates. In reality, each population of cells (normal, cancer, immune) is made up of a diverse array of cell types that may each respond disparately to stimuli from within the system itself, or from therapeutic approaches. We have therefore not tested sequential treatment regimens that target specific sub-categories of cancer and are often used to combat complex conditions.
Second, we have not addressed the process of systematic deterioration of the body functions as cancer proliferates. This deterioration introduces an element of path dependence in the treatment regimens and its consideration would require understanding the role of the shared common nourishing environmental factors like the blood supply that supports multiple body functions.
Even though the biological organisms are open systems that draw energic inputs from their environment and can produce more nourishment when their need increases [22], their processing capacity that creates the shared nourishment environment does have a limit. Thus, the growing cancer and immune cell response will ultimately be affected by the body’s shared nourishment capacity, a manifestation of which is the blood supply. Excessive use of the shared nourishment by cancer will inhibit the maintenance of the human body and the failure and corruption of the immune system in advanced stages of cancer. We are however unable to verify our constructs on the role of nourishment environment in the propagation and control of cancer from the available literature, which seems to posit that even though the cancer cells have a higher metabolic demand, nutrients are not a limiting factor and so cancer cell proliferation is not sensitive to nutrient supply [23].
Given the normal cells create a sustenance environment for all cell populations that sustains their functions, an antagonist relationship between normal cells and cancer cells in terms of sharing the body’s nourishing commons must be taken into account. The healthy cells of the body might be able to transform more external nutritional inputs into nourishment, they would however be ultimately limited by capacity constraints as manifest in blood volume and organ and subsystem functions. Thus, even when cancer cells are able to create their exclusive blood supply, they would diminish the inclusive environment that sustains this supply, which is shared by all cells. A sustenance capacity limitation therefore makes intuitive sense, though it may invoke different responses from healthy and cancer cells. It may therefore be interesting to model how angiogenesis will promote tumor growth, or how anti-neoangiogenesis therapy might limit growth.
8. Conclusions
We have made a preliminary attempt in this paper to model the development of cancer as an interaction between normal, immune system, pre-cancer, and cancer cell populations. We have tested the various prevalent and experimental treatment regimens and explored their unintended consequences. While reasonable parameter values were used to experiment with the model, our analysis in this first effort remains qualitative. Our limited model, however, raises interesting questions about the direction of the therapeutic research on cancer.
Viewed as a cell disease, the widespread treatment strategy for cancer has been to attempt to eradicate all cancer cells. The treatments based on this perspective have often caused considerable collateral damage to the human physiology, while the surviving cancer cells often resurge after some lapse of time. When viewed as a system dysfunction instead, the treatment strategy would be to facilitate containment of the rogue cells by the physiological system.
Given that cancer cell population and growth rates are not homogenous, our model suggests that the most effective strategy would include targeting the most prolific population segment to reduce overall growth rates, while at the same time, strengthening immune system cross-sections that combat the prolific growth segments of the cancer cell population. Moderate actions at the two intervention points may be able to contain the disease and also prevent its resurgence. Future therapeutic research must understand the nature of cancer cell and immune system cell diversity and aim at devising targeted therapies that both help containment and limit resurgence. Our model further suggests that therapies aiming at complete eradication of cancer can create much collateral damage with risk of resurgence, while blanket stimulation of immune system may create autoimmune disorders; such aggressive therapies may do more harm than good.
Our model can also be extended to create disaggregation within each cell population category so a larger variety of treatment regimens affecting different types of cells could be tested. Furthermore, while we surmise the role of inclusive nourishment resources of the body, such as blood supply, to be an important part of the cell interaction in the body, they are not yet included in the model. We recognize the importance of the inclusive nourishment commons of the body embodied in its blood supply but defer its inclusion to future work.
Author Contributions
Conceptualization, K.S., E.F.R. and A.L.M.; Formal analysis, K.S.; Investigation, A.L.M.; Methodology, K.S.; Project administration, K.S.; Validation, E.F.R. and A.L.M.; Writing—original draft, K.S., E.F.R. and A.L.M. All authors have read and agreed to the published version of the manuscript.
Funding
This research received no external funding.
Institutional Review Board Statement
Not applicable.
Informed Consent Statement
Not applicable.
Conflicts of Interest
The authors declare no conflict of interest.
References
- Saeed, K.; Pavlov, O.V. Dynastic cycle: A generic structure describing resource allocation in political economies, markets and firms. J. Oper. Res. Soc. 2008, 59, 1289–1298. [Google Scholar]
- Thompson, K.M.; Tebbens, R.J.D. Using system dynamics to develop policies that matter: Global management of poliomyelitis and beyond. Syst. Dyn. Rev. 2008, 24, 433–449. [Google Scholar]
- Klassen, D.K.; Edwards, L.B.; Stewart, D.E.; Glazier, A.K.; Orlowski, J.P.; Berg, C.L. The OPTN Deceased Donor Potential Study: Implications for Policy and Practice. Am. J. Transpl. 2016, 16, 1707–1714. [Google Scholar]
- Makherjee, S. The Emperor of All Maladies, a Biography of Cancer; Scribner Simon and Schuster: New York, NY, USA, 2010. [Google Scholar]
- Richmond, B. Towards a Structural Theory of Cancer; System Dynamics Memo D-4151; MIT: Cambridge, MA, USA, 1977. [Google Scholar]
- Forrester, J.W. System dynamics, systems thinking, and soft OR. Syst. Dyn. Rev. 1994, 10, 245–256. [Google Scholar]
- Saeed, K. The dynamics of economic growth and political instability in developing countries. Syst. Dyn. Rev. 1986, 2, 20–35. [Google Scholar]
- Saeed, K. Maintaining professional competence in innovation organizations. Hum. Syst. Manag. 1998, 17, 69–87. [Google Scholar]
- Saeed, K.; Pavlov, O.V.; Skorinko, J.; Smith, A. Farmers, bandits and soldiers: A generic system for addressing peace agendas. Syst. Dyn. Rev. 2013, 29, 237–252. [Google Scholar]
- Saeed, K. Circumscribing System Dynamics Modeling and Building Confidence in Models, A Personal Perspective. In Proceedings of the 36th International Conference of the System Dynamics Society, Reykjavek, Iceland, 6–10 August 2018. [Google Scholar]
- Hanahan, D.; Weinberg, R.A. The hallmarks of cancer. Cell 2000, 100, 57–70. [Google Scholar]
- Marin-Acevedo, J.A.; Dholaria, B.; Soyano, A.E.; Knutson, K.L.; Chumsri, S.; Lou, Y. Next generation of immune checkpoint therapy in cancer: New developments and challenges. J. Hematol. Oncol. 2018, 11, 39. [Google Scholar]
- Bakhoum, S.F.; Ngo, B.; Laughney, A.M.; Cavallo, J.A.; Murphy, C.J.; Ly, P.; Shah, P.; Sriram, R.K.; Watkins, T.B.K.; Taunk, N.K.; et al. Chromosomal instability drives metastasis through a cytosolic DNA response. Nature 2018, 553, 467–472. [Google Scholar]
- White, M.C.; Holman, D.M.; Boehm, J.E.; Peipins, L.A.; Grossman, M.; Henley, S.J. Age and cancer risk: A potentially modifiable relationship. Am. J. Prev. Med. 2014, 46, S7–S15. [Google Scholar]
- Weidner, N. Current pathologic methods for measuring intratumoral microvessel density within breast carcinoma and other solid tumors. Breast Cancer Res Treat. 1995, 36, 169–180. [Google Scholar]
- Gleason, D.F. Histologic grading of prostate cancer: A perspective. Hum. Pathol. 1992, 23, 273–279. [Google Scholar]
- Montecino-Rodriguez, E.; Berent-Maoz, B.; Dorshkind, K. Causes, consequences, and reversal of immune system aging. J. Clin. Invest. 2013, 123, 958–965. [Google Scholar]
- Tomasetti, C.; Poling, J.; Roberts, N.J.; London, N.R., Jr.; Pittman, M.E.; Haffner, M.C.; Rizzo, A.; Baras, A.; Karim, B.; Kim, A.; et al. Cell division rates decrease with age, providing a potential explanation for the age-dependent deceleration in cancer incidence. Proc. Natl. Acad. Sci. USA 2019, 116, 20482–20488. [Google Scholar]
- Housman, G.; Byler, S.; Heerboth, S.; Lapinska, K.; Longacre, M.; Snyder, N.; Sarkar, S. Drug resistance in cancer: An overview. Cancers 2014, 6, 1769–1792. [Google Scholar]
- Bast, R.C., Jr.; Bast, B.S.; Rapp, H.J. Critical review of previously reported animal studies of tumor immunotherapy with non-specific immunostimulants. Ann. N. Y. Acad. Sci. 1976, 277, 60–93. [Google Scholar]
- Pantuck, M.; McDermott, D.; Drakaki, A. To treat or not to treat: Patient exclusion in immune oncology clinical trials due to preexisting autoimmune disease. Cancer 2019, 125, 3506–3513. [Google Scholar]
- Bertalanffy, L.V. General system theory. In Foundations, Development, Applications; Braziller, G., Ed.; George Braziller Inc.: New York, NY, USA, 1969; Volume 24, 295p. [Google Scholar]
- Liberti, M.V.; Locasale, J.W. The Warburg Effect: How Does it Benefit Cancer Cells? Trends Biochem. Sci. 2016, 41, 211–218. [Google Scholar]
| 1 | Conversations with Oncologists John Phillips, Atish Chaudhary, and Martin King at Da-na Farber, and Saleem Khanani at Umas Med School helped to frame the problem ad-dressed in our model. Additionally, Amna Zarar, a general practitioner and Erika Brutseart, an endocrinologist provided valuable inputs that helped the initial formulation of the model. Discussion of the model with David Lounsbury, Tom Rohan, and Illir Agal-liu at the Albert Einstein Medical College helped with developing the research questions. |
| 2 | A trademark of ISEE Systems, Inc., Lebanon, NH, USA. |
| 3 | https://www.cancer.org/treatment/treatments-and-side-effects/treatment-types/immunotherapy/nonspecific-immunotherapies.html (accessed on 7 February 2021). |
Figure 1.
Key cell population stocks, their connecting flows, and rules of conduct in the cellular society.
Figure 1.
Key cell population stocks, their connecting flows, and rules of conduct in the cellular society.

Figure 2.
Comparative plots showing a tipping point in cancer containment.

Figure 3.
Testing hypotheses about lifetime changes in pre-cancer transformation and immune system response.
Figure 3.
Testing hypotheses about lifetime changes in pre-cancer transformation and immune system response.

Figure 4.
Simulation of treatments with different targets.

Figure 5.
Sensitivity simulations comparing immunotherapy options.

Figure 6.
Autoimmune disorder risk for alternative immunotherapy regimens.


Table 1.
Integral equations describing the baseline model of the cellular society.
| Variable | Equation | Equation Reference |
|---|---|---|
| normal cells (t) | ∫ (normal cell population change − normal cells becoming pre-cancerous − normal cells killed by autoimmune disease) × dt | (1) |
| normal cell population change | normal cell base growth + ((indicated normal cells − normal cells)/normal cell adjustment time) | (1.1) |
| normal cells becoming pre-cancerous | normal cells × fraction normal cells becoming pre-cancerous | (1.2) |
| normal cells killed by autoimmune disease | normal cells × fraction normal cells killed by autoimmune disease × immune system capacity adequacy | (1.3) |
| pre-cancer cells (t) | ∫ (normal cells becoming pre-cancerous − pre-cancer cells removed − pre-cancerous cells going cancerous) × dt | (2) |
| pre-cancer cells removed | pre-cancer cells × normal fraction rogue cells removed by immune system × immune system capacity adequacy | (2.1) |
| pre-cancerous cells becoming cancerous | pre-cancer cells × fraction pre-cancerous cells becoming cancerous | (2.2) |
| cancer cells (t) | ∫ (cancer cell proliferation + pre-cancerous cells becoming cancerous − cancer cells killed and injured) × dt | (3) |
| cancer cell proliferation | cancer cells × (cancer growth fraction) | (3.1) |
| cancer cells being killed and injured | cancer cells × normal fraction rogue cells removed by immune system × immune system capacity adequacy | (3.2) |
| immune system cells (t) | ∫(immune system cell population change) × dt | (4) |
| immune system cell population change | (indicated immune system cells-immune system cells)/immune system cell adjustment time | (4.1) |
| indicated immune system cells | (pre-cancer cells + cancer cells) × immune system cell ratio | (4.2) |
| immune system capacity adequacy | immune system cells/(pre-cancer cells + cancer cells) | (4.3) |
Publisher’s Note: MDPI stays neutral with regard to jurisdictional claims in published maps and institutional affiliations. |
© 2021 by the authors. Licensee MDPI, Basel, Switzerland. This article is an open access article distributed under the terms and conditions of the Creative Commons Attribution (CC BY) license (http://creativecommons.org/licenses/by/4.0/).
Share and Cite
MDPI and ACS Style
Saeed, K.; Ryder, E.F.; Manning, A.L. Cancer as a System Dysfunction. Systems 2021, 9, 14. https://0-doi-org.brum.beds.ac.uk/10.3390/systems9010014
AMA Style
Saeed K, Ryder EF, Manning AL. Cancer as a System Dysfunction. Systems. 2021; 9(1):14. https://0-doi-org.brum.beds.ac.uk/10.3390/systems9010014
Chicago/Turabian StyleSaeed, Khalid, Elizabeth F. Ryder, and Amity L. Manning. 2021. "Cancer as a System Dysfunction" Systems 9, no. 1: 14. https://0-doi-org.brum.beds.ac.uk/10.3390/systems9010014
Note that from the first issue of 2016, this journal uses article numbers instead of page numbers. See further details here.