Reduction of Cost, Energy and Emissions of the Formalin Production Process via Methane Steam Reforming


1
Faculty of Chemistry and Chemical Engineering, University of Maribor, 2000 Maribor, Slovenia
2
Department of Applied Sciences, TU Delft, 2629 Delft, The Netherlands
*
Author to whom correspondence should be addressed.
Systems 2021, 9(1), 5; https://0-doi-org.brum.beds.ac.uk/10.3390/systems9010005
Submission received: 9 December 2020
/
Revised: 9 January 2021
/
Accepted: 13 January 2021
/
Published: 16 January 2021
(This article belongs to the Special Issue Selected Papers from SDEWES Conferences 2020)
Abstract
:Production of formalin, which is among the highest production volume chemicals, is highly energy-intensive; thus, reduction of energy use is very important in reducing cost and emissions. The aim of this and its larger overall research is to systemically analyze how to improve sustainability of processes producing formalin as an intermediate or final product. In this part of the work, energy consumption requirements are analyzed for the conventional formalin production process via methane steam reforming, where opportunities for energy consumption reduction are identified. This work will serve as a base case for further investigation of alternative formalin production pathways. To achieve energy savings, heat integration technology by combined pinch analysis and mathematical programming is applied. The formalin production process is simulated using Aspen HYSYS, and heat integration of the production process was performed based on simulated design using GAMS software. Economic and environmental footprint analyses were performed for both non-integrated and integrated designs. Results show that heat integration reduces heat consumption by around 39%, leading to a saving of 11% in capital cost and turning annual operating cost into positive revenue. Heat integration also improves the environmental aspect, where a 7–22% reduction in selected environmental footprints is achieved.
1. Introduction
Modern chemical industries and supply chains currently face numerous challenges that threaten their continued success in an increasingly complex environment. The pressure on modern companies to go clean and sustainable to compete in an ever-changing economy is enormous. Circularity of production systems is important for sustainability and sustainable systems to obtain minimal resource use and maximal reuse of energy and materials. Cyclic production systems are the goal of industrial ecology and the circular economy. The issue is being tackled on many fronts, from increasing the energy consumption of present technologies, to redesigning and challenging the conventional approaches on multiple levels along the supply chains [1].
Modern complex systems that require a holistic approach rather than a linear one are best viewed through the lens of systems thinking, which enables a better understanding of the system and offers more effective solutions [2]. As a group of interconnected parts (process units and flows) that together form a whole, every single chemical industrial process represents a system. The same is true for a factory with an organizational hierarchy and specified goals. In systemic structures, decisions are often derived from these complex hierarchies and can be better managed with systems thinking tools [3]. Various newly developed technologies and techniques are expected to improve the currently unsustainable state of industrial systems [4]. It is vital to adopt more sustainable technologies in supply chains [5], to interconnect different industrial processes, and directly use secondary raw materials, byproducts and waste as inputs, especially in the production of bulk chemicals.
One of these bulk chemicals is formalin, which is a 37% aqueous solution of formaldehyde and ranks in the top 50 chemicals produced worldwide [6]. It is a key platform chemical and an important precursor for a variety of products and value-added chemicals, such as the production of resins, disinfectants, adhesives, coatings and many other products for various industries [7], while it also offers potential applications in the future energy sector [8]. Most of the formalin is currently produced by methanol oxidation [8], while methanol is typically produced from natural gas producing syngas, converting syngas to crude methanol and purifying methanol [9]. Most of the methanol, which is highly-energy intensive [10], is used in the production of formaldehyde [9]. Contrary to current practice, methanol and formalin production processes could be operated sustainably regarding materials and energy [11].
In this work, the main goal is to obtain a formalin production process with minimum energy requirements. A formalin production process was first simulated; heat integration (HI) was then applied to reduce utility consumption by a combination of pinch analysis (PA) and mathematical programming (MP) [12], where a sequential three-step approach was used. The first two steps were optimization steps to achieve minimum utility cost with the least number of heat exchange units. Based on these two steps, the heat exchanger network (HEN) of the process was designed. The economic and environmental impacts of implementing HI within the process were further evaluated. Both capital and operating cost were calculated, while environmental footprints were calculated based on life cycle analysis (LCA). By applying process systems engineering (PSE) techniques, a more sustainable formalin production process was designed.
Few studies have dealt with the applications of PSE to the formalin production process. Kovač Kralj [13] used the PA method to perform total site HI between production processes of solvent, methanol and formalin. However, in this study, capital cost and environmental impacts were not assessed. Qi and Li [14] used the PA method to analyze an existing HEN for a simulated methanol-to-formaldehyde production process, where savings in hot and cold utility consumption were achieved. Studies also analyzed how HI affects utility consumption and subsequently the economic and environmental impacts of methanol production process. Kijevčanin et al. [15] used PA to reduce utility consumption and achieve a viable trade-off between capital and utility cost. Chen et al. [16] developed a simultaneous HI approach based on linear programming formulations and applied it to a methanol production process. Maréchal et al. [17] modified the methanol process by applying simulation models and a new synthesis strategy. Improvements in overall energy balance and conversion were achieved; however HEN was not designed in detail.
Several investigations have also been undertaken on the economic and environmental analysis of various systems, such as diffusion of electric vehicles [18], wastewater management [19], bioenergy systems [20], biogas supply networks [21], company supply networks [22] and many others. Based on the literature review, it was found that no studies had dealt with systematic analysis of cost, energy and emissions of the formalin production process, even though formaldehyde is among the top chemicals produced in the United States by quantity [23] and is among the basic organic chemicals. Analysis had not been performed for either the classical process via methane steam reforming (MSR) or for the more sustainable process, such as formalin produced by captured CO2 and renewable hydrogen, produced by biomass gasification and the like.
In this work a comprehensive technical, economic and environmental footprint analysis of the formalin production process via MSR is performed. The process is first simulated using Aspen HYSYS software, where energy consumption requirements are analyzed. Moreover, HI was applied to improve energy efficiency and to enhance energy savings in formalin industries. Additionally, economic evaluation and environmental footprint analysis were carried out for both non-integrated and heat-integrated processes. The conclusions of this work will serve as a basis for technical, economic and environmental assessment of more sustainable formaldehyde production and production processes that use formaldehyde as a raw material.
2. Methodology
Reduction of energy consumption, and consequently the cost of and emissions from the formalin production process by the most common method MSR are analyzed by a sequential HI approach. In this section, a general description of the formalin production process via MSR is first presented. The methodology for HI, and economic and environmental footprint analysis are then described. Energy use, operating and capital cost and environmental footprints were evaluated for both the non-integrated (simulated) and heat-integrated process.
Simulation of MSR to methanol and further to formalin was carried out using Aspen HYSYS software [24]. Based on the simulation, a sequential three-step approach was used to obtain HEN design and a proposed heat-integrated process flowsheet by combined PA/MP.
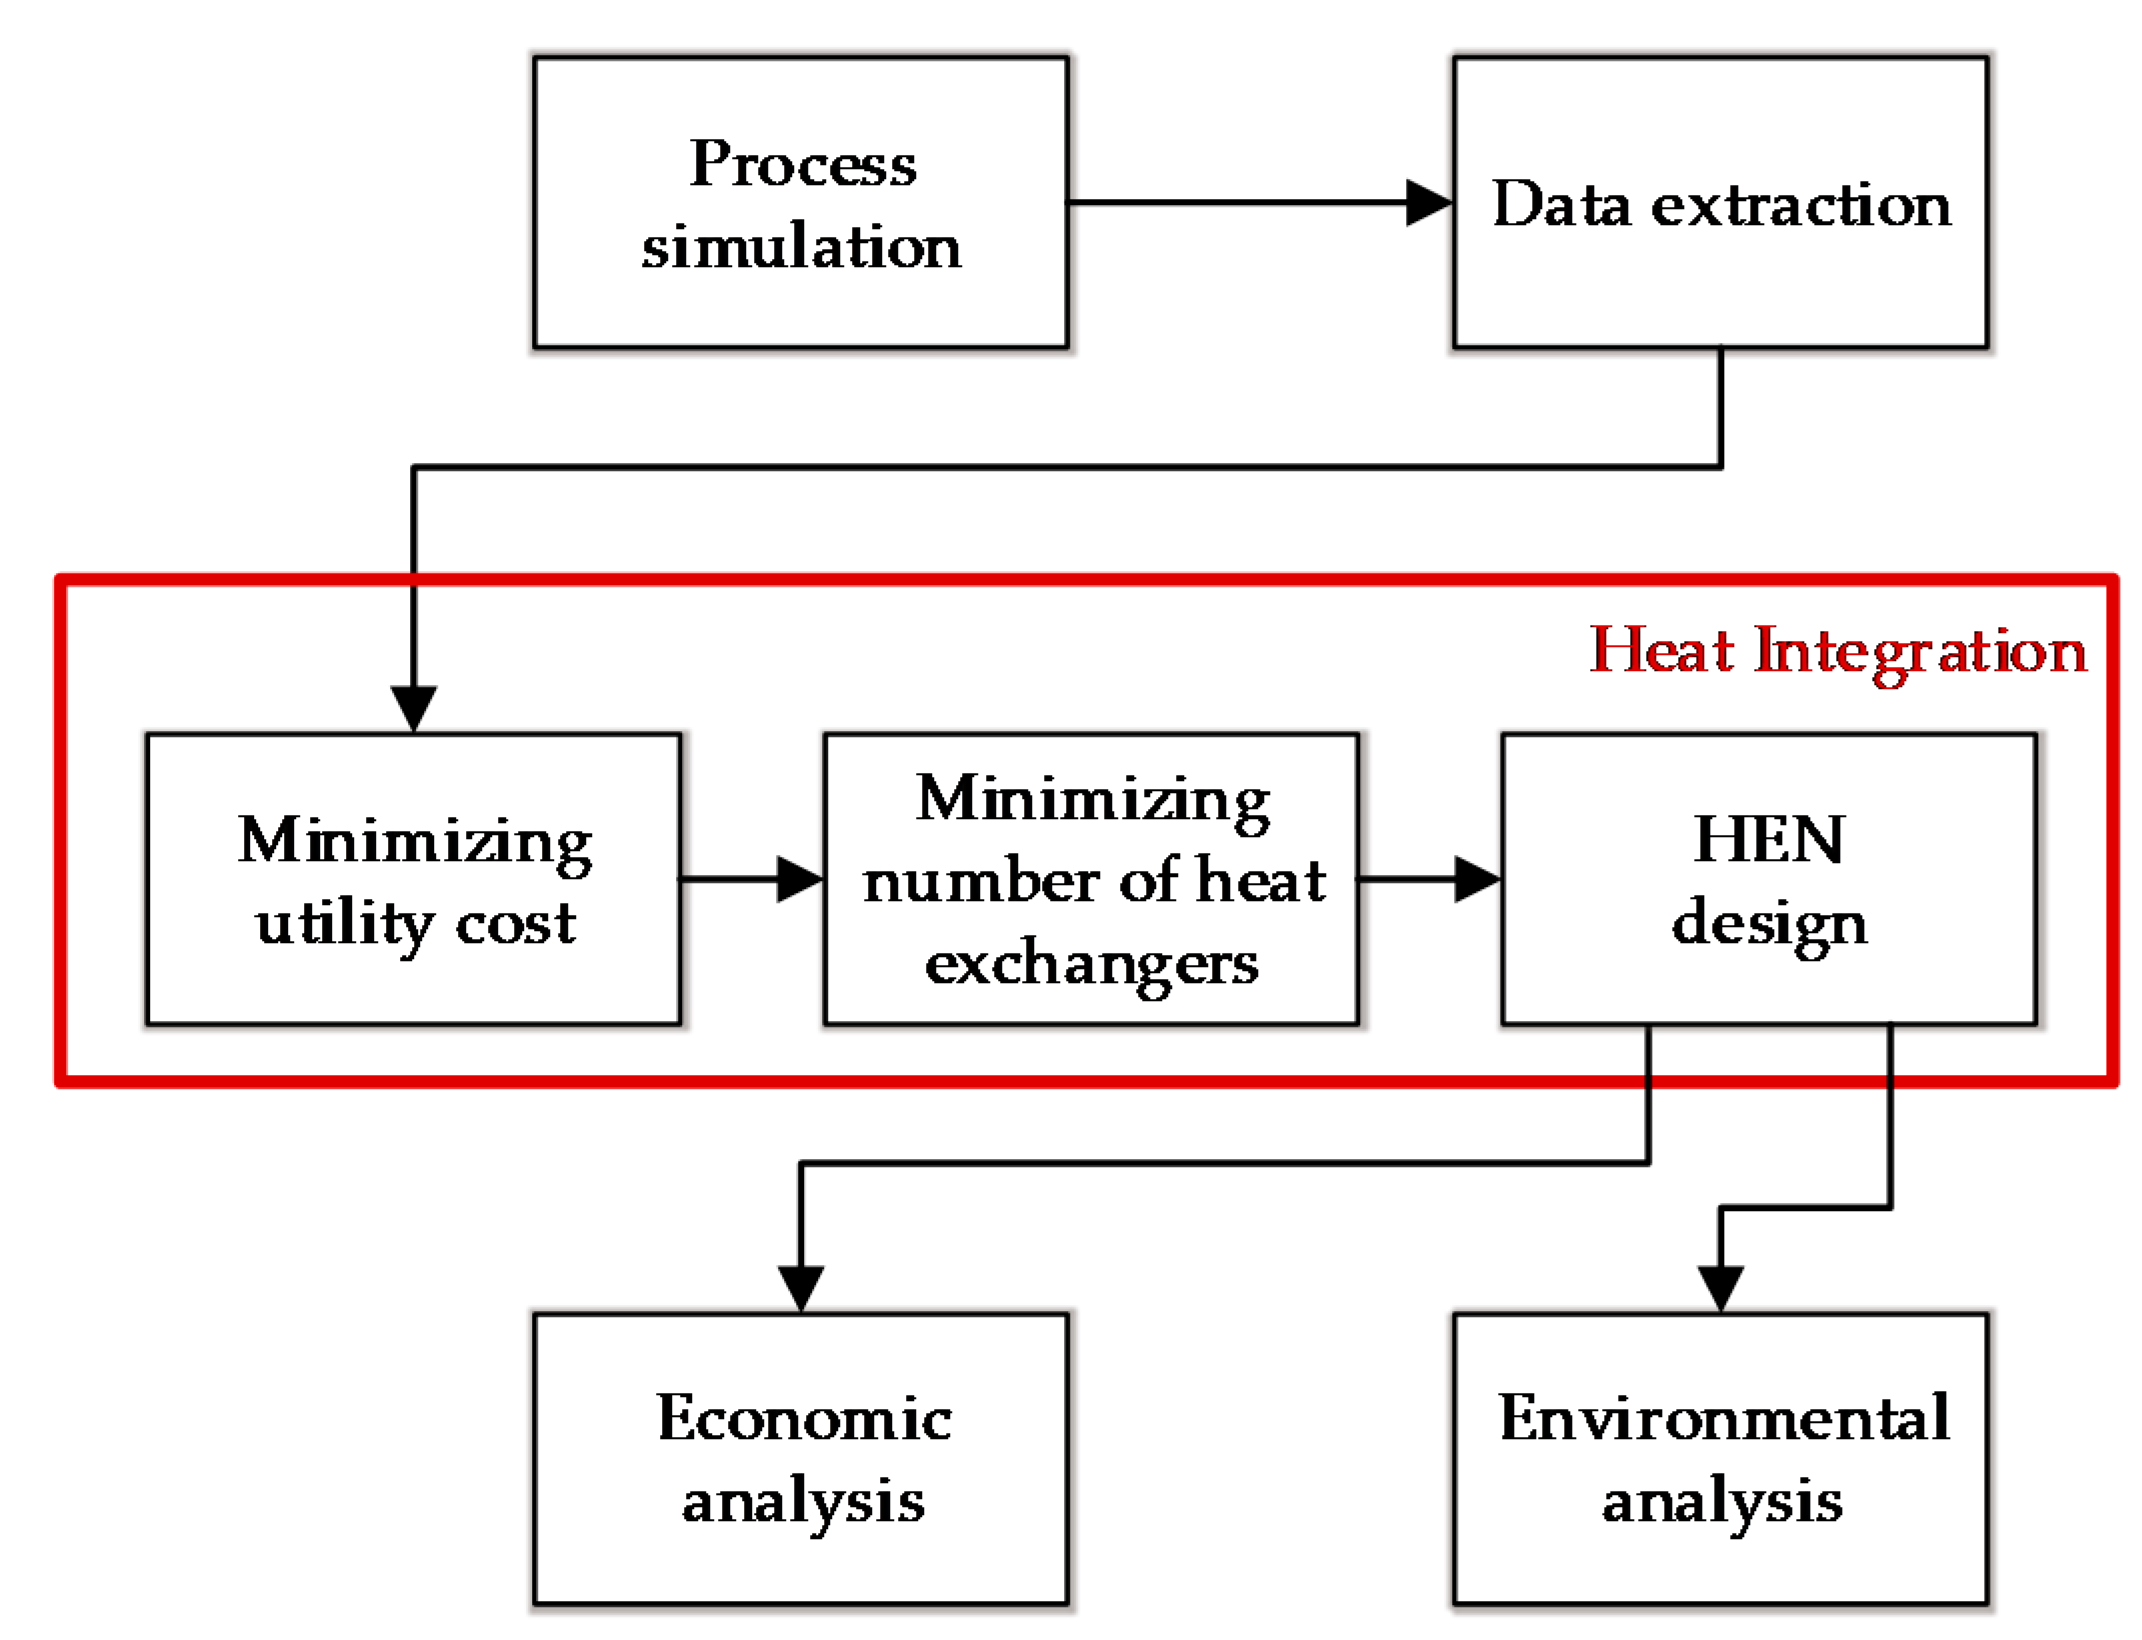
Economic evaluation was carried out by calculating operating cost and capital cost based on the factors method [25]. Environmental footprint analysis was performed using OpenLCA software [26], where various environmental footprints (greenhouse gas (GHG), nitrogen, phosphorus, ecological and energy footprints) and human toxicity potential were evaluated. A flowchart showing the framework of applied methodology is shown in Figure 1.
2.1. Formalin Production via Methane Steam Reforming
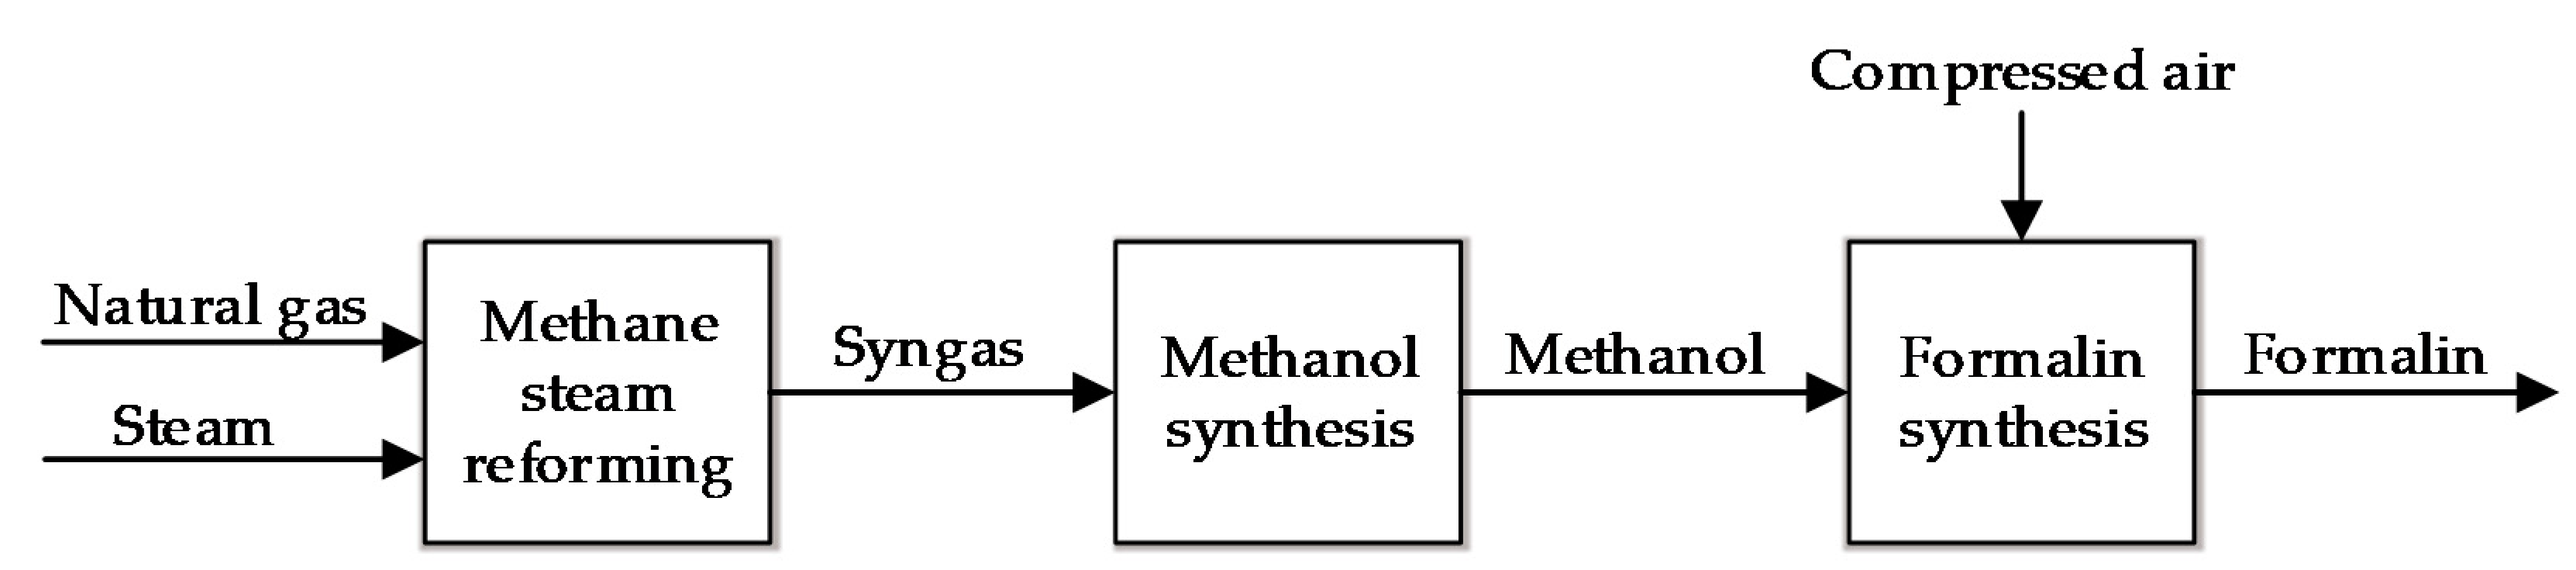
Formalin is a 37 wt % aqueous solution of formaldehyde and is the most common formaldehyde product [27]. Most formaldehyde is produced by subsequent processes of methane steam reforming (MSR), synthesis of methanol and synthesis of formaldehyde from methanol and air. Figure 2 shows a simplified block diagram of the formalin production process via MSR. The flowsheet is composed of three different production parts: (i) MSR, (ii) methanol synthesis and (iii) formalin synthesis. Formalin is obtained as the desired product, along with an aqueous mixture of methanol as a byproduct.
MSR is one of the most common processes for syngas production, from which a variety of bulk chemicals are produced, like hydrogen, ammonia, methanol and many others. The reactions occurring during the MSR process are shown in Equations (1) and (2). Equation (1) stands for methane reforming, which is an endothermic reaction, where CH4 reacts with high-temperature steam under pressure to syngas, consisting of CO and H2. Equation (2) represents the water gas shift (WGS) reaction to enhance H2 production efficiency.
Moreover, methanol is produced from syngas, based on equilibrium reactions of oxocarbons and hydrogen:
In the last part of the process, formalin is produced from methanol and air, where the overall process is a combination of partial oxidation and dehydrogenation reactions [28]:
2.2. Energy Consumption Reduction
Heat integration (HI) was performed in three steps: (i) minimizing utility cost; (ii) minimizing the number of heat exchange units and (iii) heat exchanger network (HEN) design. The general algebraic modeling system (GAMS) [29] was used for minimizing utility cost and for minimizing the number of heat exchange units.
Stream data was first extracted from Aspen HYSYS simulation. Then, in the first step of HI, utility cost was minimized with a linear programming (LP) model by using an expanded transshipment model [30]. The objective function for the model is shown in Equation (7):
where QHU and QCU are the consumption of hot and cold utilities, and and are the cost coefficients of hot and cold utilities.
In the second step, the number of heat exchange units was minimized. The transshipment model was expanded to include binary variables representing connections between the hot and cold streams. This was solved using a mixed-integer linear programming (MILP) model, which is called the MILP expanded transshipment model [30]. Heat duty values for specific utilities as obtained from the first step were fixed in the model. A set of binary variables and a set of equations connecting the variables to the streams were added to the model. The objective in the second step was to minimize the sum of binary variables, as shown in Equation (8):
where are the available connections between hot and cold streams exchanging heat. The minimum number of heat exchange units and a table displaying the amount of heat exchanged between streams were obtained as results. GAMS was also used for the second step.
In the third step, HEN was obtained based on the results from the second step and heuristics, and a flowsheet of the production process based on HI was proposed. A minimum temperature approach (∆Tmin) and the cp inequality rule [25] were considered for each individual match for designing HEN. For HEN design, parallel arrangement was prioritized over a series arrangement [31]. Finally, the heat exchangers were arranged in such a way as to minimize the total heat exchanger area. The heat exchanger area calculation is shown in Equation (9):
where Q is the heat transferred between streams, U is the heat transfer coefficient and ∆Tln is the logarithmic mean temperature difference. As a result of the HEN design, total utility consumption, exchanged heat and total heat exchanger area were obtained.
2.3. Economic and Environmental Footprint Analysis
For economic evaluation, both capital and operating costs were calculated. For capital cost estimation, the factors method [32] was used. The base factor for capital cost is the delivered (purchased) cost of process equipment, calculated for each piece of equipment depending on its material and size. Equipment cost is further adjusted for inflation using the chemical engineering plant cost index (CEPCI) [32]. Operating costs were calculated on a yearly basis and comprise costs for the following: raw materials, utilities, labor, maintenance, quality assurance and depreciation cost, which depend on the total depreciable capital investment.
Environmental footprint analysis was performed using the cradle-to-gate approach and was based on the production of 1 kg of formalin. Selected environmental footprints were evaluated using OpenLCA software [26], such as GHG, nitrogen, phosphorus, ecological and energy footprints and human toxicity potential.
3. Description of the Formalin Production Process and Heat Integration Approach
In this section, the formalin production process is described in detail. The sequential HEN design method approach for HI is then presented, including extracted data for the HEN design.
3.1. Process Description
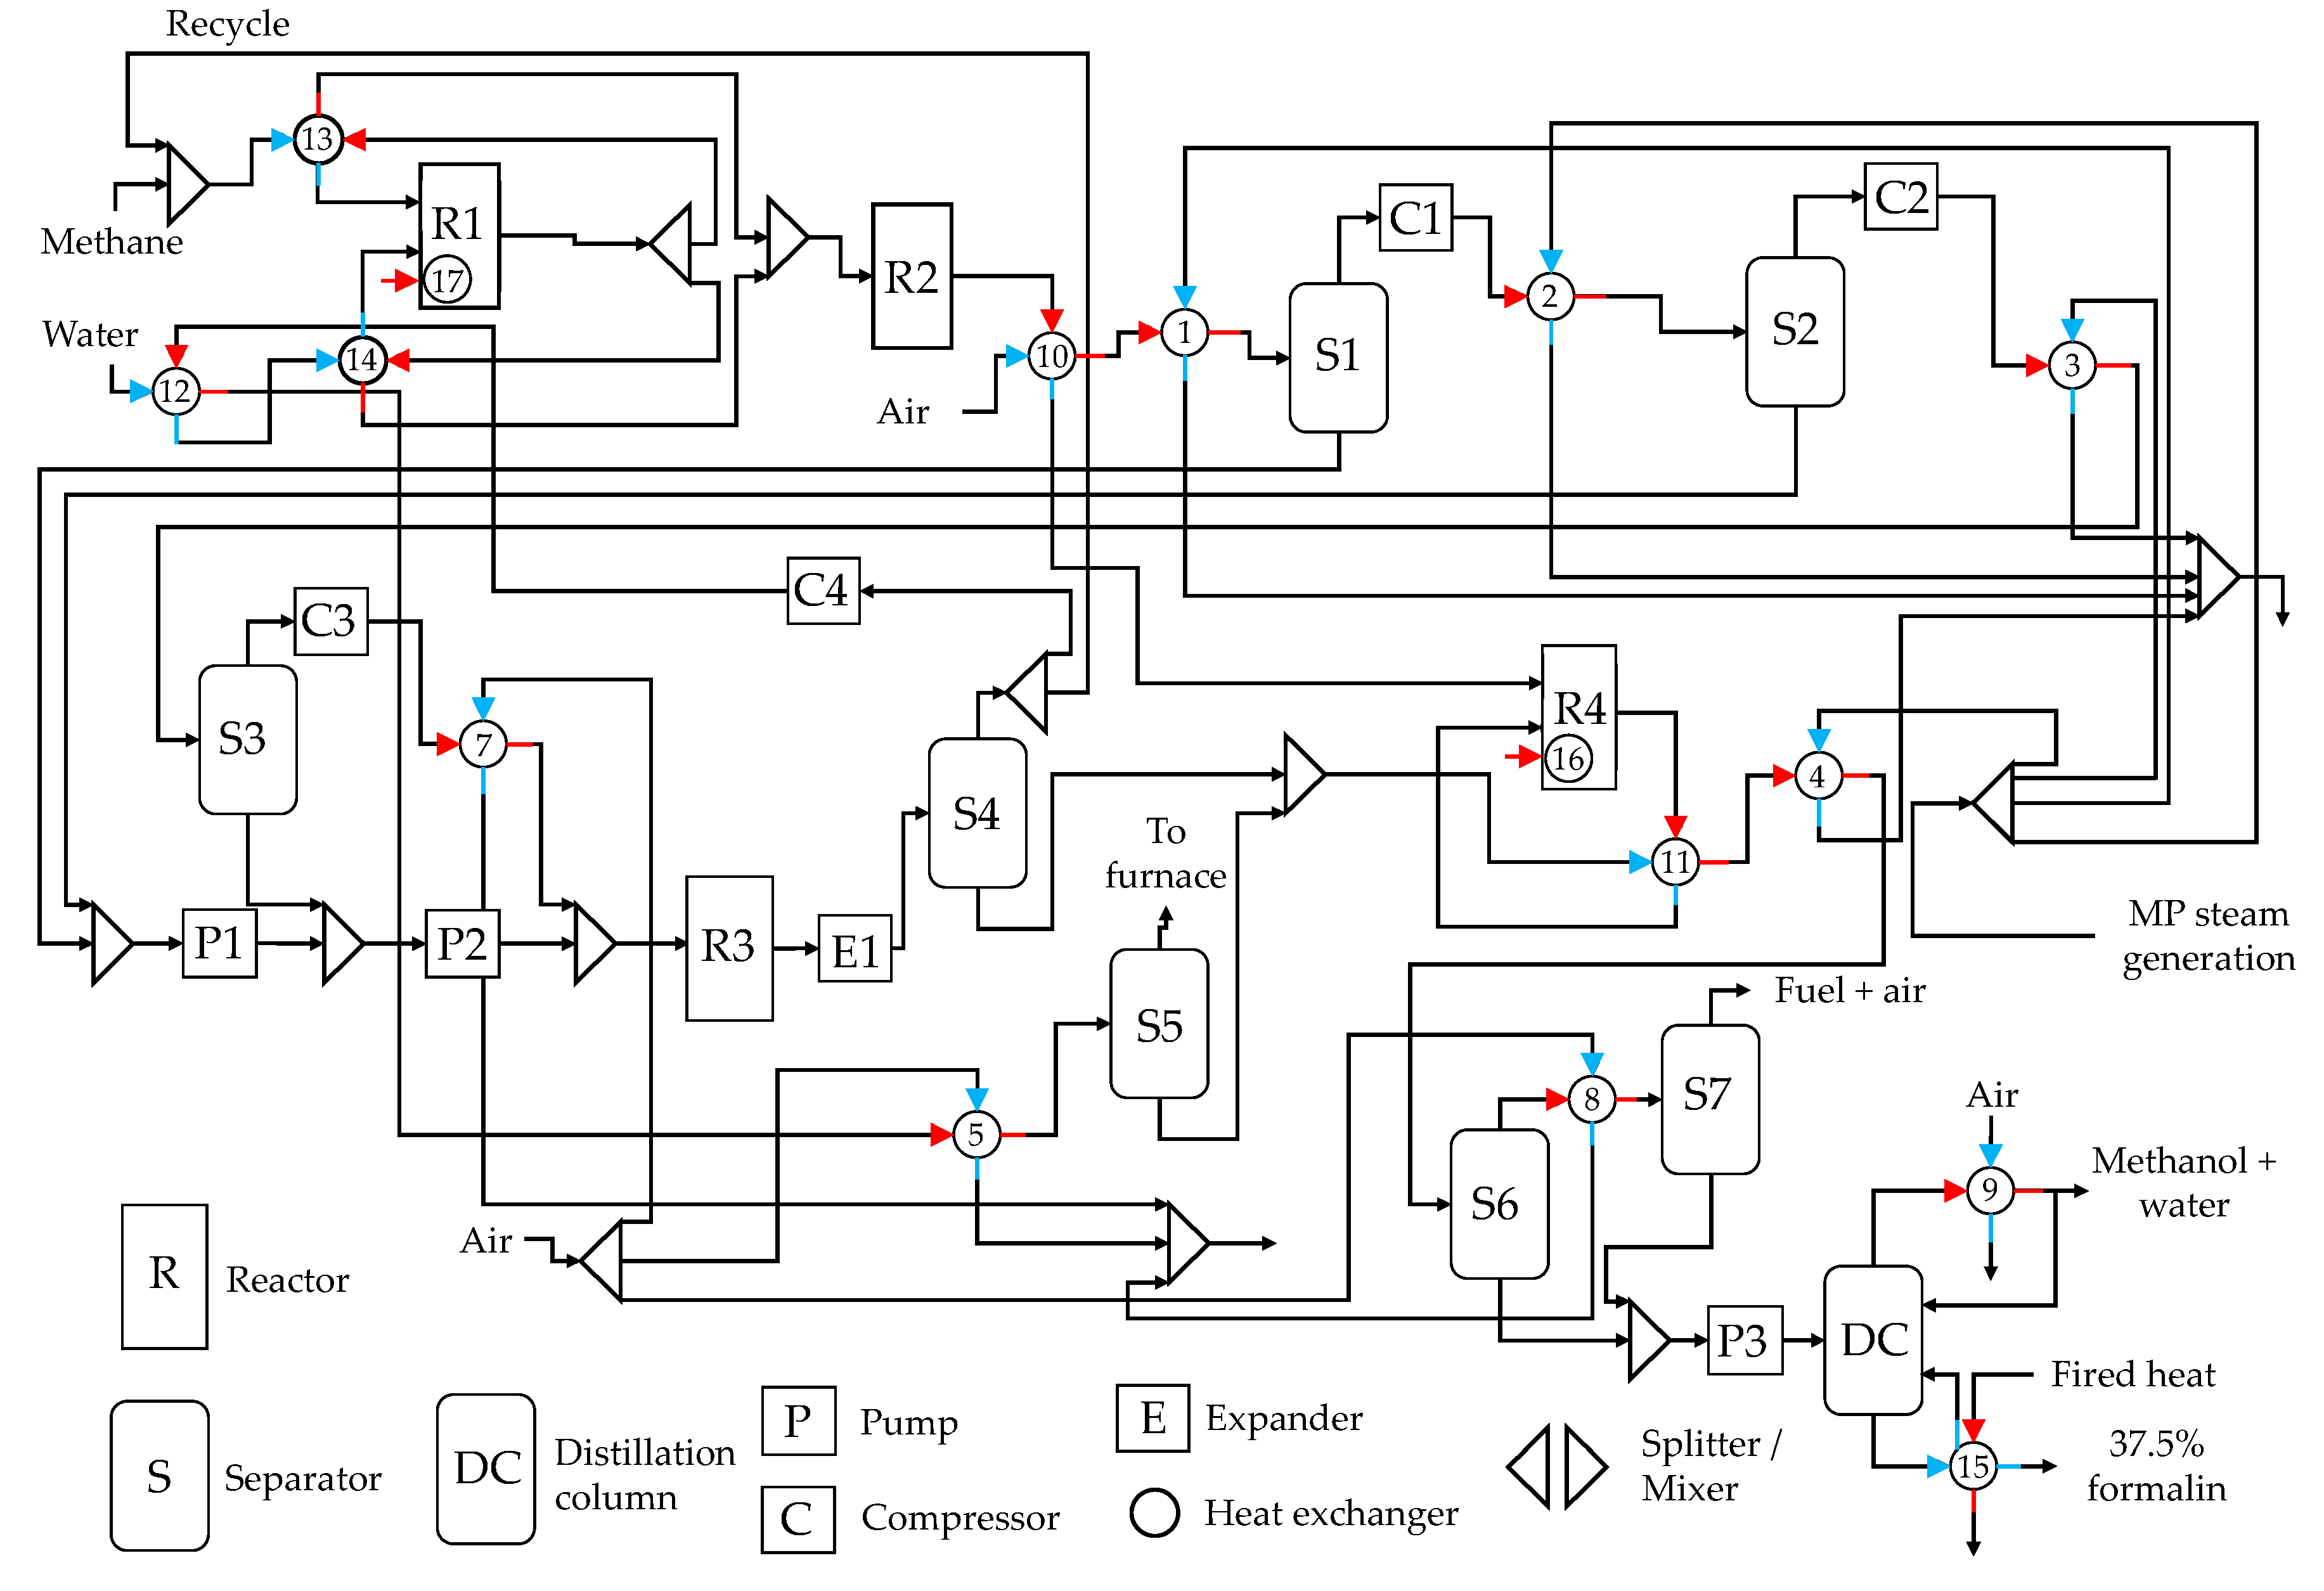
The formalin production process is presented in Figure 3, where physical properties for all mixtures in the MSR part and in the methanol synthesis loop were estimated using Peng–Robinson equations of state. MSR is a catalytic process, which occurs in three phases: methane steam reforming, WGS and water removal. Methane reforming takes place in the reactor R1 over the Ni/α-Al2O catalyst [33], where the inlet flow of methane is 53.5 m3/h and steam 35.5 m3/h. The inlet flows were first heated to the reforming conditions. The outflow temperature after reactor R1 was 850 °C, which was cooled to 200 °C (hot stream H1) and introduced into the equilibrium reactor R2, where the low-temperature WGS reaction takes place (Equation (2)). The stream was further cooled to 40 °C (hot stream H2). Water was then eliminated in separator S1 prior to introduction to compressors. A multistage compression train was implemented with interstage coolers to 40 °C, where a maximum compression factor of 5 was observed throughout the simulation. Condensate water collected from separators S1 and S2 was pressurized via pumps P1 and P2 to the same pressure downstream of compressor C3 (considering the pressure drop in H5). In this way, it is possible to introduce the syngas stream combined with water to the R3 reactor.
Methanol synthesis was simulated using a Gibbs reactor R3, where reactions occur as specified in Equations (3)–(5). A Gibbs reactor is a HYSYS built-in module, which minimizes Gibbs free energy for the reaction products at equilibrium [24]. The R3 reactor outflow was later expanded with expander E1 to 10 bar and introduced to separator S3, where non-condensable (H2, CO2 and CH4) were separated from the methanol-water flow. Stream 27 represents recycling of 60% non-condensable back to the methane inflow, and stream 28 the purge gas outflow, which contained about 78.7% CH4, 18.1% H2 and small amounts of CO2 and methanol. This stream was further compressed, cooled and separated in S4 prior to burning in a furnace.
For the formalin synthesis, the NRTL property package was used to predict liquid phase activity coefficients. The methanol-water stream and air inlet stream (75 m3/h) were preheated to 150 °C and introduced to the R4 conversion reactor, where formaldehyde was synthesized. A conversion of 87.4% was achieved using a silver catalyst [34]. The outlet stream was cooled to 50 °C and introduced into the S5 separator, where separation of the formaldehyde-water stream and other gases (H2, N2, O2 with some H2O, CH3OH and CH2O) occurred. Stream 44 was then introduced to distillation column DC, from which 37.5% formalin and an aqueous mixture of CH3OH were obtained. Gases emerging from separator S5 were cooled further to 50 °C and separated again in separator S6, to separate the residual of CH2O, CH3OH and H2O, which was recycled. The process was scaled to produce about 1075 t of formalin per day.
3.2. Heat Integration of the Formalin Process
The process of formalin production was highly energy intensive. Table 1 shows utility consumption in the formalin production process obtained from the simulation in Aspen HYSYS (schematic representation is shown in Figure 3). For heating, fired heat (FH) with temperatures between 1000 and 150 °C was used, while for cooling, air was used. MP steam was also generated in the process, with temperatures between 25 and 200 °C. The consumption of hot utility (FH) was 151.7 MW, with a heat transfer area of 27,824 m2. The consumption of cold utility (air) was 9.8 MW, with a heat exchange area of 2616 m2. Additionally, 141.4 MW of medium pressure steam (MPS) was generated, as shown in Table 1. The total energy consumption of the process before HI was 302.9 MW and the heat exchanger area was 45,045 m2.
Combined PA/MP [12] was used to evaluate the opportunities for energy consumption reduction. The problem table for HI is shown in Table 2, which gave the supply and target temperatures, heat duties and flowrates of each hot and cold stream. The process contained 9 hot streams (H1-H9) and 7 cold streams (C1–C7); see also Figure 3. ∆Tmin of 10 °C was assigned to all heat exchangers.
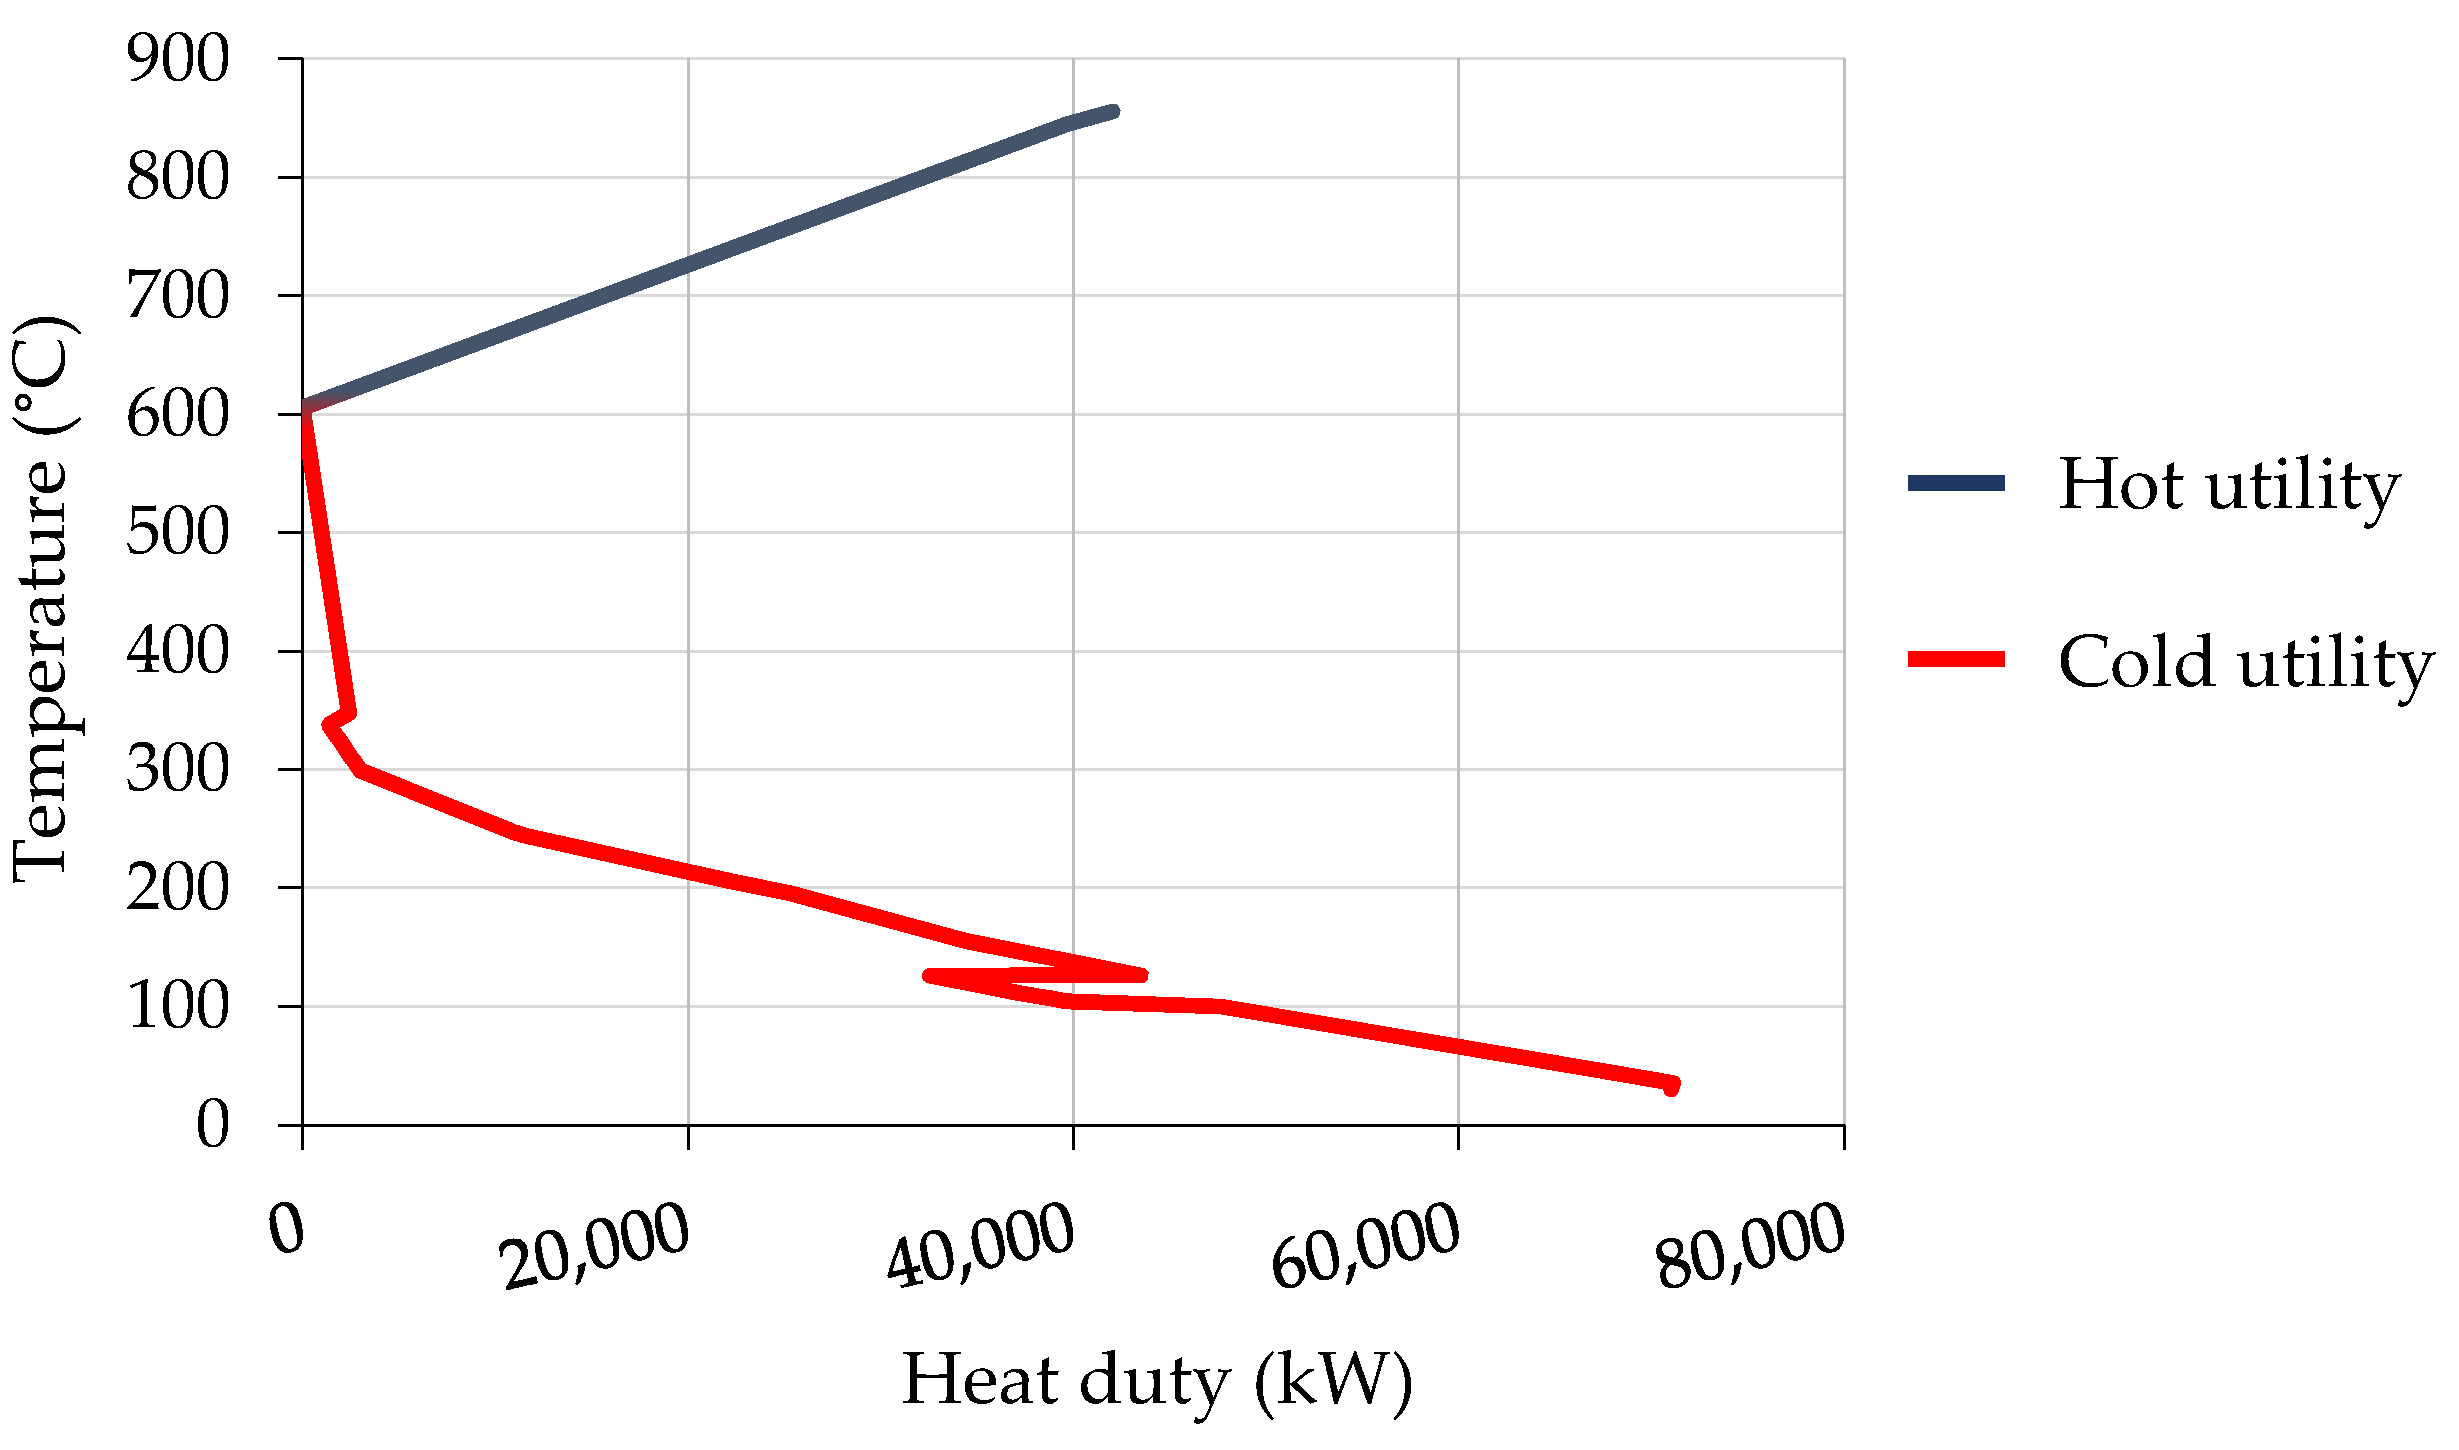
Figure 4 shows the grand composite curve (GCC) of the process. The pinch temperature was at 600/610 °C. Minimum energy requirements for heating were 42.02 MW and 68.25 MW for cooling. However, in the study it was considered that the heat from the reactions in R1 and R4, which were not process streams, and heat for distillation (reboiler and condenser), where temperature control is difficult [25], were not available for HI. Consequently, the utility consumption obtained was higher than the target.
The extracted data in the problem table and utility data were entered into the expanded transshipment model in GAMS [30] to minimize the cost/maximize profit. In the second step, the number of heat exchange units was minimized by a MILP expanded transshipment model [30], also in GAMS. In the third step, the heat exchangers were arranged using heuristics and the results from the second step, as described in Section 2.2. The HI results and the proposed heat-integrated production process based on HI are shown in Section 5.
4. Economic Performance and Footprint Analysis
In this section, evaluation of the economic performance, environmental footprints and human toxicity potential was described. The calculation procedure for obtaining capital investment cost and total annual cost is shown. For footprint and human toxicity potential assessment, a description was provided, including life cycle inventory (LCI) for the process before and after HI.
4.1. Economic Performance
To evaluate economic performance, capital cost, which consists of direct and indirect cost, was first estimated using the factors method [32]. Equipment delivered (purchased) cost was first calculated for each process unit, based on the equations factoring in variables for size and material. The following variables were considered: power required for compressors and expanders, diameter, height and number of trays for distillation columns, heat exchange area for heat exchangers, volume flow and electric motor power required for pumps and height and diameter for vessels (reactors and separators). For mixers and splitters, cost was considered negligible. The equations used in this section are based on the literature [32]. Total equipment delivered cost was converted to EUR and adjusted to 2019 value [35] using the CEPCI index [36].
Direct cost was calculated using factors for installation, which include the costs for equipment erection, piping, instrumentation, electrical installation, insulation, buildings, site preparation and off-sites. Direct cost (CD) was calculated using Equation (10), where installation factors were accumulated:
where CE is equipment cost.
Indirect cost (CI) includes the cost of engineering and construction and was calculated using Equation (11):
The cost for contractors and contingencies (CCC) was next calculated using Equation (12):
The capital cost (CCAP) was calculated using Equation (13):
Working capital and start-up cost (CWC) was calculated using Equation (14):
Finally, total capital investment (CINV) was calculated using Equation (15):
Total annual cost was then estimated, factoring in the cost of raw materials, utilities, labor, maintenance, quality assurance and depreciation cost. The depreciation cost (CDEP) depends on the total depreciable capital and was calculated using Equation (16):
where N is the plant lifespan, which was assumed to be 25 years.
The maintenance cost (CMAIN) also depends on the capital cost and was calculated:
The annual costs of tax and insurance and miscellaneous costs were labeled as other costs (COTHER), and were calculated using Equation (18):
The labor cost (CL) was estimated to depend on the hourly wage and number of employees. The quality assurance cost (CQA) was assumed to be 15% of the labor cost. The utility (CUTIL) and raw material costs (CRM) were based on consumption and market prices. Finally, the total annual cost (CTAC) was calculated using Equation (19):
4.2. Footprint Analysis
Environmental impact assessment was performed based on the production of 1 kg of formalin before and after HI. Different footprints were evaluated in close relation to worldwide concerns over threats to human society. The five most important footprints from the “Footprint Family” [37] and high-risk planetary boundaries [38] were considered, such as GHG, nitrogen, phosphorus, ecological and energy footprint and human toxicity potential [39].
The GHG footprint reflects total GHG emissions over the life cycle of a product, expressed as kg of CO2 equivalent [39]. It was calculated using the IPCC 2013 GWP methodology over a 100-y time horizon. The nitrogen footprint measures all the nitrogen compounds except N2 released into the environment over the life cycle of a product and is expressed in mass units of N [39]. The phosphorus footprint reflects the phosphorus imbalance [39] that occurs because of the increasing phosphorus consumption by humans and livestock [40] and is expressed in mass units of P. The ecological footprint measures the biologically productive land and sea area required to supply resources over the life cycle of a product [39]. It is measured in units of biologically productive global land area (in m2·y). The energy footprint represents the consumption of non-renewable or renewable energy sources across the product life cycle [41]. Human toxicity potential reflects the effects of toxic substances on human health. It enables relative comparisons between a large number of chemicals that may contribute to cancer or other negative human effects for an infinite time horizon [42]. It is expressed as 1,4-dichlorobenzene equivalents.
To evaluate the environmental footprints and human toxicity potential of the formalin process, OpenLCA 1.10.3 software [26], the Ecoinvent 3.6 database [43] and the data obtained from the simulations in Aspen HYSYS were used. The LCA study was performed applying a cradle-to-gate variant, which is a partial LCA utilizing a systemic approach to calculate environmental impacts associated with a product, taking into account all relevant inputs and outputs of a product system during its lifetime. As LCA studies consider entire supply chains of materials and utilities, there is potential to significantly reduce environmental impacts and increase sustainability.
Table 3 summarizes the main life cycle inventory (LCI) data for the formalin production process before and after HI. LCI includes the main inputs of raw materials and utilities, and the main outputs (products and emissions) and is shown for 1 kg of formalin production.
5. Results and Discussion
Sequential three-step HI was performed for the energy-intensive formalin production process to reduce energy use, cost and emissions.
In the first step, an expanded transshipment model was used to obtain a minimum utility consumption of 183.0 MW, of which 91.8 MW was for heating and 91.2 MW for cooling (targets are 42.0 and 68.3 MW, as shown from GCC in Figure 4). Fired heat was assumed to be used for heating, and MP steam and air for cooling. MP steam was also generated to cool the fired heater fuel to 150 °C. In this way, 37.7 MW of MP steam was generated, as shown in Table 4. By performing HI, hot utility consumption was reduced from 151.7 to 91.8 MW, while cold utility consumption was reduced from 151.2 to 91.3 MW (see also Table 1), representing a 39.5% reduction in hot and 39.6% reduction in cold utility consumption.
In the second step, the values for utility consumption were fixed as obtained from the first step. The MILP expanded transshipment model was used to obtain the minimum number of heat exchange units, which was 17. A table displaying the amount of heat exchanged between the streams was also obtained.
In the third step, HEN was obtained using the data from the second step and heuristics. Heat exchange matches were arranged according to ∆Tmin of 10 °C and the cp inequality rule, as described in Section 2.2. Table 4 shows heat exchange matches, where each column represents one heat exchange match. Cumulative utility consumption, total exchanged heat, and total heat exchange area are also presented in Table 4, where utility consumption amounts to 183.1 MW, and 59.9 MW of heat was exchanged. A similar value was obtained in the first step of the sequential HEN design method. The slight difference in the value was attributed to changing certain matches due to constraints. The calculated total heat exchange area of the HEN was 43,522.2 m2, reduced from 45,045 m2 before HI. The total number of heat exchangers in the HEN was 17, as also obtained in the second step where it was minimized. Therefore, this number of heat exchangers represents the minimum number of units.
The data from Table 4 was used for a schematic design of HEN, which is shown in Figure 5. After HI, nine coolers (marked in blue), three heaters (marked in red), five process-to-process heat exchangers (indicated with grey) and one utility-to-utility heat exchanger (indicated with green) were suggested. Cold process streams C1, C2, C3 and C4 were heated completely by exchanging heat with the hot streams and did not require hot utilities. Heat exchangers 13 and 14 together accounted for 76.6% of the heat duty reduction (45.9 MW out of 59.9 MW, see also Table 4). As described in the Methodology section, the utility streams for air and MP steam generation were split for the heat exchangers to be connected in parallel. Heat exchangers utilizing fired heat were connected in series, which was done because of temperature difference constraints.
Figure 6 shows the proposed heat integrated formalin production process. The proposed formalin production process flowsheet was obtained by combining the flowsheet before HI (Figure 3) with the HEN shown in the grid diagram in Figure 5. The numbered heat exchange units in Table 4, and in the grid diagram in Figure 5 matched those in the proposed formalin production process flowsheet in Figure 6.
Cost analysis was performed before and after HI. A notable reduction in equipment cost was achieved, from 32.3 × 10⁶ EUR before HI, to 28.8 × 10⁶ EUR after HI. Part of the reduced cost was due to reduced heat exchange area, and to some fired heater units being replaced by less costly shell-and-tube heat exchangers. The heat exchange area was reduced from 45,045 to 43,522 m2 (by 3.4%). In total, the purchased cost of all heat exchange units was reduced by 29.5% after HI. These reduced equipment costs had a direct effect on other investment costs, as described in the Methodology section. Purchased equipment cost was reduced by 10.9%, and subsequently, total capital investment was reduced from 141.3 × 10⁶ EUR to 125.8 × 10⁶ EUR (also by 10.9%). All cost reductions are shown in Table 5.
Operating cost also decreased after HI. The most significant decrease was achieved in the utility cost, where revenue was obtained rather than decreased cost. This was attributed to the significant amounts of MP steam being generated. Steam was generated and sold in both integrated and non-integrated designs, and owing to the decrease in heating costs of fired heat after HI, these revenues increased from 8.8 × 10⁶ to 29.4 × 10⁶ EUR. The revenues were large enough to offset other cost such as depreciation and maintenance cost, and as a result, total annual costs were turned from a loss to a profit after HI. Changes in utility revenue and total annual cost can also be seen in Table 5.
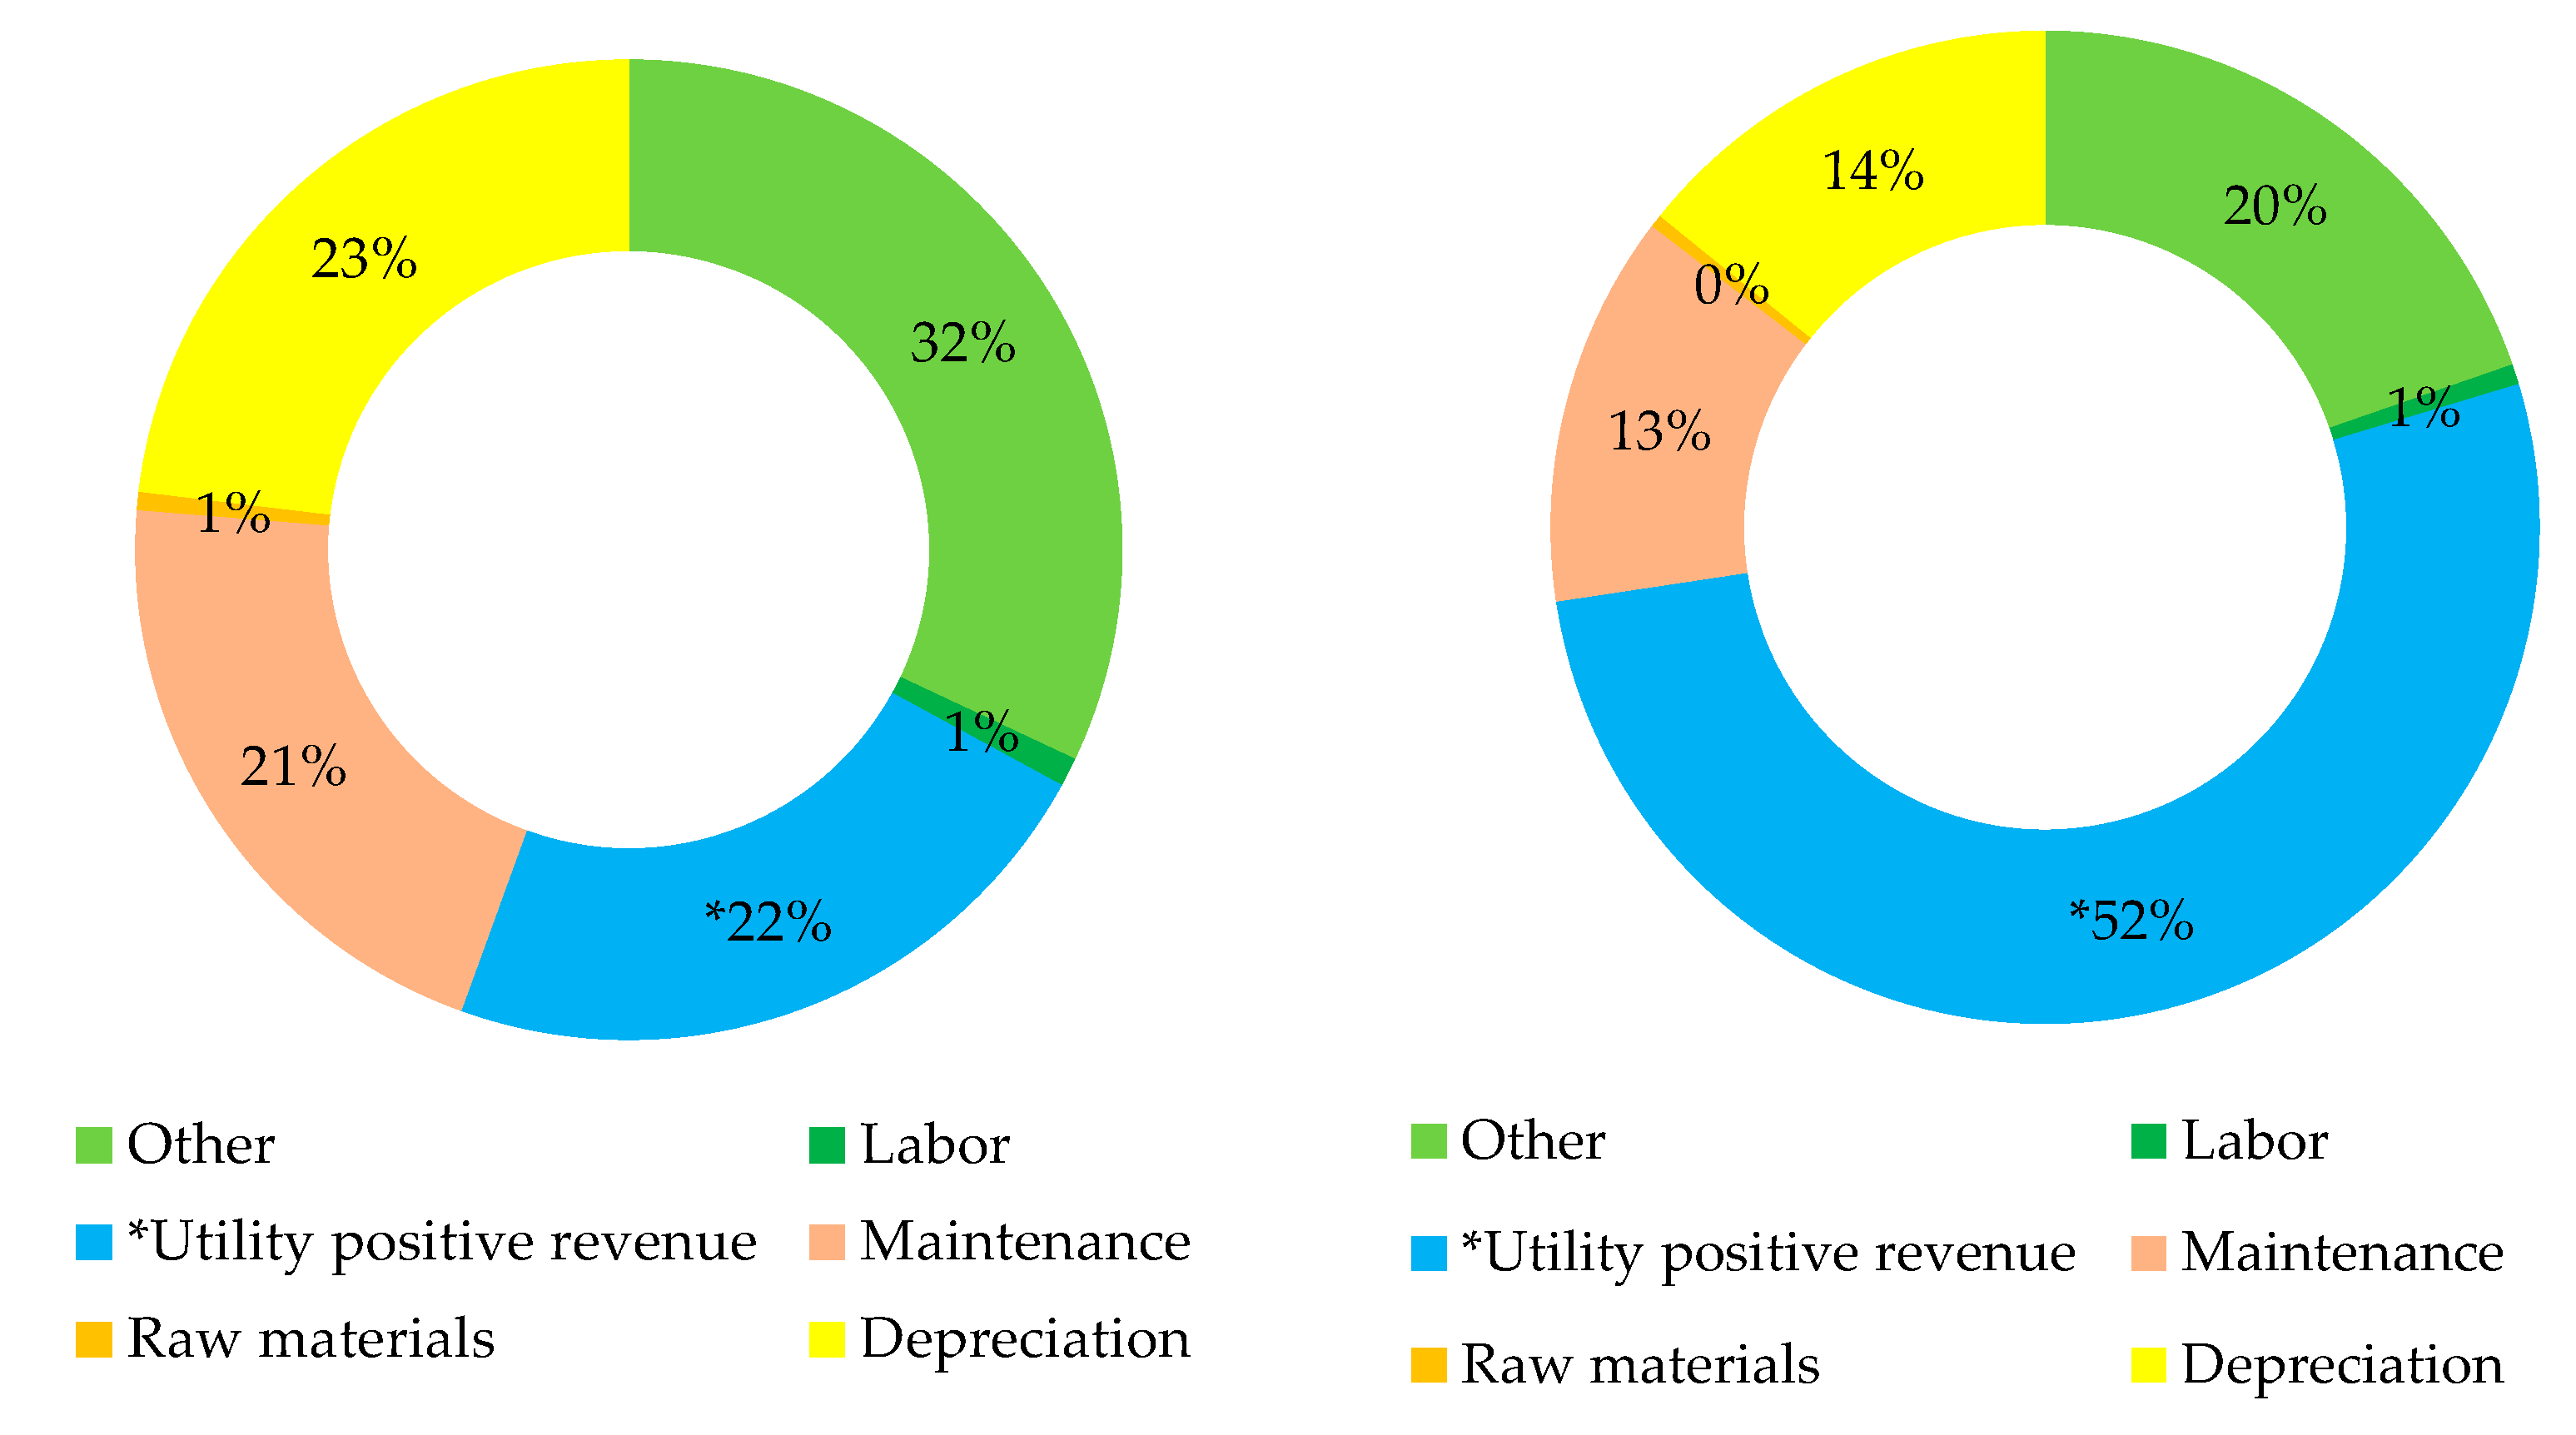
The pie charts shown in Figure 7 indicate the contributions of various categories to the total annual cost of the process before and after HI, including utility revenues. The increase in utility revenues is shown as the most notable change, where the increase after HI caused utility revenues to exceed the total annual cost.
Among annual costs, other costs form the largest contribution (32%). They were followed by depreciation cost (23%) and maintenance cost (21%), while labor and raw material cost contributed only a small percentage of the annual cost (around 1%). After HI, equipment and capital costs were reduced, and thus a notable reduction in these categories was obtained (see Figure 7, right, vs. Figure 7, left).
Total annual costs represented in the pie charts amount to 30.1 × 10⁶ EUR/y before HI (Figure 7, left) and 26.9 × 10⁶ EUR/y after HI (Figure 7, right). If utility revenues were not considered, other costs amounted to 41% of total annual costs, and the remaining costs largely comprised depreciation and maintenance costs. The distribution of these categories remained the same before and after HI.
Environmental evaluation of the process was finally performed before and after HI. The data for footprint and human toxicity potential analysis are as shown in Table 3. The footprint and human toxicity potential values per kg of formalin before and after HI are shown in Figure 8. After HI, all six evaluated environmental categories were reduced. Reductions in the evaluated environmental footprints are shown in Table 6, where the highest reduction percentage was obtained for GHG and ecological footprints.
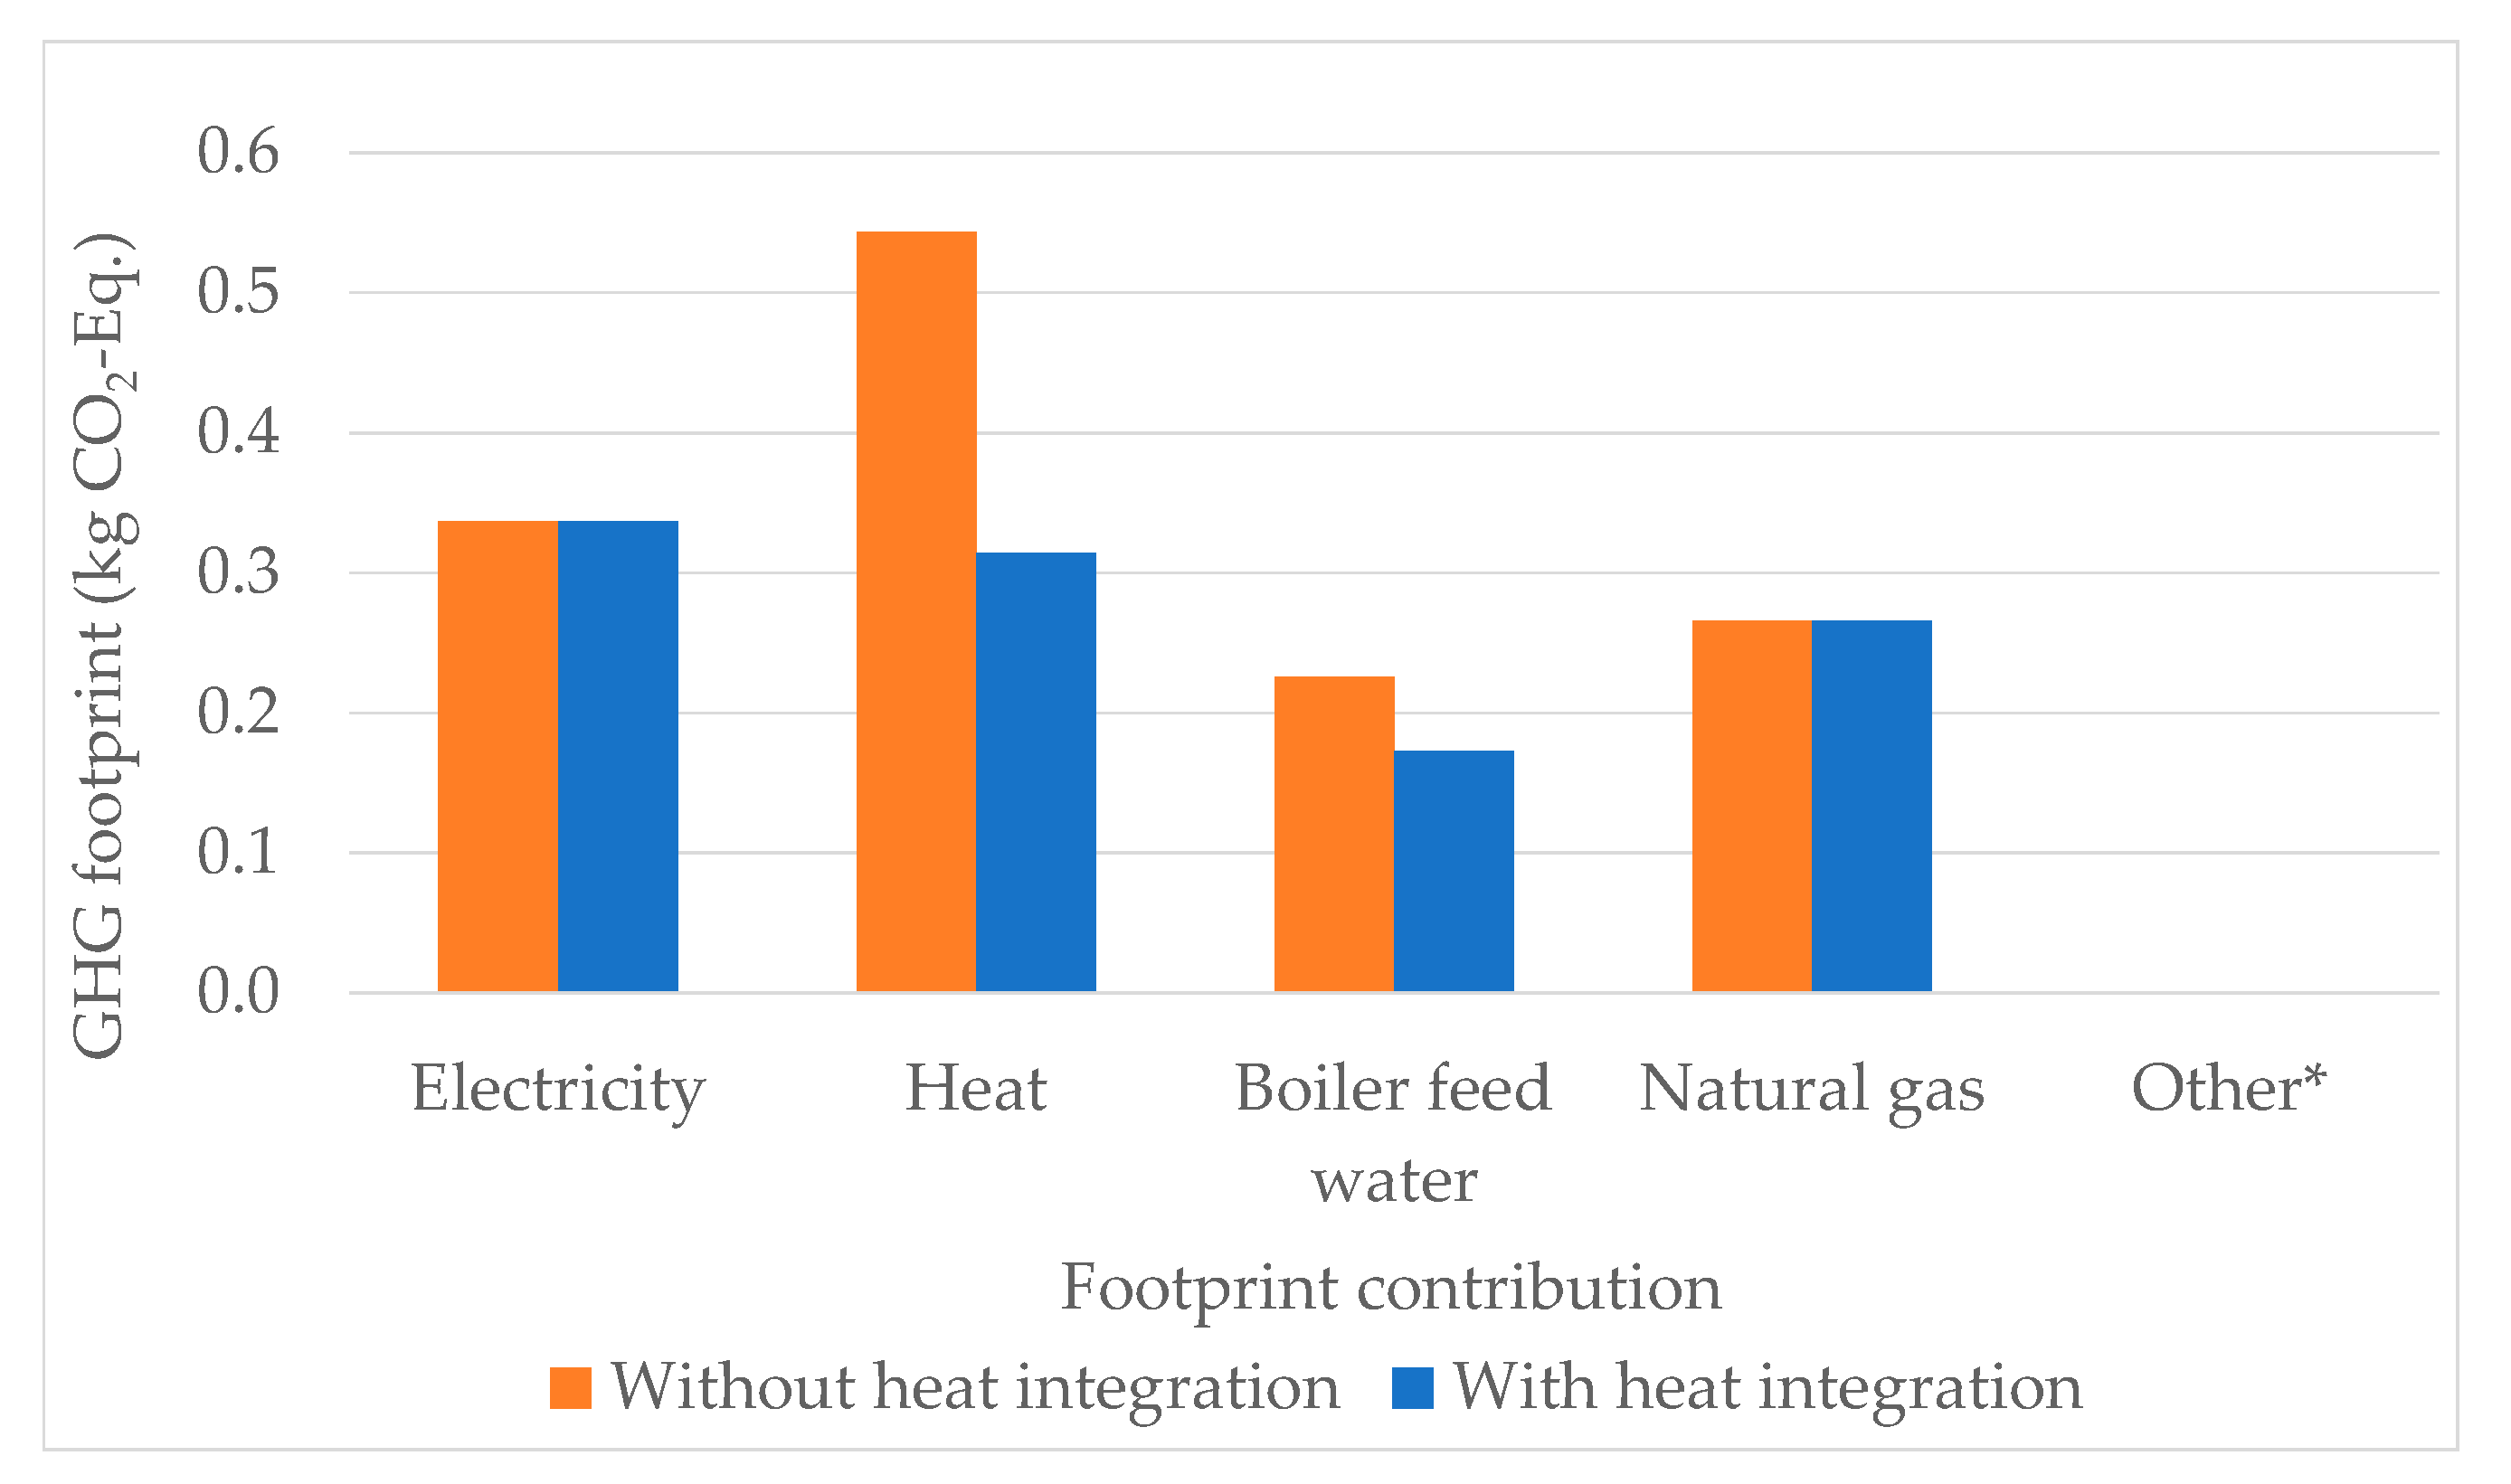
Figure 9 displays contributions to the GHG footprint in both the non-integrated and integrated designs. After HI, the GHG footprint was reduced because of the reduced inputs of fired heat and boiler feed water used to generate steam. The footprint values for electricity (used for compressors, pumps and air coolers) and natural gas remained the same before and after HI. Electricity contributed the most to the energy footprint, while natural gas contributes the most to human toxicity potential. The column labeled “Other*” reflected the contribution of gaseous outputs to the GHG footprint during the production process.
6. Conclusions
The formalin production process was first simulated and included three production parts, MSR, methanol synthesis and formaldehyde synthesis. Based on the simulated design, HI using PA/MP was performed. With 53 m3/h of methane, 35 m3/h of steam and 75 m3/h of air as raw materials, 39.5 t/h of 37.5% formalin and 2.4 t/h of aqueous methanol mixture were obtained.
The process, as shown in Figure 3, consumed 151.7 MW of hot utilities and 151.2 MW of cold utilities. After performing HI, consumption of both hot and cold utilities was reduced by 59.9 MW (by about 39.5%), and total utility consumption was reduced by 119.9 MW. The total heat exchange area was also reduced, from 45,045 to 43,522 m2 (by 1523 m2 or 3.4%). The total number of heat exchangers was 17 in both the non heat-integrated and heat-integrated designs.
Economic analysis of the process before and after HI showed that total capital investment cost was reduced by 15.4 × 10⁶ EUR or 10.9%. With reduced utility consumption after HI, utility revenues increased by 20.7 × 10⁶ EUR/y, turning a total annual cost into positive revenue.
Analysis of environmental footprints showed that selected footprint categories were reduced by 7–22% owing to reduced utility consumption. All the analyzed environmental categories showed that reductions in consumption of a boiler feed water and fired heat contributed the most to reducing environmental burden.
In future work, different, more sustainable formalin production routes, sourced from renewables and waste (such as from biomass or waste CO2 from larger point sources) will be synthesized and compared to the conventional process of MSR. Additionally, for each technology, sustainability evaluation (economic, environmental and social assessment) will be performed. As in the case of formalin, simulations will be performed for urea production from renewable and waste sources and technical, economic and environmental evaluation will be carried out. The final aim was to synthesize and comprehensively evaluate different routes for more sustainable melamine etherified resin (MER) fiber production.
Author Contributions
Conceptualization, A.V. and L.Č.; methodology, A.V., J.P. and L.Č.; software, P.A.; validation, P.A., A.V., L.Č. and J.P.; investigation, A.V., L.Č. and J.P.; data curation, P.A., A.V., L.Č. and J.P.; writing—original draft preparation, A.V. and J.P.; writing—review and editing, A.V., L.Č., P.A. and J.P.; visualization, J.P.; supervision, L.Č.; project administration, A.V. All authors have read and agreed to the published version of the manuscript.
Funding
This research was funded by the Ministry of Education, Science and Sport of Republic of Slovenia and European Regional Development Fund for the project No. 5442-1/2018/106 and Slovenian Research Agency (core research funding No. P2-0412 and project N2-0138).
Conflicts of Interest
The authors declare no conflict of interest.
Abbreviations
| CEPCI | Chemical Engineering Plant Cost Index |
| FH | Fired heat |
| GAMS | General Algebraic Modeling System |
| GCC | Grand Composite Curve |
| GHG | Greenhouse gas |
| HEN | Heat Exchanger Network |
| HI | Heat Integration |
| LCA | Life Cycle Analysis |
| LCI | Life Cycle Inventory |
| LP | Linear Programming |
| MER | Melamine Etherified Resin |
| MILP | Mixed-Integer Linear Programming |
| MP | Mathematical Programming |
| MPS | Medium pressure steam |
| MPSG | MPS generation |
| MSR | Methane Steam Reforming |
| NF | Nitrogen footprint |
| PA | Pinch Analysis |
| PSE | Process Systems Engineering |
| PF | Phosphorus footprint |
| WGS | Water–gas shift |
References
- Koh, S.C.L.; Gunasekaran, A.; Morris, J.; Obayi, R.; Ebrahimi Seyed, M. Conceptualizing a circular framework of supply chain resource sustainability. Int. J. Oper. Prod. Manag. 2017, 37, 1520–1540. [Google Scholar] [CrossRef]
- Monat, J.; Amissah, M.; Gannon, T. Practical Applications of Systems Thinking to Business. Systems 2020, 8, 14. [Google Scholar] [CrossRef]
- Hossain, N.U.I.; Dayarathna, V.L.; Nagahi, M.; Jaradat, R. Systems thinking: A review and bibliometric analysis. Systems 2020, 8, 23. [Google Scholar] [CrossRef]
- Hoekstra, A.Y.; Wiedmann, T.O. Humanity’s unsustainable environmental footprint. Science 2014, 344, 1114–1117. [Google Scholar] [CrossRef] [PubMed]
- Shongwe, M.I.; Bezuidenhout, C.N.; Sibomana, M.S.; Workneh, T.S.; Bodhanya, S.; Dlamini, V.V. Developing a Systematic Diagnostic Model for Integrated Agricultural Supply and Processing Systems. Systems 2019, 7, 15. [Google Scholar] [CrossRef] [Green Version]
- Roode-Gutzmer, Q.I.; Kaiser, D.; Bertau, M. Renewable Methanol Synthesis. Chembioeng Rev. 2019, 6, 209–236. [Google Scholar] [CrossRef]
- Shakeel, K.; Javaid, M.; Muazzam, Y.; Naqvi, S.R.; Taqvi, S.A.A.; Uddin, F.; Mehran, M.T.; Sikander, U.; Niazi, M. Performance Comparison of Industrially Produced Formaldehyde Using Two Different Catalysts. Processes 2020, 8, 571. [Google Scholar] [CrossRef]
- Heim, L.E.; Konnerth, H.; Prechtl, M.H. Future perspectives for formaldehyde: Pathways for reductive synthesis and energy storage. Green Chem. 2017, 19, 2347–2355. [Google Scholar] [CrossRef] [Green Version]
- Dalena, F.; Senatore, A.; Basile, M.; Knani, S.; Basile, A.; Iulianelli, A. Advances in methanol production and utilization, with particular emphasis toward hydrogen generation via membrane reactor technology. Membranes 2018, 8, 98. [Google Scholar] [CrossRef] [Green Version]
- Marlin, D.S.; Sarron, E.; Sigurbjörnsson, Ó. Process advantages of direct CO2 to methanol synthesis. Front. Chem. 2018, 6, 446. [Google Scholar] [CrossRef]
- Martín, M.; Grossmann, I.E. Towards zero CO2 emissions in the production of methanol from switchgrass. CO2 to methanol. Comput. Chem. Eng. 2017, 105, 308–316. [Google Scholar] [CrossRef]
- Merli, R.; Preziosi, M.; Acampora, A. How do scholars approach the circular economy? A systematic literature review. J. Clean. Prod. 2018, 178, 703–722. [Google Scholar] [CrossRef]
- Kovač Kralj, A. A simple graphical utilities targeting method for heat integration between processes. Ind. Eng. Chem. Res. 2012, 51, 14171–14177. [Google Scholar] [CrossRef]
- Qi, S.-N.; Li, S.-Y. Simulation and energy efficiency optimization of methanol to formaldehyde process. Mod. Chem. Ind. 2014, 3, 47. [Google Scholar]
- Kijevčanin, M.L.; Đorđević, B.; Ocić, O.; Crnomarković, M.; Marić, M.; Šerbanović, S.P. Energy and economy savings in the process of methanol synthesis unsig Pinch technology. J. Serb. Chem. Soc. 2004, 69, 827–837. [Google Scholar] [CrossRef]
- Chen, Y.; Eslick, J.C.; Grossmann, I.E.; Miller, D.C. Simultaneous process optimization and heat integration based on rigorous process simulations. Comput. Chem. Eng. 2015, 81, 180–199. [Google Scholar] [CrossRef] [Green Version]
- Maréchal, F.; Heyen, G.; Kalitventzeff, B. Energy savings in methanol synthesis: Use of heat integration techniques and simulation tools. Comput. Chem. Eng. 1997, 21, S511–S516. [Google Scholar]
- Pautasso, E.; Osella, M.; Caroleo, B. Addressing the Sustainability Issue in Smart Cities: A Comprehensive Model for Evaluating the Impacts of Electric Vehicle Diffusion. Systems 2019, 7, 29. [Google Scholar] [CrossRef] [Green Version]
- Mohammadifardi, H.; Knight, M.A.; Unger, A.A. Sustainability assessment of asset management decisions for wastewater infrastructure systems—Implementation of a system dynamics model. Systems 2019, 7, 34. [Google Scholar] [CrossRef] [Green Version]
- Zhao, N.; Lehmann, J.; You, F. Poultry Waste Valorization via Pyrolysis Technologies: Economic and Environmental Life Cycle Optimization for Sustainable Bioenergy Systems. ACS Sustain. Chem. Eng. 2020, 8, 4633–4646. [Google Scholar] [CrossRef]
- Egieya, J.M.; Čuček, L.; Zirngast, K.; Isafiade, A.J.; Kravanja, Z. Optimization of biogas supply networks considering multiple objectives and auction trading prices of electricity. BMC Chem. Eng. 2020, 2, 1–23. [Google Scholar] [CrossRef] [Green Version]
- Vujanović, A.; Čuček, L.; Pahor, B.; Kravanja, Z. Multi-objective synthesis of a company’s supply network by accounting for several environmental footprints. Process Saf. Environ. Prot. 2014, 92, 456–466. [Google Scholar] [CrossRef]
- Loeschen, D. The Top 10 Chemicals Produced in the United States. Available online: https://www.mixerdirect.com/blogs/mixer-direct-blog/the-top-10-chemicals-produced-in-the-united-states (accessed on 26 November 2020).
- Aspen Technology Inc. Aspen HYSYS User’s Guide; Aspen Technology Inc.: Burlington, MA, USA, 2009. [Google Scholar]
- Smith, R. Chemical Process: Design and Integration; John Wiley & Sons: Chichester, UK, 2005. [Google Scholar]
- GreenDelta. OpenLCA V1.10.3. 2020. Available online: https://www.openlca.org (accessed on 21 December 2020).
- PubChem. Formaldehyde. Available online: https://pubchem.ncbi.nlm.nih.gov/compound/Formaldehyde (accessed on 21 August 2019).
- Millar, G.J.; Collins, M. Industrial production of formaldehyde using polycrystalline silver catalyst. Ind. Eng. Chem. Res. 2017, 56, 9247–9265. [Google Scholar] [CrossRef] [Green Version]
- GAMS Development Corporation. GAMS—Documentation. Available online: https://www.gams.com/latest/docs/gams.pdf (accessed on 29 November 2019).
- Papoulias, S.A.; Grossmann, I.E. A structural optimization approach in process synthesis—II: Heat recovery networks. Comput. Chem. Eng. 1983, 7, 707–721. [Google Scholar] [CrossRef]
- Jäschke, J.; Skogestad, S. Parallel Heat Exchanger Control. EU/UK Patent Application pct/ep2013/059304 and gb1207770.7, 7 November 2013. [Google Scholar]
- Seider, W.D.; Seader, J.D.; Lewin, D.R. Product & Process Design Principles: Synthesis, Analysis and Evaluation; John Wiley & Sons: New York, NY, USA, 2009. [Google Scholar]
- Hou, K.; Hughes, R. The kinetics of methane steam reforming over a Ni/α-Al2O catalyst. Chem. Eng. J. 2001, 82, 311–328. [Google Scholar] [CrossRef]
- Qian, M.; Liauw, M.A.; Emig, G. Formaldehyde synthesis from methanol over silver catalysts. Appl. Catal. A 2003, 238, 211–222. [Google Scholar] [CrossRef]
- Jenkins, S. 2019 Chemical Engineering Plant Cost Index Annual Average. Available online: https://www.chemengonline.com/2019-chemical-engineering-plant-cost-index-annual-average/ (accessed on 3 April 2020).
- Vatavuk, W.M. Updating the CE Plant Cost Index. Chem. Eng. 2002, 109, 62–70. [Google Scholar]
- Vanham, D.; Leip, A.; Galli, A.; Kastner, T.; Bruckner, M.; Uwizeye, A.; Van Dijk, K.; Ercin, E.; Dalin, C.; Brandão, M. Environmental footprint family to address local to planetary sustainability and deliver on the SDGs. Sci. Total Environ. 2019, 693, 133642. [Google Scholar] [CrossRef]
- Čuček, L.; Klemeš, J.J.; Varbanov, P.S.; Kravanja, Z. Significance of environmental footprints for evaluating sustainability and security of development. Clean Technol. Environ. Policy 2015, 17, 2125–2141. [Google Scholar] [CrossRef]
- Čuček, L.; Klemeš, J.J.; Kravanja, Z. A review of footprint analysis tools for monitoring impacts on sustainability. J. Clean. Prod. 2012, 34, 9–20. [Google Scholar] [CrossRef]
- Brownlie, W.; Spears, W.; Carmen, E.; Sutton, M. Managing our Human Phosphorus Footprint: The Greatest Phosphorus Sustainability Issue? Available online: https://www.phosphorusplatform.eu/images/Conference/ESPC2-materials/Brownlie%20poster%20ESPC2.pdf (accessed on 21 November 2020).
- Frischknecht, R.; Jungbluth, N.; Althaus, H.-J.; Bauer, C.; Doka, G.; Dones, R.; Hischier, R.; Hellweg, S.; Humbert, S.; Köllner, T. Implementation of Life Cycle Impact Assessment Methods; Citeseer: Dübendorf, Switzerland, 2007. [Google Scholar]
- ILCD Handbook. Analysis of existing Environmental Impact assessment methodologies for use in Life Cycle Assessment. Jt. Res. Cent.-Eur. Commun. 2010, 1, 21. [Google Scholar]
- Ecoinvent Version 3.6, 12th ed.; Ecoinvent: Zurich, Switzerland, 2019.
Figure 1.
Flowchart of performed steps in the study.

Figure 2.
Formalin production via methane steam reforming.

Figure 3.
Formalin production process.

Figure 4.
Grand composite curve of the process.

Figure 5.
Grid diagram for the heat-integrated process.
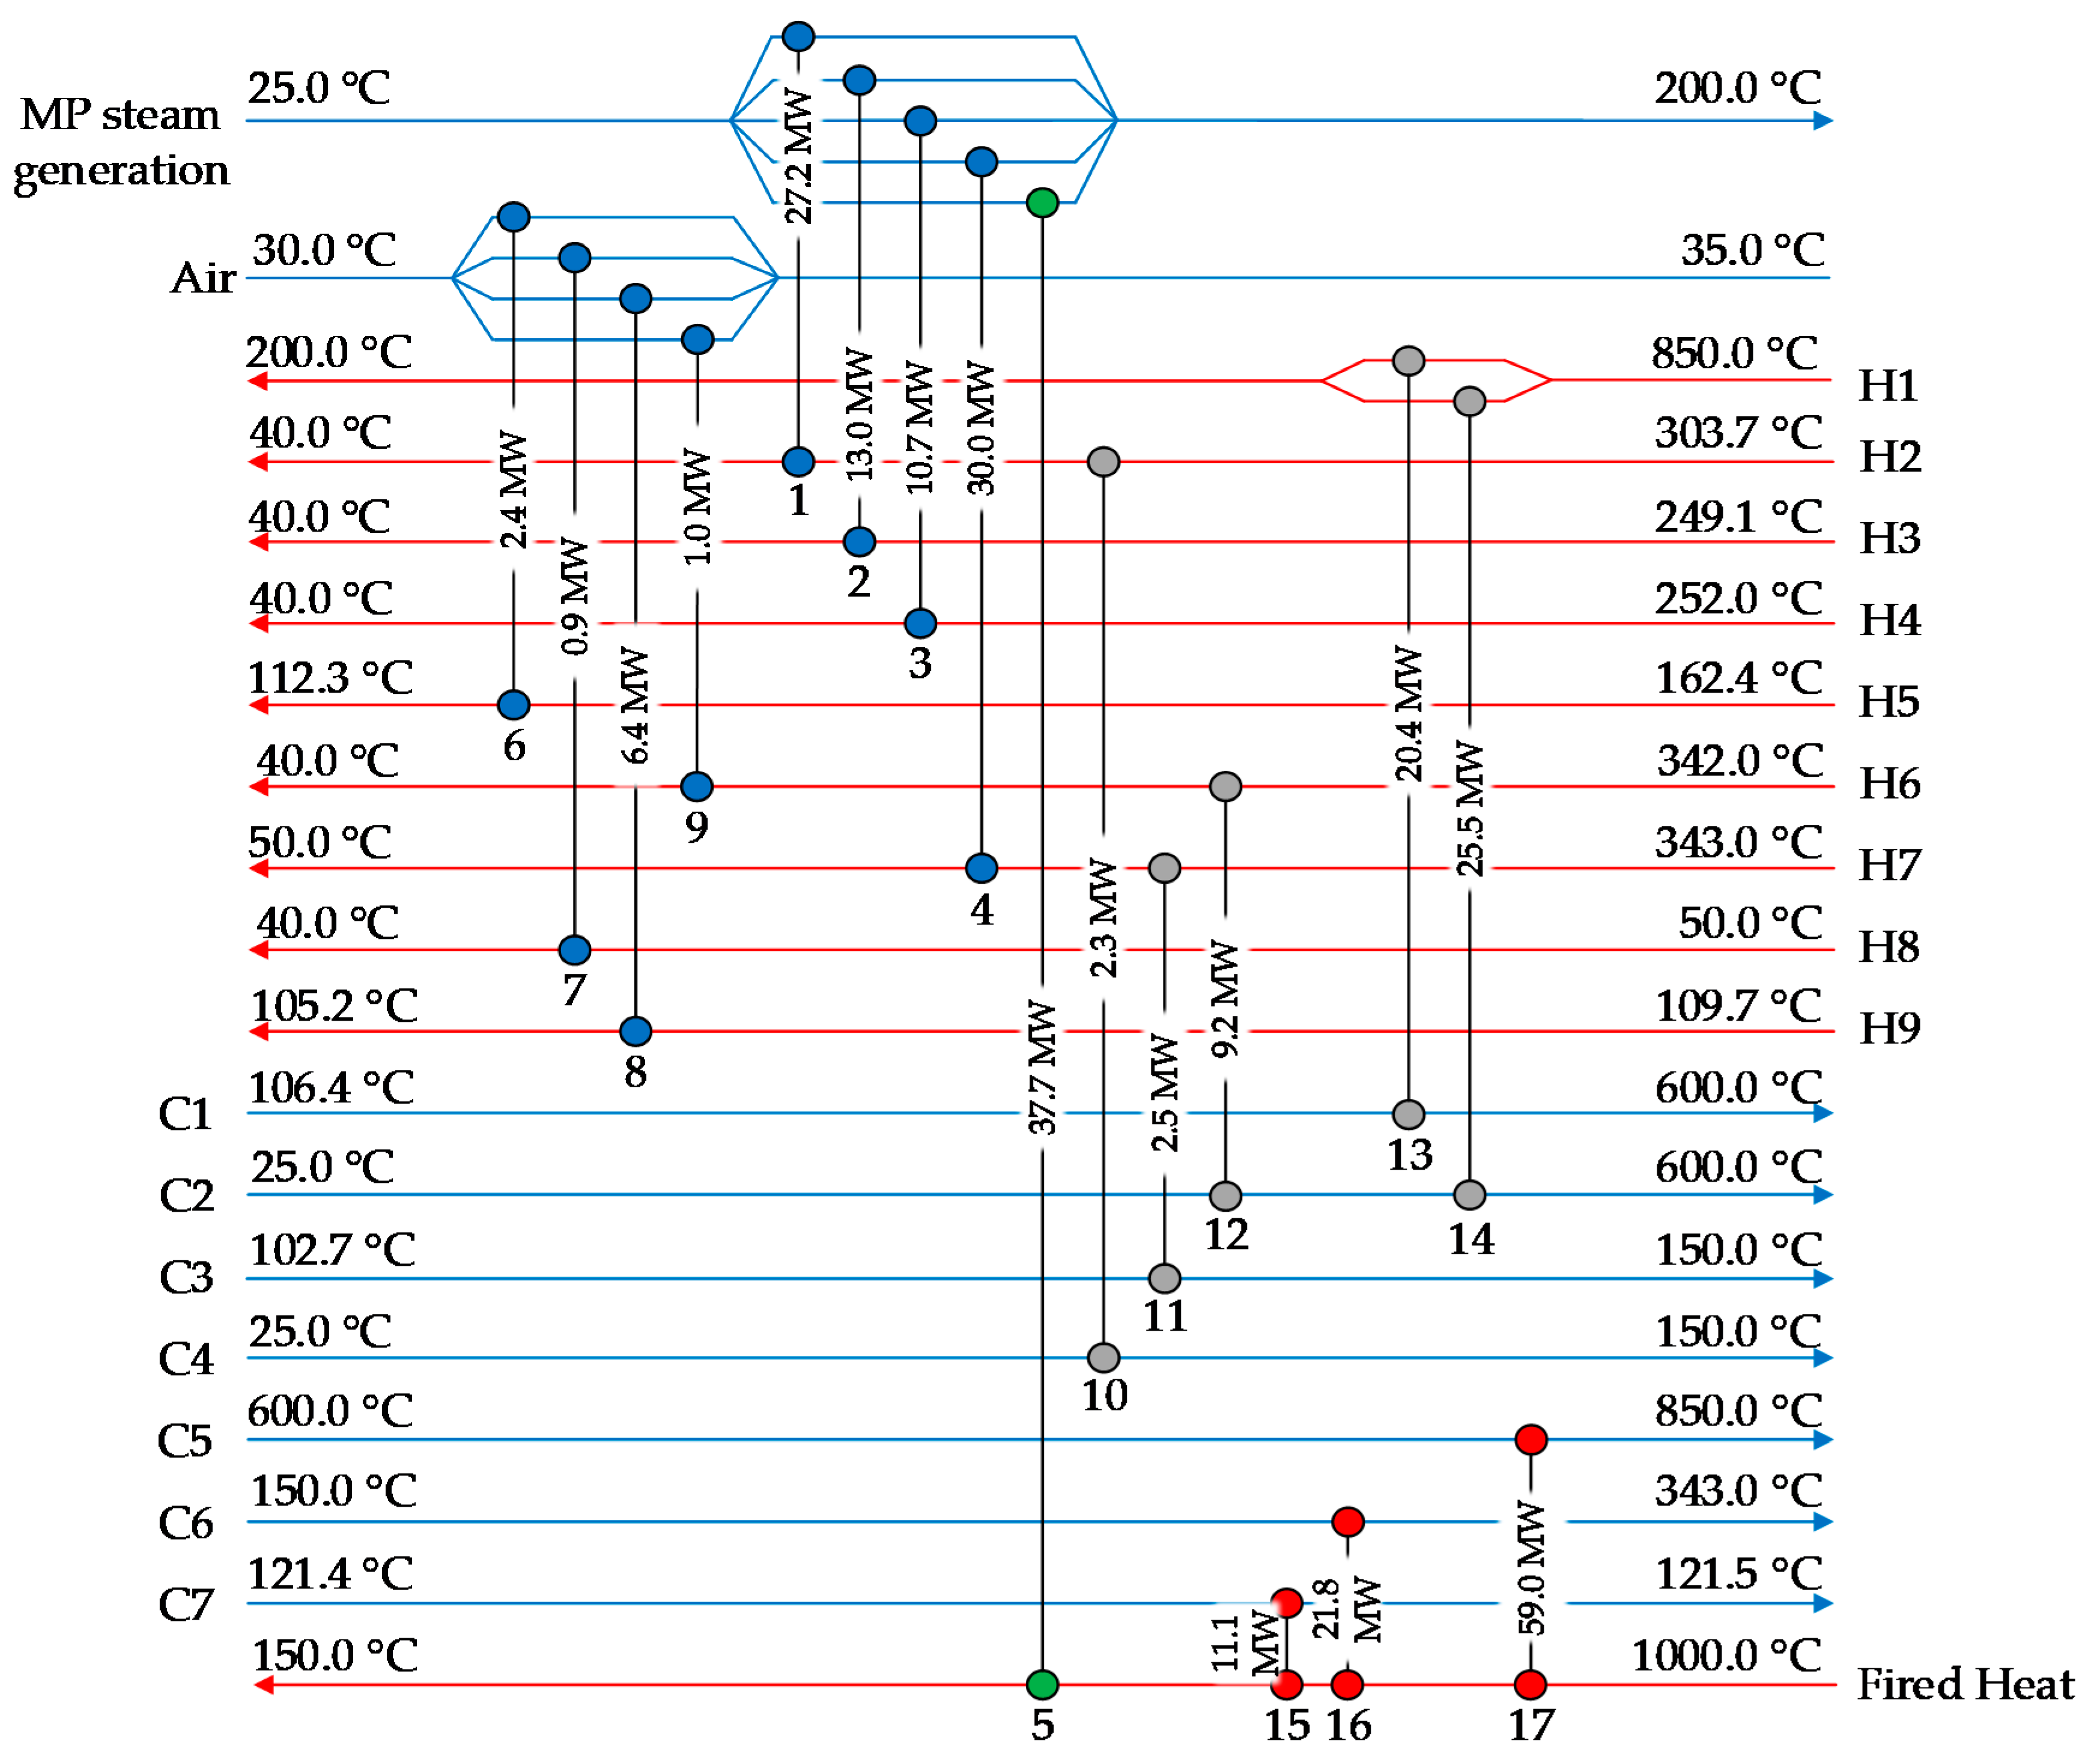
Figure 6.
Proposed formalin production process based on the heat integration.

Figure 7.
Cost contributions including utility revenue before (left) and after HI (right).

Figure 8.
Environmental footprints per t of formalin before and after HI.
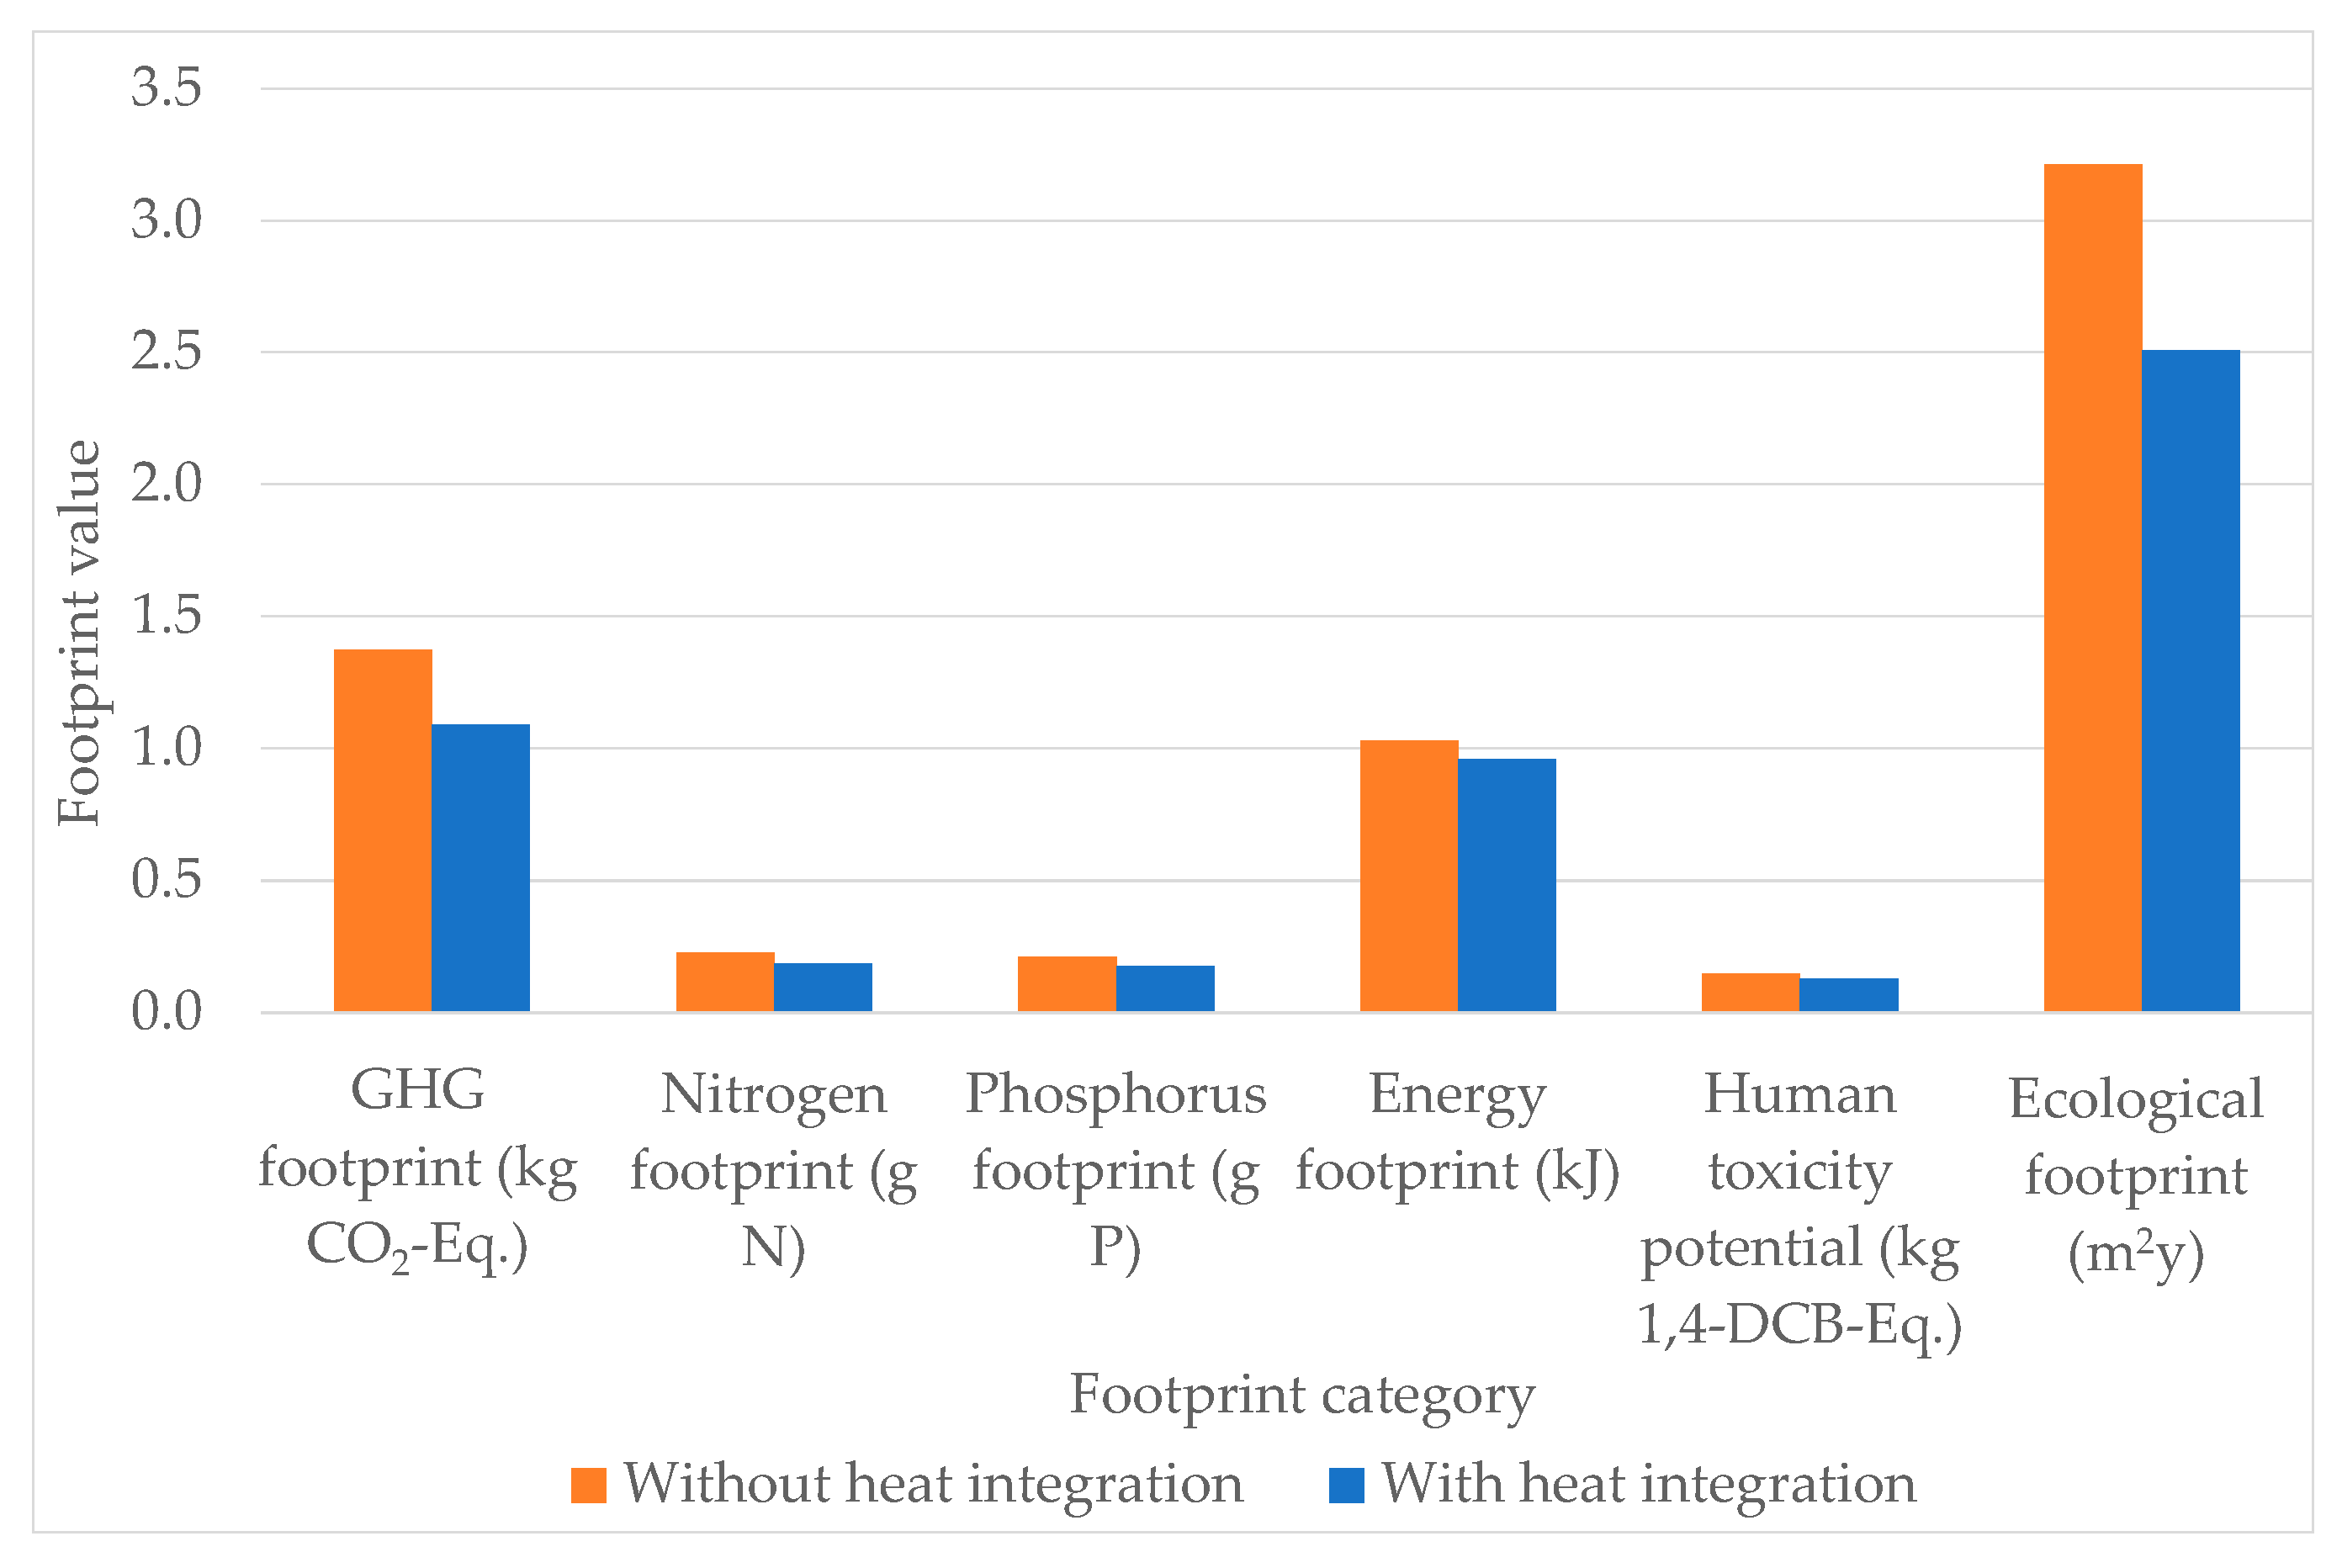
Figure 9.
Greenhouse gas (GHG) footprints per kg of formalin before and after HI.

Table 1.
Utility streams.
| Utility | Type | Tsupply (°C) | Ttarget (°C) | Heat Duty (MW) |
|---|---|---|---|---|
| Fired heat (FH) | Hot | 1000 | 150 | 151.7 |
| Air | Cold | 30 | 35 | 9.8 |
| MPS generation (MPSG) | Cold | 25 | 199 | 141.4 |
| 199 | 200 |
Table 2.
Problem table.
| Stream | Type | Tsupply (°C) | Ttarget (°C) | Heat Duty (MW) | Flowrate (t/h) |
|---|---|---|---|---|---|
| H1 | Hot | 850.0 | 200.0 | 45.9 | 79.2 |
| H2 | Hot | 303.6 | 40.0 | 29.5 | 79.2 |
| H3 | Hot | 249.0 | 40.0 | 13.0 | 53.3 |
| H4 | Hot | 252.0 | 40.0 | 10.7 | 53.3 |
| H5 | Hot | 162.4 | 112.3 | 2.4 | 49.7 |
| H6 | Hot | 342.1 | 40.0 | 10.2 | 19.0 |
| H7 | Hot | 343.0 | 50.0 | 32.2 | 109.1 |
| H8 | Hot | 50.0 | 40.0 | 0.9 | 68.0 |
| H9 | Hot | 109.7 | 105.2 | 6.4 | 14.5 |
| C1 | Cold | 106.4 | 600.0 | 20.4 | 44.5 |
| C2 | Cold | 25.0 | 600.0 | 34.7 | 34.7 |
| C3 | Cold | 102.7 | 150.0 | 2.5 | 44.5 |
| C4 | Cold | 25.0 | 150.0 | 2.3 | 65.4 |
| C5 | Cold | 600.0 | 850.0 | 59.0 | 79.2 |
| C6 | Cold | 150.0 | 343.0 | 21.8 | 109.1 |
| C7 | Cold | 121.4 | 121.5 | 11.1 | 63.6 |
Table 3.
Life cycle inventory (LCI) for formalin production process before and after heat integration (HI) per 1 kg of formalin.
Table 3.
Life cycle inventory (LCI) for formalin production process before and after heat integration (HI) per 1 kg of formalin.
| Parameter | Before HI | After HI | Unit |
|---|---|---|---|
| Inputs | |||
| Natural gas | 0.406 | 0.406 | kg |
| Steam | 0.874 | 0.874 | kg |
| Air | 0.002 | 0.002 | m3 |
| BFW | 4.803 | 3.676 | kg |
| Fired Heat | 4.814 | 2.782 | MJ |
| Electricity | 2.682 | 2.682 | MJ |
| Outputs | |||
| Gases to furnace 1 | 0.184 | 0.184 | kg |
| Fuel and air 2 | 1.671 | 1.671 | kg |
| Methanol 3 | 0.061 | 0.061 | kg |
| Steam | 6.639 | 4.955 | kg |
| Formalin | 1.000 | 1.000 | kg |
1 After combustion: 0.404 kg CO2, 0.922 kg H2O, 2 75.5 wt % N2, 2.6 wt % methanol, 2.5 wt % H2O, 2.4 wt % formaldehyde, 1.6 wt % O2, 3 36.7 wt % methanol, 63.2 wt % H2O.
Table 4.
Heat exchange matches obtained in the third HI step.
| Hot Stream | Cold Stream | Match | Heat Duty (MW) | U (kJ/h m2 °C) | Thot,in (°C) | Thot,out (°C) | Tcold,in (°C) | Tcold,out (°C) | ∆Tln (°C) | Area (m2) |
|---|---|---|---|---|---|---|---|---|---|---|
| H2 | MPSG | 1 | 27.2 | 683.5 | 283.1 | 40.0 | 25.0 | 200.0 | 39.8 | 4178.2 |
| H3 | MPSG | 2 | 13.0 | 683.5 | 249.1 | 40.0 | 25.0 | 200.0 | 28.8 | 2927.5 |
| H4 | MPSG | 3 | 10.7 | 683.5 | 252.0 | 40.0 | 25.0 | 200.0 | 29.8 | 2368.5 |
| H7 | MPSG | 4 | 29.7 | 683.5 | 320.0 | 50.0 | 25.0 | 200.0 | 60.6 | 3160.3 |
| FH | MPSG | 5 | 37.7 | 683.5 | 397.3 | 150.0 | 25.0 | 200.0 | 158.4 | 1318.2 |
| H5 | Air | 6 | 2.4 | 257.0 | 162.4 | 112.3 | 30.0 | 35.0 | 103.2 | 324.6 |
| H8 | Air | 7 | 0.9 | 257.0 | 50.0 | 40.0 | 30.0 | 35.0 | 12.3 | 1111.4 |
| H9 | Air | 8 | 6.4 | 257.0 | 109.7 | 105.2 | 30.0 | 35.0 | 74.9 | 1202.8 |
| H6 | Air | 9 | 1.0 | 257.0 | 69.1 | 40.0 | 30.0 | 35.0 | 19.6 | 715.3 |
| FH | C7 | 15 | 11.1 | 257.0 | 470.0 | 397.3 | 121.4 | 121.5 | 310.8 | 601.7 |
| FH | C6 | 16 | 21.8 | 257.0 | 612.9 | 470.0 | 150.0 | 343.0 | 294.2 | 1248.4 |
| FH | C5 | 17 | 59.0 | 257.0 | 1000.0 | 612.9 | 600.0 | 850.0 | 55.9 | 17,809.7 |
| Total utility consumption | 183.1 | |||||||||
| H2 | C4 | 10 | 2.3 | 41.4 | 303.7 | 283.1 | 25.0 | 150.0 | 201.4 | 1006.8 |
| H7 | C3 | 11 | 2.5 | 692.5 | 343.0 | 320.0 | 102.7 | 150.0 | 204.9 | 64.3 |
| H6 | C2 | 12 | 9.2 | 360.0 | 342.0 | 69.1 | 25.0 | 177.7 | 91.4 | 1208.7 |
| H1 | C1 | 13 | 20.4 | 360.0 | 850.0 | 164.7 | 106.4 | 600.0 | 131.7 | 1875.8 |
| H1 | C2 | 14 | 25.5 | 360.0 | 850.0 | 225.7 | 177.7 | 600.0 | 122.4 | 2400.1 |
| Total heat exchanged | 59.9 | Total area | 43,522.2 | |||||||
Table 5.
Breakdown of economic analysis results before and after HI.
| Parameter | Before HI | After HI | Reduction (%) |
|---|---|---|---|
| Heat exchange area (m2) | 45,045 | 43,522 | 3.4 |
| Heat exchanger cost (EUR) | 12.0 × 10⁶ | 8.4 × 10⁶ | 29.5 |
| Purchased equipment cost (EUR) | 32.3 × 10⁶ | 28.8 × 10⁶ | 10.9 |
| Installed equipment cost (EUR) | 84.6 × 10⁶ | 75.4 × 10⁶ | 10.9 |
| Total capital investment (EUR) | 141.3 × 10⁶ | 125.8 × 10⁶ | 10.9 |
| Utility revenue (EUR/y) | 8.8 × 10⁶ | 29.4 × 10⁶ | |
| Total annual cost (EUR/y) | 16.1 × 10⁶ | −7.2 × 10⁶ |
Table 6.
Reductions of evaluated environmental footprints and human toxicity potential.
| Footprint Category | Before HI | Reduction after HI (%) |
|---|---|---|
| GHG footprint (kg CO2-eq.) | 1.372 | 21% |
| Nitrogen footprint (g N) | 0.226 | 18% |
| Phosphorus footprint (g P) | 0.213 | 18% |
| Energy footprint (kJ) | 1.028 | 7% |
| Human toxicity potential (kg 1,4-DCB-eq.) | 0.148 | 12% |
| Ecological footprint (m2·y) | 3.211 | 22% |
Publisher’s Note: MDPI stays neutral with regard to jurisdictional claims in published maps and institutional affiliations. |
© 2021 by the authors. Licensee MDPI, Basel, Switzerland. This article is an open access article distributed under the terms and conditions of the Creative Commons Attribution (CC BY) license (http://creativecommons.org/licenses/by/4.0/).
Share and Cite
MDPI and ACS Style
Puhar, J.; Vujanović, A.; Awad, P.; Čuček, L. Reduction of Cost, Energy and Emissions of the Formalin Production Process via Methane Steam Reforming. Systems 2021, 9, 5. https://0-doi-org.brum.beds.ac.uk/10.3390/systems9010005
AMA Style
Puhar J, Vujanović A, Awad P, Čuček L. Reduction of Cost, Energy and Emissions of the Formalin Production Process via Methane Steam Reforming. Systems. 2021; 9(1):5. https://0-doi-org.brum.beds.ac.uk/10.3390/systems9010005
Chicago/Turabian StylePuhar, Jan, Annamaria Vujanović, Peter Awad, and Lidija Čuček. 2021. "Reduction of Cost, Energy and Emissions of the Formalin Production Process via Methane Steam Reforming" Systems 9, no. 1: 5. https://0-doi-org.brum.beds.ac.uk/10.3390/systems9010005
Note that from the first issue of 2016, this journal uses article numbers instead of page numbers. See further details here.