1. Introduction
Population growth and the increasing demand for energy, especially fossil fuels, has led to a deterioration of the environment. This deterioration over the last decade has become a major concern and a current challenge for scientists and communities. Researchers have focused on obtaining suitable alternative energy sources to eliminate fuel dependencies and environmental damage and to reduce the impact of global warming [
1]. Because it is necessary to minimize the deterioration of the environment by alleviating carbon dioxide, biomass, one of the oldest sources of energy, is being widely used as a main source of heat and energy production today. Biomass is defined as the organic substances available in the environment that are capable of supporting life including plants, animals, or microorganisms [
2]. The biomass matter known as feedstock includes both the above and below ground tissues of plants [
3] and can be firewood from forestry residue such as trees, energy crops like sorghum, miscanthus, kenaf, switchgrass, corn, and sugarcane or agricultural residues such as corn stover and wheat straw [
4]. Biomass, which is an abundant, green, sustainable, and renewable generator of heat, biofuel, or a combination of both [
5], holds considerable promise in the current economy and is beneficial to the environment [
6]. In addition, biomass reduces fuel dependency, wastes and residues, and lessens climate change by minimizing the emission of toxic gases [
7]. Given these benefits and the possibility of using future biomass energy, the current biomass industry faces several challenges that hinder the durability and sustainability of energy generated by the biomass.
Environmental, technical, financial, social, political, and organizational issues are some of the existing challenges that hinder the production of biomass energy [
8]. The sustainable use of natural resources is an example of a current environmental challenge [
8,
9,
10]. Another environmental challenge is how to offset the buildup of emissions due to activities involved in the biomass [
8,
11]. Technical challenges include the uncertainties facing conversion facilities and related bioengineering investments, barriers created by high capital costs as well as the issues related to emerging conversion technologies, which suffer from uncertainties. These uncertainties cause a lack of insurability in the bioengineering investments and uncertainty in their rate of return [
8,
12,
13,
14]. An example of the policy and regulatory challenges is the effect of fuel tax on transport in the biomass supply chain [
8,
15]. With these challenges and others cited in the literature, it is necessary to further explore the biomass industry since it presents a potential solution to energy dependency. Since there are different processes used to produce biomass energy, it is important to select the most suitable decision-making tools. These tools help practitioners to select the most advantageous pelleting process using predefined factors that can be related to technology, the environment, finances, or some other dynamic constraints like price and reliability [
8,
16,
17].
This study aims to fill a gap in the literature by comparing three existing biomass pelleting processing depots: conventional pelleting process (CPP), ammonia fiber expansion pelleting process (AFEX), and high moisture pelleting process (HMPP). The comparison involves four different attributes that the literature considers to be the most critical in a biomass depot; the attributes are total capital investment cost, emissions, transportation, and preprocessing costs. The researchers believe this analysis will help practitioners in evaluating the three different processes and will result in selecting the best process for the biomass depot. The study used the preference selection index (PSI), an advanced method introduced by Mania and Bhatt in 2010 [
18] to compare the three distinct depot configurations. PSI is the most suitable decision-making tool because unlike other tools, it is capable of handling the multiple conflicting criteria that can influence the selection of the best pelleting process. Another advantage of using the PSI is that it does not require the use of weights for the criteria nor their relative importance [
18]. The PSI and many other multi criteria decision making tools are commonly used as they have numerous areas of use. The method has been used to select the most suitable material [
19], the preferred machine using ranking and outranking tools [
20], and the best “non-traditional machining process using analytic network” [
21].
A survey of the literature is presented below in
Section 2. The intent is to describe the importance of the biomass pelleting process depot selection and position the contribution of the study within the literature. In
Section 3, the problem statement with the identification of the used factors is presented, followed by
Section 4, which provides a detailed discussion of the multi-criteria decision-making tools used for the comparison/selection of the best alternative.
Section 5 and
Section 6 discuss the methodology and the results follow the validation of the tool used in the analysis. The study ends with concluding thoughts and future research arenas.
2. Review of the Literature
In the past few years, researchers have focused on bioenergy and ways to develop it. Biomass provides a potential energy source as it is renewable and involves exploiting natural residues such as wood residues that are available all year around [
22] or those that are seasonally available such as corn-stover (available seasonally every year from September to November) [
23]. The biomass can be transformed into different types of fuel states such as solid, liquid, or gas and is considered to be a clean “green” and “renewable carbon” resource [
24]. With the increasing energy demand, there is now a growing interest in the area of biomass energy. This section of the research summarizes the literature related to this study.
Table 1 provides a summary related to different sources relevant to biomass research.
Throughout the recent literature, different research has shown the linkage between biomass and supply chain. For example, [
25] introduced an optimization model that integrated the costs and emissions of a supply chain. In a similar study, [
23] proposed a math model to manage and reduce the cost and emissions of pellet processing depots. Their optimization model was developed to provide decision makers with economic and environmental insights pertaining to supply chain networks. Ref. [
26] discussed the economic aspect of biomass depots by analyzing the economic cost, and [
27] studied the supply chain disruption of biomass through the development of an optimization model. Ref. [
28] used the life cycle assessment (LCA) method to evaluate the environmental effect resulting from the pelleting process in a biomass depot. Ref. [
29] also considered the use of (LCA) to determine and evaluate the environmental impact of the energy of a bioenergy system. A study by [
30] used the Taguchi–Grey relational analysis as a tool to determine the optimal process to obtain an optimal quality pellet.
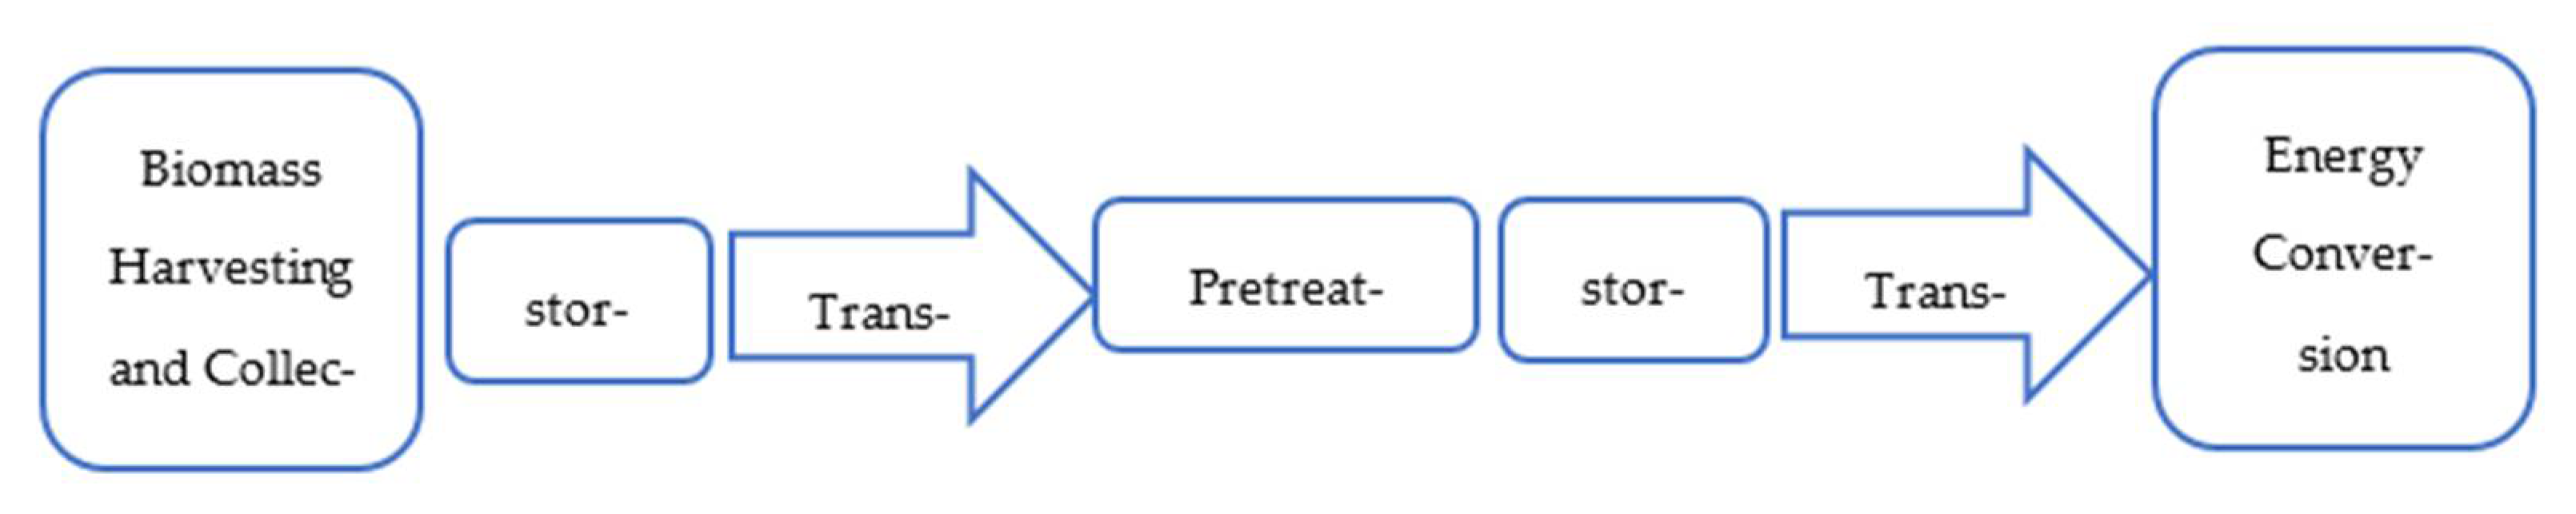
The biomass energy process consists of multiple production stages that can differ depending on various factors such as the nature and quantity of biomass, the environmental standards, and the financial resources [
8,
12]. As illustrated in
Figure 1, the supply chain for bioenergy components are biomass procurement, storage, transportation from the supply sites to the depot, pre-treatment, and conversion to energy. The processing of biomass in the depot can vary depending on the feedstock and its availability. The three main steps involved with biomass are the pre-process, treatment, and densification [
23]. The densification step of biomass produces the pellets from the biomass; it includes three stages consisting of “pre-pelletization, pelletization, and post-pelletization” [
31]. The pellet process is necessary to facilitate transportation and augment the energy of the biomass [
32]. The conventional pelleting process, the high moisture pelleting process, and the ammonia fiber expansion process [
23] are three main alternative processes for biomass depot pelleting.
The CPP pelleting process uses a rotary dryer as a first step to reduce the particles to 50 mm before passing through a second stage to further decrease their size to 52 mm. The CPP is mainly used for forest residue [
23,
26]. The HMPP pelleting process, consisting of preheating and palletization, is used as an additional step to enhance the CPP. To better reduce the moisture content and further stabilize the pellets, the pellets are usually dried vertically [
23,
26]. The HMPP process is frequently used in the biomass industry that delivers large batches such as herbaceous material including corn-stover [
23]. Finally, the AFEX pelleting process, which provides a high level quality pellet, uses an ammonia-based process [
26]. During the pretreatment of the biomass, the glucan and xylan conversion increases, making the produced pellets suitable and attractive for animal feed [
23]. The AFEX pelleting process is considered a dry-to-dry process since no watercourse is produced during the process [
23]. The HMPP is mainly used for pelleting corn-stover and miscanthus.
Despite the advantages biomass brings to energy demand, there are still challenges that need to be addressed. These challenges are numerous since the biomass or biofuel supply chain encounters many uncertainties due to supply, demand, and development of technology [
25]. Although Mafakheri and Nasiri used six groups to classify challenges to biomass use, our study focused on three main classifications: the environmental, the technical, and the financial. The environment challenge is ensuring the sustainability of the renewable energy with regard to the use of the natural resource [
8,
9,
10]. The environmental issue is the focus of several research studies undertaken to determine and evaluate the impact that can result from biomass energy production [
29]. The second challenge of the biomass is technical and is related to the insecurities surrounding the conversion facilities and the bioenergy profits [
8,
12,
13]. The third challenge is financial and involves the limits due to high capital costs [
8,
14]. In addition to these challenges, there are policy and regulatory challenges that can influence biomass development. One of these policies is the fuel tax on biomass transport [
8,
15], an important consideration that is often neglected in assessing transportation costs in the biomass supply chain.
Strategic, tactical, and operational decision making-processes are integrated in the supply chain of the biomass to determine the overall system performance and provide better solutions to the current supply chain problems [
22]. The determination and comparison of the optimal available pelleting process in conjunction with the environmental, technical, and financial challenges has received less attention in the literature. The demand for biomass, especially for wood pellets, has increased significantly in recent years [
33]. This specific increase is due to the importance of the biomass being used for different purposes such as heating. The study of [
34] showed that the future demand for wood pellets will increase even further, creating a new market. As the literature substantiates the importance of biomass pellets, an economic review is needed to compare the three main pelleting processes used in biomass depots.
Table 1.
Existing themes in the literature.
Table 1.
Existing themes in the literature.
| Author | Application | Approach |
|---|
| Lamer et al. (2015) [26] | Biomass depot | Economic analysis (using plant cost index from chemical engineering magazine |
| Quddus et al. (2017) [23] | Biomass processing and densification depot in Mississippi and Alabama as testing ground | Two stage stochastic mixed-integer linear programming |
| Marufuzzaman et al. (2014) [25] | Biodiesel supply chain (case study from Mississippi) | Two stage stochastic programming model for biodiesel supply chain |
| Maheshwari et al. (2017) [27] | Biomass supply chain disruption during design stage (2 case studies in Southern Illinois) | Optimization model with Generic Model |
| Moran. et al. (2006) [35] | Biomass pellet production plant in Galicia (northwest Spain) | Grey Relational Analysis |
| Ng, R.T., and Maravelias, C.T. (2017) [36] | Model for selecting and allocating biomass technologies and capacity planning for the case of a regional depot and biorefineries | Mixed-integer linear programming (MILP) |
| Paletto et al. (2019) [29] | Environmental impacts of biomass power plants in northern Italy | Life Cycle Assessment (LCA) |
| Attri and Grover (2015) [37] | Comparison of different methods to the PSI | Preference selection index method |
| Thapa and Engelken (2020) [30] | Biomass samples from farmers in Mississippi, Craighead, and Greene Counties in northeast Arkansas | Taguchi-based Grey relational analysis, ANOVA |
| Kylili, Christoforou, Fokaides (2016) [28] | Pelleting process of olive husk and the waste of biomass in Cyprus | Life Cycle Assessment |
Most studies used traditional approaches to optimize the supply chain such as the classical two stage stochastic mixed integer method. Various decision-making tools such as life cycle assessment (LCA), ANOVA, and PROMETHEE were used to study the biomass depot (
Table 1). The current study was data driven and uses an effective decision-making method for the selection called the preference selection method (PSI). The PSI is a multi-criteria decision making tool especially suitable during the design stage of a production system [
37]. The PSI method can be used as a decision tool for facility layout design selection [
38]. In addition to the preference selection index method, the Grey relational analysis (GRA) was used to validate the results obtained from the performance of the PSI. The selection of the most appropriate and cost-effective pelleting process for a biomass depot is the current concern of the biomass industry. To the best of our knowledge, previous comparison research studies have been limited to stating the different costs related to the pelleting process. This study addresses this research gap and uses the preference selection index method and Grey relational analysis to compare the three alternative ways to process pellets.
3. Problem Statement and Attribute Selection
The current study solves a multi criteria decision making problem associated with the three different types of biomass pellet processing. The three processes were categorized according to their different attributes. The alternative factors were selected according to the cited challenges facing biomass. Four attributes were defined: (1) total capital investment cost, (2) emissions data, (3) transportation costs, and (4) preprocessing costs.
The total capital investment cost: A biomass depot consists of multiple operations requiring buildings and different equipment like grinders, hammer mills, and conveyors [
23,
39]. The total fixed cost is based on the equipment purchase and installation costs. These costs represent the largest portion of the total investment besides other expenses that can directly or indirectly impact the total investment. Direct costs include infrastructure, buildings and piping systems, while indirect costs include the engineering and the contingency of the biomass [
26].
Table 2 shows the total investment cost of different biomass densification depots [
23].
The emissions data: The emissions data are the emissions of CO
2/kWh produced by the transportation system used to transport the biomass from the supply sites to the depot and back from the depot to the market. As proposed by [
23], only the emissions due to truck transportation were considered in the emissions data.
Table 3 shows the emissions data parameter of the three different densification depots [
23].
The transportation cost: The transportation cost of the biomass is an important factor to consider since the cost of the energy produced by the biomass is much smaller than the cost of transporting it [
40]. In addition, because of the massive, bulky nature of biomass, it is difficult to transport from one place to another, along with moving the biofuel that may require delivery by rail, truck, and barge [
41,
42]. According to [
41], a larger amount of ethanol was shipped by rail and truck than barge in Mississippi. Ref. [
40] defined the transportation cost as the cost related to moving the biomass to the processing plant and taking the produced energy from the plant to the market. The transportation cost is directly linked to the plant’s location, which according to [
40] can be affected by economic and non-economic factors. Economic factors include constructing and operating costs in a specific location, while non-economic factors include the congestion and possible emissions. The cost of transportation includes two cost components: (1) the distance variable cost (DVC) that is directly dependent on the distance traveled and the transportation mode between the supply chain, depot, and the market location, and (2) the distance fixed cost (DFC) that is independent of the distance traveled and depends on the type of transported mass along with the equipment used. In Mississippi, the transportation modes used for shipping the biomass and biofuel are rail, truck, and barge [
41]. For ease of computation and considering the short distances between the supply site, depot, and market, this study considers the truck as the means of transportation for biomass. Furthermore, in their 2020 study, [
43] reported that transporting biomass with trucks was deemed to be the least expensive and most flexible alternative. The cost of transporting biomass by truck can be estimated using Equation (1) [
23,
44].
Table 4 summarizes the parameters and values related to transportation costs.
Table 5 represents the estimated traveling distance
for the three different pelleting processes.
The preprocessing cost: The preprocessing cost according to Jacobson et al. includes two types of costs: the ownership cost and the operating cost. The ownership cost includes interest and depreciation and depends on the purchase price of equipment, the annual interest rate, the life of the equipment, and the salvage value. The ownership cost also includes the insurance, housing, and taxes related to the equipment and are estimated as a percentage of the purchase price. The operation cost consists of all costs that ensure that the equipment and machines are operating and includes repair, maintenance, and labor costs (2014).
Table 6 summarizes the preprocessing cost, adopted from [
45], of the three pelleting processes.
4. The Preference Selection Index (PSI) Method
In everyday life, there are many problems that require the use of multi-criteria decision making (MCDM) tools in order to arrive at the most suitable solution. Though on a much more complex level, the biomass industry also deals with problems that readily lend themselves to MCDM applications to deal with the uncertainties, attributes, and criteria associated with the decision making process. Although there are many MCDM tools, most of them involve complex computations and require the determination of relative importance and the assignment of the attributes’ weights. On the other hand, the PSI method, introduced by [
38], is a very effective method in determining the relative importance between the different attributes [
37] and has the further major advantage of not requiring the assignment of relative importance [
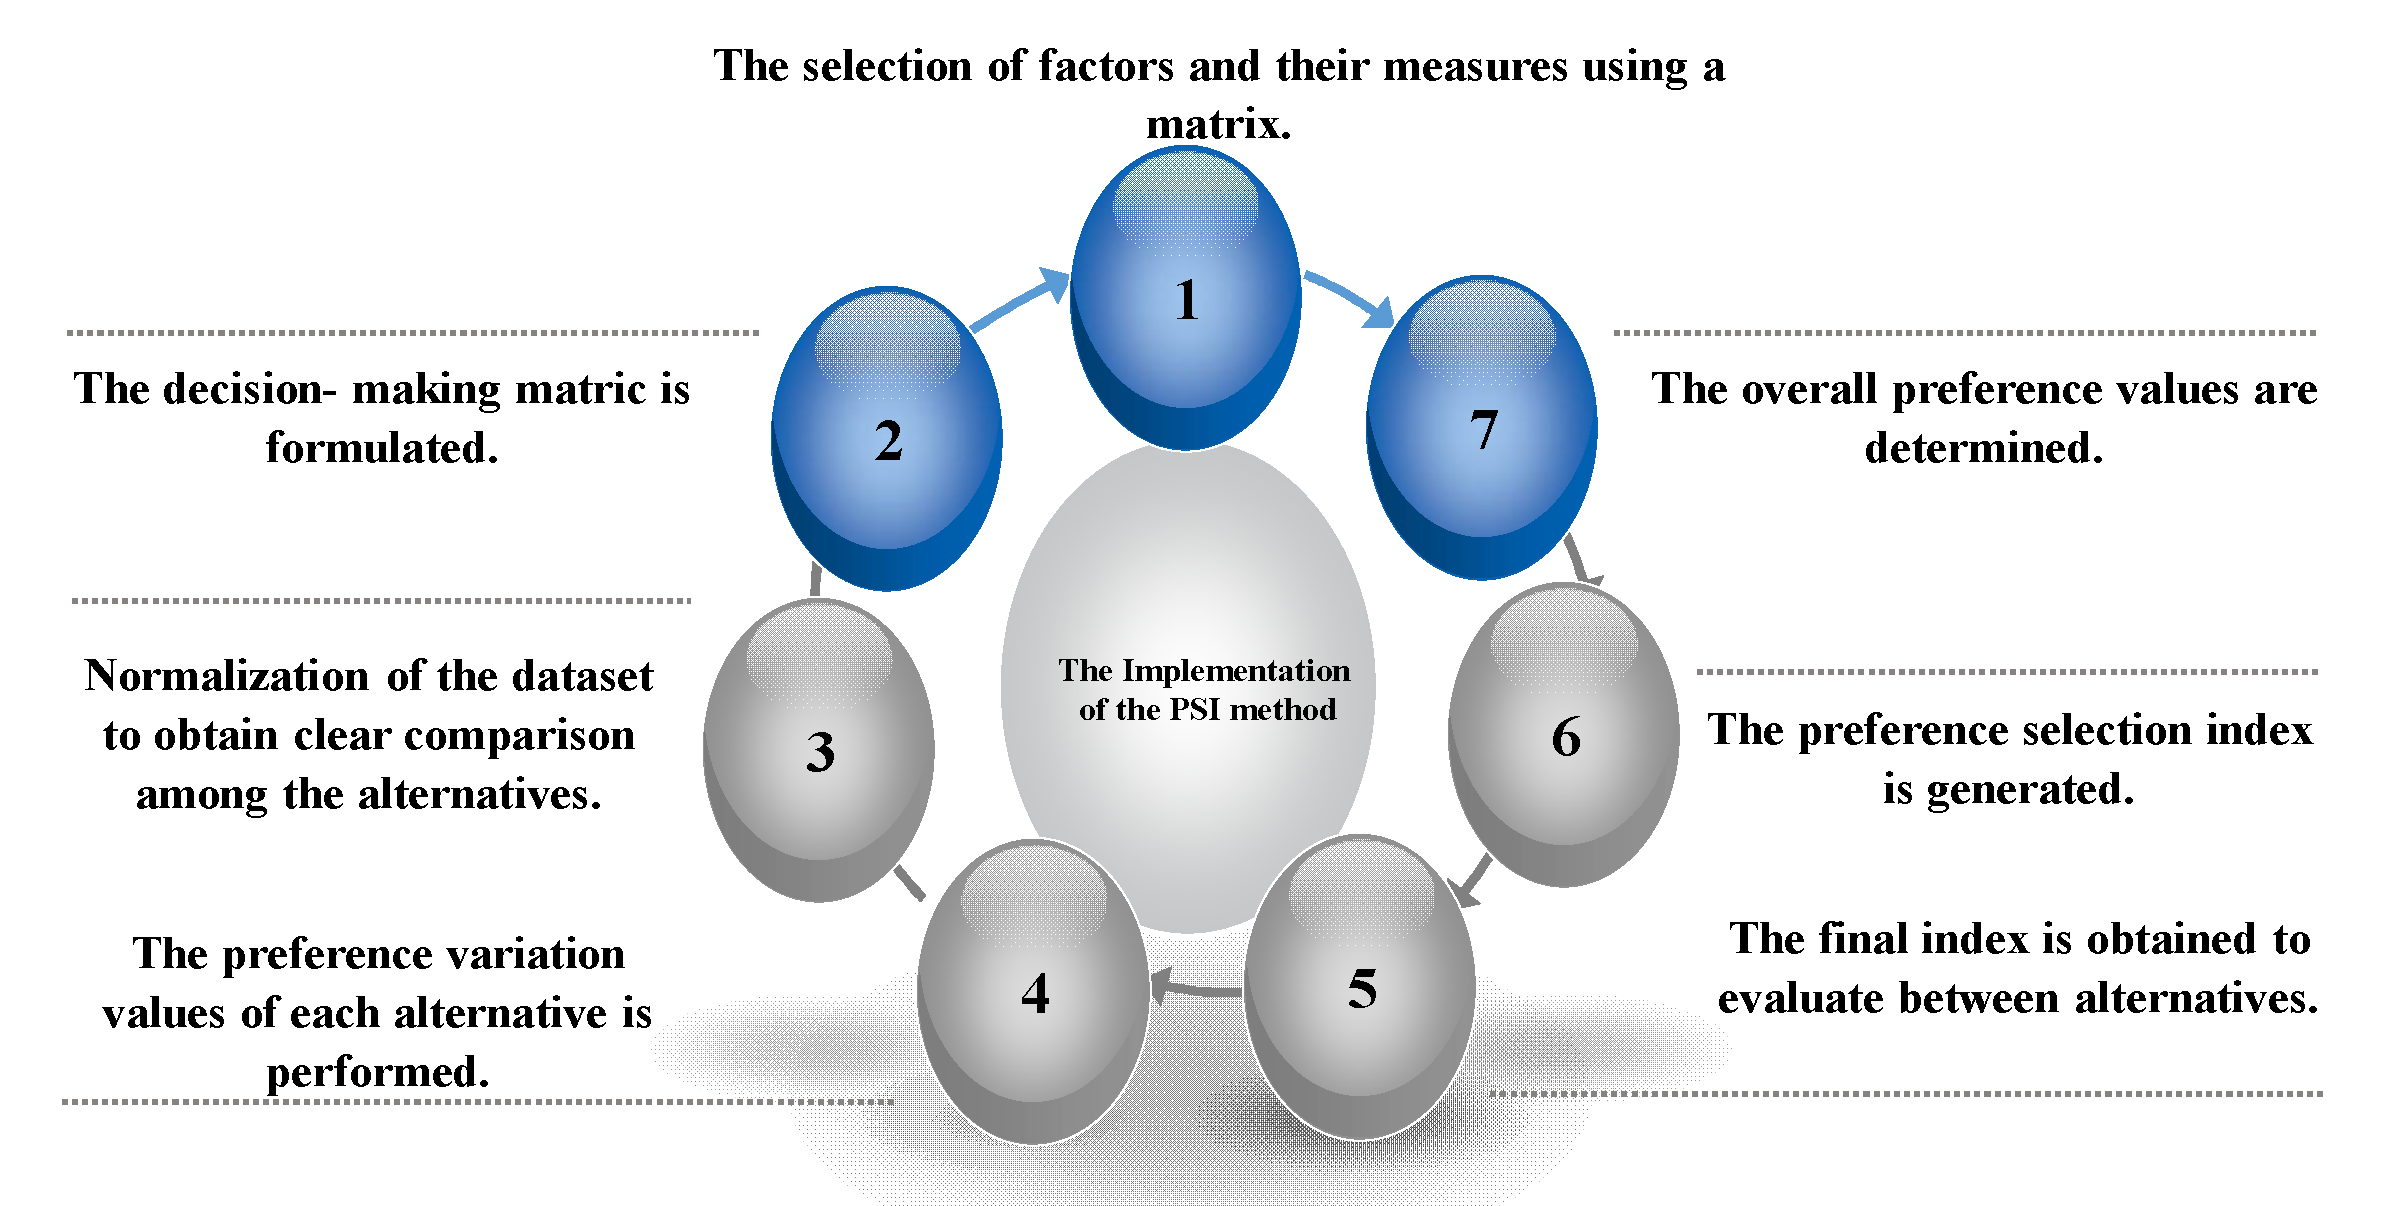
38]. The preference selection index method proceeds as follows. First, the attributes and alternatives are identified. Second, the decision matrix is formulated in a way that the rows represent the alternatives and the columns represent the attributes. Third, the matrix is normalized to convert the matrix into a “compatible unit” [
38], depending on the needs. The expectancy may be different, if it is related to cost (the smaller the better), or related to profit (the larger the better). Fourth, the relative preference variation to each criterion is computed. Fifth, the overall preference value relative to each alternative is determined overall. Next, the preference selection index related to each alternative is obtained, and finally, the best alternative is deducted by comparing the relative preference index obtained from previous steps. The highest value of the preference selection index will be chosen as the best alternative [
38]. The steps for PSI implementation are detailed below (see
Figure 2):
- Step 1:
In the first step of PSI, we configure the decision-making matrix that includes the criteria and alternatives selection or specifically select the factors and their measures. This step clarifies the objective of the problem.
- Step 2:
Next, the decision matrix is formulated. The multi-criteria decision making matrix is a matrix of dimension () where represents the alternatives and represents the criteria. Let be the alternatives for and .
- Step 3:
In this step, we perform data normalization. The method normalizes data in such a way that the attribute values will range between and . It is necessary to measure all criteria in a dimensionless unit in order to make the comparison easier. The obtained normalized matrix is denoted as .
Data normalizing is done following one of two approaches depending on the aim of the study:
- (i)
If the goal of the study is the smaller-the-better, in other words, the cost, then the following normalization method is used:
- (ii)
If the goal of the study is the larger-the-better, in other words the profit, then the following normalization method is used:
for which
is the criteria values
, and
.
- Step 4:
In this step, we calculate the preference variation values for each alternative . The obtained normalized matrix is used to compute the attributes’ preference variation value.
Preference variation
is done by using the two following equations:
where
denotes for each alternative its normalized value and
denotes for each alternative its preference value.
- Step 5:
In this step, we determine the overall preference value, . This step requires computing first the deviation , then obtaining the total preference values relative to each criterion.
The computations are performed with the following equations:
where
denotes for each attribute its deviation and
denotes for each attribute its overall preference value.
- Step 6:
In this step, we obtain the final preference selection index relative to each alternative. This step assigns an index value to each alternative to be compared.
The preference selection index is found using the following equation:
- Step 7:
In this final step, after all the computations are performed from steps 1–6, we obtain the final index allocated to each alternative to be evaluated. We can compare the final score of all alternatives, and rank them so that the best alternative is the alternative with the highest Index value .
5. Results and Analysis
As shown below, different phases are performed to execute the PSI method.
- Phase 1:
Selection and formulation of the decision problem:
The first step in the method requires the identification of the different alternatives to be used in the selection along with their criteria or factors. The criteria of the alternatives are independent of each other as proposed by Mukesh (2019).
The index j refers to the different factors: total investment cost, emissions data, transportation cost, and preprocessing cost. Therefore, j = {1, 2, 3, 4}.
- Phase 2:
Construction of the decision matrix:
The second step of the method relates to finding the quantification of all attributes and factors for all different alternatives.
Table 7 presents the decision matrix.
- Phase 3:
Construction of the normalized decision matrix:
The third step requires construction of the normalized decision matrix. For the normalization, the interest is to have smaller values since all the used factors are costs. Therefore, the computation is preformed using Equation (2):.
Table 8 shows the normalized decision matrix.
- Phase 4:
Calculation of the preference variation
The fourth step of the method consists of calculating the preference variation . By using Equation (5), we obtain the following results: = 0.202, = 0.0146, = 0.0824, = 0.201.
- Phase 5:
Calculation of preference value
The fifth step of the method requires the computation of the preference value Ψ for each attribute. This requires Equations (6) and (7). Completing the equation, we obtain the following results:
For the deviation = 0.798, = 0.985, = 0.918, = 0.799.
For the preference value = 0.228, = 0.282, = 0.262, = 0.228.
- Phase 6:
Computation of the preference index
This final step of the method evaluates the overall preference selection index (). The value obtained in this section allows for the ranking of the alternatives. We calculated the index with Equation (8) and obtained the following results: = 0.799, = 0.627, = 0.869. Ranking the three different pelleting processes from maximum to minimum value of preference selection index, we determined that CPP is the best alternative followed by HMPP and then AFEX. Analysis shows that CPP and HMPP are the most suitable alternatives.
6. Results Validation
To validate the case study results from the PSI, we used another well-known multi criteria decision making method called the GRA (readers can refer to
Appendix A for further details on this methodology). The three steps of the GRA validation process are presented below.
In this first step, the construction of the normalized matrix is performed. Similar to step 3 from the PSI method, the aim is to have smaller values. The normalization is calculated using Equation (A2):.
The normalized matrix is presented in
Table 9.
This step involves computing the deviation sequence using the formulas
The results from this step are presented in
Table 10.
In addition to computing the deviation sequence, step 2 also involves computing the Grey relational coefficient using Equation (A3):
. The results are presented in
Table 11.
In the final step, we need to compute the Grey relation grade. The Grey relation grade allows for the ranking of three available alternatives. The computation is performed by using Equation (A4) . The following results were obtained: ,, .
From the values of the Grey relation grade, we can conclude that HMPP is the best alternative out of the three options since its value ranked first, followed by CPP and then AFEX. In other words, HMPP and CPP were the two best options.
The selection of the best alternative from different possibilities in the case of multi attributes is key in decision making. From the previous section, we note that with the use of the preference selection index method, the results were as follows: = 0.798, = 0.627, = 0.869, and we can deduce that the conventional pelleting process CPP is the best alternative since it ranked first. Grey relational analysis was used in this study as a decision-making tool to verify the previous results. With the GRA method, the ranking of the pelleting processes was similar to the PSI, with the grades of: 0.747, 0.399, 0.712. Using the PSI and GRA methods, the results show that HMPP and CPP were the best two alternatives and had the most economical and environmentally friendly use, depending on the preselected factors.
7. Discussion and Conclusions
There are several multiple criteria decision making (MCDM) approaches prevalent in the literature that convert the written assessment of the experts to numerical values. Among them are DEMATEL, AHP, ANP, TOPSIS, PSI, and Graph Theory and Matrix Approach. However, PSI has some advantages over other traditional approaches. One main advantage is the simplicity of assigning weights to different attributes.
This study completed a comparison between three main pelleting processes used in biomass depots. The process comparison and selection of the three processes were performed using the multi criteria decision-making tool preference selection index (PSI). The PSI methodology selects the best pelleting process alternative from a set of alternatives depending on a number of economic and environmental factors. The decision-making problem includes four factors: total capital investment cost, carbon emissions, transportation cost, and preprocessing cost. The factors were chosen with respect to the challenges related to the pelleting process.
We based our study on data collected in Mississippi and Alabama [
23,
26]. Our analysis provides a solution to a multi criteria decision-making problem. Because our study helps to select the most suitable pelleting process methods for biomass production, the results can be used to facilitate and optimize the supply chain costs of a biomass depot.
The authors of this study believe that it will benefit both the academic and industrial fields and will address an important gap that exists in the literature. The gap refers to the economic and environmental comparison of the three most utilized pelleting processes in the biomass industry. Our study used the preference selection index as the multi-criteria decision making method. The proposed methodology helps to determine the most economic and environmentally suitable process of the biomass. The data, methodology, and results in the study can be used as a baseline for future studies by adding other factors such as the social factor to determine the most sustainable process.
Our research contributes to the existing biomass energy literature in the following ways:
It solves a complex decision-making problem in a biomass depot, namely, the selection of a pelleting process.
It determines the most suitable and cost appropriate pelleting processes, resulting in the optimization of the biomass supply chain.
This study can be extended in multiple ways. Other studies are needed to investigate the impact of policy and regulations that are related to the biomass pelleting process depots. Future research studies can investigate and further include the missing factors: social, regulatory, and technical.
In this study, trucking was used as a main transportation system, and thus further studies are needed for other means of transportation. To minimize the cost, studies are needed to compare the cost among different types of transportation system. The literature shows that uncertainty in climate change can impact the combustion process of the biomass and therefore future studies are needed to quantify and measure the impact of the climate factor on the overall biomass industry [
46].

 ,
, 

