
Adapting an Agent-Based Model of Infectious Disease Spread in an Irish County to COVID-19


1
Information, Communications and Entertainment Institute, Technological University Dublin, Grangegorman, Dublin 7, Ireland
2
ADAPT Centre Technological University Dublin, Grangegorman, Dublin 7, Ireland
*
Author to whom correspondence should be addressed.
Systems 2021, 9(2), 41; https://0-doi-org.brum.beds.ac.uk/10.3390/systems9020041
Submission received: 22 April 2021
/
Revised: 1 June 2021
/
Accepted: 8 June 2021
/
Published: 10 June 2021
(This article belongs to the Section Complex Systems)
Abstract
:The dynamics that lead to the spread of an infectious disease through a population can be characterized as a complex system. One way to model such a system, in order to improve preparedness, and learn more about how an infectious disease, such as COVID-19, might spread through a population, is agent-based epidemiological modelling. When a pandemic is caused by an emerging disease, it takes time to develop a completely new model that captures the complexity of the system. In this paper, we discuss adapting an existing agent-based model for the spread of measles in Ireland to simulate the spread of COVID-19. The model already captures the population structure and commuting patterns of the Irish population, and therefore, once adapted to COVID-19, it can provide important insight on the pandemic, specifically in Ireland. We first investigate the different disease parameters that need to be adjusted to simulate the spread of COVID-19 instead of measles and then run a set of experiments initially comparing the model output for our original measles model with that from the adjusted COVID-19 model. We then report on experiments on how the different values of the basic reproductive number, , influence the simulated outbreaks, and find that our model behaves as expected: the higher the , the more agents are infected. Then, we demonstrate how different intervention strategies, such as vaccinations and school closures, influence the spread of measles and COVID-19 and how we can simulate real pandemic timings and interventions in our model. We show that with the same society, environment and transportation components among the different disease components lead to very different results for the two diseases, and that our COVID-19 model, when run for Leitrim County, Ireland, predicts a similar outbreak length to a real outbreak in Leitrim County, Ireland, but the model results in a higher number of infected agents compared to the real outbreak. This difference in cases is most likely due to identifying all cases of COVID-19 in the model opposed to only those tested. Once an agent-based model is created to simulate a specific complex system or society, the disease component can be adapted to simulate different infectious disease outbreaks. This makes agent-based models a powerful tool that can be used to help understand the spread of new and emerging infectious diseases.
1. Introduction
As the COVID-19 pandemic continues, countries throughout the world are attempting to find the best strategies to slow the spread of the disease so that it does not overwhelm the health care systems. Epidemiological modelling can play an important role in developing and implementing successful intervention strategies, but in many cases, an appropriate model needs to be developed. In this study, we demonstrate the feasibility of taking a previously developed and validated model for the spread of infectious diseases in Ireland and adjusting the parameters of the disease components to model the spread of COVID-19.
COVID-19 is known to be more severe in older patients and those with co-morbidities [1]. Thus, having a population in the model that has the appropriate age structure could be important in capturing the severity of the pandemic in a given region, and the response of older individuals might be different to the response of younger individuals. For example, an older individual might be more likely to reduce contacts and remain home due to their risks. Additionally, commuting patterns and differences in intra-city mobility have been shown to influence how a disease spreads through a city [2,3]. Interactions between the regional characteristics, such as commuting patterns, age structure, the number of schools, and different immunity levels can influence an outbreak in a town or region [4]. As these interactions are complex, being able to simulate the specific characteristics of a given region can be important in infectious disease modelling and capturing that complexity. These interactions can lead to large events, such as super spreader events and the adaptation of agents as they change their behaviours due to the outbreak. Having a model that can simulate the society, transport networks and patterns, and environment of a given region or country, and that is adaptable to different diseases can reduce the time it takes to create a new model (as compared with creating a complete model from scratch). This reduction in model creation time will allow for quicker results to help guide decision-making during an outbreak. If such detailed models are only commissioned after the start of a pandemic, it may be too late for the results to have a substantial effect [5]. While the dynamics of a disease might vary, the underlying structure of the population will not. Here, we show that it is possible to adjust an agent-based model designed for the spread of measles to model the spread of COVID-19. Once a model is adjusted for a specific disease, it can be used to test how different intervention strategies will work to mitigate an outbreak and help to support decision-making. For example, will school closures be enough to slow the spread of an outbreak, or will more drastic measures be needed? While there are existing high-level models that have been used to show this [6], a more country-specific model can show how populations might respond differently to a given intervention. For example, a densely populated city or town that relies heavily on public transportation might need stricter movement restrictions compared to a more rural county in order to achieve the same flattening of the curve.
Once the disease component has been adapted, it is an important step in the validation process to compare the results of the model simulating outbreaks of different diseases. It is important to understand how changes interact with other components of the model and the complexity of the system. Having a validated model can help in making difficult decisions on interventions. As COVID-19 spreads throughout the world, it is clear that predicting and preparing for a pandemic is an important aspect of global health, and modelling should play an essential role in that prediction and preparation.
In this work, we start by briefly discussing the COVID-19 pandemic, and then discuss a number of existing COVID-19 models. Then, we introduce an agent-based model designed to model the spread of measles in the Irish context, and explain how it is adjusted for COVID-19 dynamics. It is important to note that while we discuss adapting the disease component (specifically, the parameters needed to adapt the component to a new disease) of our model, due to the flexibility of agent-based models, these might not be the same parameters that need to be adjusted to adapt other agent-based models for the spread of an infectious disease to COVID-19. We then run a number of experiments using the COVID-19 version of the Irish agent-based model. First we compare the results of the adapted COVID-19 model with the original measles model so as to validate the changes in the model parameters and disease dynamics. This allows us to get a better understanding of the complexity in the model and the impact of adjusting the model parameters. As far as we are aware, this analysis does not exist in the current COVID-19 literature. Once we have validated the adapted model in this way, we then report three experiments that demonstrate the usefulness of agent-based models to the study of COVID-19 in the Irish context. The first focuses on how the characteristics and dynamics of the COVID-19 disease affect the spread of the disease, with a particular emphasis on the parameter of the disease. Currently, in the literature on COVID-19, there are a range of values reported for ; this is not surprising, given that is a function of both the disease itself and also the specifics of the environment and society that it is spreading through. In this experiment, we use our adapted agent-based model to forecast the range of outcomes for COVID-19 in Ireland that can be expected for the spread of COVID-19 under different values reported in the literature. As part of the experiment, we also report a study examining how presymptomatic individuals, those who have not yet developed symptoms but who are infectious, can affect the spread of disease. In the next experiment, we use the adapted model to examine how different intervention strategies affect the spread of different diseases (in this case, measles versus COVID-19) in Ireland. Finally, in the last experiment, we use the adapted model to simulate the spread of COVID-19 in an Irish county, replicating the Irish responses to COVID-19 with school closures and agent movement restrictions.
1.1. COVID-19 Pandemic
On 31 December 2019, a cluster of patients with pneumonia of unknown cause was detected in Wuhan, China. By 9 January 2020, China reported that a novel coronavirus was the cause of the outbreak [7]. By 27 August 2020, the virus had led to over 24.2 million cases, and over 827,000 deaths [8]. The first case of COVID-19 in the Republic of Ireland was reported on 29 February 2020 [9]. By 27 August 2020 there were 28,453 notified cases and 1777 deaths, with all counties affected [10].
1.2. COVID-19 Models
One almost immediate response to the COVID-19 outbreak was to create models to help understand the spread of the disease and to help predict the spread. While many models focus on estimating disease parameters, such as the basic reproductive number or the length of time between exposure and when an individual becomes infectious, here we focus on those models created to simulate the spread of the disease through a population, so as to get a better understanding of how COVID-19 will affect a particular country, and the likely outcomes of different interventions. For example, Wang et al. [11] used a basic SEIR model to predict the number of COVID-19 cases in Wuhan in China, and looked at different scenarios for prevention and control measures. A number of studies have looked into different intervention measures and their effectiveness, such as differences in how strictly and for how long social distancing measures are enforced [6], airport screenings [12], or contact tracing and isolation [13].
Beyond SEIR-based models, there are a number of equation-based models that can take into account other factors important to the spread of an infectious disease, such as the spatial spread of the virus. A common method for this is use of a metapopulation model that breaks the population into subpopulations that can represent different regions or cities. Each subpopulation has independent disease dynamics. There are limited interactions between subpopulations, but these interactions simulate transportation between subpopulations [14]. Danon et al. [15] adapted an existing metapopulation model of disease transmission in England and Wales to capture the spread of COVID-19. They used the model to look at a number of factors, including the potential seasonality of COVID-19 and how changes in the location of the initial infection within the country have an effect on the timing of the epidemic and when the peak reaches different regions. The authors compare the results of their equation-based models that do not include the spatial spread of the disease with the results of their metapopulation spatial model. Their results show that the spatial model forecasts that the country will reach its peak four times slower than the model that does not include spatial spread. The non-spatial-equation-based model does not consider the spread of the disease across regions of the country because it does not consider transportation patterns, and thus misses key factors in the spread of the disease.
Agent-based models are particularly suited to understanding how population, transportation, and environmental characteristics and the interactions of these characteristics can influence the spread of an infectious disease [16]. They not only take into account spatial characteristics of the spread, but can also consider individual actions and how they influence the spread of the virus. However, creating and validating an agent-based model that is specific to a certain population can take both time and data. When trying to respond to an emerging disease, that time may not be available. A number of groups have taken existing agent-based models and shown how they can be adapted to simulate the spread of COVID-19. Marini et al. [17] took the EnerPol model that had been previously used to look at scenarios of influenza spread in Switzerland, as well as a number of other scenarios for different countries, such as the U.S., Japan, and South Korea, and adapt the model for COVID-19. The model is data-driven and uses the exact start date of the pandemic in Switzerland, combined with accurate seeding of initial cases. The model determines where potential hotspots of infection around the country will be, and also shows how uncertainties in model parameters due to the characteristics of modelling an emerging disease can lead to a wide variation in model results. Chang et al. [18] used AceMod, an agent-based epidemic model that was created using Australian census data, and adjusted the disease component of the model for COVID-19 while keeping the population the same. They then used the model to look at various intervention strategies and determined that a combination of several strategies, such as school closures, case isolation, and social distancing produces the best results. Ferguson et al. [19] created a model that simulated the spread of pandemic influenza in the United Kingdom and in the United States, and more recently, this model has been adapted to simulate the spread of COVID-19.
The taxonomy of agent-based models for epidemiology presented in [16] identifies four major components within these models: environmental, society, transportation, and disease components. Adapting an agent-based model from one disease (such as measles) to another (such as COVID-19) primarily involves adapting the parameters of the disease component. Indeed, this is one of the real benefits of agent-based models for epidemiology: the environmental, society and transport components of the model can be reused in the creation of a model for a new disease, thus saving the time and effort required to develop these components and speeding up the development of a model specific to the region or country. Having a model that is specific to a region or a country is an important advantage when modelling the spread of an infectious disease, as it can use the unique characteristics of a region, such as transportation patterns, to show how the region will be affected.
However, the forecasts generated by an agent-based model emerges from the interactions between these different components and the region’s characteristics. Consequently, when adapting an agent-based model to a new disease, it is important to compare the forecasts generated by the adapted model to those of the original model in order to check that the new disease component has an appreciable effect on the generated forecasts (or in other words, that the dynamics of the new disease are not dominated by the other components of the model). Once the model has been validated in this way, we can run experiments using the new disease dynamics. In the following section, we will describe the agent-based model we used for this work and explain how it was adapted to COVID-19. Following this, we report a number of experiments that study COVID-19 in the Irish context.
2. Materials and Methods
Agent-based models are particularly suited to model complex systems, as complex systems are systems of interdependent, diverse, and adaptable entities. The agents in an agent-based model embody these characteristics: the heterogeneous characteristics of the agents lead to their diversity; in the case of an infectious disease model, an agent can adapt their behaviour based on their own characteristics, their disease status, and the overall level of disease in the society; and an agent’s own disease status is interdependent on other agents, in terms of the contacts they have had with other agents, and the actions of those other agents. We use the agent-based model developed by Hunter et al. [20], to simulate the spread of measles in Irish counties, as the basis for the work reported in this paper. The model we use in this work has the same environmental, societal, and transportation components as that model, and runs on discrete time-steps, with each time-step equating to two hours of an agent’s day. Thus, 12 time-steps equals one day. However, the disease component is updated in two ways. First, structurally, the disease component used in our experiments is designed as a hybrid agent-based and equation-based component that switches between these two modes based on the number of infected or exposed agents in a given town in the region. This disease component uses the same hybrid architecture that was used in Hunter et al. [21]. The model code and a detailed description of the hybrid disease architecture, along with exemplary input data is available on the CoMSES Network—Computational Model Library as: Hybrid Agent-Based and Equation-Based Model for Infectious Disease Spread (version 1.0.0), https://www.comses.net/codebases/e30e36f0-5471-46b5-9c78-27b3f2185ff9/releases/1.0.0/ (accessed on 19 April 2020) [22]. Second, to model COVID-19, the parameters of the disease component are naturally set to values that reflect the known dynamics of COVID-19. We will describe the COVID-19 disease parameters and characteristics later in the paper. In the following sections, we provide a brief description of the four model components and the experiments we run using the model.
2.1. Environment Component
The model environment was created using data from the Irish Central Statistics office. The region being modelled was broken up into a number of smaller regions using Irish census small areas. Small areas contain between 50 to 200 dwellings and are the smallest geographic area that the Irish census statistics are aggregated over [23]. Each small area in the model is represented by one Netlogo patch or grid cell. Any agents that are in the same small area are coded in the same physical location in the model; however, agents keep track of their location within the small area. Agents can be in one of four locations—home, school, work, or the community. An agent’s location within a small area will determine their contact with other agents. Agents only interact with other agents who are in the same small area and location within the small area. An agent can access information about the small areas, including the real-world distance to other small areas and the number of agents there at a given time. Agents can move between small areas.
2.2. Society Component
The society in the model was created using census data from the Irish Central Statistics Office [23]. For each small area, the assigned population matches the age, sex, household size, and economic status breakdown of the real population. Social networks are also included in the model and created from the agents’ simulated schools, workplaces and families. Agents have a family social network made up of agents in their household, or a work or school social network made up of other agents in their workplace or their school, and students have an additional class network made up of agents who are in their school and of the same age. Social networks, along with the agent’s location, help to determine the contacts an agent has in the model.
Although in real systems, there is a level of immunity in the population (for measles, this is due to both past infection and vaccination, and for COVID-19, in many countries, vaccination campaigns began in the winter of 2020–2021), to initially investigate the dynamics of the two diseases we start with a completely susceptible population, and in the later experiments reproduce measles vaccination rates for the measles version of the model based on Irish vaccination data.
2.3. Transportation Component
Agents’ movements in the model are either predetermined, with agents moving between home and school or home and work at set times, with commuting patterns to school and work determined using the CSO Place of Work, School or College—Census of Anonymity Records (POWSCAR) data [24], or determined using a gravity model. The gravity model determines where an agent will move when they are moving through the community during day-time hours. A gravity model gives the interactions between two location pairs, and determines those interactions based on the characteristics of a location and the distance between locations [25]. In our model, the probability of an agent moving to another small area is proportional to the population density of the small area, with small areas that contain a lot of other agents being more attractive, and inversely proportional to the distance to the small area from the agent’s current location, with small areas that are farther away being less attractive.
Agents’ movements can be influenced by their disease statuses. If an agent is sick and symptomatic, they will adjust their movements to stay home more often. The amount of time that they stay home is determined by the modeller, and can be influenced by the disease being modeled. For example, agents would be much more likely to stay home when sick with measles than if they had the common cold.
2.4. Disease Component
The disease component is the hybrid disease component used in the model described in Hunter et al. [21]. The hybrid disease component allows for the model to switch between an agent-based disease component and an equation-based disease component when the number of agents infected or exposed in a town (a town can be made up of one small area or a group of small areas) reaches a certain threshold. The model starts with all towns using an agent-based disease component, and when the threshold in the town is reached, the town is switched to an equation-based disease component. Other towns that have not reached the threshold will remain entirely agent-based, and transportation between towns is still driven by the agent-based model regardless of whether the town has switched to an equation-based disease component or not. When the number of infected or exposed agents in a town that has switched to an equation-based component drops below the threshold, it returns to an agent-based disease component. In all experiments reported in this paper, the towns will switch when 10% of agents are infected or exposed.
At the agent level, the agents will move between four states: susceptible, exposed, infected, and recovered. A contact between a susceptible and an infected agent has a certain chance of resulting in the susceptible agent moving to the exposed states. They will remain in the exposed state for a defined period of time where they are not yet infectious, and then will move to an infected state. The agent will remain in the infected state for a set period of time, where they are able to infect other agents that they might come into contact with, and then will move to the recovered state where they will no longer be able to infect others or become infected.
2.5. Adapting from Measles to COVID-19
Measles and COVID-19 are two distinctly different viruses with different levels of infectiousness, severity, and immunity within the population. However, the society and environment through which they spread do not change. If an outbreak of measles occurs in the county of Leitrim in Ireland, the population structure, population density, and initial commuting patterns and mobility would be the same as those that occur in the county of Leitrim during an outbreak of COVID-19. Thus, to adapt a model that captures the disease dynamics of measles to the disease dynamics of COVID-19, we only need to adjust the disease component of the model and not the society, environment, or transportation (admittedly, in some cases, such as the current COVID-19 pandemic, agent transportation patterns will change in response to dynamics of the pandemic—for example, in response to the number of cases of COVID-19 in an area, or because of government restrictions—and an agent-based model can be created to account for these changes in transportation as well; however, in this paper we are focusing on the difference in disease dynamics). As a first step in adjusting the model to simulate the spread of COVID-19, it is important to look at the set of parameters that must be adjusted to change the model from simulating measles to COVID-19. The main parameters required to change the model from a model for measles to a model for COVID-19 are the incubation period, the infectious period, and the basic reproductive number (). These three parameters can help to understand how fast an infectious disease will spread. The incubation period is the amount of time between initial contact with an infectious individual and a subject developing symptoms. For infection with COVID-19, the mean incubation period is between 5 and 6 days, and ranges from 1 to 14 days [26]. The infectious period is defined as the amount of time an individual can pass the disease to others. As an estimate for the infectious period, we take the median time from the development of symptoms to clinical recovery. For mild cases, this is 2 weeks, but can be 3–6 weeks for severe cases [26]. The last parameter, the basic reproductive number, , gives an estimate of how quickly the disease will spread, and is the expected number of new cases of a disease infected by a single infected individual in a completely susceptible population. There are a range of estimates for the basic reproductive number of COVID-19: although the World Health Organization (WHO) estimates it to be between 2 and 2.5 [26], a review of the existing studies measuring the basic reproductive number found it to range from 1.4 to 6.49, with a mean of 3.28 [27]. In order to investigate the scale of potential outbreaks compatible with this range of values for the basic reproductive number, in our second experiment reported below, we used the model to simulate a number of different outbreak scenarios.
Additionally, COVID-19 has some other characteristics that make it different from measles. While there are many severe cases of COVID-19, approximately 81% are classified as mild [28]. There is evidence that individuals are infectious with COVID-19 2.5 days before they develop symptoms [29]. Both of these factors could influence the spread of the disease affecting individual behaviours, and thus influence transmission (those who are not yet symptomatic or only appear to have a cold will likely still interact with others). Additionally, there is an existing level of immunity to measles in the population through vaccinations and those who have previously had measles, and there is no existing immunity for COVID-19. These factors, especially being infectious prior to showing symptoms, should be included in an agent-based model for the spread of COVID-19 in order to completely capture the dynamics of the disease.
In the agent-based disease component, the parameters are used as follows: the incubation period determines the number of days that the agent is exposed but does not have symptoms (and thus does not know that they are infected); if the disease allows for the agent to be infectious while presymptomatic, this is included in the exposed period. The infectious period determines the number of days that the agent has symptoms, and this is the period that the agent will pass the infection on to others while they have symptoms. It is also the period when an agent’s behaviour will change based on having symptoms, with agents more likely to stay home. is used to determine how likely agents are to infect each other when they meet. can be broken down into three parameters: the time per infection, the contacts per time, and the infections per contact. From the agent-based model, we can determine the average number of contacts per time-period for the agents in the model, and we know the time per infection based on the infectious period. With those two parameters and , we can calculate the likelihood of an infection per contact.
To account for the number of mild and asymptomatic cases of COVID-19, we reduce the likelihood that agents will stay home when sick compared to the measles model. We also adjust the agent-based model so that agents are infectious for, on average, 2.5 days before they develop symptoms, while they are still in the exposed state. These agents will not adjust their movements to stay home when sick, and will continue their movements as normal.
2.6. Experiments
In all of the experiments that we run in this paper, we simulate the spread of the infectious disease, either measles or COVID-19, through the county of Leitrim, Ireland. Leitrim is a county in Ireland that has a population of approximately 32,000 people over an area of 1590 km. The county is made up of 173 small areas. If the measles vaccination is included in the model, approximately 12.3% of the population is not vaccinated or otherwise immune to measles.
In the original model with measles dynamics, we take the to be 12, the incubation period to be 10 days, and the infectious period to be 8 days. In the COVID-19 model, we set the average incubation period of exposed agents to 5 days, and the average infectious period to 2 weeks. As these are the averages to get the incubation period and the infectious period for each individual agent, we sample from normal distributions with means of 5 and 14 days, respectively, with standard deviations of 0.5 days. Additionally, to account for the large number of mild cases of COVID-19, we set a parameter for severity, with older agents more likely to have more severe cases. This severity parameter will influence the agents’ decisions to interact with other agents when sick. The severe cases will be much less likely to leave their homes when sick, while the mild cases have a higher chance of going out and interacting with others. As a base, we set the to be the mean value reported in the literature, 3.28, but in our second experiment we look at the effects of changing the .
To test the effects of changing the model parameters from those for measles to COVID-19, we first run the model 300 times (the model is run 300 times to account for the stochasticity in the agent-based model; this is based on methods in [30]) using measles dynamics, and then 300 times for COVID-19 dynamics with the mean of 3.28, and compare the results for the two outbreaks. To make the models more comparable, we do not include existing immunity in the measles model. We compare the results from the measles model and the COVID-19 model as a basis for assessing whether changing the disease dynamics has an effect on the model output. If the model results are not different, there would be an error in our simulation. There should be a number of differences seen between the two outbreaks (we consider an outbreak to last from when one agent is infected until the time when no other agents in the model are infected).
The second experiment we report was designed to determine if the COVID-19 model is affected, as we would expect by changing certain disease dynamics. This experiment compared the results from three versions of the COVID-19 model, each with a different value: one with an of 2, which is at the low end of the WHO range; one with an of 3.28, which is at the mean of the studies in the review; and finally, one with an of 6.49, the largest calculated for COVID-19. in this agent-based model impacts the chances that an agent will be infected upon contact with an infectious agent. The relationship between and the probability of infection is discussed further in [4]. To generate the results, each of these three versions of the model was run 300 times. We then do one additional run of COVID-19 dynamics by including agents being infectious before they develop symptoms. For this run, we take the average value of 3.28. If the model is capturing the COVID-19 dynamics correctly, then the size and growth rate of COVID-19 outbreaks should increase as increases, and also when agents are infectious before symptoms begin. If this pattern is not evident across the results from the different models, this would indicate that there is an error in the disease dynamics of the model.
Finally, we look at how an agent-based model can be used to simulate different intervention strategies. We first consider two possible theoretical interventions, vaccinations, and school closures. We run the measles model 300 times, including existing immunity from vaccination or having previously had measles, and run the COVID-19 model 300 times with the same level of immunity as the measles model. To show the adaptability of the model and how different infectious diseases will respond to different interventions, we also look at how school closure policies influence the spread of the two diseases, running the model 300 times for the measles model and 300 times for the COVID-19 model with the same school closure strategy. Then we run the model on a scenario that mimics the real policies implemented during the COVID-19 pandemic in Ireland with school closures and a lockdown.
3. Results
The following sections present the results of the experiments outlined in the previous section. First, we compare the COVID-19 results to the model results for measles, then we show the differences in the COVID-19 model based on different values and infectious periods, and finally, we look at how two different interventions influence both outbreaks.
3.1. COVID-19 Model Results vs. Measles Model Results
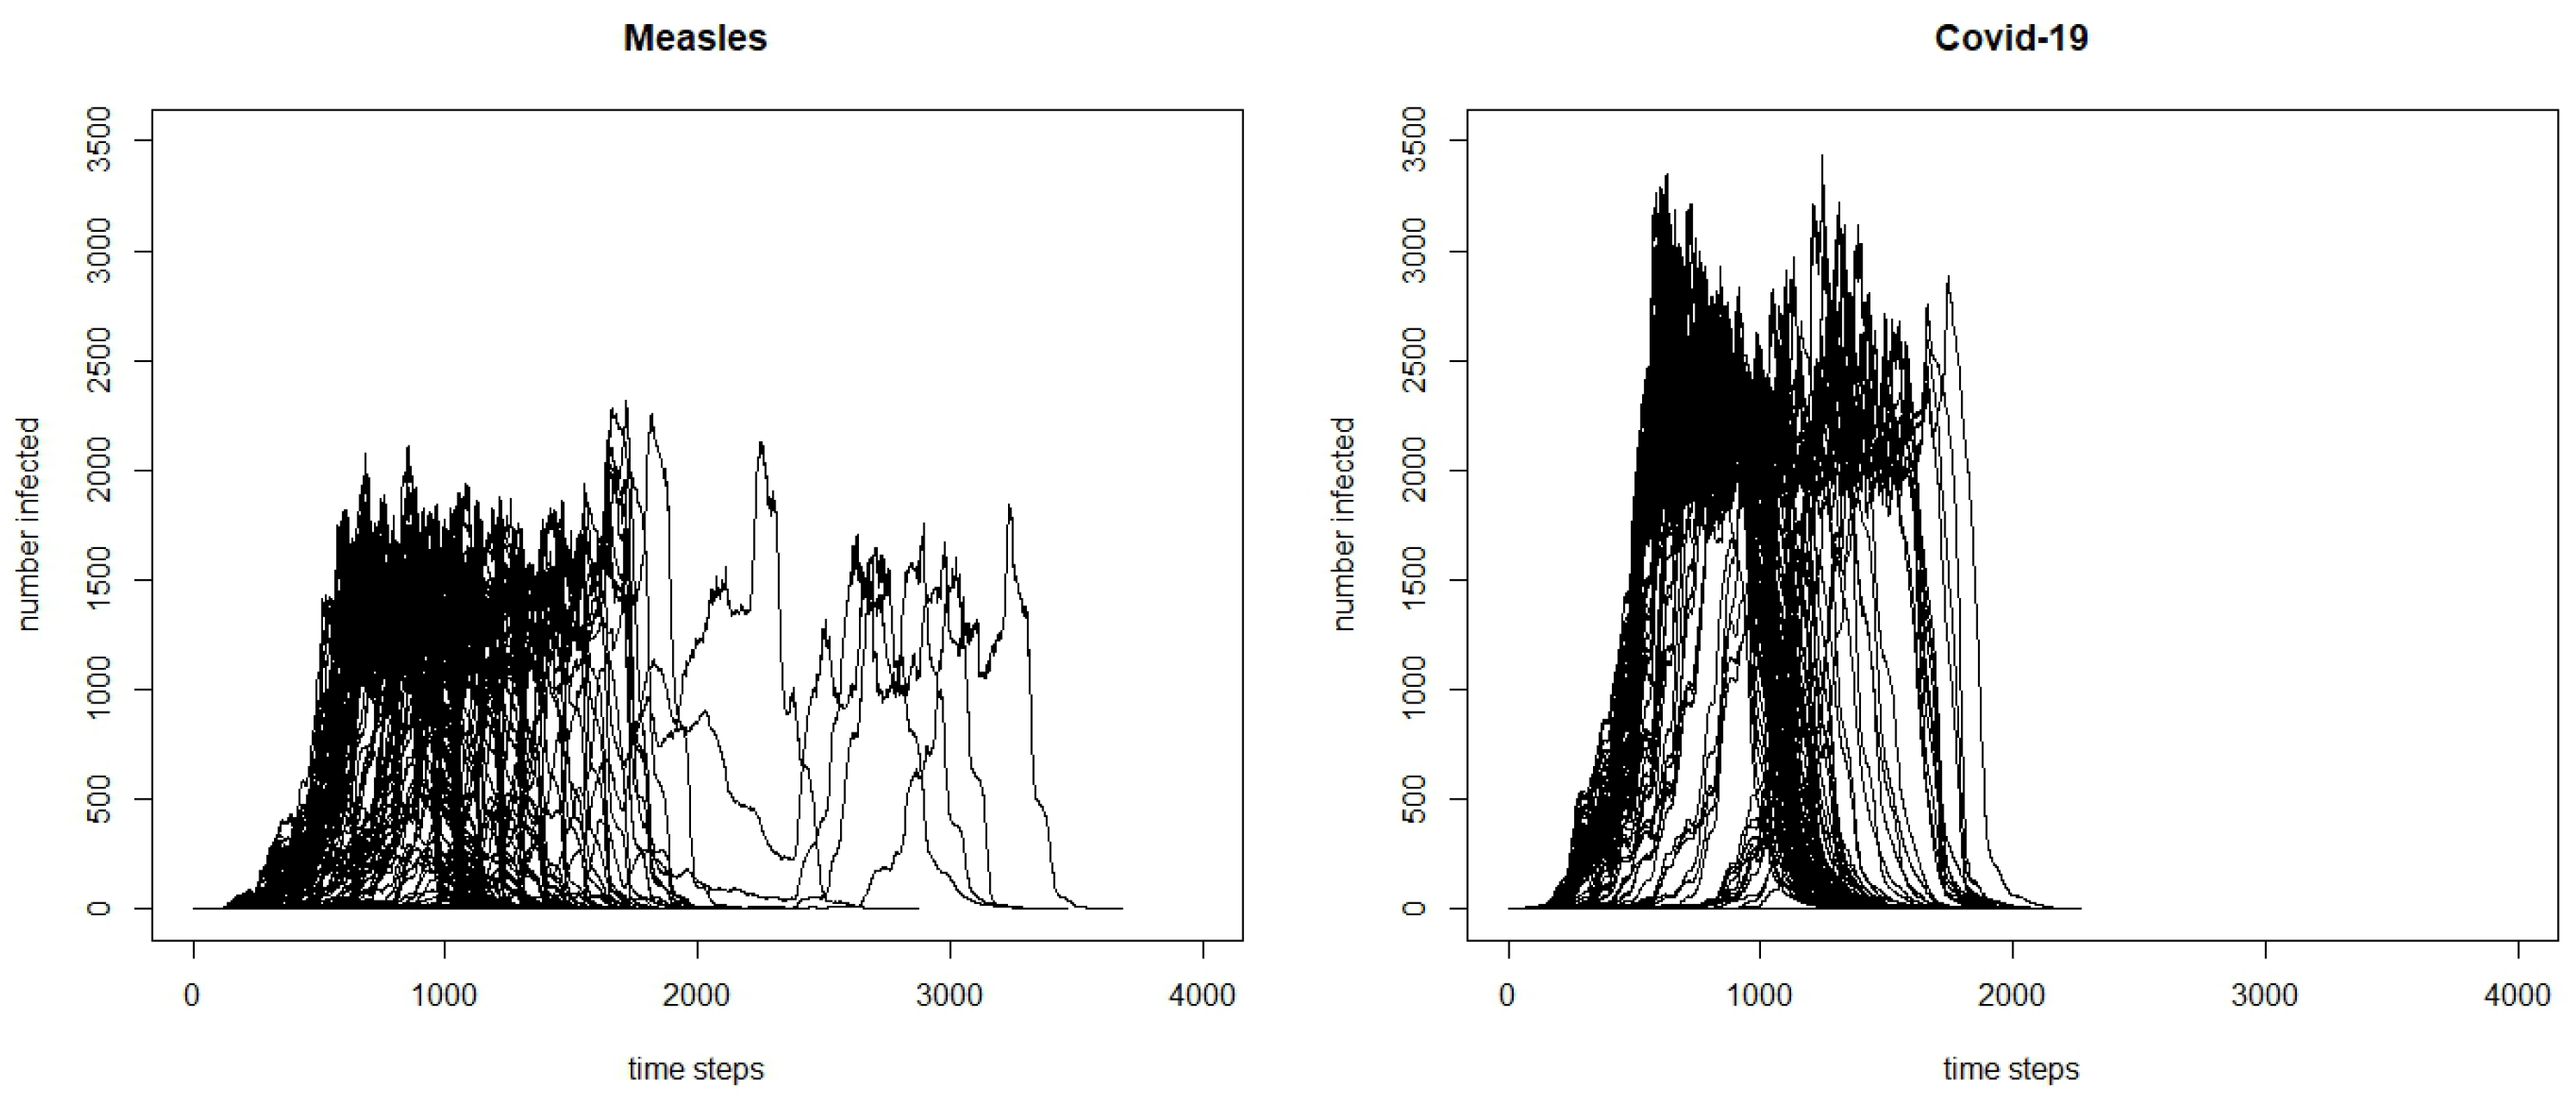
In order to be sure that the model is taking into account the interactions of the different parameters that describe the disease, we compare the outbreaks produced from the model with COVID-19 dynamics to the model with measles dynamics. If we do not see key differences in the results, it would be concerning that the COVID-19 model was not accurately capturing the dynamics of COVID-19, but instead just reproducing the measles dynamics. Although the of COVID-19 is still only being estimated, for ease of comparison, we compare the results from the measles model to the results from the COVID-19 model with an of 3.28. To also make the models more comparable, we do not include any existing immunity in the measles model, so all agents are susceptible.
The results, showing some key outbreak characteristics for the measles model and the COVID-19 model, can be found in Table 1.
From the table, we can see that the measles outbreak has a higher total number of infected. This is likely because measles has a higher ; therefore, the virus is more easily transmittable. The differences between the two outbreaks can be further seen in Figure 1. The COVID-19 outbreak seems to take off faster, and reaches a higher peak. Although at first, this higher peak and faster initial spread might seem counter-intuitive, because measles has a higher than COVID-19, there are a number of factors that are causing this difference. One is the other characteristics of the virus, especially the incubation period. While COVID-19 has an average incubation period of approximately 5 days, measles has a much longer incubation period, with an average of approximately 10 days. This means that the serial interval, the time between the symptom onset of a primary case and the symptom onset for a secondary case, will be longer for measles, and it takes longer for an agent infected in the measles model to move between the exposed and infected state than in the COVID-19 model; thus, the number of agents in the infected state for COVID-19 will grow faster earlier on in the model. Additionally, because there is a high percentage of COVID-19 cases that are mild and in some cases, asymptomatic, we have built it into the model so that mild cases are not as likely to stay at home when sick compared to more severe cases. Because a number of agents with mild cases will be going about their day as normal, they will be infecting more cases compared to the agents with measles who have a higher likelihood of staying home. The differences between the two models show that it is important to tailor the disease dynamics and behaviors of the agents to a particular infectious disease.
3.2. Modelling COVID-19 Dynamics
After determining that changing the disease dynamics of the model from those for measles to those for COVID-19 leads to expected differences in model results, we next consider how altering the COVID-19 dynamics will further affect the model. Although there are estimates of the parameters needed for modelling the spread of COVID-19, they are only estimates based off of available data. We set the exposed period from the estimated values and the infectious period as the estimated symptomatic period but investigate the effects of different values on the model output. is an important parameter because it modulates how infectious a disease is, and also influences what level of herd immunity would be needed for an outbreak to not take hold. Herd immunity is the concept that if a population contains a certain proportion of immune individuals, this will result in population-level protection from the disease. The higher the value, the higher the herd immunity that is needed [31]. This should result in a larger number of individuals becoming infected in an entirely susceptible population. In order to investigate the scale of potential COVID-19 outbreaks compatible with the possible range of values for the basic reproductive number, we used the COVID-19 model to simulate a number of different outbreak scenarios.
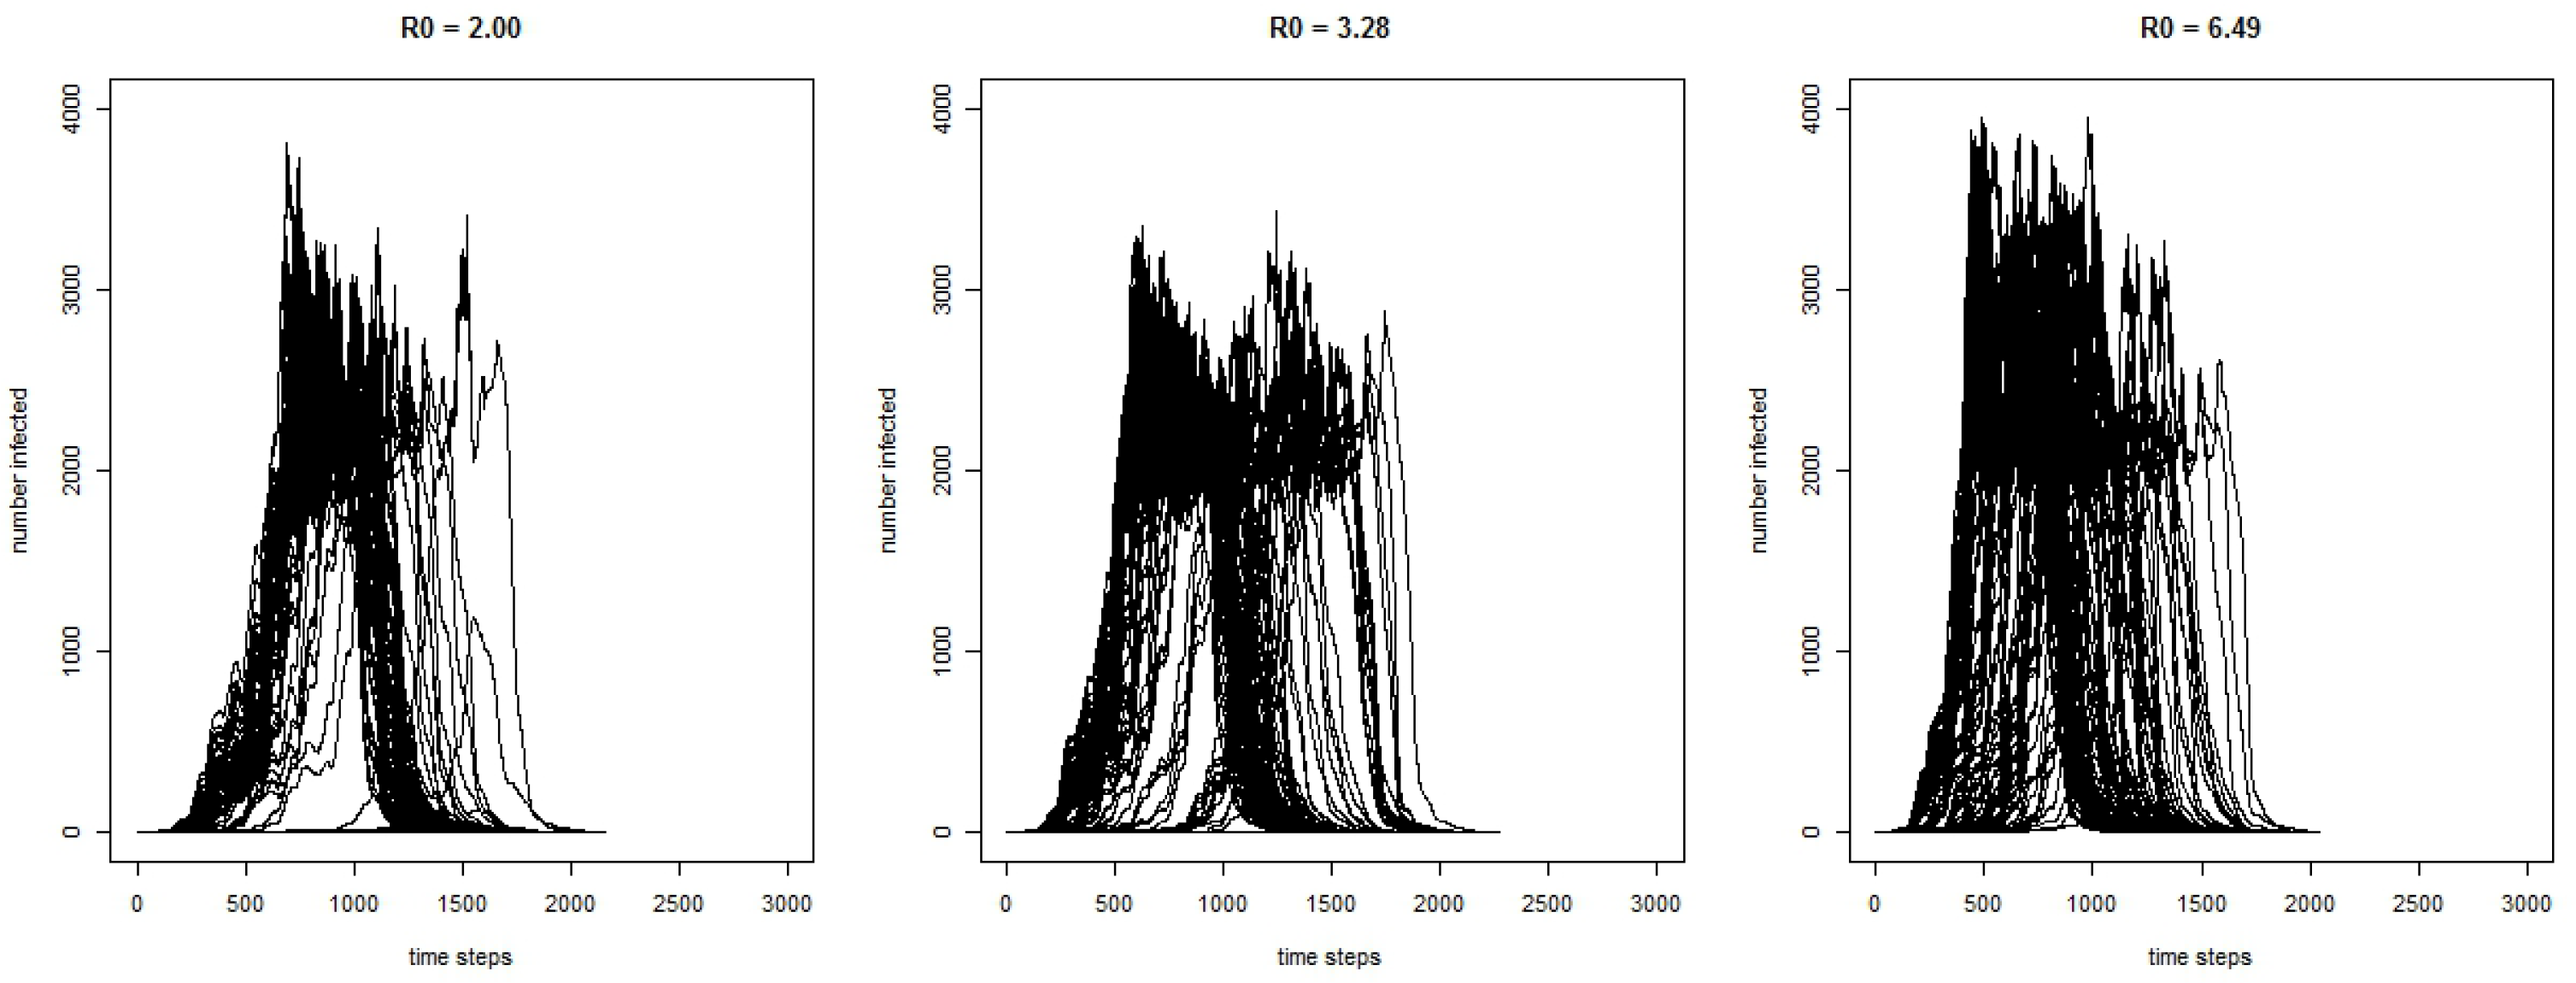
Figure 2 shows the curves for the 300 runs for the COVID-19 model for the number of infected agents for each time-step with three different values of . As expected, the results show that with a higher , the outbreak has a greater magnitude.
Some key characteristics of the simulated outbreaks can be seen in Table 2 for model runs where the disease spreads beyond the initially infected agent. Without interventions, the model shows that, on average, the total number of individuals infected by the end of the outbreak ranges between 25,671 and 28,058. The average length of the outbreak ranges from 105.22 days to 114.86 days. The average maximum number of agents infected at any one time ranges from 2240 to 2766, and this peak occurs, on average, between 43.88 days into the outbreak to 59.06 days.
The model behaved as we expected, with regard to the difference in the values. A higher results in a greater number of cases and faster growth in the outbreak, reaching the peak sooner.
To further adjust the model, we change the infectious period so that agents can be infectious before they are symptomatic. Not only does being infectious before developing symptoms give the agents a longer infectious period, which influences the number of agents they can spread the virus to, but it also influences their actions. When an agent has no symptoms, they will not consider staying home, thus spreading the virus to more agents. Table 3 shows the results comparing the COVID-19 model with the average of 3.28 with two different infectious period scenarios.
From the table, we can see that the total infected and the maximum number infected are significantly greater when the agents are infectious before symptoms begin, and we claim significance here as the confidence intervals do not overlap. Additionally, we see that the days to the maximum number of people infected is lower, and when agents are infectious before symptoms, it reaches the peak faster. We can see the differences by further comparing the infection curves for the model where agents are infectious before they develop symptoms and the model where they are only infectious after developing symptoms in Figure 3. Although there is variation in the runs, we can see that there is a higher peak in the model where agents are infectious before symptoms begin, and faster initial growth.
3.3. Interventions and Their Influence on the Outbreaks
One advantage of agent-based models is their adaptability to simulate different outbreaks on the same population, as seen in the previous two sections. However, another advantage is the ability to simulate intervention strategies. The outbreaks in the previous sections for both measles and COVID-19 stopped after herd immunity was reached. However, in both cases, there were a large number of total infected by the end of the outbreak which, especially in the case of COVID-19, would lead to a relatively large number of deaths. An outbreak of the severity of measles or COVID-19 spreading through a population unimpeded is unrealistic. In any population, there is a level of immunity to measles due to individuals having the disease or having been vaccinated, and as we have seen with COVID-19, most countries have implemented a number of measures to control the pandemic, such as school closures and movement restrictions that are aimed at isolating the individuals who are infectious so that they cannot spread the disease to others.
In this section, we simulate two intervention strategies on the measles model, and two intervention strategies on the COVID-19 model. One strategy is including vaccination and existing immunity. For the vaccination policy, for comparability, we base the level of immunity in the population on Irish measles vaccination rates. An agent’s immunity is thus determined by their age: older agents are assumed to have had measles and be immune, and for younger agents we take the percentage of agents that were vaccinated for measles for each age group and give that percentage of agents immunity. For the vaccination policy scenario, we apply the same measles vaccination rates by demographics to the COVID-19 model. This, in effect, turns COVID-19 into a childhood disease, as measles is, because the older population has pre-existing immunity while the younger population is not fully immune due to lower-than-desired vaccination rates. While this is unrealistic for the current situation with COVID-19, running the vaccination intervention experiment in this way enables us to directly compare the effectiveness of the vaccination intervention for diseases with different s and symptomatic/infectious dynamics. Furthermore, it also enables us to consider COVID-19 dynamics after a vaccination has been developed and deployed in the population for a number of years.
The second intervention strategy considered is a school closure policy where schools in the county will close when 100 agents are infected and will reopen when there is only one agent infected in the county. In this school closure scenario, there is no pre-existing immunity in the population for either the measles or COVID-19 model. This intervention strategy is more analogous to the strategies used to control COVID-19 so far with movement restrictions and control of the outbreak through isolation.
The results for the measles scenario with no interventions, with vaccination, and with school closures for runs when outbreaks occur can be found in Table 4.
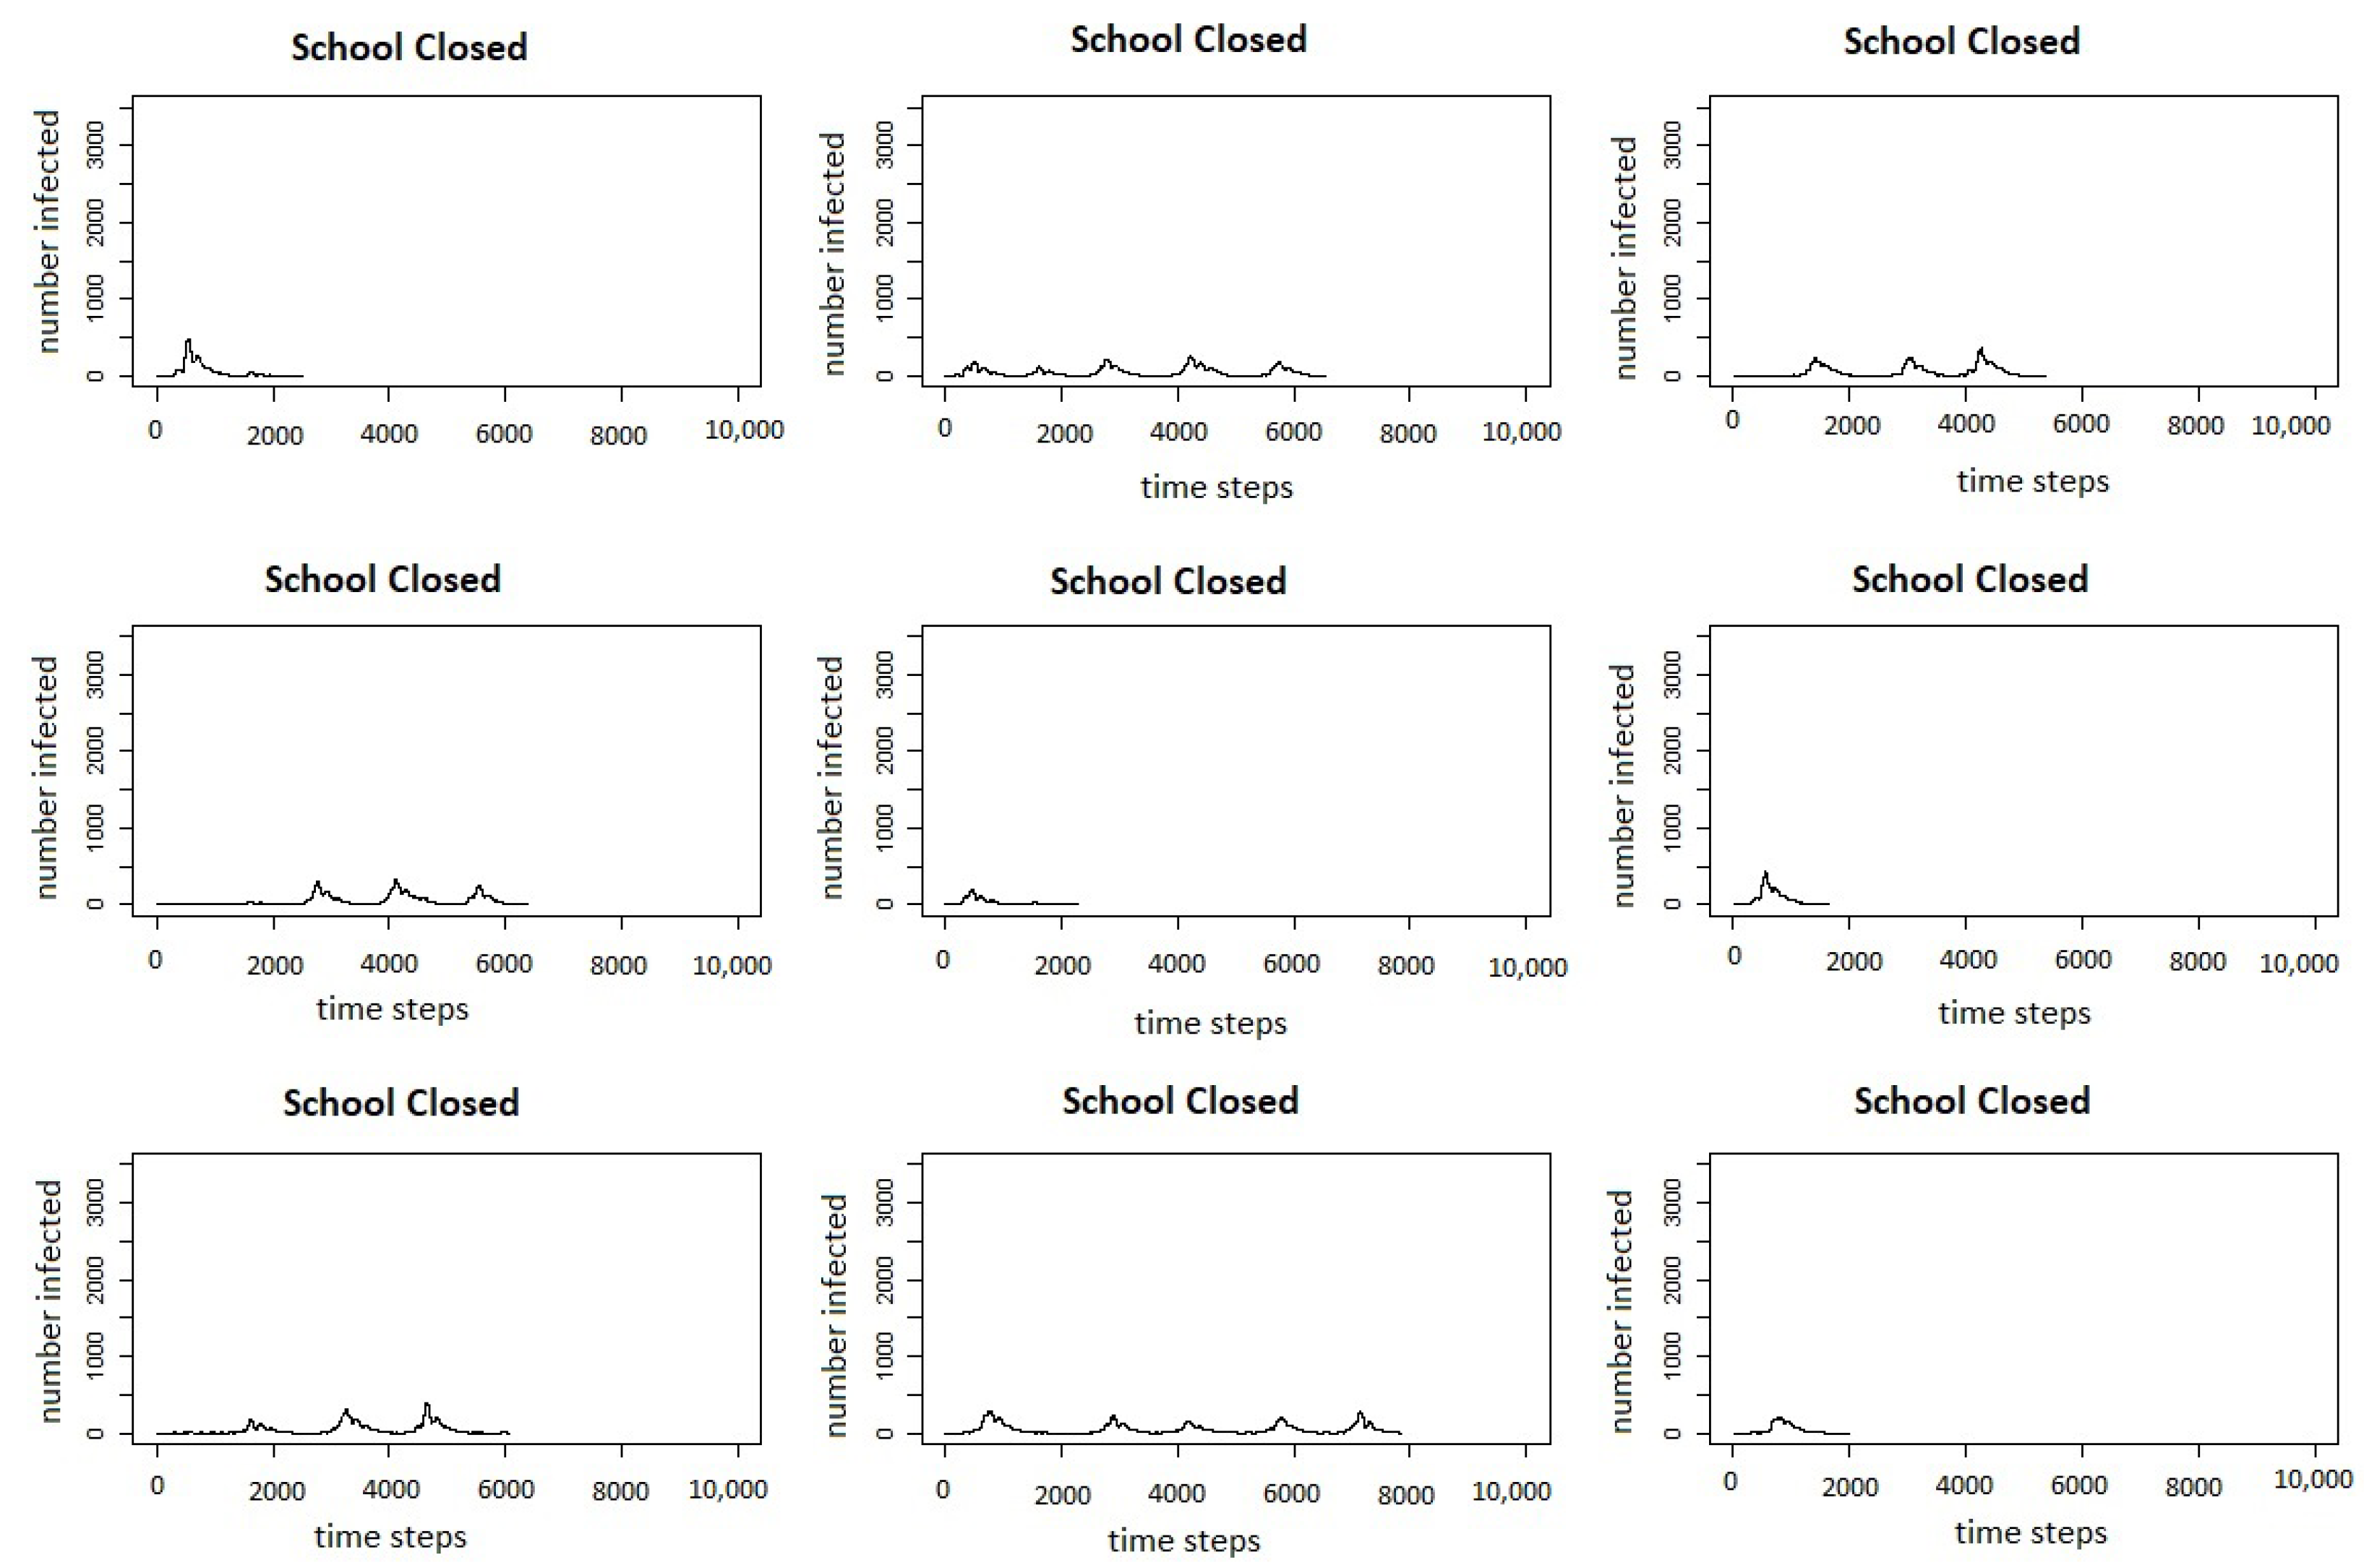
The table shows results for when the outbreak takes off and more than one agent is infected. We can see that with Irish vaccination rates, the outbreaks are significantly reduced in size, dropping from an average of 29,275 agents infected in the scenario with no interventions to 602 in the scenario with vaccination. The scenario with school closures also reduces the number of agents infected, but only to 868. Similarly, the maximum number of agents infected drops when either intervention is introduced, but more so with vaccinations than with school closures. Although the number of days to reach the peak does not change much between scenarios, the total number of days of the outbreak is increased for the scenario with school closures. This is likely because the school closures result in multiple waves of the outbreak when the schools reopen again. The multiple peaks of the outbreak can be seen in Figure 4, which shows the infection curves for all 300 runs of each scenario presented in Table 4 and in Figure 5, which shows the infection curves for nine individual runs of the measles school closure scenario.
Results for the COVID-19 scenarios with no interventions, with vaccinations, and with school closures using an of 3.28 across all three scenarios can be seen in Table 5.
From the table, it can be seen that compared to the scenario with no interventions, both using measles-level vaccinations and immunity and closing schools in the county of Leitrim, Ireland results in a large decrease in the average total infected agents, as well as the maximum number of agents, with school closures resulting in a greater decrease in cases than vaccination. This is a surprising result, as we would expect that reducing the number of susceptible agents through vaccination would have a greater impact on reducing the size of the outbreak; however, this is likely due to the interaction of different characteristics of COVID-19 and the intervention strategies. Because agents are infectious before showing symptoms and do not adjust their actions in the exposed state, these infectious but presymptomatic agents will continue to go to school, bringing the disease to school where they have a high number of contacts with other students who will become infected and bring the disease home to spread to their family and others in their social networks. Similarly, those infected but only with mild symptoms will continue to go to school again, bringing the disease to their classmates who will take it home. Although COVID-19 is often thought of as a disease that affects the older populations, there is growing evidence that children are also infected at a higher rate than previously thought. Closing schools stops infected students from bringing the disease into the school population, where it will have many opportunities to spread.
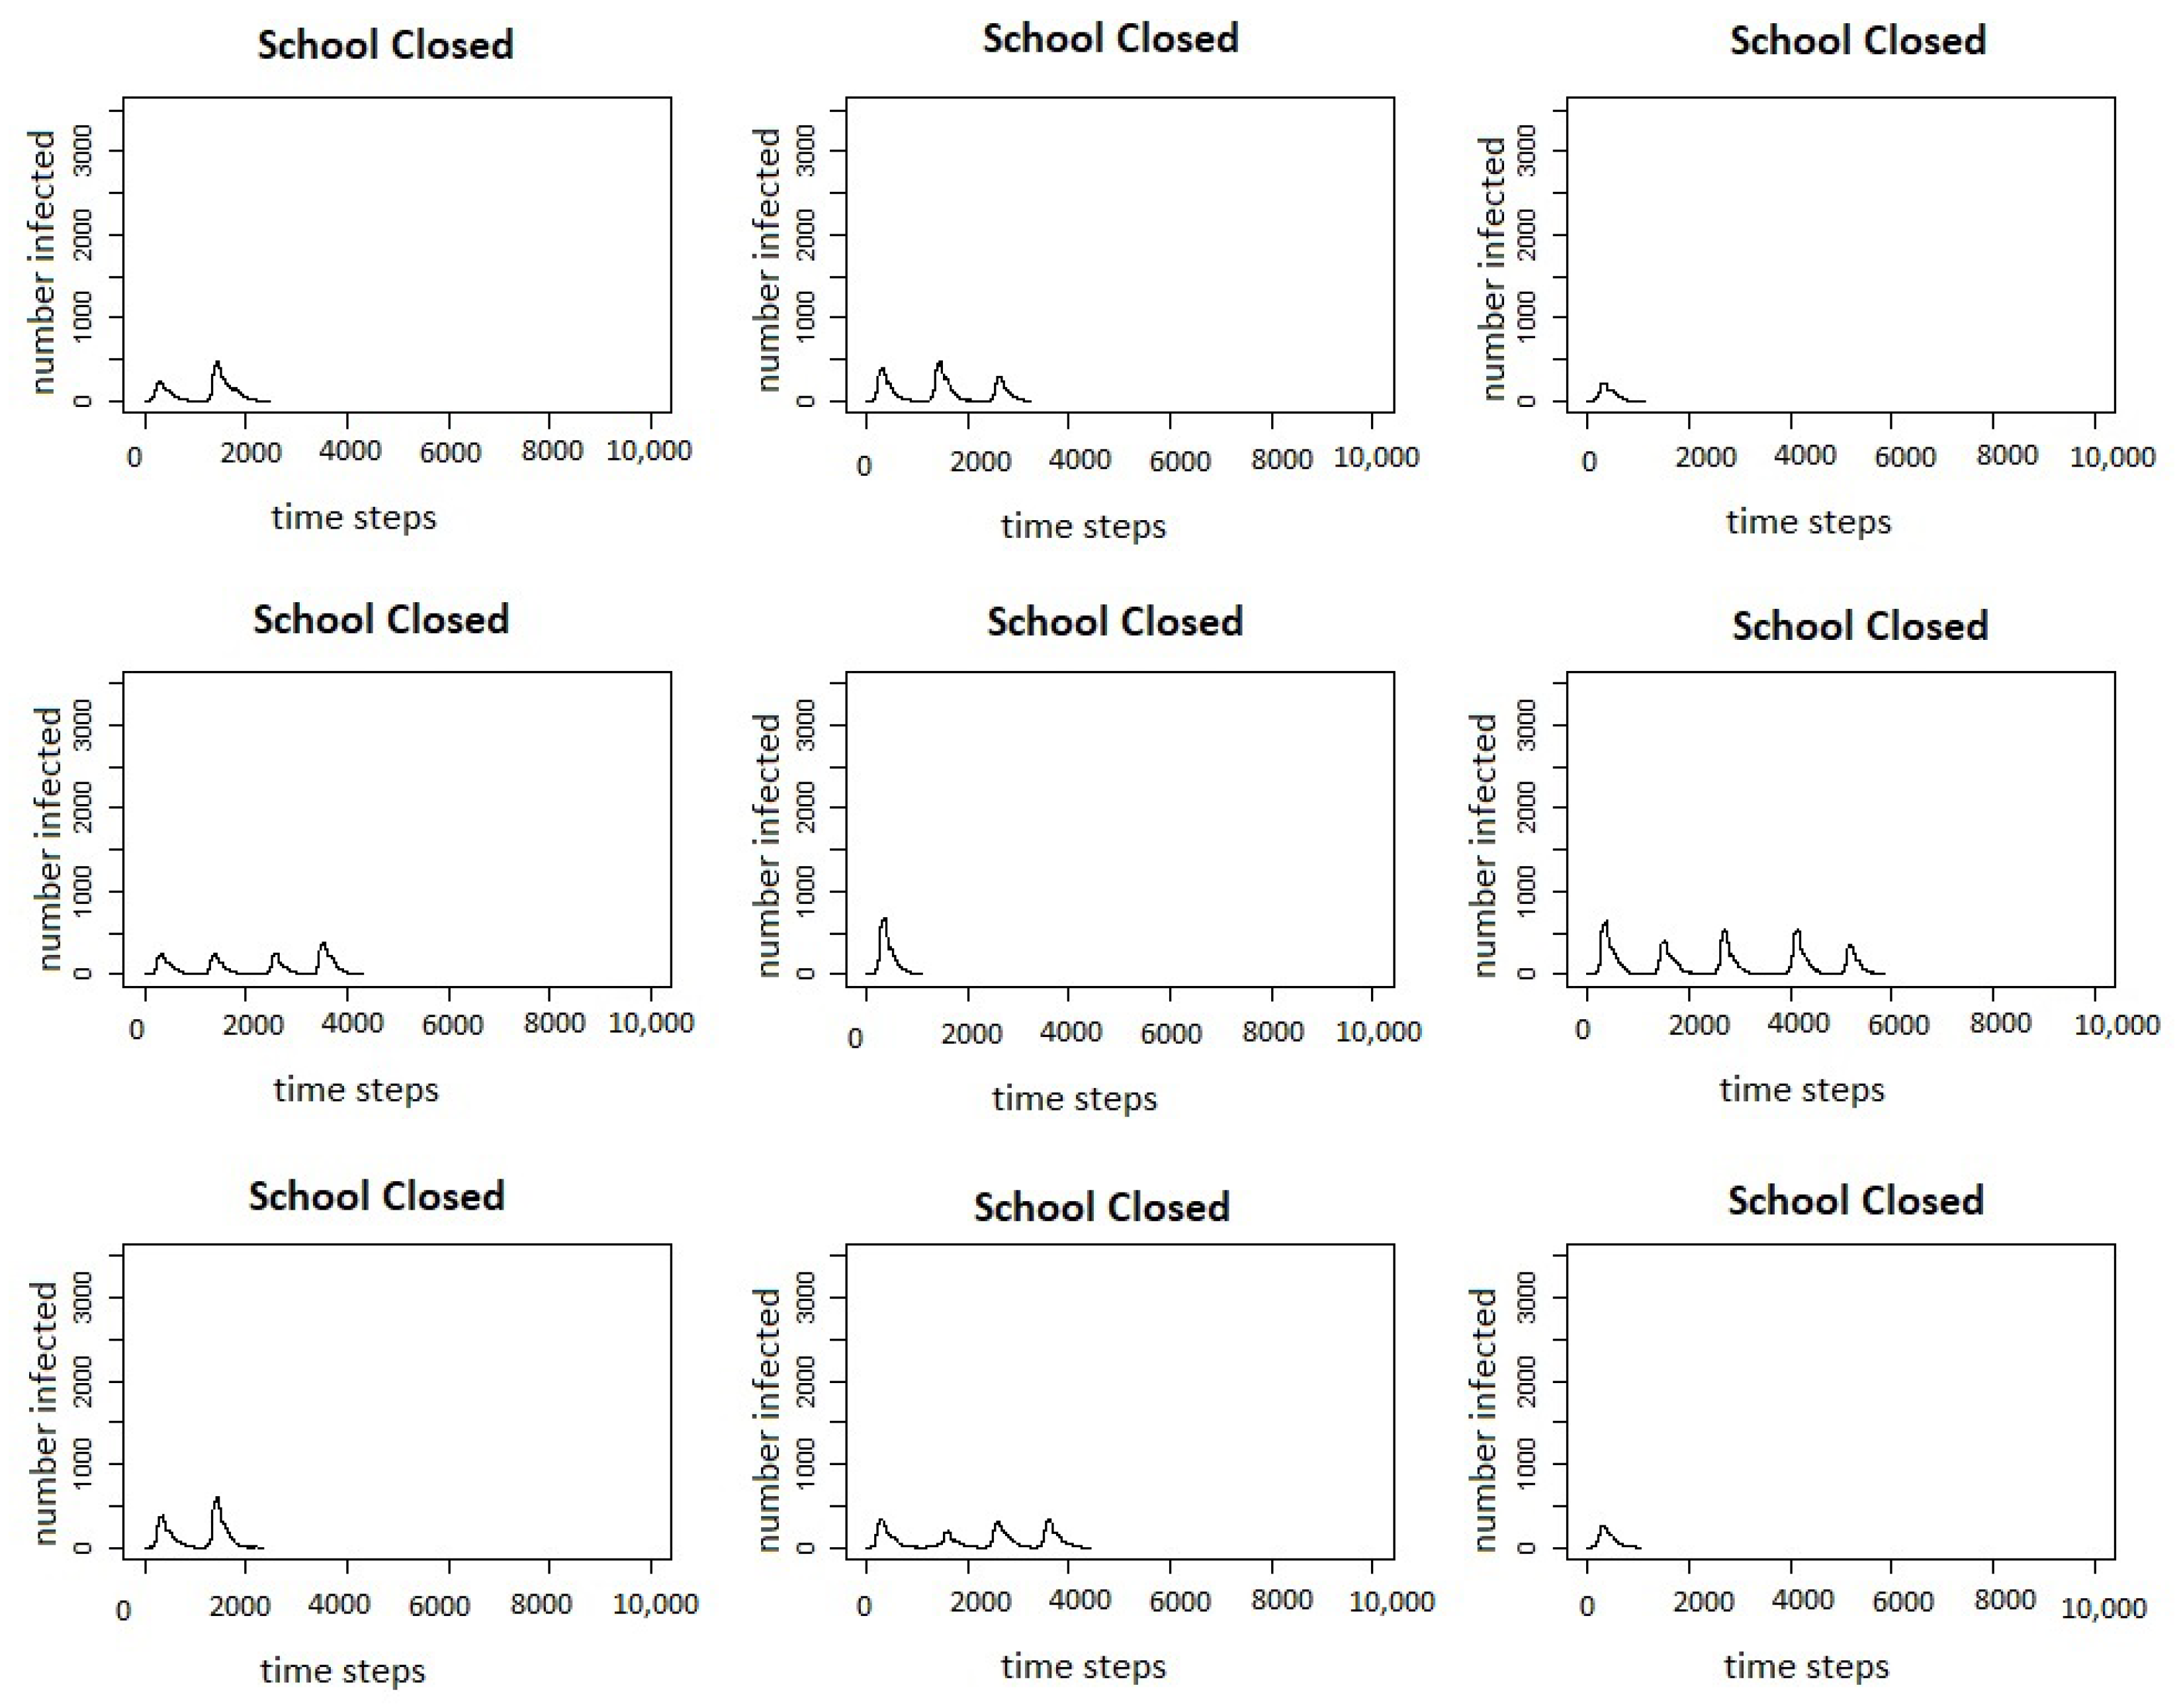
We also see that while the time to the maximum number of agents infected or the time to the peak does not change much between the scenario without interventions to the scenario with school closures, the time to the max infected increases by almost 20 days going from the scenario without interventions to the scenario with vaccinations. Additionally, the average total length of the outbreak increases from about 115 days without interventions to about 135 days with vaccinations, and about 141 days with the school closures. Thus, while both interventions lead to a decrease in the total number of cases, they increase the length of the outbreak by almost a month. The reason for this increase in the length of the outbreak can likely be seen when looking at the curves showing the total number of infected agents over time. Figure 6 shows the infection curves for all of the 300 runs of the three different scenarios of the COVID-19 model: no interventions, vaccinations, and school closures, and Figure 7 shows the infection curves for nine individual runs of school closures.
In both figures, we can see that in a number of runs, there are multiple peaks of the outbreak. Even though the schools do not reopen until there are fewer than two agents infected in the county, this does not count exposed agents, and if there are a number of agents exposed, they may start spreading the virus again once the schools are re-opened. Comparing the results of the model for the intervention scenario for measles with vaccination and the scenario for COVID-19 with school closures, we can see that the responses to interventions are very different. The measles outbreaks reach one small peak and then die out, whereas in many cases, the COVID-19 outbreaks reach multiple peaks.
Comparing the results between diseases, it is interesting to note that the measles outbreaks with vaccination and school closures are significantly smaller than the COVID-19 outbreak with the same vaccination rates. This is likely because of a number of characteristics of COVID-19 that are different than measles: agents are infectious before showing any symptoms, and there are a large number of mild cases. Agents who are presymptomatic but infectious will not change their behaviour in the model, and agents with mild cases will likely stay home less often than those with more severe cases; both of these factors should drive up the number of those infected, and are not present in the measles model. It is also important to see that the school closure policies reduce the size of the COVID-19 outbreak more than vaccinations, while the vaccinations reduce the size of the measles outbreak more than school closures. Again, this can be contributed to the characteristics of the disease. The presymptomatic and mild COVID-19 cases play a large role in the outbreak dynamics, and these individuals do not change their behaviour to staying home more when sick, as the symptomatic agents in the measles model would; thus, movement restrictions are more successful at controlling the COVID-19 outbreak, because these individuals will not be mixing with their peers, leading to fewer infections.
3.4. COVID-19 in Leitrim: Real Interventions and Timings
The experiment reported in the previous section demonstrated the flexibility of agent-based models in terms of simulating the effect of interventions on the complex dynamics of a disease spreading through a population and environment. In this section, we report on an experiment that assessed the ability of our COVID-19-adapted, agent-based model to replicate the dynamics of a real COVID-19 outbreak through a population when the actual interventions imposed during the real outbreak are simulated in the model.
We focus on simulating the COVID-19 outbreak in Leitrim County, Ireland, using real timings and interventions. Although the first case of COVID-19 was reported in the Republic of Ireland on 29 February 2020, there were no cases reported in Leitrim until the 21st of March, when three cases were reported. In response to the COVID-19 outbreak, Ireland has taken a number of country-wide mitigation measures. On 13th March, all schools and universities were closed, and on 28th March, a nationwide lockdown was implemented. The initial lockdown required all non-essential workers to stay within 2 km of their home, and all restaurants, pubs, and non-essential shops were closed.
To simulate these measures, we make a number of changes to the model, mostly to the transportation component of the model. When schools are closed, students do not attend school, and move about their day as if it was a weekend until lockdown occurs. Working agents are classified as either essential or non-essential to determine if they continue to work during lockdown, and 20% of working agents are considered to be essential [32]. During lockdown, all non-essential agents stay within their small area, and have a 90% chance of being in their home at a given point during daytime hours. Although Ireland has gone through a number of phases to lift the lockdown measures starting with Phase 1 on 18 May 2020, in the modelling scenario, we do not lift the lockdown measures but run the simulation until there are no additional cases in the county. To mimic the outbreak in Leitrim, we start the scenario with three agents infected after the schools have already been closed.
The results from running the model mimicking the real Irish interventions for COVID-19 compared to no interventions can be found in Table 6. As expected, implementing the interventions results in a large reduction of agents infected, with an average of 304 agents having been infected at the end of the outbreak compared to 26,134 with no interventions. Similarly, there are, on average, only 48 agents infected at the peak of the outbreak with interventions, compared to 2144 without interventions. Looking at the timings of the outbreaks, the interventions increase the total number of days until there are no longer any exposed or infected agents to 142 days from 115 days, and increase the days until the peak to 63 from 57. This is likely due to the slower spread because agents are staying home and not interacting with each other as often, thus, the rapid growth in cases is not seen in the intervention scenario. This results in the susceptible pool of agents staying larger for a longer period of time. However, reducing the number of contacts an agent has also reduces the effective reproductive number (): is reduced because it takes into account both the number of individuals who are no longer susceptible (which still grows under the intervention, if at a reduced rate), and how public health interventions slow transmission. This reduction in also leads to a reduction in the number of non-susceptible individuals in the population needed to reach herd immunity. Therefore, the outbreak with the intervention results in fewer people being infected overall, because there is a lower level needed for herd immunity, but the outbreak lasts longer because the slower growth rate means it takes longer to reach this reduced herd immunity level.
In the real COVID-19 epidemic, there were 83 confirmed cases in Leitrim from 29 February until 19 July 2020. This is 142 days into the epidemic, the average time for the outbreak to last in the simulation model. From 19 July through 5 August 2020, there were only two more cases identified in the county. Although, at first, 83 cases appears to be much smaller than the simulated 304 cases in the agent-based model, the model identifies all cases including those who would be asymptomatic or mild and would not have been tested, while the 83 cases are only those who have been identified through testing. If we assume that the average number of cases simulated in the model is the real number of cases in Leitrim, this would result in approximately 27% of cases being identified. This is in line with the results from a seroprevalence study that was carried out in Ireland in the summer of 2020 which found that the number of estimated cases based on the study results was three times higher than the identified cases [33].
4. Discussion
Our results show the feasibility of transforming an agent-based model for the spread of measles to a model for the spread of COVID-19. We show that when porting an existing model to a new disease, we can alter a few key disease parameters and capture the dynamics of the other disease. The differences in the results are what we would expect from the different diseases and parameters. These differences highlight the complex nature of the system and how that complexity needs to be considered when simulating the infectious disease dynamics. This is important, as the COVID-19 pandemic has shown us that the next pandemic will not always be a disease known to us or that is expected. To be better prepared for the future infectious diseases, a model that can accurately simulate the intricacies of a given population but that is portable between diseases could provide valuable information.
We look at three different possible values for , and although the scale of outbreaks in all three simulated scenarios is extremely worrying, it is important to recognize the relative differences between these scenarios. Increasing from an of 2 to 6.28 results in a 9.3% increase in total cases and a 23.5% increase in the maximum number of cases. It is also important to recognize that the differences between these scenarios is the basic reproductive number , and that (unlike the incubation period and infectious period) the parameter is something that can be affected by societal interventions, such as social distancing. Thus, the main conclusion we draw from the differences in the outbreak structure between the different values is the importance in reducing the number of contacts any one infected individual has. Additionally, the differences in the results show the importance of knowing the in predicting outbreaks. If a predictive model uses an that is too small, then a model will underestimate the number of cases, and a country using a model with an that is too low may not be entirely prepared for the actual size of the outbreak.
The importance of the disease dynamics is further seen when we adjust the model to account for agents being infectious before they show symptoms. This does not just increase the infectious period, but it influences agent behaviour. Agents who do not have symptoms act as if they are not sick, and thus will spread the disease unknowingly, whereas an agent who knows that they are sick will adapt their behaviour and isolate. While we did not find a significant difference in the total number of agents infected, we see an increase in the peak, and the peak is reached faster. The faster growth when agents are infectious before they show symptoms show the potential importance of identifying and isolating the contacts of those who are infected as a strategy of slowing the spread of the virus. Going forward, it will be important to get a better understanding of these parameters for the specific population and how adjusting behaviours as the outbreak progresses might influence the spread of the virus. Agent-based models allow us to adjust behaviours for an entire run or for the entire population, but also have the ability to allow for different behaviours within different groups and for these behaviours to change over time. Unlike a compartmental SEIR model where everyone in a compartment is homogeneous, an agent-based model gives us the ability to have each agent adopt a set of behaviours based on their unique set of characteristics.
Finally, we looked at how the model performs when simulating a scenario that replicates the interventions that were used in Ireland at the start of the pandemic. Our results show that when lockdown measures are not lifted in the simulation, the number of days the pandemic lasts in the simulation of Leitrim corresponds relatively well with the number of days the pandemic lasted in the real county. Although the model shows a higher number of cases than what were identified in the real county, the real cases are the identified cases while the model shows all cases. The similarities between our modelling scenario for Leitrim and the real outbreak in Leitrim might suggest that even after restrictions were lifted, people continued to practice safer behaviours. Evidence for the continuation of safer social distancing practices and additional measures to stop the spread of the virus, such as hand washing and mask wearing after movement restrictions were lifted, can be found in the public opinion surveys carried out in Ireland [34]. Future work can be done to account for identified and unidentified cases by including testing and asymptomatic agents in the model. Using real data on the number of tests run in Ireland and the percentage of positive tests would allow us to better capture the outbreak.
One limitation of our study is that we only simulate the spread of the infectious diseases through Leitrim, Ireland. Leitrim is a small county with no major urban areas. The size of the population, as well as the population density may have a large impact on the results, especially once we consider school closure and movement restriction policies. However, this does not reduce the importance of our results. In developing intervention strategies for an infectious disease, it is vital to understand how it will affect all types of areas, from larger cities to smaller counties. Understanding how a disease spreads through different counties based on their population structure and transportation networks is an important aspect in fully understanding how the disease will affect an entire country. The ability of an agent-based model to be tailored to the specific characteristics of different regions or counties makes them an important tool in learning as much detail as we can about the spread of infectious diseases. Future work will focus on modelling the spread of COVID-19 both in other counties and in an all-Ireland model. Additionally, when we look at the intervention strategies of closing schools, we only look at one scenario, closing schools when 100 agents are infected and reopening the schools when less than two agents are infected, and additional scenarios should be analysed to determine the ideal school closure policy.
As we first want to investigate how the changes we made to the disease parameters impact the disease dynamics, we only restrict our focus to just changes in the disease component of the model. However, there are a number of other differences that could occur when comparing an outbreak of a well-known disease, such as measles, where there is a large level of pre-existing immunity compared to an emerging disease such as COVID-19, especially in the movements and actions of the agents. While most people or agents might not greatly adjust their behaviour during a measles outbreak, the COVID-19 pandemic has caused significant changes in individual behaviours and mobility. Agent-based models are able to capture these changes, and future work on the adapted model will focus on how agents change their actions based on the level of disease within the community. However, we feel that prior to looking at the changes in agents’ behaviour, it is important to understand the changes in the underlying disease dynamics.
5. Conclusions
We have shown the adaptability of the disease component of an agent-based model for the spread of an infectious disease and how the changes in the parameters related to the disease component can lead to complex changes in the model results. This adaptability is an important characteristic of agent-based models for epidemiology, which means that creating and maintaining an agent-based model of a society and region is a useful investment as part of pandemic preparedness, because such a baseline model can be adapted to the specific characteristics of different diseases relatively quickly. The response of the modeling community to COVID-19 was the creation of a number of agent-based models for the spread of COVID-19, some of which had been adapted from a pre-existing agent-based model designed to simulate a different disease, as we have done here. However, we are unaware of work that provides a comparison (or validation of the differences) of the output between the original and adapted disease components. This comparison is an important step in understanding the agent-based model being used and the complexity of the system, and validating the model for further use.
Even with the reduction in time of adapting an existing agent-based model by changing the disease component, the time required to test the adapted model and run the required simulations still will likely be more than that required to create a more classic mathematical equation-based model, such as the SEIR model, to simulate the spread of a disease within a population. However, it is a well-known fact that all models are wrong, but useful information can still be determined from some of those models, and different types of models can provide different information. While a population-level SEIR model can look at the dynamics of the pandemic at a higher level, agent-based models allow for a detailed analysis of agent movements, characteristics, and contact patterns and how changes in any of these can impact the course of a pandemic. The agent-based model can capture the complexity between these different parts of the system where SEIR models cannot. This level of detail can provide information on specific regions, groups of agents, or the relative success of an intervention.
Author Contributions
Conceptualization, E.H. and J.D.K.; methodology, E.H. and J.D.K.; software, E.H.; validation, E.H; formal analysis, E.H.; writing—original draft preparation, E.H.; writing—review and editing, J.D.K.; supervision, J.D.K. All authors have read and agreed to the published version of the manuscript.
Funding
This work was partly supported by the Fiosraigh Scholarship Programme of the Technological University Dublin, and by the ADAPT Centre for Digital Content Technology which is funded under the SFI Research Centres Programme and is co-funded under the European Regional Development Funds.
Institutional Review Board Statement
Not applicable.
Informed Consent Statement
Not applicable.
Data Availability Statement
Data available on request.
Conflicts of Interest
The authors declare no conflict of interest.
References
- Sanyaolu, A.; Okorie, C.; Marinkovic, A.; Patidar, R.; Younis, K.; Desai, P.; Hosein, Z.; Padda, I.; Mangat, J.; Altaf, M. Comorbidity and its Impact on Patients with COVID-19. SN Compr. Clin. Med. Vol. 2020, 2, 1069–1076. [Google Scholar] [CrossRef]
- Charaudeau, S.; Pakdaman, K.; Boëlle, P.Y. Commuter Mobility and the Spread of Infectious Diseases: Application to Influenza in France. PLoS ONE 2014, 9, e83002. [Google Scholar] [CrossRef] [PubMed] [Green Version]
- Dalziel, B.D.; Pourbohloul, B.; Ellner, S.P. Human mobility patterns predict divergent epidemic dynamics among cities. Proc. R. Soc. B 2013, 280, 20130763. [Google Scholar] [CrossRef] [PubMed]
- Hunter, E.; Mac Namee, B.; Kelleher, J. An open-data-driven agent-based model to simulate infectious disease outbreaks. PLoS ONE 2018, 13, e0208775. [Google Scholar] [CrossRef]
- Simpson, C.R.; Beever, D.; Challen, K.; Angelis, D.D.; Fragaszy, E.; Goodacre, S.; Hayward, A.; Lim, W.S.; Rubin, G.J.; Semple, M.G.; et al. The UK’s pandemic influenza research portfolio: A model for future research on emergin infections. Lancet Infect. Dis. 2019, 19, e295–e300. [Google Scholar] [CrossRef] [Green Version]
- Anderson, R.M.; Heesterbeek, H.; Klinkenberg, D.; Hollingsworth, T.D. How will country-based mitigation measures influence the course of the COVID-19 epidemic? Lancet 2020, 395, 931–934. [Google Scholar] [CrossRef]
- ECDC. Disease Background of COVID-19; European Centre for Disease Prevention and Control: Solna, Sweden, 2020. [Google Scholar]
- WHO. Coronavirus (COVID-19) Outbreak Situation Dashboard; World Health Organization: Geneva, Switzerland, 2020. [Google Scholar]
- BBC. First Case of Coronavirus In Republic of Ireland. BBC News, 29 February 2020. Available online: https://www.bbc.com/news/world-europe-51693160 (accessed on 13 April 2020).
- DOH. Statement from the National Public Health Emergency Team—Monday 13 April. Gov.ie, 13 April 2020. [Google Scholar]
- Wang, H.; Wang, Z.; Dong, Y.; Chang, R.; Xu, C.; Yu, X.; Zhang, S.; Tsamlag, L.; Shang, M.; Huang, J.; et al. Phase-adjusted estimation of the number of Coronavirus Disease 2019 cases in Wuhan, China. Cell Discov. 2020, 6, 1–8. [Google Scholar] [CrossRef] [Green Version]
- Quilty, B.J.; Clifford, S.; Liu, Y.; Diamond, C.; Edmunds, W.J.; Funk, S.; Gimma, A.; Munday, J.D.; Gibbs, H.; Bosse, N.I.; et al. Effectiveness of Airport Screening at Detecting Travellers Infected with Novel Coronavirus (2019-nCoV). Eurosurveillance 2020, 25, 2000080. [Google Scholar] [CrossRef]
- Hellewell, J.; Abbott, S.; Gimma, A.; Bosse, N.I.; Jarvid, C.I.; Russell, T.W.; Munday, J.D.; Edmunds, W.J.; Funk, S.; Centre for the Mathematical Modelling of Infectious Diseases COVID-19 Working Group; et al. Feasibility of controlling COVID-19 outbreaks by isolation of cases and contacts. Lancet Glob. Health 2020, 8, E488–E496. [Google Scholar] [CrossRef] [Green Version]
- Keeling, M.J.; Rohani, P. Modelling Infectious Diseases in Humans and Animals; Princeton University Press: Princeton, NJ, USA, 2008. [Google Scholar]
- Danon, L.; Brooks-Pollock, E.; Bailey, M.; Keeling, M.J. A spatial model of COVID-19 transmission in England and Wales: Early spread and peak timing. medRxiv 2020. [Google Scholar] [CrossRef] [Green Version]
- Hunter, E.; Mac Namee, B.; Kelleher, J.D. A Taxonomy for Agent-Based Models in Human Infectious Disease Epidemiology. J. Artif. Soc. Soc. Simul. 2017, 20, 2. [Google Scholar] [CrossRef] [Green Version]
- Marini, M.; Chokani, N.; Abhari, R.S. COVID-19 Epidemic in Switzerland: Growth Prediction and Containment Strategy Using Artifical Intelligence and Big Data. medRxiv 2020. [Google Scholar] [CrossRef] [Green Version]
- Chang, S.L.; Harding, N.; Zachreson, C.; Cliff, O.M.; Prokopenko, M. Modelling transmission and control of the COVID-19 pandemic in Australia. Nat. Commun. 2020, 11, 5710. [Google Scholar] [CrossRef] [PubMed]
- Ferguson, N.M.; Cummings, D.A.T.; Fraser, C.; Cajka, J.C.; Cooley, P.C.; Burke, D.S. Strategies for Mitigating an Influenza Pandemic. Nature 2006, 7101, 448–452. [Google Scholar] [CrossRef]
- Hunter, E.; Mac Namee, B.; Kelleher, J.D. A Model for the Spread of Infectious Diseases in a Region. Int. J. Environ. Res. Public Health 2020, 17, 3119. [Google Scholar] [CrossRef] [PubMed]
- Hunter, E.; Kelleher, J. Using a Hybrid Agent-Based and equation-based Model to Test School Closure Policies. BMC Public Health 2020, 21. [Google Scholar] [CrossRef] [Green Version]
- Hunter, E.; Mac Namee, B.; Kelleher, J.D. Hybrid Agent-Based and Equation-Based Model for Infectious Disease Spread (Version 1.0.0). CoMSES Computational Model Library. Available online: https://www.comses.net/codebases/e30e36f0-5471-46b5-9c78-27b3f2185ff9/releases/1.0.0/ (accessed on 19 April 2020).
- CSO. Census 2011 Boundary Files. 2014. Available online: https://www.cso.ie/en/census/census2011boundaryfiles/ (accessed on 26 May 2016).
- CSO. Census 2016 Place of Work, School or College—Census of Anonymised Records (POWSCAR); Central Statistics Office: Dublin, Ireland, 2017. [Google Scholar]
- Rodrigue, J.P.; Comtois, C.; Slack, B. The Geography of Transport Systems; Routledge, Taylor and Francis Group: London, UK, 2006. [Google Scholar]
- WHO. Report of the WHO-China Joint Mission on Coronavrius Disease 2019 (COVID-19); World Health Organization: Geneva, Switzerland, 2020. [Google Scholar]
- Liu, Y.; Gayle, A.A.; Wilder-SMith, A.; Rocklov, J. The reproductive number of COVID-19 is higher compared to SARS coronavirus. J. Travel Med. 2020, 27. [Google Scholar] [CrossRef] [PubMed] [Green Version]
- Wu, Z.; McGoogan, J.M. Characteristics of and Important Lessons From the Coronavirus Disease 2019 (COVID-19) Outbreak in China: Summary of a Report of 72 314 Cases From the Chinese Center for Disease Control and Prevention. JAMA 2020, 323, 1239–1242. [Google Scholar] [CrossRef] [PubMed]
- He, X.; Lau, E.H.; Wu, P.; Deng, X.; Wang, J.; Hao, X.; Lau, Y.C.; Wong, J.Y.; Guan, Y.; Tan, X.; et al. Temporal dynamics in viral shedding and transmissibility of COVID-19. Nat. Med. 2020, 26, 672–675. [Google Scholar] [CrossRef] [Green Version]
- Hunter, E.; Kelleher, J.D. A Framework for Validating and Testing Agent-Based Models: A Case Study from Infectious Diseases Modelling. In Proceedings of the 34th annual European Simulation and Modelling Conference, Toulouse, France, 21–23 October 2020. [Google Scholar] [CrossRef]
- Fine, P.; Eames, K.; Heymann, D.L. “Herd Immunity”: A Rough Guide. Clin. Infect. Dis. 2011, 52, 911–916. [Google Scholar] [CrossRef]
- Redmond, P.; McGuinness, S. Essential Employees During the COVID-19 Crisis. ESRI Surv. Stat. Rep. Ser. 2020. [Google Scholar] [CrossRef]
- Health Protection Surveillance Centre. Preliminary Report of the Results of the Study to Investigate COVID-19 Infection in People Living in Ireland (SCOPI): A National Seroprevalence Study, June–July 2020; Health Service Executive: Dublin, Ireland, 2020. [Google Scholar]
- Amárach Public Opinion Survey. Available online: https://www.gov.ie/en/collection/6b4401-view-the-amarach-public-opinion-survey/ (accessed on 7 September 2020).
Figure 1.
Infection curves for all model runs for a measles outbreak ( = 12) and a COVID-19 outbreak ( = 3.28).
Figure 1.
Infection curves for all model runs for a measles outbreak ( = 12) and a COVID-19 outbreak ( = 3.28).

Figure 2.
The number of infected agents by time-step (each time-step represents two hours) in the simulation with different values.
Figure 2.
The number of infected agents by time-step (each time-step represents two hours) in the simulation with different values.

Figure 3.
Infection curves for model runs with and without infectious agents before they begin to show symptoms.
Figure 3.
Infection curves for model runs with and without infectious agents before they begin to show symptoms.
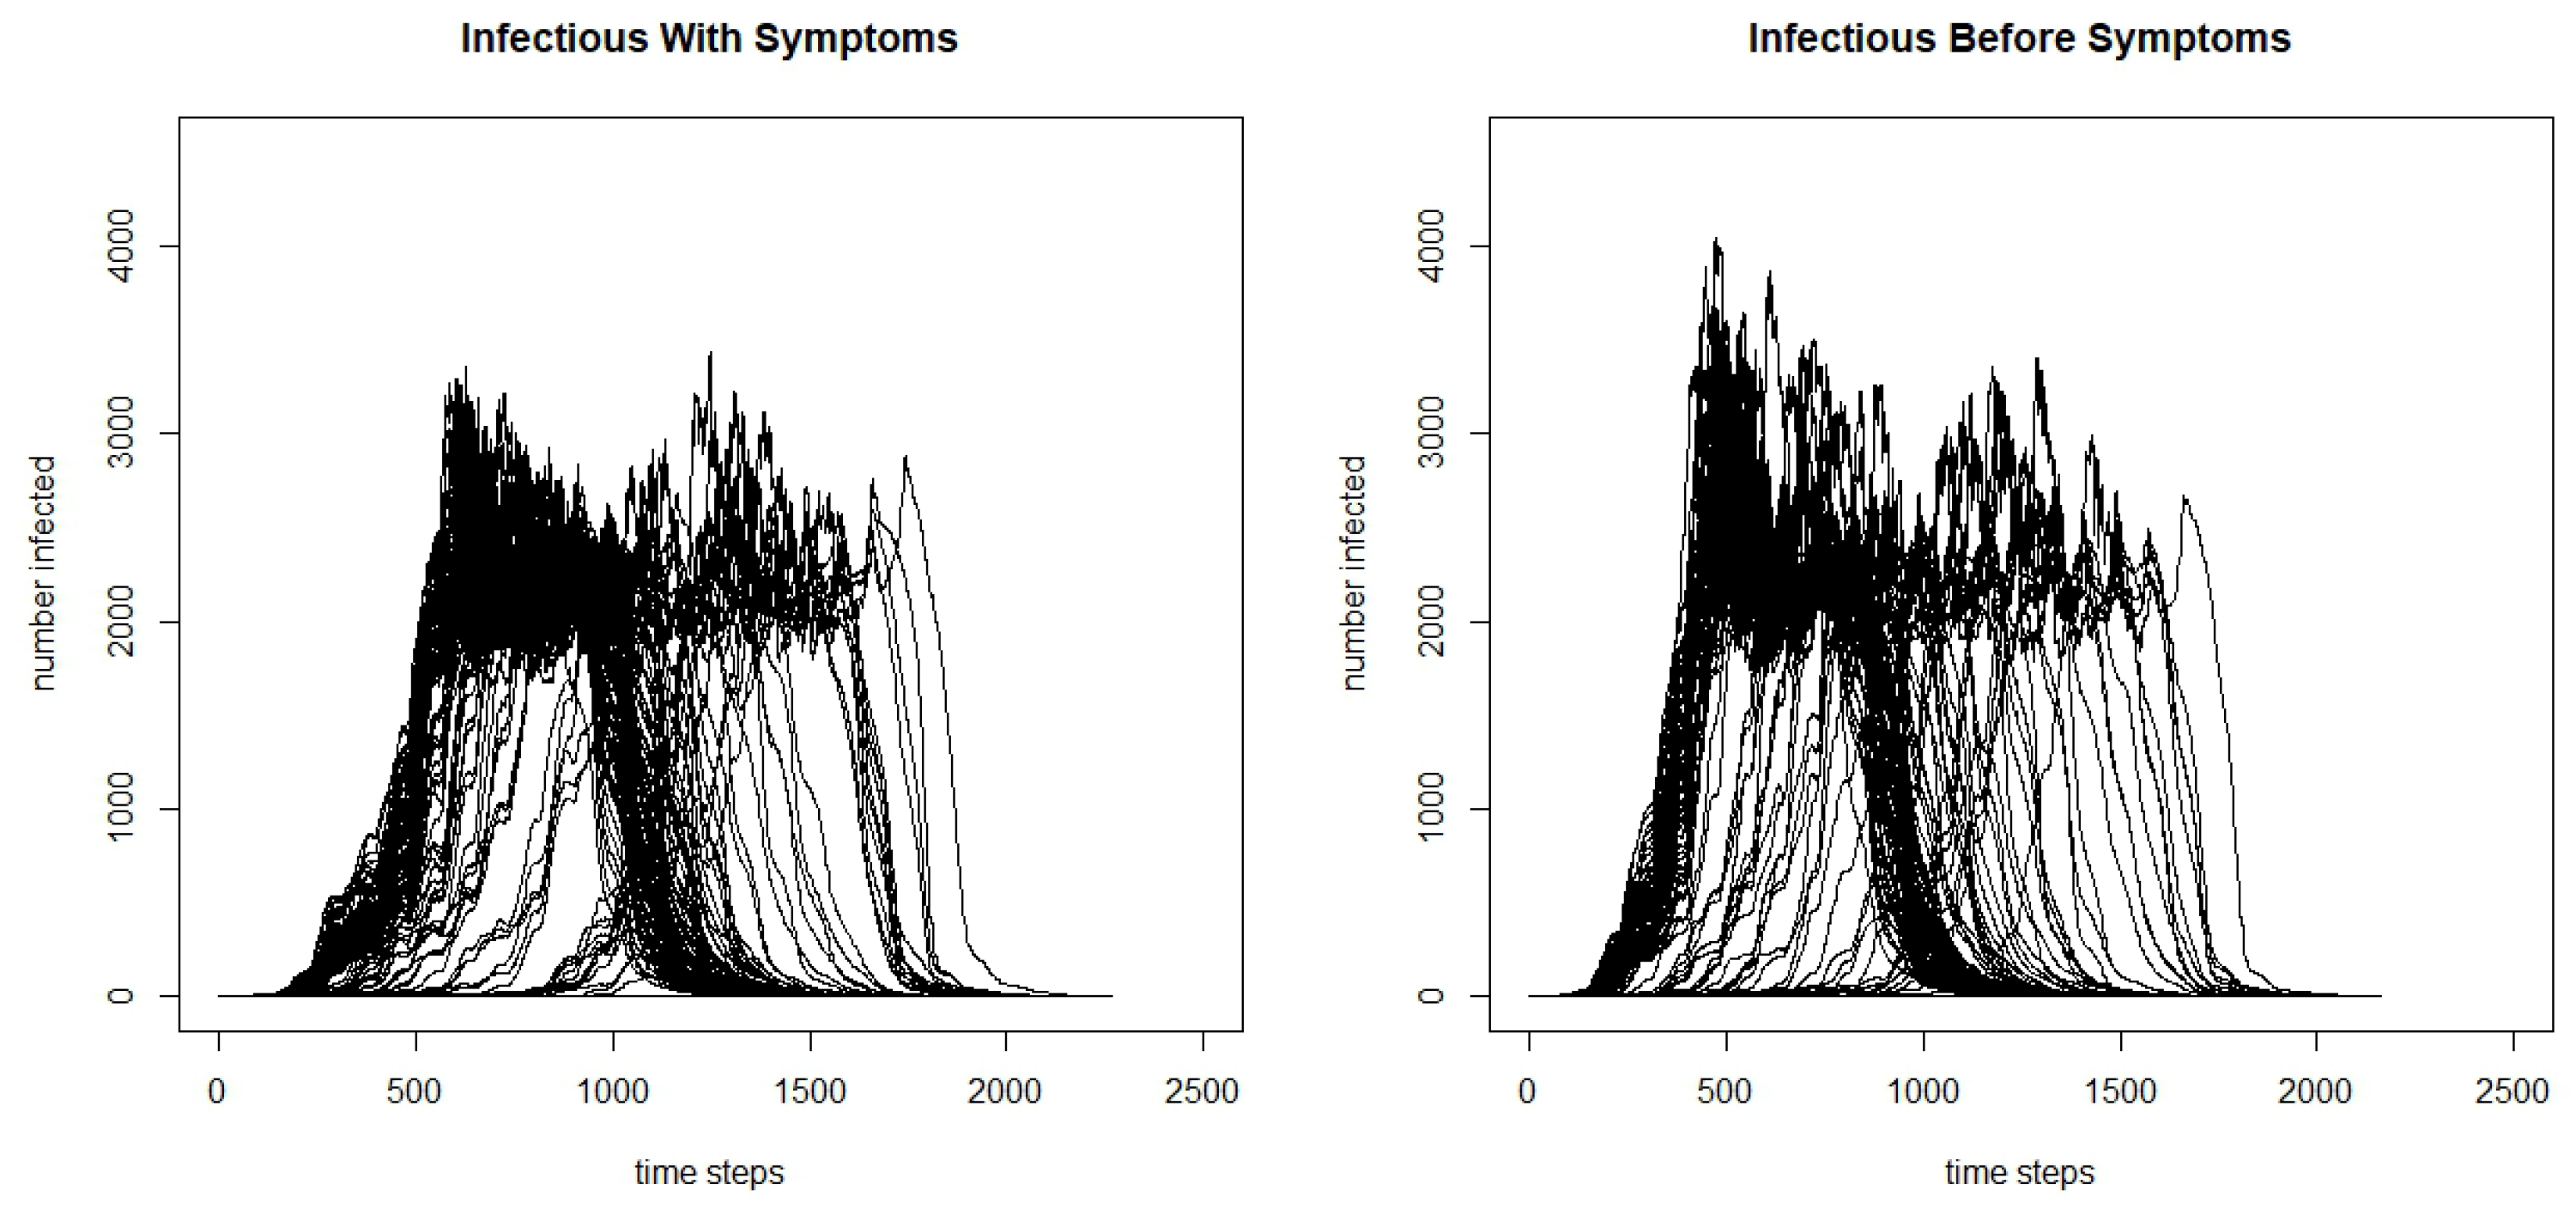
Figure 4.
Infection curves for all model runs for school closures in a measles outbreak.
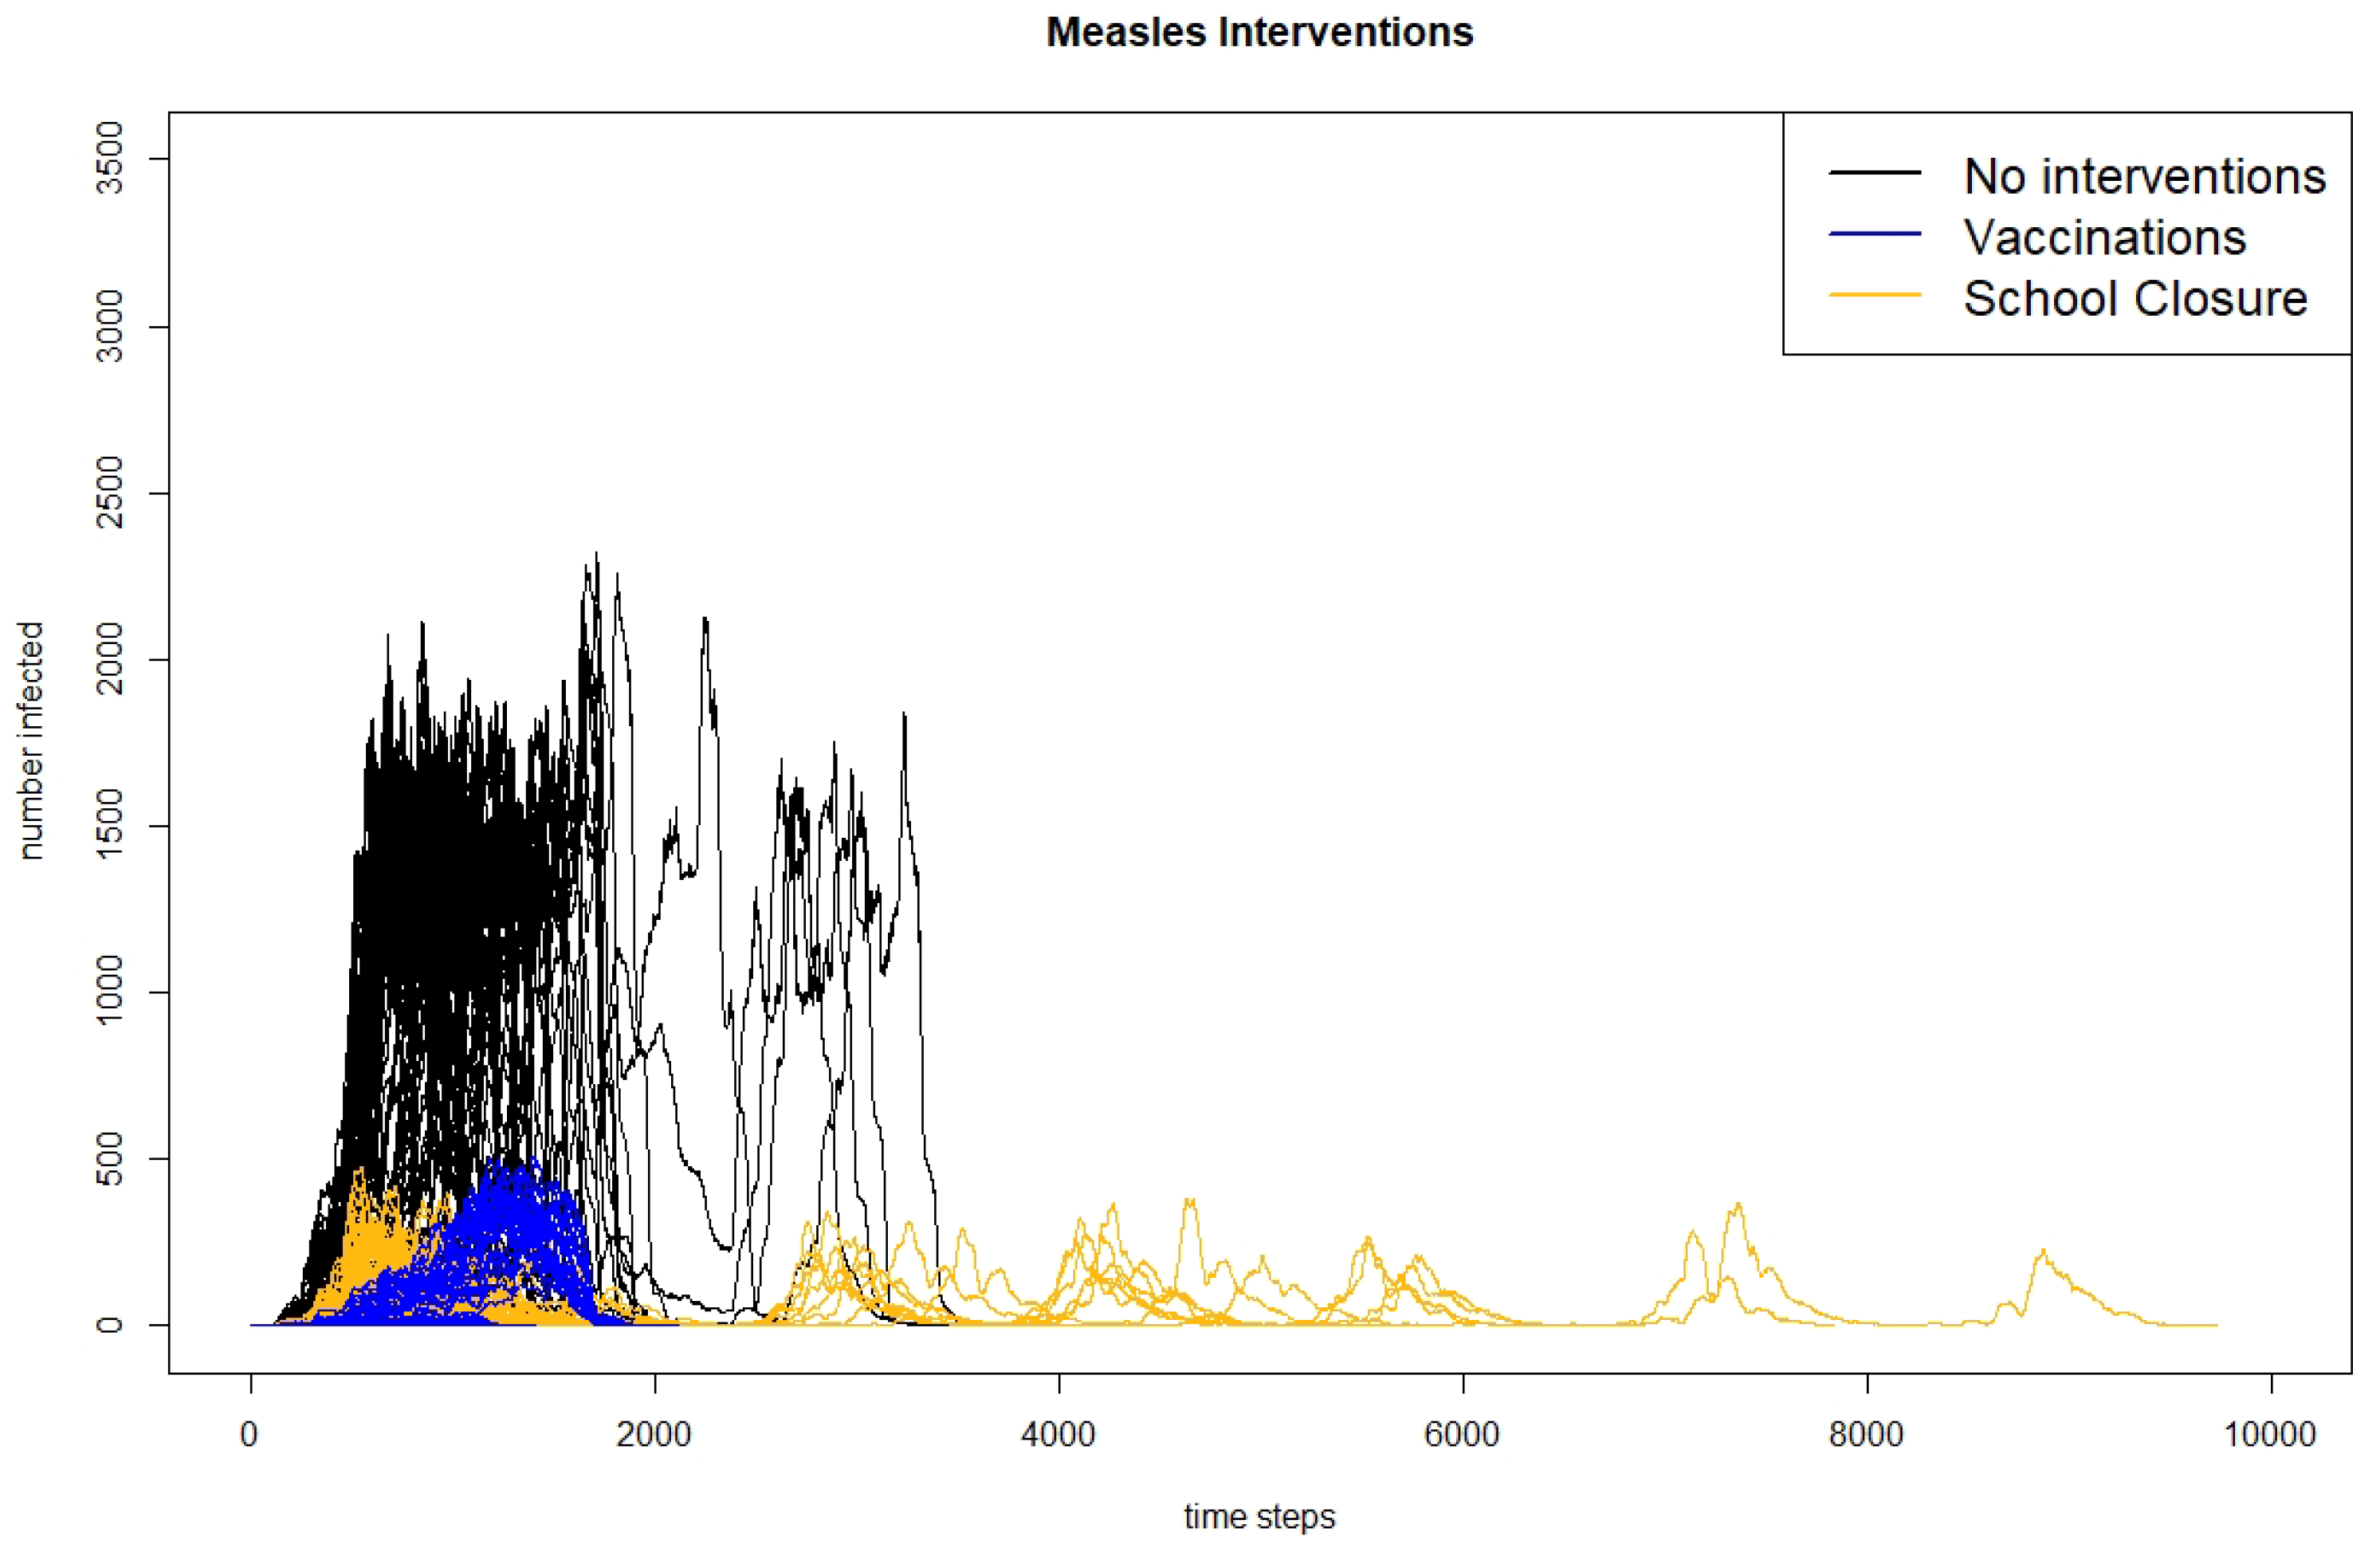
Figure 5.
Infection curves for nine individual model runs for school closures in a measles outbreak.
Figure 5.
Infection curves for nine individual model runs for school closures in a measles outbreak.

Figure 6.
Infection curves for all model runs for school closures in a COVID-19 outbreak ( = 3.28).
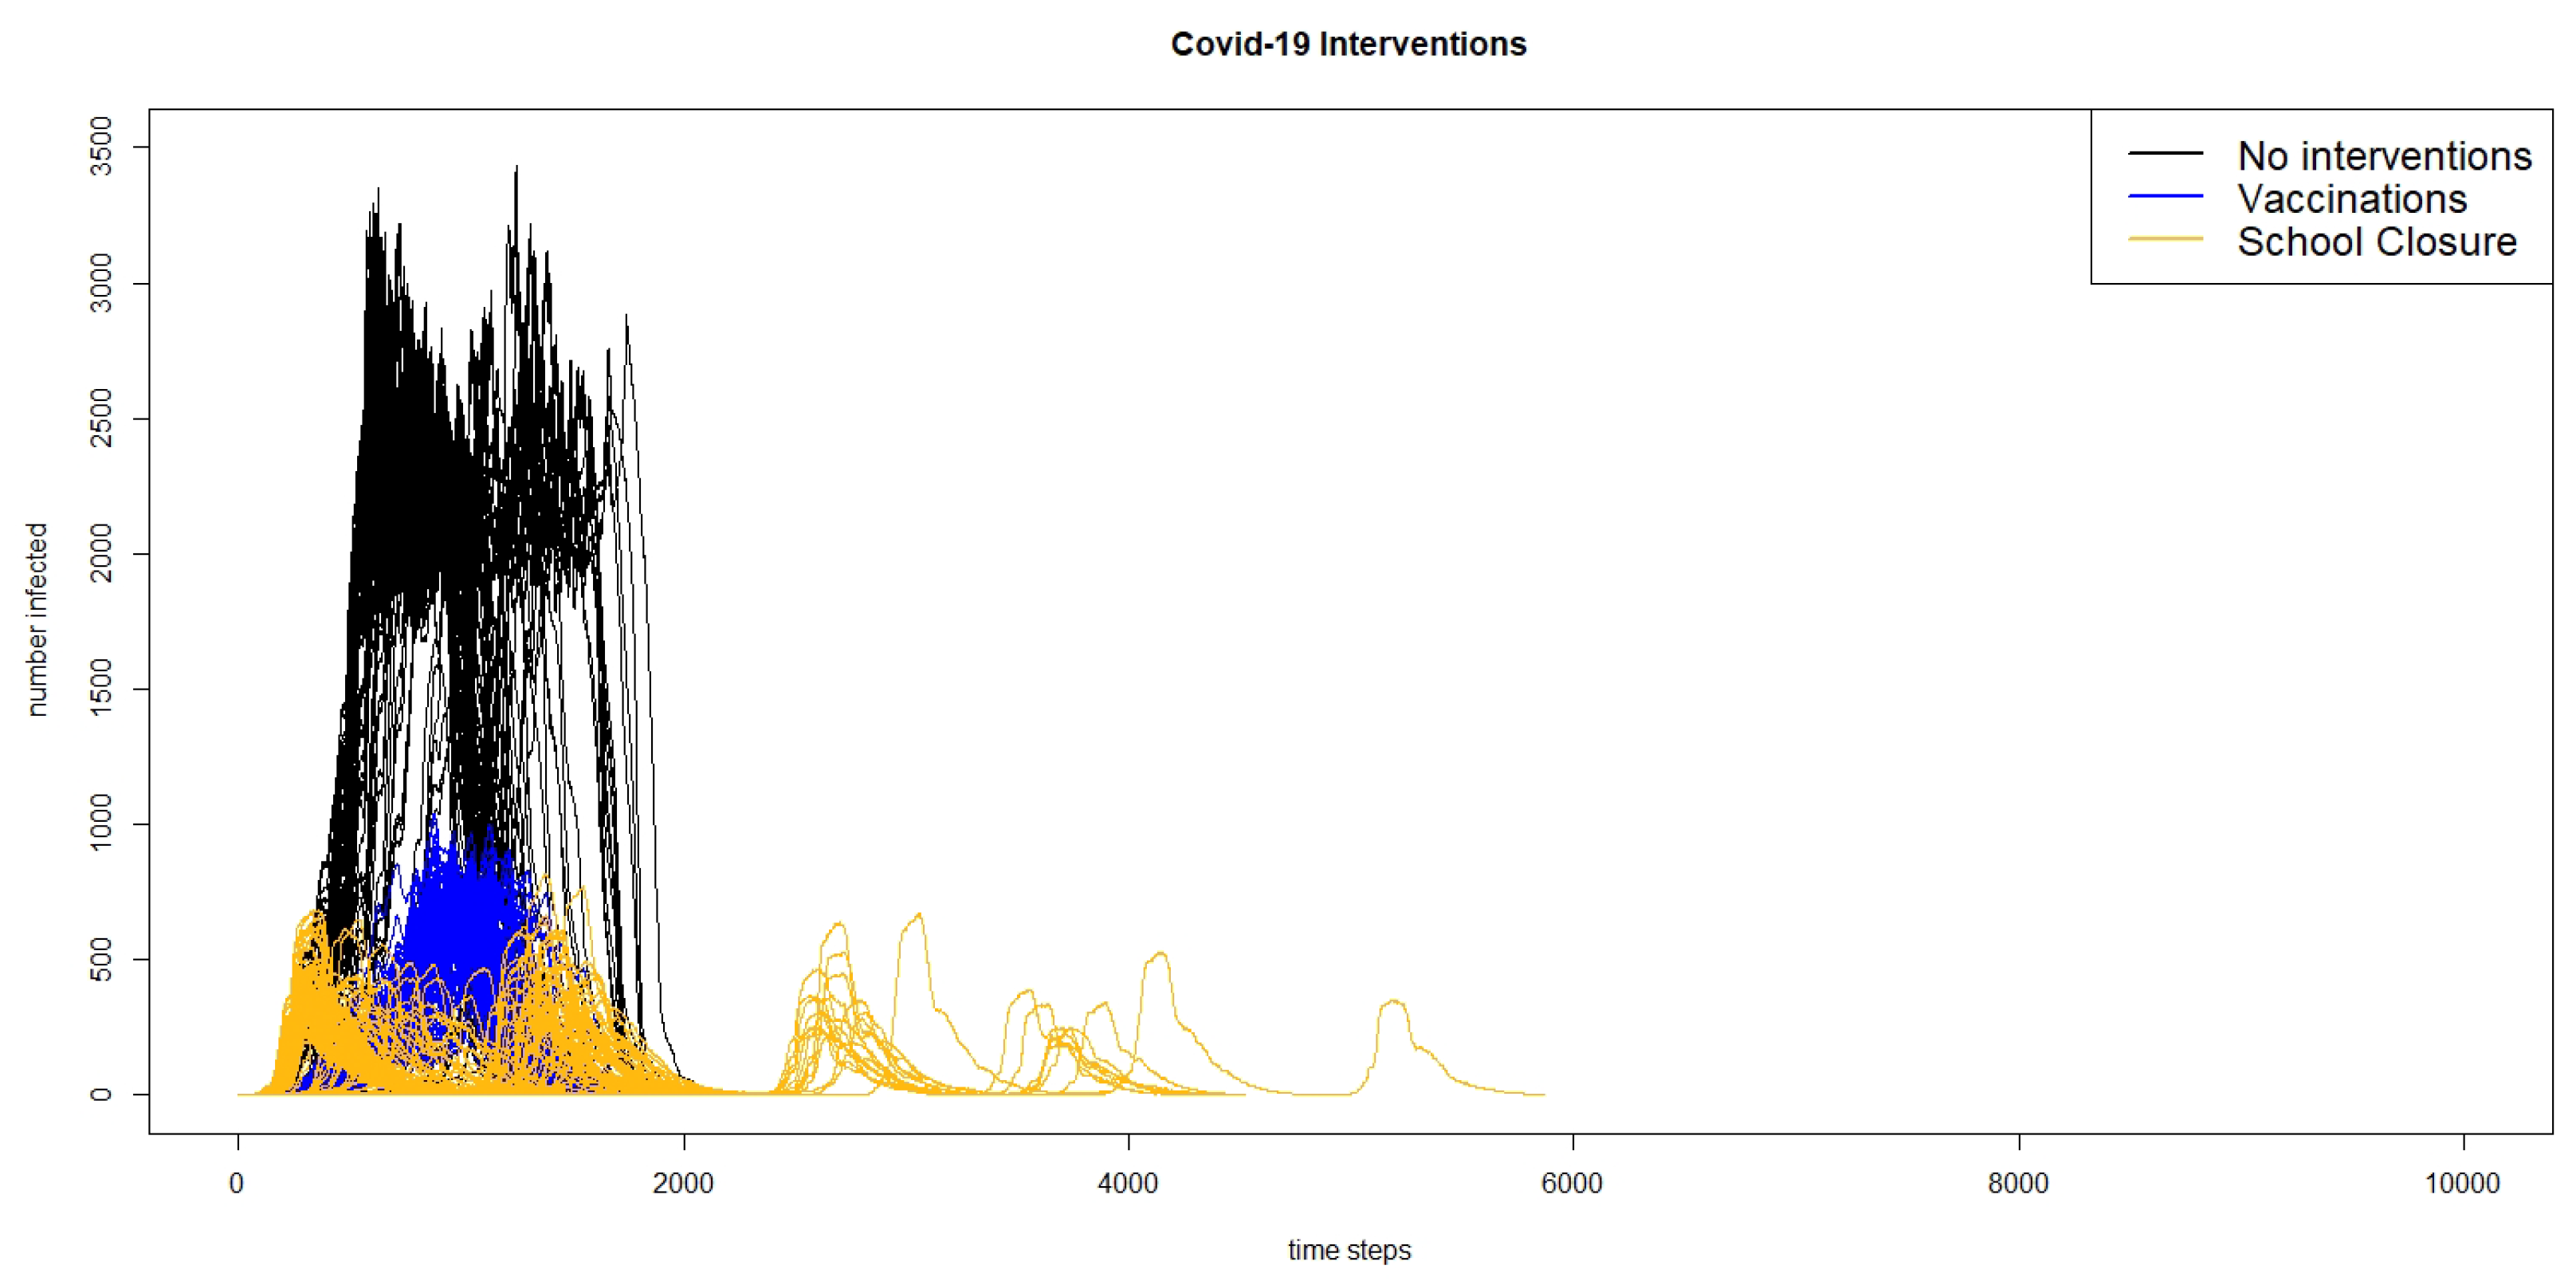
Figure 7.
Infection curves for 9 individual model runs for school closures in a COVID-19 outbreak ( = 3.28).
Figure 7.
Infection curves for 9 individual model runs for school closures in a COVID-19 outbreak ( = 3.28).


Table 1.
Key outbreak characteristics from the measles model and the COVID-19 model ( = 3.28).
| Measles | COVID-19 | |
|---|---|---|
| Total Infected | 29,275 | 26,134 |
| (27,120 31,430) | (23,870 28,367) | |
| Maximum Infected | 1441 | 2144 |
| (1333 1548) | (1956 2331) | |
| Total Days | 113.12 | 114.86 |
| (105.44 120.79) | (107.28 122.44) | |
| Days to Max Infected | 74.18 | 57.11 |
| (67.14 81.21) | (52.13 62.09) |
Table 2.
Key characteristics from the COVID-19 model by .
| 2.00 | 3.28 | 6.49 | |
|---|---|---|---|
| Total Infected | 25,671 | 26,134 | 28,058 |
| (22,820 28,522) | (23,870 28,367) | (25,979 30,137) | |
| Max Infected | 2240 | 2144 | 2766 |
| (1993 2489) | (1956 2331) | (2558 2973) | |
| Total Days | 114.49 | 114.86 | 105.22 |
| (106.09 112.89) | (107.28 122.44) | (98.93 111.52) | |
| Days to Max | 59.06 | 57.11 | 43.88 |
| (53.46 64.66) | (52.13 62.09) | (40.30 47.46) |
Table 3.
Key characteristics from the COVID-19 model with an of 3.28 with and without agents being infectious before symptoms begin.
Table 3.
Key characteristics from the COVID-19 model with an of 3.28 with and without agents being infectious before symptoms begin.
| Infectious before Symptoms | Yes | No |
|---|---|---|
| Total Infected | 27,927 | 26,134 |
| (25,741 30,112) | (23,870 28,367) | |
| Max Infected | 2536 | 2144 |
| (2332 2740) | (1956 2331) | |
| Total Days | 112.04 | 114.86 |
| (105.32 118.76) | (107.28 122.44) | |
| Days to Max | 48.08 | 57.11 |
| (43.81 52.36) | (52.13 62.09) |
Table 4.
Key characteristics from measles models with different interventions.
| No Interventions | Vaccination | School Closures | |
|---|---|---|---|
| Total Infected | 29,275 | 602 | 868 |
| (27,129 31,430) | (419 784) | (724 1010) | |
| Max Infected | 1,441 | 110 | 208 |
| (1333 1548) | (78 143) | (185 232) | |
| Total Days | 113.12 | 100.88 | 149 |
| (105.44 120.79) | (92.16 109.62) | (137 170) | |
| Days to Max | 74.18 | 69.26 | 66 |
| (67.14 81.21) | (61.99 76.53) | (49 83) |
Table 5.
Key characteristics from COVID-19 models with different interventions.
| No Interventions | Vaccination | School Closures | |
|---|---|---|---|
| Total Infected | 26,134 | 2339 | 1078 |
| (23,870 28,367) | (2256 2422) | (953 1203) | |
| Max Infected | 2144 | 753 | 373 |
| (1956 2331) | (723 784) | (343 404) | |
| Total Days | 114.86 | 135.38 | 141.44 |
| (107.28 122.44) | (131.48 139.47) | (127.84 155.04) | |
| Days to Max | 57.11 | 81.13 | 54.51 |
| (52.13 62.09) | (78.15 85.10) | (46.56 62.47) |
Table 6.
Key characteristics from the COVID-19 model with an of 3.28 with and without Irish Interventions.
Table 6.
Key characteristics from the COVID-19 model with an of 3.28 with and without Irish Interventions.
| No Intervention | Irish Interventions | |
|---|---|---|
| Total Infected | 26,134 | 304.41 |
| (23,870 28,367) | (198.71 410.11) | |
| Maximum Infected | 2144 | 48.14 |
| (1956 2331) | (33.12 63.17) | |
| Total Days | 114.86 | 142.13 |
| (107.28 122.44) | (118.91 165.34) | |
| Days to Max | 57.11 | 63.43 |
| (52.13 62.09) | (48.60 78.25) |
Publisher’s Note: MDPI stays neutral with regard to jurisdictional claims in published maps and institutional affiliations. |
© 2021 by the authors. Licensee MDPI, Basel, Switzerland. This article is an open access article distributed under the terms and conditions of the Creative Commons Attribution (CC BY) license (https://creativecommons.org/licenses/by/4.0/).
Share and Cite
MDPI and ACS Style
Hunter, E.; Kelleher, J.D. Adapting an Agent-Based Model of Infectious Disease Spread in an Irish County to COVID-19. Systems 2021, 9, 41. https://0-doi-org.brum.beds.ac.uk/10.3390/systems9020041
AMA Style
Hunter E, Kelleher JD. Adapting an Agent-Based Model of Infectious Disease Spread in an Irish County to COVID-19. Systems. 2021; 9(2):41. https://0-doi-org.brum.beds.ac.uk/10.3390/systems9020041
Chicago/Turabian StyleHunter, Elizabeth, and John D. Kelleher. 2021. "Adapting an Agent-Based Model of Infectious Disease Spread in an Irish County to COVID-19" Systems 9, no. 2: 41. https://0-doi-org.brum.beds.ac.uk/10.3390/systems9020041
Note that from the first issue of 2016, this journal uses article numbers instead of page numbers. See further details here.