A PROMETHEE MCDM Application in Social Inclusion: The Case of Foreign-Born Population in the EU


1
Department of International and European Studies, University of Macedonia, 54636 Thessaloniki, Greece
2
Faculty of Law, Aristotle University of Thessaloniki, 54124 Thessaloniki, Greece
3
Department of Business Administration, University of Macedonia, 54636 Thessaloniki, Greece
*
Author to whom correspondence should be addressed.
Systems 2021, 9(2), 45; https://0-doi-org.brum.beds.ac.uk/10.3390/systems9020045
Submission received: 27 April 2021
/
Revised: 3 June 2021
/
Accepted: 11 June 2021
/
Published: 15 June 2021
(This article belongs to the Section Systems Practice in Social Science)
Abstract
:Since the migrant surge in 2015, social inclusion has become a crucial issue to be addressed effectively by the European Union, given that 39% of the population born outside of the EU member states faces the risk of poverty or social exclusion. Adding to that, the COVID-19 pandemic has severely affected migrant households worldwide, rendering migrant integration an urgent matter for national governments. Discrimination, racism, xenophobia, and radicalization are all societal threats emerging in periods of massive migrant flows and need appropriate policy measures to be employed in migrant host countries to tackle them. This paper suggests the integration of a multiple criteria decision analysis method, namely PROMETHEE, for policy making with regard to migrant social exclusion. In light of previous research findings and the recent release of the Migrant Integration Policy Index 2020, the authors argue that the method proposed could help policy makers to evaluate the effectiveness of the implemented policies, spot the discrepancies between policies and policy outcomes, and motivate knowledge sharing among the EU member states. The findings include a ten-year comparative list of the EU member states (2010–2019) driven by social inclusion indicators for the foreign-born (non-EU-born) population. The results are rather sensitive to changes in the data utilized but they provide an overall comparative picture of social inclusion policy effectiveness in the EU during the past decade.
1. Introduction
In view of an inclusive European way of life, the new EU Action Plan on Integration and Inclusion 2021–2027 is indicative of the attention the European Commission pays to the issue of social inclusion, promoting a comprehensive approach to migrant integration [1]. Particularly in the aftermath of the COVID-19 pandemic crisis and its negative impact on the European economies, the effective integration of the migrant population in the host EU member states’ economies and societies has been considered vital for the resilience and the economic recovery of the EU [1]. Nevertheless, 39% of the population born outside of the EU faces the risk of poverty or social exclusion in the EU country of residence while the corresponding rate for the native population is 19.5% [1]. This gap of 19.5 percentage points in the risk of poverty or social exclusion between the native and the migrant population is too wide to ignore, especially during a period when the COVID-19 pandemic has disproportionately affected the migrant population [2]. Furthermore, in 2019, 12% of non-EU citizens faced severe material deprivation while the indicator for EU citizens was 5% [3]. Adding to the aforementioned indicative measures of social exclusion, a report from the World Health Organization Regional Office for Europe revealed that migrants and refugees are at greater risk of developing infectious diseases because of their exposure to infections, lack of access to health care, interrupted care, and poor living conditions during the migration process [4]. Towards addressing such issues, the European Union decided to direct more than EUR 377 billion of the European Multiannual Financial Framework (MFF) to cohesion, resilience, and values [5,6].
Social inclusion is defined by the World Bank as “the process of improving the ability, opportunity, and dignity of people, disadvantaged on the basis of their identity, to take part in society” [7]. An inclusive society is a global challenge, as captured in the message of the world leaders at the SDG summit in September 2019 calling to leave no one behind [8]. It has also been one of the core elements of sustainable development along with economic growth and environmental protection [8]. Social inclusion is reasonable from an economic point of view and important to end poverty and boost prosperity in accordance with the World Bank Group’s twin goals [9].
Race, ethnicity, and religion are among the most usual group identities that lead to social exclusion [7] and could be manipulated to justify extreme behavior, radicalization, or racist phenomena. This is particularly relevant to the last surge of migrant flows in the European Union which heated the public debate on societal threats. Migration is a demographic transition which should be considered when addressing social inclusion in hosting areas such as the EU. There is a multifactorial reason supporting this argument. Both the cohesion of the society and the growth of the economy depend on the positive outcomes of migration. Migrants’ social inclusion is necessary for increased productivity in workplaces, improved employment outcomes, reduced cost of social services, and inclusive growth [10]. Moreover, it is imperative to prevent the European societies from marginalization, violent extremism, radicalization, and societal tensions, and build upon resilience mechanisms.
Drawing upon previous research on the evaluation of the effectiveness of migrant labor market integration policies in EU member states [11], this paper extends the research framework to a key field for migrant integration, the social inclusion area. To identify the progress made on the issue of social inclusion in the EU-28 area, the authors present a multiple-criteria decision analysis based on longitudinal data from 2010 to 2019 for the Zaragoza integration indicators in the field of social inclusion. Since monitoring and evaluating policies is a critical parameter for their efficiency, the methodology chosen in this paper provides the ground for revised inclusion policies based on integration outcomes.
Balourdos and Petraki [12] used a comparative analysis to test the relationship between welfare states in Europe and social inclusion outcomes of third-country nationals, concluding that the gaps between natives and migrants persist even in the case of generous welfare systems. The comparative analysis employed in this paper at the EU level could add to the aforementioned results and be utilized by policymakers in parallel with the integration reports identifying good practices for the social inclusion in EU member states to enhance knowledge diffusion and address historical reasons for exclusion. The Migrant Integration Policy Index (MIPEX) indicator is also a measure of policies to integrate migrants and provides a comparative view of 52 countries in 8 policy areas [13]. Incorporating the results of MIPEX 2020 with the findings of this paper gives a broad overview of whether policies keep up with the outcomes in the field of social inclusion.
The rest of this paper is structured as follows: first, the method employed and the indicators utilized are analyzed; next, the results are illustrated and interpreted; and last but not least, the robustness of the methodology suggested is explained.
2. Data
The empirical part of this study emphasizes providing a comparative ranking of the EU 27 member states plus the UK for a ten-year period between 2010 and 2019 based on the social inclusion outcomes of the migrant population. The social inclusion indicators chosen to develop the decision-making model derive from the Zaragoza Declaration which was adopted in April 2010 and included the indicators accepted by the EU Ministers responsible for integration [14]. The values of the data for each indicator refer only to the foreign-born (non-EU-born) population of every member state, without separating between migrant subgroups such as the economic migrants, refugees, asylum seekers, etc., and they are available in Eurostat [3]. Although data imputation was considered in order to fill in the missing values, the authors made use of raw data only. The multiple criteria method used (PROMETHEE) can handle a reasonable amount of missing data in a small scale [15], which was part of the reason for selecting this method. Romania and Slovakia are the two countries with missing statistical data for most of the years examined, but they are included in the sample.
The Zaragoza indicators for social inclusion encompass the percentage of people at risk of poverty and social inclusion, the self-reported health status, an indicator of income, and one for owner occupancy [16]. The first indicator includes the share of people at risk of poverty, severely materially deprived, or living in households with very low work intensity [3]. Health status is a subjective measure of the health situation [3]. For the income indicator, the authors used the median annual equalized net disposable income [3]. With regard to owner-occupancy, it indicates the level of protection from discrimination in the rental market and the long-term residence in the host country [3]. Apart from the clear scope of the first indicator, data on basic income, housing, and good health are of appropriate importance since they are related to other areas of integration as well [17].
Analyzing the data collected from Eurostat on 18 March 2021, there are several figures worth mentioning. The largest gaps in 2019 between the native and the foreign-born (non-EU-born) population at risk of poverty or social exclusion were monitored in Sweden, Belgium, and Greece. Nevertheless, the 2019 gap in Belgium was the smallest among the ten years examined. On the other hand, the 2019 gap in Sweden was the largest in the decade. Finland managed to reduce the difference between natives and migrants as regards this indicator since 2010, while in the Netherlands it seems to have widened. Poland was among the countries with the smallest discrepancy between natives and migrants at risk of poverty or social exclusion.
The perception of very good or good health status varied by group of population among the EU-28 member states. In 16 out of 28 member states, the difference between natives and migrants in this indicator was negative, meaning that there is a larger share of the foreign-born than the native-born population that perceives its health as satisfying. In particular, the Czech Republic had the largest difference in favor of the migrant population, while in Estonia, there was a 30 percentage points gap in favor of the native population. Luxembourg, Sweden, Poland, and Hungary had less than one percentage point difference between natives and migrants as regards this indicator. The gap in the Netherlands presented an impressive expansion during the decade examined in contrast with the gap in Poland, which had a decreasing trend.
For most of the EU-28 member states, the median equivalized net income was larger for the native than for the foreign-born (non-EU-born) population. Luxembourg had by far the largest variation among natives and migrants in the median income (EUR 14,704) in 2019. Sweden came next with a gap of EUR 9016 followed by Belgium and Austria. The smallest differences were observed in Hungary, Poland, and Portugal in 2019. In fact, the median income was larger for the foreign-born than the native population in these countries. Finland presented a decreasing gap over the years.
With regard to housing tenure and particularly the owner-occupancy for people over the age of 18, the gap between the native and the foreign-born (non-EU-born) population was wider in Spain, Italy, and Ireland. The Baltic countries presented the smallest discrepancies in favor of the foreign-born population meaning that the size of the foreign population with owner-occupancy was larger than that of the native one. An additional important observation emanating from this indicator’s values is that the differences in owner-occupancy among natives and migrants in Bulgaria, Malta, Netherlands, and Slovenia became larger over the decade examined.
3. PROMETHEE Method
The method of analysis applied in this paper was the Preference Ranking Organization METHod for Enrichment of Evaluations, which belongs to the outranking family of the multi-criteria decision analysis methods. The Preference Ranking Organization METHod for Enrichment of Evaluations (PROMETHE) was originally developed by Brans, Mareschal, and Vincke [18,19]. This can be considered a family of methods, since PROMETHEE has been widely accepted by the international research community and has been much extended and refined over the years. The main methodologies are PROMETHEE I to VI and many versions about group decision support and with interval or fuzzy numbers have been developed. PROMETHEE II especially results in a ranking of actions (as the alternatives are known in the method terminology) and is based on preference degrees. PROMETHEE II was chosen instead of PROMETHEE I in order to avoid the alternative incompatibility issue. In MCDA methods, the decision maker is right in the center of the whole procedure. Each decision maker needs to develop the original decision matrix and input the model parameters, which can differ from one decision maker to the other. Thus, PROMETHEE provides a decision-maker with a ranking of the various alternatives built upon preference degrees among the available options and is based on pairwise comparisons in order to calculate them [20]. PROMETHEE was chosen for the following reasons:
- It can handle small amounts of missing data well, as already mentioned.
- The data input table is easily constructed, especially if compared to methods like the Analytic Hierarchy Process (AHP) or the Measuring Attractiveness by a Categorical Based Evaluation Technique (MACBETH) [21].
- The same data input table can be used with other MCDM methods as well, allowing comparisons among the methods.
- It can integrate both quantitative and qualitative data.
- It is considered as one of the ‘classical’ MCDM methods and has been widely used by the international research community in various areas.1
- The PROMETHEE method has not been applied in the past in this public policy domain.
- The Visual PROMETHEE software is freely available online and offers much functionality (http://www.promethee-gaia.net/visual-promethee.html accessed on 1 June 2021).
The main steps of PROMETHEE include:
- the calculation of the preference degrees for every action on every criterion,
- the calculation of the unicriterion flow of every criterion, and
- the calculation of the global flows of all criterions.
PROMETHEE is designed to tackle multicriteria problems like:
where A is a finite set of possible alternatives {a1, a2, …, ai, an} and {g1(∙), g2(∙), …, gj(∙), …, gk(∙)} is a set of evaluation criteria to be either minimized or maximized. The evaluation table is constructed as in Table 1.
In PROMETHEE, a preference degree is an expression of how one action is preferred against another action. If the deviations among the evaluations of a pair of actions in a criterion are small, the decision maker can allocate a small preference of one over the other or even a negligible preference. If they are quite big, the decision maker can allocate a large or even an absolute preference of one over the other. This preference degree is always a real number between 0 and 1.
Therefore, the preference function, if the criterion is to be maximized, can be defined as:
where dj(a, b) is the difference of evaluations among two actions (pair-wise comparison):
and since the preference degree is always between 0 and 1:
dj(a, b) = gj(a) − gj(b)
0 ≤ Pj(a, b) ≤ 1
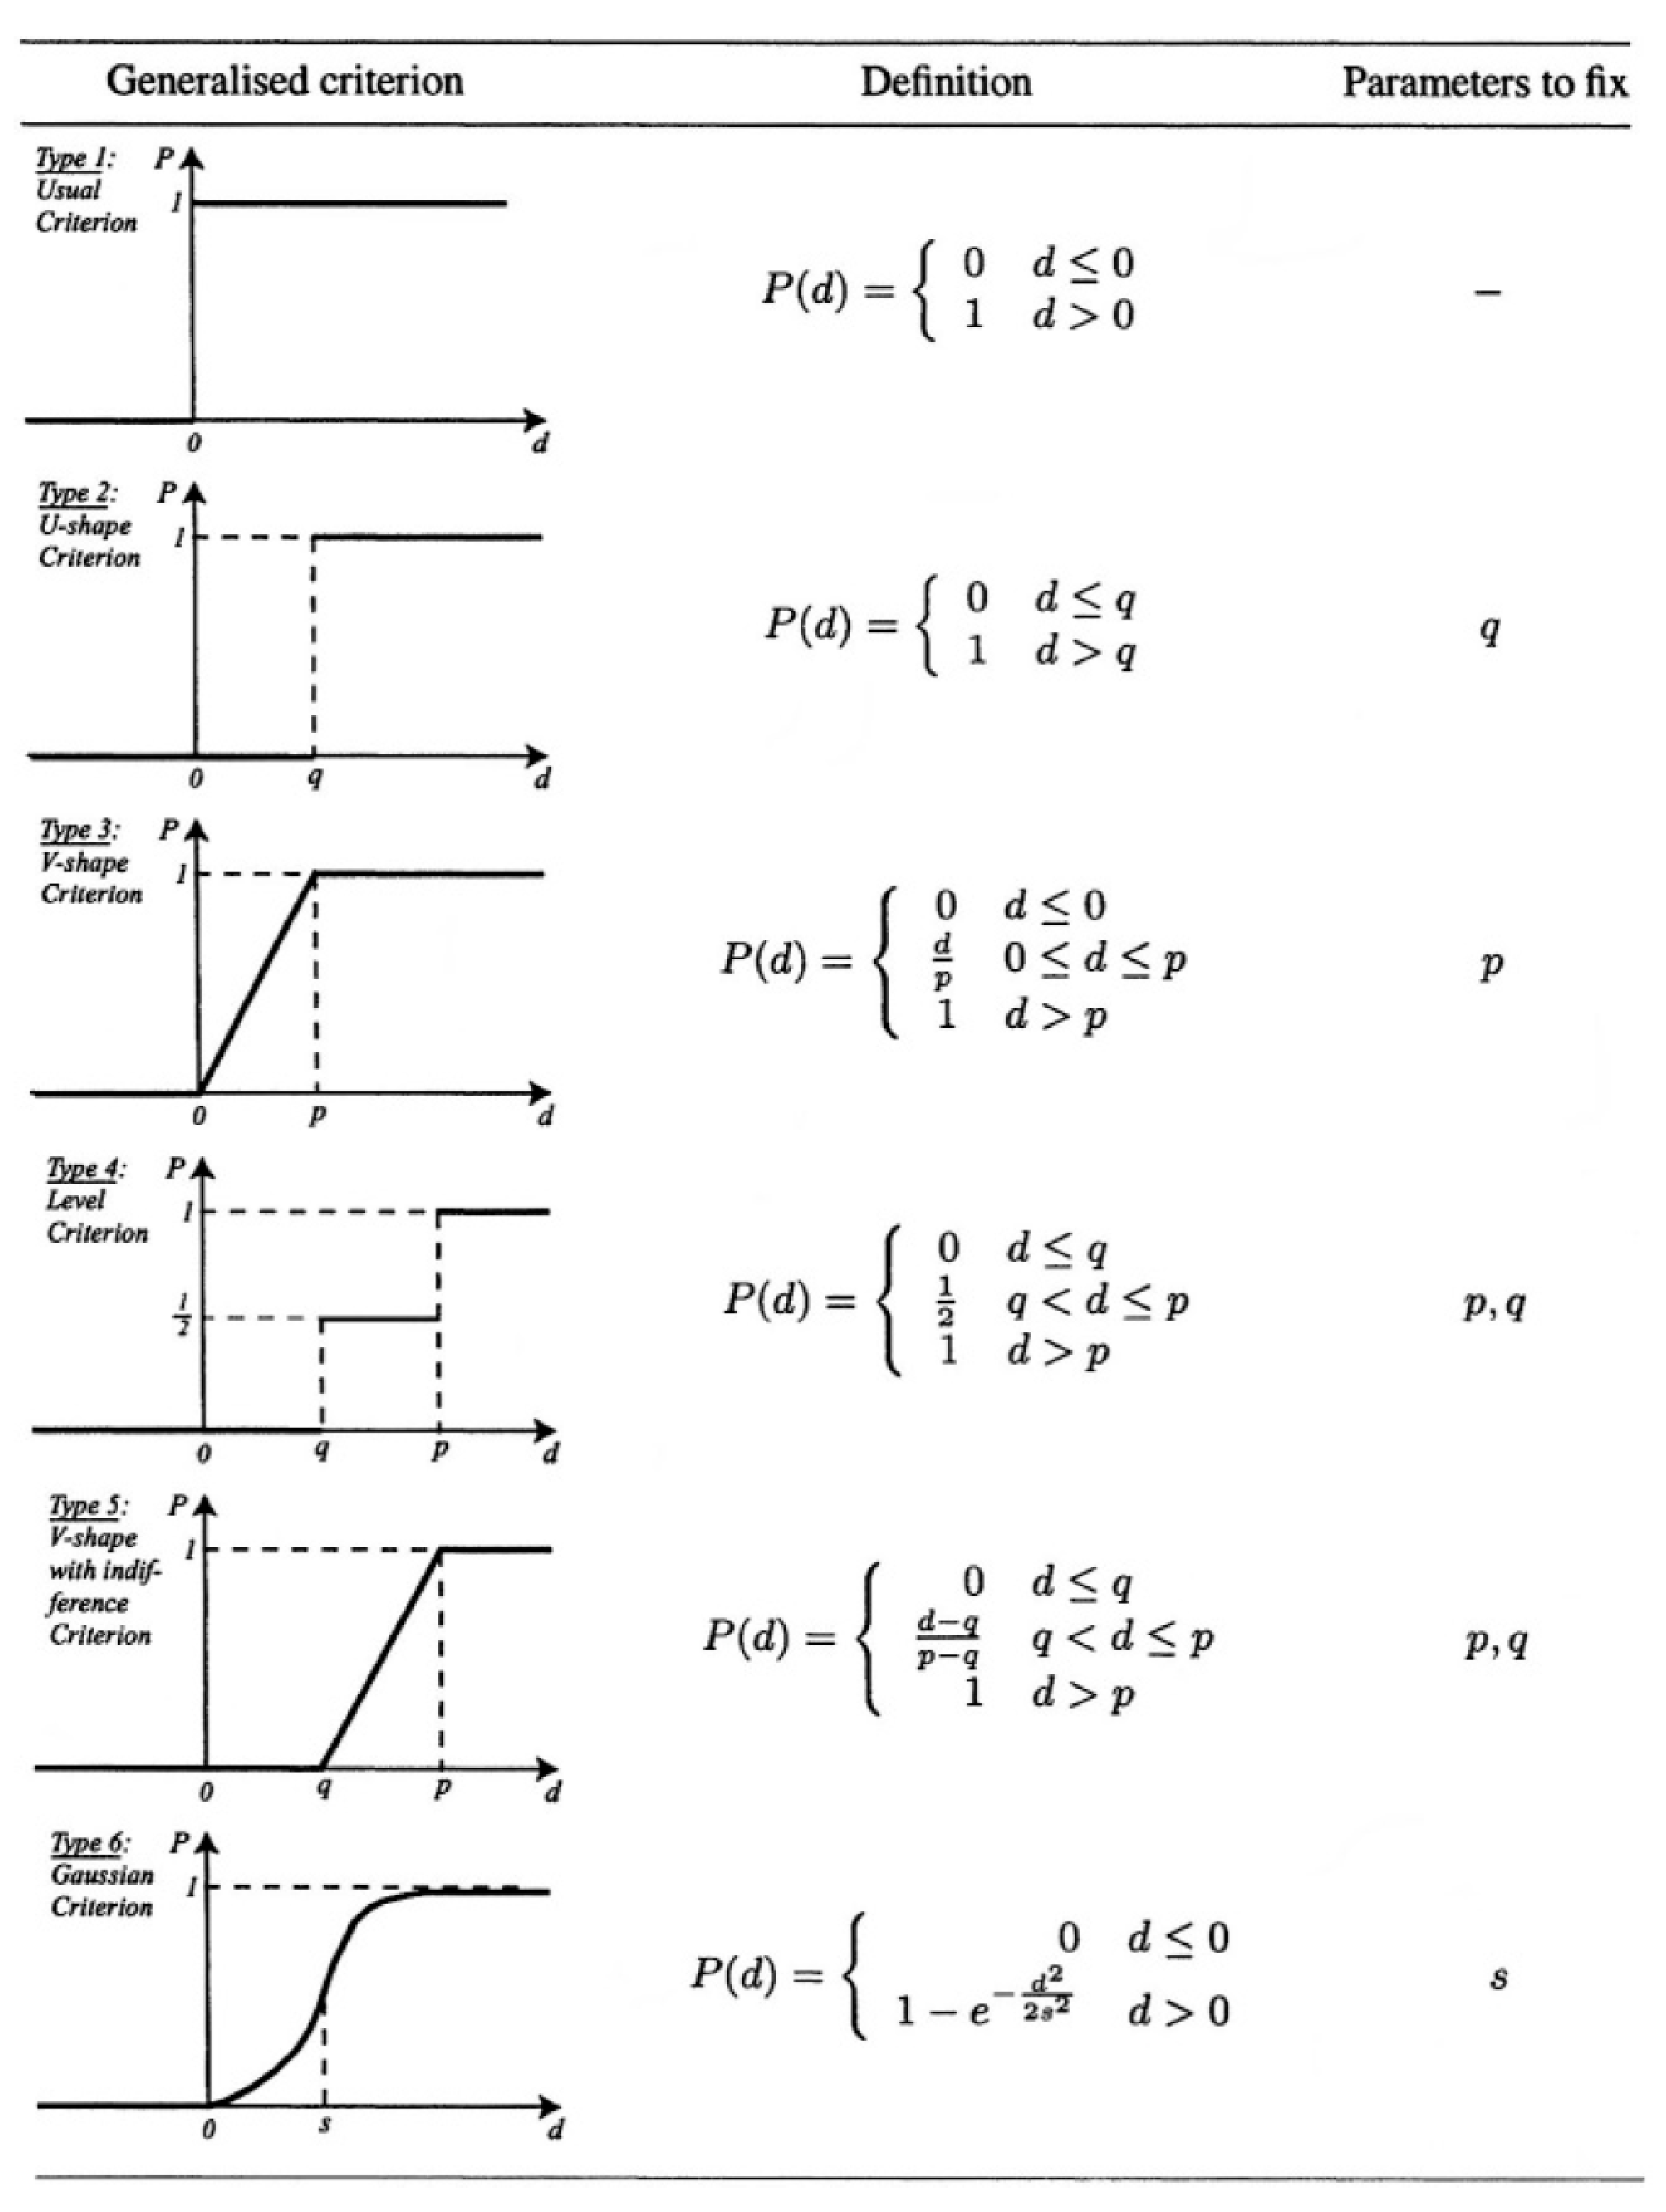
The pair {gj(∙), Pj(a, b)} is called by the authors of the method a generalized criterion associated to criterion gj(∙). There are 6 different types of preference functions proposed as in Figure 2. The preference function is trying to model the way the decision maker prefers one action over another; it is an attempt to model the way this specific decision maker thinks.
Τhe outcome is a ranking of all available alternatives based on the global flows, which are the aggregated unicriterion flows. Table 2 depicts a distribution of papers based on PROMETHEE by application area [23].
To our knowledge, multiple criteria decision analysis has recently been employed in the field of migration to help policy makers with scientific methods for the decision process of migration governance and contribute to the planning of strategies offering alternatives, albeit not very often, a fact that motivated us to use PROMETHEE in order to perform the study. Rashid [24,25] utilized a GIS-based multi-criteria decision analysis approach to explain the destination choices of urban-to-urban migration in the Klang Valley, Malaysia and model the distribution of potential migrants in urban areas. Arandarenko et al. [26] also used multiple criteria decision analysis for predictions in internal migration in the case of Serbian municipalities. The TOPSIS method was employed by Cetinkaya et al. [27] to produce a refugee camp ranking for 10 southeastern cities in Turkey that host Syrian refugees in an effort to determine suitable camp locations. The CAT-SD MCDA method was applied by Costa et al. [28], assigning underused buildings to categories of migrant status in order to make alternative suggestions for the accommodation system for refugees in Turin.
In this paper, the aforementioned indicators plus their gaps among natives and migrants (non-EU-born population) provided a preferable ranking stemming from the pairwise comparisons of a combination of the lowest risk of poverty or social inclusion, the highest median equivalized net income, the highest percentage of migrants considering their health as good or very good, the highest percentage of owner-occupancy, and the lowest gaps in these indicators among natives and migrants in every country. As described in Table 3, the weights of all the criteria are equal for the purpose of this paper. The Linear function chosen requires an indifference threshold q and a preference threshold p, which were defined following the values of the data. In particular, in the Linear function when the difference between a criterion’s evaluations is less than the selected threshold of indifference q, then there is not a perceived discrepancy between these two actions for the preferences of the decision maker. In contrast, when the difference is higher than the preference threshold p, the preference is strong [22]. In this case, all the indicators apart from the ones expressing currencies had an indifference threshold of 3 and a preference threshold of 10 while the income indicators’ thresholds were 700 and 2000, accordingly.
4. Results
Table 4 presents the eleven alternative scenarios obtained from the PROMETHEE multiple criteria decision analysis conducted under the aforementioned preferences. Ten out of the eleven scenarios refer to the pairwise comparisons of the criteria among the alternatives for a specific year. The 11th scenario is the “All” scenario, representing a multi-scenario analysis integrating the results of all scenarios.
Interpreting the data, it should be mentioned that the position of Malta in the ranking was not expected. Malta did not adopt an integration strategy until December 2017, when the percentage of the non-EU population in the country reached about 3% of the total population [29]. Malta’s 100-point MIPEX score was below average (48/100) with anti-discrimination policies being described as more favorable than political participation or family reunion ones [13]. As Nimfόhr et al. [30] mention, the accession of Malta in the EU and the incorporation of the European legal framework to its national legislation led to bureaucratic rather than social integration, paying attention to the social interactions for the efficacy of integration apart from the legal framework. However, in this empirical case, Malta received the first place in the ranking in nine out of the ten years under examination. This could be explained by the fact that in Malta, the non-EU-born population has one of the lowest percentages for people at risk of poverty and social exclusion, one of the highest ratios for people with a very good or good perception of health, an above average median equivalized net income, and an above average owner-occupancy compared to the non-EU-born population in other EU countries.
Another surprising outcome of the analysis is the Czech Republic’s place in the ranking, since the Czech government adopted a negative stance towards the migrant relocation quotas mechanism. Despite the rejection of the EU migrant relocation quotas, the Czech Republic has been a favorable place with regard to migrant social inclusion as portrayed in the PROMETHEE results table in accordance with MIPEX. Particularly the anti-discrimination policies, which were among the first measures taken after the launch of the national integration policy in 2000, received a slightly favorable MIPEX score [13]. Moreover, the 2019 official report on migrant integration mentioned that despite the increasing number of migrants due to the increased demand for industrial workforce in the country, no rise in criminality has been reported [31].
Hungary, despite its classification by MIPEX as an “equality on paper” only country [13], ranked among the top ten countries in the results. The majority of migrants in Hungary have been ethnic Hungarians and there is a marginal part of the total population having a non-EU nationality [29]. Despite its overall MIPEX score, which is below average, and specific policies ranked as critically unfavorable, it should be mentioned that the anti-discrimination strategy implemented in the country was ranked top 10 and makes Hungary a leader in the field in Central Europe [13]. As regards the indicators of this analysis, Hungary managed to reduce the size of the migrant population at risk of poverty, increase their median equivalized net income, and upgrade their tenure status. However, the indicator of self-perceived health status among migrants worsened during the decade examined.
On the other hand, Portugal, which was also among the top five countries in the results of the multiple criteria decision analysis, was expected to achieve such a high ranking, since it is in the top ten European countries with the highest MIPEX score (81/100). In fact, the enforcement mechanisms of anti-discrimination policies have been very successful reaching a score of 100/100 [13]. Although the first integration strategy adopted in the country was in 2007, the integration efforts made for asylum seekers since 2015 have been remarked on by OECD [32].
The UK also held a high rank in the list even if migration was a defining issue in the 2016 Brexit referendum. The UK does not have a national integration strategy, but it is well-known for its long-term implementation of multiculturalism programs. Ireland, which until the 1990s was mainly an emigration country and adopted its first integration strategy in 2017 [29], had some ups and downs in the ranking during the ten years examined. Although anti-discrimination policies in the country are developed much more than the migrant labor market integration ones, MIPEX makes specific reference to the need for appropriate addressing of hate speech legislation and racism in the country [13]. It is noteworthy, though, that the country accepted more people than originally agreed under the relocation scheme despite the opt-in possibility [33].
The position of the Netherlands in the ranking became unfavorable from 2010 and all the country’s indicators analyzed worsened. Although the Netherlands has been a destination for migrants since the beginning of the last century and accepted the fourth largest share of relocations during the refugee crisis [34], integration policies need to be further developed. It should be noticed, though, that the enforcement mechanisms for antidiscrimination policies in the Netherlands are among the strongest in developed democracies [13].
Among the other traditional migrant destinations in the EU, Luxembourg was the one receiving the highest rank in the list, although it set up its first integration strategy in 2010. The positions of Germany, France, Belgium, and the Nordic countries were lower than that of Luxembourg for most of the years examined. Germany, with an integration strategy since the 1970s, and France, the oldest European immigration country, kept an above average place. The focus areas of integration, though, differ between these two founding EU states. France performs better with regard to policies that give access to nationality and promote anti-discrimination and equality, while Germany focuses more on the socio-economic opportunities and migrants’ access to employment and vocational training [13]. The position of Denmark in the ranking was also an unexpected one in comparison with Sweden and Finland. The latter implemented more developed policies and received twice as many MIPEX score points as Denmark, whose integration vision pays more attention to employment as a facilitator of social integration [13]. In this case though, Denmark had a higher rank than the other two Nordic countries for five out of the ten years examined.
The Baltic countries kept below average places in the ranking during this decade with Lithuania being higher than Estonia, and Latvia holding the lowest place among them. Estonia was expected to perform better, however, since the other two countries are mostly emigration ones and hold lower MIPEX scores.
The Mediterranean countries, facing several economic problems during this particular decade and being the main entrance of migrants to the European Union, also had below average places in the ranking except for Cyprus. Italy, which mostly focused on economic integration rather than on social and cultural policies [35], received a higher place in the ranking than Spain, where migration is considered as generally open and committed to integration [36]. Greece, which has a lower MIPEX score than Italy and Spain, was below Italy and above Spain in the ranking for most of the scenarios.
Poland, an emigration country whose MIPEX score is low and which does not have a national integration strategy, was expected to underachieve and it actually held a below average rank. Slovenia, which is in favor of intercultural dialogue and promotes tolerance [29], was also ranked below average in the list. Bulgaria, due to its socio-economic profile, has not been a favorable migrant destination and apart from its anti-discrimination measures, all the other inclusion policies need further development in line with the MIPEX classification. However, the results of the analysis show an improvement in Bulgaria’s ranking. On the other hand, Croatia, having an unfavorable MIPEX score and not being an immigration country, was far above Bulgaria in the PROMETHEE ranking.
The last place in the multiple criteria decision analysis ranking belonged to Austria, for eight out of the ten years from 2010 to 2019. Belgium was also among the lowest-ranked countries. In both these cases, the gaps between the native and the migrant population in the indicators analyzed were probably responsible for this outcome, since they were among the widest in the EU. Despite the structural obstacles to migrant integration, however, it should be mentioned that Belgium has strong legal protections against discriminative acts, while Austria provides migrants more favorable healthcare benefits than other EU countries [13].
The PROMETHEE results in this change are rather sensitive to changes since the selection of the weights and the preference degrees is subjective and the data input matrix is large. The sensitivity analysis conducted and presented in Table 5 reveals the stability intervals of this model for which the results remain unaffected. This is an additional tool in the hands of policy makers to evaluate their policy measures. The range of the intervals was small in this case, but this could be due to the fact that the data do not present large deviations from each other.
5. Discussion
This paper envisages presenting an alternative decision-making model to migrants’ integration driven by social inclusion indicators. Combining the preference ranking of the 27 EU member states and the UK provided by the PROMETHEE method with the Migrant Integration Policy Index, the paper offers a basis for further research and discussion with regard to integration governance in the field of social inclusion. In detail, the paper illustrates a classification of the EU member states drawing upon the indicators already agreed at the EU level for the migrants’ social inclusion. Some of the method’s outcomes were to be expected while others need further attention to be interpreted. The main contribution of this paper lies in fact that a well-known MCDM method like PROMETHEE can easily be adapted and used in order to address the social inclusion issue and provide support to the decision maker integrating his/her attitudes in the form of the MCDM model preferences and weights. In addition, the sensitivity analysis provides a measure of the robustness of the suggested solution. No matter how sensitive the comparative list of the EU member states with regard to the migrants’ social inclusion outcomes is, it could provide one more source of knowledge in the EU toolbox that could offer a motive for mutual learning and knowledge sharing. It could also be of help for policy evaluation, so that the policy makers can adapt the integration measures to achieve the highest efficacy. Having data-based integration policies following established indicators available at the EU level is one of the targets of the new Action Plan on Integration and Inclusion [1]. Since most of the EU member states seem to perform well in the anti-discrimination policy field, a multiple criteria decision analysis could also improve the policy proposals to tackle other societal threats and enhance the social inclusion of the foreign-born population. For this purpose, the PROMETHEE method could be extended to include more indicators that focus on evaluating specific societal issues providing valuable feedback on the effectiveness of implemented measures.
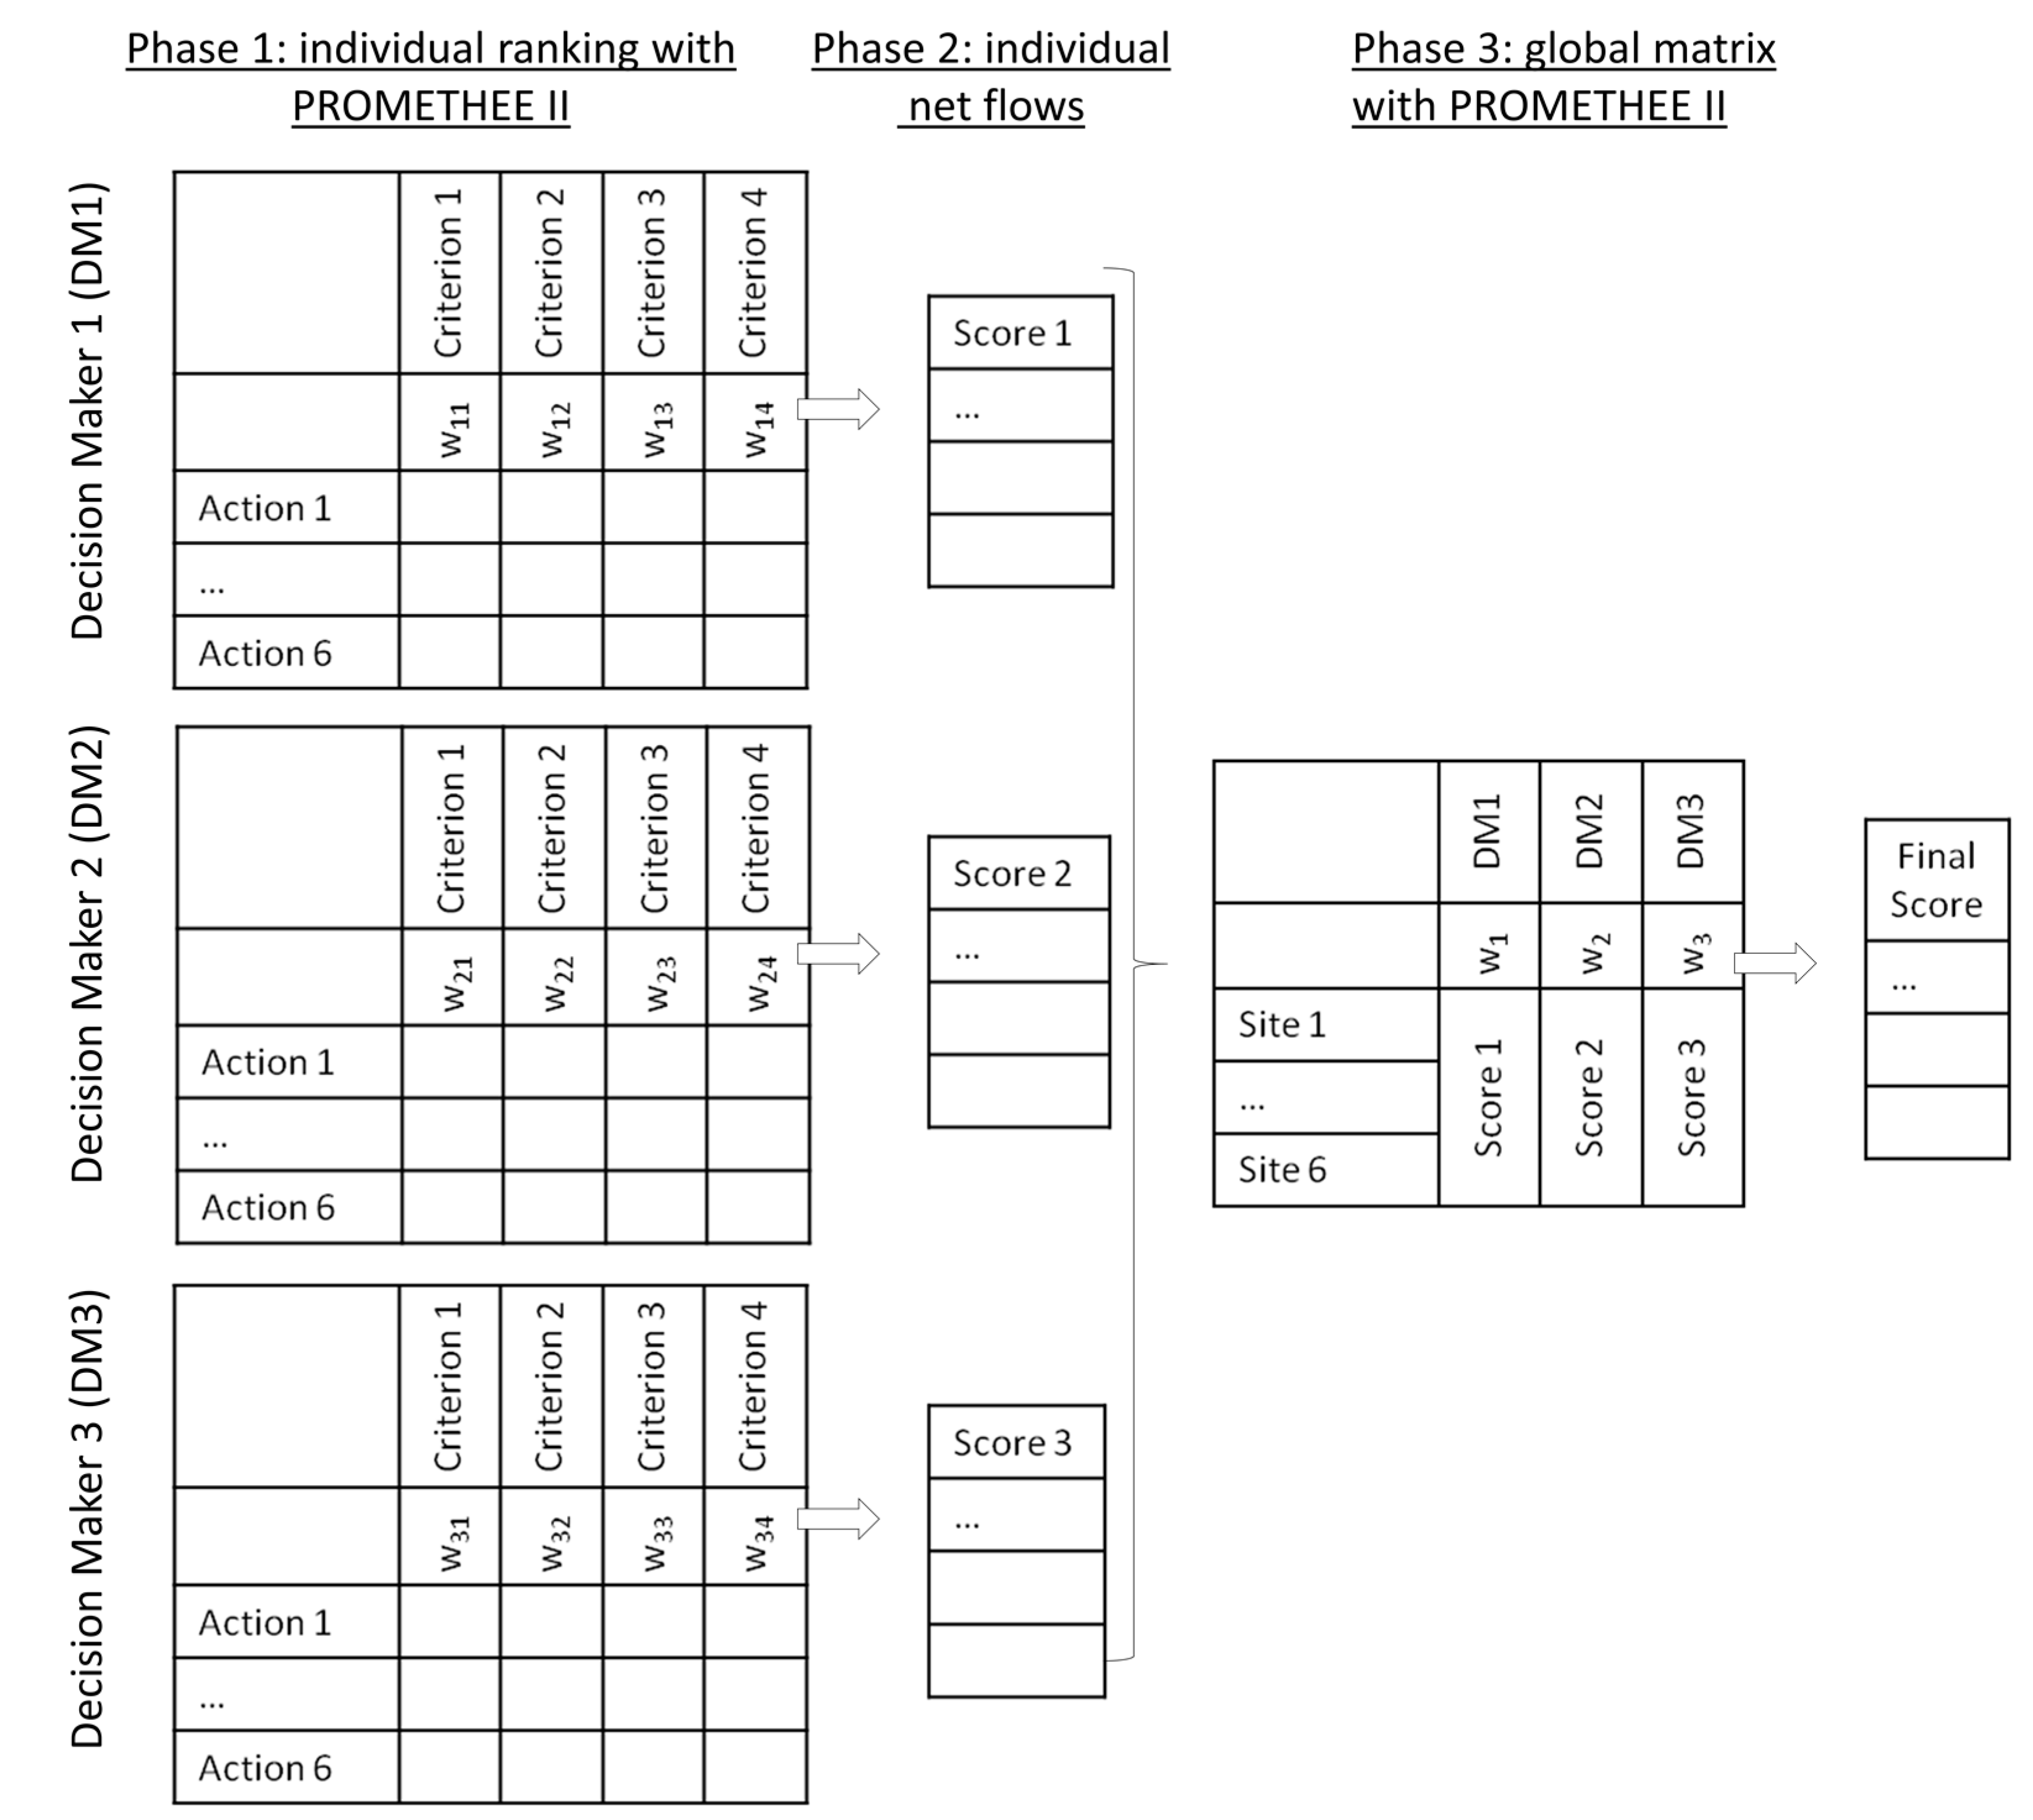
As for future directions, the authors plan to expand this paper by utilizing the GDSS expansion of PROMETHEE [20]. This will allow the integration of the opinion of experts in the field into the procedure. Each expert can introduce his/her own set of weights and preference functions to the methods. That will avoid the forcible introduction of a set of weights and preference function parameters, which in turn will allow the integration of expert opinion with more accuracy. The authors plan to survey experts at a European level and to produce an aggregated result in order to compare it with the one in this paper and draw conclusions. In addition, TOPSIS (Technique of Order Preference and Similarity to the Ideal Solution) and VIKOR (the acronym is in Serbian, meaning multicriteria optimization and compromise solution) MCDM methods use the same input table as PROMETHEE. The author will expand this research in order to include the results of these methods as well; however, the focus of the present paper is not to compare and test different MCDM methods, but to compare and evaluate national public policies on a challenging issue.
Author Contributions
Conceptualization, A.B. and D.M.; methodology, J.P.; software, J.P.; validation, A.B., D.M., and J.P.; formal analysis, A.B., D.M., and J.P.; investigation, A.B. and D.M.; resources, J.P.; data curation, J.P.; writing—original draft preparation, A.B.; writing—review and editing, D.M. and J.P.; visualization, J.P.; supervision, J.P.; project administration, A.B.; funding acquisition, D.M. All authors have read and agreed to the published version of the manuscript.
Funding
This research was funded by the H2020 project “MigrAtion Governance and AsYlum Crises—MAGYC”, grant number 822806.
Data Availability Statement
Publicly available datasets were analyzed in this study. These data can be found here: https://ec.europa.eu/eurostat/statistics-explained/index.php/Migrant_integration_statistics_-_at_risk_of_poverty_and_social_exclusion accessed on 18 March 2021.
Conflicts of Interest
The authors declare no conflict of interest. The funders had no role in the design of the study; in the collection, analyses, or interpretation of data; in the writing of the manuscript, or in the decision to publish the results.
| 1 | As of 12 September 2020, 2393 references to the methods have been counted (http://www.promethee-gaia.net/assets/bibliopromethee.pdf accessed on 1 June 2021) |
References
- European Commission. Action Plan on Integration and Inclusion 2021–2027. COM (2020) 758 Final, Brussels. 24 November 2020. Available online: https://ec.europa.eu/home-affairs/sites/default/files/pdf/action_plan_on_integration_and_inclusion_2021-2027.pdf (accessed on 11 June 2021).
- OECD. OECD Employment Outlook 2020: Worker Security and the COVID-19 Crisis; OECD Publishing: Paris, France, 2020. [Google Scholar]
- Eurostat. Migrant Integration Statistics—At Risk of Poverty and Social Exclusion. Available online: https://ec.europa.eu/eurostat/statistics-explained/index.php/Migrant_integration_statistics_-_at_risk_of_poverty_and_social_exclusion (accessed on 18 March 2021).
- World Health Organization. Report on the Health of Refugees and Migrants in the WHO European Region. No Public Health without Refugee and Migrant Health; WHO: Copenhagen, Denmark, 2018. [Google Scholar]
- European Commission. Recovery Plan for Europe. Available online: https://ec.europa.eu/info/strategy/recovery-plan-europe_en#main-elements-of-the-agreement (accessed on 18 March 2021).
- Sapala, M.; Pari, M.; Kresnichka-Nikolchova, N. EU Financing for 2021–2027. The 2021–2027 Multiannual Financial Framework (MFF), the Next Generation EU (NGEU) Recovery Instrument and New Own Resources. European Parliament Briefing Infographic 2021–2027 MFF. 2020. Available online: https://www.europarl.europa.eu/RegData/etudes/BRIE/2020/659371/EPRS_BRI(2020)659371_EN.pdf (accessed on 11 June 2021).
- World Bank. Inclusion Matters: The Foundation for Shared Prosperity; World Bank: Washington, DC, USA, 2013. [Google Scholar] [CrossRef]
- United Nations. Sustainable Development Goals. The Sustainable Development Agenda. Available online: https://www.un.org/sustainabledevelopment/development-agenda/ (accessed on 18 March 2021).
- World Bank. Social Inclusion. Available online: https://www.worldbank.org/en/topic/social-inclusion#1 (accessed on 18 March 2021).
- Special Broadcasting Service. The Economic Benefits of Improving Social Inclusion. Deloitte Access Economics. Available online: https://www2.deloitte.com/content/dam/Deloitte/my/Documents/risk/my-risk-sdg10-economic-benefits-of-improving-social-inclusion.pdf (accessed on 18 March 2021).
- Blouchoutzi, A.; Digkolou, P.; Papathanasiou, J.; Nikas, C. An evaluation of the effectiveness of labor market integration policies in EU Member States using PROMETHEE. Int. J. Oper. Res. Inf. Syst. 2021, 12, 73–84. [Google Scholar] [CrossRef]
- Balourdos, D.A.; Petraki, M.A. Immigrant social inclusion in Europe: A descriptive investigation. Eur. XXI 2019, 37, 105–124. [Google Scholar] [CrossRef]
- Solano, G.; Huddleston, T. Migrant Integration Policy Index 2020; CIDOB and MPG: Barcelona, Spain; Brussels, Belgium, 2020. [Google Scholar]
- Council of the European Union. Declaration of the European Ministerial Conference on Integration. Zaragoza, 15-16/4/2010. Available online: https://ec.europa.eu/migrant-integration/librarydoc/declaration-of-the-european-ministerial-conference-on-integration-zaragoza-15-16-april-2010 (accessed on 18 March 2020).
- Mareschal, B.; El Hadouchi, M. Handling Missing Values in Discrete MCDA Problems. Available online: http://www.promethee-gaia.net/assets/missingvalues.pdf (accessed on 28 May 2021).
- Huddleston, T.; Niessen, J.; Dag Tjaden, J. Using EU Indicators of Immigrant Integration. Available online: https://ec.europa.eu/home-affairs/sites/homeaffairs/files/e-library/documents/policies/legal-migration/general/docs/final_report_on_using_eu_indicators_of_immigrant_integration_june_2013_en.pdf (accessed on 18 March 2021).
- Özdemir, E.; Ward, T.; Zólyomi, E.; Kureková, L.M. Labour Market Situation and Social Inclusion of Migrants. Research Note No. 8/2016; European Union: Brussels, Belgium, 2016. [Google Scholar]
- Brans, J.P.; Mareschal, B.; Vincke, P. PROMETHEE: A new family of outranking methods in multicriteria analysis. In Operational Research ‘84; Brans, J.P., Ed.; Elsevier: Amsterdam, The Netherlands, 1984; pp. 477–490. [Google Scholar]
- Brans, J.P.; Vincke, P.; Mareschal, B. How to select and how to rank projects: The PROMETHEE method. Eur. J. Oper. Res. 1986, 24, 228–238. [Google Scholar] [CrossRef]
- Papathanasiou, J.; Ploskas, N. Multiple Criteria Decision Aid. Methods, Examples and Python Implementations; Springer: Cham, Switzerland, 2017. [Google Scholar]
- Ishizaka, A.; Nemery, P. Multi-Criteria Decision Analysis: Methods and Software; Wiley: Hoboken, NJ, USA, 2013; ISBN 978-1-119-97407-9. [Google Scholar]
- Brans, J.; Mareschal, B. PROMETHEE methods. In Multiple Criteria Decision Analysis: State of the Art Surveys; Figueira, J., Greco, S., Ehrgott, M., Eds.; Springer Science + Business Media Inc.: Berlin, Germany, 2005; pp. 163–186. [Google Scholar]
- Mareschal, B. PROMETHEE-GAIA Stats. Available online: http://www.promethee-gaia.net/ (accessed on 12 May 2021).
- Rashid, M.F. Capabilities of a GIS-based multi-criteria decision analysis approach in modelling migration. Geo J. 2019, 84, 483–496. [Google Scholar] [CrossRef]
- Rashid, M.F.A. Spatial Modelling of Migration Decision-Selectivity in the Klang Valley Region, Malaysia. Int. J. Appl. Geospat. Res. 2020, 11, 21–35. [Google Scholar] [CrossRef]
- Arandarenko, M.; Corrente, S.; Jandrić, M.; Stamenković, M. Multiple criteria decision aiding as a prediction tool for migration potential of regions. Eur. J. Oper. Res. 2020, 284, 1154–1166. [Google Scholar] [CrossRef]
- Çetinkaya, C.; Özceylan, E.; Erbaş, M.; Kabak, M. GIS-based fuzzy MCDA approach for siting refugee camp: A case study for southeastern Turkey. Int. J. Disaster Risk Reduct. 2016, 18, 218–231. [Google Scholar] [CrossRef]
- Costa, A.S.; Lami, I.M.; Greco, S.; Figueira, J.R.; Borbinha, J. Assigning a house for refugees: An application of a multiple criteria nominal classification method. Oper. Res. 2019. [Google Scholar] [CrossRef]
- European Commission. European Web Site on Integration. Governance of Migrant Integration Across Europe. Available online: https://ec.europa.eu/migrant-integration/home (accessed on 18 March 2020).
- Nimfόhr, S.; Otto, L.; Samateh, G. Denying, While Demanding Integration: An Analysis of the Integration Paradox in Malta and Refugees’ Coping Strategies. In Politics of (Dis) Integration; Hinger, S., Schweitzer, R., Eds.; Springer: Cham, Switzerland, 2020. [Google Scholar] [CrossRef] [Green Version]
- Ministerstvo vnitra České republiky. Zpráva O Situaci V Oblasti Migrace A Integrace Cizinců Na Území České Republiky 2019; Ministerstvo vnitra České Republiky: Praha, Czech Republic, 2020. [Google Scholar]
- OECD. Finding Their Way. The Integration of Refugees in Portugal; OECD: Paris, France, 2019. [Google Scholar]
- European Parliament. Legislative Train 8 Towards a New Policy on Migration. Available online: https://www.europarl.europa.eu/legislative-train/theme-towards-a-new-policy-on-migration/file-1st-emergency-relocation-scheme (accessed on 18 March 2021).
- European Commission. Relocation: EU Solidarity between Member States. Available online: https://ec.europa.eu/home-affairs/sites/homeaffairs/files/what-we-do/policies/european-agenda-migration/20171114_relocation_eu_solidarity_between_member_states_en.pdf (accessed on 18 March 2021).
- Caneva, E. The Integration of Migrants in Italy: An Overview of Policy Instruments and Actors, Migration Policy Centre, INTERACT Research Report, Country Reports, 2014/05. Available online: http://hdl.handle.net/1814/32019 (accessed on 18 March 2021).
- Arango, J. Exceptional in Europe? Spain’s Experience with Immigration and Integration; Migration Policy Institute: Washington, DC, USA, 2013. [Google Scholar]
Figure 1.
The PROMETHEE GDSS procedure [20].
Figure 1.
The PROMETHEE GDSS procedure [20].

Figure 2.
Types of generalized criteria [22].
Figure 2.
Types of generalized criteria [22].


Table 1.
PROMETHEE evaluation table.
| a | g1(∙) | g2(∙) | … | gj(∙) | … | gk(∙) |
| w1 | w2 | … | wj | … | wk | |
| a1 | g1(a1) | g2(a1) | … | gj(a1) | … | gk(a1) |
| a2 | g1(a2) | g2(a2) | … | gj(a2) | … | gk(a2) |
| ai | g1(ai) | g2(aj) | … | gj(ai) | … | gk(ai) |
| an | g1(an) | g2(an) | … | gj(an) | … | gk(an) |
Table 2.
Distribution of the 2393 papers based on PROMETHEE by application areas (some papers are related to multiple fields so that the total of the above percentages is larger than 100%) [23].
Table 2.
Distribution of the 2393 papers based on PROMETHEE by application areas (some papers are related to multiple fields so that the total of the above percentages is larger than 100%) [23].
| Number of Papers | Percentage | Application Domain |
|---|---|---|
| 493 | 0.21% | theoretical papers about the PROMETHEE methodology, including many proposals for extensions or new models |
| 469 | 0.20% | services and/or public applications |
| 457 | 0.19% | environmental problems |
| 347 | 0.15% | industrial applications |
| 227 | 0.09% | energy |
| 153 | 0.06% | water |
| 124 | 0.05% | finance |
| 116 | 0.05% | transportation |
| 77 | 0.03% | procurement |
| 75 | 0.03% | health care |
| 30 | 0.01% | mining |
| 101 | 0.04% | other fields of application |
Table 3.
PROMETHEE Preferences.
| Property Ownership (%) | People at Risk of Poverty or Social Exclusion (%) | Median Equivalized Net Income (€) | Self-Perceived Health (Very Good or Good) (%) | Gap between Natives and Migrants with Regard to Property Ownership (pp) | Gap between Natives and Migrants with Regard to People at Risk of Poverty or Social Exclusion (pp) | Gap between Natives and Migrants with Regard to Median Equivalized Net Income (€) | Gap between Natives and Migrants with Regard to Self-Perceived Health (Very Good or Good) (pp) | |
|---|---|---|---|---|---|---|---|---|
| MIN/MAX | max | min | max | max | min | min | min | min |
| Weight | 1 | 1 | 1 | 1 | 1 | 1 | 1 | 1 |
| Preference Fn | Linear | Linear | Linear | Linear | Linear | Linear | Linear | Linear |
| Thresholds | absolute | absolute | absolute | absolute | absolute | absolute | absolute | absolute |
| Q: Indifference | 3 | 3 | 700 | 3 | 3 | 3 | 700 | 3 |
| P: Preference | 10 | 10 | 2000 | 10 | 10 | 10 | 2000 | 10 |
Table 4.
PROMETHEE results.
| 2010 | 2011 | 2012 | 2013 | 2014 | 2015 | 2016 | 2017 | 2018 | 2019 | All |
|---|---|---|---|---|---|---|---|---|---|---|
| Malta | Malta | Malta | Malta | Malta | Malta | Malta | Malta | Malta | Czechia | Malta |
| Hungary | Romania | Czechia | Czechia | Czechia | Czechia | UK | Czechia | Czechia | Malta | Czechia |
| Portugal | Portugal | Hungary | Hungary | UK | Hungary | Czechia | UK | Portugal | Portugal | Portugal |
| Netherlands | Hungary | Portugal | Romania | Hungary | UK | Portugal | Portugal | UK | Slovakia | Hungary |
| Czechia | UK | UK | Portugal | Portugal | Portugal | Luxembourg | Luxembourg | Germany | Denmark | UK |
| UK | Ireland | Cyprus | Luxembourg | Cyprus | Cyprus | Germany | Hungary | Ireland | Hungary | Cyprus |
| Ireland | Cyprus | Netherlands | Ireland | Slovakia | Luxembourg | Hungary | Finland | Bulgaria | Germany | Luxembourg |
| Luxembourg | Czechia | Germany | Cyprus | Luxembourg | Denmark | Cyprus | Cyprus | Cyprus | Bulgaria | Germany |
| Cyprus | Netherlands | Luxembourg | Netherlands | France | Germany | Croatia | Slovakia | Hungary | Ireland | Romania |
| Slovakia | Luxembourg | France | UK | Germany | Netherlands | Finland | Germany | Finland | Finland | Ireland |
| Croatia | Germany | Sweden | Denmark | Romania | France | France | Netherlands | Luxembourg | Cyprus | Netherlands |
| Romania | France | Romania | France | Netherlands | Romania | Romania | Croatia | Croatia | Romania | Croatia |
| Slovenia | Slovenia | Ireland | Germany | Finland | Slovakia | Slovakia | Romania | Romania | UK | Denmark |
| Sweden | Croatia | Croatia | Finland | Denmark | Sweden | Ireland | Ireland | France | Poland | France |
| Estonia | Estonia | Italy | Croatia | Lithuania | Croatia | Denmark | Denmark | Denmark | Croatia | Finland |
| Germany | Denmark | Lithuania | Sweden | Croatia | Poland | Poland | Bulgaria | Slovenia | Luxembourg | Slovakia |
| France | Sweden | Estonia | Lithuania | Ireland | Finland | Lithuania | France | Lithuania | Lithuania | Lithuania |
| Italy | Italy | Denmark | Estonia | oland | Ireland | Bulgaria | Sweden | Sweden | Slovenia | Sweden |
| Lithuania | Lithuania | Poland | Poland | Sweden | Lithuania | Estonia | Italy | Netherlands | Greece | Slovenia |
| Spain | Poland | Greece | Slovenia | Estonia | Estonia | Latvia | Slovenia | Estonia | Estonia | Poland |
| Poland | Spain | Slovenia | Latvia | Slovenia | Slovenia | Slovenia | Lithuania | Poland | France | Estonia |
| Finland | Greece | Finland | Greece | Latvia | Latvia | Sweden | Estonia | Italy | Latvia | Bulgaria |
| Greece | Latvia | Spain | Italy | Spain | Spain | Netherlands | Latvia | Greece | Italy | Italy |
| Denmark | Finland | Latvia | Spain | Bulgaria | Bulgaria | Italy | Greece | Latvia | Sweden | Latvia |
| Latvia | Slovakia | Slovakia | Bulgaria | Greece | Italy | Spain | Poland | Slovakia | Belgium | Greece |
| Bulgaria | Belgium | Belgium | Belgium | Italy | Greece | Greece | Spain | Spain | Spain | Spain |
| Belgium | Austria | Bulgaria | Slovakia | Belgium | Belgium | Belgium | Belgium | Austria | Netherlands | Belgium |
| Austria | Bulgaria | Austria | Austria | Austria | Austria | Austria | Austria | Belgium | Austria | Austria |
Table 5.
Sensitivity analysis.
| 2010 | 2011 | 2012 | 2013 | 2014 | 2015 | 2016 | 2017 | 2018 | 2019 | |
|---|---|---|---|---|---|---|---|---|---|---|
| Property Ownership | 12.31–12.54% | 11.96–12.51% | 12.49–12.54% | 12.35–13.12% | 12.46–12.82% | 11.99–12.58% | 12.04–12.78% | 11.93–12.64% | 12.35–12.63% | 12.33–12.51% |
| People at risk of poverty or social exclusion | 12.3–12.5% | 12.32–12.53% | 12.49–12.72% | 12.36–12.65% | 12.36–12.57% | 11.54–13.17% | 11.72–12.90% | 12.37–12.79% | 12.37–12.71% | 12.49–12.98% |
| Median Equivalized Net Income | 12.22–12.5% | 12.48–12.85% | 12.46–12.54% | 12.32–13.13% | 12.28–12.52% | 12.40–12.81% | 12.29–12.95% | 12.30–13.11% | 12.04–12.78% | 12.40–12.73% |
| Self-perceived health (very good or good) | 12.5–12.65% | 12.49–12.58% | 12.45–12.51% | 12.13–12.78% | 12.24–12.54% | 12.39–13.02% | 11.96–12.94% | 12.28–12.80% | 12.39–12.59% | 12.48–12.68% |
| Gap between natives and migrants with regard to Property Ownership | 12.28–12.5% | 11.63–12.51% | 12.49–12.57% | 12.17–12.97% | 12.45–12.74% | 11.83–12.55% | 11.76–13.10% | 12.07–12.61% | 12.38–12.61% | 12.35–12.52% |
| Gap between natives and migrants with regard to People at risk of poverty or social exclusion | 12.48–12.68% | 12.48–12.69% | 12.46–12.51% | 12.41–12.57% | 12.45–12.53% | 12.43–12.82% | 12.21–13.14% | 12.16–12.69% | 12.35–12.65% | 12.01–12.53% |
| Gap between natives and migrants with regard to Median Equivalized Net Income | 12.49–12.92% | 12.22–12.51% | 12.49–12.54% | 12.17–12.68% | 12.45–12.70% | 12.24–12.60% | 12.13–12.88% | 11.91–12.78% | 12.29–12.82% | 12.47–12.76% |
| Gap between natives and migrants with regard to Self-perceived health (very good or good) | 12.5–12.73% | 12.49–13.07% | 12.30–12.51% | 12.06–12.74% | 12.47–12.58% | 12.39–13.23% | 11.84–13.45% | 12.32–12.75% | 12.37–12.59% | 12.49–12.68% |
Publisher’s Note: MDPI stays neutral with regard to jurisdictional claims in published maps and institutional affiliations. |
© 2021 by the authors. Licensee MDPI, Basel, Switzerland. This article is an open access article distributed under the terms and conditions of the Creative Commons Attribution (CC BY) license (https://creativecommons.org/licenses/by/4.0/).
Share and Cite
MDPI and ACS Style
Blouchoutzi, A.; Manou, D.; Papathanasiou, J. A PROMETHEE MCDM Application in Social Inclusion: The Case of Foreign-Born Population in the EU. Systems 2021, 9, 45. https://0-doi-org.brum.beds.ac.uk/10.3390/systems9020045
AMA Style
Blouchoutzi A, Manou D, Papathanasiou J. A PROMETHEE MCDM Application in Social Inclusion: The Case of Foreign-Born Population in the EU. Systems. 2021; 9(2):45. https://0-doi-org.brum.beds.ac.uk/10.3390/systems9020045
Chicago/Turabian StyleBlouchoutzi, Anastasia, Dimitra Manou, and Jason Papathanasiou. 2021. "A PROMETHEE MCDM Application in Social Inclusion: The Case of Foreign-Born Population in the EU" Systems 9, no. 2: 45. https://0-doi-org.brum.beds.ac.uk/10.3390/systems9020045
Note that from the first issue of 2016, this journal uses article numbers instead of page numbers. See further details here.