
Cyberspace: A Digital Ecosystem


1
Department of Defense USG, Ft George G. Meade, MD 20755, USA
2
College of Engineering, University of South Alabama, Mobile, AL 36688, USA
*
Author to whom correspondence should be addressed.
†
Kari J. Lippert has retired.
Systems 2021, 9(3), 48; https://0-doi-org.brum.beds.ac.uk/10.3390/systems9030048
Submission received: 28 April 2021
/
Revised: 22 June 2021
/
Accepted: 24 June 2021
/
Published: 26 June 2021
Abstract
:Cyberspace is a new frontier, not just for hackers, but for engineers. It is a digital ecosystem, the next generation of Internet and network applications, promising a whole new world of distributed and open systems that can interact, self-organize, evolve, and adapt. These ecosystems transcend traditional collaborative environments, such as client-server, peer-to-peer, or hybrid models (e.g., web services), to become a self-organized, evolving, interactive environment. Understanding cyberspace as a system is critical if we are to properly design systems to exist within it. Considering it to be a digital ecosystem, where systems can adapt and evolve, will enable systems engineering to become more effective in the future of networks and the Internet. While most systems engineers have only anecdotal experience with large segments of this ecosystem, in today’s world all of them must come to understand it. Engineering any system, or portion of a system, begins with an understanding of the system. This paper presents two interrelated yet distinct foundational models of the ecosystem of cyberspace: a Systemigram to narrate the cyclical nature of cyber warfare, and a modified predator–prey model, as a mathematical model. Systems engineers can utilize these models to design digital “species” that function and adapt within this ecosystem.
Keywords:
cyberspace; digital ecosystem; complex system; Systemigram; cyberwarfare; cybersecurity; predator-prey; SIR1. Introduction
Cyberspace is the domain where the electromagnetic spectrum is used to store, modify, and exchange data. It is characterized by logically networked systems that reside on physical infrastructure. Cyber warfare is an adversarial conflict that utilizes cyber means and occurs, at least partially, in cyberspace. This can include denying opposing forces the utilization of cyberspace during conflict, and involves cyber-attack, cyber-defense, and cyber-enabling actions [1]. It is, as is all warfare, a conflict over control of resources, which includes people, wealth, information, and infrastructure.
Current-generation security engineering is characterized principally as reactive: it is invented and deployed in response to attack experiences. The catch-up ability of this method degrades as the volume and variety of attacks increases. Security is typically an add-on after-the-fact defense insertion as a functional subsystem, force-fit to the system that needs protection. In contrast, next-generation security must at least provide parity with the agility of intelligent attackers and the communities that support their rapid innovation and evolution. The forefront of systems engineering in cybersecurity is developing theory and abstractions for systems of systems and self-organizing complex systems to support better engineered solutions in this space. The agility of the adversary and the urgency for effective systemic response offers the systems engineering community a tangible and urgent target for meaningful application. Good systems engineering cannot happen, however, if the domain being engineered for is poorly understood.
Cyberspace is clearly a system of systems (SoS)—a system composed of other systems. This SoS resembles an ecosystem more closely than an engineered system: members of the ecosystem survive and flourish based on their fitness and ability to modify themselves in the face of competition and other evolutionary pressures. This work explores the rapidly emerging digital ecosystem of cyberspace using the Systemigram tool [2]. It then applies properties of complex systems to the ecosystem, looking to the well-known Lotka–Volterra predator–prey model [3] and extending the model to better fit the oscillatory pattern of cyber warfare. The resultant models are presented as a concise, informative description of the ecosystem of cyberspace. The paper concludes with a discussion of the application of the model to the Colonial Pipeline ransomware attack of May 2021 [4,5].
2. Background
Even though the term “cyberspace” was introduced by William Gibson in 1982, the concept that the word describes existed years before the term was formally adopted to refer to the World Wide Web, or Internet, in the 1990s. Cyberspace is a global domain within the information environment consisting of a network of information technology infrastructures, including the Internet, telecommunication networks, computer systems, and embedded processors and controllers. The term is also used to refer to objects and identities that exist within it. Information assurance has become synonymous with cybersecurity, which focuses the dynamic interaction of people, process, technology, the environment, and results of the interactions. Reflecting this, cyberspace can be described in terms of three interrelated layers: physical network, logical network, and cyberpersona.
It has taken years of information assurance research and modeling for a systems view of the entirety of cyber warfare reflecting these three layers to be published [6]. Most research is focused on a single, or a set of related, attacks and defenses, such as distributed denial of service (DDoS) [7], malware attacks and propagation, and situational awareness [8], each focusing on a single layer. This has resulted in powerful models characterizing attacks, such as the Lockheed Martin Kill Chain [9], the Diamond Model of Intrusion Analysis [10], and Mitre ATT&CK [11]. Various frameworks and perspectives [8,12,13,14,15] have been proposed but none consider the concepts of emergence and evolution as is suggested in the ecological perspective on cyberspace [16]. Several of the frameworks acknowledge that cyber security behaves more like an arms race than a purpose designed system, where the advancement of adversary capabilities drives the advancement of security measures which, in turn, drives the advancement of adversary capabilities.
The call for systems thinking in considering the domain of cyberspace and self-organizing networks [13,14] argues for the use of systems thinking tools to represent the domain. The Systemigram [1] is one such tool, providing a systematic visualization of system complexity [17]. It has been applied to several domains, including the risk dynamics of cyberspace [18]. The complexity of this domain, cyberspace, with the interrelation of physical, logical, and human (social) networks, lends itself to description with this tool.
The concepts underlying ecology, coevolution, the immune system, and biomimicry have been applied to this domain [16,19]. Considering cyberspace to be a community of cyber organisms that interact with each other and with their environment opens a variety of ecological models for consideration. The ecosystem interaction models of predation, parasitism, symbiosis, cooperation, resource competition, and sexual interaction have been suggested. The Lotka–Volterra predator–prey model [3] has been widely used to model various aspects of cyberspace as it is useful where there is a degree of dependence on performance and resources. Considering power fluctuations instead of population density fluctuations with a variety of predators (computer network exploitation, cyber weapons of mass destruction, and cyber weapons of mass effect) [12], this model indicates the potential impact from each type of predator.
One shortcoming of the Lotka–Volterra predator–prey model is the assumption of a homogeneous prey [20]. Species diversification in prey has been shown to improve the resilience of the prey. Agent-based modeling has been used for many years in attempts to model an adaptive co-evolving adversary [7,21] and is useful for its ability to represent a large number of simultaneously interacting variables during population studies, making it useful to address heterogeneous populations. The models presented in this paper do not address the heterogeneity of either the attacker or defender populations as this would require inclusion of methodologies and techniques of attack and defense to properly characterize the prey and the predator. These models simply present an ecosystem of three species characterized by their interest in resources: attackers wish to obtain and/or control new resources, defenders wish to not lose control or ownership of their resources, and the uninterested are neither attackers nor defenders.
3. Scope and Methods
Building a digital ecosystem is a considerable undertaking; ecologists have had only limited success with the construction and maintenance of small ecosystems. It seems, from their experience, ecosystems need to be grown, which is a concept foreign to systems architecture and design. Dealing with complexity in an ecosystem can be challenging. Describing only the portions of an ecosystem that are of interest can help deal with the complexity; simplifying assumptions can be made provided they are not hidden. Using the Systemigram tool [2], the Cyberspace Systemigram was developed to illustrate that portion of the digital ecosystem dealing with cyber warfare. This model illustrates the populations of humans involved as well as some other critical resources, such as infrastructure and time. The model highlights an overlooked aspect of cyberspace models—in victory, attackers become defenders of newly won resources, and defenders must become attackers to recover those resources. It is important to note that cyber warfare revolves around the control of resources: money, time, people, infrastructure, and reputation. Resources can be stolen, ransomed, or purchased, so it is important to keep in mind when examining these models that the words “attack” and “defend” are not a perfect fit for describing the transfer of these types of control. These words are used here as they are commonly used to describe actors in cyberspace and cyber warfare. In these models, attackers are defined as those that wish to control the resources, and defenders are those that currently control the resources. The models do not address methods and modes of attack and/or defense.
Based on this conceptual model of cyberspace, a complex system model was developed through the application of a predator–prey complex system using various modifications to the Lotka–Volterra predator–prey model [3]. These modifications include considerations of the Kermack–McKendrick model [22,23] for susceptibility, resistance, and infection rates. A new complex system model is proposed that accommodates the ecosystem detailed in the Systemigram. Recruitment is essential to the cyber warfare ecosystem, as uninvolved members of the population will be available for recruitment by both defenders and attackers. Although omitted from the Systemigram, these uninvolved, or uninterested, people must also be represented. Parameters to adequately describe the cyberspace population therefore represents the cyclic conversion between members of the three populations—uninterested, attackers, and defenders. It is shown that the only stable equilibrium in this model occurs where all the population is “uninterested”—neither attacker nor defender.
The novel contribution of these models is the consideration of the oscillation of predator into prey and back again. Converting prey into predator and vice versa is not a concept that is dealt with in population dynamics as it is outside the “normal” realm of ecology. A mathematical model is developed through the extension and combination of existing models, and research is continuing to discover and measure data to validate an agent-based simulation of this model. These models can help to better understand the interplay of the various parameters applying evolutionary pressure in the digital ecosystem. Therefore, this mathematical model only illustrates the pressures and processes of moving through the cycle depicted in the Systemigram and has not been tested against observation of the actual populations within cyberspace. A recent cyberattack is described using the model as a verification of the concepts presented.
4. Results
4.1. Cyber Warfare in a Systemigram
The relative strength or weakness of a defense can be seen in how quickly it fails to increasingly advanced attacks. While the lowest tiers of attack may focus on simply beating the door down, any attack worth consideration will revolve around attempting to find and exploit a vulnerability. Cyber warfare is unique in that any vulnerability across the entirety of an organization’s infrastructure can result in the total compromise of that organization’s security. For this reason, defensive postures in cyber security are generally discussed as “not being vulnerable to X” rather than “able to do Y”. Thus, the strength of a defensive position in cyber warfare has little to do with capability and everything to do with not being vulnerable to the exploit that took out someone else’s network yesterday [24].
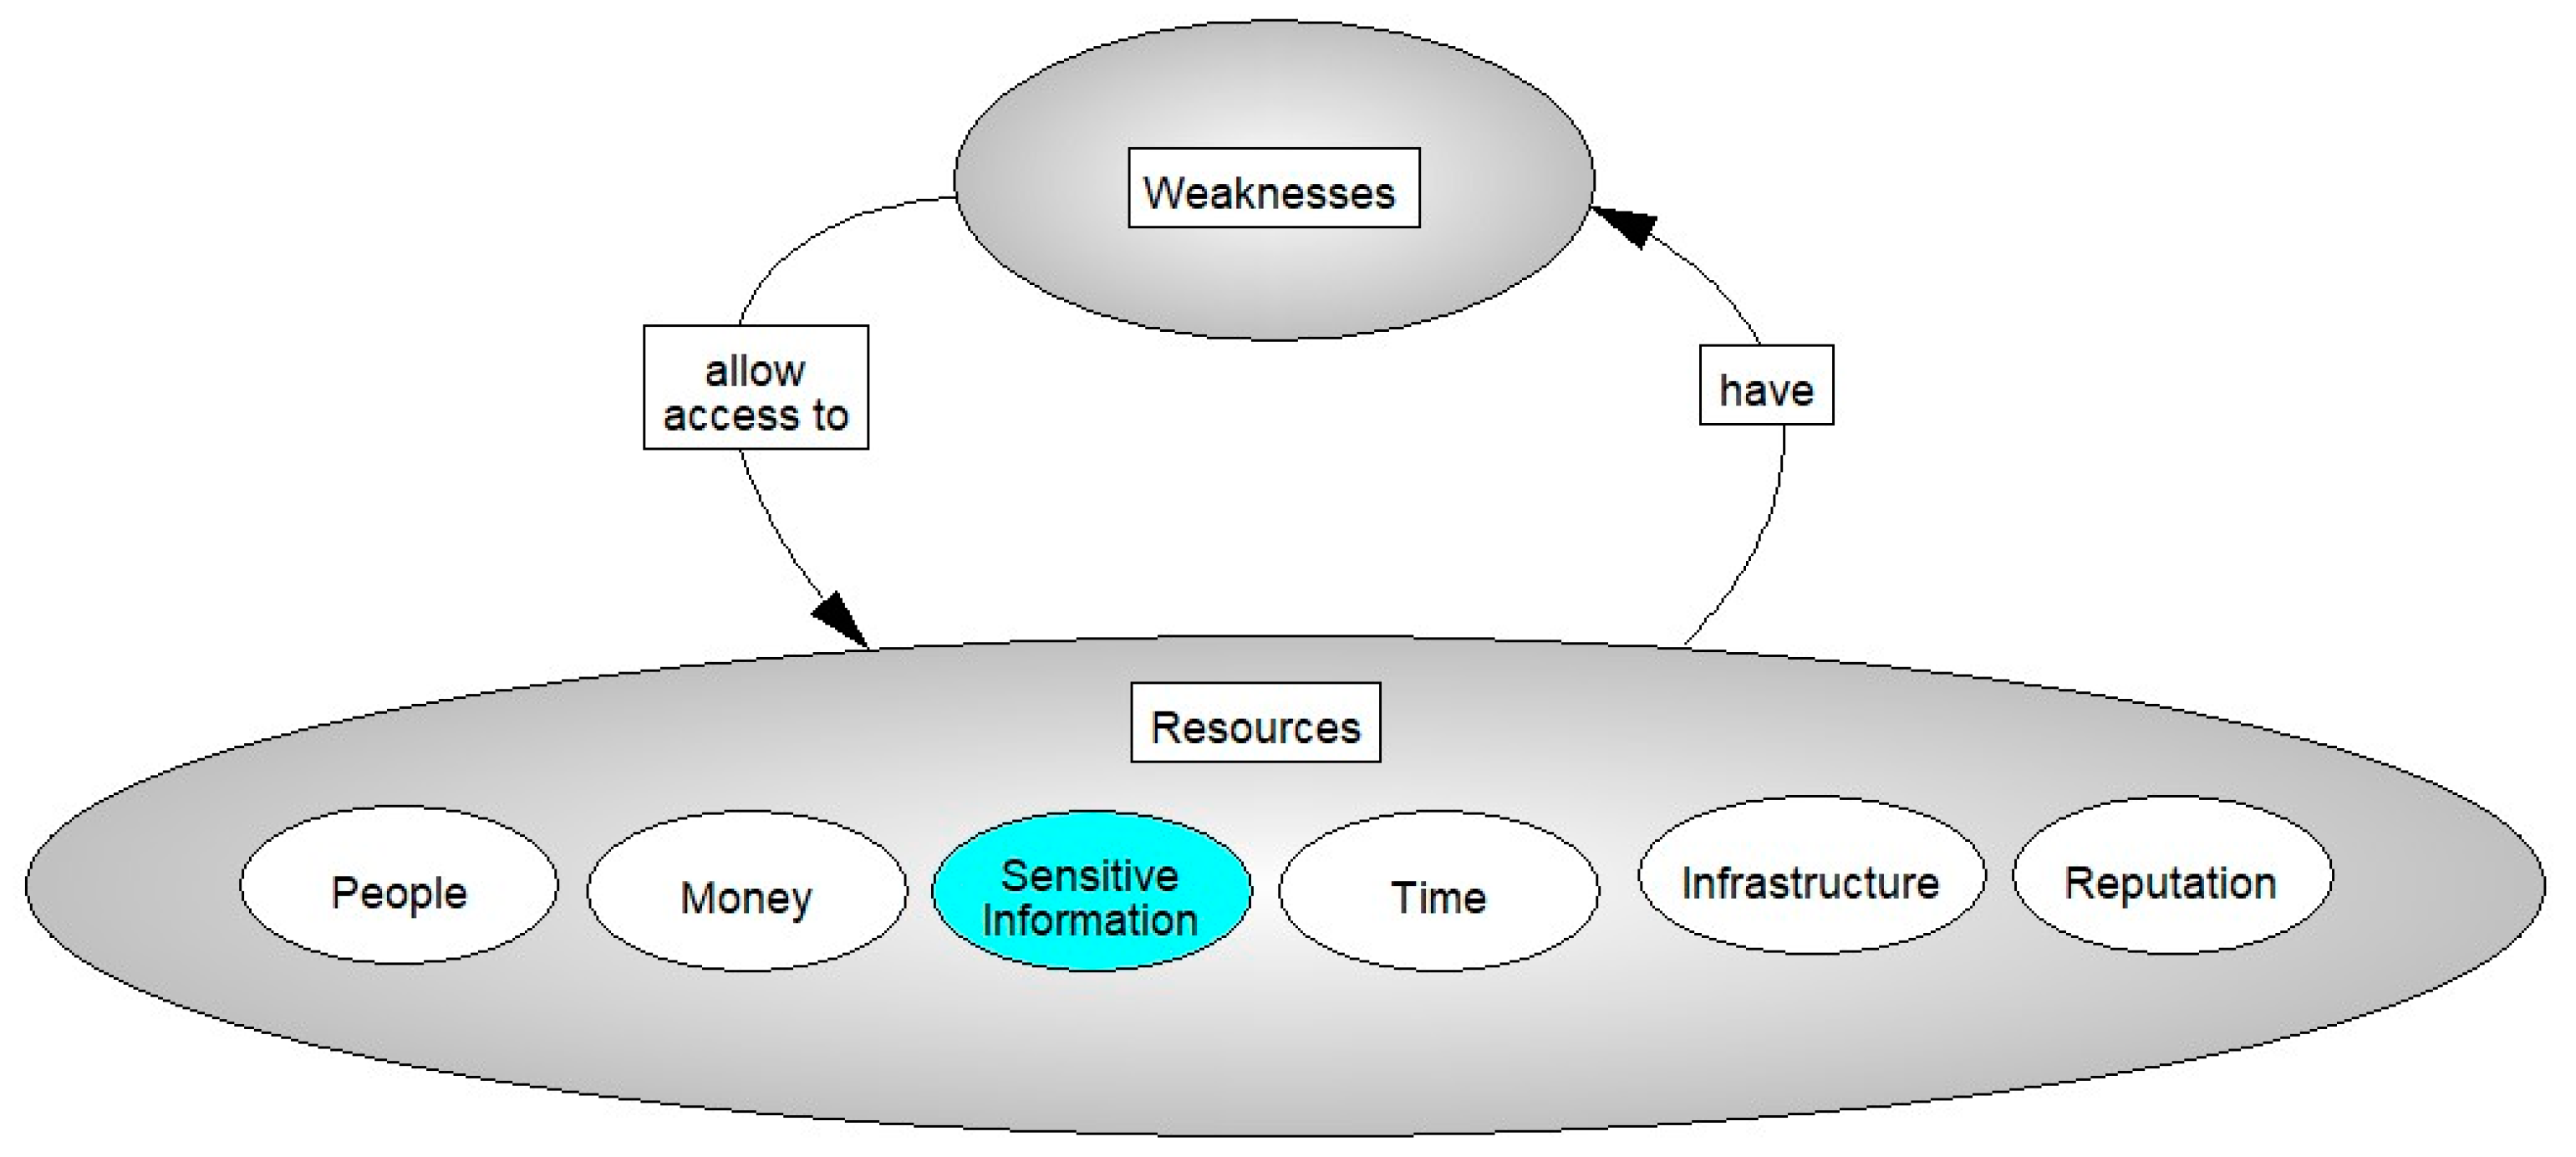
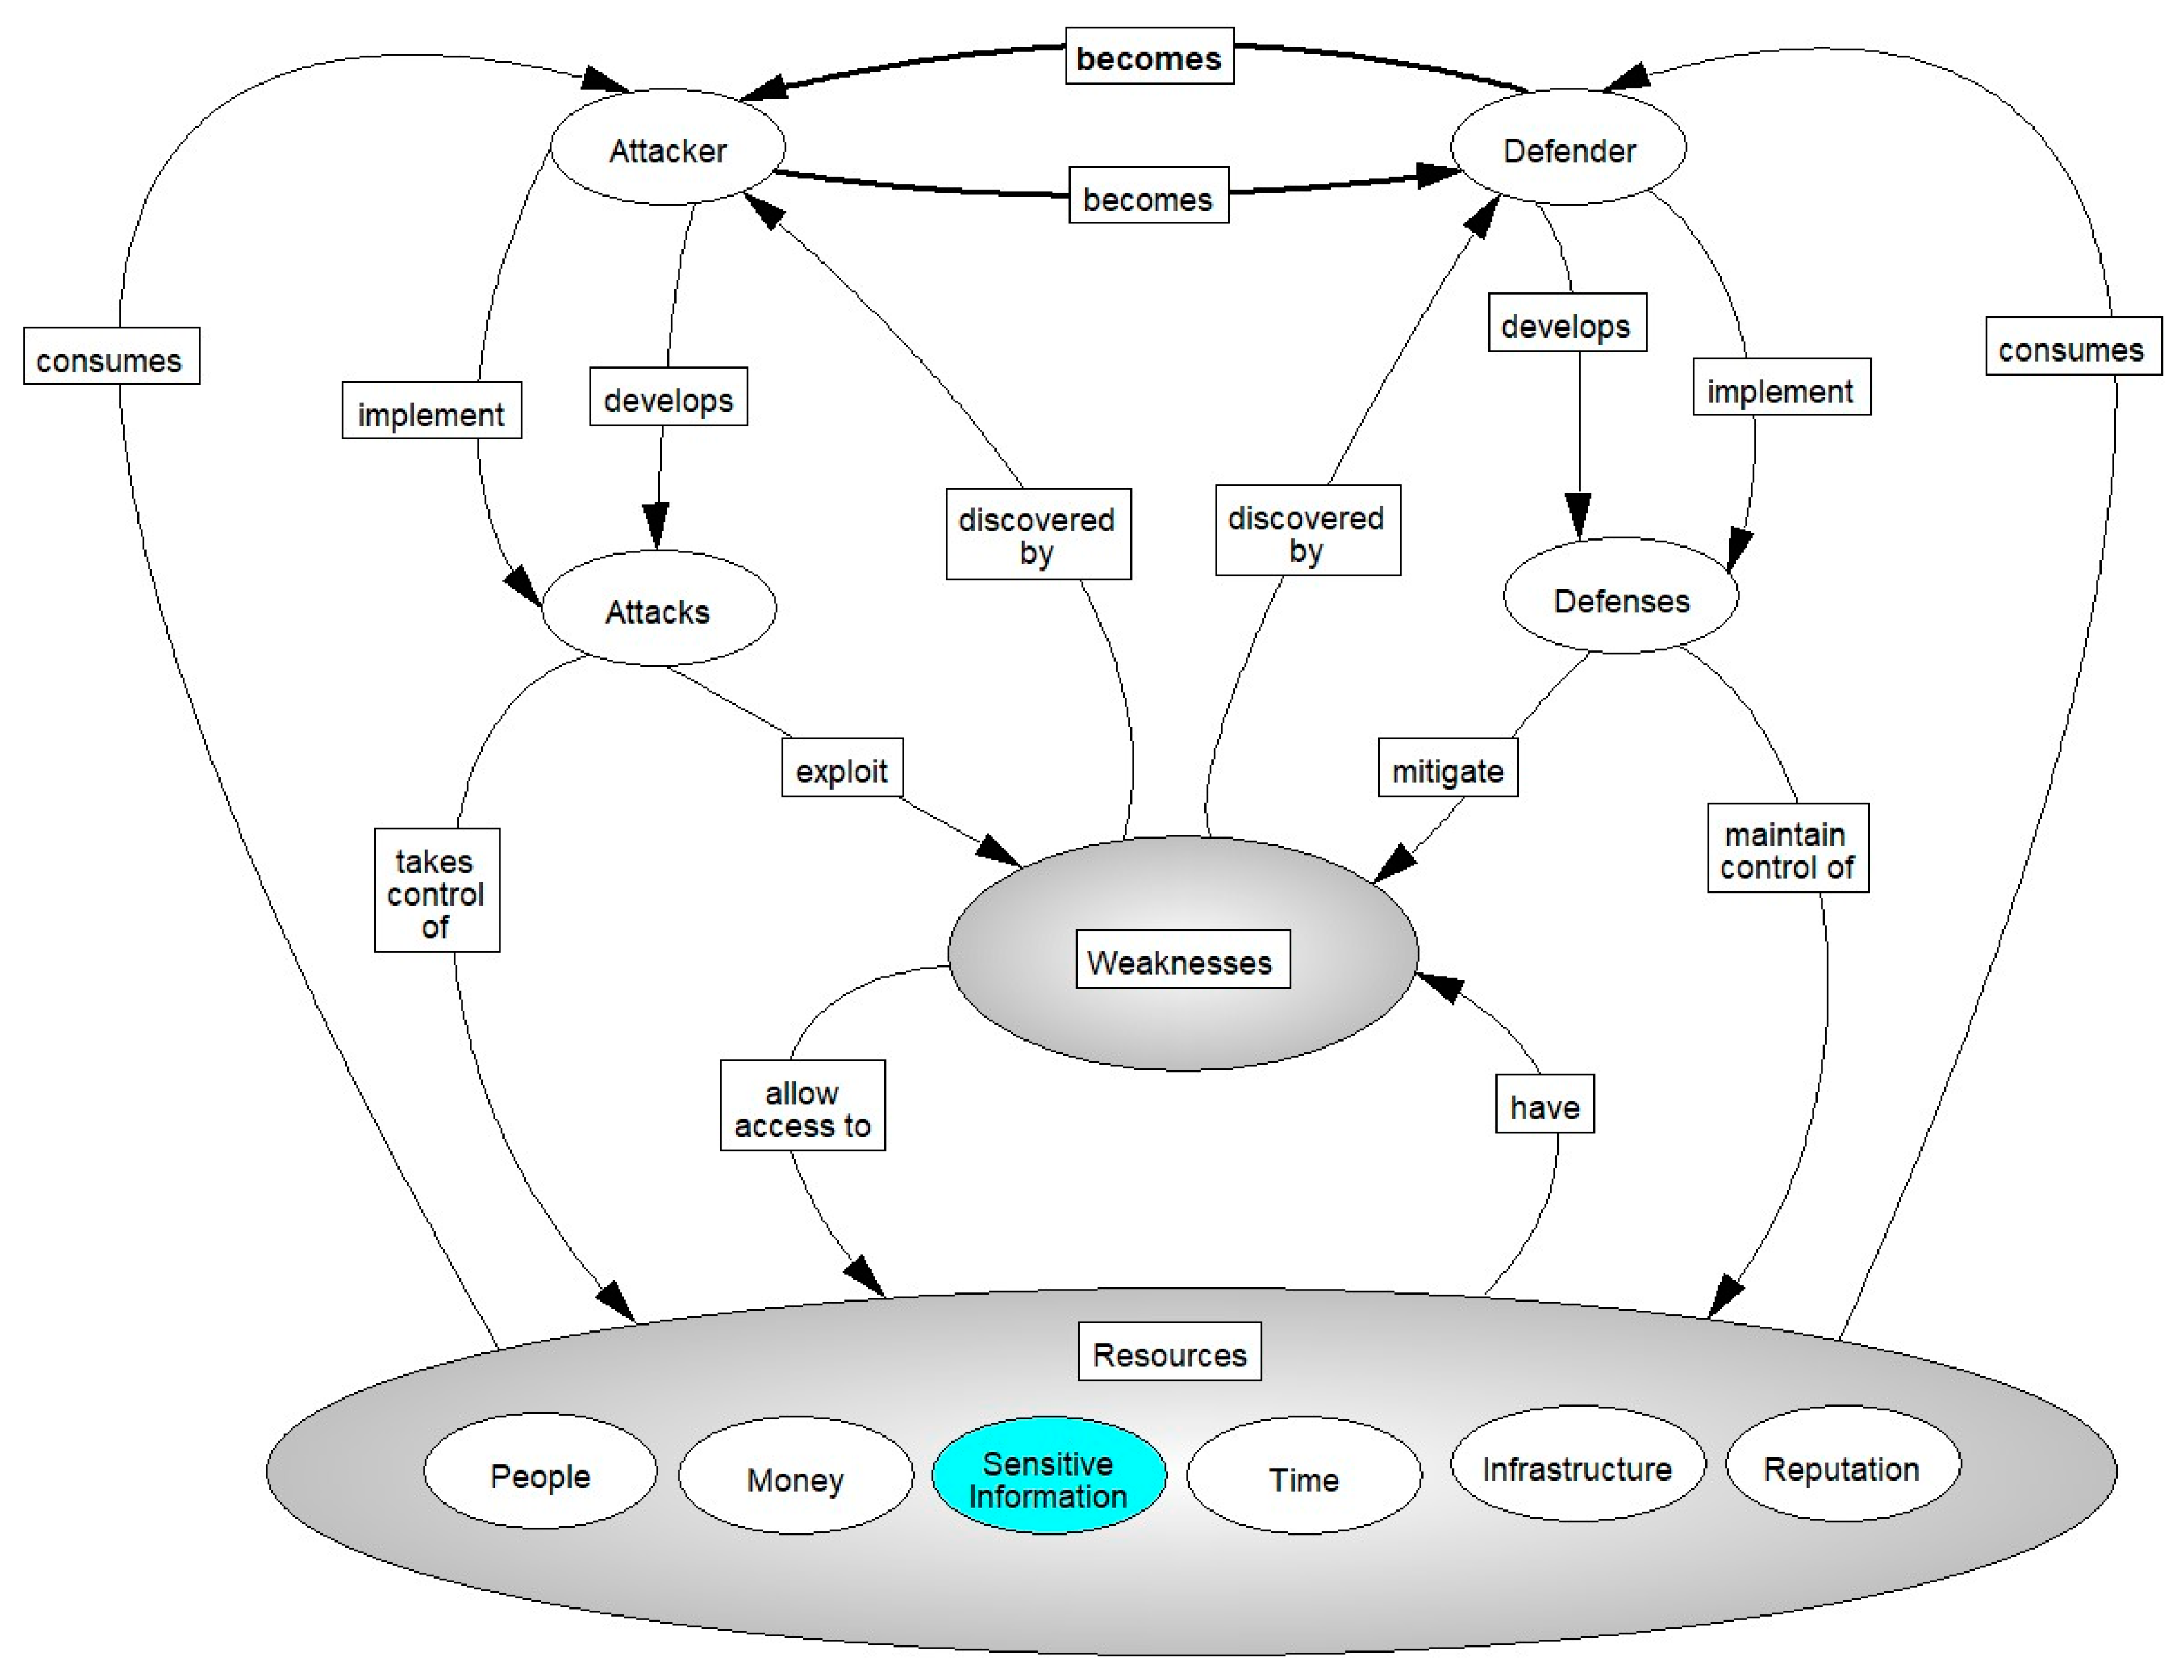
Cyber warfare, as for warfare in other domains, focuses on weaknesses. Resources, especially people and infrastructure, have weaknesses. Weakness is a lack of force (strength), or of ability. It is also the inability to withstand temptation, urgency, and persuasion; being easily impressed, moved, or overcome; accessible; vulnerable or susceptible. As seen in the Systemigram (Figure 1), resources have weaknesses that allow access to them. In addition to enabling access to people and infrastructure, weaknesses allow access to sensitive information, money, and reputation. These resources can be exploited for control (people and infrastructure) or to attain money and reputation.
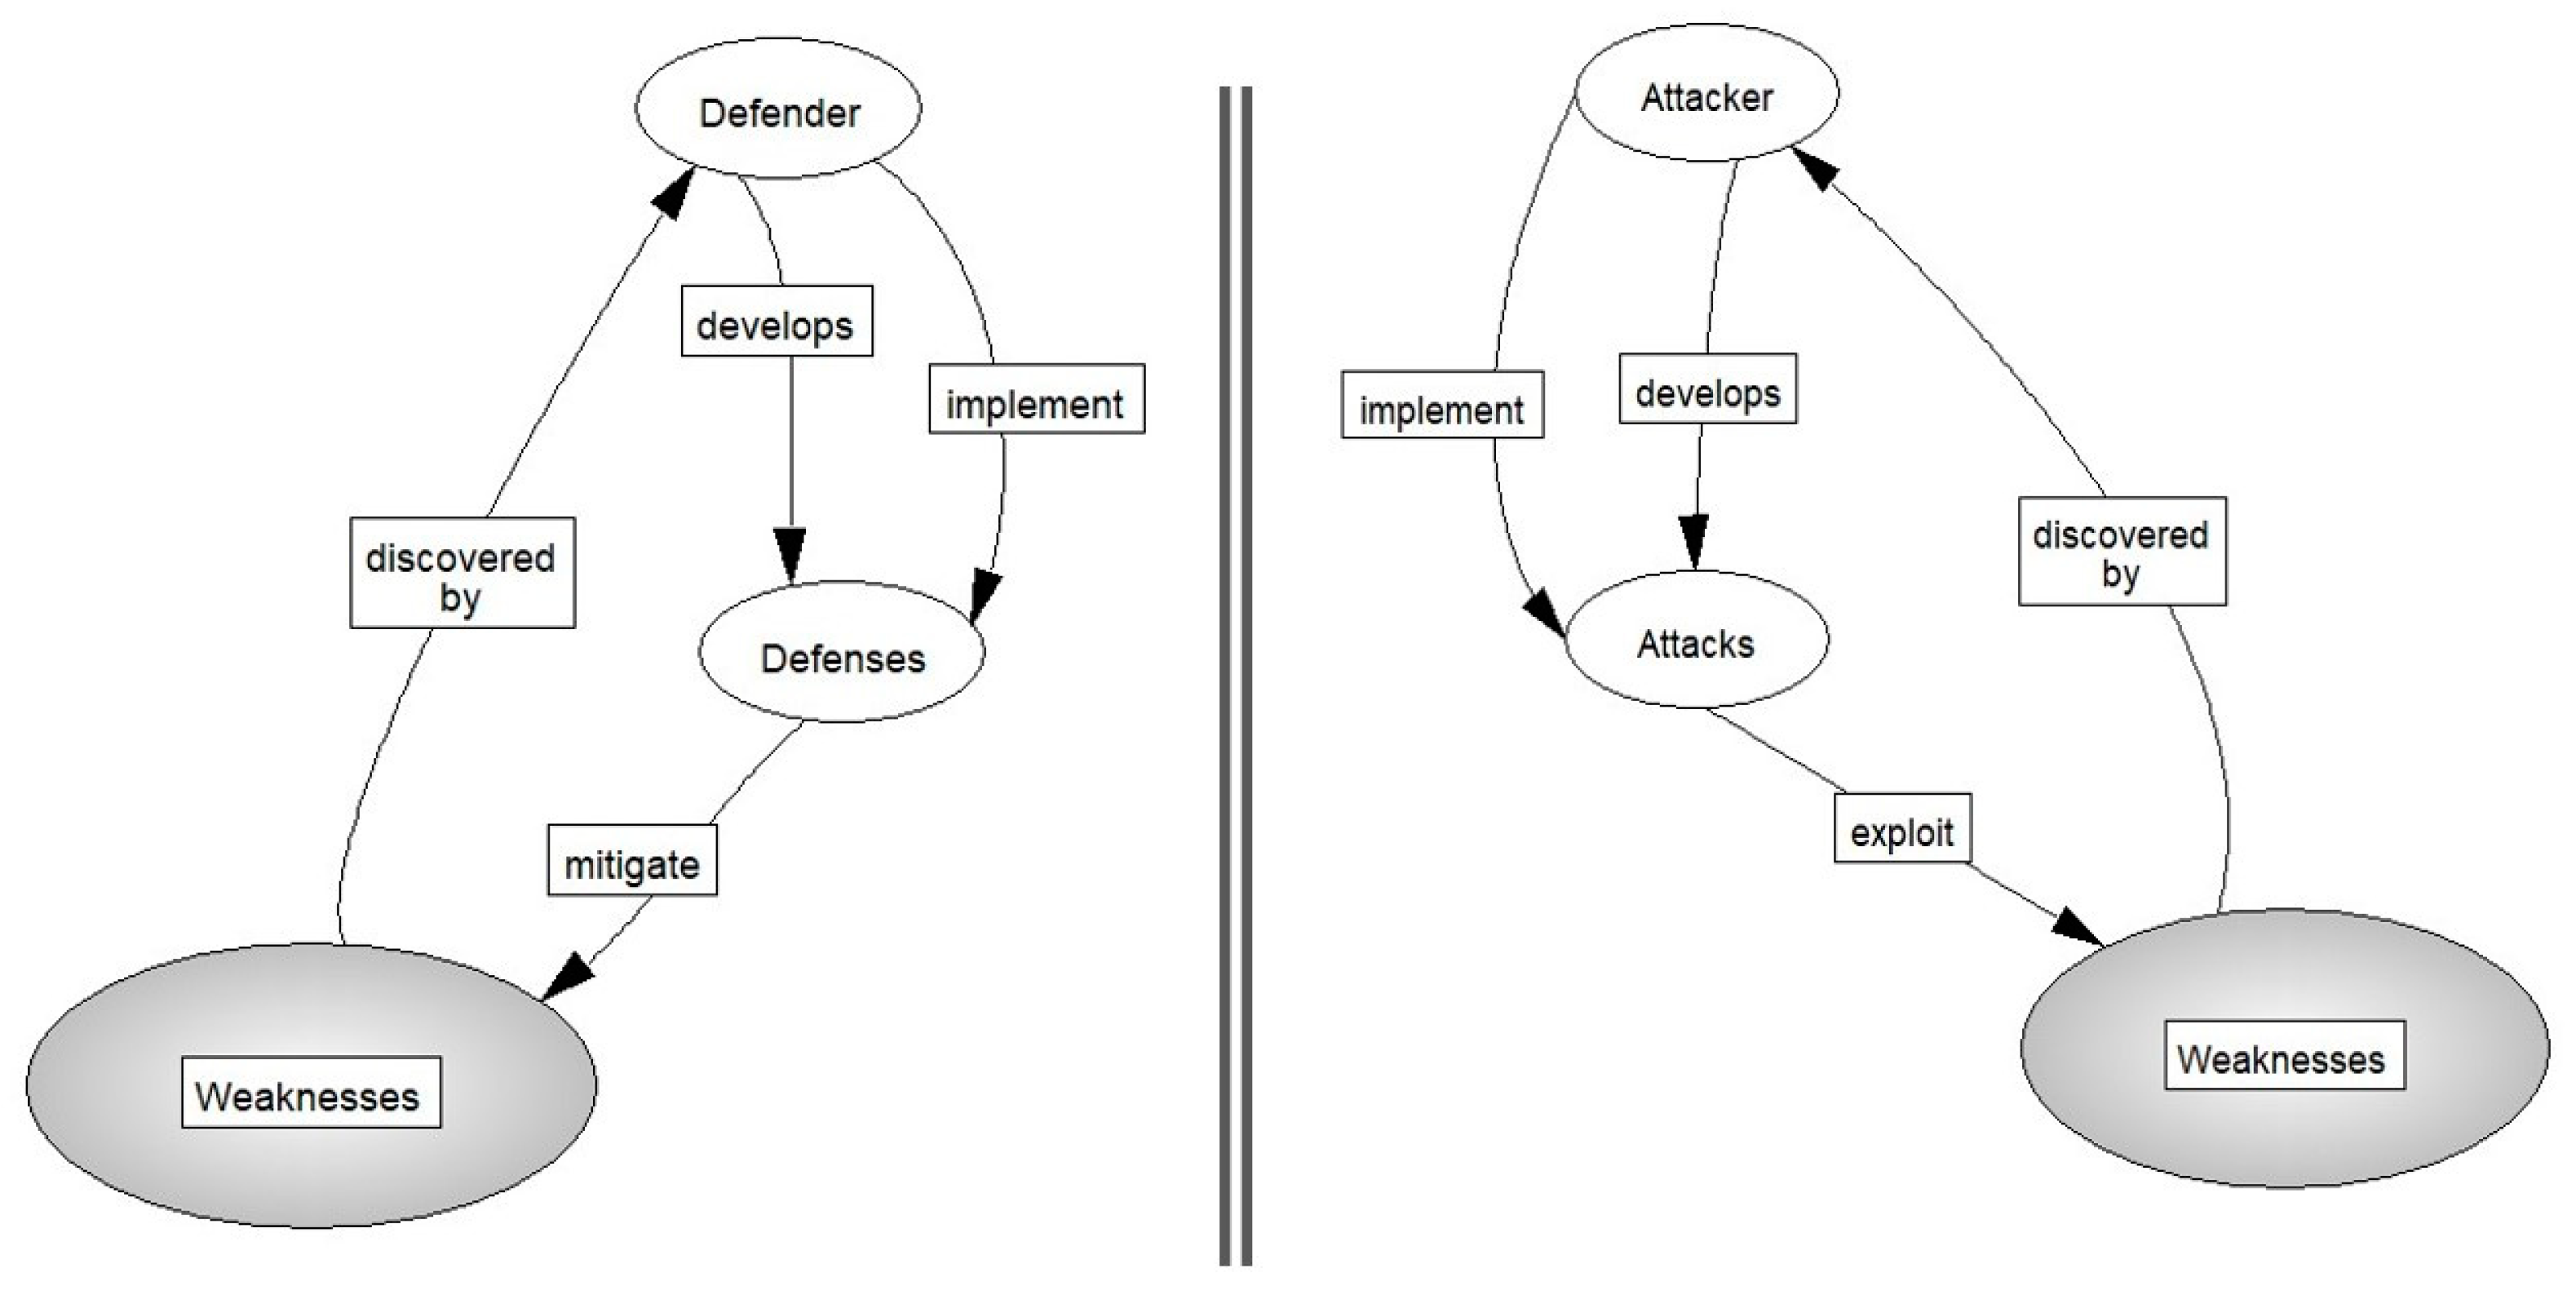
It is a result of these weaknesses that defenses are necessary, so a smart defender will invest their resources in the mitigation of weakness, as shown on the left half of Figure 2. Defenders consume their resources—people, money, and time—in understanding their own weaknesses and the defenses available to them. Sometimes defenders will invest or consume resources in the development of defenses. Implementing defenses to mitigate weaknesses involves additional resources. Inherent weaknesses are exposed through attacks and are often the result of the exploitation of a vulnerability of the human in the system or a programming failure.
Attacks in cyber warfare, illustrated in the right half of Figure 2, are designed to discover and to exploit weaknesses. An attacker will invest in people, infrastructure, and reputation; consuming resources of money and time to discover weaknesses. In an investment like that of the defender, the attacker will commit resources—people, money, infrastructure, and time—to developing and to implementing attacks that will exploit a weakness. This will allow the attacker access to new resources, which they can then control and use, or otherwise exploit, to increase the available resources (money, infrastructure, etc.).
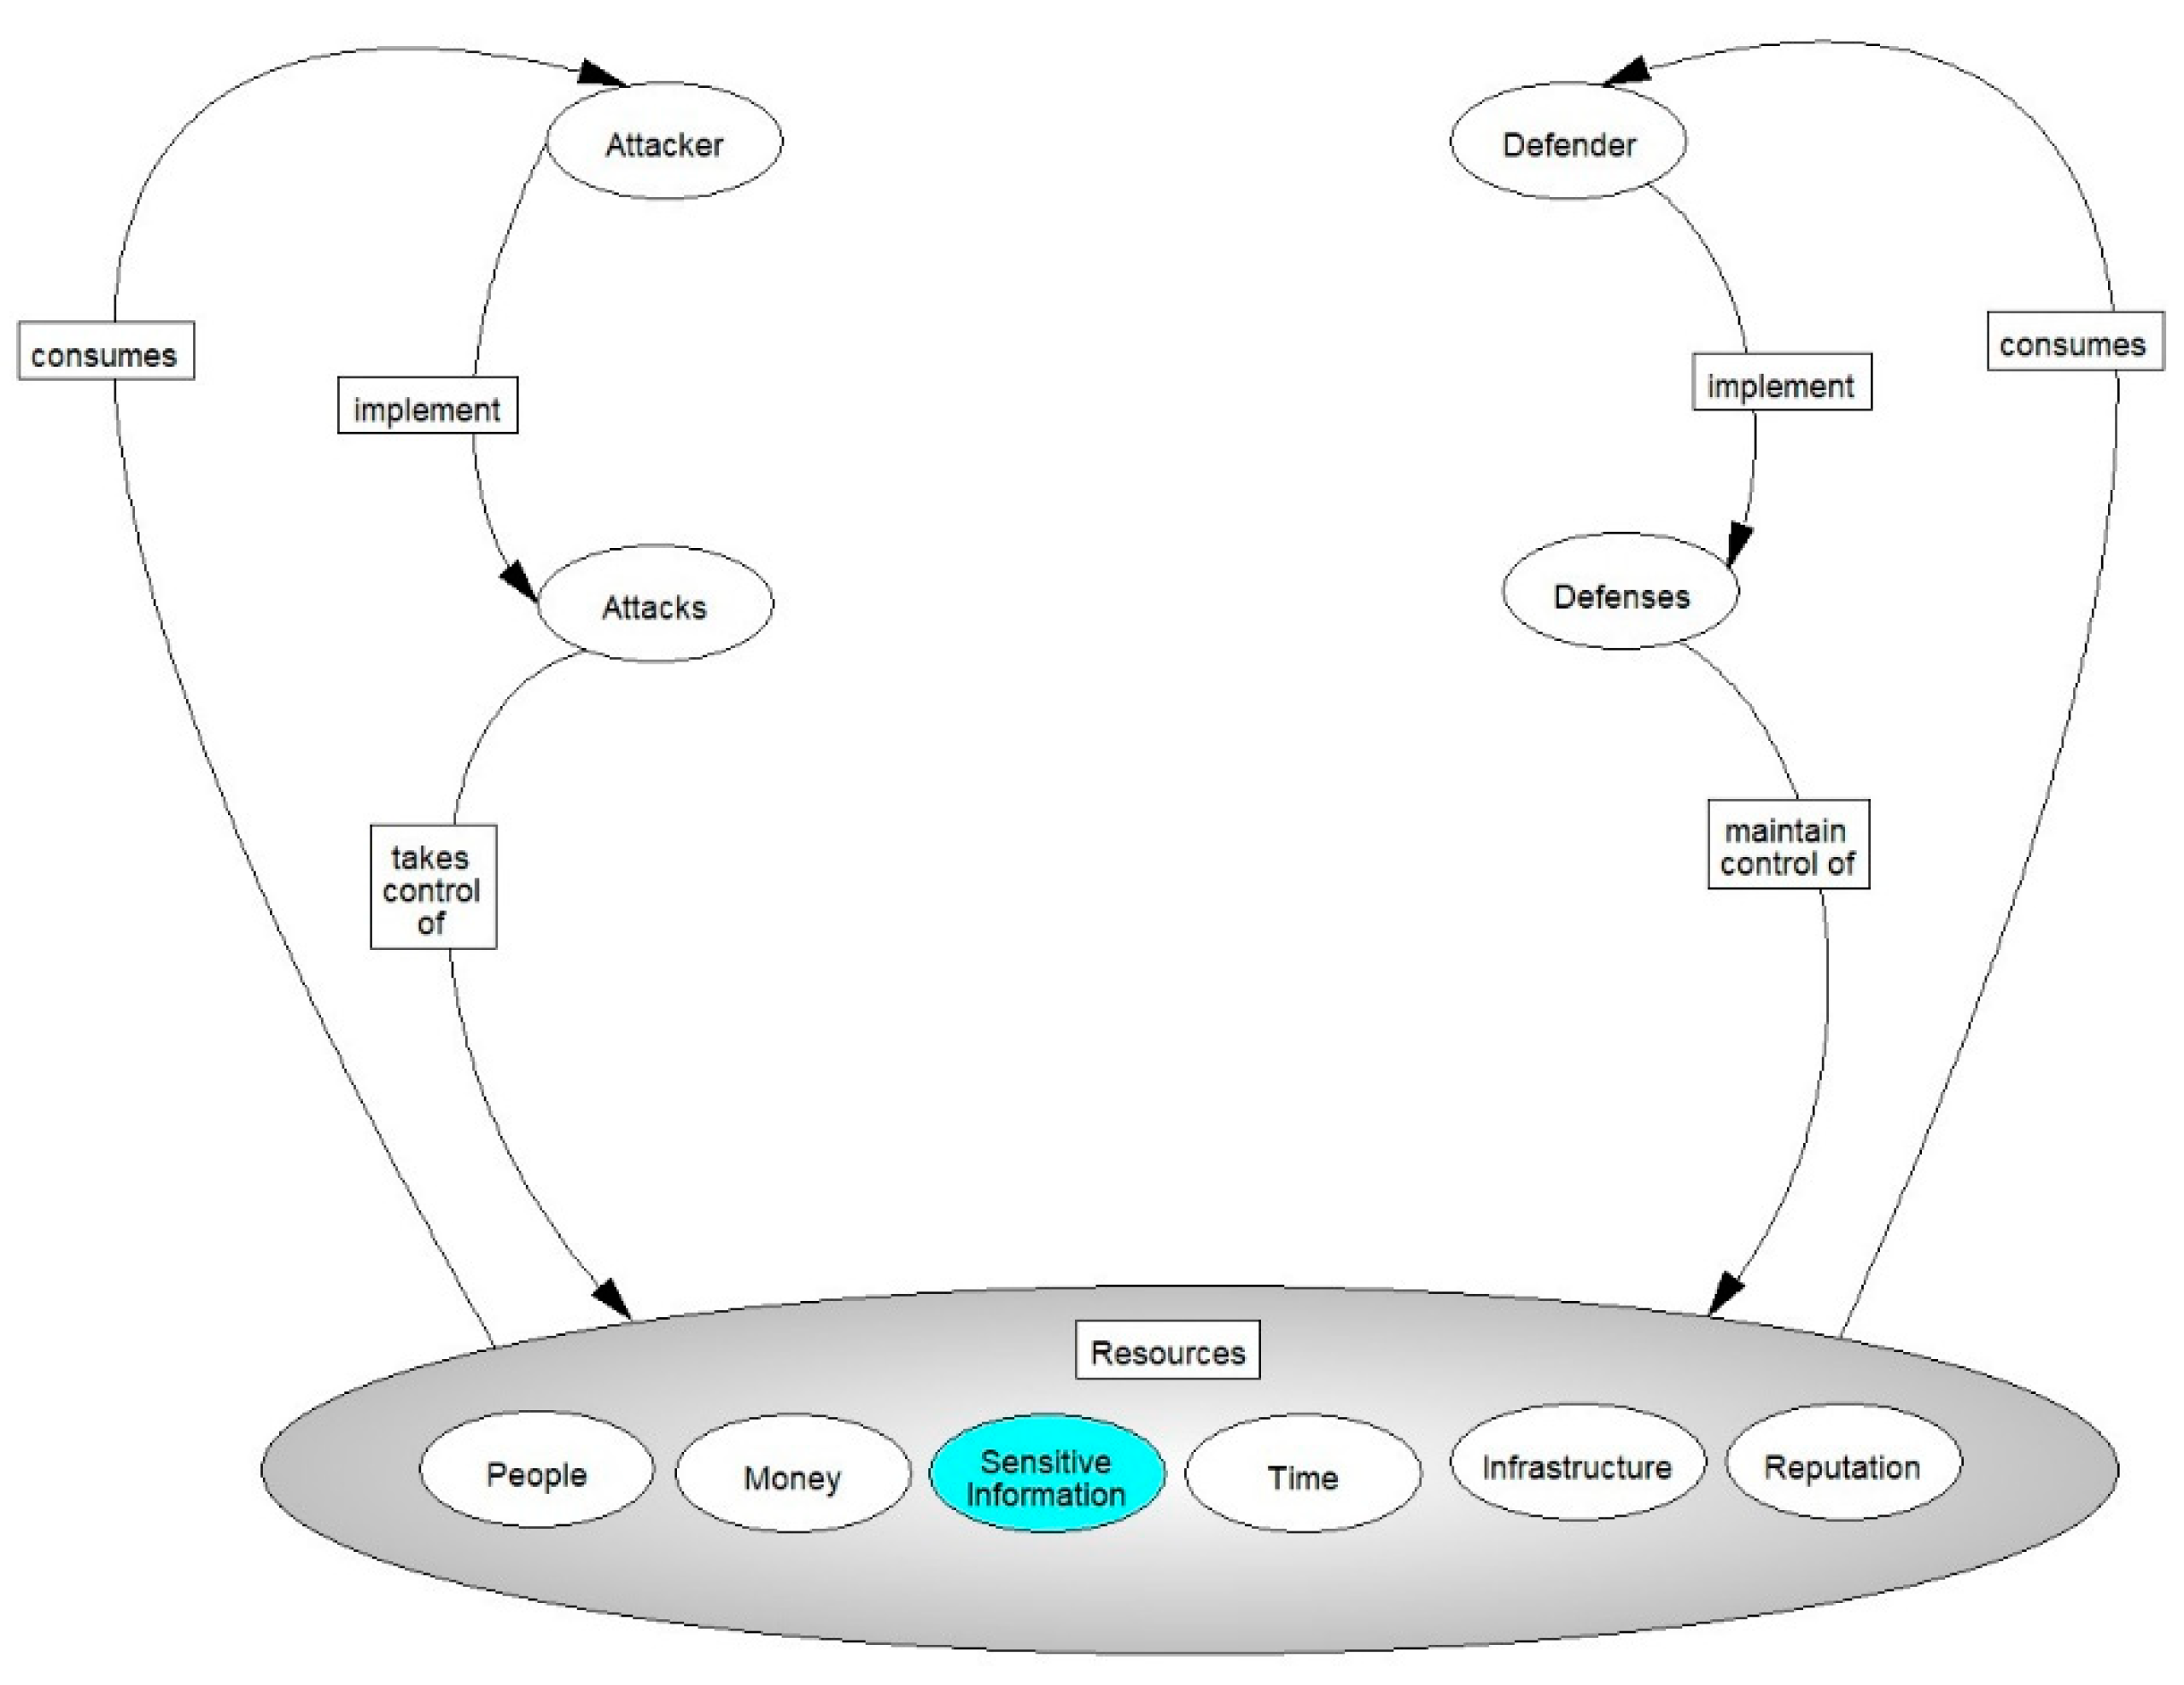
The two sides, attacker and defender, enter an arms race to control resources (Figure 3). The evolution of the attacker will continue, in turn forcing the defender to continue to evolve, invest in resources to anticipate and thwart attacks. When either side reaches a critical point in the depletion of their resources, they will seek to acquire more. Victory in cyberwar is determined by who controls the resources.
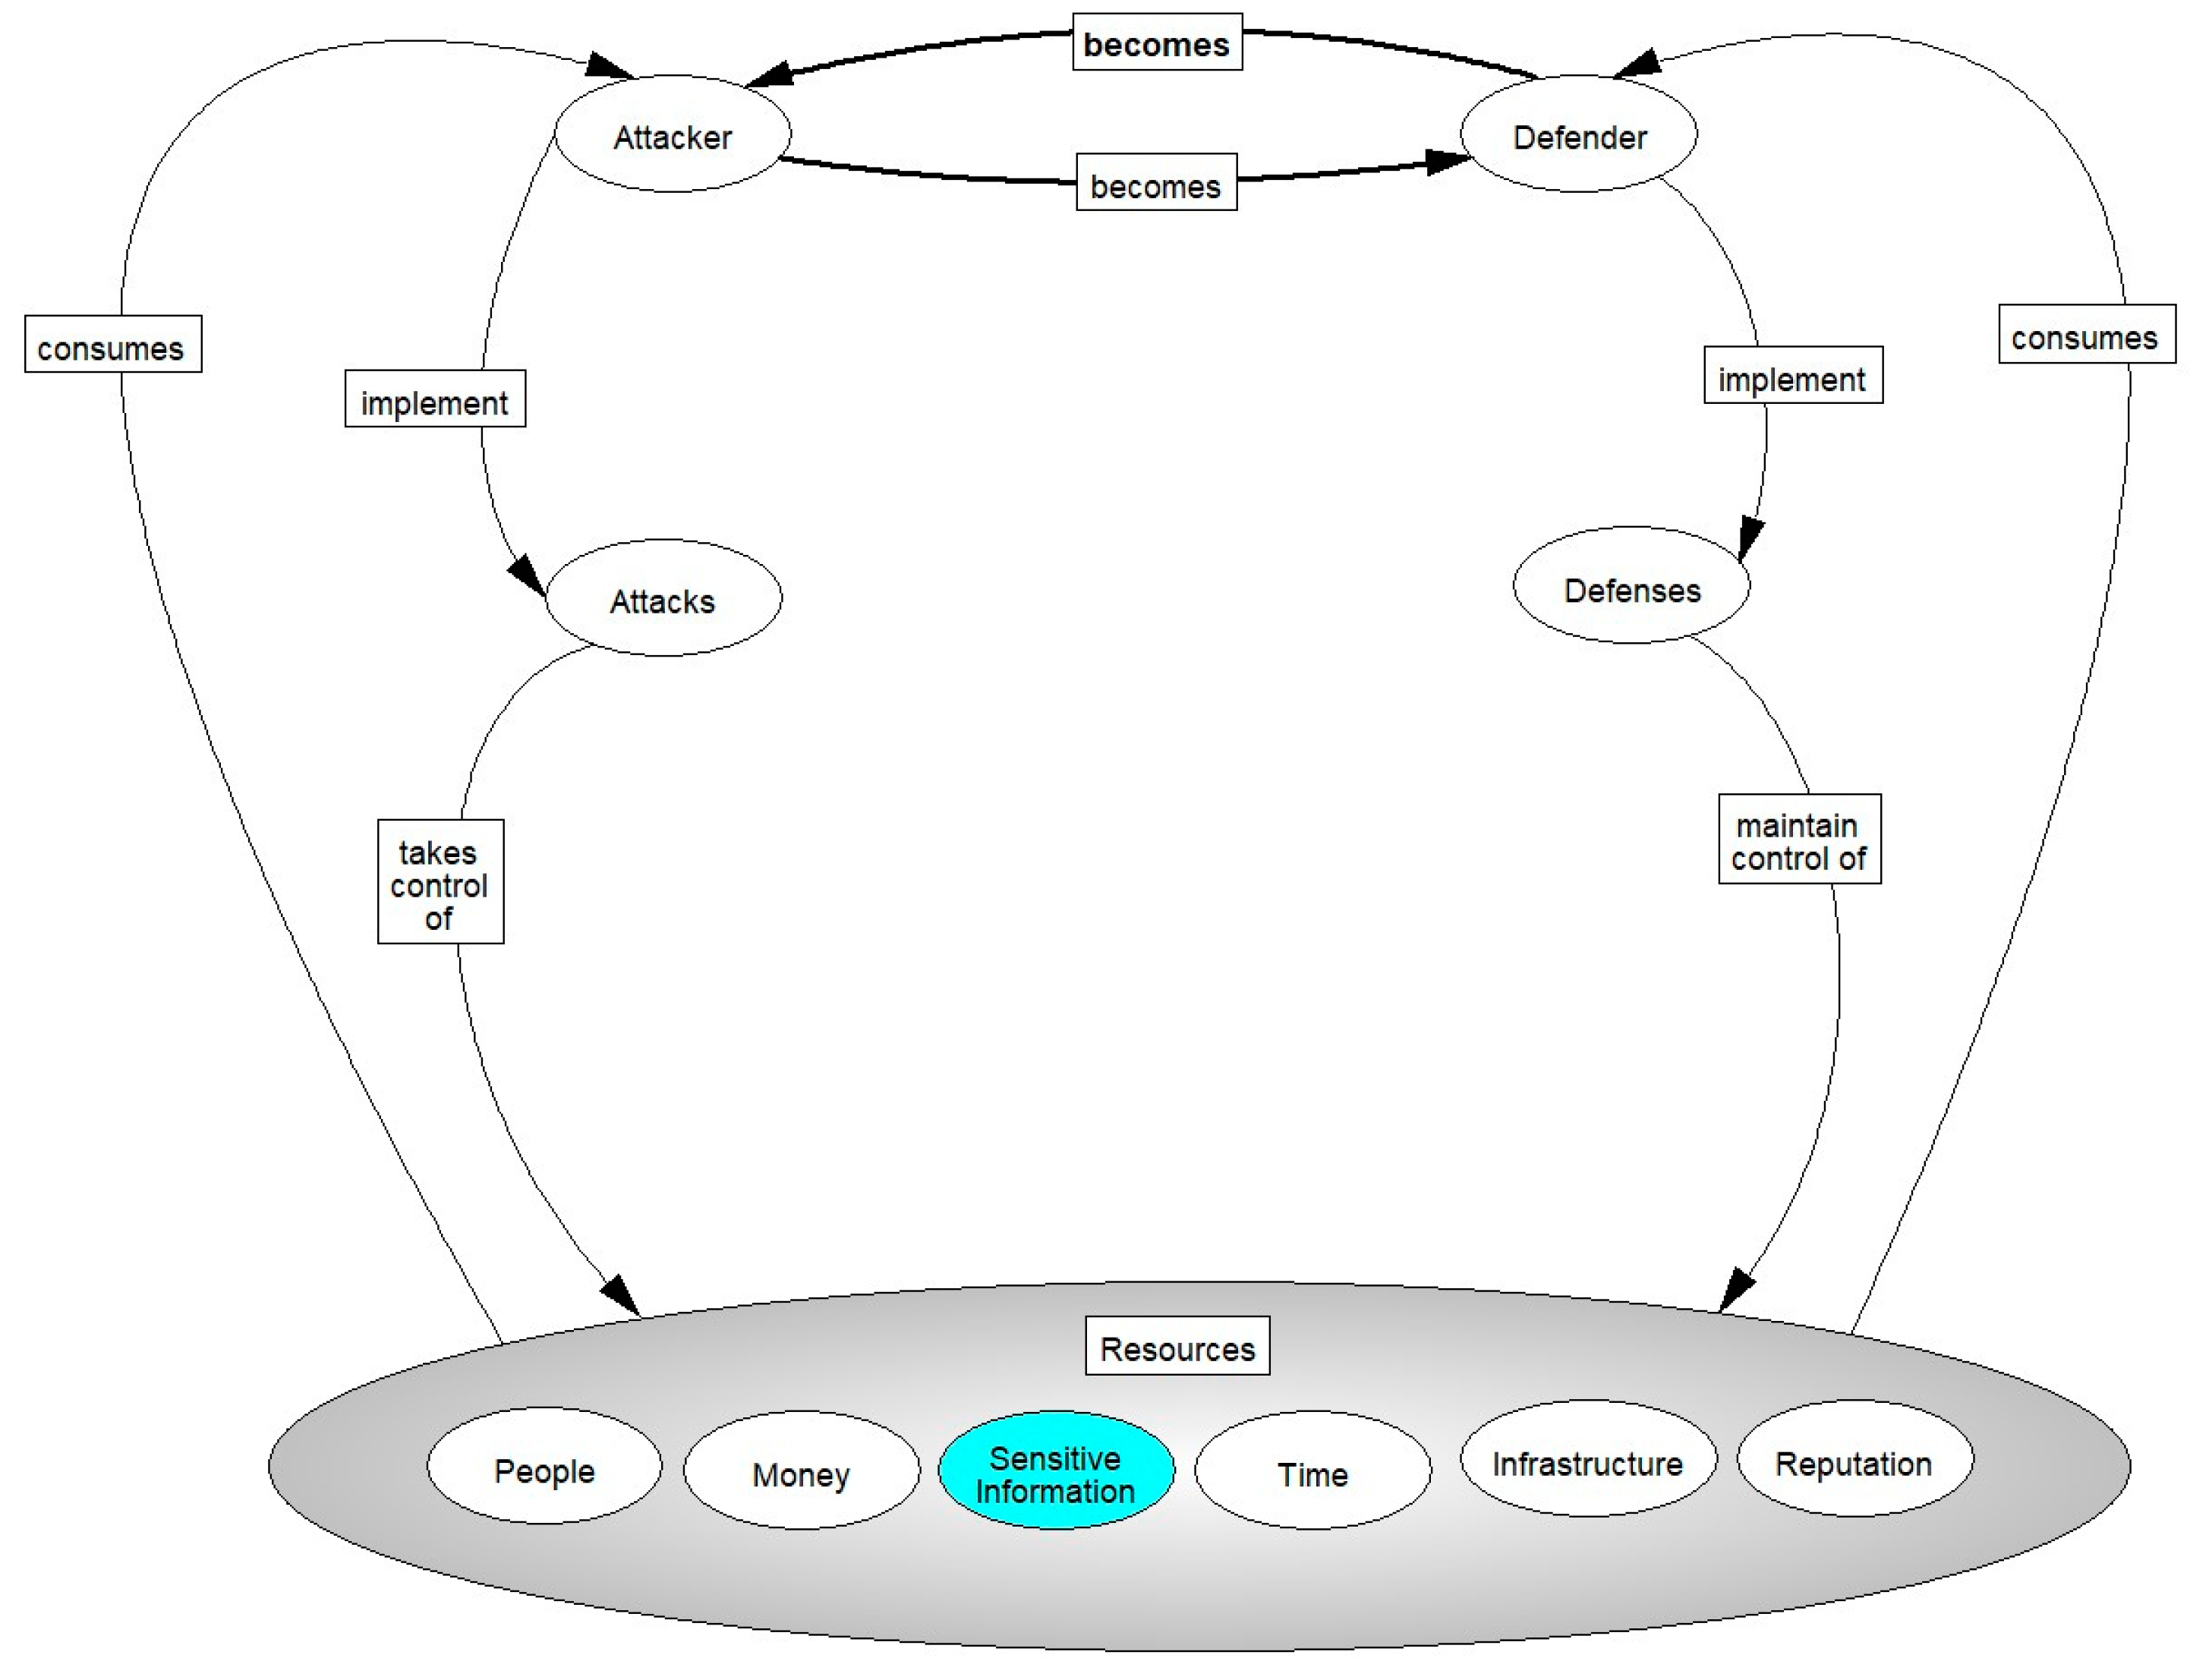
When the defender reaches a critical point in the depletion of their resources, the defender will seek to acquire more. It is at this point that the defender will recognize that the resources of the attacker have weaknesses that can be exploited. When the defender moves to act on this knowledge, the roles are reversed—the defender becomes the attacker, and the attacker becomes the defender (Figure 4).
This role reversal is not readily apparent. Attackers are generally viewed as the “bad guys”—the “black hat hacker”. Defining an attack as “a means to gain control of a resource” necessarily changes that viewpoint. Legal action, as would be taken to recover a “stolen” resource, seeks to gain control of that resource and would therefore be a type of attack in this model. With this definition of attack, it is easier to envision the cyclical nature of the cyberwar.
4.2. Coevolution through Dynamics
4.2.1. Predator–Prey Model
A model of the evolution of cyberspace is captured in the Systemigram (Figure 5), but many details about the surrounding ecosystem have been omitted to introduce it in its entirety. Most of these simplifying omissions do not alter the understanding of the model. One additional detail that is essential to a full understanding of the ecosystem, however, is the rest of the population. There are more classes than just the attackers and defenders—there are also “innocent” bystanders that fall into neither class or that may be “recruited” to become one or the other. Through this recruitment the bystanders become attackers or defenders, wittingly or unwittingly. Traditional predator–prey studies and models tend to focus on the two-species model. This ecosystem does not exactly fit that model as there are three “species” to consider (defender, attacker, and uninterested). The predator–prey model can be extended [25] to give some insight into the dynamics of the ecosystem. Understanding the predator–prey model will illustrate where it can be extended for this ecosystem.
A predator is an organism that eats another organism; the prey is the organism being consumed by the predator. These terms are almost exclusively used to describe animals, but the same concept can be applied to plants when resources are considered, such as nutrients and water. The prey is part of the predator’s environment and is necessary for the health of the predator. The predator will evolve to ensure the prey can be caught—speed, camouflage, stealth, heightened senses, etc. As can be imagined, “arms races” can ensue. Predation is the oldest ecological model and perhaps the most studied. The Italian mathematician Volterra formalized his observations about fish using the same equations Lotka used in his theory of autocatalytic chemical reactions. The model has become known as the Lotka–Volterra model and expresses the relationships of the predator (x) and the prey (y) in these two differential equations:
This model makes a few simplifying assumptions:
- Prey has no food restriction, so that death is either natural or at the hand (or teeth) of the predator;
- The food supply of the predator is solely the prey (only two species);
- The environment does not favor one species over the other;
- The rate of population change is proportional to its size;
- Predators have a limitless appetite.
The use of differential equations allows for the overlapping of the two populations, where the rate of change of the prey (dx/dt) is its growth rate (α) minus the rate of predation (β), and the rate of change of the predator (dy/dt) is its growth rate (δ), which is related to, but not the same as, the rate of predation, minus the death rate (γ). The solutions to these equations are periodic, where a decrease in one population enables an increase in the other until some point at which the tables turn.
It can be easily seen that this model does not apply to the situation in cyberspace. The simplifying assumptions do not translate, and the model does not allow for a reversal of roles where the prey simply becomes a predator, and vice versa. This reversal, as seen in the Cyber Warfare Systemigram (Figure 5), is an integral part of the model. Other models have been used to describe predator–prey relationships that do not account for the essential parts of the digital ecosystem being described, such as competition for prey [26,27], predator harvesting [28], three species predation chains, or coupling [29] where the harvest rate of the prey is considered.
The traditional predator–prey model is a two-species model and, as such, cannot adequately be used to describe the population of cyberspace, which is (minimally) a three-species model. Work has been done to extend the Lotka–Volterra model to more than two species [25]:
where xi represents the ith species and Aij represents the effect that species j has on i.
This extension of the Lotka–Volterra model exhibits stable, periodic, or chaotic behavior, depending on the interaction matrix of the species. Experiments with this model have indicated that agent-based modeling may be superior in the description of higher order populations where each individual, or individual archetype, can be represented explicitly.
Closer to the realm of cyberspace attacks with the notion of infection and transmission, the Lotka–Volterra model extension for the description of infectious disease was first described by Kermack and McKendrick [22]. The Kermack–McKendrick model describes the relationship between susceptibles (S), infectives (I), and the recovered/removed (R), and it was first applied to epidemics and then to endemics. Initially the model included structuring the population of susceptibles based on age, but when the transmission rate is held constant for all ages, a generalized model (SIR) could be described:
The SIR model can be solved for various cases, with or without demographics (birth and death rates) [30]. It has been extended to include the concepts of a carrier (C) and an exposed (E) segment of the population. Additional models have been shown to include immunity, both temporary and inherited. These models are used to describe the spread of infectious disease and the effect of vaccination in populations [31].
The concept of recruitment has been examined in the context of marine life, where the populations are demographically open and the rate of population growth is dependent on both the birth rate and the recruitment rate [32]. The recruitment rate has been experimentally observed to be independent of the spawn or birth rate [33]. This indicates that a new parameter must be introduced to properly describe an increase in a population based on recruitment.
This recruitment parameter is essential to the cyber warfare ecosystem, as uninvolved members of the population will be available for recruitment by both defenders and attackers. The remaining parameter required to adequately describe the cyberspace population is one to represent conversion, where an attacker becomes a defender and vice versa. Conversion is foundational to the understanding of the ecosystem model. Converting prey into predator and vice versa is not a concept that is dealt with in biological population dynamics as it is outside the “normal” realm of ecology.
4.2.2. Zombie Model
The SIR model has been extended to include a conversion of prey into predator through a consideration of zombies [34]. The modified SIR, or SZR model, is composed of three basic classes:
- Susceptibles (S);
- Zombie (Z);
- Removed (R).
In this basic model, the removed individuals are those who have died through attack or natural causes. The parameter for the case of deceased resurrecting into a zombie is ζ; for a normal death, the parameter is δ. Susceptibles become zombies through transmission (parameter β) and zombies can be destroyed (parameter α) by clever susceptibles, which adds them to the removed class. Susceptibles, in the basic model, can only be produced through the birth rate (there is no cure). The birth rate (parameter Π) is held to be constant.
Given these conditions, the SZR model is expressed by the following differential equations:
If the timescale is taken to be short, the birth and death rates can both be ignored (Π = δ = 0). This simplification allows for the determination of the equilibrium points. In Munz’s treatment, it is shown that human–zombie coexistence is impossible, and the disease-free equilibrium is always unstable. If the model is revised to consider latency in the infection—transformation to a zombie takes some time—then an additional class of individual is introduced to the population, the infected. The transformation is captured by the parameter ρ. This creates a different model, the SIZR model, which reflects the case where an infected individual (I) can either die naturally or become a zombie.
The disease-free equilibrium of this model is also unstable, and it is only a matter of time for the population to be overtaken by zombies. The researchers pressed on to discover a model that might introduce some desirable stable equilibrium by introducing quarantine (Q), where infected individuals and zombies are removed from the population (parameters κ and σ, respectively). Quarantined individuals cannot infect others while they remain quarantined. The possibility of escape exists, but escapees would be killed (parameter γ), putting them in the removed class.
The solution of this model is complex, requiring the introduction of a reproductive ratio. The two equilibria can be shown to be stable if the quarantine rates are high enough to ensure that the reproductive rate is less than one. The second equilibrium shows that eradication depends critically on the quarantine of those in the primary infection, as zombies can infect humans faster than humans can kill them.
The final model of interest includes the concept of a cure (parameter ς). This removes the quarantine class as it is no longer needed. An assumption is made that the cured individual returns to the susceptible population and that no immunity is inferred by the cure. The resulting model is as follows:
These models can be applied to the population in the cyberspace domain. Not surprisingly, many of the considerations for the spread of a zombie outbreak transfer to the world of the cyber warrior.
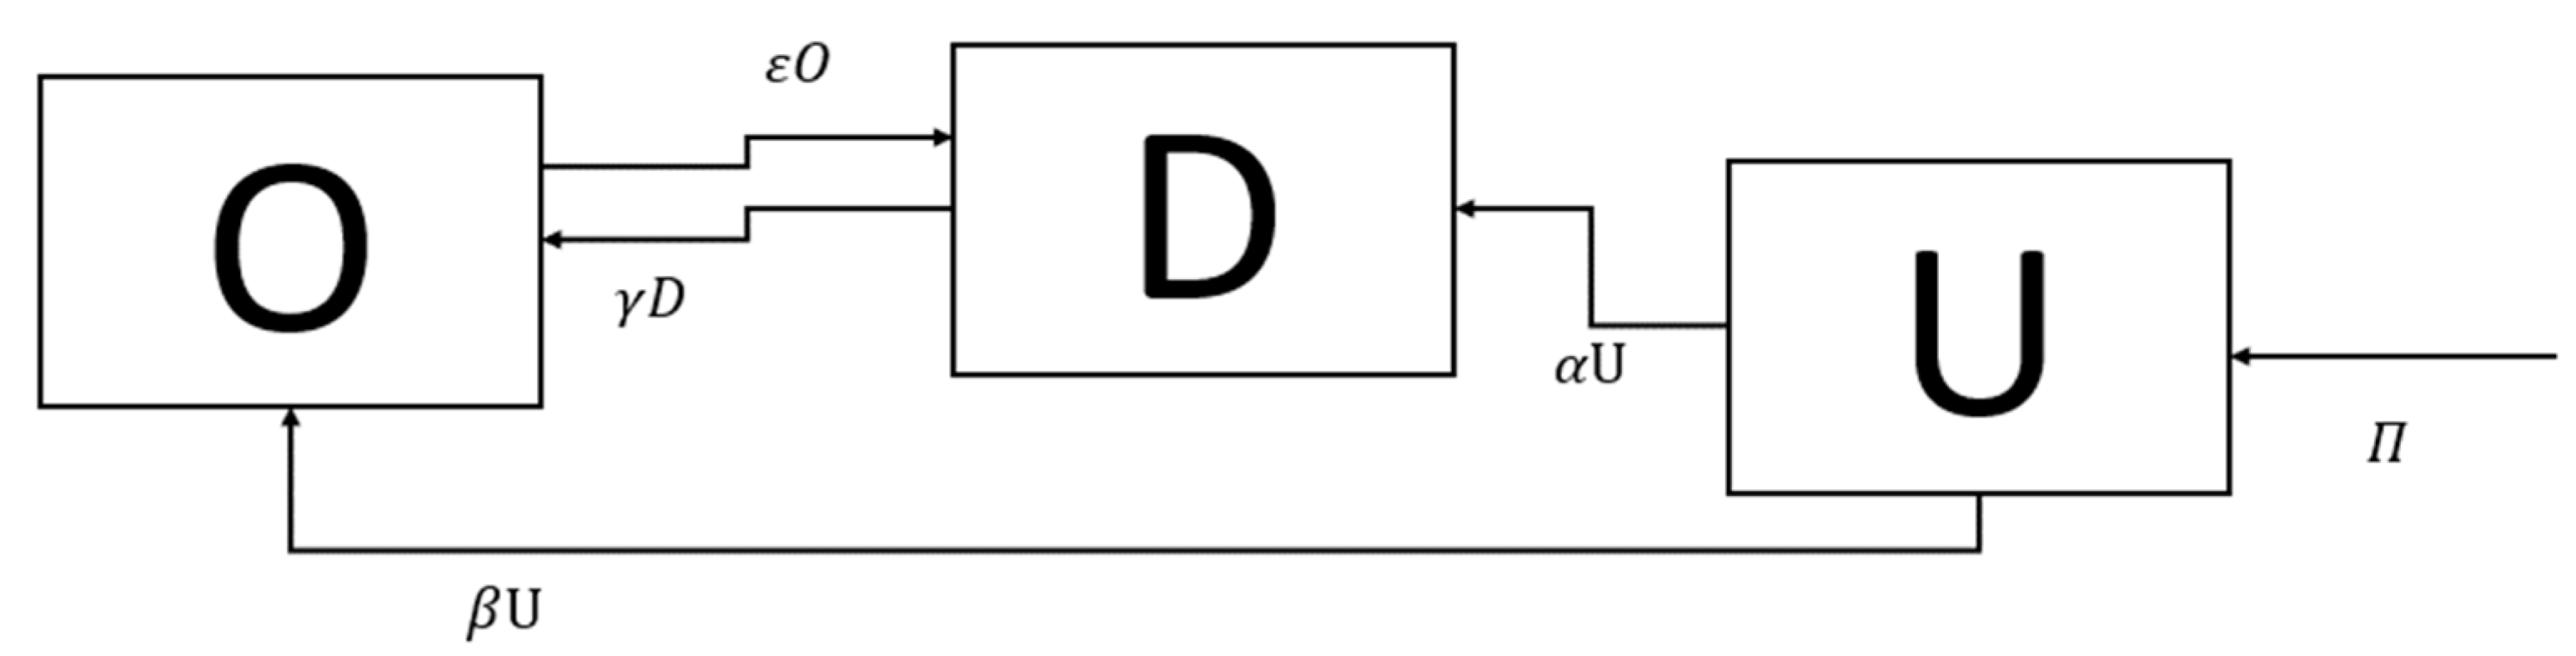
4.2.3. Cyberspace ODU Model
The terms “attacker” and “defender” are overloaded and carry heavy contextual connotations of good and bad. For this reason, the active participants in the cyberspace model will be referred to by the position they are currently occupying—uninterested, offense, or defense. This cyberspace model (Figure 6) is then composed of three basic classes:
- Uninterested (U);
- Defense (D);
- Offense (O).
In the basic model, the uninterested are the class of individuals who are not actively on offense or defense. The total population of cyberspace, N, is taken to be the sum of the three classes of individuals. The birth rate (parameter Π) is held to be constant; for death, parameter δ is independent of the class of individual to whom it is being applied. Offense can be recruited from the uninterested (parameter β) or they can be converted from defenders (parameter γ). Defenders can likewise be recruited from the uninterested (parameter α) or they can be converted attackers (parameter ε). A distinction is made between the conversions between offense to defense and of the recruitment from the uninterested to either role. Each of these population-adjusting actions is given a different rate parameter since they would not be equivalent. It is assumed that neither class of individuals willingly converts to the uninterested.
Given these conditions, the UDO model is expressed by the following differential equations:
The first-order differentials, describing the population change over time, satisfies the condition
The total population in cyberspace is growing, and so it can be shown that over a sufficiently long period (barring population-destroying catastrophic events). A limit will be reached due to resource limitations, but it is suspected that the equation at hand will reach equilibrium long before that limit is reached, so U does not approach infinity. By reducing the period of interest, we can hold the birth and death rates to be equal, , resulting in
Setting the resulting individual equations equal to zero gives the following:
These models highlight the fact that the population of U will be depleted: everyone will become involved in cyberwar. The equilibrium, if one exists, will be between the populations of offense and defense. The illegal nature of cyber-attacks makes it necessary to consider that there is a portion of an attacker (offensive) population (ρ) that would return to the uninterested state forcibly via arrest (the “cure” from the zombie model above). The addition of this parameter for arrest, or incarceration, indicates that unless this rate is extremely high, the population of the uninterested will still be depleted.
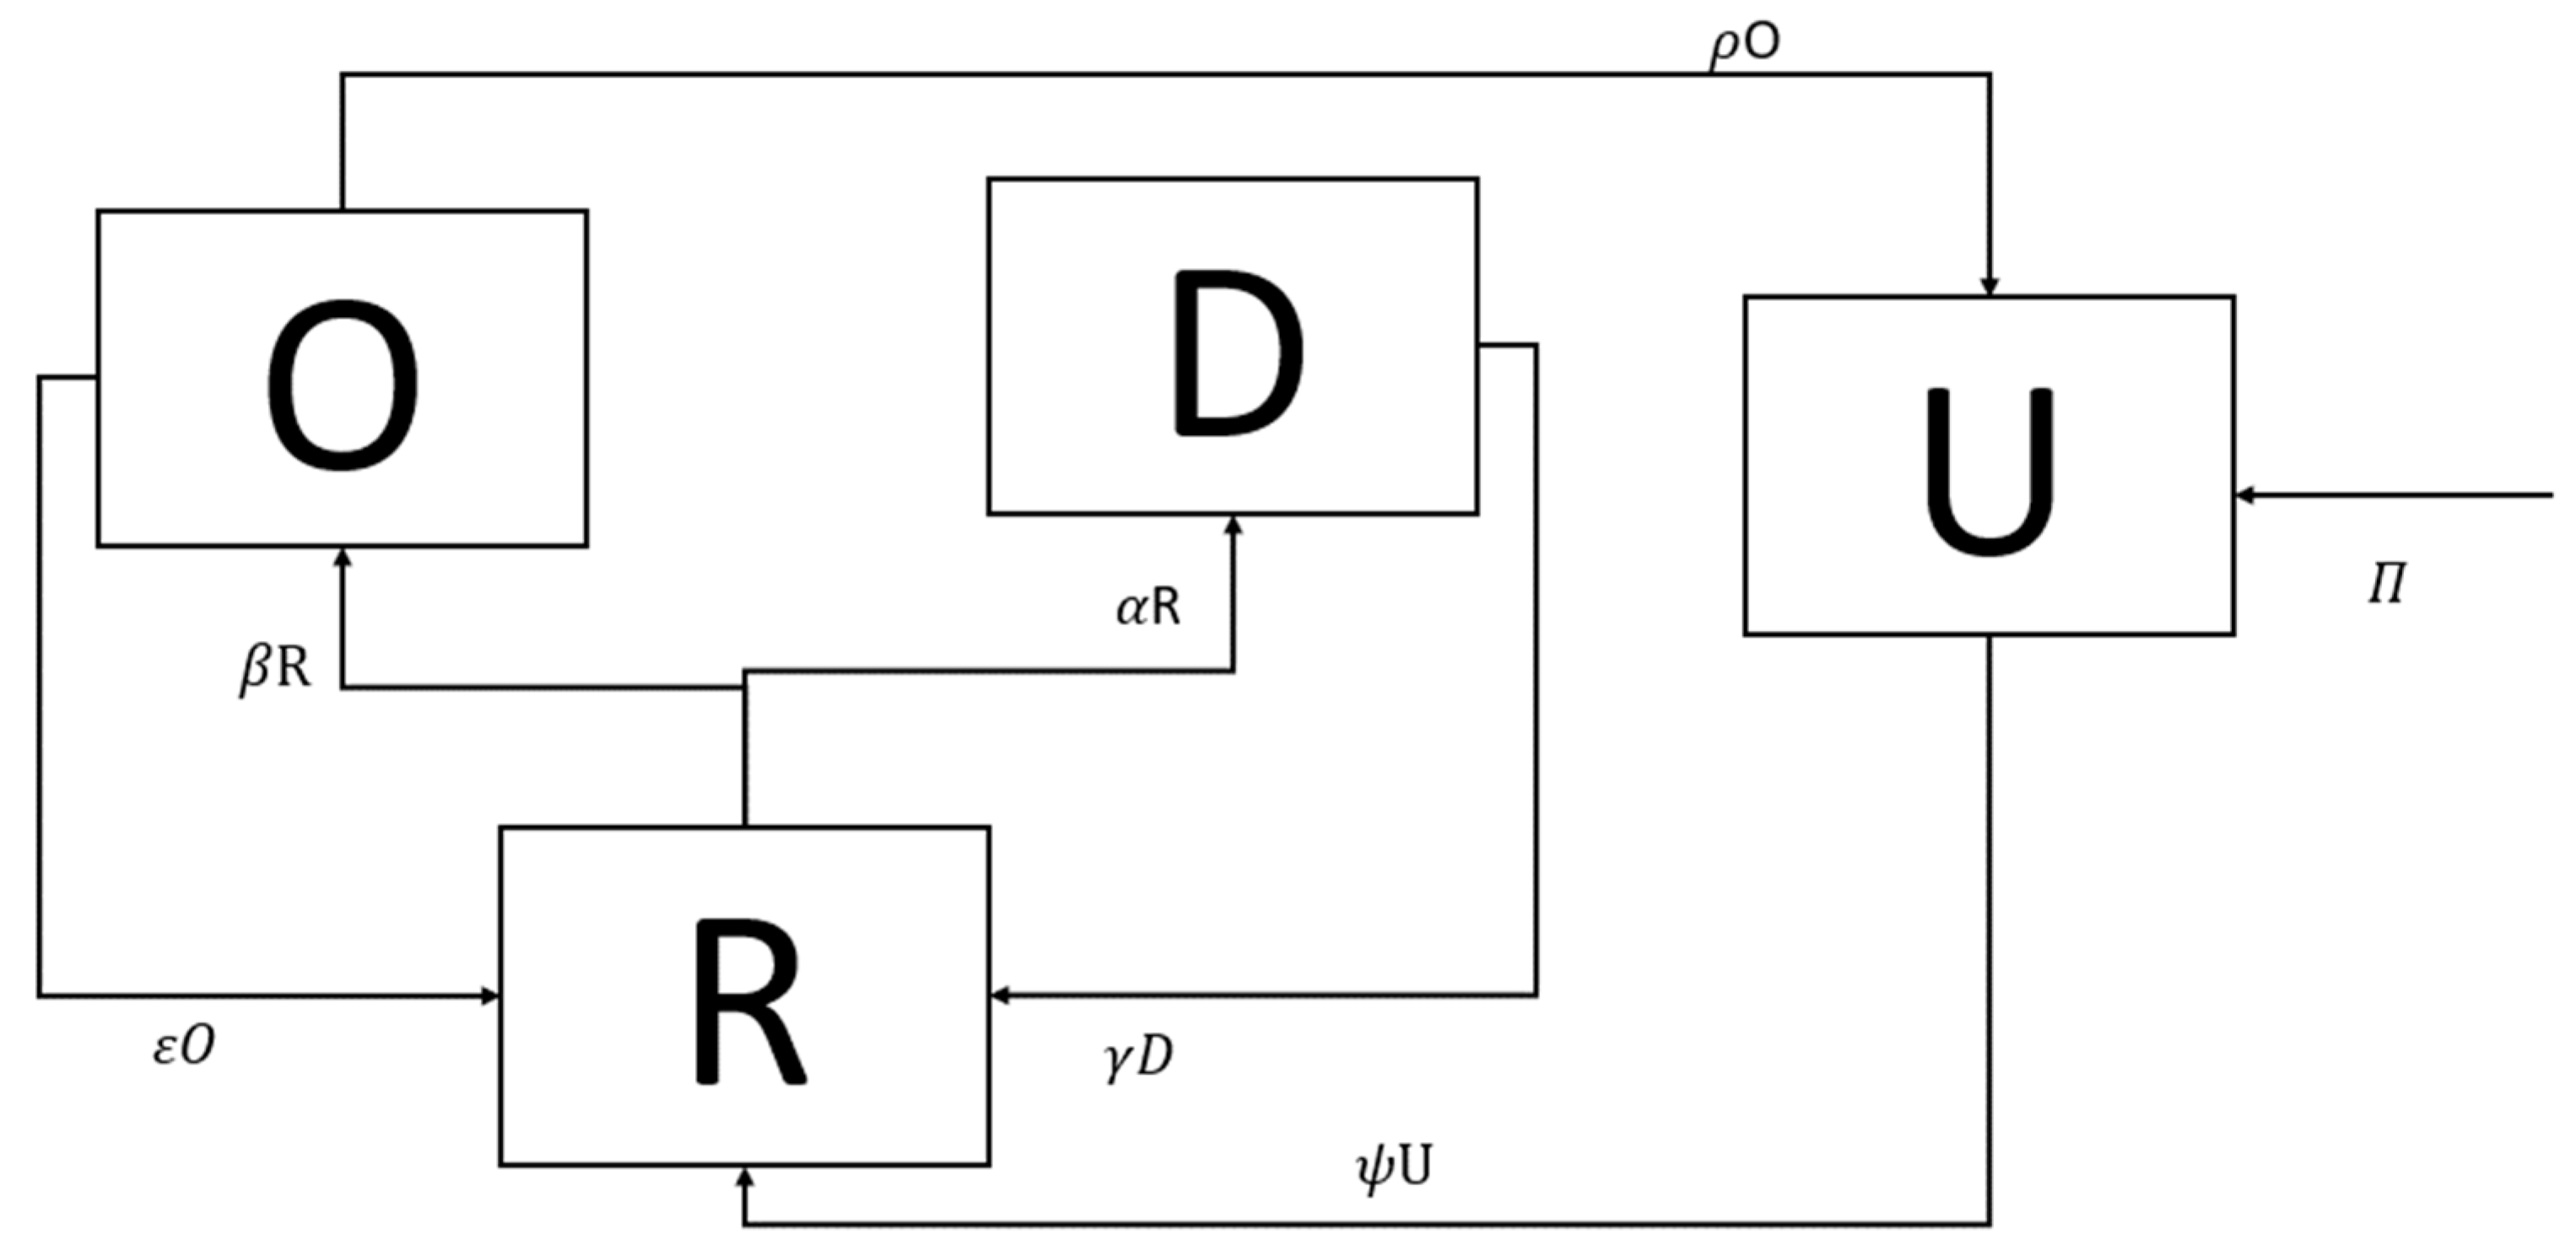
The URDO model shown in Figure 7 has two possible outcomes for the recruited where Munz’s zombie model only has the single outcome of becoming a zombie. Dual outcomes significantly complicate the determination of the equilibria of the model. A simplification is introduced here so that the rate of recruitment (passing from R to either O or D) is the same (α = β). This model assumes that the individual decides at the point of conversion to change their class and does not change their mind during the recruitment time interval. In this case, the rates determining the increase of recruits (γ and ε) become the critical factors for equilibrium.
The equations become
where
Retaining the term ψ, the Jacobian [U, R, D, O] for this model is
The total population, N, is simply the sum of all classes of individuals. The first equilibrium then is at [N, 0, 0, 0], the point where all individuals are uninterested.
The eigenvalues are λ = 0, −β, −γ, and −ρ. Since all the eigenvectors are non-positive, the equilibrium where all individuals are uninterested is stable. All other equilibriums possible with this model are unstable.
This model does not consider delays that would occur for recruitment, retooling, and rehabilitation, as would be expected with conversions between various populations. The conversion of an attacker to a defender (and vice versa) in reality is not instantaneous and requires a period of retooling. This “learning” period is also required for the recruitment of the previously uninterested, and in this fashion, resembles the latency of Munz’s SIZR model. These additional factors are considered in the agent-based representation of the model.
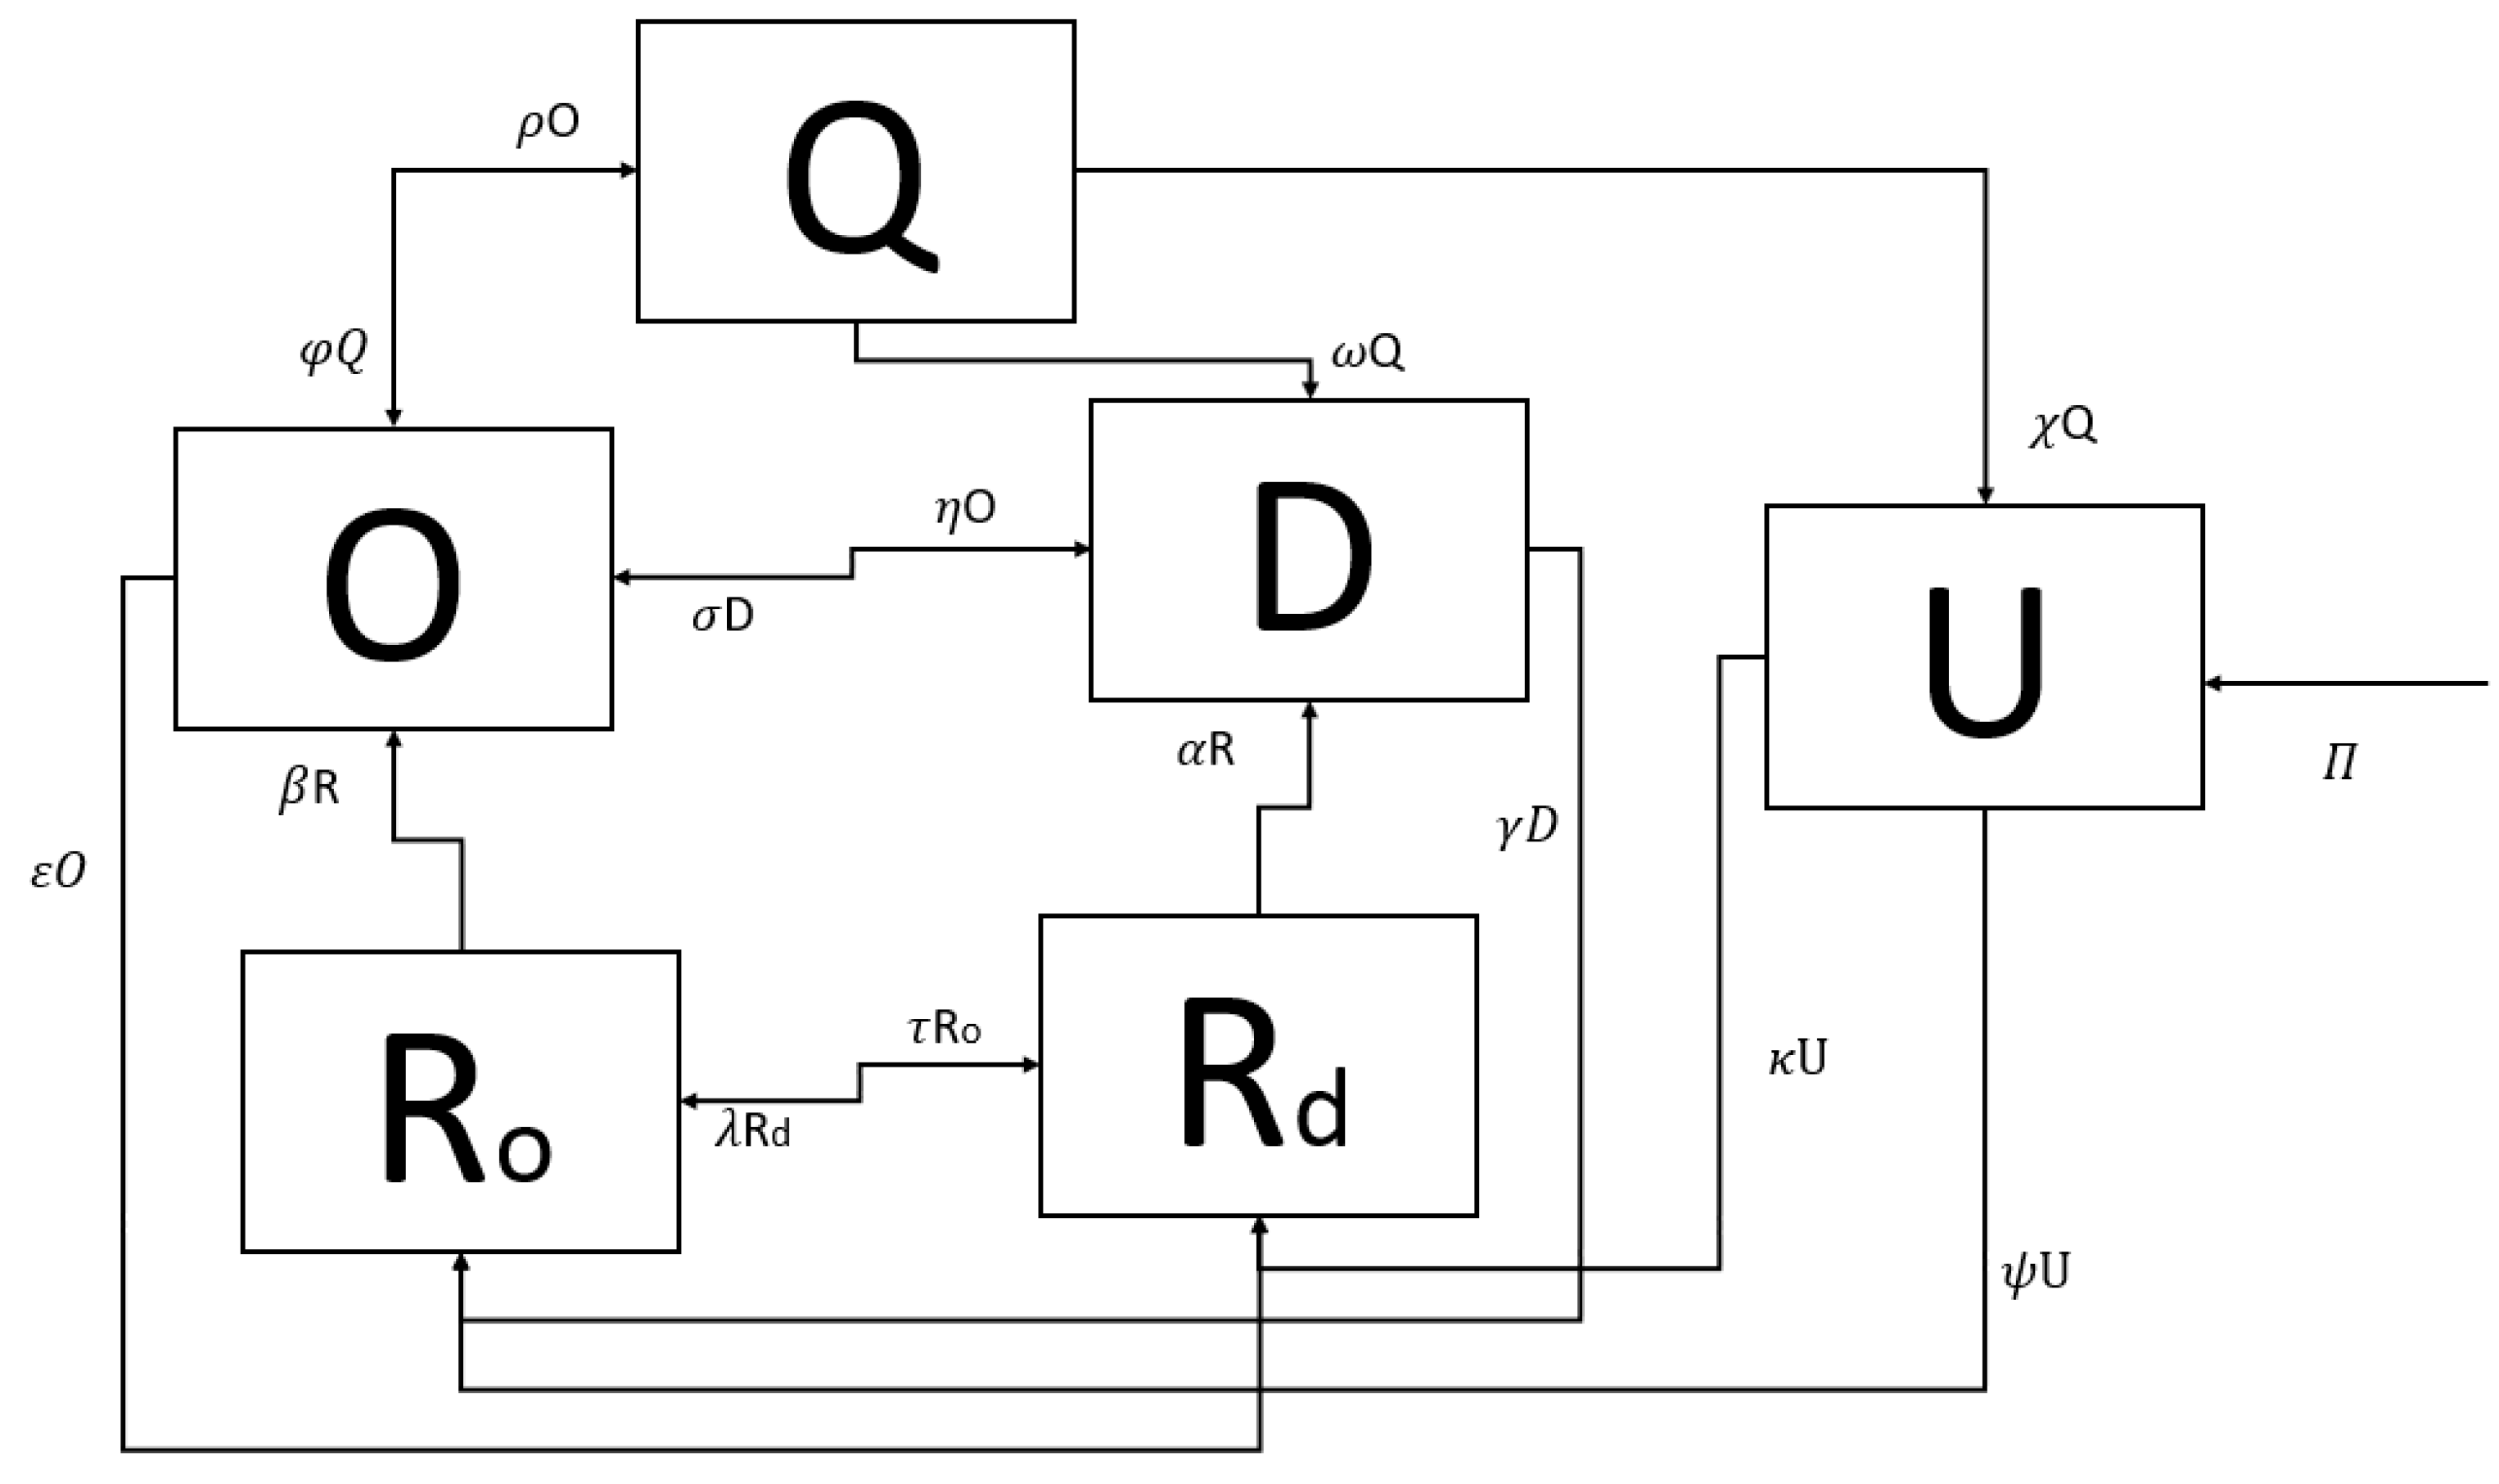
4.2.4. Cyberspace QURDO Model
The basic URDO model was extended to include quarantine (Q) and to separate all the rates of conversion, eliminating the simplifying assumptions made in the URDO model. To represent the perceived time delays that happen because of recruitment and quarantine (arrest), the QURDO model (Figure 8) was constructed. As in previous models, birth (Π) and death (δ) rates are held to be constant and omitted from the equations.
In this model, an individual in an offensive role (O) can be arrested and converted to a quarantined, or incarcerated, role (Q). The rate for this conversion is given as ρO. Quarantined individuals (Q) can be converted to uninterested (U), defense (D), or return to offense (O). The rates for these conversions are unequal: χQ represents conversion to uninterested; ωQ represents conversion to defense; and φQ represents a return to offense. A delay is included in the model to represent the length of incarceration. An assumption is made in the model that only those in an offensive role will be subject to incarceration (quarantine). The change in the quarantined population over time is then
The uninterested, or uninvolved, (U) can be recruited to either the offensive (Ro) or the defensive (Rd) at the rates of ψU and κU, respectively.
To accommodate for the possibility that a recruit might change their orientation, two additional rates are added: λRd for recruits moving from defense to offense, and τRo for those moving offense to defense. A recruitment time for each type of recruit (Ro or Rd) is included in the model. This parameter is meant to represent the time it would take for an individual to become skilled at either offense or defense. If the skill level of the individual is considered, additional divisions of the population become necessary. An additional parameter set could also be added to reflect unwitting recruitment. Such granulation of the population only serves to complicate the model and does not contribute to the generalities being drawn here. Consideration of the resources that could influence the rates of flow between roles is similarly omitted in this model. The conversion from uninterested to defender (represented by rates κU and αR) occurs at a different rate than that of conversion to attacker (represented by rates ψU and βR).
To allow for the oscillation of an individual between the offense and defense roles, two paths are available. An individual not previously trained in the destination role will require “retooling” and is therefore passed through the recruit role with the rates of γD (defense to offense recruit) and εO (offense to defense recruit). If an individual is previously trained in the destination role, a “retooling” period will not be necessary, and the conversion is captured by the rates ηO (offense to defense) and σD (defense to offense).
4.2.5. NetLogo QURDO Model
The complexity of this QURDO model is such that a mathematical solution is unreachable. An agent-based model was developed that enabled experimentation of the interdependencies of the model parameters. Each of the rates shown in Figure 8 is included as a parameter that can be adjusted by the user through a slider control on the interface. The model variables that can be controlled include:
- Total population;
- Percent population offense;
- Percent population defense;
- Conversion rate of offense to defense;
- Conversion rate of defense to offence;
- Time to recruit offense to defense;
- Time to recruit defense to offense;
- Time to recruit uninterested to defense;
- Time to recruit uninterested to offense;
- Arrest rate;
- Incarceration time;
- Percent incarcerated rehabilitated to defense;
- Percent incarcerated rehabilitated to uninterested.
The percentage of incarcerated rehabilitated to offense is calculated automatically as the remainder of the balance of the incarcerated after the specified rehabilitation has been applied.
Initial runs of the model were done with the (arbitrary) default settings (see Table 1). These initial rates were set as estimates of the anticipated behavior of the actors in cyberspace and reflect the researcher’s assumptions made about cyberspace with respect to recruitment.
The population begins with the ratio of defense to offense set at 50:10. (The population of uninterested is computed as the remainder of the total population.) It is assumed that it takes more time to recruit someone to an offensive role, and that the recruitment rate of uninterested to defensive is the same as that of recruitment to offense. An arrest rate is represented in the model very simply. It is assumed that only people on the offense will be arrested and become quarantined (incarcerated).
ask off-team [ if ( random-float 100 < arrest-rate ) [ become-qua ] ]
A distinction is made between the defense recruits and the offense recruits to insert a delay for “retooling”—the learning required to become a member of the offense or defense—and additionally allow for different rates of successful conversion. (There is no provision in the model for failure to convert once recruited.) Recruits are developed based on the recruitment rates uni-to-offense-rate and uni-to-defense-rate:
ask uni-team [ ifelse (random-float 100 < uni-to-offense-rate ) [ become-rec-O ] [ if ( random-float 100 < uni-to-defense-rate ) [ become-rec-D ] ] ]
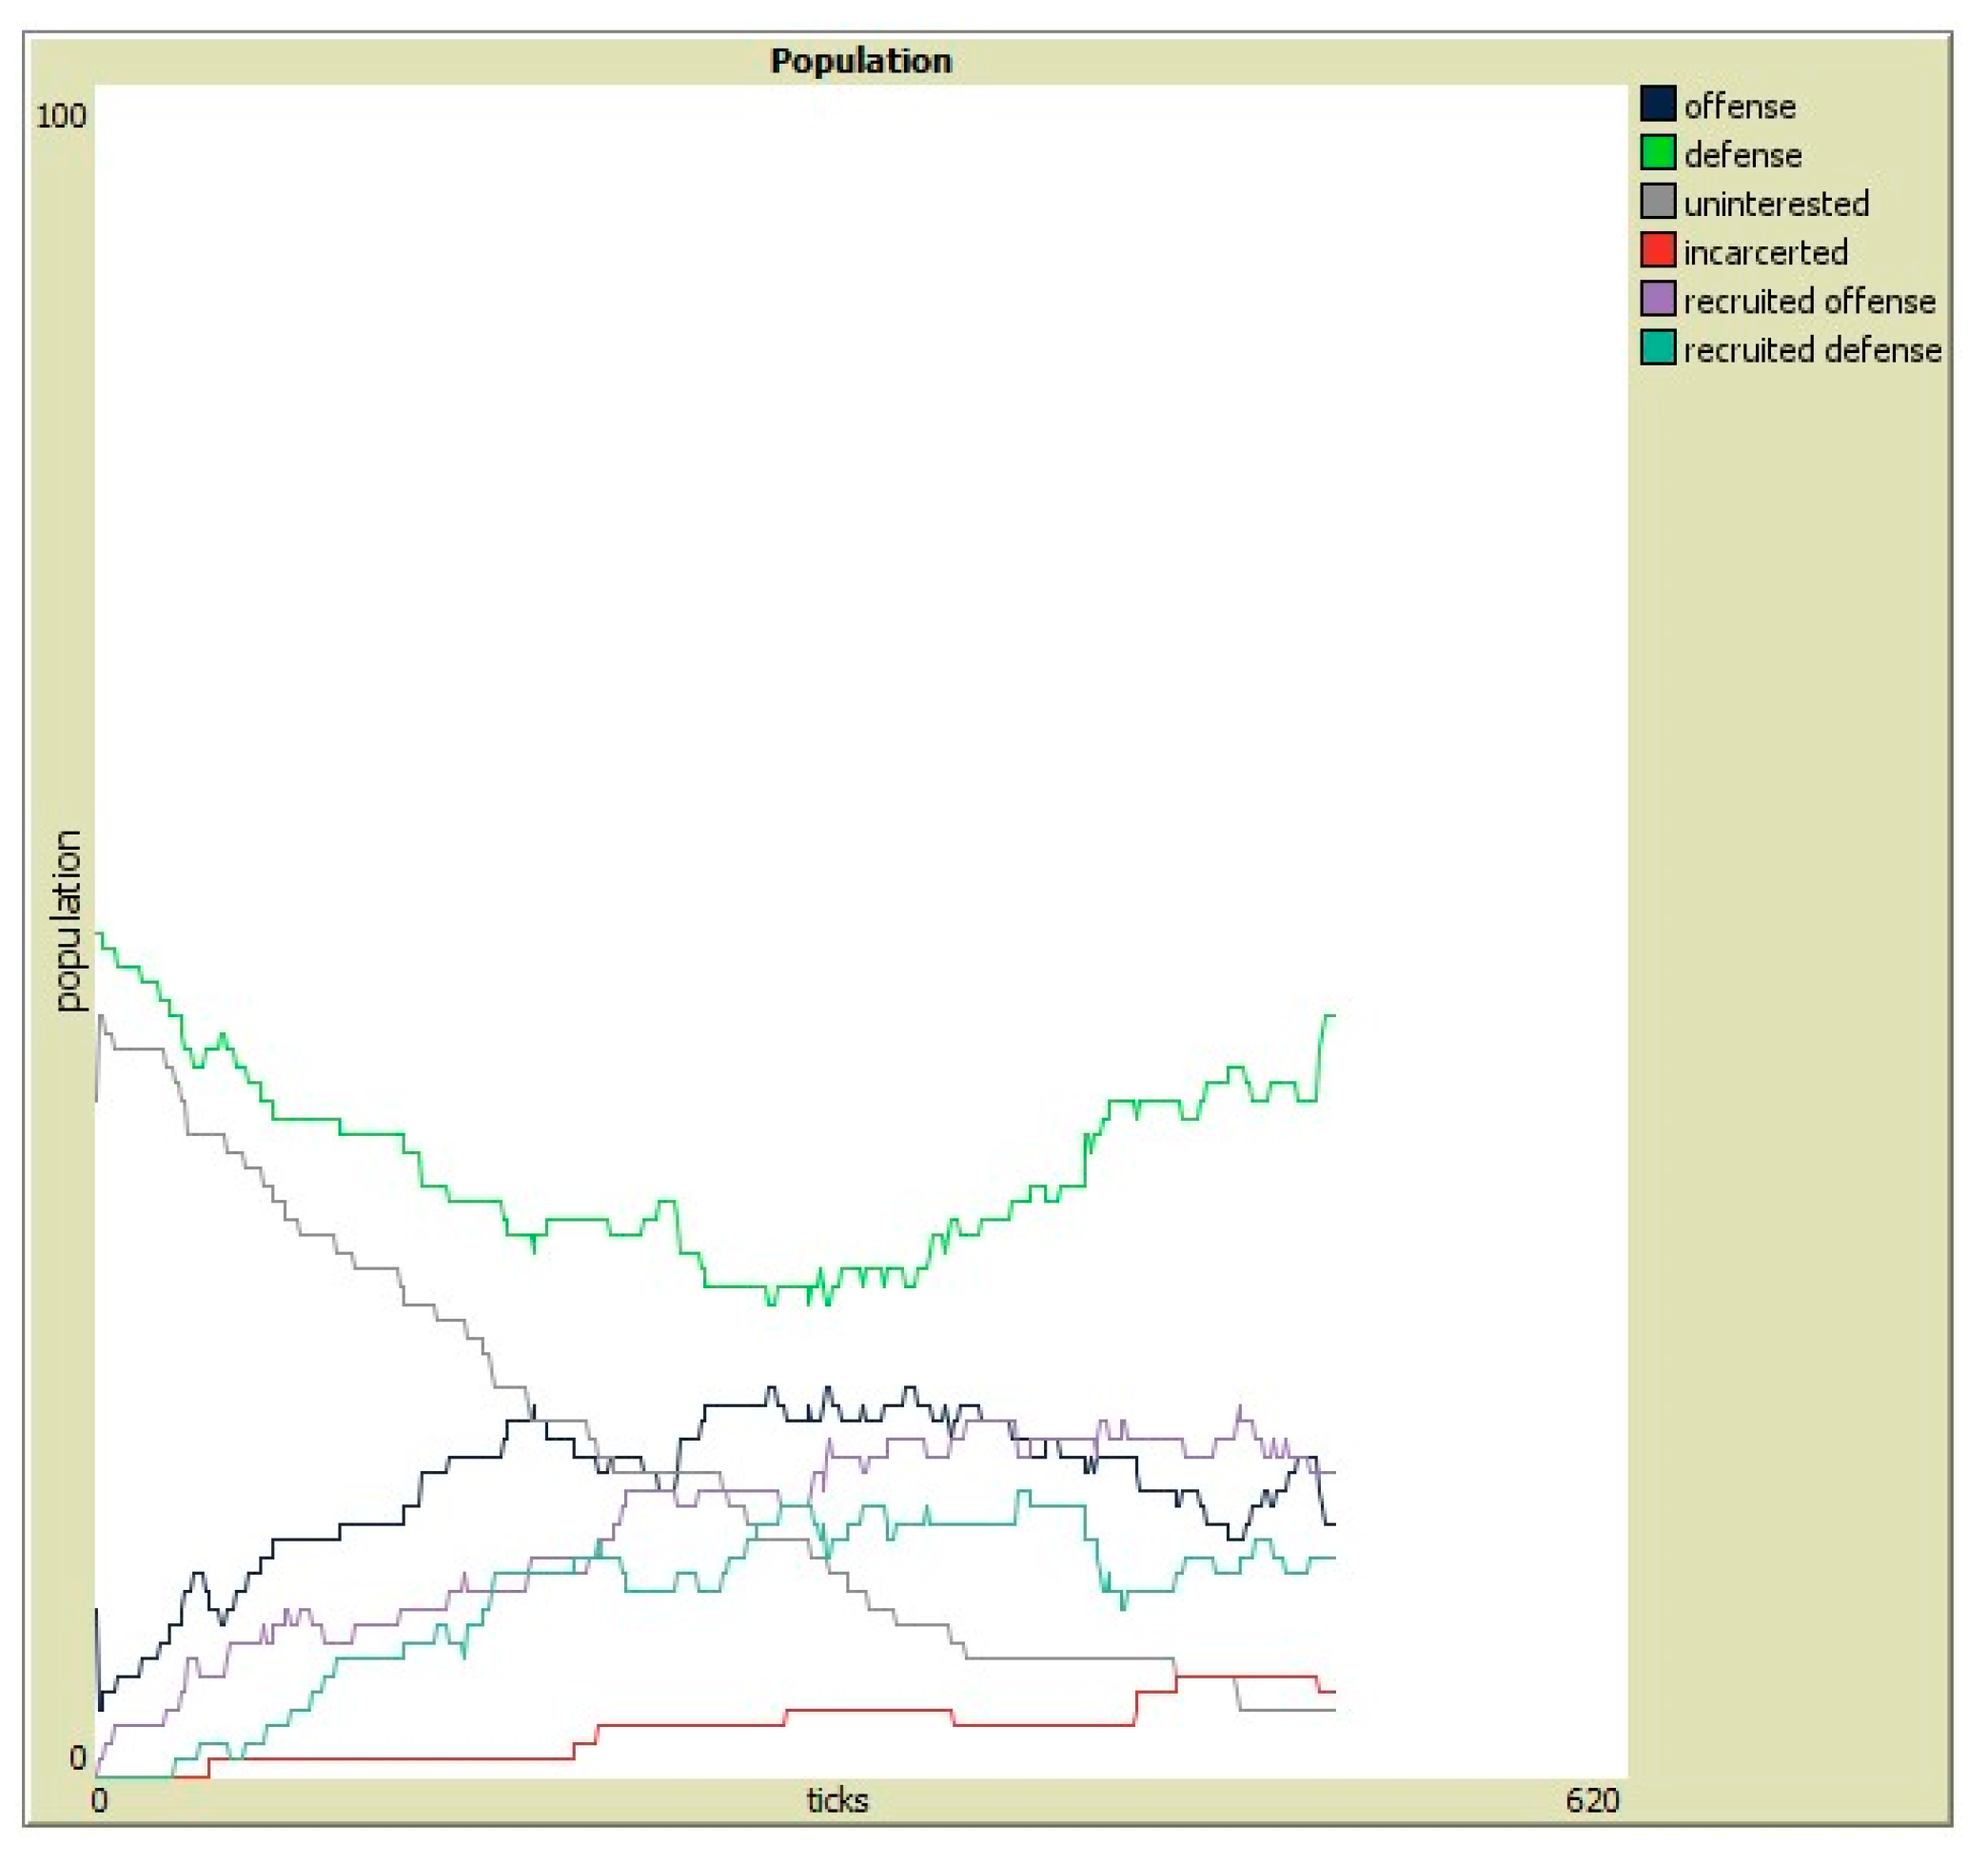
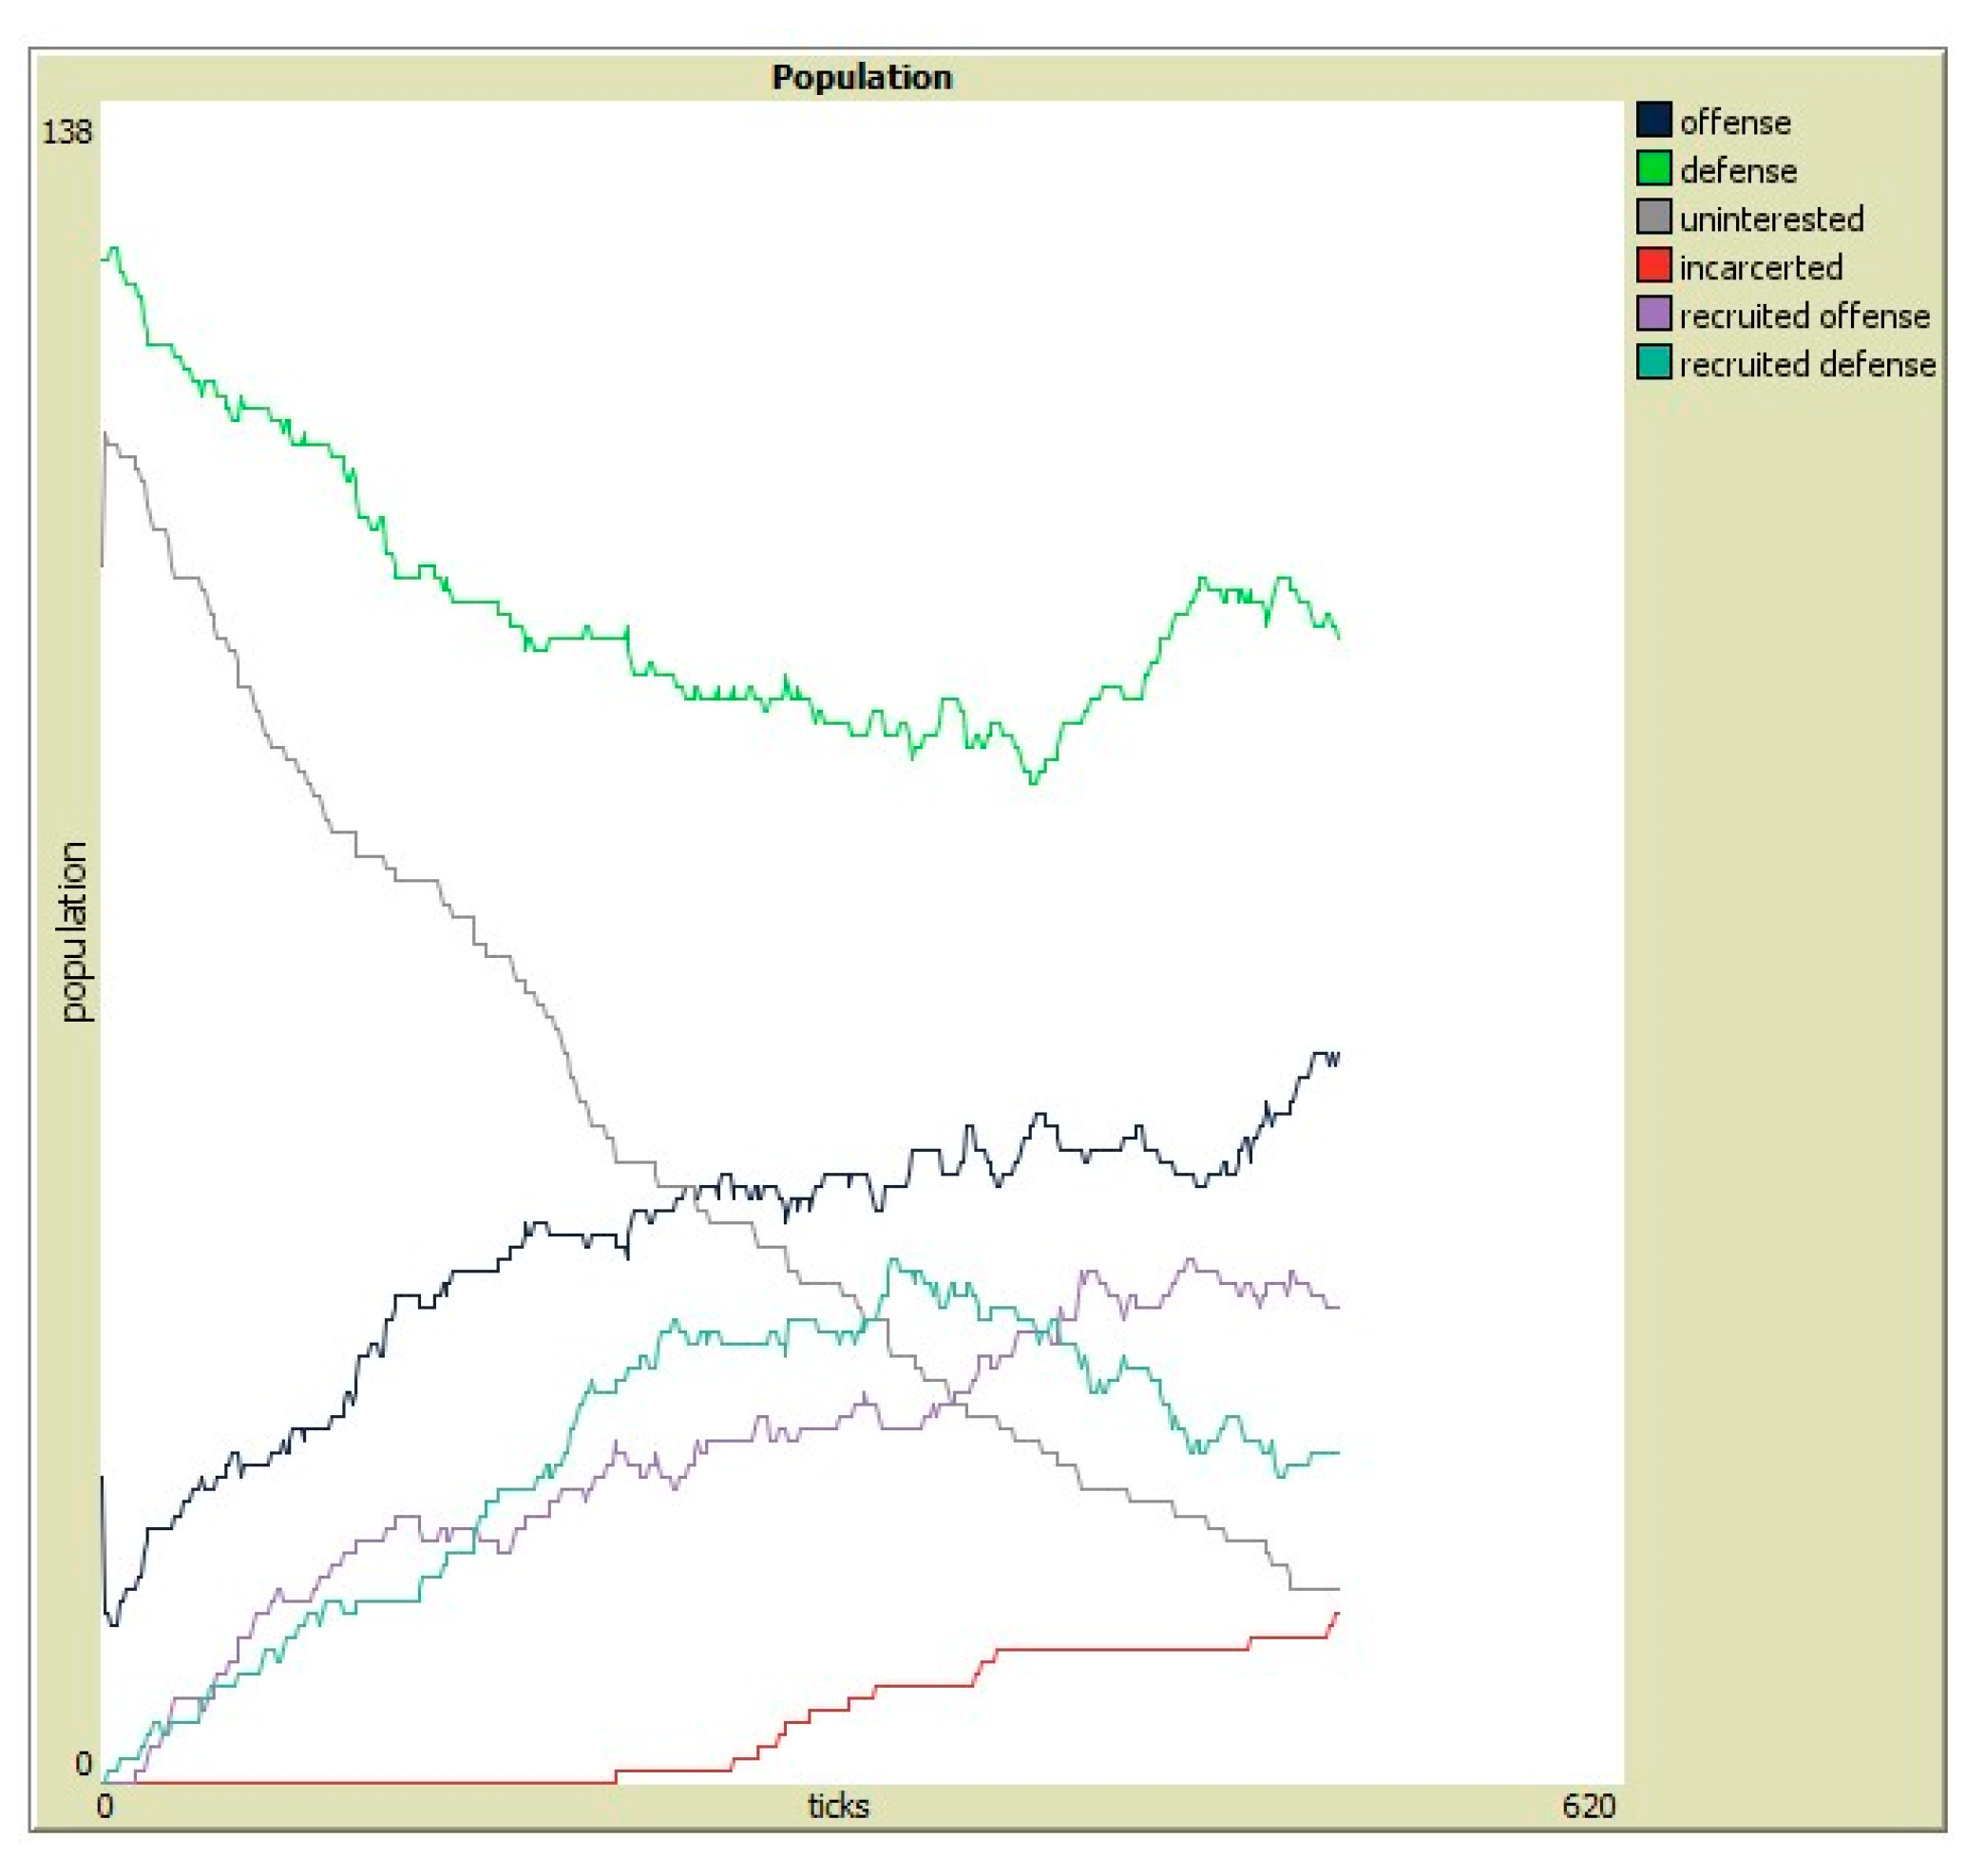
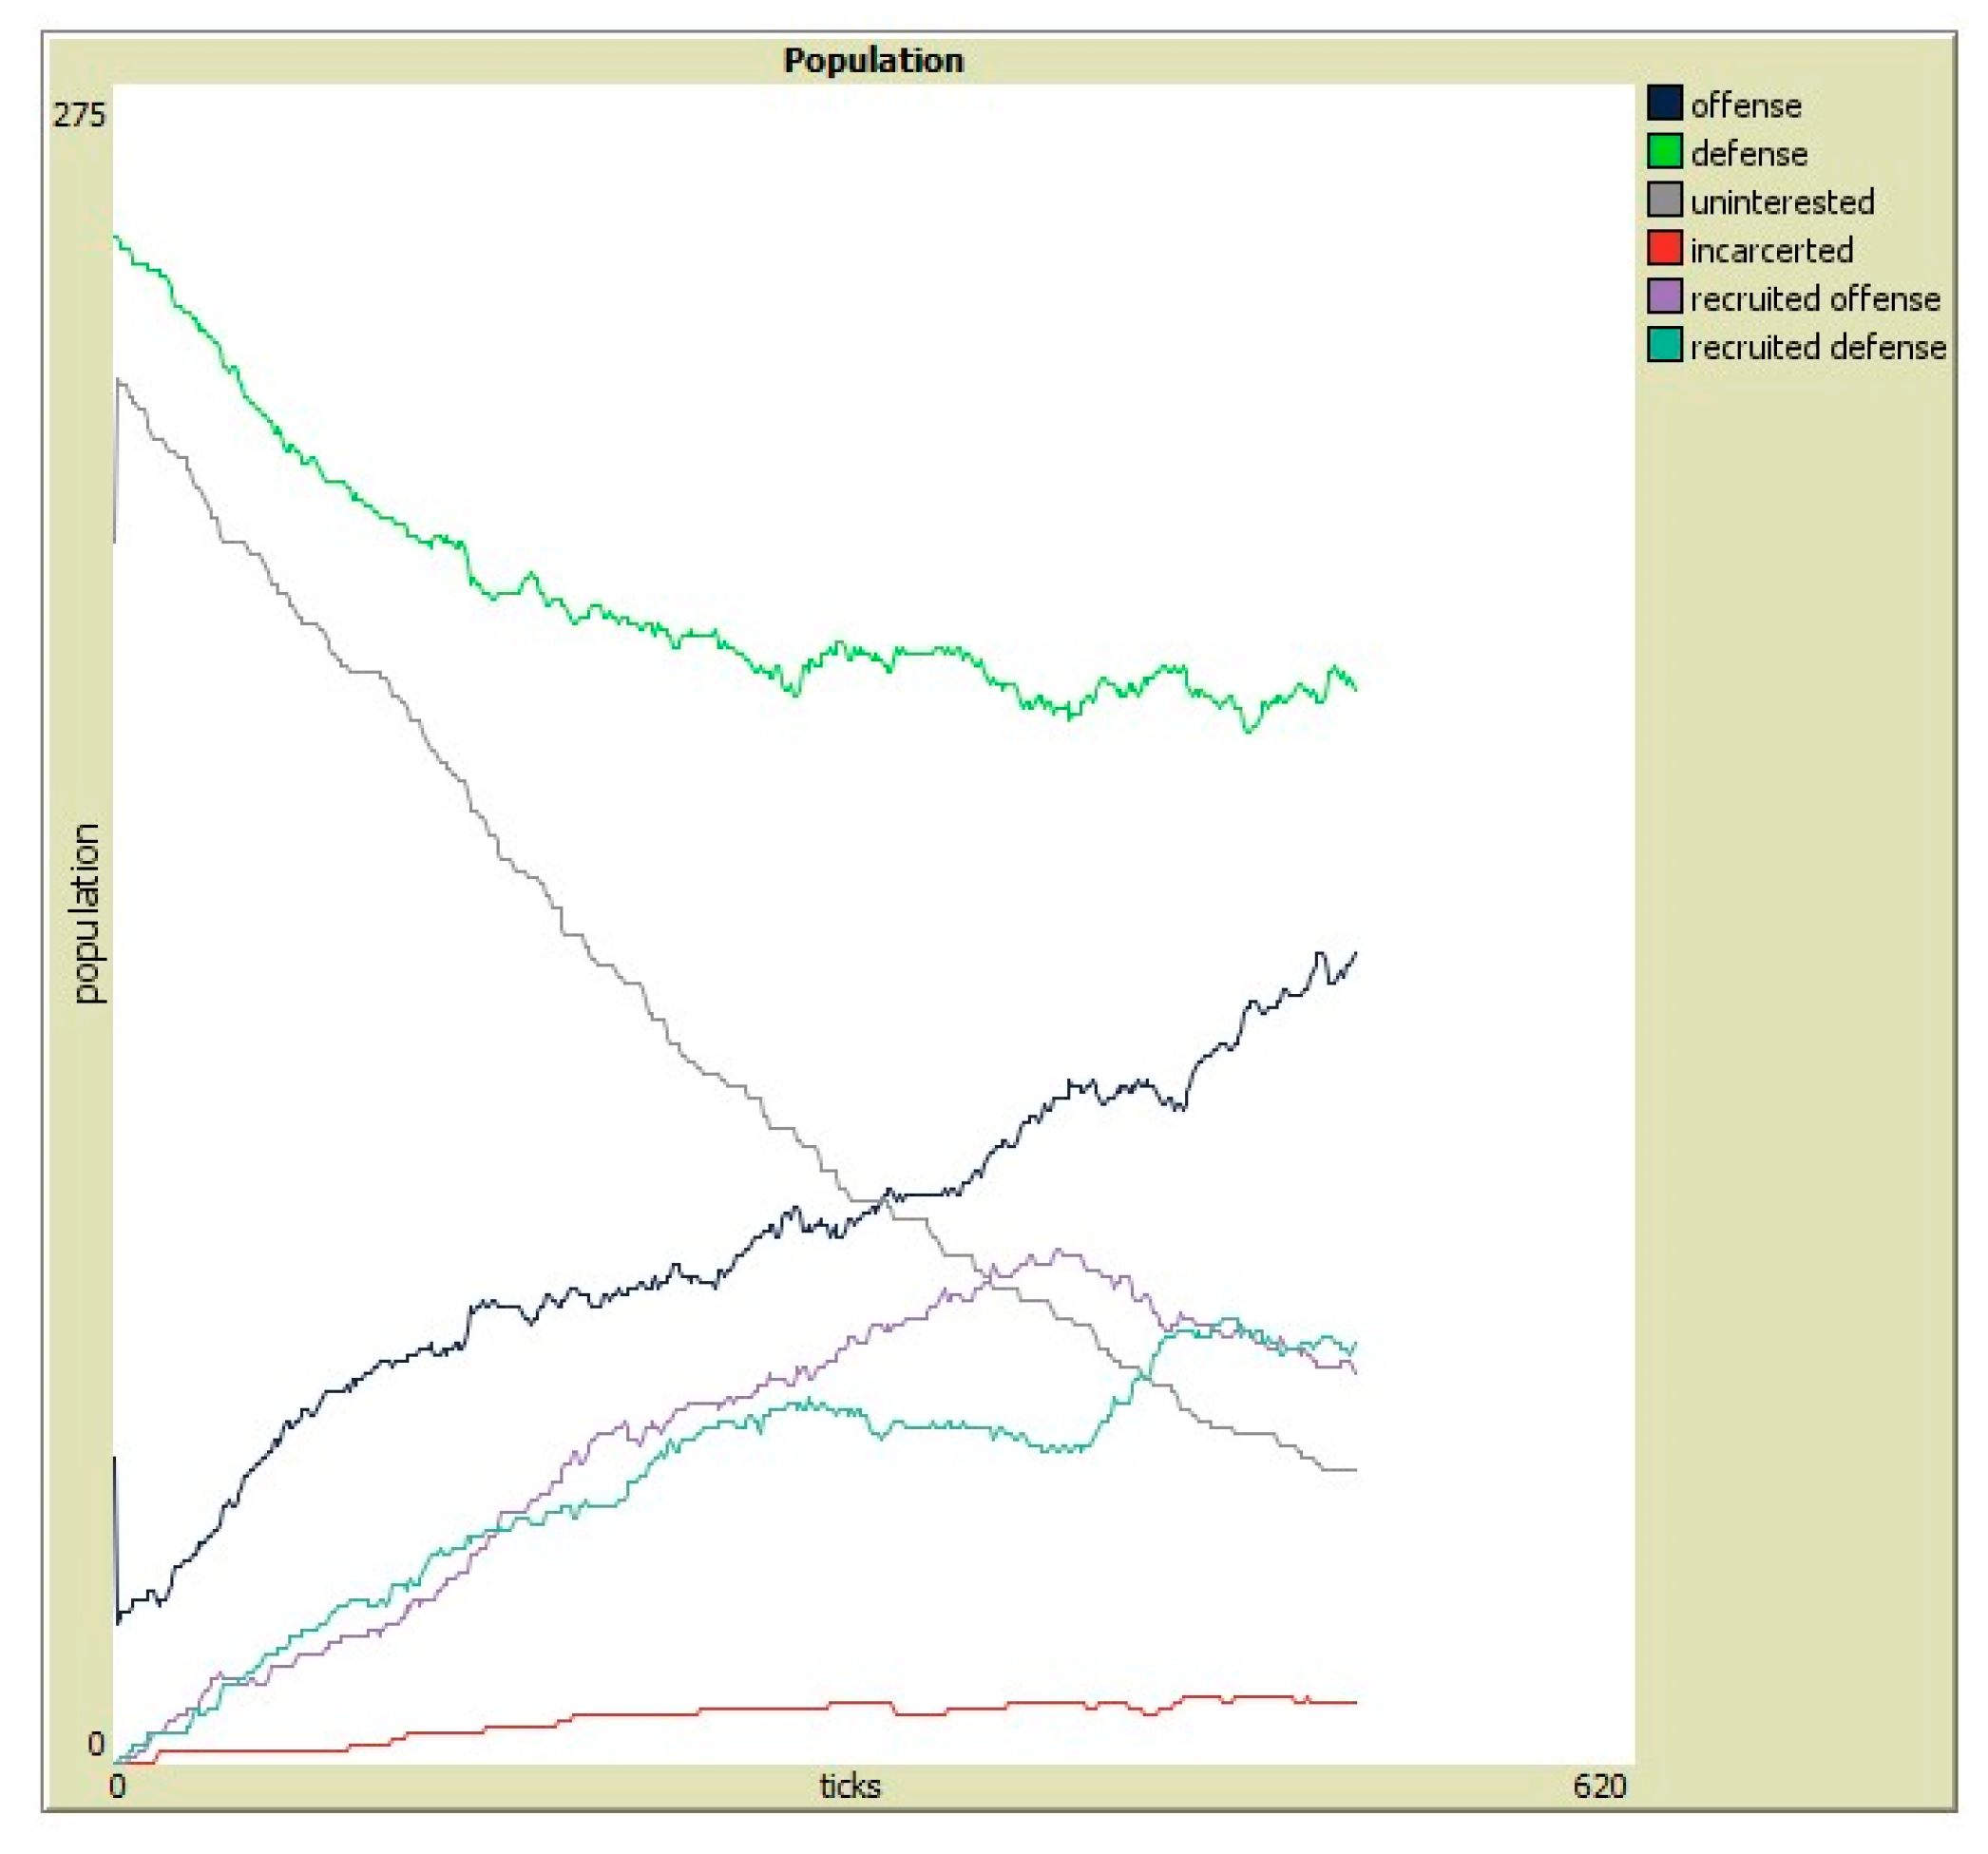
Output graphs of the initial population sensitivity studies are shown in Figure 9, Figure 10 and Figure 11, where Figure 9 shows a population of 100, Figure 10 a population of 250, and Figure 11 a population of 500. Each was run for approximately 500 ticks (time increments in the simulation). The population size does not appear to affect the behavior of the variables with respect to one another. This is expected as no assignment to a population group relies on the contact (or collision) of two individuals, rather, it is calculated as a percentage of the current population. A smaller population is expected to converge more quickly, which is what was observed. The runs of the simulation for each population size showed a similar pattern of progression. The defensive population (shown by the green line) decreases initially and then gains slowly. The uninterested (gray) population decreases sharply in all the simulation runs. The population of attackers (blue) initially increases with the shape of the curve consistent regardless of the population size. The incarcerated (red) initially rise steadily, as do the two populations of recruits—recruited to offense (purple) and recruited to defense (teal).
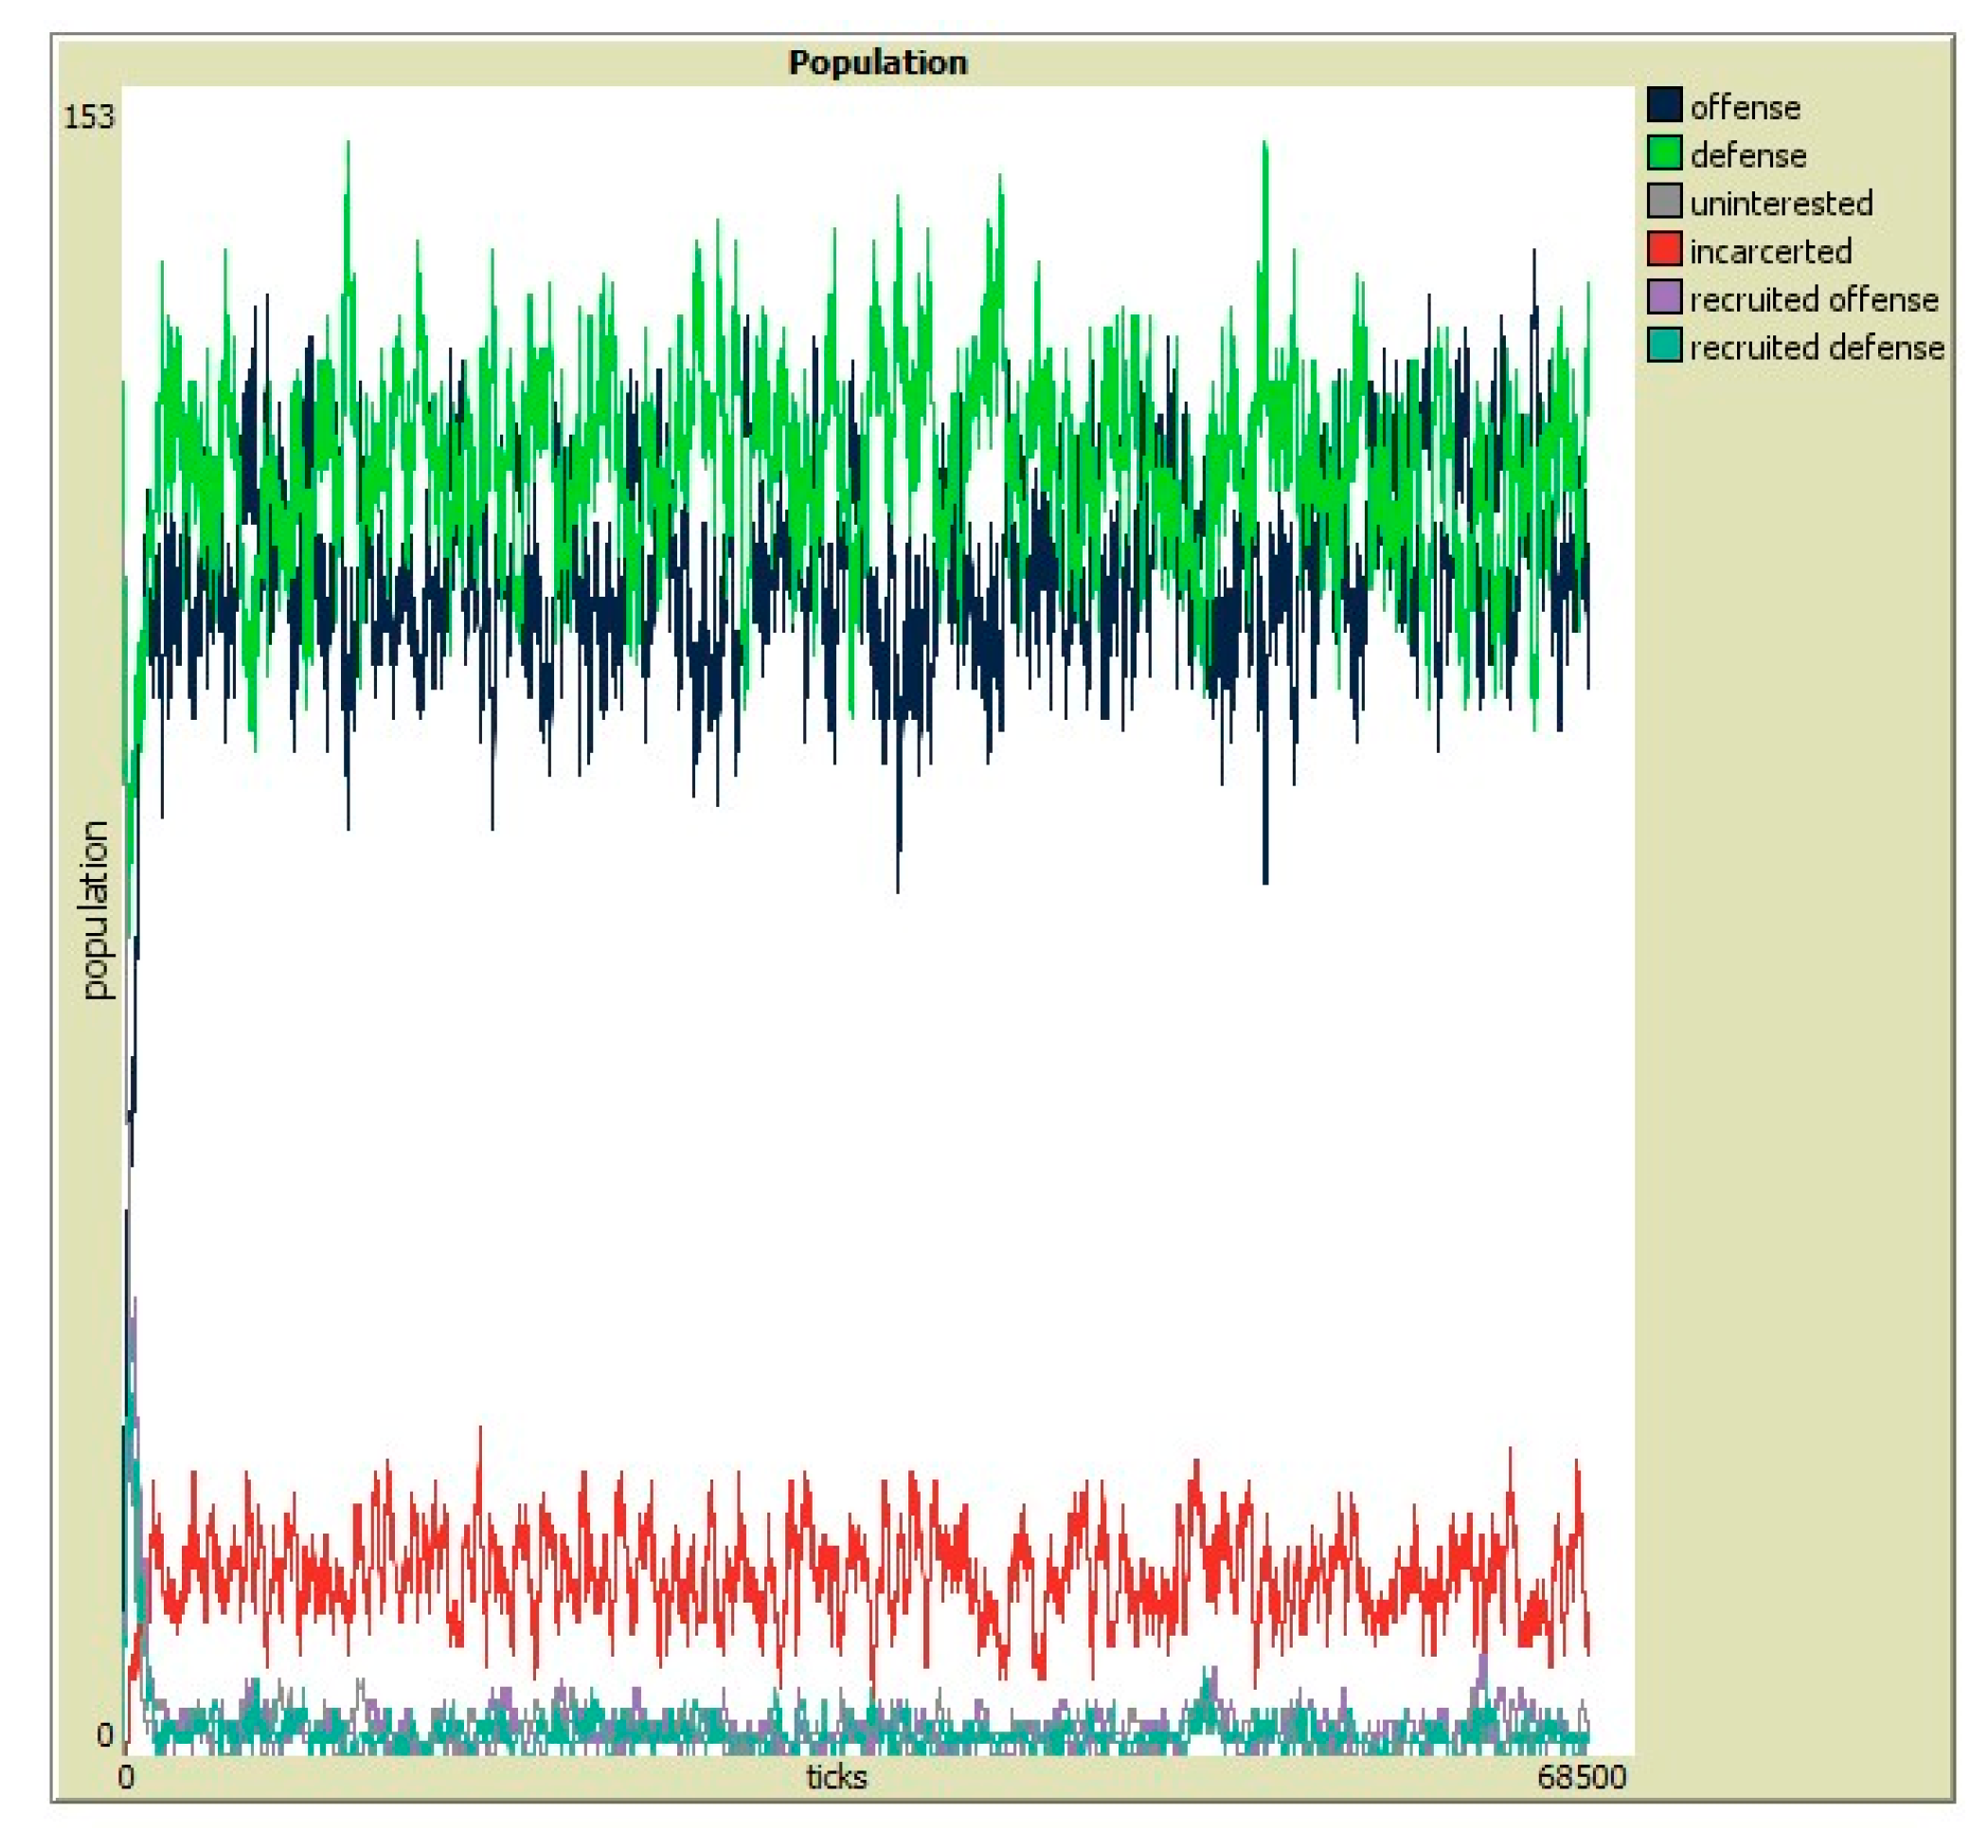
Runs with the default settings were conducted for longer times. The longest run (66,513 ticks) is shown in Figure 12. The model demonstrates that a stable but oscillating population occurs after the uninterested have been recruited. The proportion of the population that is incarcerated oscillates: the magnitude, frequency, and periodicity are observed to be dependent on the arrest-rate and incarceration-time variables.
The default values for the recruitment rates result in a small percentage of the population ever being in a recruited state. Figure 12 also illustrates what appears to be an increase in defense resulting from a decrease in the incarcerated (quarantined). This is expected based on the reahab-to-def rate used, which is more than three times that of the rehab-to-off rate. Moreover, the increase in the incarcerated is reflected in the decrease in the offensive population, as that is the only population against whom the arrest-rate is applied.
5. Discussion
The Cyber Warfare Systemigram (Figure 5) was developed to illustrate that a portion of the digital ecosystem deals with the oscillation between offense and defense in cyber warfare. The QURDO model illustrates important considerations and rates that influence the evolution of members of the ecosystem. An agent-based simulation of this model has been produced in NetLogo™ and is being validated. Validation against real-world data is not currently possible due to a lack of suitable data; however, the model has indicated the types of data that would be required.
The model posits that the defense becomes the offense in an oscillating fashion. The model prevents an agent from passing through the “retooling” stage of recruitment more than once, assuming that the skills of either role are retained during “retooling”. While it could be argued that a retooling is required for every switch, since the knowledge used by both defenders and attackers is perishable in this domain, it was not implemented in this fashion in this version of the model. A future version could force a retooling for every agent role conversion.
The incarcerated spend a variable number of ticks in quarantine and then re-enter the population as either offense, defense, or as uninterested. This is an attempt to simulate the possible outcomes of incarceration, with a return to offense having a greater rate in the default parameters.
Assumptions made in the assignment of relative rates in this model are based on the researchers’ observations. Data supporting this type of model is not readily available: only high-profile cases of recruitment from offense to defense are publicized [35]. Without a source of reliable data regarding these rates, and the others in the model, validation of the model against reality is not possible. This model is presented to explore the various pressures that influence the populations in cyberspace, and while they exemplify the oscillating nature of the populations, they overlook various pressures, such as legal restrictions, financial restrictions, infrastructure impacts, and access restrictions.
This model can be applied to a cyberattack as a form of verification. On 7 May 2021, Colonial Pipeline suffered a cyberattack, assumed to be perpetrated by DarkSide [4]. Figure 3 illustrates this situation: Colonial is on defense and DarkSide is on offence (attacking) in an attempt to control some of Colonial’s resources. This was a ransomware attack where the attacker gains control of a portion of the defender’s network and demands a large sum on money to be paid to regain control of the network. In order to recover control of the network, which controls gas and oil distribution pipelines, Colonial Pipeline agreed to pay the $4.4 million ransom in Bitcoin [36]. Bitcoin, an alternative currency, is preferred by ransomware actors as it can be virtually untraceable. Bitcoin transactions are very secure and happen through the exchange of Bitcoin from one wallet to another.
What happened next illustrates how the oscillation between attacker and defender takes place (Figure 4). DarkSide relied on the strengths of the Bitcoin currency system to insure the defense of their newly obtained resources. Colonial Pipeline contacted the FBI, who assumed the role of attacker on their behalf [37,38]. This illustrates the conversion of defense (D) to offence (O) as shown in the QURDO model (Figure 8). The rate of this conversion (σD) was less than 24 h, but the actual rate was not recorded. The FBI was able to identify a Bitcoin wallet belonging to DarkSide and obtained a warrant for its seizure. Their “attack” was successful, and they were able to recover a substantial portion of the ransom money, transferring control of those resources from DarkSide back to Colonial Pipeline. As no individuals were arrested, none became quarantined (Q), and so that portion of the model is not evoked.
DarkSide will probably continue offensive actions in the future but will also likely invest some resources into better defenses. Colonial Pipeline will undoubtedly also invest some resources into better defenses, and the FBI will return to its role of defense, investing resources into improving defense but also in their ability to convert to offense as needed. This sort of exchange is rarely made public but serves to illustrate the oscillating nature of the actors involved in cyber warfare illustrated by these models.
6. Conclusions
These models illustrate various populations of humans involved in cyber warfare and the control of resources over time. While incomplete, they demonstrate that there are many unobvious pressures in the ecosystem of cyberspace, thereby encouraging different thinking about uncommon ideas not represented in other models of cyberspace, such as recruitment and incarceration. Consideration of novel ideas such as these, and work towards their inclusion in the domain, will enable the collection of appropriate data. Without such novel ideation, systems science will not progress.
Author Contributions
Conceptualization, K.J.L.; formal analysis, K.J.L.; methodology, K.J.L.; software, K.J.L.; supervision, R.C.; validation, K.J.L. and R.C.; writing—original draft, K.J.L.; writing—review and editing, K.J.L. and R.C. All authors have read and agreed to the published version of the manuscript.
Funding
This research received no external funding.
Institutional Review Board Statement
Not applicable.
Informed Consent Statement
Not applicable.
Data Availability Statement
NetLogo model and data available from corresponding author upon request.
Conflicts of Interest
The authors declare no conflict of interest.
References
- Cartwright, J.E. Joint Terminolgy for Cyberspace Operations. 2010. Available online: http://www.nsci-va.org/CyberReferenceLib/2010-11-Joint%20Terminology%20for%20Cyberspace%20Operations.pdf (accessed on 25 June 2021).
- Boardman, J.; Sauser, B. Systems Thinking: Coping with 21st Century Problems; Taylor and Francis: Abingdon, Oxford, UK, 2008. [Google Scholar]
- Kinoshita, S. Introduction to Nonequilibrium Phenomena. In Pattern Formations and Oscillatory Phenomena; Kinoshita, S., Ed.; Elsevier: Waltham, MA, USA, 2013; pp. 1–59. [Google Scholar]
- Neuman, S. What We Know about the Ransomware Attack on a Critical U.S. Pipeline. NPR: What We Know about the Ransomware Attack on a Critical U.S. Pipeline: NPR, 2021. Available online: https://www.npr.org/2021/05/10/995405459 (accessed on 16 June 2021).
- Russon, M.-A. US Fuel Pipeline Hackers Didn’t Mean to Create Problems’. BBC News: US Fuel Pipeline Hackers didn’t Mean to Create Problems’—BBC News, 2021. Available online: https://www.bbc.co.uk/news/business-57050690 (accessed on 16 June 2021).
- US Army, TRADOC. Cyberspace Operations Concept Capability Plan 2016–2028; US Army Capabilities Integration Center: Fort Monroe, VA, USA, 2010; Available online: https://fas.org/irp/doddir/army/pam525-7-8.pdf (accessed on 16 June 2021).
- Kotenko, I.V. Agent-Based Modeling and Simulation of Cyber-Warfare Between Malefactors and Security Agents in Internet. Available online: https://www.semanticscholar.org/paper/AGENT-BASED-MODELING-AND-SIMULATION-OF-CYBERWARFARE-Kotenko/45b17fcca856bf07ac5870f1353990da332aac1d (accessed on 25 June 2021).
- McNeese, M.D.; Hall, D.L. The Cognitive Sciences of Cyber-Security: A Framework for Advancing Socio-Cyber Systems. In Theory and Models for Cyber Situation Awareness; Lui, P., Jajodia, S., Wang, C., Eds.; Springer: Berlin/Heidelberg, Germany, 2017; pp. 173–202. [Google Scholar]
- Cyber Kill Chain(R)|Lockheed Martin. Available online: https://www.lockheedmartin.com/en-us/capabilities/cyber/cyber-kill-chain.html (accessed on 25 June 2021).
- Caltagirone, S.; Pendergast, A.; Betz, C. The Diamond Model of Intrusion Analysis. 2013. Available online: https://www.activeresponse.org/qp-content/uploads/2013/07/diamond.pdf (accessed on 16 June 2021).
- MITRE ATT&CK (R). Available online: https://attack.mitre.org (accessed on 25 June 2021).
- Whyte, C. Power and Predation in Cyberspace. Strateg. Stud. Q. 2015, 9, 100–118. [Google Scholar]
- Yaqoob, T.; Usama, M.; Qadir, J.; Tyson, G. On Analyzing Self-Driving Network: A Systems Thinking Approach. In Proceedings of the Afternoon Workshop on Self-Driving Networks; ACM: Washington, DC, USA, 2017. [Google Scholar]
- Miller, B. Systems Thinking for a Secure Digital World. J. Def. Softw. Eng. 2012, 25, 11–14. [Google Scholar]
- Phillips, J.; Lachina, J.; Davenport, E.; Wong, E.Y.-K.; Comstock, J.M.; Song, S.C. A Systems Framework to Characterize How to Improve Offensive Cyber Operations of Cyber Warefare. In Proceedings of the 2018 International Annual ASEM Conference, Coeur d’Alene, ID, USA, 17–20 October 2018. [Google Scholar]
- Mazurczyk, W.; Drobniak, S.; Moore, S. Towards a Systematic View on Cybersecurity Ecology. Available online: https://arxiv.org/ftp/arxiv/papers/1505/1505.04207.pdf (accessed on 25 June 2021).
- McDermott, T.; Nadolski, M.; Sheppard, L. Use of Systemigrams to Identify Emergence in Complex Adaptive Systems. INCOSE Int. Symp. 2015, 25, 582–599. [Google Scholar] [CrossRef]
- Willett, K.D.; Dove, R.; Blackburn, M. Adaptive Knowledge Encoding for Agile Cybersecurity Operations. In Proceedings of the 25th Annual INCOSE International Symposium (IS2015), INCOSE, Seattle, WA, USA, 13–16 July 2015. [Google Scholar]
- Lippert, K.J. Towards the Evolution of Information in Digital Ecosystems; University of South Alabama: Mobile, AL, USA, 2018. [Google Scholar]
- Gorman, S.P.; Kulkarni, R.G.; Schintler, L.A.; Stough, R.R. A Predator Prey Approach to the Network Structure of Cyberspace. Available online: https://www.researchgate.net/publication/255679706_A_predator_prey_approach_to_the_network_structure_of_cyberspace (accessed on 25 June 2021).
- Kotenko, I.V. Multi-Agent Modelling and Simulation of Cyber-Attacks and Cyber-Defense for Homeland Security. In Proceedings of the 4th IEEE Workshop on Intelligent Data Acquisition and Advanced Computing Systems: Technology and Applications, Dortmund, Germany, 6–8 September 2007. [Google Scholar]
- Kermack, W.; McKendrick, A. Contributions to the mathematical theory of epidemics. Bull. Math. Biol. 1991, 53, 33–55. [Google Scholar] [PubMed]
- Brauer, F. The Kermack-McKendrick epidemic model revisited. Math. Biosci. 2005, 198, 119–131. [Google Scholar] [CrossRef] [PubMed]
- Lippert, K.; Seger, R. The Story Behind Network Defense. In Proceedings of the 2011 Eighth International Conference on Information Technology: New Generations (ITNG 2011), Las Vegas, NV, USA, 11–13 April 2011. [Google Scholar]
- Chauvet, E.; Paullet, J.E.; Previte, J.P.; Walls, Z. A Lotka-Volterra Three-species Food Chain. Math. Mag. 2002, 75, 243–255. [Google Scholar] [CrossRef]
- Haberman, R. Mathematical Modles: Mechanical Vibrations, Population Dynamics, and Traffic Flow; Society for Industrial and Applied Mathematics: Philadelphia, PA, USA, 1998; Volume 21. [Google Scholar]
- Yorke, J.A.; Anderson, W.N.J. Predator-Prey Patterns. Proc. Natl. Acad. Sci. USA 1973, 70, 2069–2071. [Google Scholar] [CrossRef] [PubMed] [Green Version]
- Li, B.; Liu, S.; Cui, J.A.; Li, J. A Simple Predator-Prey Population Model with Rich Dynamics. Appl. Sci. 2016, 6, 151. [Google Scholar] [CrossRef]
- Arditi, R.; Ginzburg, L.R. Coupling in predator-prey dynamics: Ratio-dependence. J. Theor. Biol. 1989, 139, 311–326. [Google Scholar] [CrossRef]
- Harko, T.; Lobo, F.S.N.; Mak, M.K. Exact analytical solutions of the Susceptible-Infected-Recovered (SIR) epidemic model and of the SIR model with equal death and birth rates. Appl. Math. Comput. 2014, 236, 184–194. [Google Scholar] [CrossRef] [Green Version]
- May, R.M.; Anderson, R.M. Infectious Diseases of Humans: Dynamics and Control; Oxford University Pres: Oxford, UK, 1991. [Google Scholar]
- Caley, M.J.; Carr, M.H.; Hixon, M.A.; Hughes, T.P.; Jones, G.P.; Menge, B.A. Recruitment and the Local Dynamics of Open Marine Populations. Annu. Rev. Ecol. Syst. 1996, 27, 477–500. [Google Scholar] [CrossRef] [Green Version]
- Victor, B.C. Recruitment and population dynamics of a coral reef fish. Science 1983, 219, 419–420. [Google Scholar] [CrossRef] [PubMed] [Green Version]
- Munz, P.; Hudea, I.; Imad, J.; Smith, R.A. When zombies attack!: Mathematical modelling of an outbreak of zombie infection. In Infectious Disease Modelling Research Progress; Tchuenche, J.M., Chiyaka, C., Eds.; Nova Science: Hauppauge, NY, USA, 2009; pp. 113–150. [Google Scholar]
- Mitnick, K. Ghost in the Wires: My Adventures as the World’s Most Wanted Hacker; Back Bay Books: New York City, NY, USA, 2012. [Google Scholar]
- Bitcoin.com A Quick Introduction to Bitcoin. Get Started with Bitcoin.com. Available online: https://www.bitcoin.com/ (accessed on 18 June 2021).
- Macias, A.; Wilkie, C. U.S. Recovers $2.3 Million in Bitcoin Paid in the Colonial Pipeline Ransom. CNBC: Colonial Pipeline Ransom: U.S. Recovers $2.3M in Bitcoin Paid (cnbc.com), 2021. Available online: https://www.msn.com/en-us/money/markets/us-recovers-23-million-in-bitcoin-paid-in-the-colonial-pipeline-ransom/ar-AAKNzxF (accessed on 18 June 2021).
- Perez, E.; Cohen, Z.; Marquardt, A. First on CNN: US Recovers Millions in Cryptocurrency Paid to Colonial Pipeline Ransomware Hackers. CNNPolitics. 2021. Available online: https://www.cnn.com/2021/06/07/politics/colonial-pipeline-ransomware-recovered/index.html (accessed on 25 June 2021).
Figure 1.
Cyber Warfare Systemigram: Part I.

Figure 2.
Cyber Warfare Systemigram: Part II.

Figure 3.
Cyber Warfare Systemigram: Part III.

Figure 4.
Cyber Warfare Systemigram: Part IV.

Figure 5.
Cyber warfare Systemigram: Complete.

Figure 6.
UDO model of cyber warriors.

Figure 7.
The URDO model.

Figure 8.
The QURDO model showing the rates.

Figure 9.
Population study (100 for 500 ticks).

Figure 10.
Population study (250 for 500 ticks).

Figure 11.
Population study (500 for 500 ticks).

Figure 12.
A total of 66,513 ticks for a population of 250.


Table 1.
Default settings for variables.
| Rate | Variable | Initial Rate |
|---|---|---|
| %-offense | -- | 10 |
| %-defense | -- | 50 |
| recruit-def-time | -- | 250 |
| recruit-off-time | -- | 400 |
| off-to-def-rate | ηO | 0.250 |
| def-to-off-rate | σD | 0.250 |
| recruit-to-def-rate | αRd | 0.095 |
| recruit-to-off-rate | βRo | 0.095 |
| off-to-def-recruit-rate | εO | 0.290 |
| def-to-off-recruit-rate | γD | 0.290 |
| uni-to-offense-rate | ψU | 0.175 |
| uni-to-defense-rate | κU | 0.175 |
| recruit-def-to-off | λRd | 0.045 |
| recruit-off-to-def | τRo | 0.045 |
| arrest-rate | ρO | 0.050 |
| incarceration-time | -- | 300 |
| rehab-to-def | ωQ | 0.5 |
| rehab-to-uni | χQ | 0.127 |
| rehab-to-off | φQ | 1 − (ωQ + χQ) |
Publisher’s Note: MDPI stays neutral with regard to jurisdictional claims in published maps and institutional affiliations. |
© 2021 by the authors. Licensee MDPI, Basel, Switzerland. This article is an open access article distributed under the terms and conditions of the Creative Commons Attribution (CC BY) license (https://creativecommons.org/licenses/by/4.0/).
Share and Cite
MDPI and ACS Style
Lippert, K.J.; Cloutier, R. Cyberspace: A Digital Ecosystem. Systems 2021, 9, 48. https://0-doi-org.brum.beds.ac.uk/10.3390/systems9030048
AMA Style
Lippert KJ, Cloutier R. Cyberspace: A Digital Ecosystem. Systems. 2021; 9(3):48. https://0-doi-org.brum.beds.ac.uk/10.3390/systems9030048
Chicago/Turabian StyleLippert, Kari J., and Robert Cloutier. 2021. "Cyberspace: A Digital Ecosystem" Systems 9, no. 3: 48. https://0-doi-org.brum.beds.ac.uk/10.3390/systems9030048
Note that from the first issue of 2016, this journal uses article numbers instead of page numbers. See further details here.