
Modelling the Enablers for Branded Content as a Strategic Marketing Tool in the COVID-19 Era


1
School of Management, The NorthCap University, Gurugram 122017, India
2
Department of Food Engineering, National Institute of Food Technology Entrepreneurship and Management (NIFTEM), Kundli, Sonepat 131028, India
*
Author to whom correspondence should be addressed.
Systems 2021, 9(3), 64; https://0-doi-org.brum.beds.ac.uk/10.3390/systems9030064
Submission received: 12 July 2021
/
Revised: 14 August 2021
/
Accepted: 20 August 2021
/
Published: 26 August 2021
(This article belongs to the Special Issue Life in the Time of a Pandemic: Social, Economic, Health and Environmental Impacts of COVID-19—Systems Approach Study)
Abstract
:This study aims towards identifying and modelling the significant factors which act as enablers for the branded content to be used strategically by marketers as a marketing tool in the COVID-19 era. A qualitative approach was adopted for this study, and significant factors associated with branded content were identified from the literature review and primary survey. The factors were then verified by the experts in the area of branding and digital marketing. Total interpretive structural modelling (TISM) and Decision-making Trial and Evaluation Laboratory (DEMATEL) techniques were used to model the factors as per their contextual relationships. As per the model outcomes from TISM and DEMATEL approaches, branded content is an efficient marketing tool that promises value delivery to stakeholders. This, in turn, depends on the authenticity and transparency in content development and distribution. The most significant driving enablers for the system suggest efficient measurement and evaluation strategies and the customer as co-creator for the branded content.
1. Introduction
Marketing as a concept and practice has embraced various definitions and approaches. With the change in time and versatile consumer behaviour, marketing tools adopted by marketers demand responsiveness. The visible indication for this is seen in the recent outbreak of pandemic COVID-19, which has almost shaken the full dynamics of marketing. There is a sudden upsurge in the quantum of online buyers in the year 2020. A few years back, online retailing contributed only around 3%of total retail in India, which is now expected to be around 8% in 2021 [1,2]. Marketers have observed record hit for search on the internet for their products or services. Digital platforms have become necessary for almost every marketer due to the upsurge of digital content and various entrants. The content used for product promotion may be created by the marketer itself or developed through any other company or user-generated. The content thus generated is called branded content, which may be defined as “any output fully/partly funded or at least endorsed by the legal owner of the brand which promotes the owner’s brand values, and makes audiences choose to engage with the brand based on a pull logic due to its entertainment, information or education value” [3]. The term branded content is not new and is being used across all major continents globally through close association with Branded Content Marketing Association (BCMA) for over a decade [4]. Marketers try to reach as close to the consumer as possible to promote their products by providing brand information through user-generated or brand-generated content [5].
Branded content may be a video, an article, an audiovisual, a blog, a magazine, or an event, etc. [3]. For this study, branded content created by the marketers themselves or through outsourcing in digital form is considered for discussion. It is different from traditional advertising, where the promotional content comes as a push factor, intermitting with the customer’s program of choice. Instead, digital branded content is used as a pull factor, where a separate video or digital content is there, with the aim of least obtrusion in the customer’s running show. The customer decides to watch or read branded content out of choice rather than out of compulsion. But this does not mean that branded content intends to replace traditional advertisements; instead, they both can be used strategically where traditional advertisements focus on sales and branded content focus on brand image and brand extension [4]. In other words, digital branded content is any digital form of media that is “intentional, brand-authored media used to establish or extend brand identity or affinity” [6]. It is also established from the concept of permission marketing that consumers don’t like to be disturbed by promotional content without their choice [7]. The customer, therefore, may feel more associated with the brands of their choice through branded content and content delivery. The experience of branded content acts as a driver for customer engagement with the brand and gives a feeling of virtual association [8]. Creating and managing the correct branded content which can promote the brands remains a challenge for marketers always [9].
The pandemic period has allowed marketers to exploit the opportunity of bringing the product closer to consumers through branded content. While buying from home, the consumer looks for product reviews, feedbacks, and product details deeply. A branded content revolves broadly around five areas viz. choice, deliverable vs. discipline, engagement, mode of delivery, and value [3]. Scanty research is available on understanding all the aspects of branded content as a marketing strategy. As per a few experts, the effects of a pandemic may go as long as up to the year 2022. After that, whether marketing will begin as before the COVID-19 period or whether it will be a new normal is a question to ponder upon, and the trend shows more chances for getting the new normal trend to be set up. Various researchers have emphasized that being innovative digitally can help companies survive this pandemic. During this pandemic, more companies have started using WhatsApp, Google Meet, Zoom, etc., reflecting the path ahead [10]. In such a scenario, marketers need to focus deeply and strategically on branded content as a competitive strategy. This is where the need for this study is realized.
This study is built upon the following research questions:
- R1. Which are the major enabling factors for the branded content to be used strategically by marketers as a marketing tool.
The study aims to highlight the major factors that can act as enablers for branded content success.
- R2. What should be a guiding framework for long-term sustainability for branded content as a strategic marketing tool, based on the interaction among identified factors?
Not all the factors need equal focus and efforts from marketers; therefore, an effort has been made to model the factors in a meaningful and contextual hierarchical relationship. The qualitative approach for data collection and analysis was approached, where factors were identified through extensive literature review and primary data and were validated through expert opinion. The factors were then modelled through Total Interpretive Structural Modelling (TISM) and Decision-making Trial and Evaluation Laboratory (DEMATEL) Techniques. This study emphasizes strategically approaching the branded content to be used as a marketing tool in the COVID-19 scenario and lays the foundation for marketers and policymakers.
This study further has sections, where Section 2 presents the literature review, and Section 3 discusses the methodology, including TISM and DEMATEL techniques. Section 4 is the results and analysis, and Section 5 presents the discussion and practical implications. Section 6 gives the conclusion, and Section 7 is the limitations and future research directions for this study.
2. Literature Review
The concept of online presence or digital marketing is not new for marketers or consumers. Digital marketing is there for years, and marketers adopt everyday innovative approaches to make close bonds with consumers [4] and studying the consumer attitude and behaviour in the technology-driven sharing economy [11,12,13]. Consumers are targeted through social media channels, display advertisements, and search engines [14,15,16]. Online social platforms are most interactive and communicative to reach consumers [17]. Various retail marketers are using social media platforms to promote their brands, often taking the help of brand communities on social media platforms [18,19,20]. Research suggest that, if designed and directed by marketers for brand promotion, social media platforms can develop a sense of belongingness and interactivity among consumers [21]. Branded content is relatively still a new topic [4]. Branded content is developed to provide focused information entertainingly to a specific target set of consumers. Influencer-marketed branded content is prominent, wherein the marketer chooses a personality to create and market its branded content [19,22]. The content needs to be vivid and deeply connected with the products [20]. Effective content formats also impact influencer marketing [23].
The branded content development and distribution have become a buzz feature for marketers nowadays, which is discussed widely with content marketing [3]. The terms branded content, and branded content marketing should be used carefully as both carry a separate meaning and require separate attention from marketers. In one way, branded content marketing may be considered an enabler for making the content reach its target customers. The key to using branded content efficiently lies in the adequately defined content and carefully selected medium to make it available to consumers. The Branded Content Marketing Association (BCMA) suggested a few rules for branded content success as a marketing tool. The suggestions include that interesting and original branded content, promotion of content, combined campaigns that can enhance the positive image of a brand, and synergistically with traditional advertising [6]. Authors tried to sensitize the readers about the benefits of relating branded content with crowd culture through social media [24]. Branded content integration may also be done by either placing the product or brand in the movie or TV program, or it may be used to portray the real use by using any celebrity [25]. Webisode communication is also a branded content strategy wherein movies or series are broadcasted on the internet related to a brand [26].
The significant factors as enablers for branded content to be used as an efficient marketing tool may be discussed as follows:
2.1. Factor 1: Branded Content Distribution and Promotion Strategy
Branded content must be delivered and distributed to the consumers most effectively once created. The distribution of the promotion aspect of branded content is discussed under the umbrella of content marketing. An efficient content marketing influences consumers’ purchase intentions and loyalty to brands [27]. Consumers tend to have different brand perceptions based on how the content is promoted and presented to consumers [4]. The time of content delivery impacts its popularity [28]. There are various channels available for branded content delivery, so choosing the best content delivery method is a crucial for marketers these days [6,29].
2.2. Factor 2: Quality of Content
The branded content needs to be creative, informative, and engaging. Marketers use different forms of content to engage the consumers and pass the brand message in a more focussed manner [6,27,30]. Consumers look for different types of content for different product types, like complete information and advice for health products and automobiles, while inspirational content for fashion products [19]. The type and quality of content decide the engagement power of consumers with the brand [31]. The richness of the content and proper usage of images impact the popularity of branded content amongst the consumers [28].
2.3. Factor 3: Authenticity
Consumers consult the branded content to get adequate information about the brand. Therefore, the credibility of branded content is an important decisive factor for consumer choice [32]. Content authenticity affects the brand image directly by impacting consumer trust. Consumers often relate the authenticity of any engagement initiative with brand perception; if the initiative matches with perception, it is considered authentic [33]. The authenticity of branded content depends to a great extent on the source and mode of content development.
2.4. Factor 4: Transparency
The amount of disclosure in the branded content relates to transparency and ethics [34]. Consumers expect brand marketers to be transparent in their content descriptions and delivery methods, but marketers need to consider various business decisions. Therefore, the level of transparency in branded content is tricky, and it needs to be managed with due diligence. Lack of transparency also may disorient the consumers and may lead to a lack of trust in the brands. As per the study conducted [35], companies may introduce disclaimers with new formats of creating branded content to protect the credibility and transparency of brands. The advertising of branded content also needs due consideration and compliance with the legislative mechanism for bringing in required transparency [36].
2.5. Factor 5: Value Delivery to Stakeholders
Branded content success as a marketing tool depends on how it is embraced by consumers [3]. Also, besides consumers, branded content should provide value to its other stakeholders that prominently involve the marketer company and the company if hired to develop branded content on behalf of the marketer. If the branded content can provide value to the stakeholders, it can only sustain the competition and prove a competitive tool for the marketer. There needs to be an affinity between the marketer and the media providers for delivering branded content [37].
2.6. Factor 6: Measurement and Evaluation of Branded Content
As per [6], the branded content needs to be evaluated for quality, and its impact needs to be measured for its success. BCMA suggests a content evaluation system known as Branded Content Evaluation System (BSES), which focuses on overall content performance, component-wise impact, and anything the marketer needs to do differently from the competitors. Many companies face difficulties related to content production and curation and ROI measurements [38].
2.7. Factor 7: Customer as Co-Creator
The branded content gets enriched when the consumer becomes one of the participants in creating it. Marketers are exploring online communities of consumers as a tool for brand co-creation [39]. Marketers invite consumers to participate in the co-creation of brand content through various means [40,41]. Studies claim that consumers usually believe the reviews or content provided by other consumers more than those professionally created [4]. Also, if inviting suggestions from customers, the marketers should respond or attend to those suggestions or concerns to have content and product improvements [6]. Table 1 presents a summary of the literature.
3. Methodology
This study aims to identify the significant factors that may act as enablers for branded content and be strategically used as a marketing tool by marketers in the COVID-19 era. For this purpose, a qualitative approach was adopted. As a first step, literature was screened to identify the significant factors associated with branded content. The identified factors (14 factors) were then randomly circulated online in the last week of June 2020 to a few respondents for responses on factor appropriateness. A brief questionnaire was prepared for this purpose and posted on social media platforms like Watsapp and LinkedIn. The responses were received from 83 respondents. A very brief summation of the same is mentioned in Table A2 (Appendix B). The final list of factors was prepared based on responses received and the literature survey (as mentioned in section two above). The factors were then verified by the experts in the area of branding and digital marketing. Also, the experts were asked to identify the contextual relationship between the variables as per the requirements of the TISM and DEMATEL approach. A total of five experts were approached for this purpose, including three academicians in leading management institutes in Delhi-NCR, and two were from the industry. The domain experts were chosen based on their Linkedin profile and experience in the subject. For response collection purposes, all the five experts were called on a virtual meeting two times during 2nd July to 13th July 2020, and the researcher recorded their observations and comments. Based on the suggestions from the experts, TISM and DEMATEL approaches were applied. Both these approaches have demonstrated their strength for modelling variables in different research domains. TISM is an extension of the Interpretive Structural Modeling (ISM) approach. It is preferred over ISM, as it overcomes a few of the drawbacks of the ISM approach such as in ISM no logic is provided for the identified relationships between the variables. In contrast, in TISM, the interpretive logic knowledge base matrix is prepared to provide logic for each linkage. TISM approach identifies the structural relationship between the variables [42,43,44,45], and DEMATEL further provides the strength of those relationships, along with providing the cause and effect relationship among the variables [46,47,48]. Further, in this section, the methodology for TISM and DEMATEL approaches are discussed.
3.1. Total Interpretive Structural Modelling (TISM)
Total interpretive structural modelling (TISM) is a qualitative approach for identifying the contextual relationships between the factors under study [49,50]. TISM highlights the driving power or dependence of one factor over others and thereby identifies the significant linkages. The steps involved in TISM [51,52,53] are discussed as below:
Step 1: Identification of relevant factors from the literature review and validation from experts.
Step 2: Developing the interpretive logic-knowledge base matrix for the contextual relationship (“lead to” type) amongst the factors, as per inputs from the experts, and marking the entries as YES or NO. Wherever one particular factor leads to another factor, entry is made as ‘YES’ in the matrix, and wherever the ‘lead to’ relation is missing, entry is made as ‘NO’ in the matrix. Also, the experts are asked to provide a logical reason for the proposed relationship between the factors, and the reason is mentioned in the column against the ‘YES’ entry.
Step 3: Transformation of the interpretive logic-knowledge base matrix into a binary matrix (reachability matrix) by making (i,j) entry of YES as (i,j) entry of 1 in the reachability matrix, and (i,j) entry of NO as (i,j) entry of 0 in the reachability matrix. The reachability matrix is then scrutinized for transitive links as per the following formula:
‘If factor1 leads to factor 2, and factor 2 leads to factor 3, then factor 1 should also lead to factor 3’and wherever it is found, transitivities are included in the form of 1* in the reachability matrix.
Step 4: The factors differ in their magnitude and direction to influence other factors in the system. In the TISM approach, factor level partitioning is done to allot level to each factor as per its magnitude and direction of influence. The step of allotting level to any factor is called iteration. For each iteration, the reachability set (consists of all the factors that this factor leads to, including self) and the antecedent set (consists of all the factors that lead to this factor, including self) are identified intersections are recorded under the intersection set. Levels are allotted to any factor whenever its reachability and intersections set becomes equal, and then that specific factor is removed from further iterations. Iterations in this way continue till levels are allotted to each factor.
Step 5: Carrying out MICMAC analysis for grouping the factors into four clusters viz. ‘autonomous’, ‘dependent’, ‘linkage’ and ‘drivers’ based on their driving power and dependence.
Step 6: Preparing the diagraph/TISM model, based on the levels achieved by each faculty, to represent the direction of influence of one factor on another graphically.
3.2. DEMATEL
The DEMATEL technique is used for developing and interpreting the causal or effect relationship between the identified factors [54]. The DEMATEL approach consists of the following steps [55,56,57,58,59].
Step 1: Developing the direct relation matrix (D): To develop the direct relation matrix (D), the pair-wise relationships amongst the factors are established first. For this purpose, expert opinion is sought for evaluating all the pairs of factors on a scale of 0–4, where value 0 denotes ‘no influence’ and value 4 denotes ‘extreme strong influence’ of one factor on another in the pair. Accordingly, a non-negative matrix (n × n) is achieved for n factors for each expert. After that, the responses of all the experts are averaged and accordingly, the direct relation matrix (D) is obtained by following the below-mentioned formula:
Step 2: Developing the normalized direct relation matrix (N): The normalized direct relation matrix (N) is obtained by normalizing the direct relation matrix (D), by using the formula:
Step 3: Developing the total relation matrix (R)
Total relation matrix (R) is obtained from the normalized matrix by using the formula:
where I represent the identity matrix. The total relation matrix (R) depicts the type of relationship (influence); one factor has over other factors.
R = N(I − N)−1
Step 4: Developing the causal diagram: The causal diagram in DEMATEL is obtained by plotting the values of (D+R) and (D−R), where ‘D’ denotes the sum of rows, and ‘R’ denotes the sum of columns, respectively, for each factor. The value of the sum of rows (‘D’) shows the sum of the influence of one particular factor on other factors, and the value of the sum of columns (‘R’) shows the sum of the influence of other factors on that respective factor. Similarly, values of (D+R) reflects the strength of the relationship of the particular factor with the system. Similarly, values of (D−R) reflect the nature of relationships amongst all the factors. The positive value of (D−R) of the factor shows that the respective factor belongs to the cause group. The negative value of (D−R) of factor indicates that the respective factor belongs to the effect group. The (D+R) and (D−R) values are further plotted on the x and y-axis to obtain the causal diagram.
4. Results and Analysis
4.1. TISM Modelling
Step-wise results from TISM modelling are discussed as follows.
Step 1: Identification and listing of the relevant factors: A total of seven factors were identified from the literature review and primary survey, which may act as enablers for branded content to be used as a marketing strategy. All seven factors are described in Section 2 above. Also, the factors were verified by the experts, as mentioned in Section 3 beginning.
Step 2: Defining Contextual Relationship and developing an Interpretive logic-knowledge base. The Interpretive logic-knowledge base matrix was prepared as per the methodology in step 2 in Section 3 above and is placed as Table A1 (Appendix A).
Step 3: Development of a reachability matrix from the Interpretive logic-knowledge base and then scrutinize the matrix for transitivity. The interpretive logic-knowledge base was transformed into a binary matrix following the process described in step 3 in Section 4 above. The reachability matrix obtained is placed in Table 2. Further, as per the rule for transitivity discussed in step 3 in Section 4 above, the final reachability matrix is prepared and placed in Table 3. Also, the transitivities such obtained were included in the interpretive logic-knowledge base (Table A1), by replacing the entry of NO with the entry of YES, for that respective transitive entry and also the word ‘transitive’ was written in the respective column of that entry. Further, the driving power (calculated by adding up the number of 1s in the row) and dependence (calculated by adding up the number of 1s in the column)for each factor were calculated and recorded in the final reachability matrix.
Step 4: Carrying out level partitioning of the reachability matrix: As per the process of level partitioning detailed in step 4 of Section 3 above, In this study, a total of four iterations were required to allot levels to each factor. The consolidated level partition table is placed as Table 4.
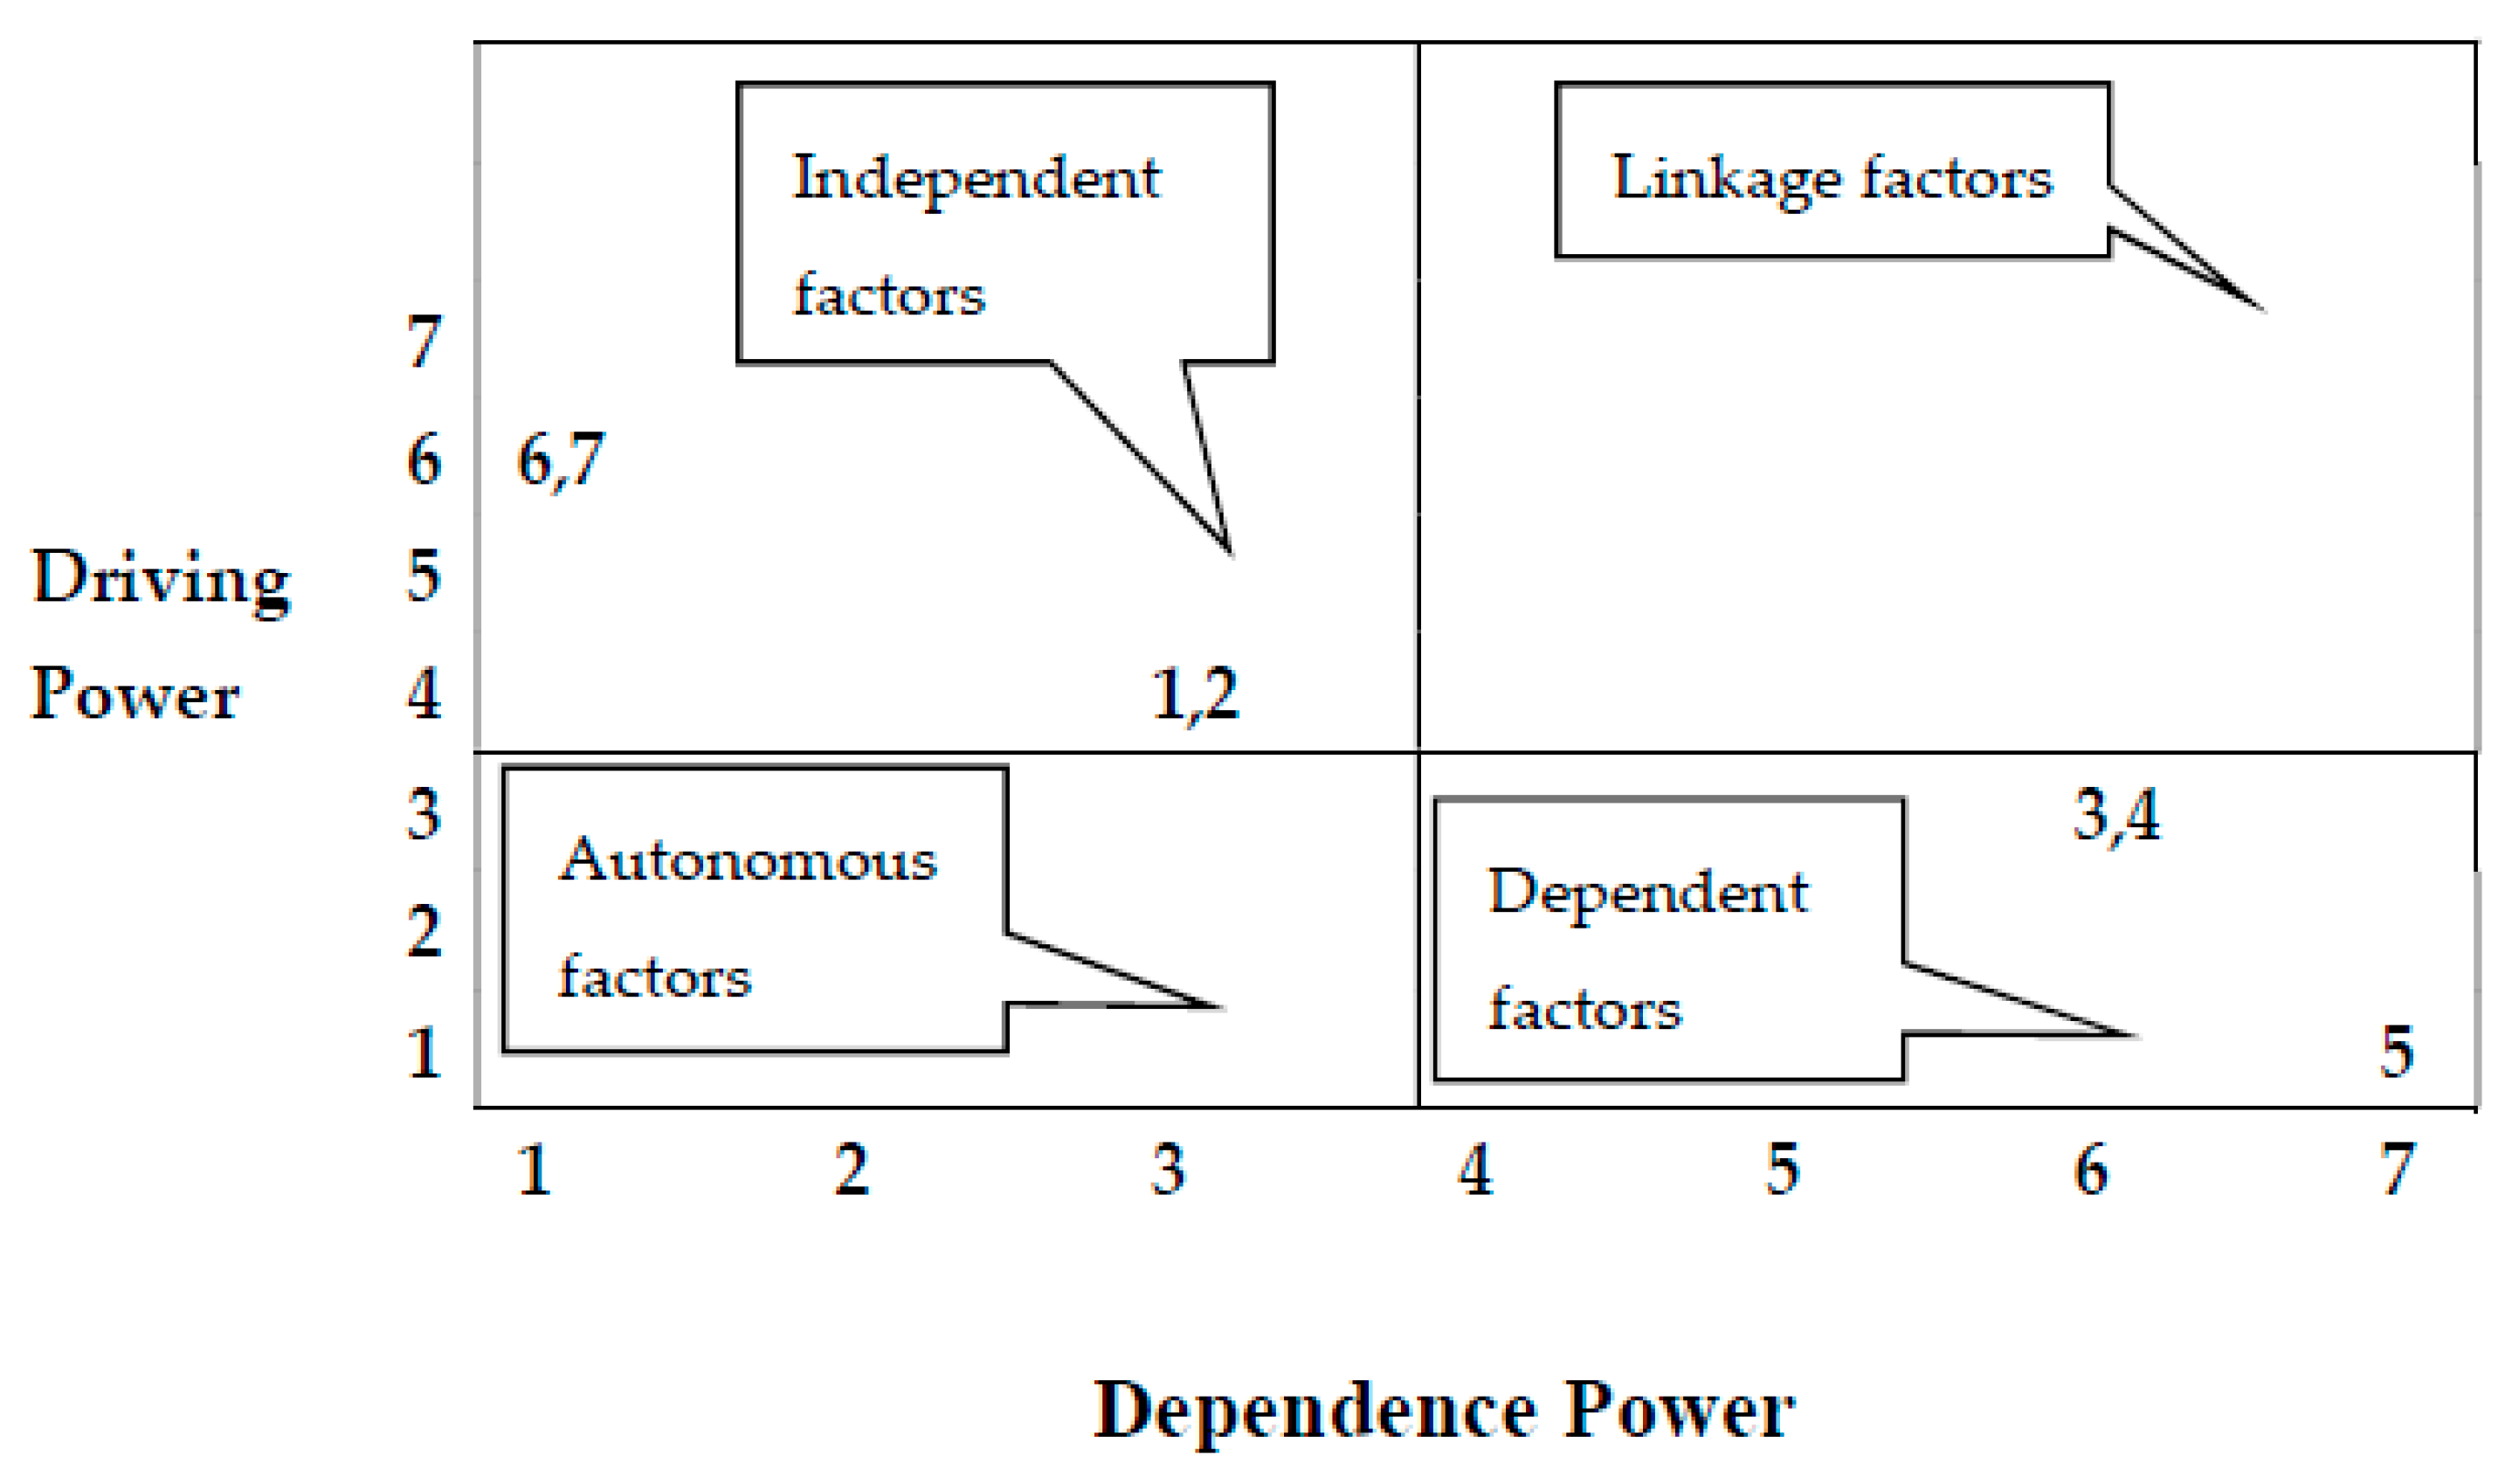
Step 5: MICMACAnalysis: The purpose of MICMAC Analysis is to divide the identified factors into four different clusters as per the driving power and dependence of the factors. The four clusters thus identify and group the factors as autonomous, dependent, linkage, and independent factors [44,60,61,62,63]. The grouping of factors in this study is presented in Figure 1 and discussed as below:
Cluster I: This cluster groups together Autonomous Factors in the system. Such factors do not significantly relate to other factors and have weak driving power and weak dependence. In this study, no factors emerged into this group, reflecting that all the factors show some other types of relationships.
Cluster II: This cluster groups together Dependent Factors in the system. Such factors have weak driving power and high dependence on other factors. In this study, value delivery to stakeholders (5), transparency (4), and authenticity (3) were grouped into this cluster. These factors are strategic for the system but need the support of other factors to be achieved successfully.
Cluster III: This cluster groups togetherLinkage Factors in the system. Such factors have driving power and dependence both as high. They are the most unstable ones, and any change on other factors can easily reflect on these factors and other factors. In this study, no factor emerged as a linkage factor, which might be because all the identified factors have either significant driving power or dependence, but not both.
Cluster IV: This cluster groups together Independent Factors in the system. Such factors have high driving power and low dependence on other factors. In this study, measurement and evaluation strategies (6), the customer as co-creator (7), quality of the content (2), and distribution and promotion strategy (1) got categorized into this cluster.
Step 6: TISM Model/Diagraph
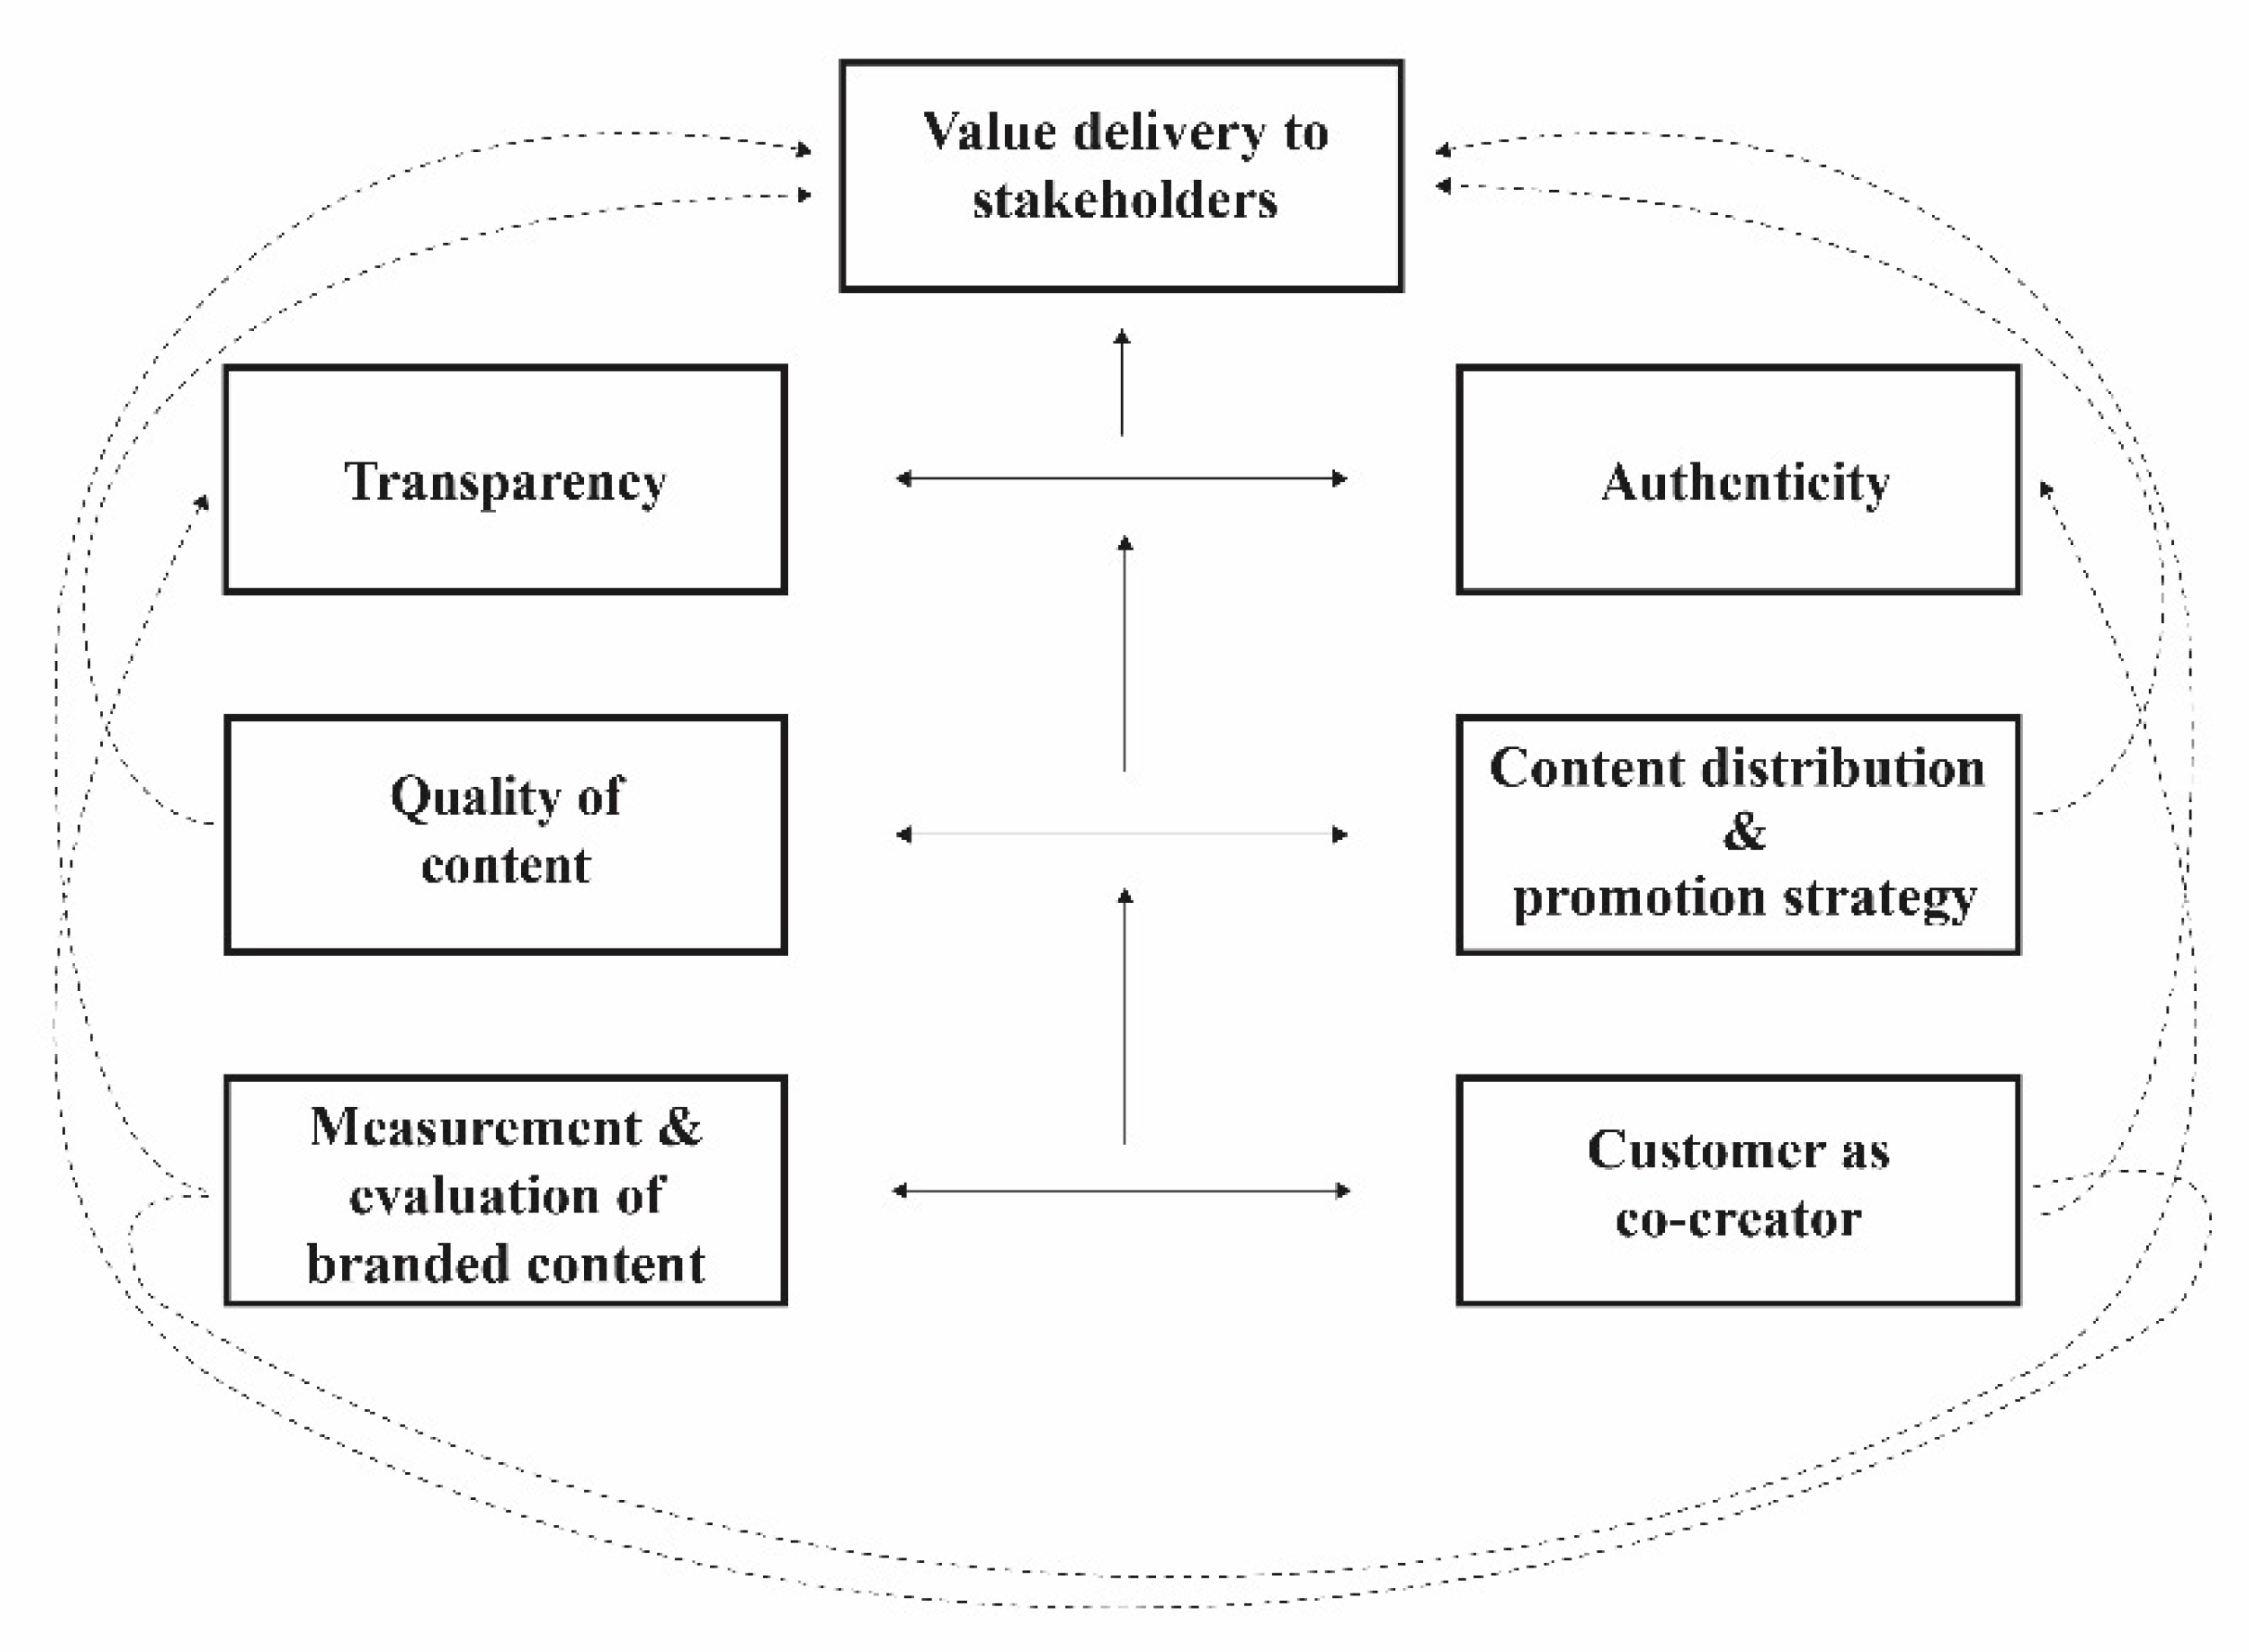
All the factors are represented graphically in the sequence as per their driving powers and dependence, and the model thus obtained is known as the TISM model or Diagraph. In this study, the seven factors were placed as per their level partitions, where the factor with level one was placed at the top, followed by next-level factors. Factors are connected through arrows, which always point upward in vertical interrelationships, and arrows point to both sides in case of horizontal or same level factors. The dotted lines in the model reflect the indirect ‘lead to’ relation between the factors. The TISM model so generated is placed as Figure 2.
As per the TISM model, the factors viz. measurement and evaluation strategies (6); and the customer as co-creator (7) emerged as the most significant driving forces for other factors. This signifies that for branded content to be used strategically for brand promotion, it is essential to have well-designed and practice measurement and evaluation strategies. These measurement and evaluation strategies help keep the quality of content higher and its delivery platforms efficient. The marketer needs to draft methods to measure the impact of branded content on the marketing and promotion aspects of their products. Similarly, the content development and delivery are to be evaluated frequently on pre-decided parameters with much precision. Equally, the strong enabler is the customer as co-creator (7), which also has high driving power. This is realized that if branded content focuses on and usage of user-generated content, its impact becomes manifold. Both these driving forces are significant to maintain transparency and credibility in the system for all the stakeholders. As per the model, next in the hierarchy in driving power are the quality of the content (2); and distribution and promotion strategy (1). With ideal measurement and evaluation strategies and involving the customer as content co-creator, it helps develop excellent quality content and content distribution in the most user-acceptable manner. Consumers seek complete and accurate information about the product before buying, and that is what they expect the branded content should provide them. Also, not all ways of making the content available to consumers are effective. Marketers need to identify the delivery method, which suits their product type and the profiling of consumers in the best suitable manner. These four driving forces discussed above lead to branded content’s transparency (4), and authenticity (3) for the customers.
Consequently, all these factors lead to value delivery to stakeholders (5). As emerged from the model, value delivery to stakeholders eventually decides the fate of the system’s success. Stakeholders involve the customers, content developers, platform providers, and marketers (if different from content creators and distributors). Unless the stakeholders get something worth higher sales, better product reviews, acceptance, and increased profits, only branded content should be sustained as a promotion strategy.
4.2. DEMATEL Model
The methodology explained in Section 3.2 above was adopted, and consequently, the step-wise results obtained from applying the DEMATEL technique on the factors are discussed below:
Step 1: Direct relation matrix (D)
The direct relation matrix (D) was developed by identifying the pair-wise relationship between the identified factors, as per the method and formula explained in step 1 of Section 3.2. The direct relation matrix is placed in Table 5.
Step 2: Normalised direct relation matrix (N)
The normalized direct relation matrix (N) was obtained by normalizing the direct relation matrix (D) using the formula mentioned in step 2 in Section 3.2 above. Accordingly, the matrix obtained is mentioned in Table 6.
Step 3: Total relation matrix (T)
The total relation matrix (T) obtained as per the formula mentioned in step 3 of Section 3.2 above is placed in Table 7.
Step 4: Developing the causal diagram based on values of (D+R) and (D−R):
From the total relation matrix, the values of (D+R), i.e., the sum of influences given to factors, and (D−R), i.e., the sum of influences received by factors, were calculated, as shown in Table 8.
The factors were ranked based on their (D+R) values, reflecting the relative importance of the factor in the system and the degree of the relation of one factor with other factors. The same is highlighted in Table 9.
Similarly, the factors were also ranked based on their values of (D−R), reflecting the kind of relation between the variables and summarised in Table 10.
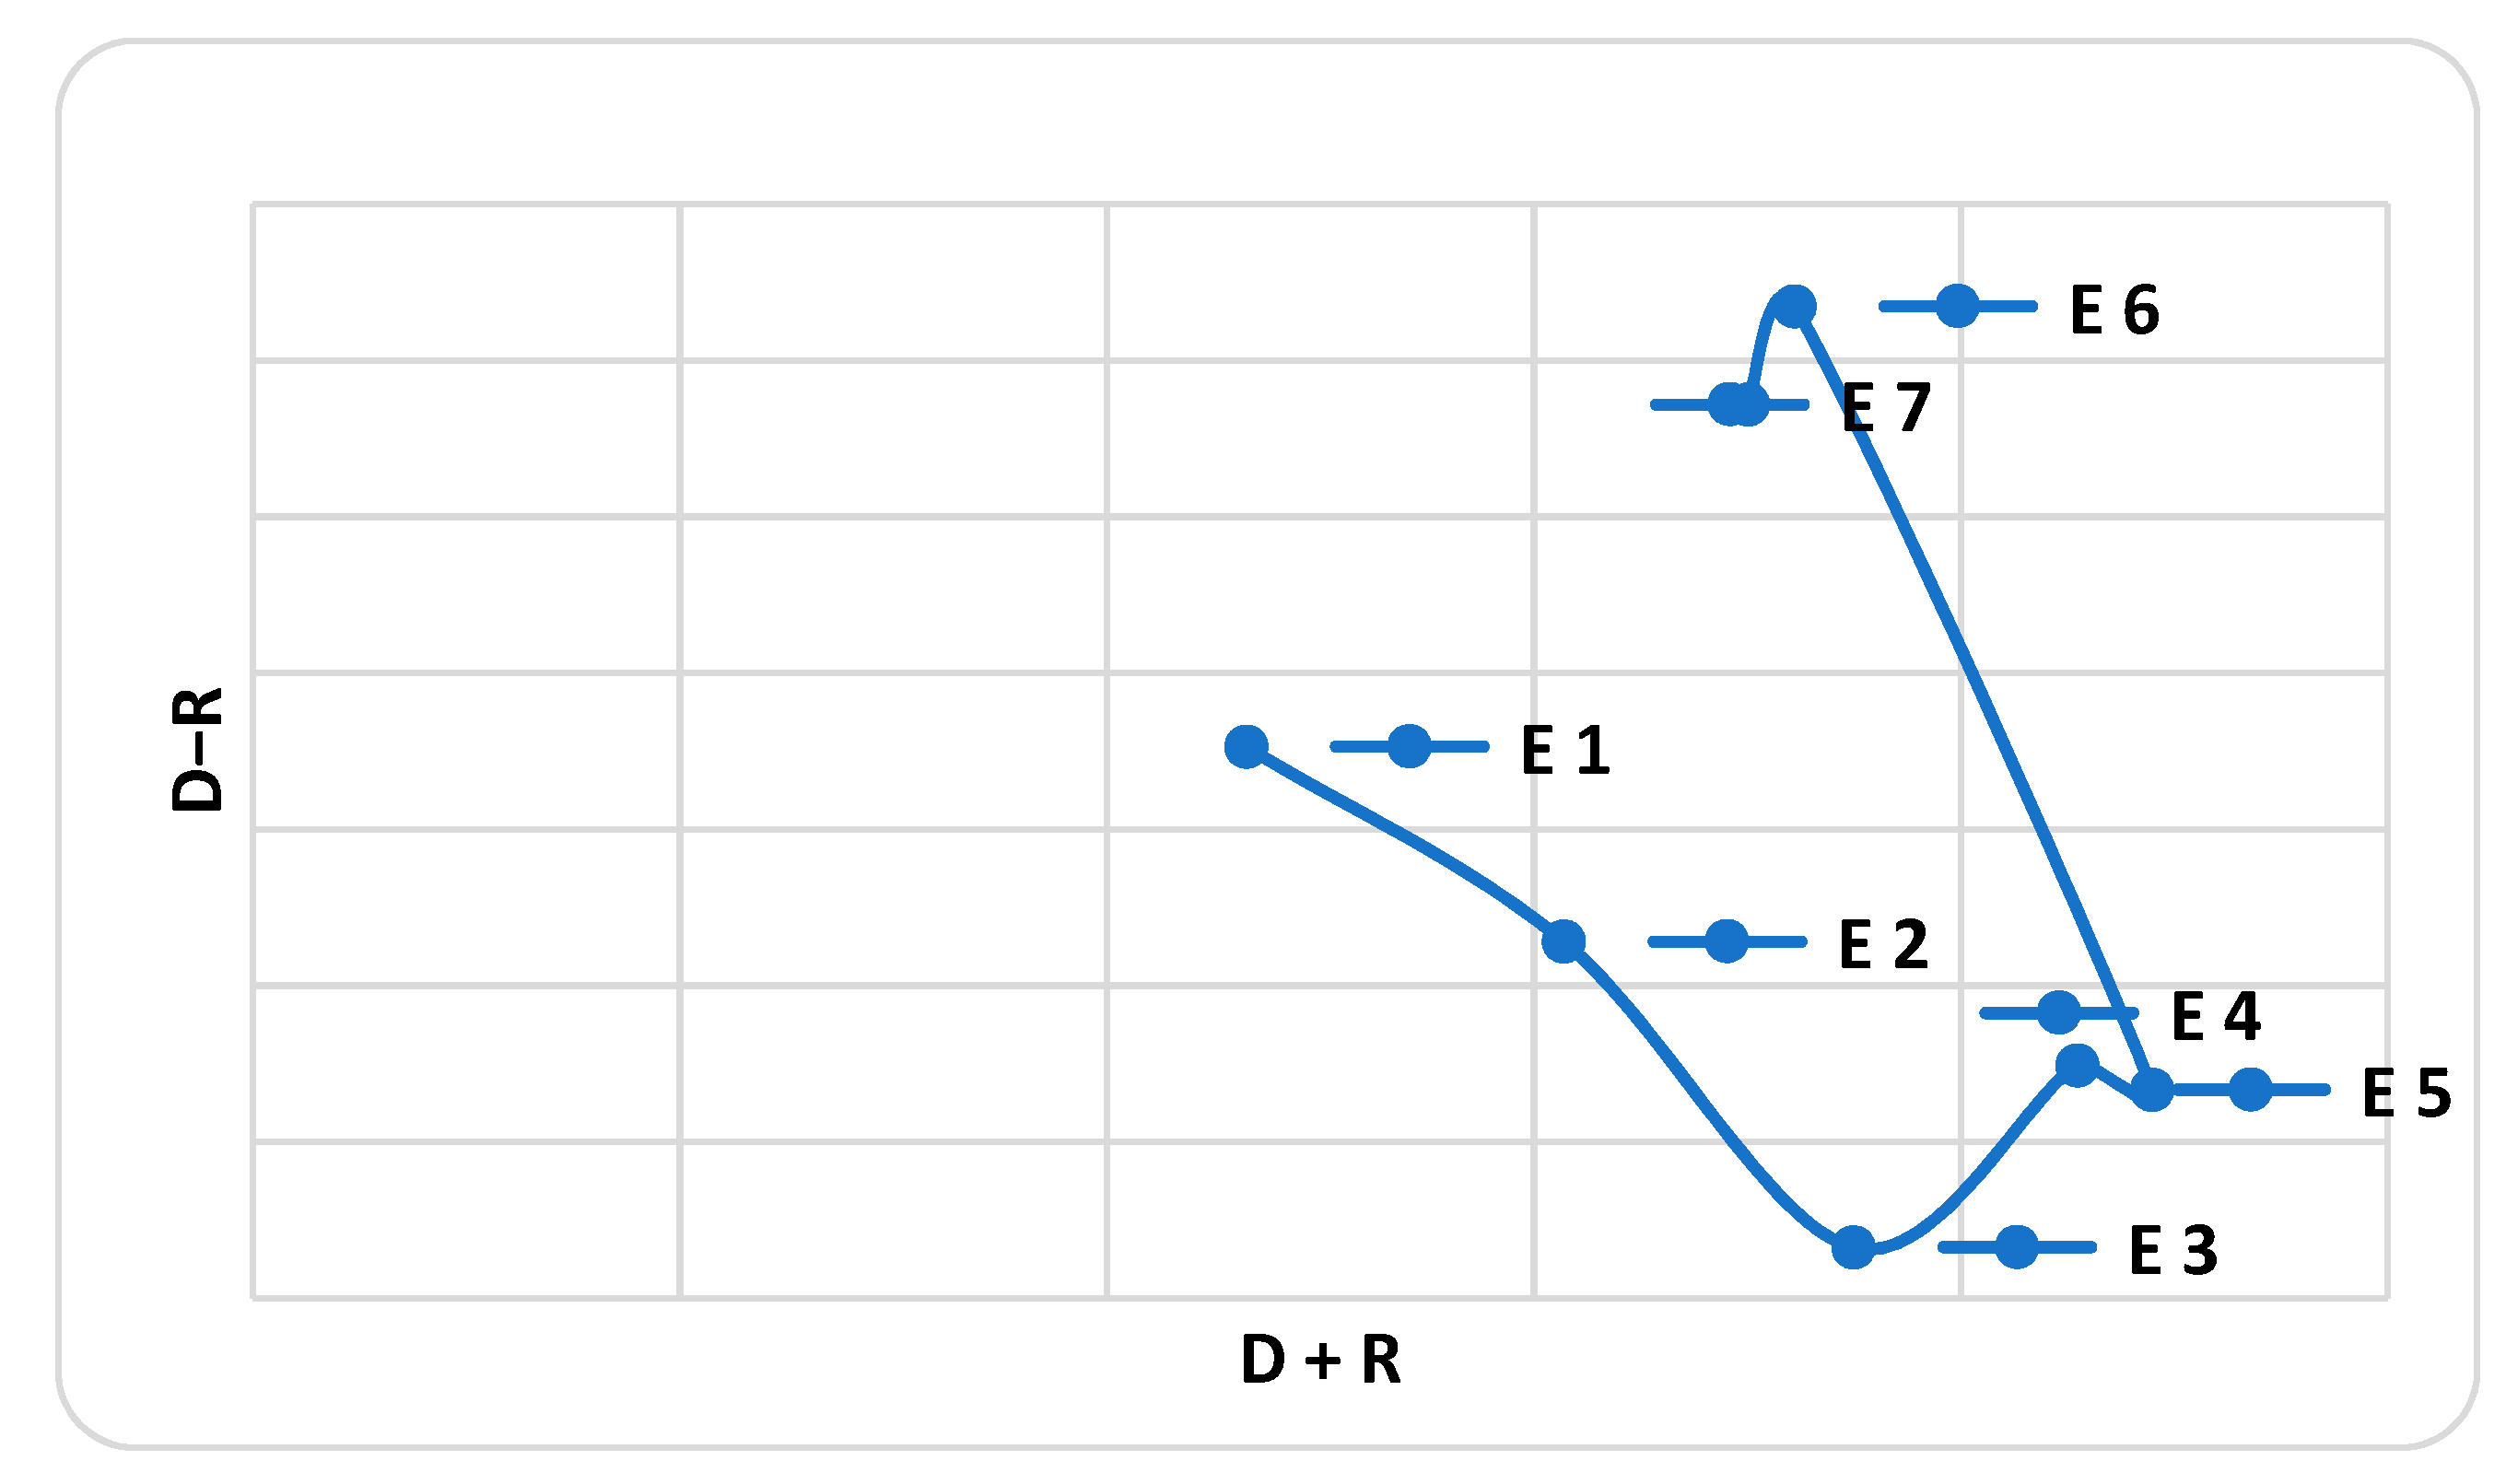
Finally, (D+R) and (D−R) values were plotted to obtain the causal diagram (Figure 3).
Inferences
The values of (D+R) and (D−R) were calculated and shown in Table 8. Further, in Table 9, the values of (D+R) were ranked, where value delivery to stakeholders (5) got the highest value of (D+R), followed by transparency (4), authenticity (3), measurement and evaluation strategies (6), customer as co-creator (7), quality of content (2), distribution and promotion strategy (1). The factors with higher values of (D+R) show higher prominence with the system. Similarly, the positive and negative values of (D−R), as shown in Table 10 categorize the factors into cause or effect groups. The factors with a positive value of (D−R) are categorized into cause group factors. The factors with a negative value of (D−R) are categorized into effect group factors.
In this study, measurement and evaluation strategies (6); and the customer as co-creator (7) got the higher positive values of (D−R), which shows that these two factors have a high impact on other factors. But the (D+R) value of both the factors is low, which may be accounted for low levels of ‘R’. The next factor with a positive but low value of (D−R) is distribution and promotion strategy (1), which shows that this factor doesn’t impact other factors much. Also, this factor has the least (D+R) value, which shows that the factor does not carry much prominence with the system.
Further, in this study, four factors got categorized into effect group factors due to their negative (D−R) values, where authenticity (3), emerged with the highest value of negative (D−R), which shows that other factors are greatly impacting this factor. The high value of (D+R) also shows that this factor has high prominence with the system. The next two factors with high values of negative (D−R) are value delivery to stakeholders (5) and transparency (4). This shows that these two factors are also impacted by other factors significantly. Also, both these factors have the highest value of (D+R), making them significant and connected to the system. The factor with a low value of negative (D−R) is the quality of the content (2), and the same as a low value for (D+R) as well, which makes the factor getting moderately impacted by other factors.
Based on the outcomes from both the models, viz. TISM and DEMATEL, most factors emerged common in both the models, in terms of impact creating or dependency. Like, value delivery to stakeholders (5) emerged as the most dependant factor as per TISM model, and as per DEMATEL approach also this factor emerged with high prominence with the system, due to high value of (D+R) and got categorized into effect group, due to negative value of (D−R). Similarly, as per the TISM model, measurement and evaluation strategies (6); and the customer as co-creator (7) emerged as strong driving forces. As per the DEMATEL approach, these factors emerged as cause group factors due to positive values (D−R).
Further, authenticity (3) and transparency (4) emerged as dependant forces in the TISM model and DEMATEL approach as well both of them emerged as effect group factors with negative values of (D−R). But, the factors viz. distribution and promotion strategy (1); and quality of the content (2) emerged as driving powers in TISM, while in DEMATEL, distribution and promotion strategy (1) emerged as weak cause group factor, and quality of the content (2) emerged as weak effect group factor. This may be attributed to either less value of ‘D’ or ‘R’ associated with these factors.
5. Discussion and Practical Implications
The results obtained in the study highlight the relationship between the identified factors and the strength of their relationships as well. It emerged that branded content needs to promise value delivery to all the stakeholders, but the value delivery depends on several other associated factors. Customers should be promoted to be co-creator for branded content to enhance the credibility and acceptability of branded content. At the same time, the company needs to be vigilant in devising the measurement and evaluation strategies for the branded content. The measurement and evaluation strategies adopted by the company and decisions to involve customers as co-creator, directly and indirectly, impact the authenticity and transparency of the content. Customer trust needs to be created by developing quality content and appropriate distribution and promotion of the content. Due to this reason, companies take due care in adopting content distribution and promotion strategies.
This study emphasizes the strategic adoption and implementation of branded content as a marketing tool for the new normal (post-COVID-19 era). The marketers need to evolve continuously to keep the consumers engaged and attached to their brands. They need to cover up the limitations of traditional marketing, find ways to impact and convey their business values and digital branded content can be a tool for that. Digital content producers and advertisers need to integrate to frame powerful, thematic messages which can enhance organic viewership and brand preference [64]. In 2020, those companies who have focused on the content and its delivery could engage with customers more effectively. This pandemic has changed the habits and buying behaviour of consumers. While sitting and buying at home, the consumer looks for product reviews and details more minutely. As per a Forbes’ study in 2016, the customers displayed 59% higher recalls than display advertising. The TISM tool applied in this study highlights that content distribution is very important for its success and in practical business life; this statement can be justified by looking at how ‘Facebook’ is giving success to the digital content distribution of companies. Apart from Facebook, marketers are exploring options of creating their advertisements and promoting through their apps like Apple news, google search and Snapchat, etc. [65]. This study emphasized the need for careful designing of quality branded content to ensure increased brand loyalty. Few studies in literature also substantiate this point whereby it is suggested to frame and deliver more informative content for high involvement product brands like a laptop; while for low involvement product brands like coffee, the content needs to be more attractive and attention seeker [9,27]. The way consumers perceive the usefulness and ease of use of content impact their attitude towards branded content, reflecting their purchase intentions further [26], which can benefit their brand if properly exploited by marketers establishment. Branded content can be a competitive tool for marketers in the coming days, wherein it can act as a bridge between the brand and the consumer relationship [66]. The younger generation mostly tends to escape from traditional advertising and feel connected with informative and entertaining promotions. There is always a quest for new content online which can be captured by branded content intelligently in the days to come.
6. Conclusions
Branded content is emerging as a subtle way of communicating about the brand with its users. The recent pandemic of COVID-19 has made consumers look towards online modes of buying, by choice or out of compulsion. Consumers now have to depend on online product or service reviews for making informed decisions. This is where the role of branded content pitches in. Marketers are innovating their ways to exploit the true worth of branded content as a robust marketing strategy. This study reflected the few factors that can enable branded content to be used as a robust marketing strategy. Authors have used the TISM and DEMATEL techniques to enable the strategic model framing of the identified enablers, to identify the appropriate way of approaching the enablers. This study outcome projected that branded content needs to provide value to different stakeholders, profit to the platform provider, increased sales to marketers, and genuine information to consumers. Value delivery again depends on the level of authenticity the content promises to the consumers. Marketing these days have become so vulnerable to mistrust and broken brand-consumer relationships. Stakeholders need transparency in content development and delivery. The quality of the branded content and the way it is delivered to the consumers make a huge difference to the success of this marketing strategy. The marketers, therefore, need to be very particular and focused on devising and implementing the measurement and evaluation strategies for the quality of the content and its delivery. The marketers need to draft the strategies depending on the type of product or service they are dealing with and the specific environment the brand is existing. Also, measuring the impact of branded content usage on the brand’s sales is equally essential for marketers. Various marketers are exploring the options of including consumers in their process of branded content development to enhance the value of branded content. This study reflects the importance of strategically approaching the concept of branded content so that stakeholders get the real worth of this much-needed strategy.
7. Limitations and Future Research Directions
Like every research, this study also has limitations, including the sample size of respondents used to finalize factors. With more responses, a mixed-method approach could have been adopted for getting deeper insights. In the future, a similar study may be carried out by adopting techniques like factor analysis, structural equation modelling, and neural networking. A combination of Fuzzy-MICMAC, Fuzzy-TISM, and Fuzzy-DEMATEL can also be adopted to cover wider linkages and relationship strengths. The way different forms of branded content related to marketing strategy is worth research. Also, sector-specific or consumer-specific studies may be conducted wherein branded content is discussed as a marketing tool for specific products or services.
Author Contributions
Conceptualization, S.S.; Formal analysis, S.S.; Investigation, R.S.M.; Methodology, S.S.; Validation, R.S.M.; Writing—original draft, S.S.; Writing—review & editing, R.S.M. Both authors have read and agreed to the published version of the manuscript.
Funding
No funding was received for conducting this study.
Institutional Review Board Statement
Not applicable.
Informed Consent Statement
Not applicable.
Data Availability Statement
Not applicable.
Acknowledgments
Authors are thankful to the School of Management, The NorthCap University, Gurugram 122017, India and the Department of Food Engineering, National Institute of Food Technology Entrepreneurship and Management (NIFTEM), Kundli, Sonepat 131028, India, for providing the necessary facilities to support this research work.
Conflicts of Interest
The authors declare no conflict of interest.
Appendix A

Table A1.
Interpretive Logic-Knowledge Base.
| Sr. No. | Variable No./Paired Comparisons | Yes/No | Reason/Logic |
|---|---|---|---|
| E1 Distribution and Promotion Strategy | |||
| 1 | E1-E2 | NO | |
| 2 | E2-E1 | NO | |
| 3 | E1-E3 | YES | Choice of platform/channel used supports content authenticity |
| 4 | E3-E1 | NO | |
| 5 | E1-E4 | YES | Choice of platform/channel used supports transparency |
| 6 | E4-E1 | NO | |
| 7 | E1-E5 | YES | Choice of platform/channel used supports value delivery |
| 8 | E5-E1 | NO | |
| 9 | E1-E6 | NO | |
| 10 | E6-E1 | YES | strong evaluation leads to better content marketing |
| 11 | E1-E7 | NO | |
| 12 | E7-E1 | YES | customer participates in decision making |
| E2 Quality of content | |||
| 13 | E2-E3 | YES | quality generates trust |
| 14 | E3-E2 | NO | |
| 15 | E2-E4 | YES | Transitive |
| 16 | E4-E2 | NO | |
| 17 | E2-E5 | YES | quality promises satisfaction |
| 18 | E5-E2 | NO | |
| 19 | E2-E6 | NO | |
| 20 | E6-E2 | YES | stringent evaluation helps in quality content |
| 21 | E2-E7 | NO | |
| 22 | E7-E2 | YES | Customer participates in relevant content generation |
| E3 Authenticity | |||
| 23 | E3-E4 | YES | Stakeholders will not hesitate in sharing authentic content |
| 24 | E4-E3 | YES | more transparency ensures authentic content to be shared |
| 25 | E3-E5 | YES | Satisfied stakeholders |
| 26 | E5-E3 | NO | |
| 27 | E3-E6 | NO | |
| 28 | E6-E3 | YES | strong evaluation leads to better authenticity |
| 29 | E3-E7 | NO | |
| 30 | E7-E3 | YES | Transitive |
| E4 Transparency | |||
| 31 | E4-E5 | YES | Satisfied stakeholders |
| 32 | E5-E4 | NO | |
| 33 | E4-E6 | NO | |
| 34 | E6-E4 | YES | strong evaluation leads to more transparency |
| 35 | E4-E7 | NO | |
| 36 | E7-E4 | YES | more involvement |
| E5 Value Delivery to stakeholders | |||
| 37 | E5-E6 | NO | |
| 38 | E6-E5 | YES | Transitive |
| 39 | E5-E7 | NO | |
| 40 | E7-E5 | YES | Customer feel associated and gets value |
| E6 Measurement and evaluation strategies | |||
| 41 | E6-E7 | NO | |
| 42 | E7-E6 | NO | |
Appendix B
Table A2.
Respondent details of Questionnaire.
| Sr. No | Description | Details |
|---|---|---|
| 1. | Total number of respondents | 83 |
| 2. | Level of education | Undergraduate and above |
| 3. | Occupation | Homemaker/student/employee |
Few major Questions:
- Q. 1. Do you prefer online shopping?
- Q. 2. Have u started buying online, during the COVID-19 duration?
- Q. 3. If No, what restricts you?
- Q. 4. If yes, how is your experience?
- Q. 5. While going for Online shopping, to how much extent do the content and reviews etc available on the website, influence your choice? Please rate on the given scale.
- Q. 6. Please rate the below-mentioned variables on the scale of importance for the success of branded content for sales promotion:
| Sr. No. | Variables | Very Important | Important | Can’t Say | Not So Important | Completely of No Importance |
| i. | The strategy for distribution and promotion of the content | |||||
| ii. | The type of technologies used for creating the branded content | |||||
| iii. | The stage of the product for which content is created | |||||
| iv. | The content needs to be trustworthy (authenticate) | |||||
| v. | How much established the brand is | |||||
| vi. | How much transparent the content is | |||||
| vii. | Content quality needs to be good | |||||
| viii. | Content is paid one by the brand or is it free | |||||
| ix. | Value delivery to all the stakeholders (including you as a customer) | |||||
| x. | Whether the content relates well with traditional advertising | |||||
| xi. | Sufficient choices availability | |||||
| xii. | How much measurable the content is | |||||
| xiii. | Has the content evolved with time | |||||
| xiv. | You as a co-creator for the content |
References
- Batra, D.; Singh, N. Marketing in the Era of Post-Covid Digitization—What Will a CMOs New Arsenal Be? 2020. Available online: https://www.businessinsider.in/advertising/brands/article/marketing-in-the-era-of-post-covid-digitization-what-will-a-cmos-new-arsenal-be/articleshow/78892267.cms (accessed on 24 January 2021).
- Kamble, S.S.; Mor, R.S. Food supply chains and COVID-19: A way forward. Agron. J. 2021, 113, 2195–2197. [Google Scholar] [CrossRef]
- Asmussen, B.; Wider, S.; Stevenson, N.; Whitehead, E. Defining Branded Content for the Digital Age: The Industry Experts’ Views on Branded Content as a New Marketing Communications. Oxford Brookes University, 2016. Available online: www.thebcma.info/wp-content/uploads/2016/07/BCMA-Research-Report_FINAL.pdf (accessed on 20 April 2020).
- Aguiar, A.C.W.C.; Steinhäuser, V. Branded Content-Strategic Marketing Tool and its Impact on Consumer Branded Content-Ferramenta Estratégica de Marketing e seuImpacto no Consumidor. Braz. J. Mark. Res. Opin. Media 2019, 12, 138–154. [Google Scholar]
- Raju, A. Can reviewer reputation and webcare content affect perceived fairness? J. Res. Interact. Mark. 2019, 13, 464–476. [Google Scholar] [CrossRef]
- Harp, E.A. Best Practices in Digital Branded Content for Generation Y: Developing Effective Campaigns in the New Era of Advertising. 2012. Available online: https://repositories.lib.utexas.edu/handle/2152/19954 (accessed on 12 June 2020).
- Bhatia, V. Drivers and barriers of permission-based marketing. J. Res. Interact. Mark. 2020, 14, 51–70. [Google Scholar] [CrossRef]
- Waqas, M.; Hamzah, Z.L.; Salleh, N.A.M. Customer experience with the branded content: A social media perspective. Online Inf. Rev. 2021. [Google Scholar] [CrossRef]
- Lou, C.; Xie, Q. Something social, something entertaining? How digital content marketing augments consumer experience and brand loyalty. Int. J. Advert. 2021, 40, 376–402. [Google Scholar] [CrossRef]
- Pandey, N. Digital marketing strategies for firms in the post-covid-19 era: Insights and future directions. In The New Normal Challenges of Managerial Business, Social and Ecological Systems in the Post Covid-19 Era; Bloomsbury Prime: London, UK, 2021. [Google Scholar]
- Graessley, S.; Horak, J.; Kovacova, M.; Valaskova, K.; Poliak, M. Consumer Attitudes and Behaviors in the Technology-Driven Sharing Economy: Motivations for Participating in Collaborative Consumption. J. Self-Gov. Manag. Econ. 2019, 7, 25. [Google Scholar] [CrossRef] [Green Version]
- Hollowell, J.C.; Rowland, Z.; Kliestik, T.; Kliestikova, J.; Dengov, V.V. Customer Loyalty in the Sharing Economy Platforms: How Digital Personal Reputation and Feedback Systems Facilitate Interaction and Trust between Strangers. J. Self-Gov. Manag. Econ. 2019, 7, 13–18. [Google Scholar] [CrossRef] [Green Version]
- Popescu, G.H.; Ciurlău, F.C. Making Decisions in Collaborative Consumption: Digital Trust and Reputation Systems in the Sharing Economy. J. Self-Gov. Manag. Econ. 2019, 7, 7–12. [Google Scholar]
- Graham, K.W.; Wilder, K.M. Consumer-brand identity and online advertising message elaboration. J. Res. Interact. Mark. 2020, 14, 111–132. [Google Scholar] [CrossRef]
- Mircică, N. Restoring Public Trust in Digital Platform Operations: Machine Learning Algorithmic Structuring of Social Media Content. Rev. Contemp. Philos. 2020, 19, 85–91. [Google Scholar] [CrossRef]
- Drugău-Constantin, A.L. Is consumer cognition reducible to neurophysiological functioning? Econ. Manag. Financ. Mark. 2019, 14, 9–15. [Google Scholar]
- Barreda, A.A.; Bilgihan, A.; Nusair, K.; Okumus, F. Generating brand awareness in Online Social Networks. Comput. Hum. Behav. 2015, 50, 600–609. [Google Scholar] [CrossRef]
- Pop, R.A.; Săplăcan, Z.; Dabija, D.-C.; Alt, M.-A. The impact of social media influencers on travel decisions: The role of trust in consumer decision journey. Curr. Issues Tour. 2021. [Google Scholar] [CrossRef]
- Miliopoulou, G.-Z. Revisiting product classification to examine content marketing practices. J. Res. Interact. Mark. 2019, 13, 492–508. [Google Scholar] [CrossRef]
- Vazquez, E.E. Effects of enduring involvement and perceived content vividness on digital engagement. J. Res. Interact. Mark. 2019, 14, 1–16. [Google Scholar] [CrossRef]
- Lim, H.; Childs, M. Visual storytelling on Instagram: Branded photo narrative and the role of telepresence. J. Res. Interact. Mark. 2020, 14, 33–50. [Google Scholar] [CrossRef]
- Lou, C.; Yuan, S. Influencer Marketing: How Message Value and Credibility Affect Consumer Trust of Branded Content on Social Media. J. Interact. Advert. 2019, 19, 58–73. [Google Scholar] [CrossRef]
- Bratu, S. Can social media influencers shape corporate brand reputation? Online followers’ trust, value creation, and purchase intentions. Rev. Contemp. Philos. 2019, 18, 157–163. [Google Scholar]
- Holt, D. Branding in the age of social media. Harv. Bus. Rev. 2016, 94, 40–50. [Google Scholar]
- Mwali, K. Branded Content Integration, Consumer Attitudes and Purchase Intent in South Africa. Master’s Thesis, University of the Witwatersrand, Johannesburg, South Africa, 2016. [Google Scholar]
- Sinthamrong, P.; Rompho, N. Factors affecting attitudes and purchase intentions toward branded content on webisodes. J. Manag. Policy Pract. 2015, 16, 64. [Google Scholar]
- Lou, C.; Xie, Q.; Feng, Y.; Kim, W. Does non-hard-sell content work? Leveraging the value of branded content marketing in brand building. J. Prod. Brand Manag. 2019, 28, 773–786. [Google Scholar] [CrossRef]
- Sabate, F.; Berbegal-Mirabent, J.; Cañabate, A.; Lebherz, P.R. Factors influencing popularity of branded content in Facebook fan pages. Eur. Manag. J. 2014, 32, 1001–1011. [Google Scholar] [CrossRef]
- Moros, M. How do different digital channels of content marketing affect brand loyalty: A user-centric exploratory research. Bachelor’s Thesis, Panteion University of Social and Political Sciences, Athens, Greece, 2021. [Google Scholar]
- Ashley, C.; Tuten, T. Creative Strategies in Social Media Marketing: An Exploratory Study of Branded Social Content and Consumer Engagement. Psychol. Mark. 2015, 32, 15–27. [Google Scholar] [CrossRef]
- Balan, C. Nike on Instagram: Themes of Branded Content and Their Engagement Power. In CBU International Conference Proceedings; CBU Research Institute: Prague, Czech Republic, 2017; Volume 5, pp. 13–18. [Google Scholar]
- Feng, S.; Ots, M. Content marketing: A review of academic literature and future research directions. In Proceedings of the Emma Conference, Hamburg, Germany, 28–29 May 2015. [Google Scholar]
- Eigenraam, A.W.; Eelen, J.; Verlegh, P.W. Let Me Entertain You? The Importance of Authenticity in Online Customer Engagement. J. Interact. Mark. 2021, 54, 53–68. [Google Scholar] [CrossRef]
- Ikonen, P.; Luoma-aho, V.; Bowen, S.A. Transparency for sponsored content: Analysing codes of ethics in public relations, marketing, advertising and journalism. Int. J. Strateg. Commun. 2017, 11, 165–178. [Google Scholar] [CrossRef] [Green Version]
- Carvajal, M.; Barinagarrementeria, I. The Creation of Branded Content Teams in Spanish News Organizations and Their Implications for Structures, Professional Roles and Ethics. Digit. J. 2021. [Google Scholar] [CrossRef]
- Edelson, L.; Chuang, J.; Franklin Fowler, E.; Franz, M.; Ridout, T.N. Universal Digital Ad Transparency. Available online: https://ssrn.com/abstract=3898214 (accessed on 25 August 2021).
- Balint, A. Branded Reality: The Rise of Embedded Branding (‘Branded Content’): Implications for the Cultural Public Sphere. Ph.D. Thesis, Goldsmiths, University of London, London, UK, 2016. [Google Scholar]
- Kendall, L. Put a Price on Your Content: Measuring the Value of Content and Branded Content. Available online: http://kendallcopywriting.co.uk/wp/wp-content/uploads/2012/05/Put_a_price_on_your_content_measuring_the_value_of_content_and_branded_content.pdf (accessed on 12 June 2020).
- Hajli, N.; Shanmugam, M.; Papagiannidis, S.; Zahay, D.; Richard, M.-O. Branding co-creation with members of online brand communities. J. Bus. Res. 2017, 70, 136–144. [Google Scholar] [CrossRef] [Green Version]
- Koivisto, E.; Mattila, P. Extending the luxury experience to social media–User-Generated Content co-creation in a branded event. J. Bus. Res. 2018, 117, 570–578. [Google Scholar] [CrossRef]
- Meilhan, D. Customer Value Co-Creation Behavior in the Online Platform Economy. J. Self-Gov. Manag. Econ. 2019, 7, 19–24. [Google Scholar] [CrossRef] [Green Version]
- Baliga, A.J.; Chawla, V.; Sunder, M.V.; Kumar, R. Barriers to service recovery in B2B markets: A TISM approach in the context of IT-based services. J. Bus. Ind. Mark. 2021, 36, 1452–1473. [Google Scholar] [CrossRef]
- Deshmukh, A.K.; Mohan, A. Analysis of Indian retail demand chain using total interpretive modeling. J. Model. Manag. 2017, 12, 322–348. [Google Scholar] [CrossRef]
- Lianto, B.; Dachyar, M.; Soemardi, T.P. Modelling the continuous innovation capability enablers in Indonesia’s manufacturing industry. J. Model. Manag. 2020. [Google Scholar] [CrossRef]
- Subadhra, R.; Suresh, M. Modelling of factors influencing brand sacralisation: A TISM approach. Mater. Today Proc. 2021. [Google Scholar] [CrossRef]
- Dehghan, A.; Mohammadkazemi, R.; Talebi, K.; Davari, A. Designing a Model of Empowerment for Small and Medium-Sized Businesses Knowledge-Based with a DEMATEL Approach. Iran. J. Manag. Sci. 2021, 16, 1–16. [Google Scholar]
- Priya, S.S.; Priya, M.S.; Jain, V.; Dixit, S.K. An assessment of government measures in combatting COVID-19 using ISM and DEMATEL modelling. Benchmark. Int. J. 2021. [Google Scholar] [CrossRef]
- Shokouhyar, S.; Dehkhodaei, A.; Amiri, B. Toward customer-centric mobile phone reverse logistics: Using the DEMATEL approach and social media data. Kybernetes 2021. [Google Scholar] [CrossRef]
- Dahiya, S.; Panghal, A.; Sindhu, S.; Siwach, P. Organic food women entrepreneurs-TISM approach for challenges. J. Enterp. Commun. People Places Glob. Econ. 2021, 15, 114–136. [Google Scholar] [CrossRef]
- Sushil. Multi-criteria valuation of flexibility initiatives using integrated TISM–IRP with a big data framework. Prod. Plan. Control. 2017, 28, 999–1010. [Google Scholar] [CrossRef]
- Dwivedi, A.; Madaan, J. A hybrid approach for modeling the key performance indicators of information facilitated product recovery system. J. Model. Manag. 2020, 15, 933–965. [Google Scholar] [CrossRef]
- Jena, J.; Sidharth, S.; Thakur, L.S.; Pathak, D.K.; Pandey, V. Total Interpretive Structural Modeling (TISM): Approach and application. J. Adv. Manag. Res. 2017, 14, 162–181. [Google Scholar] [CrossRef]
- Mor, R.S.; Bhardwaj, A.; Singh, S. Benchmarking the interactions among barriers in Dairy supply chain: An ISM approach. Int. J. Qual. Res. 2018, 12, 385–404. [Google Scholar] [CrossRef]
- Lamba, K.; Singh, S.P. Modeling big data enablers for operations and supply chain management. Int. J. Logist. Manag. 2018, 29, 629–658. [Google Scholar] [CrossRef]
- Chen, C.A. Using DEMATEL method for medical tourism development in Taiwan. Am. J. Tour. Res. 2012, 1, 26–32. [Google Scholar]
- Chiu, Y.-J.; Chen, H.-C.; Tzeng, G.-H.; Shyu, J.Z. Marketing strategy based on customer behaviour for the LCD-TV. Int. J. Manag. Decis. Mak. 2006, 7, 143. [Google Scholar] [CrossRef]
- Lin, S.M. Marketing mix (7P) and performance assessment of western fast food industry in Taiwan: An application by associating DEMATEL and ANP. Afr. J. Bus. Manag. 2011, 5, 10634–10644. [Google Scholar]
- Susanty, A.; Puspitasari, N.B.; Prastawa, H.; Renaldi, S.V. Exploring the best policy scenario plan for the dairy supply chain: A DEMATEL approach. J. Model. Manag. 2021, 16, 240–266. [Google Scholar] [CrossRef]
- Wang, Y.-L.; Tzeng, G.-H. Brand marketing for creating brand value based on a MCDM model combining DEMATEL with ANP and VIKOR methods. Expert Syst. Appl. 2012, 39, 5600–5615. [Google Scholar] [CrossRef]
- Maheshwari, P.; Seth, N.; Gupta, A.K. An interpretive structural modeling approach to advertisement effectiveness in the Indian mobile phone industry. J. Model. Manag. 2018, 13, 190–210. [Google Scholar] [CrossRef]
- Medalla, M.E.; Yamagishi, K.; Tiu, A.M.; Tanaid, R.A.; Abellana, D.P.M.; Caballes, S.A.; Jabilles, E.M.; Himang, C.; Bongo, M.; Ocampo, L. Modeling the hierarchical structure of secondhand clothing buying behaviour antecedents of millennials. J. Model. Manag. 2020, 15, 1679–1708. [Google Scholar] [CrossRef]
- Ghatak, R.R. Barriers analysis for customer resource contribution in value co-creation for service industry using interpretive structural modeling. J. Model. Manag. 2020, 15, 1137–1166. [Google Scholar] [CrossRef]
- Sheoran, M.; Kumar, D. Modelling the enablers of sustainable consumer behaviour towards electronic products. J. Model. Manag. 2020, 15, 1543–1565. [Google Scholar] [CrossRef]
- Yadav, M. Brand Integrated Content on Digital Media An Untapped Opportunity for Marketers in the Post COVID World. Available online: http://www.businessworld.in/article/Brand-Integrated-Content-on-Digital-Media-an-untapped-opportunity-for-marketers-in-the-post-COVID-world-/01-09-2020-315460/ (accessed on 19 December 2020).
- Berry, E. The Changing Face of Branded Content. 2018. Available online: https://www.forbes.com/sites/forbesagencycouncil/2018/05/18/the-changing-face-of-branded-content/?sh=6131a40c4c2d (accessed on 15 October 2020).
- Bezbaruah, S.; Trivedi, J. Branded Content: A Bridge Building Gen Z’s Consumer–Brand Relationship. Vision 2020, 24, 300–309. [Google Scholar] [CrossRef]
Figure 1.
MICMAC Analysis.

Figure 2.
TISM Model.

Figure 3.
The Causal diagram.

Table 1.
Summary of Literature Support for the Identified Factors.
| Sr. No | Factors | Literature Support |
|---|---|---|
| 1 | Content distribution and promotion strategy | [4,6,25,27,28,29] |
| 2 | Quality of content | [6,19,20,22,27,28,30,31] |
| 3 | Authenticity | [32] |
| 4 | Transparency | [34] |
| 5 | Value delivery to stakeholders | [3,37] |
| 6 | Measurement and evolution of branded content | [6,38] |
| 7 | Customer as co-creator | [4,6,39,40] |
Table 2.
Initial Reachability Matrix.
| (i,j) | 1 | 2 | 3 | 4 | 5 | 6 | 7 |
|---|---|---|---|---|---|---|---|
| 1 | 1 | 0 | 1 | 1 | 1 | 0 | 0 |
| 2 | 0 | 1 | 1 | 0 | 1 | 0 | 0 |
| 3 | 0 | 0 | 1 | 1 | 1 | 0 | 0 |
| 4 | 0 | 0 | 1 | 1 | 1 | 0 | 0 |
| 5 | 0 | 0 | 0 | 0 | 1 | 0 | 0 |
| 6 | 1 | 1 | 1 | 1 | 0 | 1 | 0 |
| 7 | 1 | 1 | 0 | 1 | 1 | 0 | 1 |
Table 3.
Final Reachability Matrix(Transitivity).
| (i,j) | 1 | 2 | 3 | 4 | 5 | 6 | 7 | Driving Power |
|---|---|---|---|---|---|---|---|---|
| 1 | 1 | 0 | 1 | 1 | 1 | 0 | 0 | 4 |
| 2 | 0 | 1 | 1 | 1 * | 1 | 0 | 0 | 4 |
| 3 | 0 | 0 | 1 | 1 | 1 | 0 | 0 | 3 |
| 4 | 0 | 0 | 1 | 1 | 1 | 0 | 0 | 3 |
| 5 | 0 | 0 | 0 | 0 | 1 | 0 | 0 | 1 |
| 6 | 1 | 1 | 1 | 1 | 1 * | 1 | 0 | 6 |
| 7 | 1 | 1 | 1 * | 1 | 1 | 0 | 1 | 6 |
| Dependance | 3 | 3 | 6 | 6 | 7 | 1 | 1 |
* Transitivity.
Table 4.
Consolidated Level of Factors.
| Factors | Reachability Set | Antecedent Set | Intersection Set | Level |
|---|---|---|---|---|
| 1 | 1,3,4,5 | 1,6,7 | 1 | 3 |
| 2 | 2,3,4,5 | 2,6,7 | 2 | 3 |
| 3 | 3,4,5 | 1,2,3,4,6,7 | 3,4 | 2 |
| 4 | 3,4,5 | 1,2,3,4,6,7 | 3,4 | 2 |
| 5 | 1 | 1,2,3,4,5,6,7 | 1 | 1 |
| 6 | 1,2,3,4,5,6 | 6 | 6 | 4 |
| 7 | 1,2,3,4,5,7 | 7 | 7 | 4 |
Table 5.
Direct Relation Matrix (D).
| (i,j) | 1 | 2 | 3 | 4 | 5 | 6 | 7 |
|---|---|---|---|---|---|---|---|
| 1 | 0 | 0 | 4 | 4 | 4 | 0 | 0 |
| 2 | 0 | 0 | 3 | 4 | 4 | 1 | 0 |
| 3 | 0 | 1 | 0 | 3 | 4 | 1 | 1 |
| 4 | 2 | 3 | 4 | 0 | 4 | 1 | 2 |
| 5 | 1 | 3 | 4 | 4 | 0 | 2 | 2 |
| 6 | 4 | 4 | 4 | 4 | 4 | 0 | 4 |
| 7 | 3 | 4 | 4 | 4 | 4 | 3 | 0 |
0 = No influence; 1 = Low influence; 2 = Medium influence; 3 = High influence; 4 = Very High influence.
Table 6.
Normalized direct relation matrix (N).
| (i,j) | 1 | 2 | 3 | 4 | 5 | 6 | 7 |
|---|---|---|---|---|---|---|---|
| 1 | 0.00000 | 0.00000 | 0.16667 | 0.16667 | 0.16667 | 0.00000 | 0.00000 |
| 2 | 0.00000 | 0.00000 | 0.12500 | 0.16667 | 0.16667 | 0.04167 | 0.00000 |
| 3 | 0.00000 | 0.04167 | 0.00000 | 0.12500 | 0.16667 | 0.04167 | 0.04167 |
| 4 | 0.08333 | 0.12500 | 0.16667 | 0.00000 | 0.16667 | 0.04167 | 0.08333 |
| 5 | 0.04167 | 0.12500 | 0.16667 | 0.16667 | 0.00000 | 0.08333 | 0.08333 |
| 6 | 0.16667 | 0.16667 | 0.16667 | 0.16667 | 0.16667 | 0.00000 | 0.16667 |
| 7 | 0.12500 | 0.16667 | 0.16667 | 0.16667 | 0.16667 | 0.12500 | 0.00000 |
Table 7.
Total relation matrix (T).
| (i,j) | 1 | 2 | 3 | 4 | 5 | 6 | 7 |
|---|---|---|---|---|---|---|---|
| 1 | 0.06131 | 0.11857 | 0.32363 | 0.31631 | 0.32787 | 0.06875 | 0.07862 |
| 2 | 0.07056 | 0.12810 | 0.29613 | 0.32584 | 0.33642 | 0.11172 | 0.08615 |
| 3 | 0.06824 | 0.15930 | 0.16650 | 0.27339 | 0.31505 | 0.10733 | 0.11553 |
| 4 | 0.16357 | 0.27125 | 0.38438 | 0.23748 | 0.39407 | 0.13350 | 0.17423 |
| 5 | 0.13603 | 0.28087 | 0.39091 | 0.38698 | 0.25808 | 0.17170 | 0.18199 |
| 6 | 0.29029 | 0.38800 | 0.50638 | 0.50215 | 0.52024 | 0.13855 | 0.29606 |
| 7 | 0.24202 | 0.36991 | 0.47674 | 0.47292 | 0.48995 | 0.23829 | 0.13982 |
Table 8.
The sum of influences (given to and received by) the factors.
| Factors | D | R | (D+R) | (D−R) |
|---|---|---|---|---|
| 1 | 1.2950615 | 1.032015 | 2.327076437 | 0.26304664 |
| 2 | 1.3549088 | 1.715992 | 3.070900834 | −0.361083279 |
| 3 | 1.205329 | 2.544663 | 3.749992006 | −1.339334033 |
| 4 | 1.7584737 | 2.515068 | 4.273541299 | −0.756593956 |
| 5 | 1.8065666 | 2.641663 | 4.448229307 | −0.835096164 |
| 6 | 2.6416627 | 0.969843 | 3.61150587 | 1.671819602 |
| 7 | 2.4296369 | 1.072396 | 3.502032547 | 1.35724119 |
Table 9.
The relationship strength rankings.
| Ranks | Factor | (D+R) |
|---|---|---|
| 1 | 5 | 4.448229 |
| 2 | 4 | 4.273541 |
| 3 | 3 | 3.749992 |
| 4 | 6 | 3.611506 |
| 5 | 7 | 3.502033 |
| 6 | 2 | 3.070901 |
| 7 | 1 | 2.327076 |
Table 10.
The relation type and relative rankings.
| Ranks | Cause-Group Factor (+ve Value of D−R) | (D−R) |
| 1 | 6 | 1.671819602 |
| 2 | 7 | 1.35724119 |
| 3 | 1 | 0.26304664 |
| Ranks | Effect-Group Factor (−ve Value of D−R) | (D−R) |
| 1 | 3 | −1.339334033 |
| 2 | 5 | −0.835096164 |
| 3 | 4 | −0.756593956 |
| 4 | 2 | −0.361083279 |
Publisher’s Note: MDPI stays neutral with regard to jurisdictional claims in published maps and institutional affiliations. |
© 2021 by the authors. Licensee MDPI, Basel, Switzerland. This article is an open access article distributed under the terms and conditions of the Creative Commons Attribution (CC BY) license (https://creativecommons.org/licenses/by/4.0/).
Share and Cite
MDPI and ACS Style
Sindhu, S.; Mor, R.S. Modelling the Enablers for Branded Content as a Strategic Marketing Tool in the COVID-19 Era. Systems 2021, 9, 64. https://0-doi-org.brum.beds.ac.uk/10.3390/systems9030064
AMA Style
Sindhu S, Mor RS. Modelling the Enablers for Branded Content as a Strategic Marketing Tool in the COVID-19 Era. Systems. 2021; 9(3):64. https://0-doi-org.brum.beds.ac.uk/10.3390/systems9030064
Chicago/Turabian StyleSindhu, Shilpa, and Rahul S Mor. 2021. "Modelling the Enablers for Branded Content as a Strategic Marketing Tool in the COVID-19 Era" Systems 9, no. 3: 64. https://0-doi-org.brum.beds.ac.uk/10.3390/systems9030064
Note that from the first issue of 2016, this journal uses article numbers instead of page numbers. See further details here.