
Causal Loop Diagramming of Socioeconomic Impacts of COVID-19: State-of-the-Art, Gaps and Good Practices


1
Advancing Systems Analysis Program, International Institute for Applied Systems Analysis (IIASA), Schlossplatz 1, 2361 Laxenburg, Austria
2
Faculty of Computational Mathematics and Cybernetics, Lomonosov Moscow State University, GSP-1, Leninskie Gory, 119991 Moscow, Russia
*
Author to whom correspondence should be addressed.
Systems 2021, 9(3), 65; https://0-doi-org.brum.beds.ac.uk/10.3390/systems9030065
Submission received: 30 July 2021
/
Revised: 26 August 2021
/
Accepted: 30 August 2021
/
Published: 2 September 2021
(This article belongs to the Special Issue Life in the Time of a Pandemic: Social, Economic, Health and Environmental Impacts of COVID-19—Systems Approach Study)
Abstract
:The complexity, multidimensionality, and persistence of the COVID-19 pandemic have prompted both researchers and policymakers to turn to transdisciplinary methods in dealing with the wickedness of the crisis. While there are increasing calls to use systems thinking to address the intricacy of COVID-19, examples of practical applications of systems thinking are still scarce. We revealed and reviewed eight studies which developed causal loop diagrams (CLDs) to assess the impact of the COVID-19 pandemic on a broader socioeconomic system. We find that major drivers across all studies are the magnitude of the infection spread and government interventions to curb the pandemic, while the most impacted variables are public perception of the pandemic and the risk of infection. The reviewed COVID-19 CLDs consistently exhibit certain complexity patterns, for example, they contain a higher number of two- and three-element feedback loops than comparable random networks. However, they fall short in representing linear complexity such as multiple causes and effects, as well as cascading impacts. We also discuss good practices for creating and presenting CLDs using the reviewed diagrams as illustration. We suggest that increasing transparency and rigor of the CLD development processes can help to overcome the lack of systems thinking applications to address the challenges of the COVID-19 crisis.
1. Introduction
Despite a significant progress on vaccination, with almost four billion vaccine doses administered, the daily number of new COVID-19 cases worldwide is still around the 500,000 mark, and the daily number of deaths is close to 10,000 as of late July 2021 [1]. Furthermore, various new mutations of the virus, an uneven distribution of vaccines across different countries, the unwillingness of large parts of the populations in some countries to receive vaccination, as well as other factors contribute to the persistence of the COVID-19 crisis as the most pressing issue globally [2].
The COVID-19 pandemic is not only a grand challenge for the public health system, but it has also affected virtually all areas of human life. The spread of the virus, as well as various mitigation and adaptation measures have had a widespread effect on economic activity, job security, social relations, mental health, and trust in others and institutions [3]. This makes the challenge of “getting back to normal life” truly multi-dimensional and calls for an interdisciplinary approach [4]. However, multiple and potentially lagged interdependencies between various components of the affected systems are difficult to oversee and comprehend by the human brain in the absence of special tools, while the lack of a holistic perspective increases the risks of unintended adverse consequences [5,6]. Systems thinking has been suggested to unravel this challenge by accounting for essential links and feedback loops between issues that both scientists and policymakers tend to consider in isolation, creating a shared understanding of the problem and identifying potential leverage points [7,8].
Some scholars responded to this call advocating the use of systems thinking in a rather general sense [9,10,11], while others came up with some concrete examples of the application of systems thinking, usually through employing causal loop diagrams [2,4,12,13,14,15,16] or system dynamic models [17,18,19].
Causal loop diagramming (also termed systems mapping) is a principal qualitative system thinking tool used both inside academia and for communicating with policymakers and the general public [20]. Causal loop diagrams (CLDs) constitute a schematic description of the considered system depicting its components and the (causal) relations between them. Components are connected by directed links. Each link represents an impact (causal influence) of one component on another. The impact can be positive, in which case an increase/decrease of the state of the impacting component leads to an increase/decrease of the state of the impacted component, or negative, in which case an increase/decreases of the state of the impacting component leads to the opposite change of the state of the impacted component, i.e., a decrease/increase. CLDs are useful for formalizing mental models of individuals and groups, rapid identification of the possible drivers of the considered system’s dynamics, and communicating feedback and archetypal structures in the considered system [20]. CLDs can be used as a standalone qualitative modeling tool or as a step toward developing a quantitative simulation, e.g., a system dynamics model [21].
This paper aims to review the state-of-the-art studies that construct CLDs to investigate the impact of the COVID-19 pandemic on a broader human–society–environment system. This review intends to formulate methodological as well as applied insights. Methodologically, our analysis provides observations (a) on what seems to be a common practice in research involving causal loop diagramming to analyze the socioeconomic impacts of COVID-19 from the systems perspective; (b) on major gaps in the existing CLDs that deal with systems impact of COVID-19; and (c) on what seems to be a good practice in the development, presentation, and analysis of CLDs. Observations (a), (b), and (c) can be useful for future CLD developers for benchmarking their work against the state-of-the-art, for positioning and focusing their research, and for increasing the impact of their research, respectively. The applied insights of this paper include observations that can guide quantitative model development to further analyze the multi-dimensional impacts of COVID-19 and policy-relevant observations.
The paper is organized as follows. The approach to the selection of studies for the review as well as key methods for the analysis of the selected CLD set is described in Section 2. In Section 3, we present the results of the analysis of the selected studies including a summary of the selected papers and their scope (Section 3.1), analysis of commonly and rarely used concepts across the reviewed CLDs (Section 3.2), basic network statistics of the reviewed CLDs (Section 3.3), major drivers and impacted components (Section 3.4), complexity patterns (Section 3.5), and, finally, the discussion of good practices for the CLD development, presentation and analysis as used by the authors of the reviewed CLDs (Section 3.6). Section 4 provides a discussion and conclusions.
2. Methods and Scope
To identify relevant studies, first, we conducted a formal literature search in the Scopus database using the following search query:
TITLE-ABS-KEY (COVID-19 AND ((“causal loop diagram*”) OR (“influence diagram*”) OR (“systems map*”))).
Therefore, we also accounted for terms that are sometimes used interchangeably to CLDs, i.e., systems maps and influence diagrams.
This search yielded 12 papers. Seven out of these were discarded from the further analysis, as they focused either only on the virus spread itself, i.e., being epidemiological models, e.g., [22], or on a too-narrow phenomenon, e.g., [23] focusing on the routine childhood immunization or [24] focusing on the development of branchless banking. One of the remaining five papers was a conference paper [25] that then was developed into a journal article by the same author and contained the same CLD, so we also disregarded this conference paper from our analysis and included only the journal article [2].
Then, we also reviewed the citations of the remaining four papers and, using both Scopus and the Google Scholar database added four more works containing relevant CLDs—one journal paper, two preprints, and one blog post. Ultimately, eight studies satisfying the scope of our review were selected for a detailed analysis. These eight publications are summarized in Table 1.
To analyze the selected CLDs, we use both qualitative and quantitative methods. First, in Section 3.1 we discuss the research focus of the reviewed studies.
Second, in Section 3.2 we reveal commonly and rarely used concepts across the eight reviewed studies by identifying synonymic variables and computing simple statistics of the appearance of distinctively different notions across all CLDs.
Third, in Section 3.3 we analyze structural properties of the reviewed CLDs employing a number of approaches from the graph theory. Indeed, a CLD can be considered as a directed graph (a digraph) determined by its adjacency matrix , where / if component makes a positive/negative impact on and if has no link into ; here, is the total number of components in the considered system [27]. We compute and compare basic network statistics for the CLDs under review, including the number of nodes and links, as well as the average node degree, i.e., the average total number of the incoming and outgoing links associated with a node. We further analyze the dependence of links on the CLD size across the reviewed CLDs.
Fourth, in Section 3.4, for each CLD, we compute the statistics of the number of incoming and outgoing links associated with a node (in- and out-degree). Using the Frederic Vester’s approach that was originally suggested in [28] and further developed by other authors in [29], we identify active components (drivers) and passive (most impacted) components of a CLD as nodes that have a high number of outgoing and incoming links, respectively. Components with high number of both link types are regarded as critical hubs in the corresponding CLDs.
Fifth, in Section 3.5, in each CLD we identify network motifs—basic microstructures, which can be considered as network building blocks. Following [30,31], we focus on (i) bidirectionality (a two-component feedback loop), (ii) multiple causes, (iii) multiple effects, (iv) an indirect effect, (v) a moderated effect, and (vi) three-component feedback loops (see Table 2). Motif (i) includes two nodes, while motifs (ii)–(vi) include three nodes. Furthermore, we run a conditional uniform random graph (CUG) test [30] to compare the prevalence of these motifs in the reviewed CLDs to their prevalence in the ensembles of random networks with the same number of nodes and edges (so-called “N, m” model family [32]) which is used as the null model.
Sixth, in Section 3.6 we review how the eight CLDs were developed and presented in terms of the description of the design procedure, availability of lists of components, links and feedback loops, visualization, software implementation (source code), and methods employed for the CLD analysis. We selected these features as dimensions of good practice based on commonly used guidelines, e.g., [20] and our own practical experience.
3. Results
3.1. Research Focus
In terms of the research ambition, which the reviewed papers set for themselves, all eight papers share a similar approach that can be described as going “beyond health effects”. This includes unraveling and visualizing the complexity and interconnectivity of different subsystems within the socioeconomic system, adding a transdisciplinary focus to COVID-19 policies, and identifying leverage points. Two papers specifically emphasize certain sectors, namely, refs. [2,26] concentrated on the role of media in the pandemic development coverage, and, in addition, ref. [2] considered the role of businesses behavior. We summarized the addressed research question in Table 3.
3.2. Common and Rare Components
In this section, we discuss similarities and differences between the components included in the CLDs by the authors of the reviewed studies. All eight CLDs accounted for the magnitude of the infection spread, and, in addition, studies [4,13,15,16] distinguished between the number of actually infected people and diagnosed cases (“Certified infections rates”1 vs. “Infectious population” [4], “Number of positive tests” vs. “Infected population” [13], “Diagnosed” vs. “Infected” [15] and “Number of cases detected” vs. “Number of infectious people” [16]); studies [14,15] additionally distinguished between symptomatic and asymptomatic virus carriers. Six out of eight papers also separately accounted for the number of COVID-19 deaths. Three papers [4,14,15] use variables that are commonly included in SIR-type models, i.e., susceptible, recovered, and hospitalized populations [34].
The next most commonly included aspects across the eight CLDs are panic and/or fears (accounted for by six papers, i.e., “Panic and fear” [4,12], “Anxiety, panic and fear” [13], “Public outrage” [16], or just “Fears” [15]), as well as public awareness (“Alertness “ [4], “Awareness campaign” [12], “Advisories and media reports” [15], “Effectiveness of public health risk communication” and “Public awareness“ [16], “Situational awareness” [26]), business closures (lockdowns), unemployment (or “People out of work” [4]), impact on the healthcare system (“Hospital strain” and “Medical staff attrition” [4] “Health care worker load” [12], “Occupied health facilities” and “Shortage of health facilities” [14,15], “Impact on healthcare system” [26]), and social distancing (or “Avoidance of public space“ [26])—each accounted for by five papers.
On the other hand, only two papers included the influence of the pandemic on the environmental issues, i.e., air pollution [12,13]. The former paper also accounted for the “Waste generation” and “CO2 concentration”. Social challenges such as (a lack of) “Trust within communities”, “Crime and violence”, and “Racism” [12], as well as the “Conflicts of interest” [13] appeared in only one paper, correspondingly. The role of vaccines was also highlighted only in two papers (“Development of vaccines”, “Production with promising but not yet certified vaccine”, and “Availability of vaccines” [4] and “Vaccination” [15]), while [4] is the only study which accounts for the role of research institutions (“Research institutes mobilisation”). Some issues that are generally considered important factors for the spread of COVID-19 and its impact, for example, social and economic inequality [35,36], are absent in all reviewed CLDs.
An exhaustive list of concepts used in all CLDs is provided in the Supplementary Material (Table S1).
3.3. Basic Network Properties of COVID-19 CLDs
Basic CLD network properties provide a simple indication of the system complexity. Table 4 presents the summary statistics that includes the number of nodes, the number of links, and the average node degree across the eight reviewed CLDs. CLDs vary significantly in terms of the number of nodes that they include: The smallest one (17 nodes) is by [2] who studied the business response to the COVID-19 crisis, and the largest one (78 nodes) is by [4], who analyzed the resilience of healthcare, government, social, and economic subsystems to the COVID-19 shock. Half of the reviewed CLDs have between 21 and 25 nodes, which corresponds to the commonly accepted standard [37].
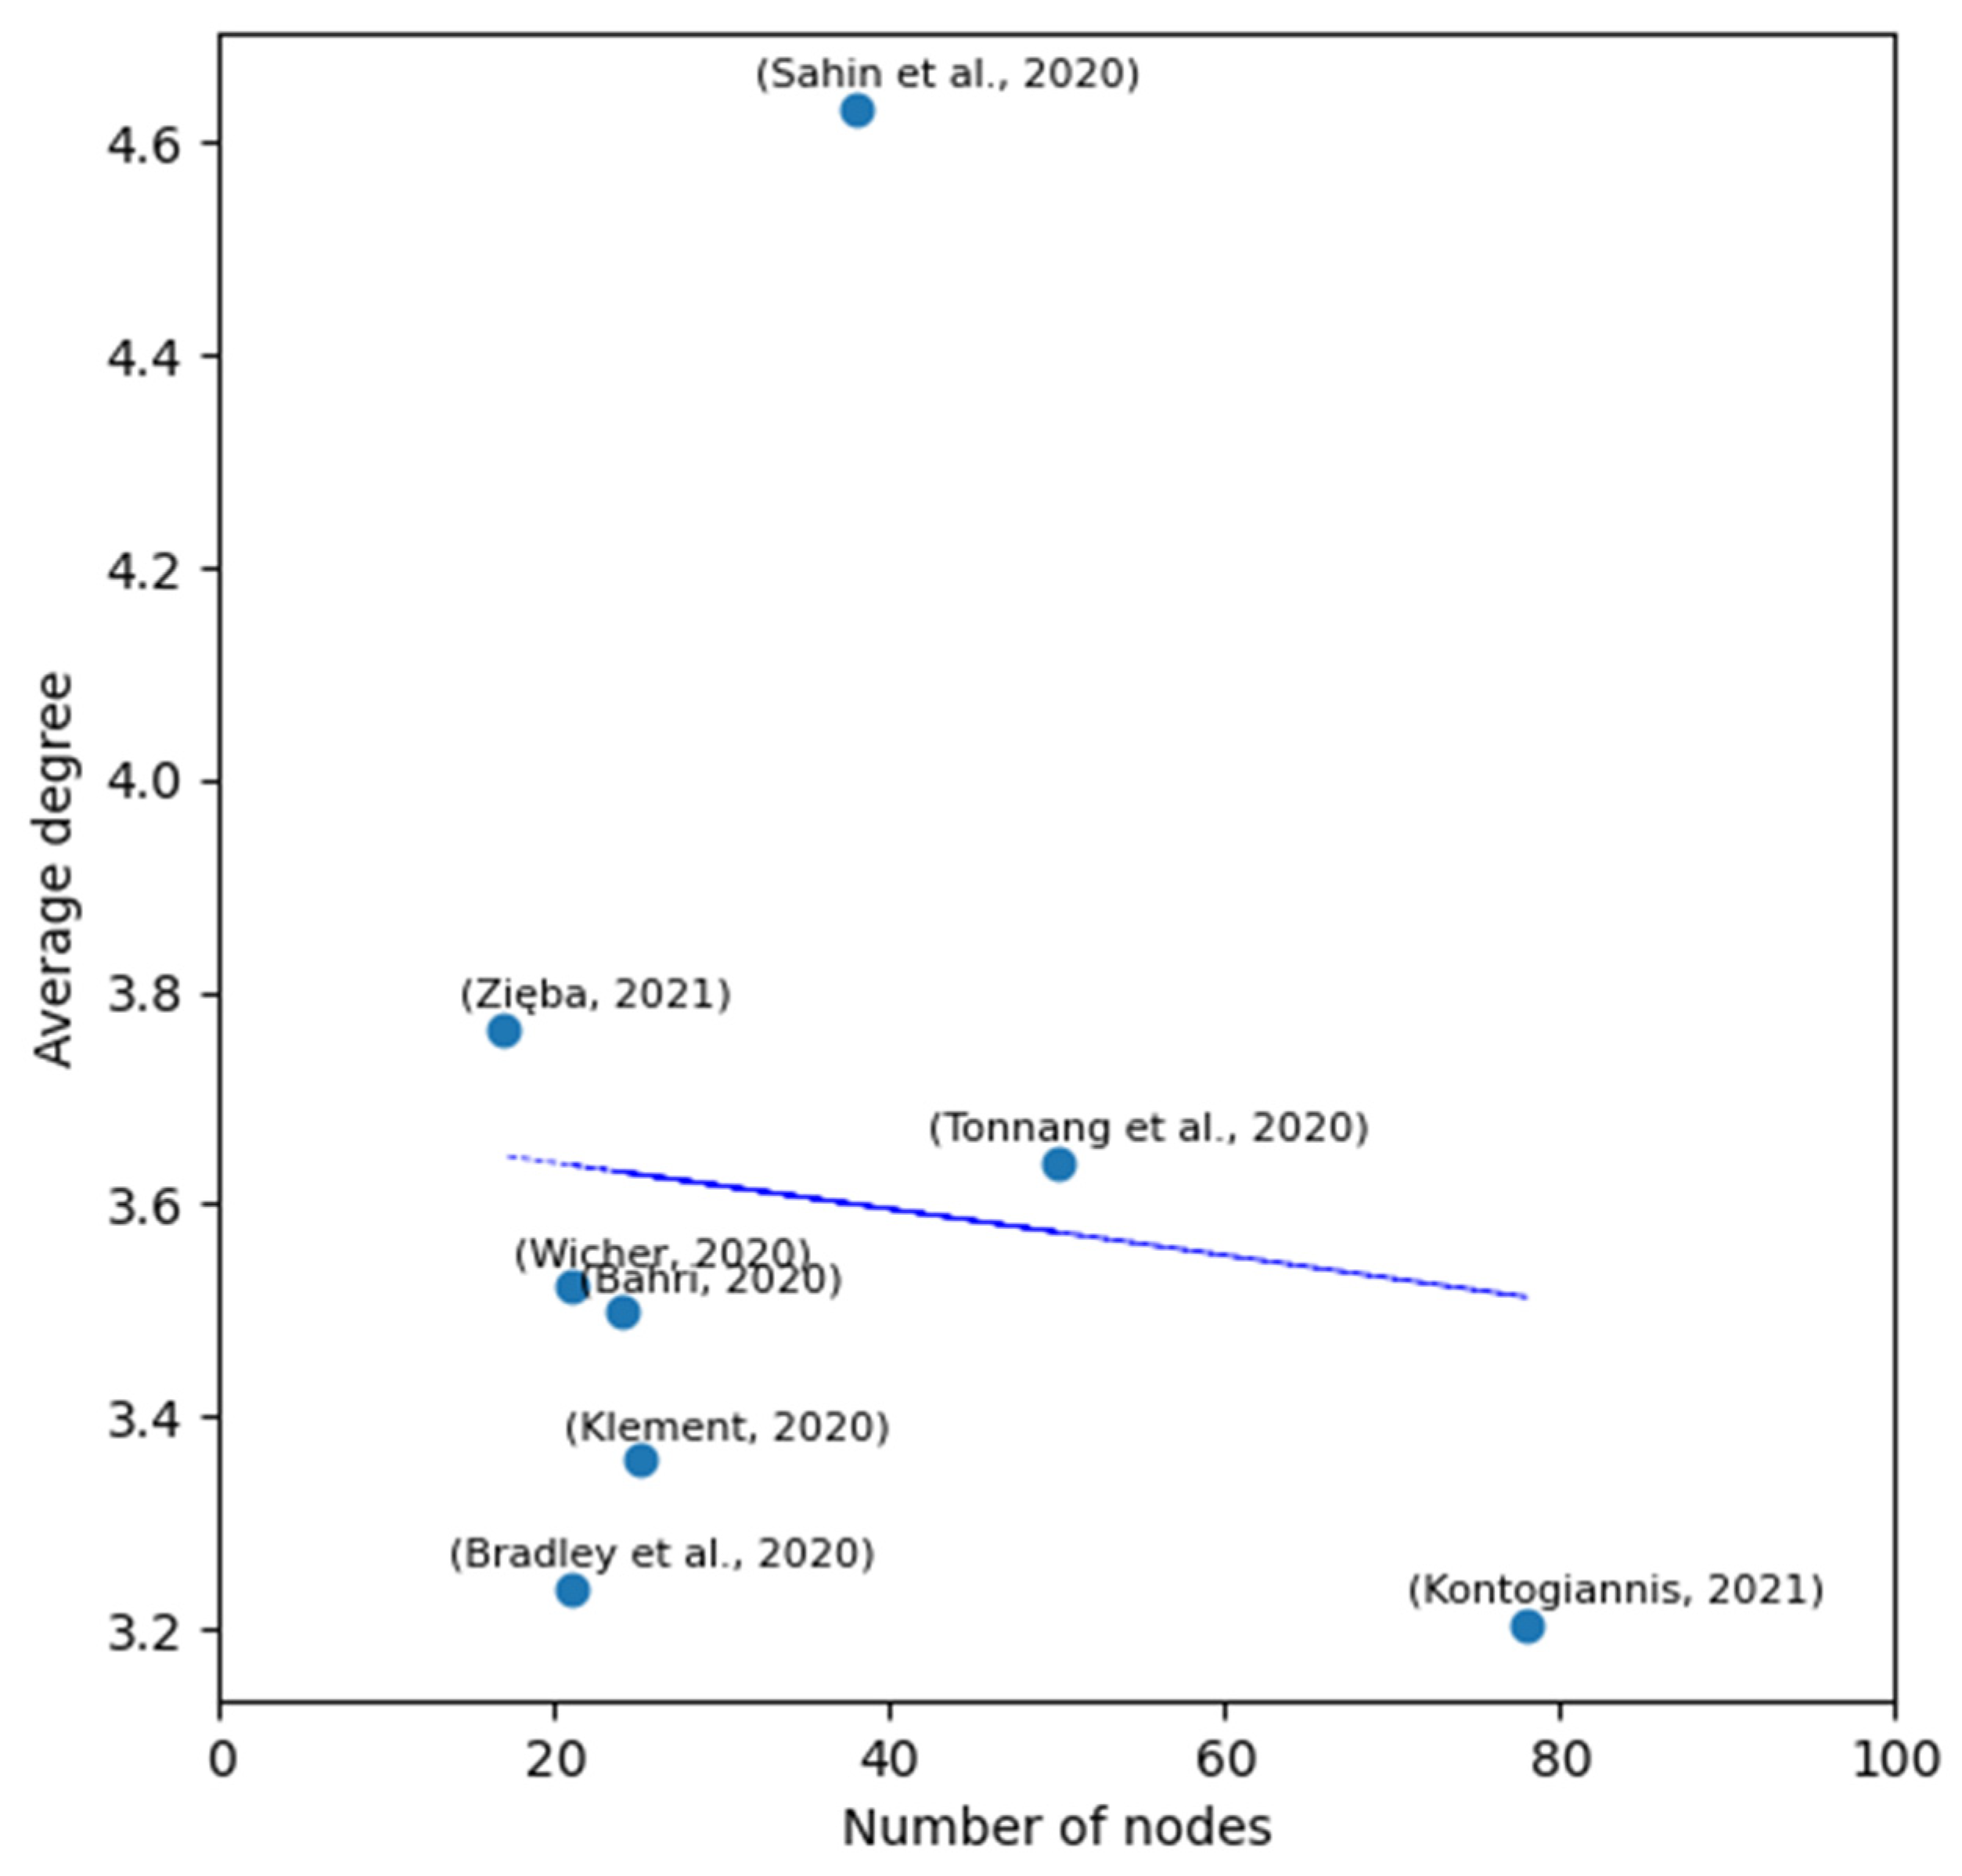
Interestingly, across the reviewed CLDs, the number of links scales approximately linearly with the number of nodes. This can be seen in Figure 1 depicting the average node degree, which is twice the ratio of the number of links to the number of nodes. Excluding [12] as an outlier [38]2, we obtain that across the remaining seven CLDs, the average node degree is 3.46 ± 0.21. Such a narrow window of the average degree suggests that in most cases, the CLD developers in these seven studies regarded three to four links per element as an appropriate representation of the system’s complexity in the context of their study. Study [12] involved a broader expert community into the design of their CLD, and this seems to have resulted in a more complex CLD with a much higher number of links and hence a higher average node degree—conceivably due to a larger heterogeneity of the views involved in the CLD construction [31].
3.4. Major Drivers and Most Impacted Components
Following Vester, in order to understand how a complex system can be managed, it is useful to identify active and passive components, as well as critical hubs in the corresponding CLD [28]. Active components have a substantial influence on other components of the system; changes in such components often trigger significant changes in the entire system, hence such components are often referred to as drivers. Passive (impacted) components tend to be sensitive to changes in other parts of the system. They can serve as indicators of the reaction of the system to a change, while they usually have a weak influence on the other components of the system. Critical hubs both strongly influence and are strongly influenced by other components of the considered system and often play an essential role in the formation of feedback loops [29].
To identify the active and passive components in the reviewed CLDs, following the spirit of [28], for each reviewed CLD we obtain the in- and out-degree distributions, i.e., the observed frequencies of in- and out-degree values3 and set a threshold which marks the highest distribution quantile. Here, we adopt the 10% right tail4. Those components, whose in-degree/out-degree is higher than the corresponding threshold value5 are identified as candidate active/passive components. More details of the implementation of this procedure can be found in the Supplementary materials.
As components of a complex system typically both influence and are influenced by other components of the system, some may have both high out- and in-degrees. To deal with such cases, following [29], for each CLD component, we compute an active/passive quotient (APQ), i.e., the ratio of its out-degree to the in-degree. As “truly” active and passive components, for the further analysis, we select only those candidate active/passive components which have APQs greater/smaller than one. Furthermore, we determine critical hubs6 as components that have a high product of out- and in-degrees. Table 5 summarizes the definitions used.
Across eight CLDs, two to seven components are classified as active7. A higher out-degree acts as an indicator of a higher importance of the component. In all reviewed papers, except [15], the magnitude of the infection spread expressed in terms of “Number of infected people” [26], “Infectious population” [4], “Number of positive tests” [13], “Confirmed cases” [12], “Perceived number of infectious people” [16], or, more generally, “Seriousness of the COVID crisis” [2] is a very important active component with the highest or second-highest out-degree. In both studies, where the infections are the second-ranked, the active component with the strongest influence is “(Policy) interventions” [12,13]. Government measures, “Lockdowns” and “Government imposed restrictions”, are also important active components in [2,15], and both have the second highest out-degree in their corresponding CLDs.
“Health system” and “Centre for Disease Control” have the highest and the second-highest out-degree in [4,15] correspondingly.
An essential role of communication and media is reflected by the presence of “Public attention towards COVID-19” in [26], “Effectiveness of public health risk communication” in [16] and “Digital channels” in [15], and “Popularity of social media” in [2] among the active components in their corresponding CLDs. “Economic activities” [12] and “Economic pressure” [4] as well as “Unemployment” [15] also appear as important drivers in these papers. Finally, “Research Institutes Mobilization” imposes a strong influence on the entire system in [4].
Across the reviewed CLDs, two to nine components were classified as passive. The public perception of the pandemic is the most critical passive component in the CLDs of [2], expressed as “Perceived seriousness of COVID crisis”; of [12,13], expressed as “(Anxiety), panic and fear”; and of [16], expressed as “Public outrage”. At the same time, “Chance of getting infected” has the highest in-degree in the CLD by [26]. The CLDs of [14] and [4,16] follow them, with “Infected droplets or surfaces”, “Infection rate”, and “Transmission events” having the second highest in-degree, correspondingly.
The most crucial passive component of the CLD by [4] is “Capacity to respond”. At the same time, “Budget for fight the COVID-19” has the second-highest degree in the CLD by [26]. The most impacted component of [14]’s CLD is “Recovered population”, while for [15], it is the “Isolated population”.
Economic effects of the pandemic impact are reflected by the presence of “GDP loss fraction” [4], “Total demand” [15], and “Business closures” [12] among the passive components in the corresponding CLDs. Finally, influence of the pandemic on mental well-being is highlighted by the respective passive nodes in the CLDs of [13,14]. Interestingly, “Immune system” is active in the CLD of [15]’s CLD and passive in the CLD of [13].
“GDP” [14,15], “Situational awareness” [26], “Symptomatic population” [14], “Dead population” [14,15], “Isolated population” [14,15], “Hospitalized population” [4], “Mobilization of policies” [4], and “Vaccination” [15] can be defined as “critical hubs” as they impact and are impacted by many other components. For example, the numbers of symptomatic, hospitalized, and isolated people depend on how fast the virus spreads, but they also influence further contamination.
At the same time, our analysis of in- and out-degree distributions (Figure S1 in Supplementary Material) shows that six out of eight reviewed CLDs demonstrate a prevalence of transmitter variables, i.e., those with zero in-degree, over receiver variables, i.e., with zero out-degree, thus highlighting a shock character of the COVID-19 pandemic, which is considered as an external perturbation to a wider socioeconomic system.
3.5. Structural Complexity: Motifs
To measure how the reviewed CLDs reflect system complexity beyond the basic network statistics and to obtain insights regarding the degree to which a CLD represents a specific type of causality [30], we measure the prevalence of certain network motifs (listed earlier in Table 2) in each diagram.
For each of the reviewed CLDs, we generated 1000 random graphs with the same numbers of nodes and edges as the corresponding reviewed CLD. Then, for each of the six motif types, we calculated the expected number of motifs across the simulated random graphs and compared it with the actually observed number of motifs in the reviewed CLD. As a measure of motif prevalence, we chose a difference between the observed motif count and the corresponding expected value [31]. To be able to compare among CLDs which have different number of components and links, we standardize both the observed and expected numbers of motifs using the mean and standard deviation of the corresponding ensemble of random graphs (i.e., we compute z-scores) [31]. Therefore, the motif differences are measured in the number of standard deviations (Figure 3).
Our findings illustrate that all reviewed studies accounted for more bidirectional structures (feedback loops with two components) than might be expected. In this sense, the most prominent study is [15]8. Six out of eight studies also had more three-component feedback loops than corresponding random networks. Four studies underrepresented and four studies overrepresented the moderated effects. At the same time, almost all studies demonstrated a lower prevalence of multiple effects (with the exception of [12]) and indirect effects (with the exception of [13]). In all studies, multiple causes were observed less frequently than in random networks.
Additionally, we find that there is no clear pattern between a motif’s prevalence in CLDs and its size (measured by the number of components), as well as between a motif’s prevalence and the date of its publication, i.e., more recent CLDs do not necessarily contain more complex causal structures than the early maps.
3.6. Good Practices of Creation and Visualization of CLDs
Here, we focus on the design procedure, availability of lists of components, links and feedback loops, visualization, software implementation (source code), and methods employed for the CLD analysis as important dimensions of good practice for developing and presenting CLDs. These features are selected based on commonly used guidelines, e.g., [20] and our own practical experience. Table 6 summarizes how these features are covered in the reviewed CLDs.
An important prerequisite for the credibility, transparency, and replicability of a CLD is the description of its design procedure [40]. For example, the CLD presented in [12] was based on several expert workshops, which are briefly described in the paper’s appendix (Appendix A) [12]. The CLD of [13] is based on this CLD. Expert workshops represent a useful source of unique knowledge and insights to address wicked problems [41]. Information on the workshop participants (can be anonymized) and other workshop details is useful for the readership to fully appreciate what the CLD represents. Using a coding procedure that formally translates participant statements into elements of a CLD can be recommended [42]. Another way to develop a CLD can be desk research. According to the descriptions provided, in six out of eight reviewed papers, the authors used their own mental models complemented by literature reviews to produce their CLDs.
We argue that a comprehensive description of the system’s components (and ideally interconnections between them) and data sources that were used to inform them is important for the CLD validation. One of the reviewed studies provided such a description ([12], Appendix A). Some papers contain literature-based evidence for justifying some key interconnections between the components of their CLDs [2,4,13,14]. We believe that while general knowledge can often be sufficient to draw causal links, in some cases, especially when it involves a novel phenomenon, such as in the case of COVID-19, justifying links with the available evidence can greatly increase the CLD’s credibility. For example, the CLD in [13] includes a “# of positive tests”→“COVID-19 deaths” link and no “Infected population”→“COVID-19 deaths” link. We find that this is not completely straightforward, and as readers, we would appreciate a justification of this choice.
Using colors and other ways to evince the CLD structure often improves its comprehensibility [43]. Among the eight reviewed papers, three papers mark subsystems within the considered systems: [12,13] highlight different subsystems using areas of different colors and [15] highlights links in different subsystems using different colors11. Both approaches seem to be helpful for better reading of the CLDs to which they were applied.
Furthermore, [4] uses different colors to highlight system archetypes, which are commonly encountered combinations of reinforcing and balancing feedback loops, often leading to an undesired behavior of the considered system [44,45]12. This study, along with [14], also presents separate maps of system archetypes, which constitute the building blocks of the full CLD. This is considered a useful practice by [20].
At least six out of eight reviewed CLDs were implemented using Vensim software13, which is a commonly used tool for designing CLDs (and systems dynamics models). None of the papers provided a source file of their model. For researchers who would wish to use a CLD developed by other authors, having such a file would save efforts on reproducing it, especially if the CLD is rather large.
The main methodological approach to the CLD analysis in all eight reviewed papers is based on the selection and discussion of several major feedback loops, which is a standard practice in the field. Feedback loops are essential to understand the behavior of a system’s model and identify potential leverage points [46,47]. CLDs can contain thousands of feedback loops [48], however, it is often enough to discuss the most essential ones which are relevant to the problem at hand. Moreover, it has been proposed that the CLD dynamics are largely driven by a relatively small subset of feedback loops, namely, a Shortest Independent Loop Set (SILS) introduced by [27] is defined as a “set of shortest loops which are necessary to fully describe the feedback loop complexity of the model” [49].
For discussing feedback loops and their role, it is essential that each one that is referred to is depicted separately and/or described textually in a way that allows readers to clearly see all the constituting links [50]. For example, [4,15], two studies with the largest numbers of feedback loops discussed, provide tables listing loops and their interpretation, which helps readers to follow the authors’ argumentation. Moreover, [4,26] give distinctive names to their loops, as suggested by [20], to increase the understanding of the function of each loop. In terms of feedback loops visualization, all studies except for [16] label the discussed feedback loops in their CLDs, which helps in following the corresponding discussion in the paper. The commonly accepted labelling style is to use either “RX”, “BX”, or just “X”, where “X” is the identificatory (number) of the analyzed loop, “R” refers to a reinforcing loop, and “B” refers to a balancing loop. Two papers, [4,14], go deeper and, following [51], identify and analyze archetypal structures in CLDs which are indicative of system modularity [52].
Feedback loops and systemic archetypes enable a better understanding of some of the challenges which make the COVID-19 pandemic a wicked problem. This type of analysis shows the capability of systems thinking to be of particular use to make a step towards problem structuring [53]. Furthermore, it can help to identify leverage points, which can steer the systems towards a desired goal or away from an undesired behavior [47]. This is explicitly emphasized in two of the reviewed papers [4,12].
4. Discussion and Conclusions
In this paper, we analyzed eight studies aimed to illustrate the complexity and multi-dimensionality of the COVID-19 crisis using a practical tool of systems thinking—causal loop diagrams (CLDs). Here, we highlight some of the observations. First, we observed that the key components of the reviewed CLDs are consistent across all eight studies, however, different studies put different emphases on the main drivers and main affected components of the analyzed systems. This diversity of both drivers and affected variables supports the need for a transdisciplinary response to the pandemic [13].
The insights on common and rare components (Section 3.2), as well as on drivers and the most affected elements (Section 3.4) can be useful for future CLD developers and quantitative modelers to guide their research. For example, CLD analysts may decide to focus on gaps revealed in the existing CLDs, e.g., inequality, or they may choose to focus on the most important components to dig deeper into their dynamics and impacts. However, the scope of some CLDs could be quite narrow, and therefore, reusing concepts from them for a more general study should be done carefully.
Quantitative modeling and in particular systems dynamics (SD) modeling [21] can benefit from this review, as modelers can use the discussed CLDs a basis for their models. The author of [4] supports this point of view: “[CLDs] have the potential to be converted into Stock and Flow diagrams that allow quantification of results”. For example, CLDs can be used to extend the traditional SIR-type system dynamic models to make them more realistic and useful for decision making [22]. The most essential system components identified in this review can guide the choice of variables in models.
Our insights in this part can also be useful for policy makers. The analysis of drivers (Section 3.4) can indicate candidate leverage points for the mitigation of the adverse consequences of COVID-19 and improve the resilience of the socioeconomic system to “provide a basis for effective response to the control of the pandemic” [4] and “bounce forward” from the shock caused by the pandemic [7]. The analysis of the most impacted components carried out in the same subsection can draw the attention of policy makers to areas where unintended and unwanted effects may be anticipated.
Second, we observed that the average number of links per node across the reviewed CLDs does not depend on the diagram size (Section 3.3). We proposed that this might be because the CLD developers regarded three to four links per node as an appropriate representation of complexity in their studies. This and other observations discussed in Section 3.3 can be useful for future developers of CLDs in the context of COVID-19 for benchmarking their models and planning their efforts and scope.
Third, we revealed a higher-than-expected prevalence of two- and three-component feedback loops in the reviewed CLDs (Section 3.5). This is different from the results obtained by [30], which found a low prevalence of these feedback structures in cognitive maps developed in the context of sustainable agriculture. This difference can be explained by the fact that the CLDs that we reviewed were developed by researchers familiar with systems thinking, which, according to [30], leads to a higher complexity of the developed cognitive models. Furthermore, in the same subsection and consistently with [30], almost all of the CLDs that we reviewed underrepresent “multiple effects” and “indirect effects” motifs, and they also underrepresent “multiple causes” motifs, which are, on the contrary, prevalent in [30]. The latter fact can probably be attributed to the novelty of the COVID-19 pandemic. Interestingly, while all authors discuss the feedback loops identified in their CLDs, none of them explicitly analyze multiple causes or effects for any components of the considered system14. This could be attributed to the fact that humans tend to perceive effects as more abstract and distant phenomena than causes, as suggested by the construal-level theory [54]. These observations can be useful for CLD developers for benchmarking their analysis as well as for researchers generally focusing on complexity and systems thinking.
Fourth, our observations made in Section 3.6 on good practices of development, presentation and analysis of CLDs can be helpful for future CLD developers. In terms of CLD development, we suggested that a detailed description of the design procedure enhances trust in the developed CLD. In terms of CLD presentation, highlighting meaningful subsystems of a large system helps reading a complex CLD. Finally, in terms of analysis, feedback loops and other smaller structures which constitute CLD building blocks such as archetypes and motifs can shine the light on the system complexity and help understand its behavior.
We conclude that despite the numerous recent calls to use systems thinking for addressing the complexity of the COVID-19 crisis, its practical applications are currently scarce; for example, [2] notes in this regard that “systems thinking approach to analyze the consequences of the COVID-19 outbreak is relatively novel and not extensively used”. More recent studies generally do not contain more complex causal structures than the earlier ones. Therefore, we assume that they do not build upon the past models. Only one of the reviewed CLDs is explicitly based on another existing CLD. A plausible explanation of this fact is that CLDs are often developed for a specific purpose with a further aim to inform a more sophisticated model or analysis. However, we are not aware if any of the reviewed CLDs have been used for such a purpose up to the date of our writing.
We suggest (Section 3.6) that CLDs could benefit from a rigorous description of the development procedure and information sources used. This would improve their credibility and enable other researchers to enhance them further or conduct other types of analysis. Moreover, sharing the model source file can also be beneficial, especially since most of the reviewed maps showed consistency in the most important components and interactions and the degree of their complexity. Therefore, the reusability of CLDs could be key to enhance the efficiency of research efforts and/or to promote more advanced studies.
Being a useful systems-thinking tool, CLDs also have a series of limitations. As with every model, a CLD constitutes a major simplification of the considered real system. CLDs do not distinguish stocks and flows, which, along with the feedback structures, are the essential concepts in modeling systems behavior [20,46]. CLDs are inherently static and therefore cannot account for the dynamics of the modeled system, i.e., behavior over time [46]15, without being translated into a computer simulation model. CLDs invite users for a mental simulation, which, however, can be challenging even for relatively simple CLDs [20].
Notwithstanding these limitations, we argue that the reviewed papers demonstrate the power of systems thinking to inform a holistic picture of the pandemic’s impact on a broader socioeconomic system. Indeed, CLDs are helpful for an initial exposition of the complexities brought about by COVID-19 for policymakers and the general public. They promote critical thinking [53] and show how deeply the pandemic affects all areas of human activity and that there is no easy “silver bullet” to solve this wicked problem [55], thus calling for a transdisciplinary approach. We suggest that building more comprehensive CLDs and having formal tools for their analysis [27,43,49] can further unleash the potential of systems thinking to inform decision making in circumstances of a wicked problem, such as the COVID-19 crisis—either as a standalone tool or as an input to more sophisticated models and analyses. As no single modelling approach can serve as a panacea for addressing a complex policy issue, CLDs should ideally be used in combination with other methods and models to provide reliable policy advice.
Supplementary Materials
The following are available online at https://0-www-mdpi-com.brum.beds.ac.uk/article/10.3390/systems9030065/s1. Table S1. Concepts used in the reviewed CLDs; Figure S1. Distributions of in- and out-degrees for each reviewed CLD.
Author Contributions
Conceptualization, N.S. and E.R.; methodology, N.S. and E.R.; formal analysis, N.S.; writing—original draft preparation, N.S.; writing—review and editing, E.R.; visualization, N.S. All authors have read and agreed to the published version of the manuscript.
Funding
This research received no external funding.
Data Availability Statement
Not applicable.
Acknowledgments
The authors acknowledge three anonymous reviewers for their detailed comments which helped to significantly improve the manuscript.
Conflicts of Interest
The authors declare no conflict of interest.
| 1 | Here, and in what follows, the names of CLD components in quotation marks are those originally used by their authors in the reviewed publications. |
| 2 | |
| 3 | These can be computed as sums of the absolute values of rows and columns of the respective adjacency matrices. |
| 4 | The 10% threshold is our choice to delimit a group of the most impacting/impacted components from the others. We show this in the distribution plots of the in- and out-degrees for each reviewed CLD (Supplementary Materials Figure S1). |
| 5 | If several components with the same degree were divided by the top decile, all of them were considered. |
| 6 | Vester originally classified all components with a high product of in- and out-degrees as critical, thus often including active and passive components. In this review, we emphasize the role of components, which are both systems drivers and indicators, but formally could not be classified as either active or passive. Formally we included components which either (i) have different in- and out-degrees less than top deciles or (ii) have equal in- and out-degrees in the top deciles, and, at the same time, have the product of in-degree and out-degree in the top deciles of the corresponding distributions of in- and out-degrees for each CLD. Vester also considers buffer components which have a low product of in- and out-degrees. These are beyond of scope of our analysis. |
| 7 | The CLD by [14] does not have any active components fulfilling our criteria. |
| 8 | Their CLD contained eight standard deviations more of the bidirectional structures than the random networks’ mean. |
| 9 | A linear transformation of raw data that provides that the mean and the variance of the distribution are 0 and 1, correspondingly. The standard score thus gives the number of standard deviations by which the actual data point is above or below the mean value. |
| 10 | Table entries marked with “N/A” indicate that the corresponding aspect has been neither explicitly articulated by the authors or the reviewed studies nor it could be identified straightforward by the review authors. |
| 11 | We assume that the authors of the reviewed CLDs have defined such subsystems a priori classifying components substantially, e.g., economic, social, healthcare, etc. However, it is also possible to recognize subsystems after a CLD has been developed, for example, using graph clustering methods. |
| 12 | Usually four generic problem archetypes are specified [45]: (i) the underachievement, (ii) relative achievement, (iii) relative control, and (iv) out-of-control. While also being “building blocks” of CLDs containing few components, these are different to motifs discussed in Section 3.5. |
| 13 | Three studies mention this explicitly, while the CLDs of three more studies have a typical visual appearance, which allowed us to attribute them to this software. |
| 14 | Analysis of multiple causes and multiple effects (along with detection of feedback loops) for each component of a CLD can be performed using Vensim software (which was used to develop the majority of the reviewed CLDs and is commonly used for this purpose). |
| 15 | Although six out of eight reviewed CLDs account for time delays for some of the links helping to qualitatively understand the speed of impact propagation, this still does not enable a formal analysis of the modeled systems’ dynamics. |
References
- Dong, E.; Du, H.; Gardner, L. An interactive web-based dashboard to track COVID-19 in real time. Lancet Infect. Dis. 2020, 20, 533–534. [Google Scholar] [CrossRef]
- Zięba, K. How can systems thinking help us in the COVID-19 crisis? Knowl. Process Manag. 2021, 1–10. [Google Scholar] [CrossRef]
- The OECD Forum Network towards a People-Centred, Inclusive, and Sustainable COVID-19 Recovery: OECD Launches the Centre on Well-Being, Inclusion, Sustainability and Equal Opportunity (WISE). Available online: https://www.oecd-forum.org/posts/towards-a-people-centred-inclusive-and-sustainable-covid-19-recovery-oecd-launches-the-centre-on-well-being-inclusion-sustainability-and-equal-opportunity-wise (accessed on 18 December 2020).
- Kontogiannis, T. A qualitative model of patterns of resilience and vulnerability in responding to a pandemic outbreak with system dynamics. Saf. Sci. 2021, 134, 105077. [Google Scholar] [CrossRef]
- Ilmola-Sheppard, L.; Strelkovskii, N.; Rovenskaya, E.; Abramzon, S.; Bar, R. A Systems Description of the National Well-Being System. Available online: http://pure.iiasa.ac.at/id/eprint/16318/ (accessed on 2 September 2021).
- Ioannidis, J.P.A. Coronavirus disease 2019: The harms of exaggerated information and non-evidence-based measures. Eur. J. Clin. Investig. 2020, 50, e13222. [Google Scholar] [CrossRef] [PubMed]
- Hynes, W.; Trump, B.; Love, P.; Linkov, I. Bouncing forward: A resilience approach to dealing with COVID-19 and future systemic shocks. Environ. Syst. Decis. 2020, 40, 174–184. [Google Scholar] [CrossRef]
- Reynolds, S. COVID-19 Means Systems Thinking Is No Longer Optional. Available online: https://www.thinknpc.org/blog/covid-19-means-systems-thinking-is-no-longer-optional/ (accessed on 22 July 2021).
- Haley, D.; Paucar-Caceres, A.; Schlindwein, S. A Critical Inquiry into the Value of Systems Thinking in the Time of COVID-19 Crisis. Systems 2021, 9, 13. [Google Scholar] [CrossRef]
- Jackson, M.C. How We Understand “Complexity” Makes a Difference: Lessons from Critical Systems Thinking and the Covid-19 Pandemic in the UK. Systems 2020, 8, 52. [Google Scholar] [CrossRef]
- Hassan, I.; Obaid, F.; Ahmed, R.; Abdelrahman, L.; Adam, S.; Adam, O.; Yousif, M.A.; Mohammed, K.; Kashif, T. A Systems Thinking approach for responding to the COVID-19 pandemic. East. Mediterr. Health J. 2020, 26, 872–876. [Google Scholar] [CrossRef]
- Sahin, O.; Salim, H.; Suprun, E.; Richards, R.; MacAskill, S.; Heilgeist, S.; Rutherford, S.; Stewart, R.A.; Beal, C.D. Developing a Preliminary Causal Loop Diagram for Understanding the Wicked Complexity of the COVID-19 Pandemic. Systems 2020, 8, 20. [Google Scholar] [CrossRef]
- Klement, R.J. Systems Thinking About SARS-CoV-2. Front. Public Health 2020, 8, 1–6. [Google Scholar] [CrossRef] [PubMed]
- Bahri, M. The Nexus Impacts of the COVID-19: A Qualitative Perspective. Preprints 2020, 2020050033. [Google Scholar] [CrossRef]
- Tonnang, H.; Greenfield, J.; Mazzaferro, G.; Austin, C.C. COVID-19 Emergency Public Health and Economic Measures Causal Loops: A Computable Framework. SSRN Electron. J. 2020. [Google Scholar] [CrossRef]
- Bradley, D.T.; Mansouri, M.A.; Kee, F.; Garcia, L.M.T. A systems approach to preventing and responding to COVID-19. EClinicalMedicine 2020, 21, 100325. [Google Scholar] [CrossRef] [Green Version]
- Taylor, I.; Masys, A.J. A System Dynamics Model of COVID-19 in Canada: A Case Study in Sensemaking. In Sensemaking for Security; Masys, A.J., Ed.; Springer: Cham, Switzerland, 2021; pp. 179–199. [Google Scholar]
- Sy, C.; Ching, P.M.; San Juan, J.L.; Bernardo, E.; Miguel, A.; Mayol, A.P.; Culaba, A.; Ubando, A.; Mutuc, J.E. Systems Dynamics Modeling of Pandemic Influenza for Strategic Policy Development: A Simulation-Based Analysis of the COVID-19 Case. Process Integr. Optim. Sustain. 2021, 1–14. [Google Scholar] [CrossRef]
- Niwa, M.; Hara, Y.; Sengoku, S.; Kodama, K. Effectiveness of Social Measures against COVID-19 Outbreaks in Selected Japanese Regions Analyzed by System Dynamic Modeling. Int. J. Environ. Res. Public Health 2020, 17, 6238. [Google Scholar] [CrossRef]
- Sterman, J.D. Business Dynamics: System Thinking and Modeling for a Complex World; Irwin McGraw-Hill: Boston, MA, USA, 2001. [Google Scholar]
- Homer, J.; Oliva, R. Maps and models in system dynamics: A response to Coyle. Syst. Dyn. Rev. 2001, 17, 347–355. [Google Scholar] [CrossRef]
- Kumar, A.; Priya, B.; Srivastava, S.K. Response to the COVID-19: Understanding implications of government lockdown policies. J. Policy Model. 2021, 43, 76–94. [Google Scholar] [CrossRef] [PubMed]
- Adamu, A.A.; Jalo, R.I.; Habonimana, D.; Wiysonge, C.S. COVID-19 and routine childhood immunization in Africa: Leveraging systems thinking and implementation science to improve immunization system performance. Int. J. Infect. Dis. 2020, 98, 161–165. [Google Scholar] [CrossRef]
- Shahabi, V.; Azar, A.; Faezy Razi, F.; Fallah Shams, M.F. Simulation of the effect of COVID-19 outbreak on the development of branchless banking in Iran: Case study of Resalat Qard–al-Hasan Bank. Rev. Behav. Financ. 2020, 13, 85–108. [Google Scholar] [CrossRef]
- Zieba, K. How can Systems Thinking Help Us Handling the COVID-19 Crisis? In Proceedings of the 21st European Conference on Knowledge Management ECKM 2020, Coventry, UK, 3–4 September 2020. [Google Scholar]
- Wicher, D. The COVID-19 Case as an Example of Systems Thinking Usage. Available online: https://agilejar.com/2020/03/a-great-example-of-systems-thinking-covid-19-case/ (accessed on 22 July 2021).
- Oliva, R. Model structure analysis through graph theory: Partition heuristics and feedback structure decomposition. Syst. Dyn. Rev. 2004, 20, 313–336. [Google Scholar] [CrossRef]
- Vester, F. The Art of Interconnected Thinking; MCB Publishing House: München, Germany, 2007. [Google Scholar]
- Forgie, V.E.; van den Belt, M.; McDonald, G.W. Extending the Boundaries of Economics to Well-Being: An Interlinked Thinking Approach. In Feedback Economics; Cavana, R.Y., Dangerfield, B.C., Pavlov, O.V., Radzicki, M.J., Wheat, I.D., Eds.; Springer: Cham, Switzerland, 2021; pp. 521–544. [Google Scholar]
- Levy, M.A.; Lubell, M.N.; McRoberts, N. The structure of mental models of sustainable agriculture. Nat. Sustain. 2018, 1, 413–420. [Google Scholar] [CrossRef]
- Aminpour, P.; Gray, S.A.; Singer, A.; Scyphers, S.B.; Jetter, A.J.; Jordan, R.; Murphy, R.; Grabowski, J.H. The diversity bonus in pooling local knowledge about complex problems. Proc. Natl. Acad. Sci. USA 2021, 118, e2016887118. [Google Scholar] [CrossRef] [PubMed]
- Butts, C.T. Social network analysis: A methodological introduction. Asian J. Soc. Psychol. 2008, 11, 13–41. [Google Scholar] [CrossRef] [Green Version]
- Aminpour, P.; Schwermer, H.; Gray, S. The relationship between social identity and cognitive diversity in environmental stakeholders. PsyArXiv 2021. [Google Scholar] [CrossRef]
- Bärwolff, G. Mathematical Modeling and Simulation of the COVID-19 Pandemic. Systems 2020, 8, 24. [Google Scholar] [CrossRef]
- Ahmed, F.; Ahmed, N.; Pissarides, C.; Stiglitz, J. Why inequality could spread COVID-19. Lancet Public Health 2020, 5, e240. [Google Scholar] [CrossRef]
- Stok, F.M.; Bal, M.; Yerkes, M.A.; de Wit, J.B.F. Social Inequality and Solidarity in Times of COVID-19. Int. J. Environ. Res. Public Health 2021, 18, 6339. [Google Scholar] [CrossRef] [PubMed]
- Betley, E.; Sterling, E.; Akabas, S.; Gray, S.; Sorensen, A.; Jordan, R.; Eustice, C. Modeling links between corn production and beef production in the United States: A systems thinking exercise using mental modeler. Lessons Conserv. 2021, 11, 26–32. [Google Scholar]
- Wilcox, R.R. The Normal Curve and Outlier Detection. In Fundamentals of Modern Statistical Methods; Springer: New York, NY, USA, 2010; pp. 29–45. [Google Scholar]
- Niemeijer, D.; de Groot, R.S. A conceptual framework for selecting environmental indicator sets. Ecol. Indic. 2008, 8, 14–25. [Google Scholar] [CrossRef]
- Kim, H.; Andersen, D.F. Building confidence in causal maps generated from purposive text data: Mapping transcripts of the Federal Reserve. Syst. Dyn. Rev. 2012, 28, 311–328. [Google Scholar] [CrossRef]
- Vennix, J.A.M. Group Model Building: Facilitating Team Learning Using System Dynamics; John Wiley & Sons Ltd.: Chichester, UK, 1996; ISBN 978-0-470-86668-9. [Google Scholar]
- Eker, S.; Zimmermann, N. Using Textual Data in System Dynamics Model Conceptualization. Systems 2016, 4, 28. [Google Scholar] [CrossRef] [Green Version]
- Stämpfli, A. A Domain-Specific Language to Process Causal Loop Diagrams with R. In Operations Research Proceedings 2019. Selected Papers of the Annual International Conference of the German Operations Research Society (GOR), Dresden, Germany, 4–6 September 2019; Neufeld, J.S., Buscher, U., Lasch, R., Möst, D., Schönberger, J., Eds.; Springer International Publishing: Berlin/Heidelberg, Germany, 2020; pp. 651–657. [Google Scholar]
- Schoenenberger, L.; Schmid, A.; Tanase, R.; Beck, M.; Schwaninger, M. Structural Analysis of System Dynamics Models. Simul. Model. Pract. Theory 2021, 110, 102333. [Google Scholar] [CrossRef]
- Wolstenholme, E.F. Towards the definition and use of a core set of archetypal structures in system dynamics. Syst. Dyn. Rev. 2003, 19, 7–26. [Google Scholar] [CrossRef]
- Lane, D.C. The emergence and use of diagramming in system dynamics: A critical account. Syst. Res. Behav. Sci. 2008, 25, 3–23. [Google Scholar] [CrossRef]
- Saleh, M.; Oliva, R.; Kampmann, C.E.; Davidsen, P.I. A comprehensive analytical approach for policy analysis of system dynamics models. Eur. J. Oper. Res. 2010, 203, 673–683. [Google Scholar] [CrossRef]
- Kampmann, C.E. Feedback loop gains and system behavior (1996). Syst. Dyn. Rev. 2012, 28, 370–395. [Google Scholar] [CrossRef]
- Schoenberg, W. LoopX: Visualizing and understanding the origins of dynamic model behavior. arXiv 2019, arXiv:1909.01138. [Google Scholar]
- Dhirasasna, N.; Sahin, O. A Multi-Methodology Approach to Creating a Causal Loop Diagram. Systems 2019, 7, 42. [Google Scholar] [CrossRef] [Green Version]
- Senge, P.M. The Fifth Discipline: The Art and Practice of the Learning Organization; Doubleday: New York, NY, USA, 1990; ISBN 1368304091100. [Google Scholar]
- Schoenenberger, L.; Schmid, A.; Schwaninger, M. Towards the algorithmic detection of archetypal structures in system dynamics. Syst. Dyn. Rev. 2015, 31, 66–85. [Google Scholar] [CrossRef]
- Cavana, R.Y.; Mares, E.D. Integrating critical thinking and systems thinking: From premises to causal loops. Syst. Dyn. Rev. 2004, 20, 223–235. [Google Scholar] [CrossRef]
- Trope, Y.; Liberman, N. Construal-level theory of psychological distance. Psychol. Rev. 2010, 117, 440–463. [Google Scholar] [CrossRef] [PubMed] [Green Version]
- WHO. WHO Director-General’s Opening Remarks at the Media Briefing on COVID-19. Available online: https://www.who.int/director-general/speeches/detail/who-director-general-s-opening-remarks-at-the-media-briefing-on-covid-19---3-august-2020 (accessed on 29 July 2021).
Figure 1.
Average node degree across the reviewed CLDs as a function of their size, i.e., the number of nodes. The blue line represents the estimated linear trend excluding the outlier [12]. The slope is −0.004 with p-value 0.379, and hence the hypothesis that the average degree is independent on the network size cannot be rejected at the significance level at least 99.9%. The mean average degree value is 3.46 ± 0.21.

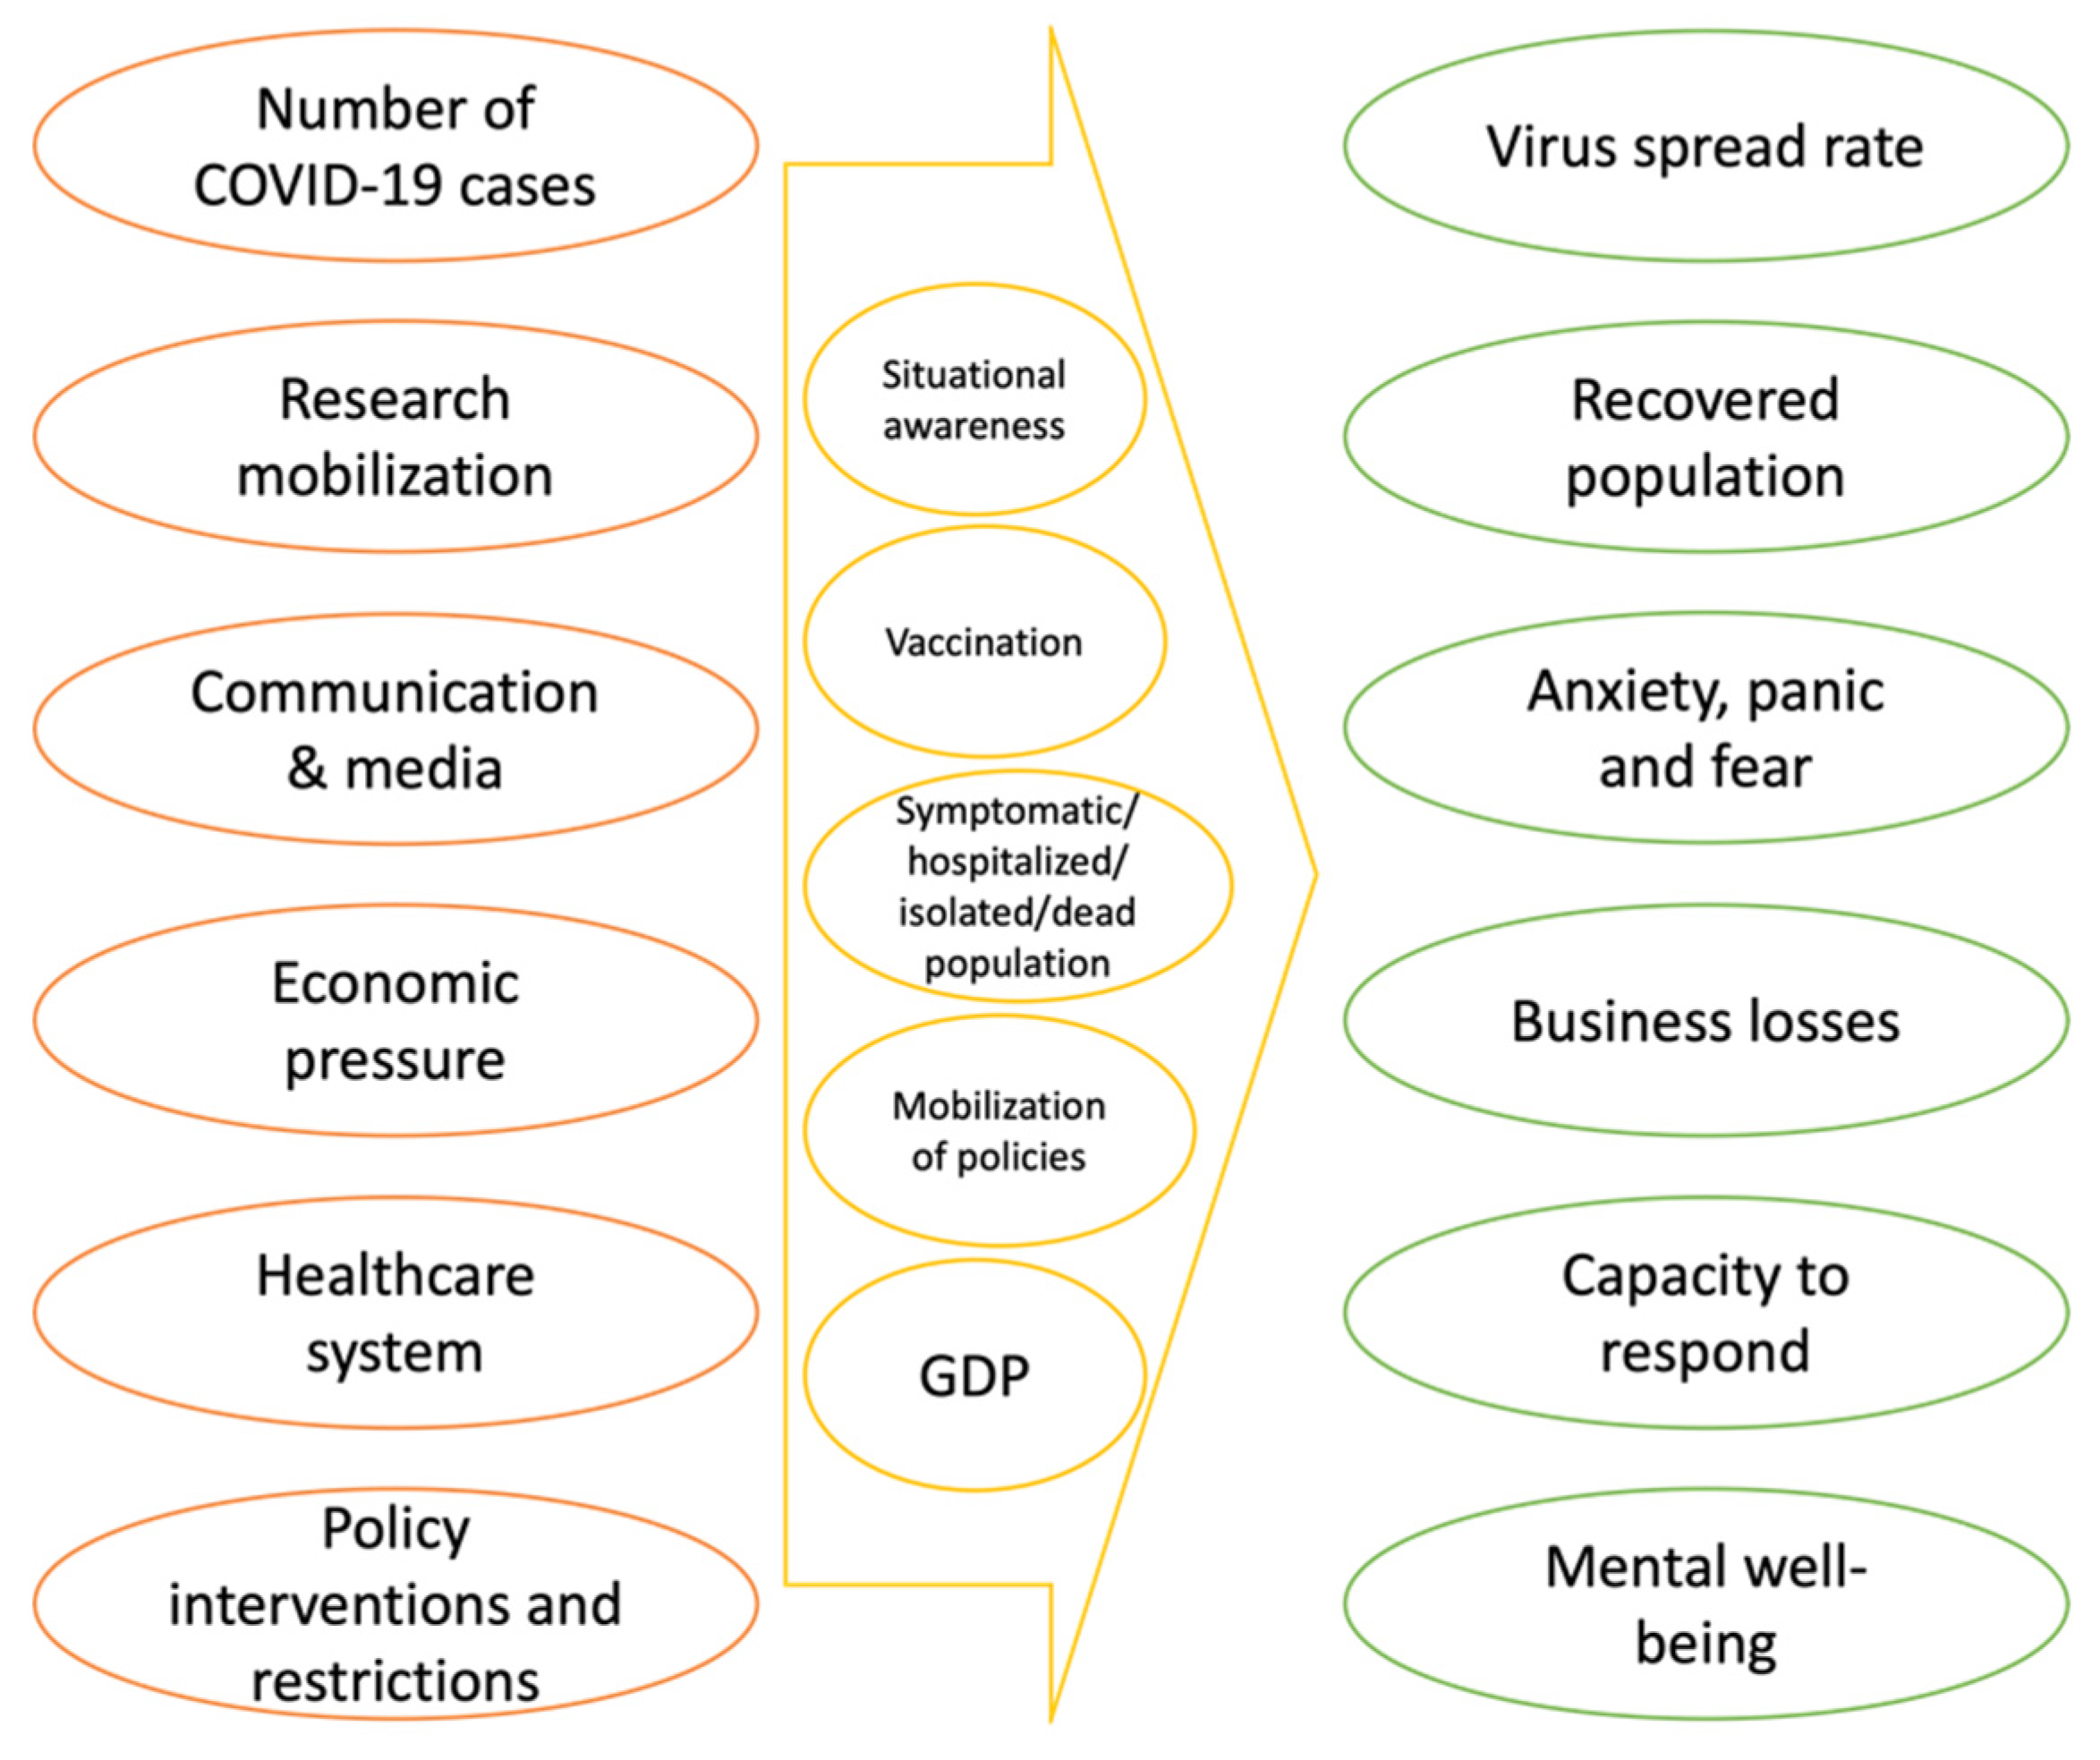
Figure 2.
Summary of active and passive components of the systems. Concepts in red circles denote active components aggregated across the reviewed studies, concepts in green circles denote aggregated passive components, and concepts in yellow circles denote aggregated critical hubs.
Figure 2.
Summary of active and passive components of the systems. Concepts in red circles denote active components aggregated across the reviewed studies, concepts in green circles denote aggregated passive components, and concepts in yellow circles denote aggregated critical hubs.

Figure 3.
Grey dots represent the standard score9 (z-score) of the number of motifs across 1000 realizations of the randomly generated graphs. The red mark depicts the actually observed indicator standardized in the same manner, so the red mark denotes the number of standard deviations by which the actually observed number of motifs differs from the mean of the distribution.


Table 1.
Reviewed studies (sorted by date of publication, ascending).
| Authors/CLD ID | Title | Date Published | Type | Reference |
|---|---|---|---|---|
| (Wicher, 2020) | The COVID-19 case as an example of Systems Thinking usage | 15 March 2020 | Blog | [26] |
| (Bradley et al., 2020) | A systems approach to preventing and responding to COVID-19 | 28 March 2020 | Paper in a peer-reviewed journal | [16] |
| (Sahin et al., 2020) | Developing a Preliminary Causal Loop Diagram for Understanding the Wicked Complexity of the COVID-19 Pandemic | 18 June 2020 | Paper in a peer-reviewed journal | [12] |
| (Bahri, 2020) | The Nexus Impacts of the COVID-19: A Qualitative Perspective | 8 August 2020 | Preprint | [14] |
| (Tonnang et al., 2020) | COVID-19 Emergency public health and economic measures causal loops: A computable framework. In COVID-19 | 10 September 2020 | Preprint | [15] |
| (Klement, 2020) | Systems Thinking About SARS-CoV-2 | 28 October 2020 | Paper in a peer-reviewed journal | [13] |
| (Kontogiannis, 2021) | A qualitative model of patterns of resilience and vulnerability in responding to a pandemic outbreak with system dynamics | 10 November 2020 | Paper in a peer-reviewed journal | [4] |
| (Zięba, 2021) | How can systems thinking help us in the COVID-19 crisis? | 8 June 2021 | Paper in a peer-reviewed journal | [2] |
Table 2.
Network motifs used for analysis. Nodes highlighted with red depict impacting components, nodes highlighted with green depict impacted components. In the cases of bidirectionality and feedback loops, it is assumed that there is no dominant impact in any direction.
Table 2.
Network motifs used for analysis. Nodes highlighted with red depict impacting components, nodes highlighted with green depict impacted components. In the cases of bidirectionality and feedback loops, it is assumed that there is no dominant impact in any direction.
| # | Motif Name | Motif Description (Following [33]) | Motif Schematic View |
|---|---|---|---|
| (i) | Bidirectionality | A node impacts and is impacted by another adjacent node |  |
| (ii) | Multiple causes | Two non-adjacent nodes impact another node, adjacent to both of them |  |
| (iii) | Multiple effects | A node impacts two adjacent nodes which are non-adjacent between each other |  |
| (iv) | Indirect effect | A node impacts a non-adjacent node through a third node |  |
| (v) | Moderated effect | A node impacts an adjacent node both directly and through a third node |  |
| (vi) | Feedback loop (3 components) | Three adjacent nodes impact each other in one direction, i.e., clockwise, or counterclockwise |  |
Table 3.
Research questions addressed by the reviewed studies.
| CLD ID | Research Question/Focus |
|---|---|
| (Wicher, 2020) | “I focused on the media and my role, as an individual, in the COVID-19.” |
| (Bradley et al., 2020) | “<…> provide a framework to look beyond the chain of infection and better understand the multiple implications of decisions and (in)actions in face of such a complex situation involving many interconnected factors.” |
| (Sahin et al., 2020) | “<…> visualise the complexity in managing the COVID-19 pandemic through a systems lens by identifying the interconnectivity between health, economic, social and environmental aspects.” |
| (Bahri, 2020) | “<…> provide readers a qualitative analysis how the COVID-19 may affect our susceptible population, healthcare facilities and economy.” |
| (Tonnang et al., 2020) | “<…> envision linkages between the elements of the contagion, healthcare, and the economy, and visualize key components that characterize the whole system.” |
| (Klement, 2020) | “<…> try to identify and study system structures and causal loops of the problem at hand, integrating all relevant disciplines within an inter- and transdisciplinary approach.” |
| (Kontogiannis, 2021) | “<…> unravel the nexus of social and institutional forces that affect the parameters of ‘system dynamics’ models <…>”; “<…> explore how CLDs, their modular blocks (i.e., system archetypes) and leverage points could be used to model <…> principles of resilience.” |
| (Zięba, 2021) | “How do businesses respond to the prolonged exposure to the COVID-19 crisis? What kind of actions are they prone to undertake and what are the drivers of those actions?” |
Table 4.
Comparative statistics of graph representations of the reviewed CLDs. The CLD highlighted in italics is an outlier in terms of average degree.
Table 4.
Comparative statistics of graph representations of the reviewed CLDs. The CLD highlighted in italics is an outlier in terms of average degree.
| CLD ID | |||
|---|---|---|---|
| (Wicher, 2020) | 21 | 37 | 3.52 |
| (Bradley et al., 2020) | 21 | 34 | 3.24 |
| (Sahin et al., 2020) | 38 | 88 | 4.63 |
| (Bahri, 2020) | 24 | 42 | 3.50 |
| (Tonnang et al., 2020) | 50 | 91 | 3.64 |
| (Klement, 2020) | 25 | 42 | 3.36 |
| (Kontogiannis, 2021) | 78 | 125 | 3.21 |
| (Zięba, 2021) | 17 | 32 | 3.77 |
| Mean | 34 | 61 | 3.61 |
Table 5.
Classification of system components following Vester.
| Active | Passive | Critical Hubs | ||
|---|---|---|---|---|
| Out-degree | In the top decile | Any | Not in the top decile | In the top decile |
| In-degree | Any | In the top decile | Not in the top decile | In the top decile |
| Product of in-degree and out-degree | Any | Any | In the top decile | In the top decile |
| Active/passive quotient | >1 | <1 | Any | 1 |
Table 6.
Design and analysis features of the reviewed CLDs10.
Table 6.
Design and analysis features of the reviewed CLDs10.
| CLD ID | Design Procedure | List of Components, Links, and Feedback Loops | Visualization Features | Software Implementation | Analysis Methods |
|---|---|---|---|---|---|
| (Wicher, 2020) | Based on an analytical article | N/A | Feedback loops marked | N/A | Feedback loops |
| (Bradley et al., 2020) | N/A | N/A | The essential feedback loop is highlighted by color | Vensim | Feedback loops |
| (Sahin et al., 2020) | Based on expert workshops | Components | Subsystems highlighted by colored areas; feedback loops marked | Vensim | Feedback loops |
| (Bahri, 2020) | Based on data analysis and literature review | N/A | Separate CLDs of subsystems and archetypes; feedback loops marked | Vensim | Feedback loops, system archetypes |
| (Tonnang et al., 2020) | Formal description of the development process | Feedback loops | Subsystems highlighted by colored links; feedback loops marked | Vensim | Feedback loops |
| (Klement, 2020) | Built upon existing CLD | N/A | Subsystems highlighted by colored areas; feedback loops marked | N/A | Feedback loops |
| (Kontogiannis, 2021) | Built upon an existing SIR model and expert interviews | Feedback loops | Separate CLDs of archetypes; archetypes highlighted by color on the main CLD; feedback loops marked | Vensim | Feedback loops, system archetypes |
| (Zięba, 2021) | Based on “mental database, observation, and intuitive approach” | N/A | Feedback loops marked | Vensim | Feedback loops |
Publisher’s Note: MDPI stays neutral with regard to jurisdictional claims in published maps and institutional affiliations. |
© 2021 by the authors. Licensee MDPI, Basel, Switzerland. This article is an open access article distributed under the terms and conditions of the Creative Commons Attribution (CC BY) license (https://creativecommons.org/licenses/by/4.0/).
Share and Cite
MDPI and ACS Style
Strelkovskii, N.; Rovenskaya, E. Causal Loop Diagramming of Socioeconomic Impacts of COVID-19: State-of-the-Art, Gaps and Good Practices. Systems 2021, 9, 65. https://0-doi-org.brum.beds.ac.uk/10.3390/systems9030065
AMA Style
Strelkovskii N, Rovenskaya E. Causal Loop Diagramming of Socioeconomic Impacts of COVID-19: State-of-the-Art, Gaps and Good Practices. Systems. 2021; 9(3):65. https://0-doi-org.brum.beds.ac.uk/10.3390/systems9030065
Chicago/Turabian StyleStrelkovskii, Nikita, and Elena Rovenskaya. 2021. "Causal Loop Diagramming of Socioeconomic Impacts of COVID-19: State-of-the-Art, Gaps and Good Practices" Systems 9, no. 3: 65. https://0-doi-org.brum.beds.ac.uk/10.3390/systems9030065
Note that from the first issue of 2016, this journal uses article numbers instead of page numbers. See further details here.