An Autonomous Low-Power LoRa-Based Flood-Monitoring System


Department of Industrial and Information Engineering, University of L’Aquila, 67100 L’Aquila, Italy
*
Author to whom correspondence should be addressed.
J. Low Power Electron. Appl. 2020, 10(2), 15; https://0-doi-org.brum.beds.ac.uk/10.3390/jlpea10020015
Submission received: 26 March 2020
/
Revised: 18 April 2020
/
Accepted: 6 May 2020
/
Published: 10 May 2020
Abstract
:The development of Internet of Things (IoT) systems is a rapidly evolving scenario, thanks also to newly available low-power wide area network (LPWAN) technologies that are utilized for environmental monitoring purposes and to prevent potentially dangerous situations with smaller and less expensive physical structures. This paper presents the design, implementation and test results of a flood-monitoring system based on LoRa technology, tested in a real-world scenario. The entire system is designed in a modular perspective, in order to have the capability to interface different types of sensors without the need for making significant hardware changes to the proposed node architecture. The information is stored through a device equipped with sensors and a microcontroller, connected to a LoRa wireless module for sending data, which are then processed and stored through a web structure where the alarm function is implemented in case of flooding.
1. Introduction
Wireless sensor networks (WSNs) include many fields of application, made increasingly possible by Internet of Things (IoT) solutions. The ability to easily connect devices for the purpose of data collection and to create networks with different specifications makes these flexible structures suitable for a wide variety of applications [1,2,3,4,5,6,7,8,9,10,11,12,13,14]. Very often, one of the characteristics of a node belonging to a WSN is extremely low energy consumption, since this device must operate via battery power [15,16,17,18]. In this regard, low-power wide area networks (LPWANs) are considered particularly suitable thanks to their relatively low operating power and the large distance covered [19,20].
Among the new leading technologies in this area, we consider LoRa [21,22,23], based on the chirp spreading spectrum (CSS) technique, currently most frequently used with the LoRaWAN Medium Access Control (MAC) level [24,25,26]. This technology stands out for its easy use, its high energy efficiency, and its excellent performance in environments where the signal to noise ratio (SNR) is low. WSN structures are particularly useful in environmental phenomena monitoring, especially in scenarios where the occurrence of an event can lead to significant safety problems [27,28,29].
Flooding is a common event in rural and urban environments where the presence of water is due both to geographical features, such as rivers or lakes and to the proximity of sensitive urban elements. Flooding can present a high level of risk. For example, the flooding of roads can damage infrastructure. Besides endangering public safety, this can have economic and social repercussions. [30,31]. Flooding can be caused by adverse rain conditions, wind, temperature changes [32]. A forecast based on a theoretical approach to this event is complex [33] and often not rapidly obtainable, therefore the development of early warning systems [34,35,36,37,38,39,40] is useful and necessary. In this work, a flood-monitoring system was developed, designed for installation and use in urban and non-urban settings, to obtain an early warning of the possible phenomenon. This would enable the implementation of countermeasures that would inform the user of the possible risks or, in the event of service disruption, the implementation of resolution strategies. One of the main objectives of this paper is the reliability of the device, for which a customized electronic board has been created. It includes the data collection and transmission functions, powered by a battery supported by a solar harvesting mechanism. Another important specification is the modularity of the configuration which will be discussed later.
The implemented system is formed by a sensor node based on a low consumption microcontroller, equipped with a LoRa wireless module for data transmission, all powered by a 3.7 V lithium battery recharged through sunlight using a photovoltaic cell and a dedicated charging module. Using this approach, it was possible to obtain a good energy performance, while maintaining the possibility of obtaining a wide coverage range for radio communication.
This paper is structured as follows. Section 2 reports an overview and comparison with related works. At the beginning of Section 3, an overview of LoRa and LoRaWAN is provided. In Section 3.2 the general architecture of the system is described. Then the design and the practical implementation of the hardware structure that creates the WSN sensor node, as well as the organization and description of the web section for data manipulation, are presented. In Section 4 the article reports the results related to the energy performance of the node. Finally, it is shown that the system can be used to manage the remotely received data, on which the early warning can be implemented.
2. Related Works
In Table 1 a comparison with selected related works, dealing with WSN implementation of flood-monitoring systems, is reported. All the considered works deal with a flood-monitoring system, even if with different approaches. In [34,35], a neural network-based approach is shown. The prediction models offer a useful instrument for the time of flooding estimation but strongly rely on the coefficient of determination of the algorithms. A more detailed description of the hardware configuration of the structures is missing, as the works are more focused to describe the developed neural model. In [36], a GSM-based flood and earthquake detection and rescue system is presented. An earthquake or flooding event triggers an SMS alert to authorities and sonorous and visual alarm for the nearby civilians. The system is composed by an Arduino Mega 2560 [41] based sensor node and a separated alarm unit that includes a siren and alarm light-emitting diodes (LEDs), along with an ESP8266 [42] that allows internet connection for remote data reading. Being the system composed of multiple different units, which also implement less energy-efficient radio technologies compared to LoRa, such as GSM [43] the overall energy efficiency is reduced. The system includes different discrete electronic boards that need to be programmed separately, making the firmware updating a more complex process, along with increasing the manufacturing cost. The final electronic board is not well suited to outdoor working conditions, as it does not feature any enclosure. The paper does not provide a detailed description of the results and of the web structure used for managing and displaying the data obtained. In [37], a survey on the transmission behavior and reliability between the sensor nodes and the hubs of the WSN is presented. In this paper, tests have been performed to study the transmission quality of the node-gateway connection at different height dislocations of the devices, and different antenna polarization setups. A more in-depth description of the nodes and hub hardware structure is missing. The paper does not deal with the implementation and description of a data analysis structure following the physical layer. In [38], the application of a LoRa and narrowband Internet of Things (NB-IoT) flood-monitoring system to the development of a damage insurance map is reported. The deployment of a WSN to contribute public data collection to the Storm and Flood Damage Insurance Map in Korea is proposed. An overview of the hardware setup is not provided, along with a description of the testing methods and results. In [39], a LoRa sensor node side analysis is carried out, with the discussion of a water height measuring approach showing how it is possible to measure water height through an ultrasonic sensor and implement a Twitter-based social network alarm, although this approach makes the alarm mechanism not generalizable to different alert interfaces. The database, interface and alarm developments are not reported. None of the above flood-monitoring system reported works present a focus on the node power consumption analysis in a WSN, albeit it being a topic of fundamental importance in the research area. In [40] the results achieved in energy management are worse compared to those of the proposed work because the sensor node uses a more expensive, high capacity 17 Ah, Saft LS33600 (Saft, Levallois-Perret, France) [44] battery, and the estimated discharge time is 3 years, which means in proportion to the presented work a higher energy consumption. Furthermore, no energy-harvesting technique has been implemented, so the battery must be replaced when exhausted. In comparison with the previously mentioned works, this paper reports the development of a flood-monitoring system providing details both on the hardware, firmware and server level. Moreover, in the proposed solution, it is shown the capability of miniaturization and shape adaptability of the sensors, because of the intrinsic nature of the implementation.
3. Materials and Methods
3.1. A View on LoRa and LoRaWAN
LoRaWAN [24,25,26] is a free network protocol, regulated by the LoRa Alliance [23], designed for use on devices where hard management of energy availability is required. The devices that implement this network functionality are based on chips that use the LoRa modulation technique [21,22]. LoRa technology sacrifices the speed of transmission to make long transmission distances obtainable, which makes it suitable for the realization of WSN systems where there is the need to send small amounts of data at regular intervals of time. Compared to other wireless IoT communication solutions based on the 802.15.4 standard [46], the aforementioned modulation allows taking advantage of much less sophisticated transceiver devices because the system does not require a highly accurate and expensive reference clock signal source. This translates into reduced module cost and superior energy performance. A comparison between LoRa and NB-IoT [47] is reported in [48]. The latter specifies that for LoRa based devices energy demand is lower compared to NB-IoT based devices, which present synchronization requirements. Compared to LoRa, the narrowband Internet of Things offers the advantage of higher data rates and lower latency, features that are not strictly necessary in the monitoring of slowly evolving environmental phenomena such as flooding.
In [49] an energy-efficiency comparison between LPWAN-based IoT devices is presented, reporting SigFox [50] having similar energy performances to LoRa, although the network coverage for SigFox can be more expensive and less accessible than LoRaWAN, which only requires a gateway deployment. A network coverage comparison between these LPWAN wireless technologies is reported in [20].
LoRa-based devices allow different radio communication parameters to be configured. Thus, allowing several data rates and sensitivity levels to be chosen based on the specific application requirements. Carrier frequency is the center frequency of the transmission band, located in ISM (industrial, scientific, and medical) bands that differ in various world regions, for Europe 868 MHz, for the US 915 MHz, and for Asia 433 MHz. Spreading factor (SF) is the ratio between symbol rate and chip rate, which can be selected from 6 to 12. A higher spreading factor increases SNR allowing communication over longer distances and in the presence of higher noise levels, yet time on-air is increased concerning lower SF, hence increasing energy consumption. Bandwidth (BW) is the range of frequencies used in the transmission band; higher BW means higher transmission speed but lower sensitivity due to the increased noise effects, lower BW instead allows more sensitivity at a lower data rate. Coding rate (CR) is the forward error correction rate used. A higher CR allows increased error protection at an increased time on air. Transmission power is the transceiver maximum output power during transmission interval, higher output power allows longer transmission range but increased energy consumption.
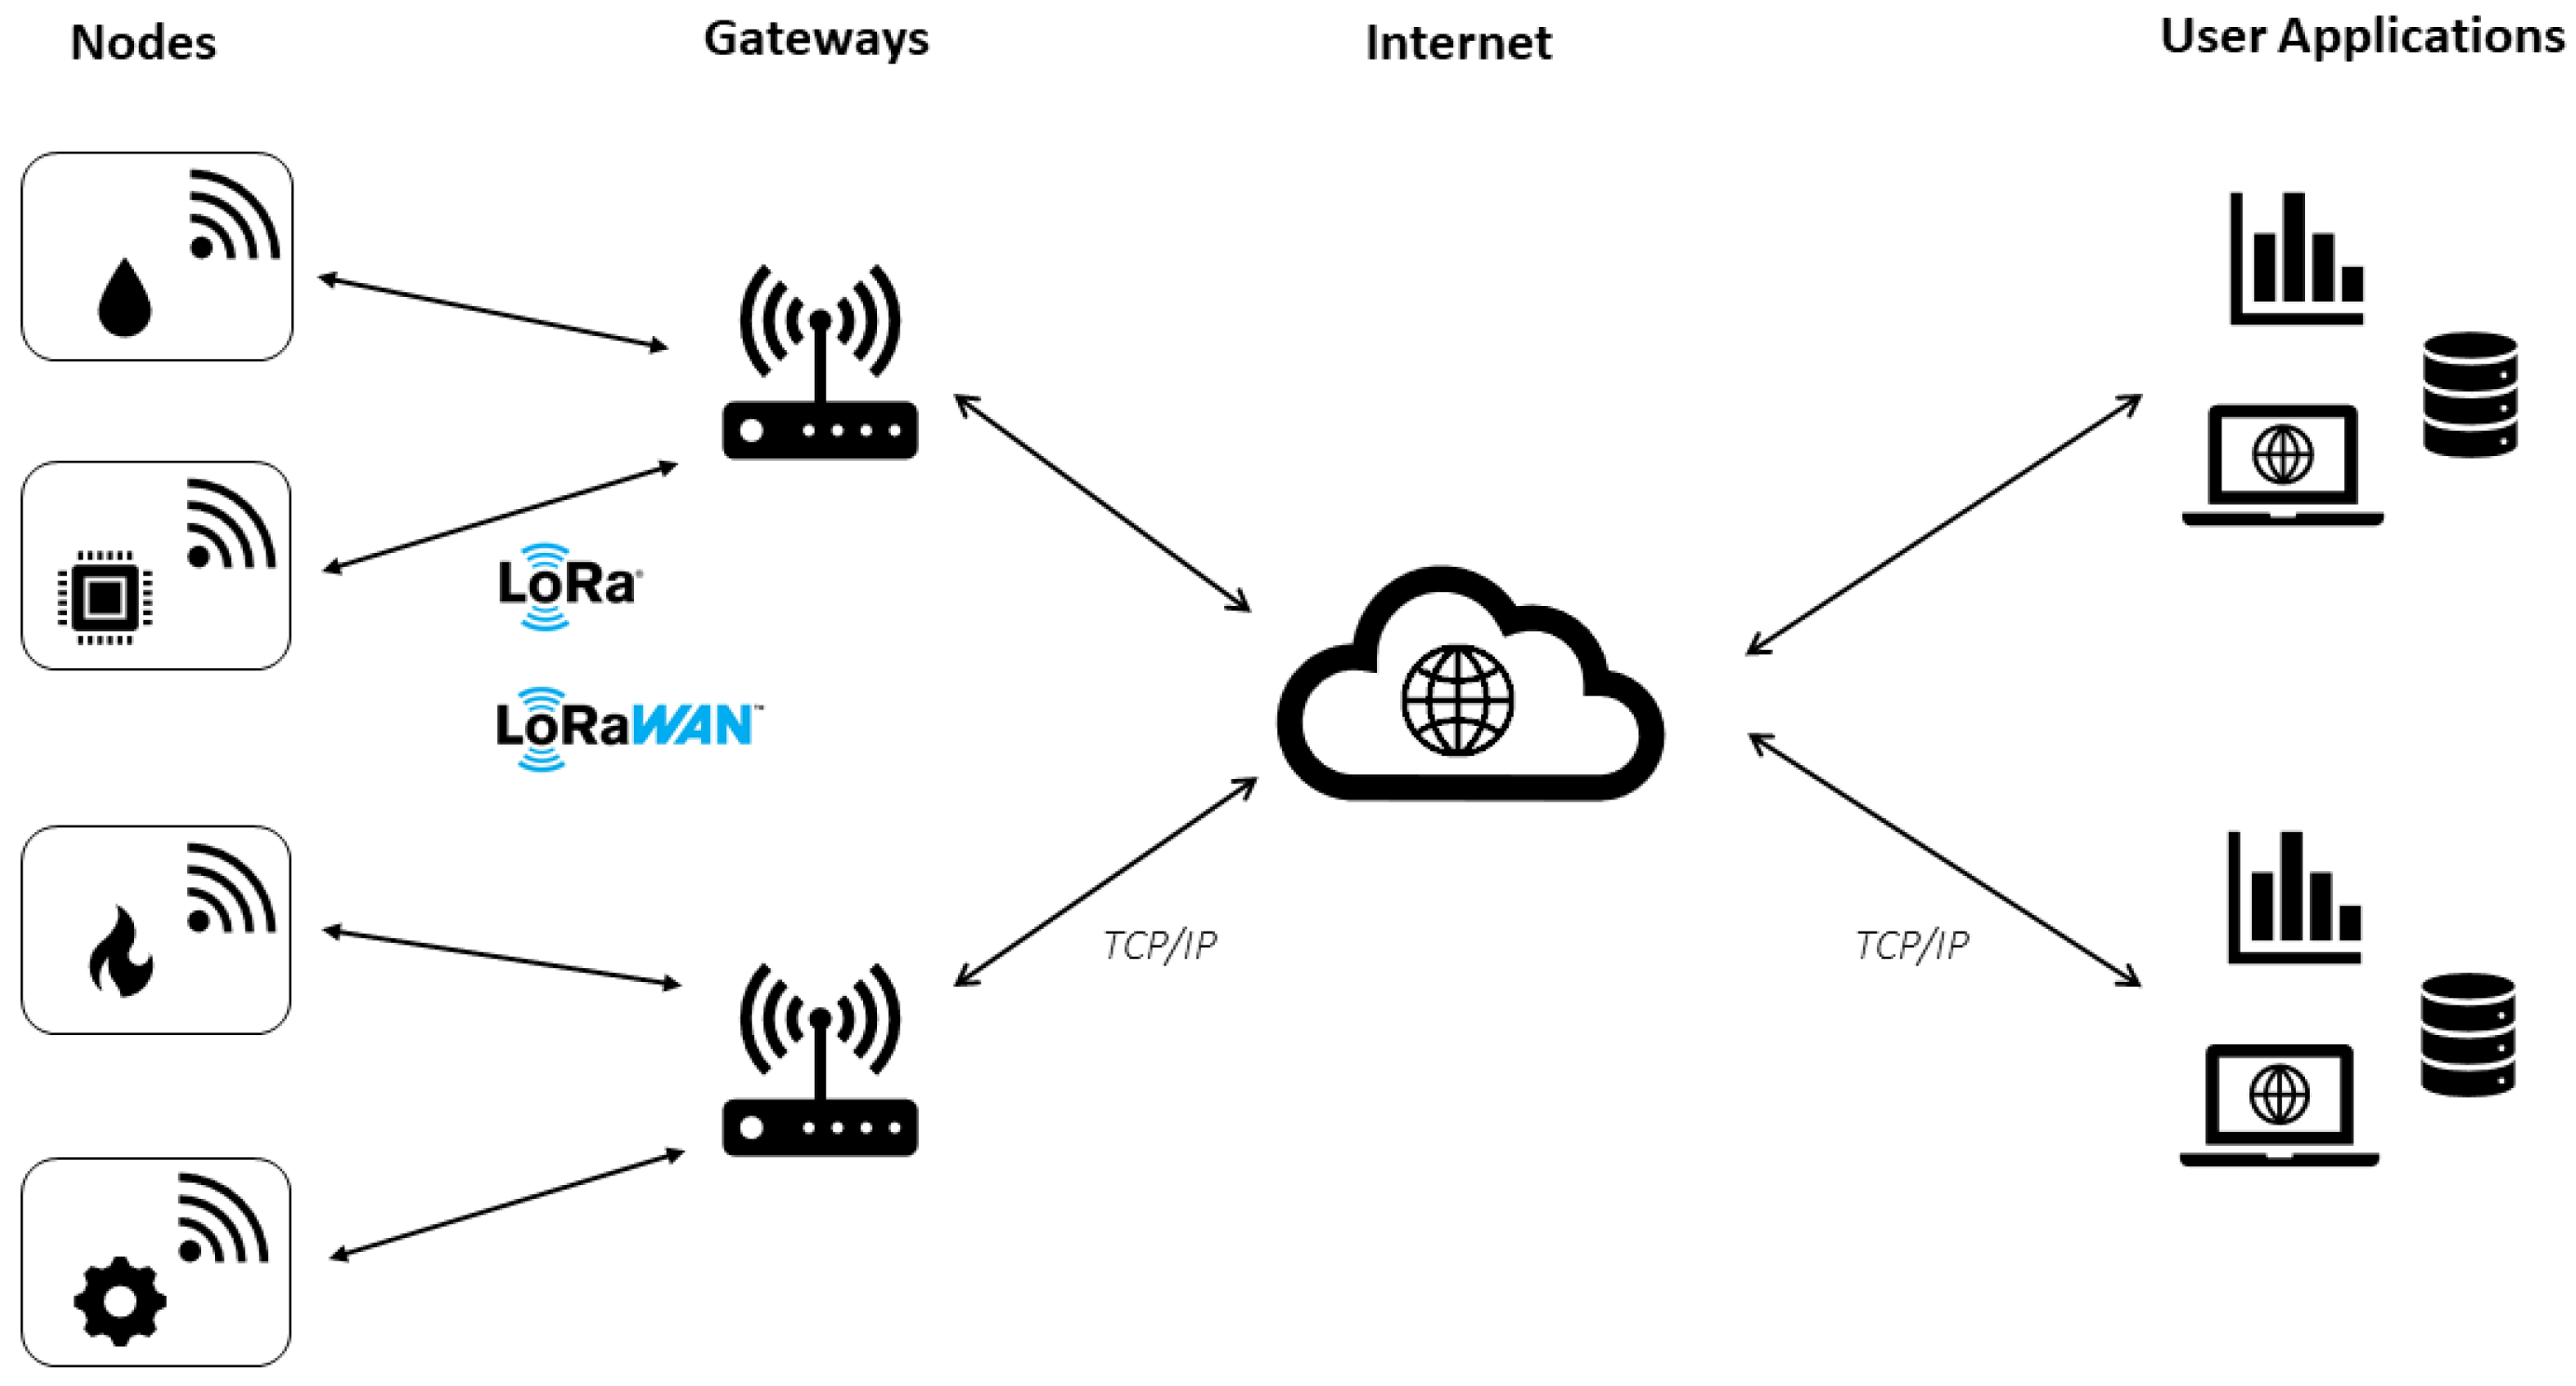
The LoRaWAN network architecture consists of devices that communicate with a central gateway through a single-hop connection. The gateway is organized in a star structure and acts as a bridge between the nodes and the cloud as shown in Figure 1.
3.2. The Proposed System Architecture
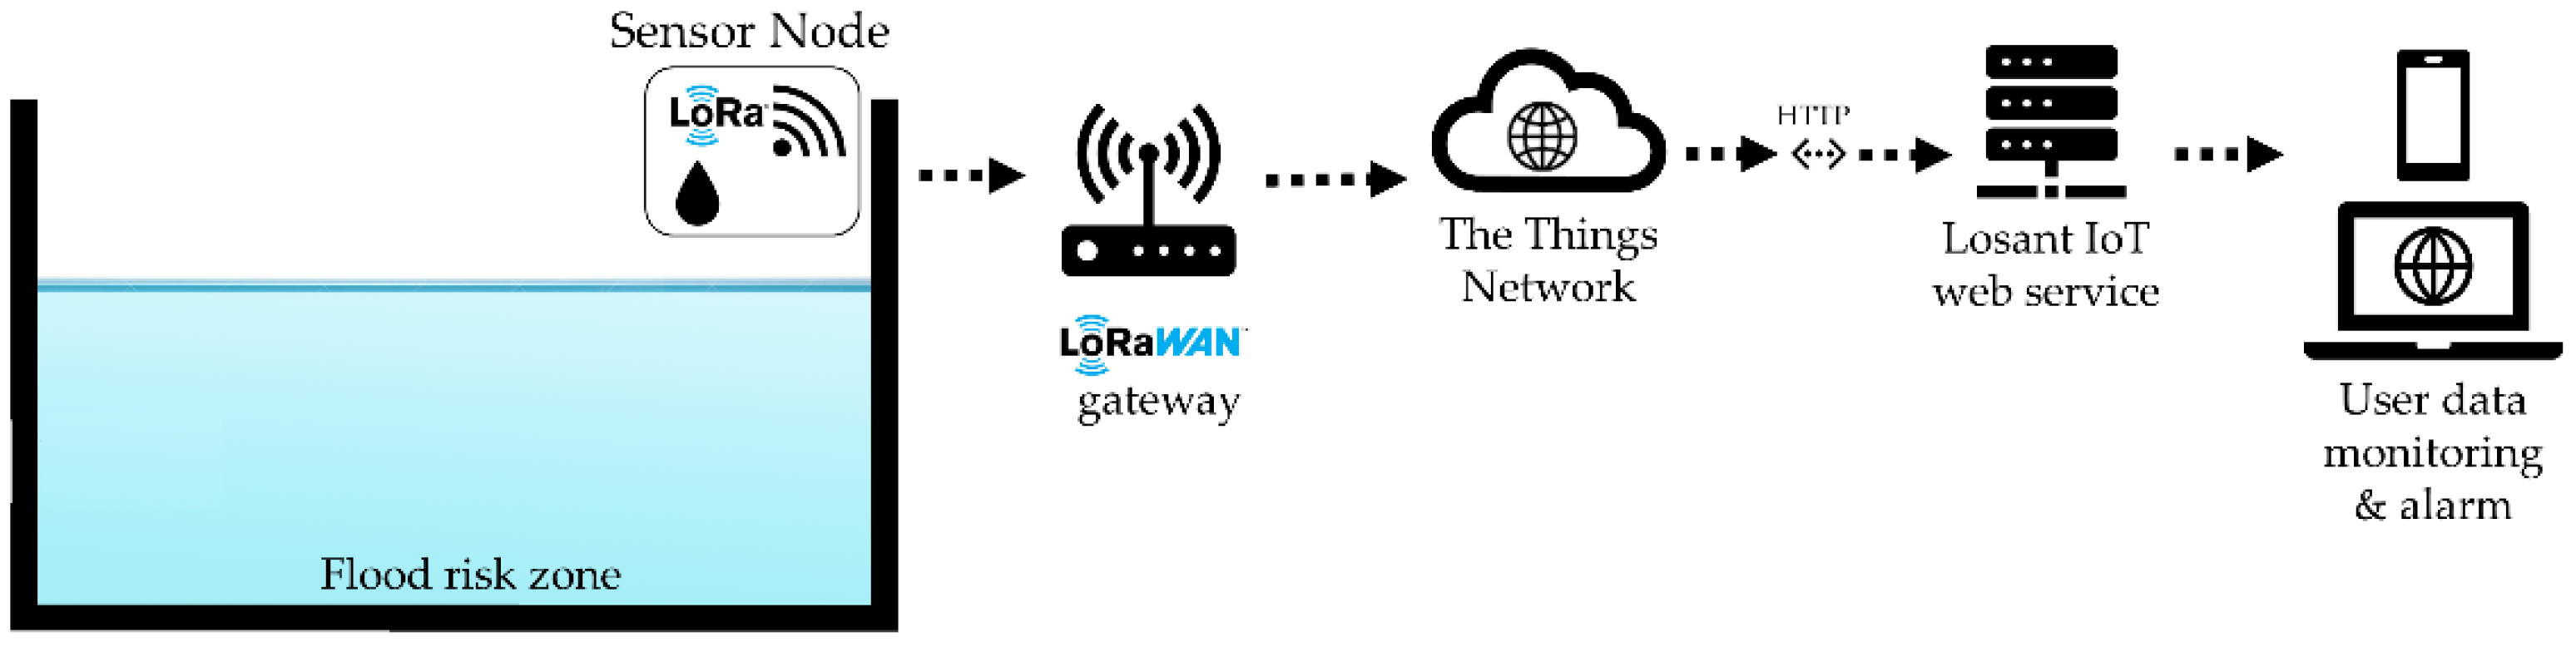
In Figure 2 the general application scheme of the proposed flood-monitoring system is presented. It has several key characteristics; among these, the most important is the low power consumption of the sensor node. The latter is not powered by the electrical network but supported by a renewable energy source like solar harvesting [51,52,53]. In addition, it can also be powered by a multisource harvesting technique [54,55,56,57]. The low power consumption has been also achieved by a dedicated operating algorithm that implements a deep sleep operation.
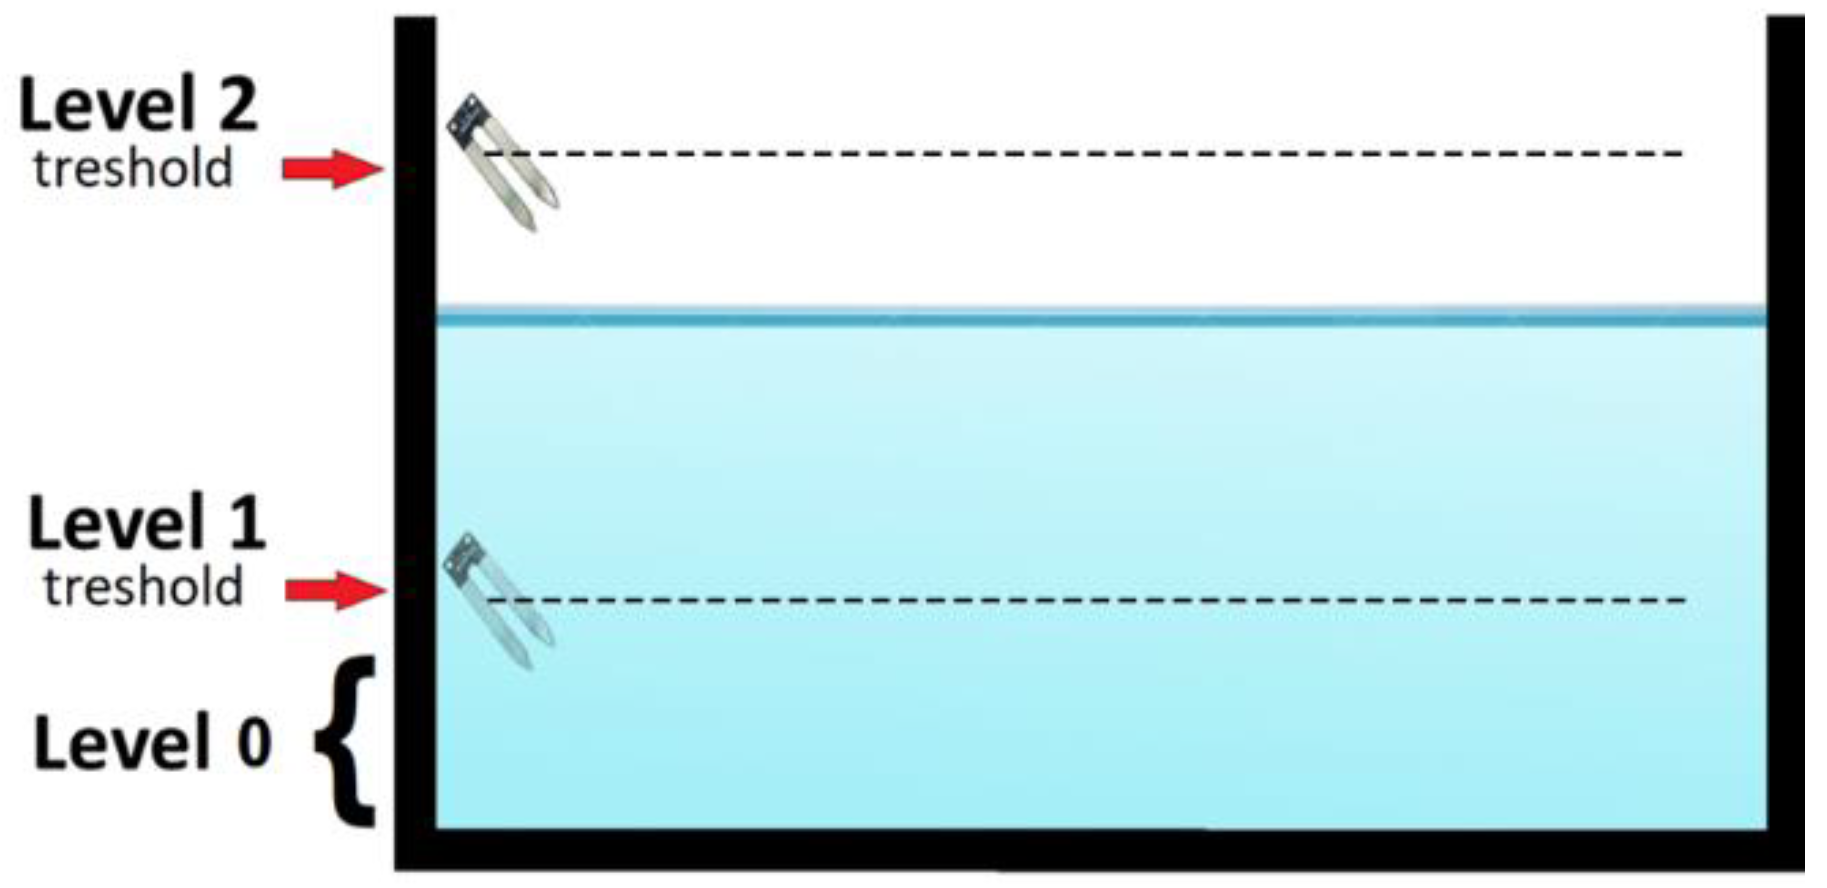
Concerning the flooding phenomenon, the entire dynamic of the possible presence of water has been partitioned in three zones (Figure 3): the first non-alert zone, an intermediate non-critical alarm zone, and a last maximum flooding partition. These areas are delimited by threshold levels where the sensors are positioned, so as to achieve a direct correspondence between water level and triggered alarm.
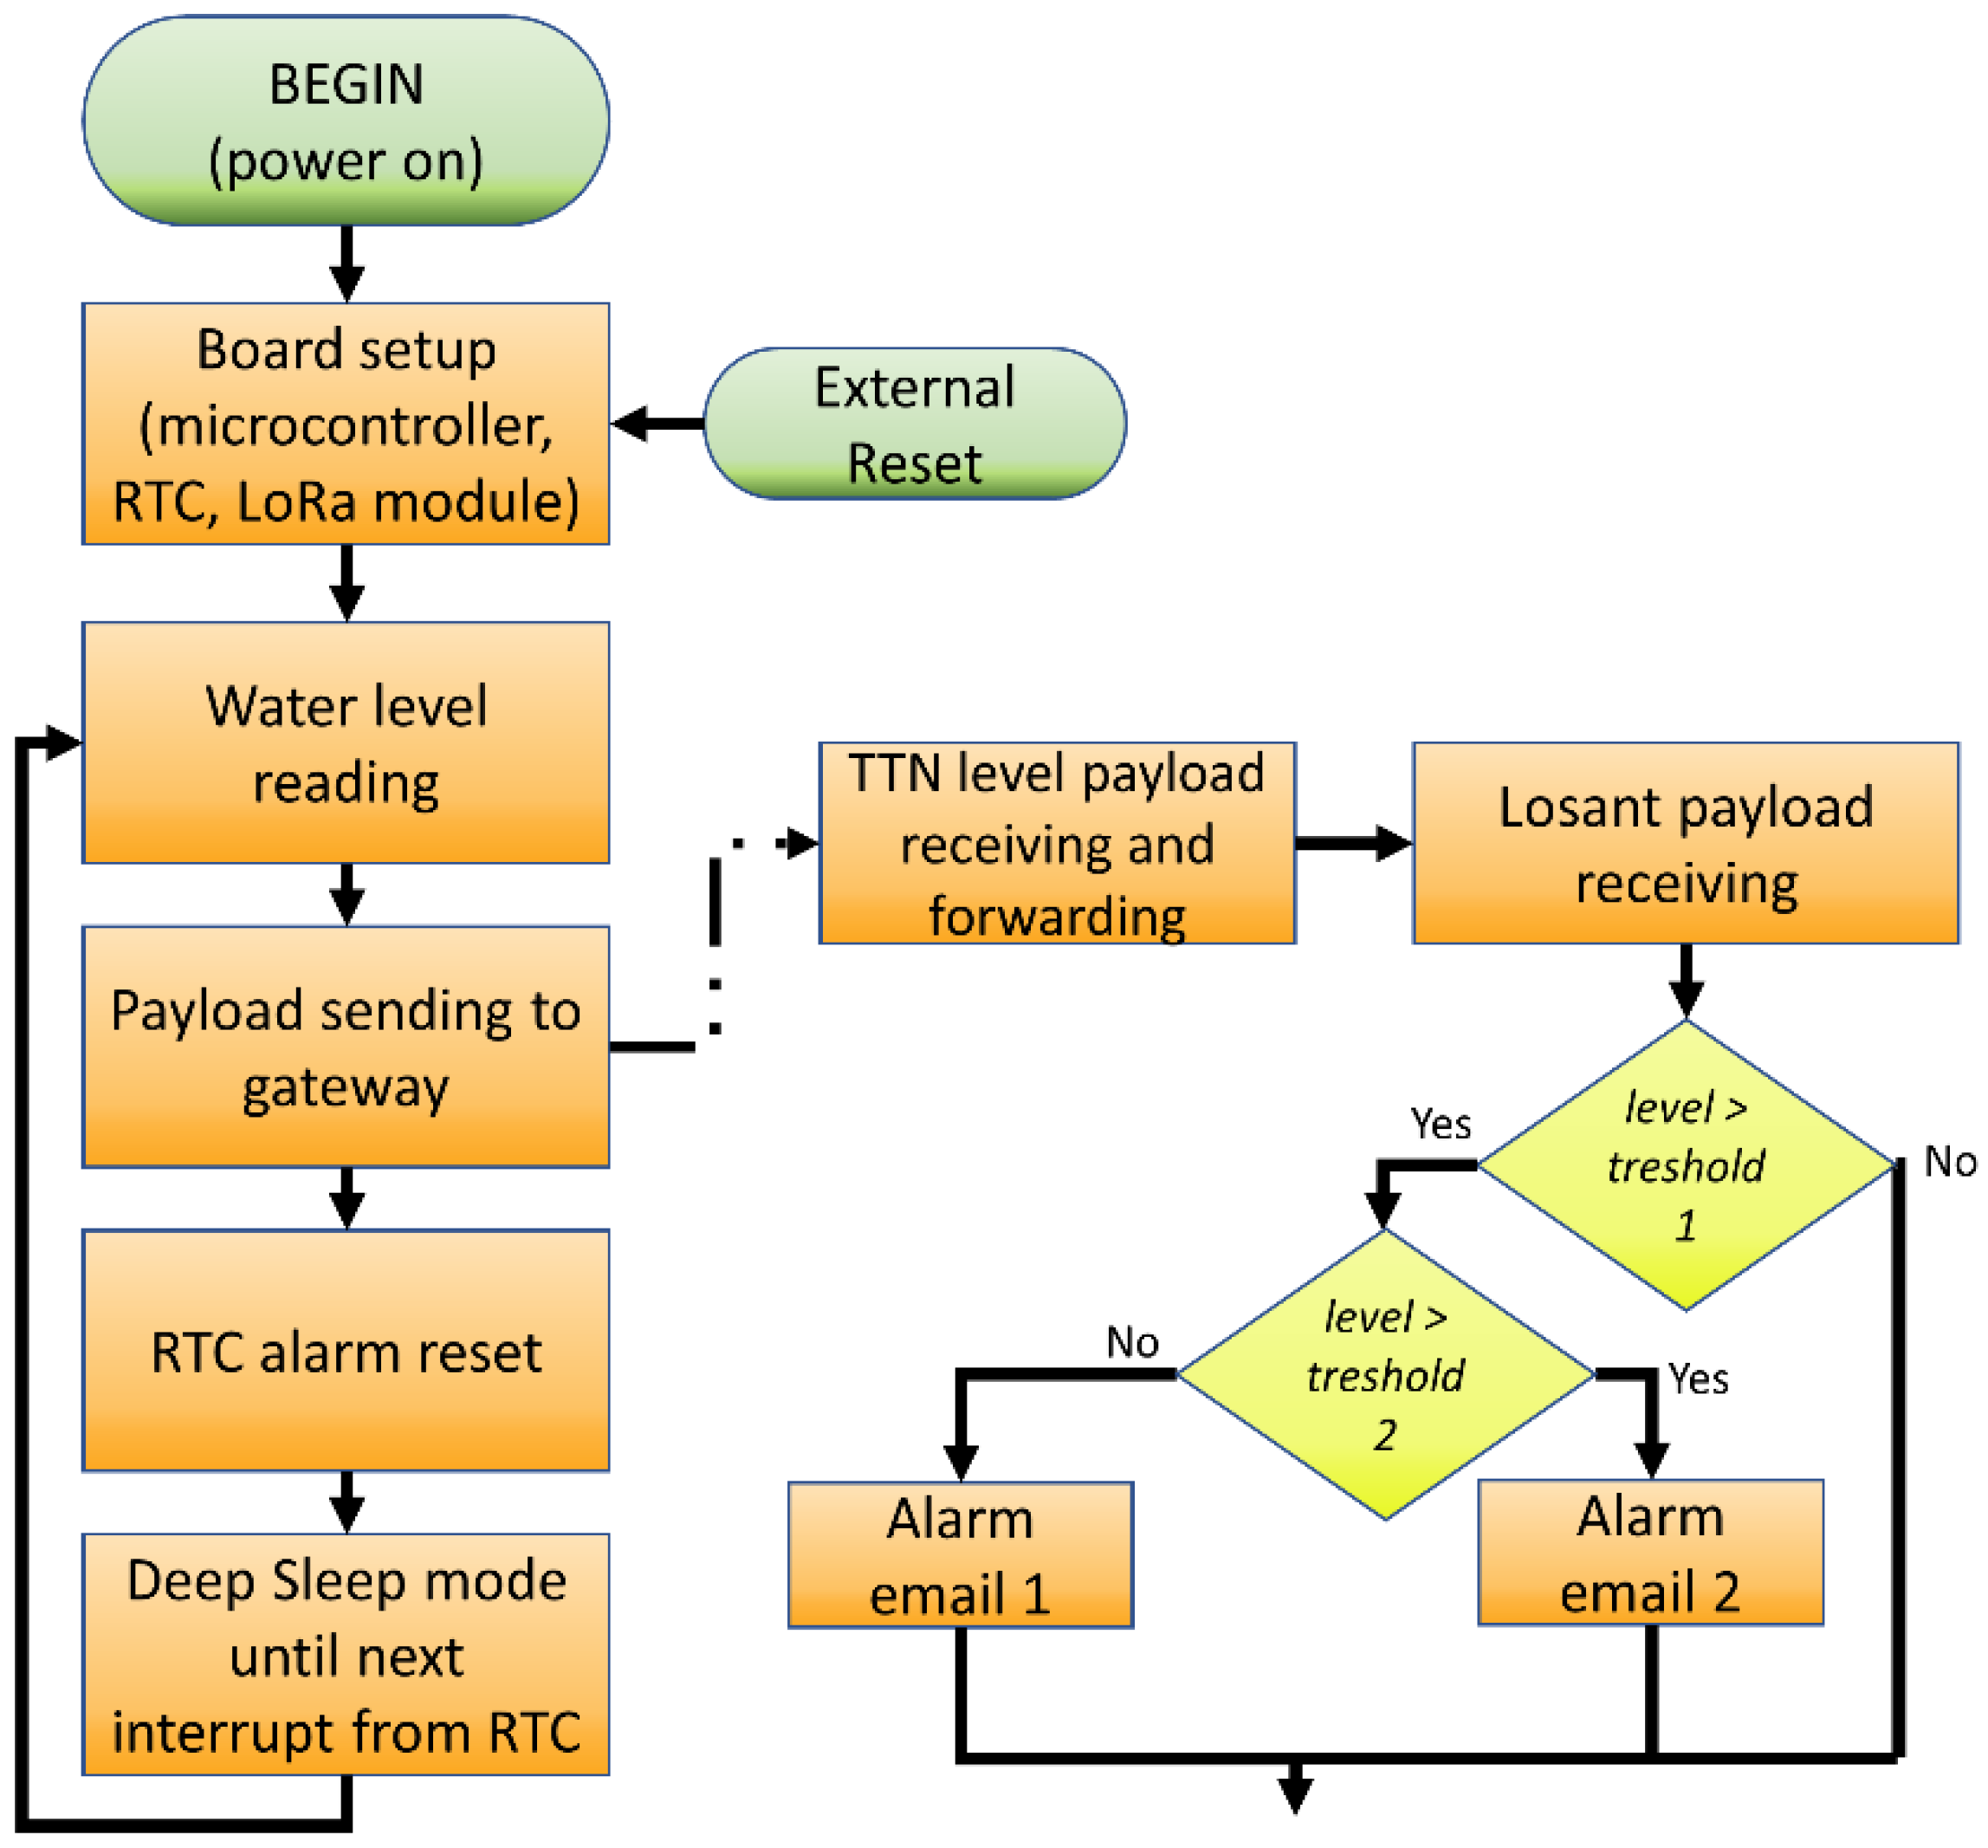
The entire structure of the system is based on the synergy between the hardware section, for the physical detection of data and transmission, and the Web section, for storage and temporal analysis as well as for the activation of an alert message in the case of flooding. The packets received at the LoRa gateway, in this case the Lorix One [58] device, are managed through The Things Network [59] service, where the sequence of incoming bytes is converted into a JavaScript Object Notation (JSON) object suitable for data exchange between websites through a payload decoding function. The object contains a key-value field where an integer numerical value is reported: 0 if the water is below level 1, for the intermediate level the value is 1, for maximum flooding value 2. Through HyperText Transfer Protocol (HTTP) integration, this key-value field is sent to the Losant IoT website [60] where data analysis and email alert functions are implemented.
The advantage of the use of such web services is the possibility of exchanging data between applications quickly and easily since interfacing is guaranteed at a very high level of abstraction; this is a fundamental aspect for achieving the goal of system modularity. For the correct operation and reliability of the system, the payload sending phase is designed to finish when a transmission acknowledgement is successfully obtained.
The flow chart of the implemented apparatus operation is depicted in Figure 4.
3.3. Sensor Node
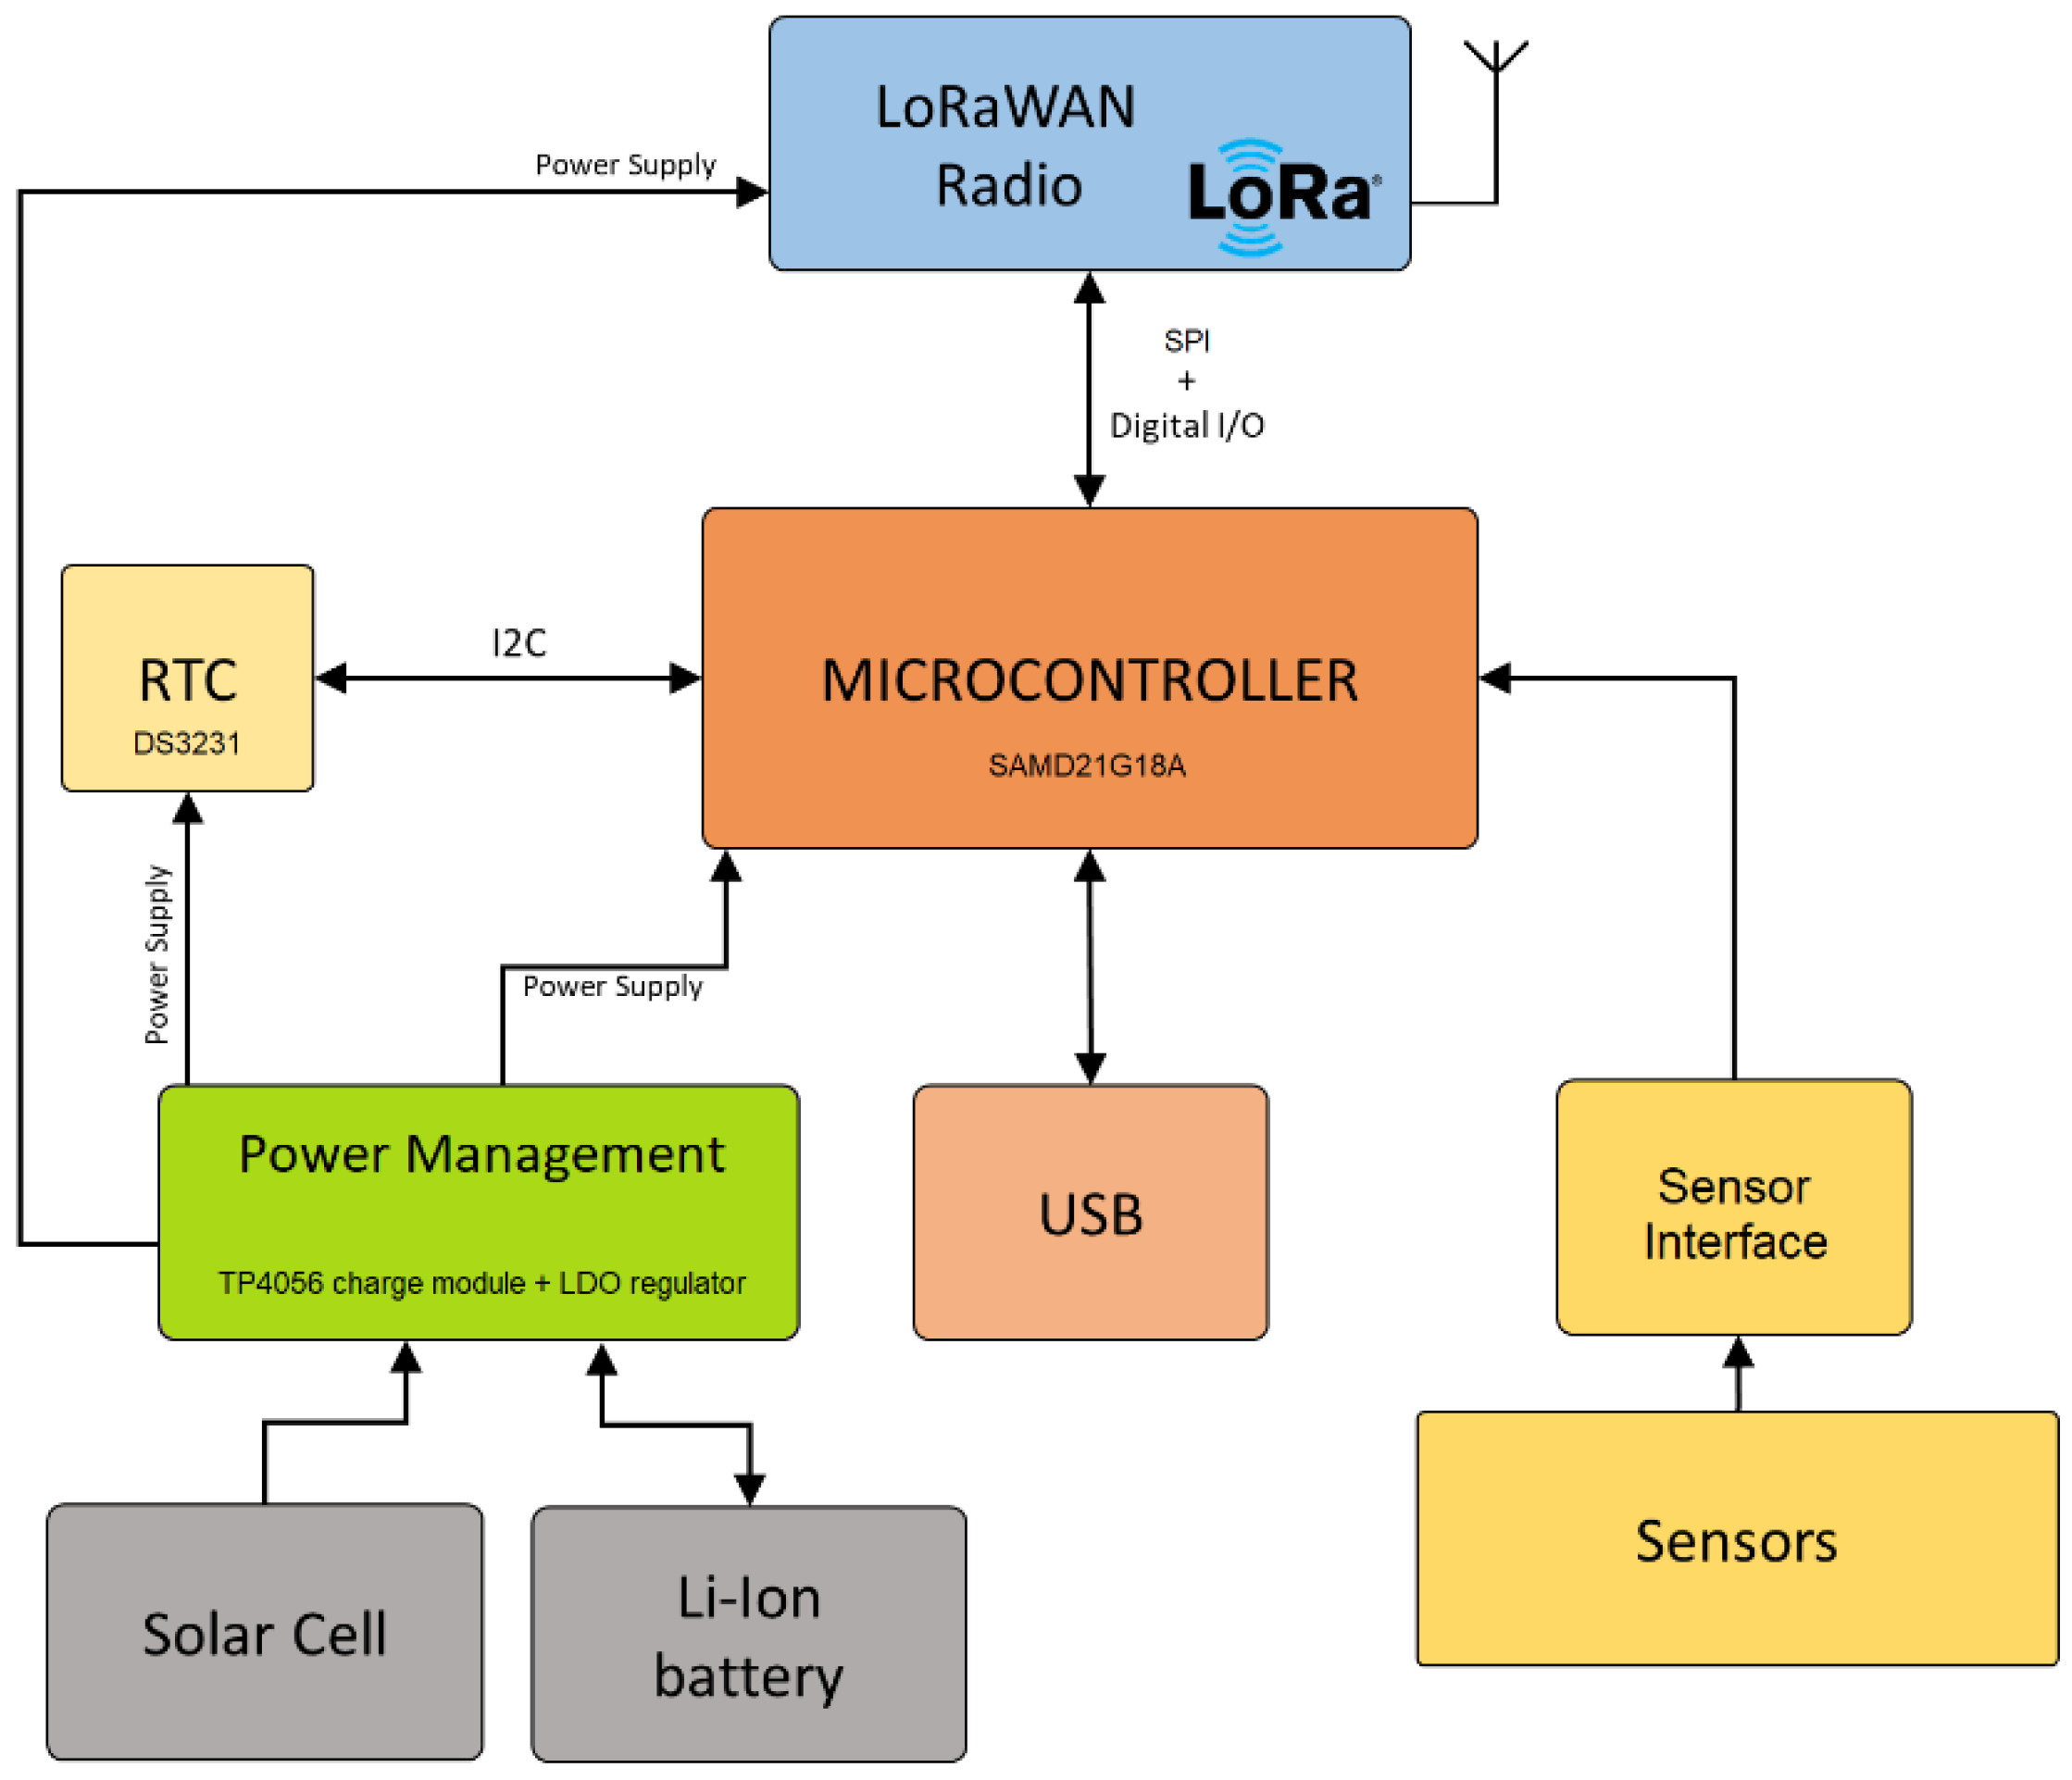
The sensor node is based on a customized electronic board equipped with a Microchip Atmel SAMD21 microcontroller, RFM95W LoRa module, sensor interface and 3.3 V voltage regulator. The printed circuit board is made on FR-4 support, with dimensions of 5 × 5 cm. The microcontroller, a central data processing unit, manages the external modules and the temporal control of actions as shown in Figure 5 at block scheme level. Communication between the microcontroller and LoRa module is implemented using a serial peripheral interface (SPI) along with dedicated digital Input/Output (I/O) lines. An 868 MHz monopole antenna is connected to the wireless module for radio communication. The external DS3231 real-time clock (RTC) (Maxim Integrated, San Jose, CA, USA) module, connected to the custom board, is interfaced by I2C protocol. External sensors are connected to the board in a bridge-based sensor interface circuit. The entire board is powered by a 3.7 V Li-Ion battery recharged using an external TP4056 charge regulator module. A universal serial bus (USB) interface is used for microcontroller firmware upload.
The physical sensors are forks of conductive material (model YL-69). In a standard situation between the metal terminals, the measured electrical resistance is very high. When the sensor comes into contact with the water, an immediate significant drop in the electrical resistance between the metal terminals is measured, allowing the reading of this structure using a resistive voltage divider. The key advantage of this solution is the simplicity and the reduced lumped elements count, which significantly lowers the overall costs for the system implementation. Besides the fact that voltage mode or current mode bridge-based solutions, like those proposed in [61,62,63,64,65], could be more effective for noise reduction, increased sensitivity and accuracy, they need a higher number of discrete components to be implemented. Moreover, the high resistance variation of the fork sensor in presence/absence of water leads to an ON/OFF behavior which can be clearly detected by a simple voltage divider architecture.
In addition, the simple voltage divider readout interface is quite effective for the goal of system modularity. In fact, the fork module could be replaced by any resistive sensor, while the produced output voltage swing can be adjusted by changing only the reference resistor of the voltage divider. This feature, in combination with the simple high level of abstraction for the data communication and exchange, leads to a general-purpose LoRaWAN sensor node architecture, which promotes modularity.
The output of the analog stage is then processed by the analog-digital converter (ADC) of the micro-controller and the subsequent mapping of the values obtained to identify flooding situations. The wall fixing of the sensors is achieved through the use of a custom enclosure developed using the fused deposition material (FDM) 3D printing technique in Figure 6.
The prevention of external disturbance actions on the sensors is easily achievable through the implementation of a fixed cover which provides a pair of small holes that allow the correct flow of water inside the enclosure.
The micro-controller, model Atmel SAMD21G18A (Microchip Technology, Chandler, AZ, USA) [66] from Microchip, features 32-bit arithmetic on ARM Cortex-M0 architecture, 256 KB flash memory, 12-bit analog to digital converter (ADC), SERCOM interfaces, USB 2.0 interface for connection with the computer. 52 I/O pins are available, all in a TQFP48 package. The firmware is loaded through the Arduino integrated development environment (IDE) [67] after the flash of the bootloader via Atmel in-circuit emulator (ICE) [68], for which specific pins have been dedicated to the electronic board.
In order to monitor the presence of water at given time intervals, it is necessary to carry out checks periodically, and therefore a precise time reference that does not degrade in the long run is needed. This function has been implemented through the use of a RTC model DS3231 (Maxim Integrated, San Jose, CA, USA) [69], with available externally programmable interrupts. The choice of the interval is related to the speed with which a flood can occur, which is of an order of magnitude ranging from minutes to hours [30,32], according to the structural characteristics of the mounting location. This parameter can be reconfigured over LoRaWAN by the implementation of a downlink frame at the end of every reading cycle where the value is obtained on the server-side, making remote management possible.
The on-board LoRa module is the RFM95 [70] model from HopeRF Electronics. With the small dimensions of 1.6 cm × 1.6 cm this component can be easily installed on the board. The component datasheet specified supply current absorption for BW 125 kHz, 13 dBm power output, SF12 is 0.2 µA in sleep mode, 11.5 mA in receiver mode and 28 mA during transmission. For the combination of spreading factor (SF8) and bandwidth (125 kHz) used, the typical sensitivity from the datasheet is −126 dBm. Spreading Factor 8 has been chosen because it is an intermediate setting for lower time on-air, which reduces energy consumption. It allows sufficient sensitivity for signal reception in the test location of choice.
- The antenna is connected to the wireless module by a U.FL surface mount connector placed at the end of a coplanar waveguide. Concerning the power supply module, in order to recharge the battery, a Seed Studio solar cell [71] with dimensions of 55 mm × 70 mm has been used. The solar panel is connected to a TP4056 charging regulator module [72] that features input voltage range from −0.3 V to 8 V with a maximum charge current of 1 A and short circuit protection, along with operating temperature range from −40 °C to +85 °C and USB recharge port.
The custom board, external charger and RTC modules are mounted in a 3D printed waterproof enclosure. The solar cell is mounted on the top cover of the enclosure and connected to the charging module by internal wires.
Energy Consumption Measurement Setup
As previously described, energy efficiency is a fundamental factor for a device belonging to an LPWAN. Measurements were performed on a Tektronix digital oscilloscope DPO 3032 (Tektronix, Beaverton, OR, USA) [74] and Tektronix’s current probe and amplifier AM 503B (Tektronix, Beaverton, OR, USA) [75]. The parameters for wireless transmission are listed in Table 2.
4. Results and Discussion
4.1. Energy Consumption Results
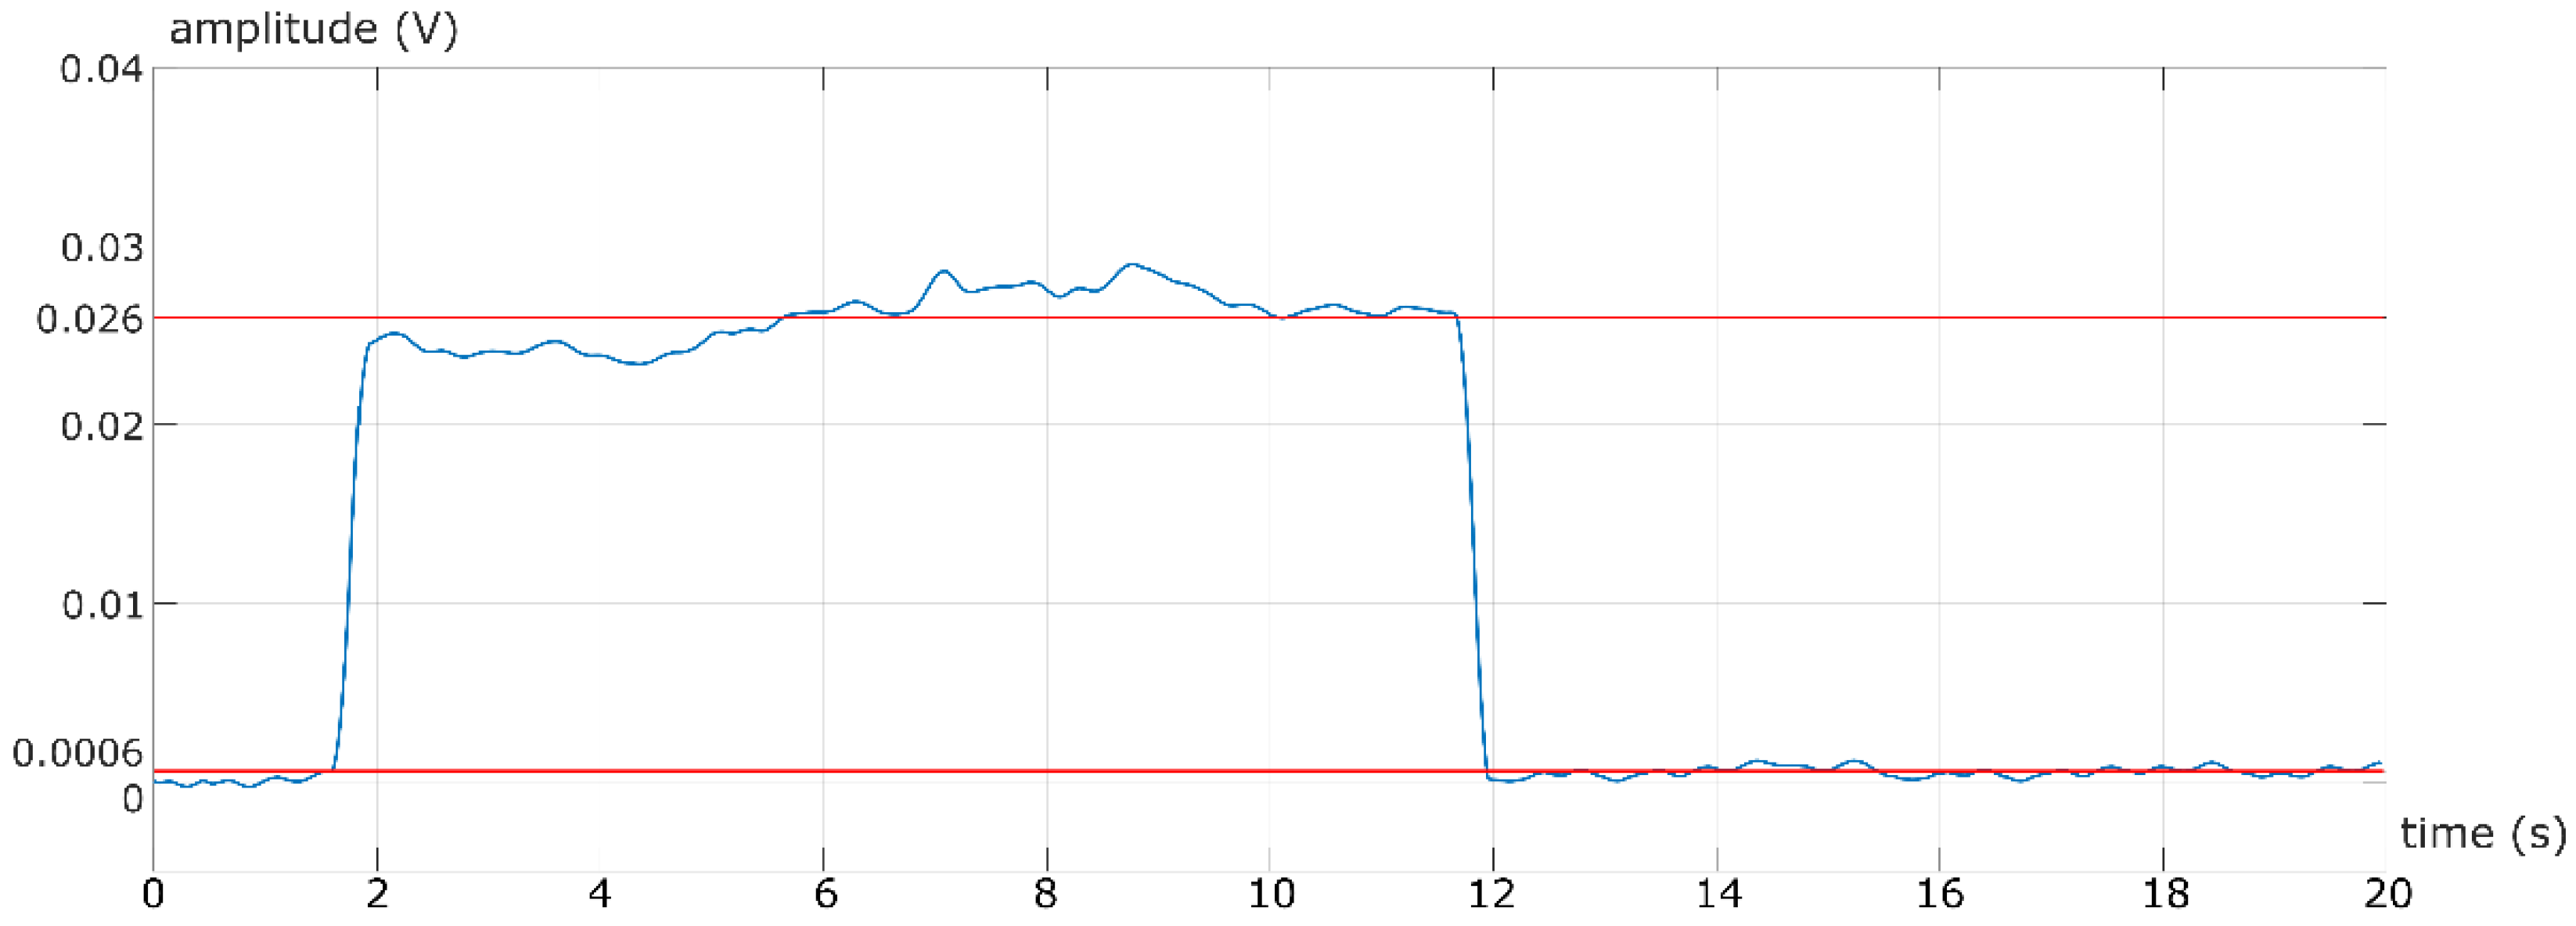
In Figure 8 a MATLAB plot from an oscilloscope sample set over 20 s is shown. A time slot of 10 s represents the board setup phase, immediately following the power on. In this period of time, the microcontroller is running the code to set every external module and interrupt capability. Then, there is the first standby phase which lasts until the next received interrupt from the RTC where a sensor value sample is taken and transmitted (this scenario is reported in Figure 9). For both Figure 8 and Figure 9, the vertical axis ticks show the current absorption values during both setup and standby phase. In the vertical scale, 10 mV corresponds to 5 mA, so it is, therefore, immediately able to obtain the current value in the idle time through a proportion; it is on average 13 mA during the setup time period. In the standby phase, the absorption of current drops to an average of 0.3 mA, or 300 µA.
This result is very important in light of the objective of obtaining a low power device. In a deeper in-depth analysis of the battery charge-discharge variations, it is appropriate to consider the actual different values of current absorption during the different time periods, especially during nighttime, where the node has to operate using the energy stored during the light hours.
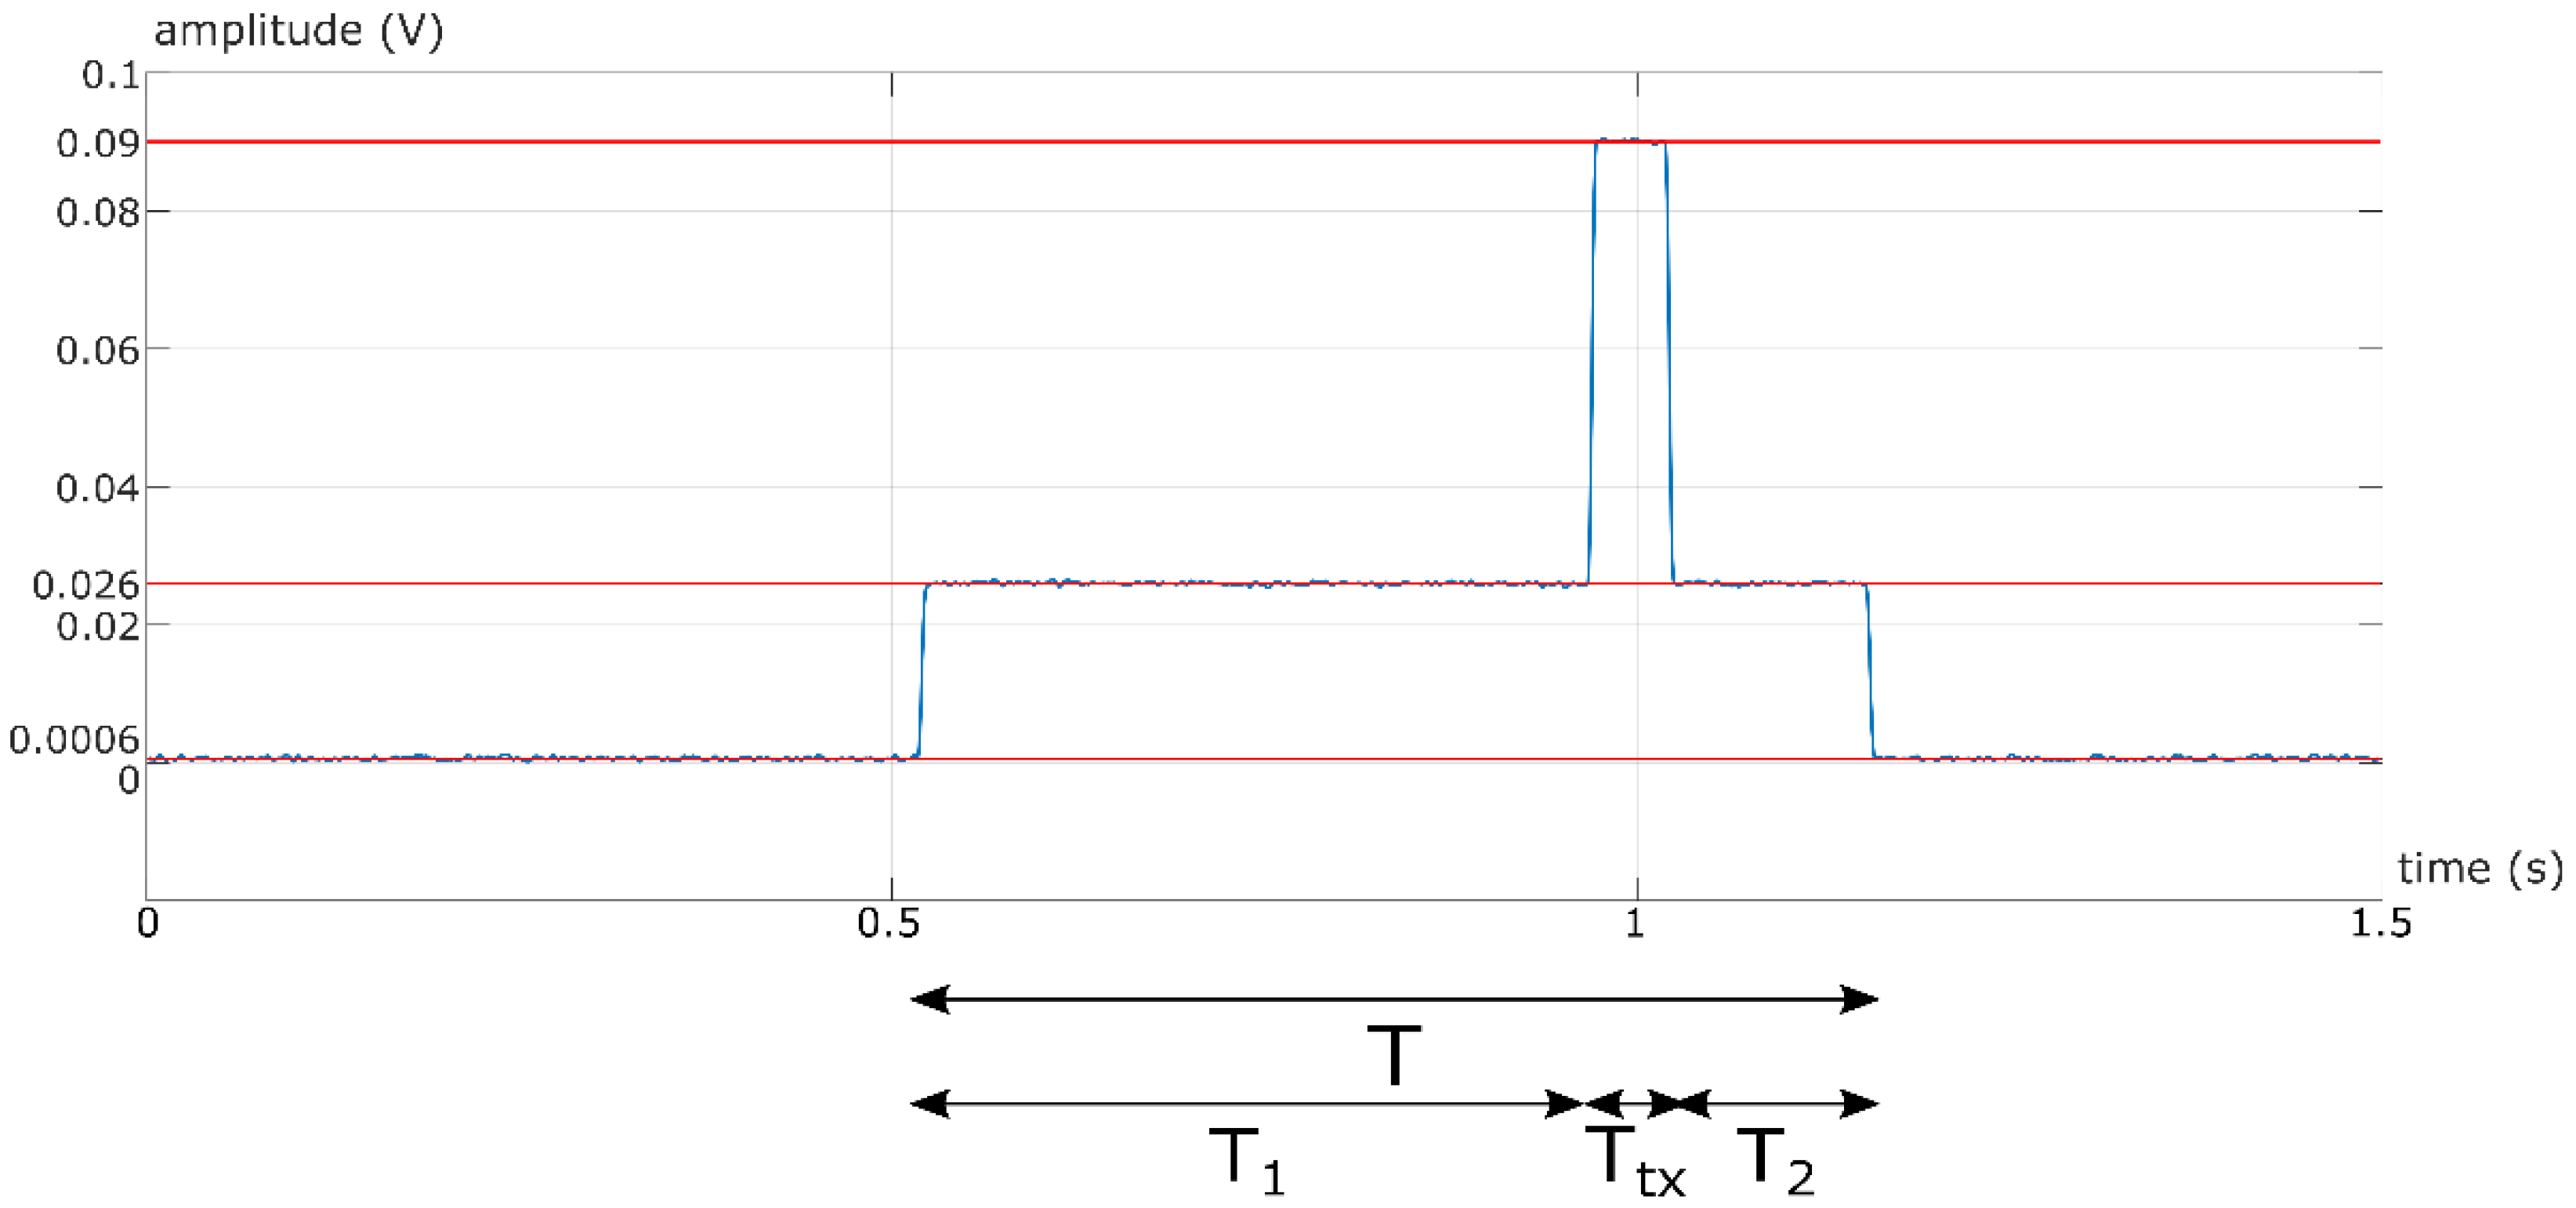
The average duration of a wake-up and transmission cycle is 0.64 s, with two idle phases, T1 = 0.45 s, where the sensor value is read and the data packet prepared for the transmission, and T2 = 0.135 s where the standby mode is reactivated. The transmission has an average duration of Ttx = 0.052 s. During the first period of time and before returning to deep sleep the current absorption Iidle is on average 13 mA as previously reported while the transmission span reports an average current absorption of Itx = 45 mA. The chosen test location has an interval of time between sunset and sunrise of about Ttot = 15 h in the worst case, meaning that running a data reading cycle every 10 min the total runs in one night time are Ncycles = 90. The single read discharge is given by:
The total battery discharge due to the total data reads and sending cycles can be expressed as follows:
while the discharge during the total deep sleep period is calculated by:
being,
The aforementioned calculated quantities allow the total charge variation during the night time to be found easily by adding the two contributions; therefore, we have:
C’ = ([Iidle ∙ (T1 + T2) + Itx ∙ Ttx])/3600 = 0.0028 mAh
Cd = C’ ∙ Ncycles ≈ 0.249 mAh
Cs = (Tsleep ∙ Isleep)/3600 ≈ 4.5 mAh
Tsleep = (Ttot ∙ 3600) − (T ∙ Ncycles) = 53,943 s
Ctot = Cd + Cs ≈ 4.74 mAh
Notice almost immediately that a 2200 mAh battery is absolutely sufficient to guarantee the uptime even in the hours of insufficient insolation. Taking into account that the battery is recharged by solar harvesting in the daytime, and given that the wake-up and data transmission phases have almost negligible durations compared to the deep sleep period, which is in the order of minutes against tens of seconds, it is possible to obtain 100% uptime from the moment of the first activation, ensuring energy self-sufficiency. In a worst-case scenario, assuming the total absence of solar charging, with reading cycles as previously reported, the charge variation over 24 h can be calculated by means of a proportion, resulting in about 7.58 mAh, which corresponds to a total discharge of the 2200 mAh battery in more than 280 days.
4.2. Functionality Tests
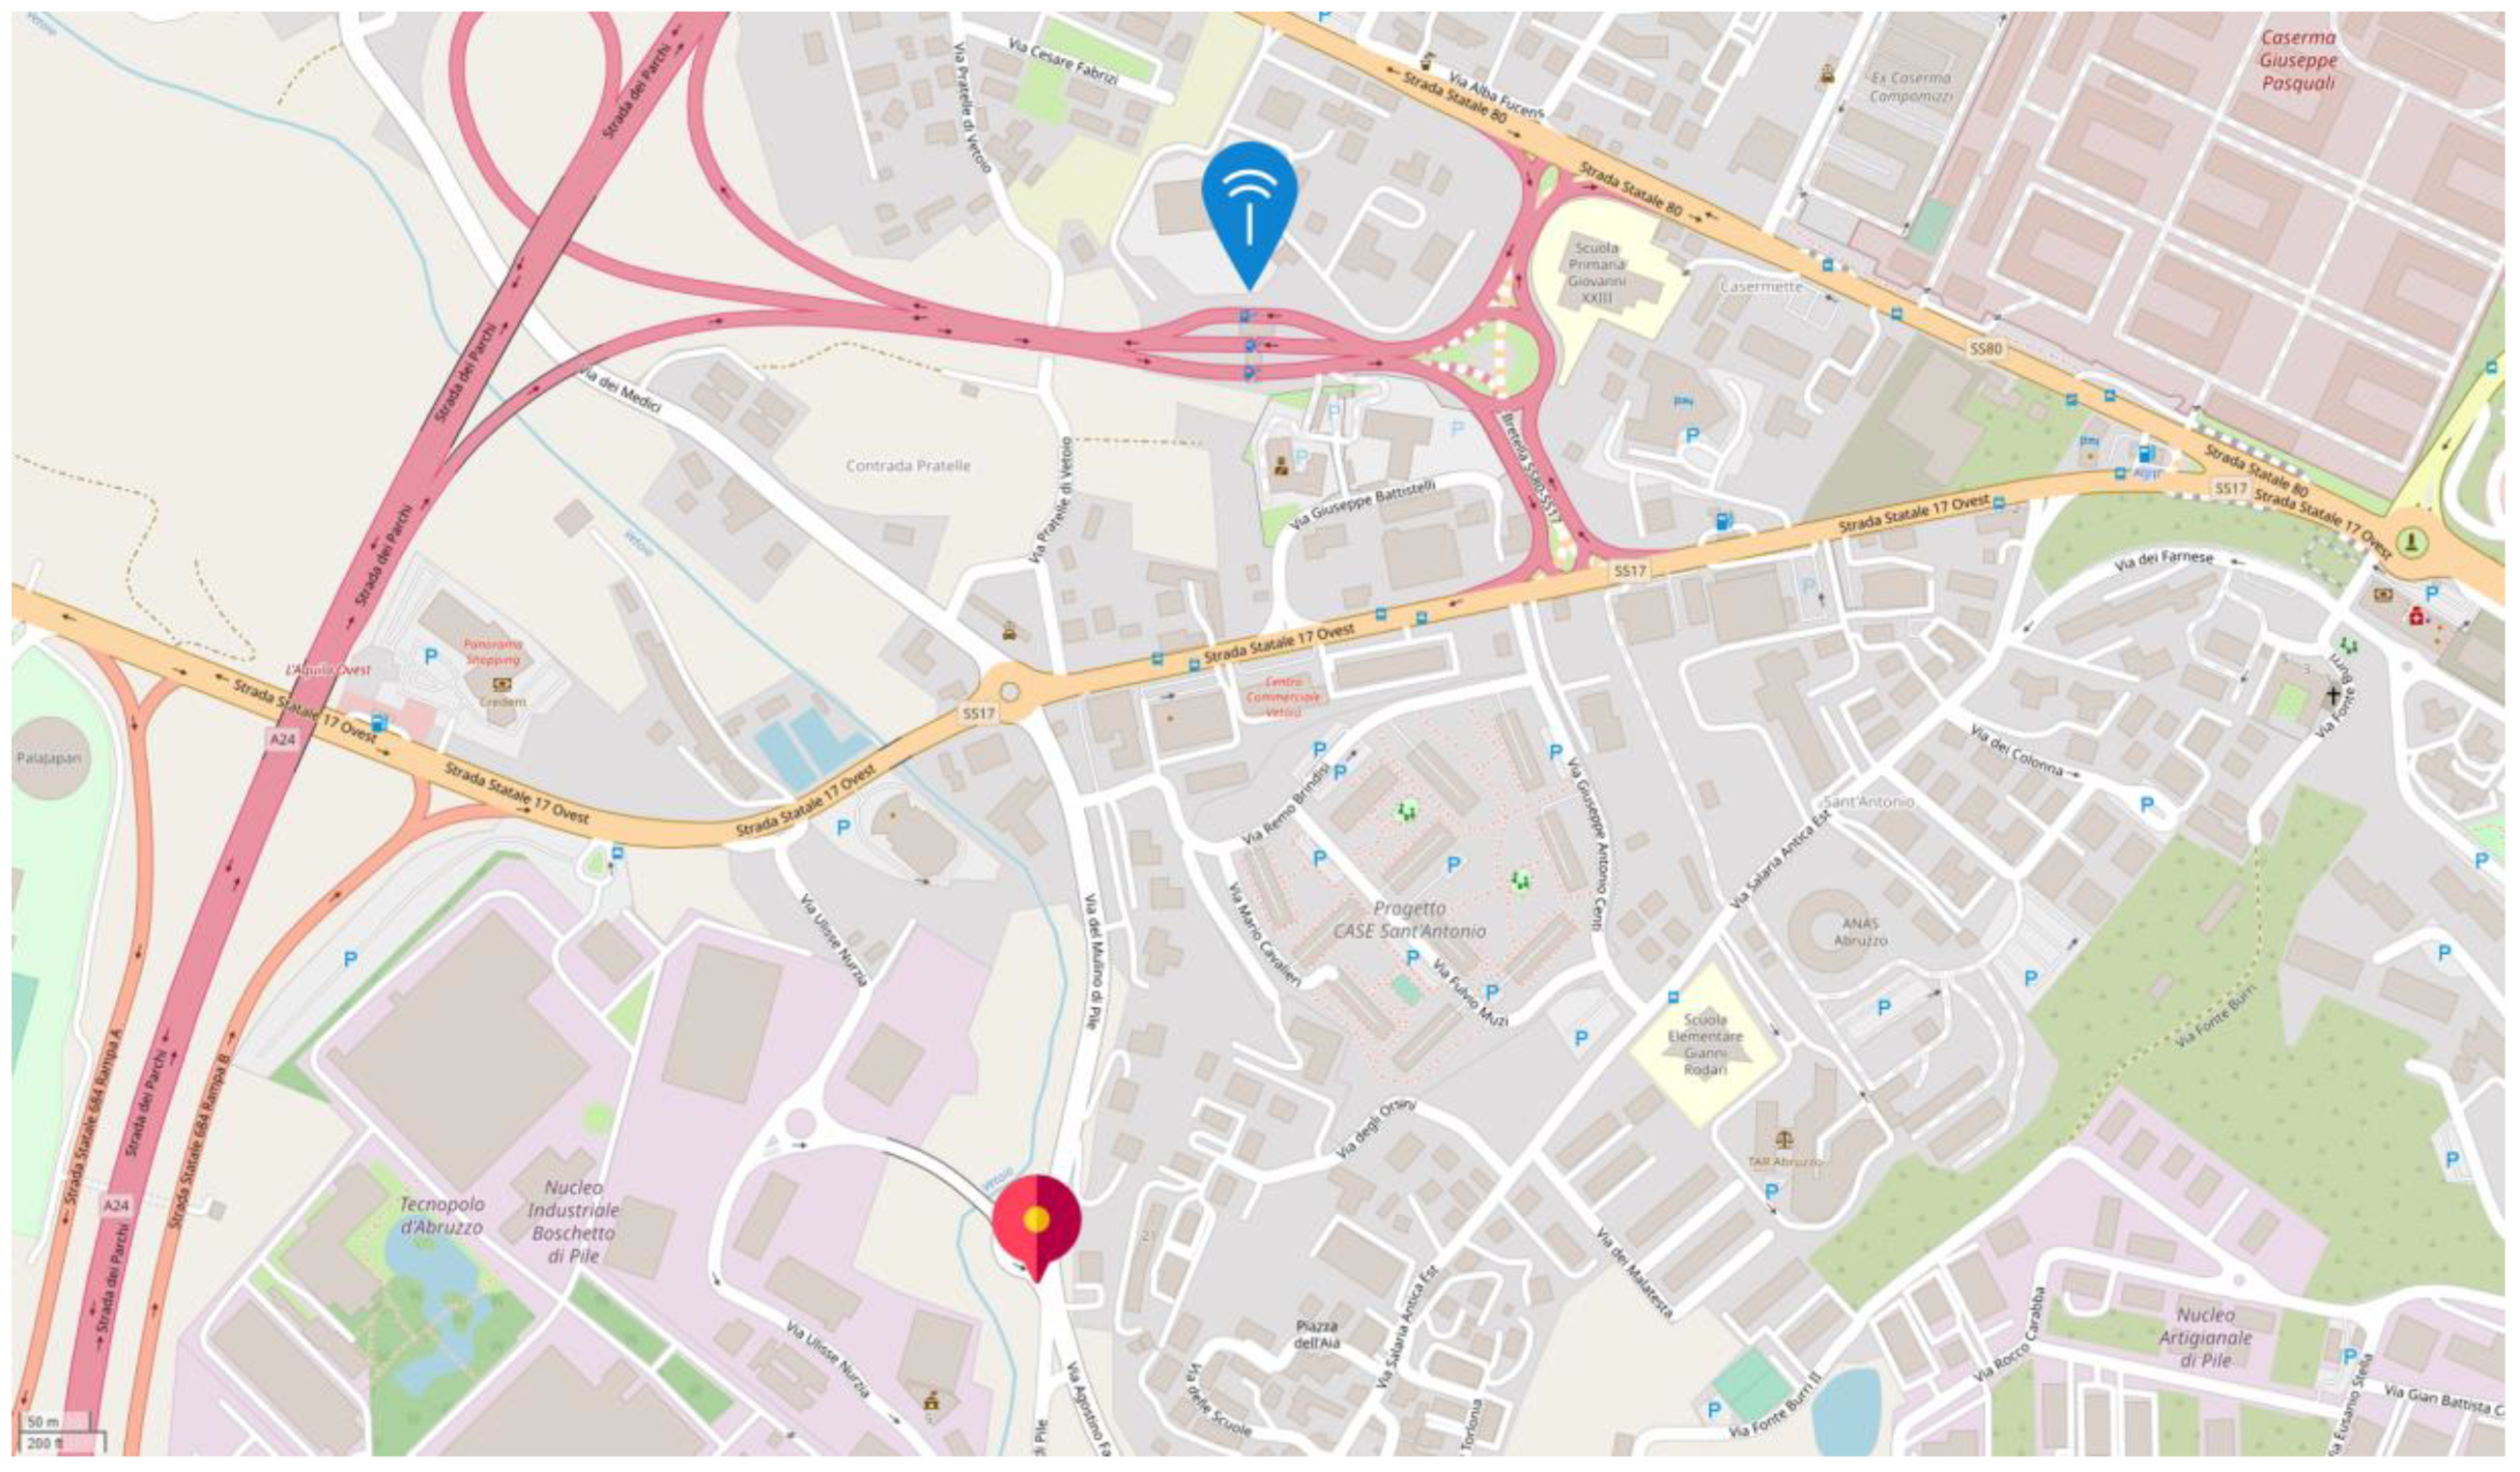
Concerning the system implementation in a real environment, a location in accordance with the city of L’Aquila local administration has been chosen that is particularly subject to the risk of flooding due to the presence of the Vetoio river (Figure 10). The nearest LoRa gateway is located about 1 km far from the implemented sensor node.
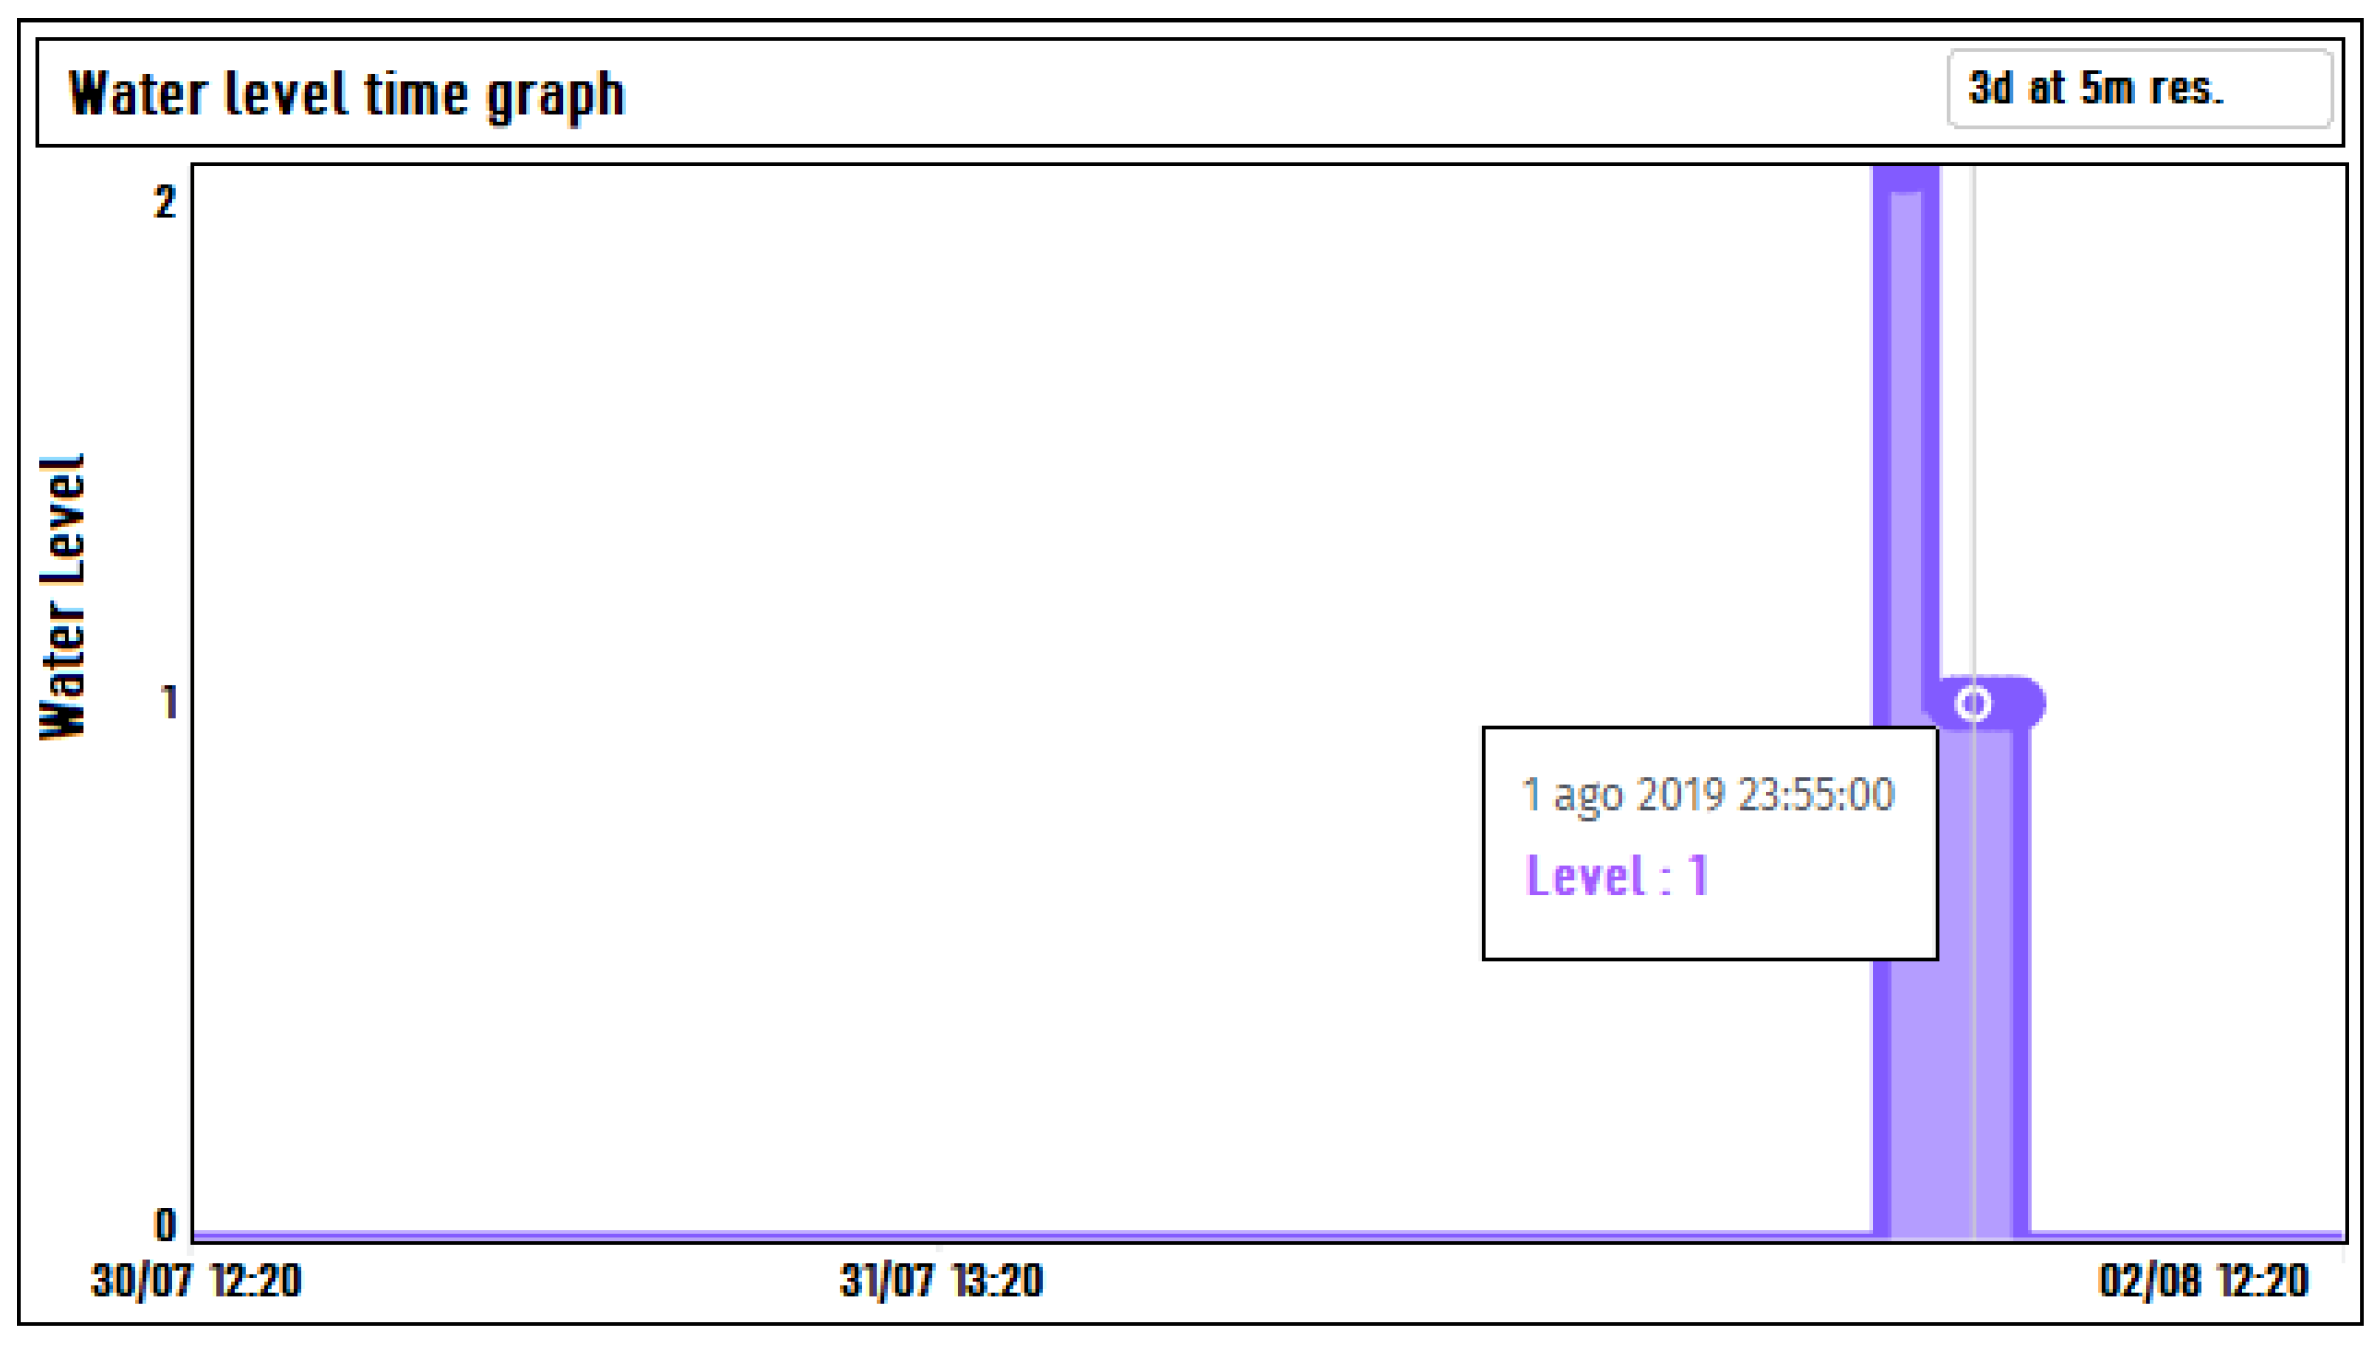
In Figure 11, the time graph of a flooding laboratory simulation is shown, where the water level has been purposefully raised bypassing the intermediate alert level only for testing purposes. The figure is captured from the plot of Losant IoT received values (time and date are on the horizontal axis and the flooding level on its three values on the vertical one).
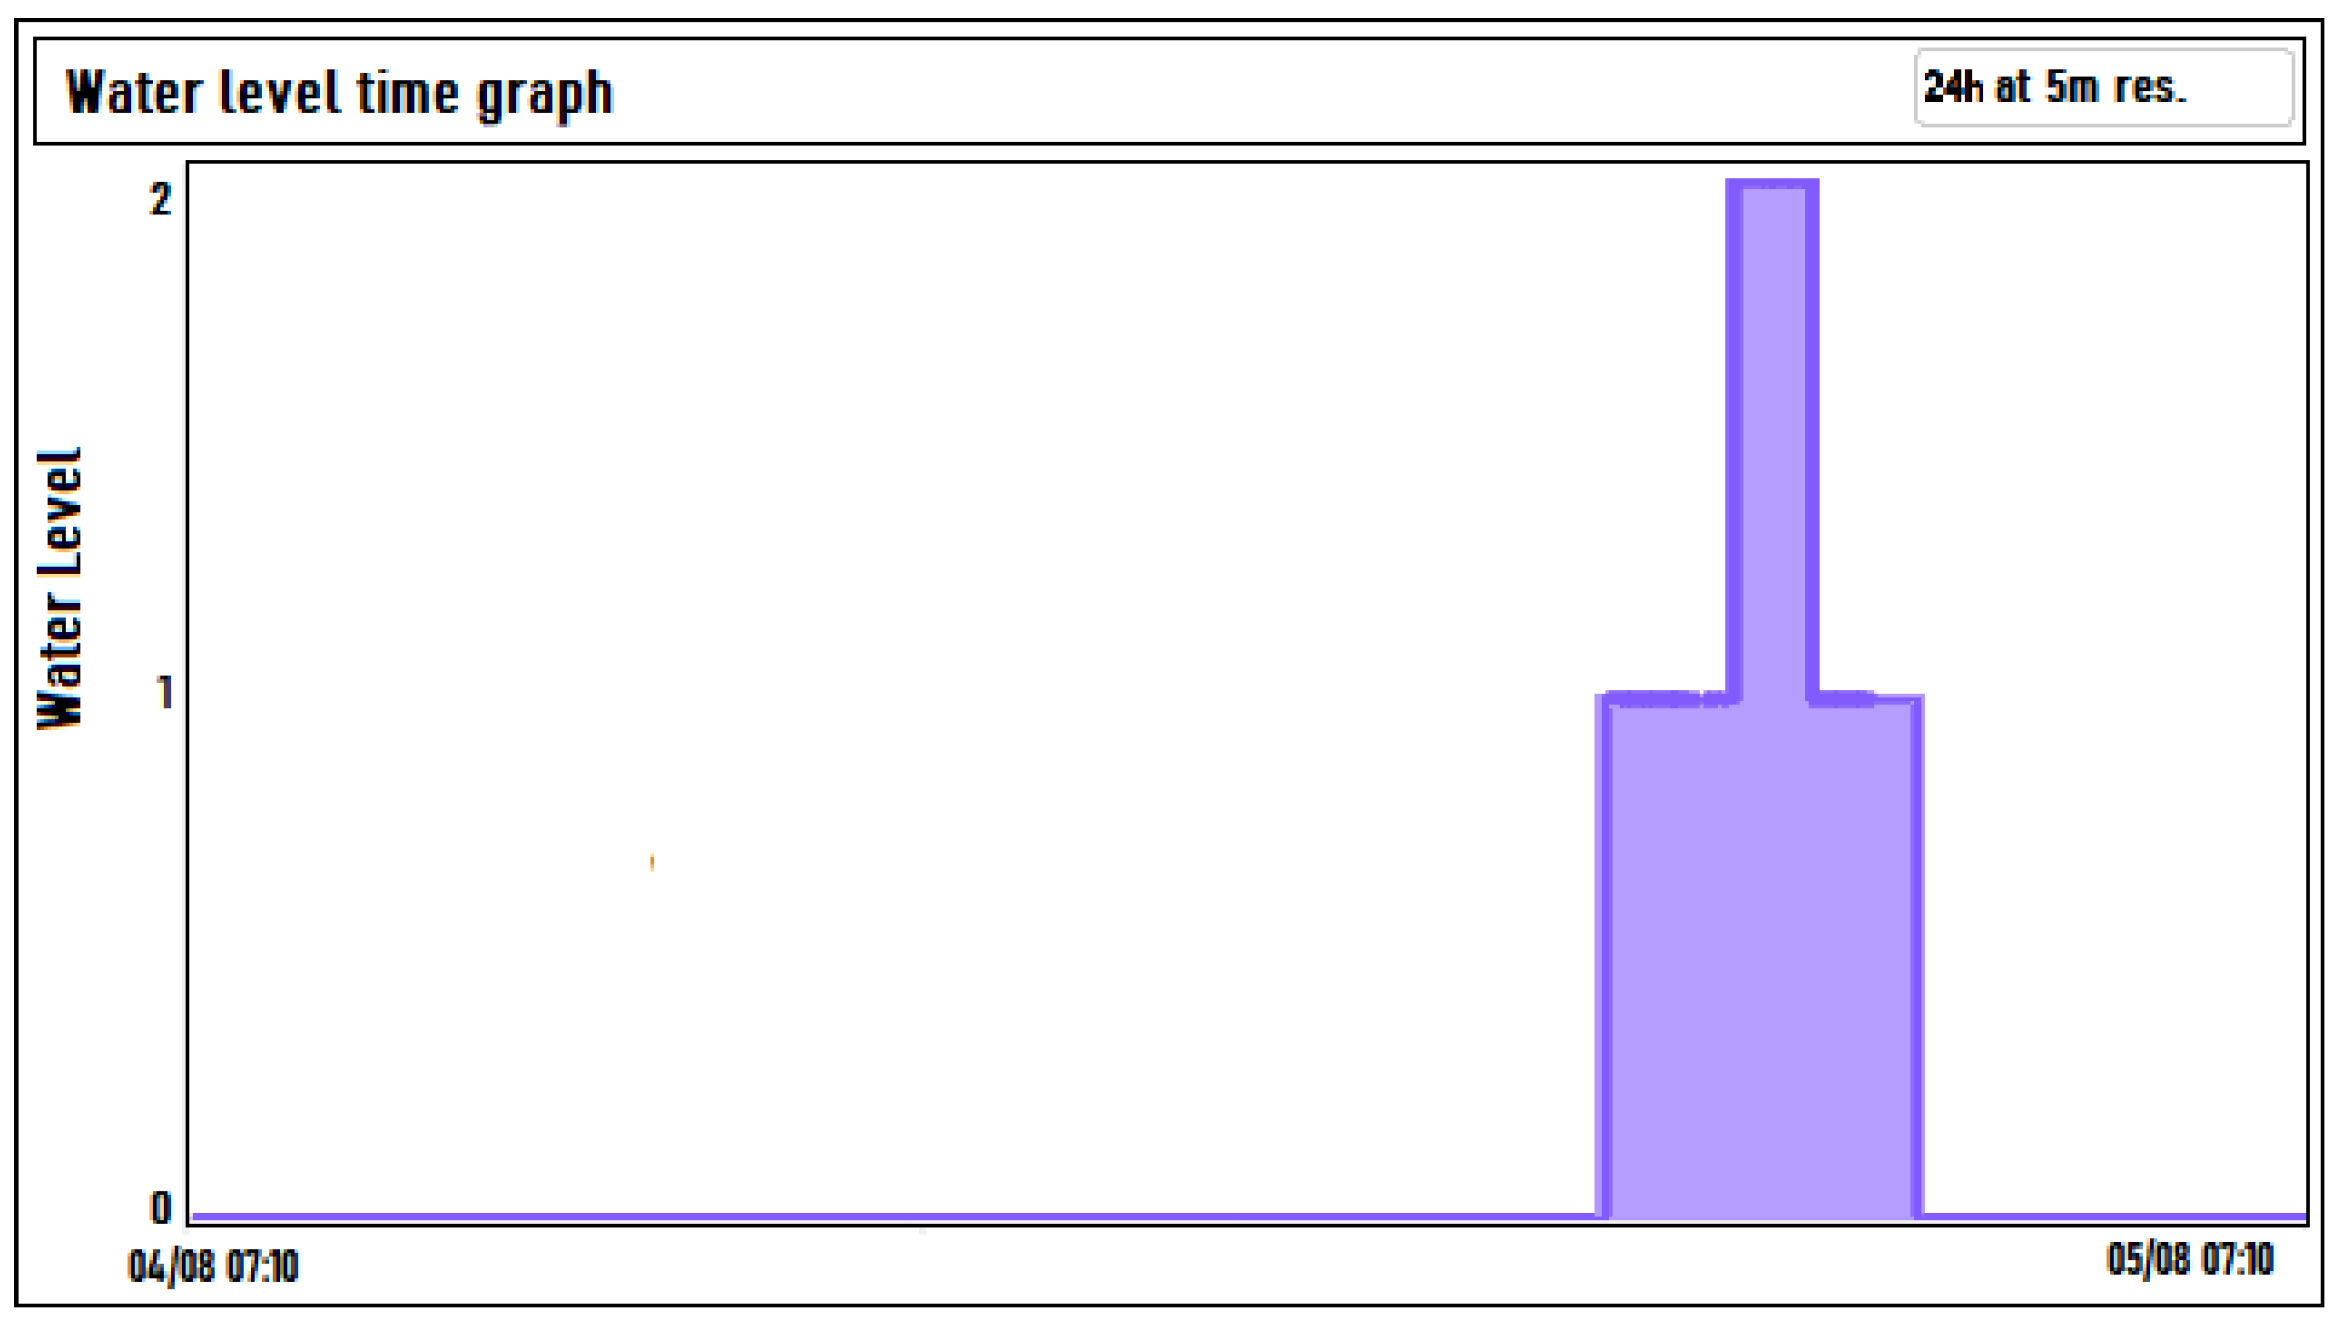
In Figure 12, a time graph concerning the water level on the actual test location reported in Figure 12 is shown. The horizontal axis represents a time span of 24 h, during which the water level has risen above the guard level, represented by the value 0, for a time duration of approximately 4 h.
The data obtained were stored remotely for possible further elaboration and an e-mail alarm was activated with the aim of informing about the possible danger.
5. Conclusions and Future Works
In this paper, an autonomous flood-monitoring system based on LoRa technology has been presented. The choice of this wireless technology, as well as a sensor node with the previously illustrated structure, proved to be effective to obtain energy performance suitable for a battery-powered IoT device. The structure of the aforementioned node has a modular implementation, it being unnecessary to make significant changes to the electronic board to obtain the possibility of using it as an interface for different types of sensors capable of detecting phenomena that differ from those taken into consideration in this work. Future developments include improvements at the hardware level, such as the direct integration of the power-management system on the electronic board, but also in software as the implementation of superior safety functions. Due to the system power efficiency achieved, it is possible to use a smaller and cheaper battery pack solution in a commercial scenario. Moreover, the proposed systems, thanks to the high-performance microcontroller utilized, can be expanded easily to a wireless multi-sensor network with the aim of monitoring various environmental and structural parameters. The possibility of data processing at a higher level makes the structure scalable to a large number of devices, even if in such a structure the traffic management policy relating to the gateway could be not negligible when managing a number of nodes of the order of magnitude of hundreds.
Author Contributions
Conceptualization: V.S., G.F., G.B., A.L., M.R.; Data curation, G.B., A.L., M.R.; Validation, V.S., G.F.; Writing—original draft, M.R., G.B.; Writing—review and editing, V.S., G.F., A.L. All authors have read and agreed to the published version of the manuscript.
Funding
This research received no external funding.
Conflicts of Interest
The authors declare no conflict of interest.
References
- Akyildiz, I.F.; Su, W.; Sankarasubramaniam, Y.; Cayirci, E. Wireless sensor networks: A survey. Comput. Netw. 2002, 38, 393–422. [Google Scholar] [CrossRef] [Green Version]
- Barile, G.; Leoni, A.; Pantoli, L.; Stornelli, V. Real-Time Autonomous System for Structural and Environmental Monitoring of Dynamic Events. Electronics 2018, 7, 420. [Google Scholar] [CrossRef] [Green Version]
- Hussian, R.; Sharma, S.; Sharma, V.; Sharma, S. WSN applications: Automated intelligent traffic control system using sensors. Int. J. Soft Comput. Eng. 2013, 3, 77–81. [Google Scholar]
- Puccinelli, D.; Haenggi, M. Wireless sensor networks: Applications and challenges of ubiquitous sensing. IEEE Circuits Syst. Mag. 2005, 3, 19–31. [Google Scholar] [CrossRef]
- Güngör, V.Ç.; Hancke, G.P. (Eds.) Industrial Wireless Sensor Networks: Applications, Protocols, and Standards; CRC Press: Boca Raton, FL, USA, 2013. [Google Scholar]
- Đurišić, M.P.; Tafa, Z.; Dimić, G.; Milutinović, V. A survey of military applications of wireless sensor networks. In Proceedings of the 2012 Mediterranean Conference on Embedded Computing (MECO), Bar, Montenegro, 19–21 June 2012; pp. 196–199. [Google Scholar]
- Liu, Y. Wireless sensor network applications in smart grid: Recent trends and challenges. Int. J. Distrib. Sens. Netw. 2012, 3, 492819. [Google Scholar] [CrossRef]
- Darwish, A.; Hassanien, A.E. Wearable and implantable wireless sensor network solutions for healthcare monitoring. Sensors 2011, 3, 5561–5595. [Google Scholar] [CrossRef] [Green Version]
- Mao, G.; Fidan, B.; Anderson, B.D. Wireless sensor network localization techniques. Comput. Netw. 2007, 3, 2529–2553. [Google Scholar] [CrossRef]
- Barile, G.; Ferri, G.; Leoni, A.; Muttillo, M.; Pantoli, L.; Stornelli, V.; Vettori, D. Automatic Wireless Monitoring System for Real-Time Rock Fall Events. Proceedings 2017, 1, 569. [Google Scholar] [CrossRef] [Green Version]
- Wang, H.; Ouyang, M.; Meng, Q.; Kong, Q. A traffic data collection and analysis method based on wireless sensor network. J. Wirel. Commun. Netw. 2020, 2, 2020. [Google Scholar] [CrossRef]
- Gao, X.; Lin, L.; Lan, T.; Gan, X. Design and Research on the Chinese Medicine Health Management System Based on the Wireless Sensor Network. In The International Conference on Cyber Security Intelligence and Analytics; Springer: Cham, Switzerland, 2019. [Google Scholar]
- Arroyo, P.; Herrero, J.L.; Suárez, J.I.; Lozano, J. Wireless sensor network combined with cloud computing for air quality monitoring. Sensors 2019, 19, 691. [Google Scholar] [CrossRef] [Green Version]
- Abella, C.S.; Bonina, S.; Cucuccio, A.; D’Angelo, S.; Giustolisi, G.; Grasso, A.D.; Imbruglia, A.; Mauro, G.S.; Nastasi, G.A.M.; Palumbo, G.; et al. Autonomous Energy-Efficient Wireless Sensor Network Platform for Home/Office Automation. IEEE Sens. J. 2019, 19, 3501–3512. [Google Scholar] [CrossRef]
- Ruan, T.; Chew, Z.J.; Zhu, M. Energy-Aware Approaches for Energy Harvesting Powered Wireless Sensor Nodes. IEEE Sens. J. 2017, 17, 2165–2173. [Google Scholar] [CrossRef]
- Li, J.J.; Wang, F. A low-power temperature and humidity monitoring system base on WSN. In Proceedings of the IET International Communication Conference on Wireless Mobile and Computing (CCWMC 2011), Shanghai, China, 14–16 November 2011; pp. 486–490. [Google Scholar]
- Kraïmia, H.; Taris, T.; Begueret, J.; Deval, Y. An ultra-low power self-oscillating mixer for WSN applications. In Proceedings of the European Microwave Conference, Nuremberg, Germany, 6–10 October 2013; pp. 822–825. [Google Scholar]
- Abdaoui, R.; Villegas, M.; Baudoin, G. Potentiality of a low power 60 GHz transceiver approach for EEG/ECG WSN medical applications. In Proceedings of the IEEE Faible Tension Faible Consommation, Paris, France, 20–21 June 2013; pp. 1–4. [Google Scholar]
- Anoh, K.; Bajovic, D.; Ikpehai, A.; Adebisi, B.; Vukobratovic, D. Enabling Peer to Peer Energy Trading in Virtual Microgrids with LP-WAN. In Proceedings of the IEEE EUROCON 2019—18th International Conference on Smart Technologies, Novi Sad, Serbia, 1–4 July 2019; pp. 1–5. [Google Scholar]
- Lauridsen, M.; Nguyen, H.; Vejlgaard, B.; Kovacs, I.Z.; Mogensen, P.; Sorensen, M. Coverage Comparison of GPRS, NB-IoT, LoRa, and SigFox in a 7800 km² Area. In Proceedings of the 2017 IEEE 85th Vehicular Technology Conference (VTC Spring), Sydney, Australia, 4–7 June 2017; pp. 1–5. [Google Scholar]
- AN1200.22 LoRa™ Modulation Basics. Available online: https://semtech.my.salesforce.com/sfc/p/#E0000000JelG/a/2R0000001OJu/xvKUc5w9yjG1q5Pb2IIkpolW54YYqGb.frOZ7HQBcRc (accessed on 10 April 2020).
- Vangelista, L. Frequency Shift Chirp Modulation: The LoRa Modulation. IEEE Signal Process. Lett. 2017, 24, 1818–1821. [Google Scholar] [CrossRef]
- LoRa Alliance. Available online: https://lora-alliance.org/ (accessed on 10 April 2020).
- De Carvalho Silva, J.; Rodrigues, J.J.P.C.; Alberti, A.M.; Solic, P.; Aquino, A.L.L. LoRaWAN—A low power WAN protocol for Internet of Things: A review and opportunities. In Proceedings of the 2nd International Multidisciplinary Conference on Computer and Energy Science (SpliTech), Split, Croatia, 12–14 July 2017; pp. 1–6. [Google Scholar]
- What is the LoRaWAN® Specification? Available online: https://lora-alliance.org/about-lorawan (accessed on 10 April 2020).
- Lavric, A.; Popa, V. Internet of things and lora low-powervwide-area networks: A survey. In Proceedings of the 2017 International Symposium on Signals, Circuits and Systems (ISSCS), Iasi, Romania, 13–14 July 2017; pp. 1–5. [Google Scholar]
- Ahmad, N.; Hussain, M.; Riaz, N.; Subhani, F.; Haider, S.; Alamgir, K.S.; Shinwari, F. Flood prediction and disaster risk analysis using GIS based wireless sensor networks, a review. J. Basic Appl. Sci. Res. 2013, 3, 632–643. [Google Scholar]
- Oliveira, L.M.; Rodrigues, J.J. Wireless Sensor Networks: A Survey on Environmental Monitoring. JCM 2011, 3, 143–151. [Google Scholar] [CrossRef]
- Henriques, V.; Malekian, R. Mine safety system using wireless sensor network. IEEE Access 2016, 3, 3511–3521. [Google Scholar] [CrossRef]
- Kaźmierczak, A.; Cavan, G. Surface water flooding risk to urban communities: Analysis of vulnerability, hazard and exposure. Landsc. Urban Plan. 2011, 103, 185–197. [Google Scholar] [CrossRef]
- Pregnolato, M.; Ford, A.; Wilkinson, S.M.; Dawson, R. The impact of flooding on road transport: A depth-disruption function. Transp. Res. Part D Transp. Environ. 2017, 55, 67–81. [Google Scholar] [CrossRef]
- Christensen, J.H.; Christensen, O.B. Severe summertime flooding in Europe. Nature 2003, 421, 805–806. [Google Scholar] [CrossRef]
- Dawson, R.; Speight, L.; Hall, J.; Djordjevic, S.; Savic, D.; Leandro, J. Attribution of flood risk in urban areas. J. Hydroinform. 2008, 10, 275–288. [Google Scholar] [CrossRef] [Green Version]
- Sakib, S.N.; Ane, T.; Matin, N.; Kaiser, M. An intelligent flood monitoring system for Bangladesh using wireless sensor network. In Proceedings of the 2016 5th International Conference on Informatics, Electronics and Vision (ICIEV), Dhaka, Bangladesh, 13–14 May 2016. [Google Scholar]
- Garcia, F.C.C.; Retamar, A.E.; Javier, J.C. A real time urban flood monitoring system for metro Manila. In Proceedings of the TENCON 2015—2015 IEEE Region 10 Conference, Macao, China, 1–4 November 2015. [Google Scholar]
- Babu, V.; Rajan, V. Flood and Earthquake Detection and Rescue Using IoT Technology. In Proceedings of the 2019 International Conference on Communication and Electronics Systems (ICCES), Coimbatore, India, 17–19 July 2019. [Google Scholar]
- Tanumihardja, W.A.; Gunawan, E. On the application of IoT: Monitoring of troughs water level using WSN. In Proceedings of the 2015 IEEE Conference on Wireless Sensors (ICWiSe), Melaka, Malaysia, 24–26 August 2015. [Google Scholar]
- Yeon, S.; Kang, J.; Lee, I. A Study on real-time Flood Monitoring System based on Sensors using Flood Damage Insurance Map. In Proceedings of the International Archives of the Photogrammetry, Remote Sensing and Spatial Information Sciences, Istanbul, Turkey, 18–21 March 2018; Volume XLII-3/W4. [Google Scholar]
- Leon, E.; Alberoni, C.; Wister, M.; Hernández-Nolasco, J.A. Flood Early Warning System by Twitter Using LoRa. Proceedings 2018, 2, 1213. [Google Scholar] [CrossRef] [Green Version]
- Dalkic, Y.; Alshekhly, Z. Development and Design of a Prototype for Monitoring the Water Level in Water Wells Using LoRaWAN. Bachelor’s Thesis, Malmö University, Malmö, Sweden, 2018. [Google Scholar]
- ARDUINO MEGA 2560 REV3. Available online: https://store.arduino.cc/arduino-mega-2560-rev3 (accessed on 10 April 2020).
- ESP8266EX. Available online: https://www.espressif.com/en/products/hardware/esp8266ex/overview (accessed on 10 April 2020).
- Paller, G.; Szármes, P.; Élo, G. Power consumption considerations of gsm-connected sensors in the agrodat. hu sensor network. Sens. Transducers 2015, 189, 52. [Google Scholar]
- STANDARD SPECIFICATION. Available online: http://www.farnell.com/datasheets/513072.pdf (accessed on 10 April 2020).
- DOST-ASTI. Available online: https://asti.dost.gov.ph/projects/arq/ (accessed on 10 April 2020).
- Institute of Electrical and Electronics Engineers. IEEE Standard for Local and metropolitan area networks—Part 15.4: Low-Rate Wireless Personal Area Networks (LR-WPANs)—Amendment 5: Physical Layer Specifications for Low Energy, Critical Infrastructure Monitoring Networks; IEEE: Piscataway, NJ, USA, 2013; pp. 1–149. [Google Scholar]
- Ratasuk, R.; Vejlgaard, B.; Mangalvedhe, N.; Ghosh, A. NB-IoT system for M2M communication. In Proceedings of the 2016 IEEE Wireless Communications and Networking Conference, Doha, Qatar, 3–6 April 2016; pp. 1–5. [Google Scholar]
- Sinha, R.S.; Wei, Y.; Hwang, S.-H. A survey on LPWA technology: LoRa and NB-IoT. ICT Express 2017, 3, 14–21. [Google Scholar] [CrossRef]
- Finnegan, J.; Brown, S. An Analysis of the Energy Consumption of LPWA-based IoT Devices. In Proceedings of the 2018 International Symposium on Networks, Computers and Communications (ISNCC), Rome, Italy, 19–21 June 2018; pp. 1–6. [Google Scholar]
- Sigfox.com. Available online: http://www.sigfox.com/ (accessed on 10 April 2020).
- Luo, P.; Peng, D.; Wang, Y.; Zheng, X. Review of Solar Energy Harvesting for IoT Applications. In Proceedings of the 2018 IEEE Asia Pacific Conference on Circuits and Systems (APCCAS), Chengdu, China, 26–30 October 2018; pp. 512–515. [Google Scholar] [CrossRef]
- Kaur, H.; Buttar, A. A Review on Solar Energy Harvesting Wireless Sensor Network. Int. J. Comput. Sci. Eng. 2019, 7, 398–404. [Google Scholar] [CrossRef]
- Sharma, H.; Haque, A.; Jaffery, Z.A. Solar energy harvesting wireless sensor network nodes: A survey. J. Renew. Sustain. Energy 2018, 3, 023704. [Google Scholar] [CrossRef]
- Leoni, A.; Pantoli, L.; Stornelli, V.; Ferri, G.; Russo, M.; Solic, P. 90/900 MHz IC architecture for autonomous systems. In Proceedings of the 2017 2nd International Multidisciplinary Conference on Computer and Energy Science (SpliTech), Split, Croatia, 12–14 July 2017; pp. 1–4. [Google Scholar]
- Pantoli, L.; Leoni, A.; Stornelli, V.; Ferri, G. Energy harvester for remote sensors systems. In Proceedings of the 2016 International Multidisciplinary Conference on Computer and Energy Science (SpliTech), Split, Croatia, 13–15 July 2016; pp. 1–3. [Google Scholar]
- Stornelli, V.; Leoni, A.; Ferri, G.; Errico, V.; Ricci, M.; Pallotti, A.; Saggio, G. A Multi-Source Energy Harvesting Sensory Glove Electronic Architecture. In Proceedings of the 2018 3rd International Conference on Smart and Sustainable Technologies (SpliTech), Split, Croatia, 26–29 June 2018; pp. 1–4. [Google Scholar]
- Colaiuda, D.; Ulisse, I.; Ferri, G. Rectifiers’ Design and Optimization for a Dual-Channel RF Energy Harvester. J. Low Power Electron. Appl. 2020, 10, 11. [Google Scholar] [CrossRef] [Green Version]
- LORIX One. Available online: https://www.lorixone.io/en (accessed on 10 April 2020).
- The Things Network. Available online: https://www.thethingsnetwork.org/ (accessed on 10 April 2020).
- Losant IoT. Available online: https://www.losant.com/ (accessed on 10 April 2020).
- Ferri, G.; Parente, F.; Stornelli, V.; Barile, G.; Pantoli, L. Automatic Bridge-based Interface for Differential Capacitive Full Sensing. Procedia Eng. 2016, 168, 1585–1588. [Google Scholar] [CrossRef]
- Han, K.; Kim, H.; Kim, J.; You, D.; Heo, H.; Kwon, Y.; Lee, J.; Ko, H. A 24.88 nV/√Hz Wheatstone Bridge Readout Integrated Circuit with Chopper-Stabilized Multipath Operational Amplifier. Appl. Sci. 2020, 10, 399. [Google Scholar] [CrossRef] [Green Version]
- Pantoli, L.; Barile, G.; Leoni, A.; Muttillo, M.; Stornelli, V. A Novel Electronic Interface for Micromachined Si-Based Photomultipliers. Micromachines 2018, 9, 507. [Google Scholar] [CrossRef] [Green Version]
- Safari, L.; Barile, G.; Ferri, G.; Stornelli, V. High performance voltage output filter realizations using second generation voltage conveyor. Int. J. RF Microw. Comput. Aided Eng. 2018, 28, e21534. [Google Scholar] [CrossRef]
- Barile, G.; Leoni, A.; Pantoli, L.; Safari, L.; Stornelli, V. A New VCII Based Low-Power Low-Voltage Front-end for Silicon Photomultipliers. In Proceedings of the 2018 3rd International Conference on Smart and Sustainable Technologies (SpliTech), Split, Croatia, 26–29 June 2018. [Google Scholar]
- 32-bit ARM-Based Microcontrollers. Available online: http://ww1.microchip.com/downloads/en/DeviceDoc/40001884A.pdf (accessed on 10 April 2020).
- Arduino. Available online: https://www.arduino.cc/en/Main/Software (accessed on 10 April 2020).
- Microchip Technology. Available online: http://ww1.microchip.com/downloads/en/DeviceDoc/AtmelICE_UserGuide.pdf (accessed on 10 April 2020).
- Extremely Accurate I2C-Integrated RTC/TCXO/Crystal. Available online: https://datasheets.maximintegrated.com/en/ds/DS3231.pdf (accessed on 10 April 2020).
- RFM95W LoRa Module. Available online: https://www.hoperf.com/modules/lora/RFM95.html (accessed on 10 April 2020).
- Seeed Studio Bazaar. Available online: http://wiki.seeedstudio.com/0.5w_Solar_Panel_55x70/ (accessed on 10 April 2020).
- Mikrocontroller. Available online: https://www.mikrocontroller.net/attachment/273612/TP4056.pdf (accessed on 10 April 2020).
- Texas Instruments. Available online: http://www.ti.com/lit/ds/symlink/tlv702.pdf (accessed on 10 April 2020).
- Test Equipment Solutions Datasheet. Available online: http://www.testequipmenthq.com/datasheets/TEKTRONIX-DPO3032-Datasheet.pdf (accessed on 10 April 2020).
- Nscainc. Available online: https://nscainc.com/wp-content/uploads/pdf/T_AM503B.pdf (accessed on 10 April 2020).
Figure 1.
LoRaWAN network architecture.

Figure 2.
Scheme of the proposed system.

Figure 3.
Flooding levels partitioning.

Figure 4.
Flow chart of the system functional steps.

Figure 5.
Block scheme of the sensor nodes architecture.

Figure 6.
Wall mount sensor enclosure.

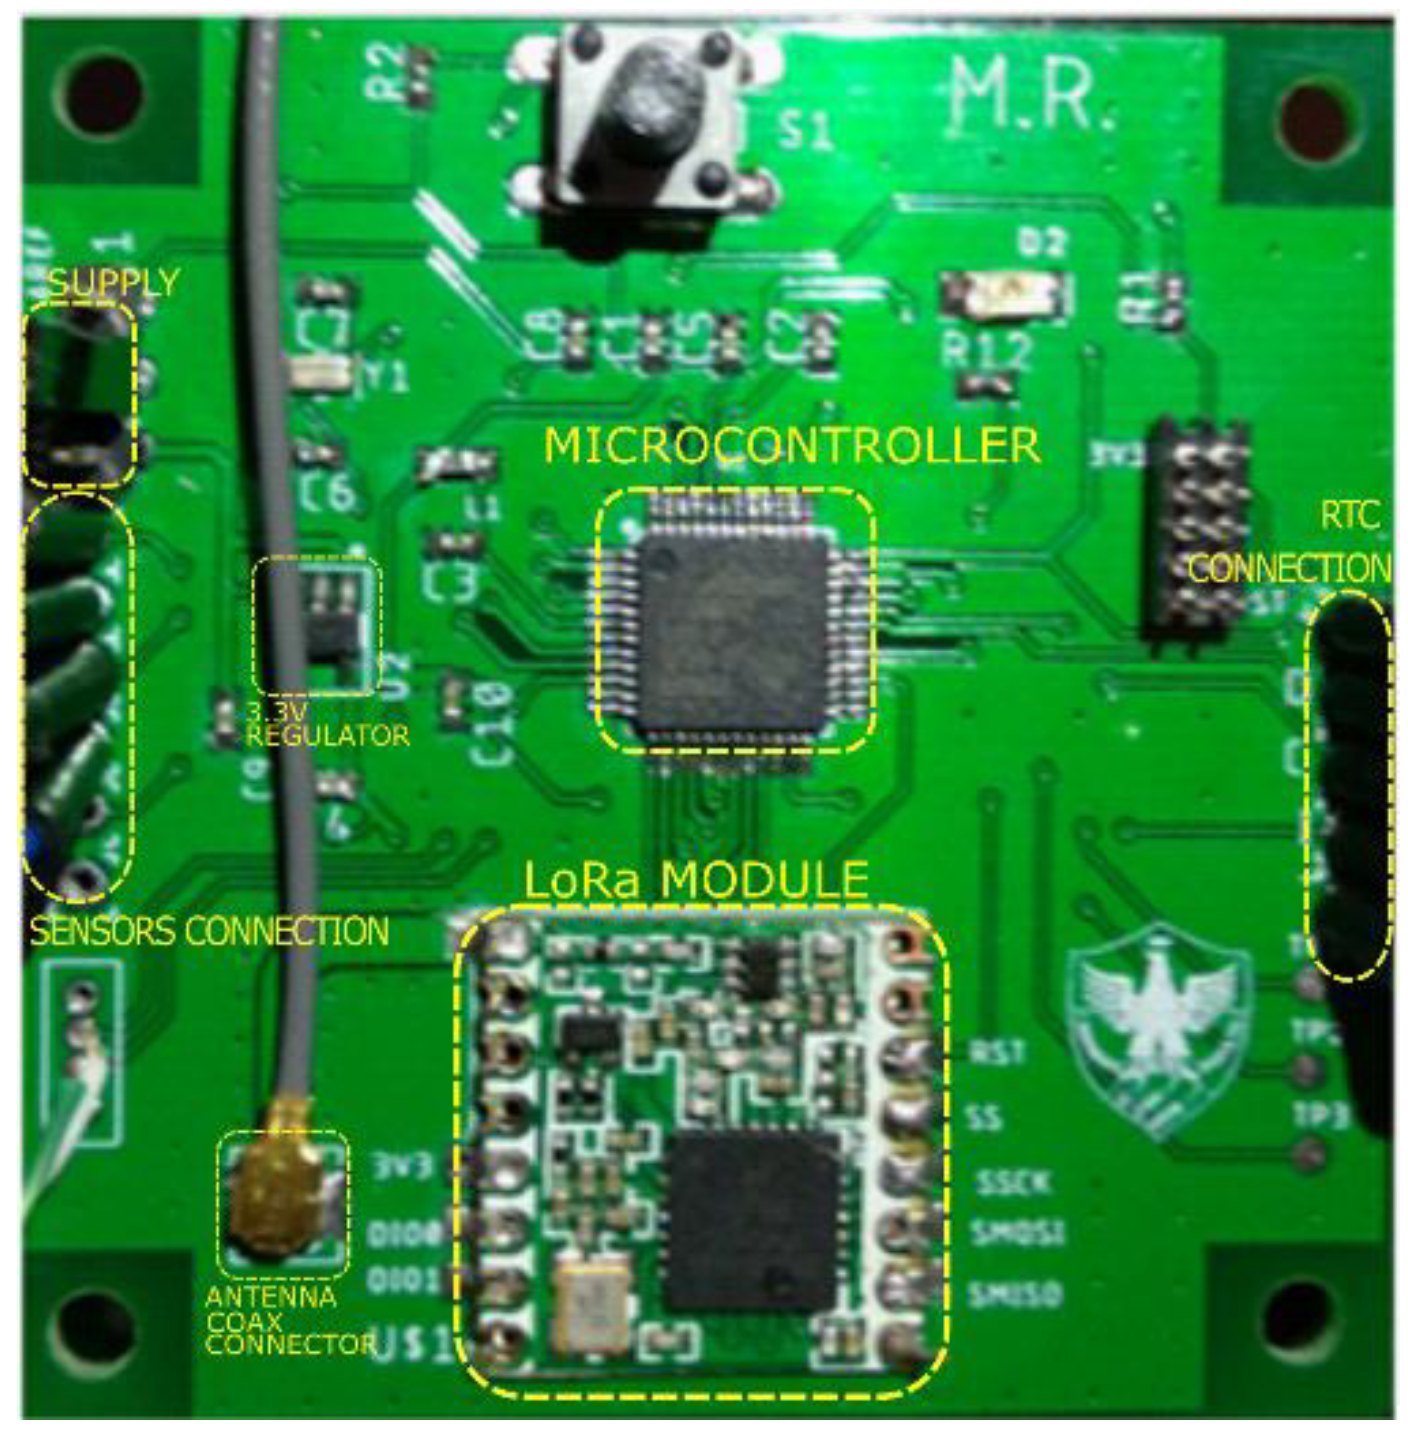
Figure 7.
Implemented custom board.

Figure 8.
Power-on and sleep current consumption graph, red line indicates the average value.

Figure 9.
Time graph of a wake-up and transmission cycle.

Figure 10.
Testing location map (City of L’Aquila, center of Italy).

Figure 11.
Time series graph of water level over three days of laboratory test.

Figure 12.
Time series graph of water level over one day of test.


Table 1.
Comparison table.
| [34] | [35] | [36] | [37] | [38] | [39] | This Work | |
|---|---|---|---|---|---|---|---|
| Transmission technology | Not specified 802.15.4 based | GPRS * | GSM * | LoRa | Lora, NB-IoT | LoRa | LoRa |
| Sensors type | Not properly specified | Pressure sensor | Resistive sensor | Float switch | Not properly specified | Ultrasonic sensor | Resistive sensor |
| Processing board | Arduino, Raspberry Pi | ASTI-ARQ [45] | Arduino, ESP8266 | Raspberry Pi, Atmega setup | Not specified | TTGO, Wemos d1, Raspberry Pi | Custom board |
| Power consumption analysis | Not reported | Not reported | Not reported | Not reported | Not reported | Not reported | Detailed reported |
* GPRS: General Packet Radio Service; GSM: Global System for Mobile Communications.
Table 2.
Transmitter parameters.
| Parameter | Value |
|---|---|
| Frequency | 868.2 MHz |
| Bandwidth | 125 kHz |
| Spreading Factor | SF8 |
| Coding Rate | 4/5 |
| Transmission Power | 14 dBm |
© 2020 by the authors. Licensee MDPI, Basel, Switzerland. This article is an open access article distributed under the terms and conditions of the Creative Commons Attribution (CC BY) license (http://creativecommons.org/licenses/by/4.0/).
Share and Cite
MDPI and ACS Style
Ragnoli, M.; Barile, G.; Leoni, A.; Ferri, G.; Stornelli, V. An Autonomous Low-Power LoRa-Based Flood-Monitoring System. J. Low Power Electron. Appl. 2020, 10, 15. https://0-doi-org.brum.beds.ac.uk/10.3390/jlpea10020015
AMA Style
Ragnoli M, Barile G, Leoni A, Ferri G, Stornelli V. An Autonomous Low-Power LoRa-Based Flood-Monitoring System. Journal of Low Power Electronics and Applications. 2020; 10(2):15. https://0-doi-org.brum.beds.ac.uk/10.3390/jlpea10020015
Chicago/Turabian StyleRagnoli, Mattia, Gianluca Barile, Alfiero Leoni, Giuseppe Ferri, and Vincenzo Stornelli. 2020. "An Autonomous Low-Power LoRa-Based Flood-Monitoring System" Journal of Low Power Electronics and Applications 10, no. 2: 15. https://0-doi-org.brum.beds.ac.uk/10.3390/jlpea10020015
Note that from the first issue of 2016, this journal uses article numbers instead of page numbers. See further details here.