Article

Hardware/Software Solution for Low Power Evaluation of Tsunami Danger

by
Mikhail Lavrentiev
1,*,
Konstantin Lysakov
1,
Andrey Marchuk
1,2,
Konstantin Oblaukhov
1 and
Mikhail Shadrin
1
1
Institute of Automation and Electrometry SB RAS, 630090 Novosibirsk, Russia
2
Institute of Computational Mathematics and Mathematical Geophysics SB RAS, 630090 Novosibirsk, Russia
*
Author to whom correspondence should be addressed.
J. Low Power Electron. Appl. 2022, 12(1), 6; https://0-doi-org.brum.beds.ac.uk/10.3390/jlpea12010006
Submission received: 13 November 2021 / Revised: 12 January 2022 / Accepted: 18 January 2022 / Published: 21 January 2022
(This article belongs to the Special Issue Low Power AI)

Abstract

:
Carbon footprint reduction issues have been drawing more and more attention these days. Reducing the energy consumption is among the basic directions along this line. In the paper, a low-energy approach to tsunami danger evaluation is concerned. After several disaster tsunamis of the XXIst century, the question arises whether is it possible to evaluate in a couple of minutes the tsunami wave parameters, expected at the particular geo location. The point is that it takes around 20 min for the wave to approach the nearest coast after a seismic event offshore of Japan. Currently, the main tool for studying tsunamis is computer modeling. In particular, the expected tsunami height near the coastline, when a major underwater earthquake is detected, can be estimated by a series of numerical experiments of various scenarios of generation and the following wave propagation. Reducing the calculation time of such scenarios and the necessary energy consumption for this is the scope of this study. Moreover, in case of the major earthquake, the electric power shutdown is possible (e.g., the accident at the Fukushima nuclear power station in Japan on 11 May 2011), so the solution should be of low energy-consuming, preferably based at regular personal computers (PCs) or laptops. The way to achieve the requested performance of numerical modeling at the PC platform is a combination of efficient algorithms and their hardware acceleration. Following this strategy, a solution for the fast numerical simulation of tsunami wave propagation has been proposed. Most of tsunami researchers use the shallow-water approximation to simulate tsunami wave propagation at deep water areas. For software implementation, the MacCormack finite-difference scheme has been chosen, as it is suitable for pipelining. For hardware code acceleration, a special processor, that is, the calculator, has been designed at a field-programmable gate array (FPGA) platform. This combination was tested in terms of precision by comparison with the reference code and with the exact solutions (known for some special cases of the bottom profile). The achieved performance made it possible to calculate the wave propagation over a 1000 × 500 km water area in 1 min (the mesh size was compared to 250 m). It was nearly 300 times faster compared to that of a regular PC and 10 times faster compared to the use of a central processing unit (CPU). This result, being implemented into tsunami warning systems, will make it possible to reduce human casualties and economy losses for the so-called near-field tsunamis. The presented paper discussed the new aspect of such implementation, namely low energy consumption. The corresponding measurements for three platforms (PC and two types of FPGA) have been performed, and a comparison of the obtained results of energy consumption was given. As the numerical simulation of numerous tsunami propagation scenarios from different sources are needed for the purpose of coastal tsunami zoning, the integrated amount of the saving energy is expected to be really valuable. For the time being, tsunami researchers have not used the FPGA-based acceleration of computer code execution. Perhaps, the energy-saving aspect is able to promote the use of FPGAs in tsunami researches. The approach to designing special FPGA-based processors for the fast solution of various engineering problems using a PC could be extended to other areas, such as bioinformatics (motif search in DNA sequences and other algorithms of genome analysis and molecular dynamics) and seismic data processing (three-dimensional (3D) wave package decomposition, data compression, noise suppression, etc.).

1. Introduction

The modern development of computing technology and construction of supercomputer centers makes it possible to significantly expand the range of tasks that can be solved by mathematical and computer modeling. However, the operation of such systems requires increased power consumption. That is why, in addition to the Top 500 list [1] of the most productive cluster systems, there also appears the list of Green500 [2] of supercomputer systems, which are the most energy-efficient. Obviously, a general-purpose computer system cannot be more energy efficient than a specialized solution created for a certain, despite a rather narrow class of tasks. This is important also in view of carbon footprint reduction as a global task.
In this paper, the energy costs of such an important task as saving lives and reducing damage from catastrophic tsunami flooding waves were evaluated. As was observed, the use of a field-programmable gate array (FPGA)-based calculator provided not only the high-performance of calculating tsunami wave propagation, but also led to saving energy. This new aspect in tsunami simulation was here estimated in numbers (measured) at several hardware platforms, of which the results were compared. For the coastal areas, a number (i.e., thousands) of tsunami zoning scenarios with a variety of tsunami source parameters (geolocation, shape, and amplitude) were computed. Therefore, being used even within the tsunami research community, the use of FPGAs may lead to valuable energy-saving.
Currently, the most widely used software for the tsunami propagation modeling are as following: the Method of Splitting Tsunamis (MOST; NOAA Pacific Marine Environmental Laboratory, Seattle, USA) [3], COMCOT (Cornell University, Ithaca, NY, USA; GNS Science, Lower Hutt, New Zealand) [4], and TUNAMI-N1/TUNAMI-N2 (Tohoku University, Sendai, Japan) [5]. All these programs being realized on a personal computer (PC) are able to simulate tsunami in an approximately 107-node computation grid at a rate of actual tsunami propagation (1 h of the processing time for a 1 h tsunami travel time).
The height of the tsunami wave at a dedicated coastal site depends on the position and shape of the seafloor deformation at the source of the tsunami, as well as the configuration of the depth profile. While sufficiently detailed digital bathymetry already exists for a number of seismically active seafloor zones, the parameters of seafloor disturbance after a seismic event simply cannot be predicted in advance. Therefore, one approach, which should allow the rapid assessment of the tsunami hazard after a particular earthquake, is to pre-compute wave propagation from a large number of model sources (accounting the variety of locations, shapes, and amplitudes). Then, after the earthquake, the model source most similar to the true source should be chosen for one reason or another, and the corresponding numerical results are taken into account. This is especially important in the case of so-called near-field events, where the tsunami wave reaches nearby coastal areas as early as 20 min after the seismic event [6,7,8].
Tsunami sources of seismic nature are usually located in subduction zones, where the oceanic tectonic plate moves beneath the continental plate. This process is called “subduction”. Such a zone typically extends for 1000–2000 km and is typically 200–300 km wide (from the axis of the deep trench to the shore). In a situation when tsunamigenic sources can be 100 km × 50 km and larger, hundreds, if not thousands, of computational experiments are needed to create a wave-height database for scenarios of tsunami propagation from model sources of various sizes and locations. The initial height of the displacement of the water surface in the source region should also be varied, since the nonlinearity of the model does not allow the linear transfer of wave modeling results for lower source heights to tsunami heights near the shore at higher initial values of the displacement in the source.
Leaving aside the question of what information can be used to make such a choice, let us dwell on how it is possible to significantly reduce the energy costs of creating and using such a database. Previously, the authors proposed the concept of a specialized calculator based on an FPGA in a PC for numerical solution of the system of shallow-water equations [9]. The necessary algorithms were ported to the FPGA platform using the high-level synthesis (HLS) technology [10].
In the Materials and Methods section, the shallow-water partial differential equations (PDEs) were given, which are the most widely used in modeling tsunami wave propagation [3]. The proposed solution demonstrated the same solution accuracy as the MOST software package [7,8]. This tool, which is the official modeling tool of the U.S. Tsunami Warning Centers, is most commonly used in tsunami modeling [7]. In the same Materials and Methods section, the McCormack finite-difference scheme (being implemented in the specialized FPGA-based calculator) was given.
The section results consists of several parts. The first part, Section 2.1, provides a rough evaluation of the required energy consumption to create (compute) a tsunami scenario database for one of subduction zones. This is based on a description of the set of parameters required to calculate one scenario and an estimate of the number of scenarios for the selected subduction zone. Then, in Section 2.2, such details of the computational experiments as a digital bathymetry of a particular part of the world ocean and model tsunami source are given. Section 2.3 describes the peculiarities of the implementation of a processor element (PE)—the basic part of the proposed specialized calculator—on different platforms. The results of power consumption measurements are summarized in Table 1. Then, the results of numerical experiment, performed at the proposed FPGA platform, are described.
Finally, the advantages of the use of the FPGA-based specialized solution to calculate tsunami wave propagation in terms of the low-power priority are discussed.

2. Results

2.1. Required Resources for Tsunami Scenarios Computation—Evaluation

One of the important tasks of tsunami warning is to perform the tsunami zoning of the entire coast of regions where the tsunami hazard is real. Tsunami zoning is the estimation of the maximum possible tsunami heights for each point on the coast under protection for all possible tsunami sources and the distribution of wave heights there for the sources of different heights and sizes. Without a database of shoreline inundation from the past tsunamis accounting a long enough time period, this problem is solved by numerical modeling. As already noted, this would require hundreds (if not thousands) of computational experiments on tsunami propagation generated by sources of different sizes, locations, and heights of the initial displacement of the water surface there.
In 2014–2016, a group of researchers from the Federal Research Center for Information and Computational Technologies SB RAS [11] and some other organizations carried out work on the Russian Science Foundation project “Tsunami hazard assessment of the coast of the Kuril-Kamchatka region, Japan, Okhotsk and Black Seas”. In the course of the project, more than 1000 computational experiments were carried out, which simulated tsunami propagation from different model sources in the observed water areas. Calculations were carried out in grid areas of 3000 × 2000 computational nodes on average. Taking into account the fact that the spatial grid step length in such calculations was about 200–300 m, one must conduct the calculations with a time step not more than 0.5 s. Hence, it is necessary to make not less than 3000–4000 time steps for the wave amplitude to reach the maximum at all points of the coast nearest to the source. The numerical method used in the series of calculations required 1.5–2 h of a central processing unit (CPU) time on the cluster of the Novosibirsk State University for each scenario. With a power consumption of at least 1 kW per node (processor), and it turned out that each computational experiment required at least 2 kWh of the electric energy. Currently, it is not difficult to calculate the total amount of the electric power for the whole series of numerical calculations to estimate the tsunami hazard of the Kuril–Kamchatka subduction zone coast or any other subduction zone. For the more detailed zoning of the coast, with a rather complex geography of the shoreline and bottom topography, the application of the nested grid algorithm [12] will be required, which can increase the number of calculations for each scenario by another three to four times. Thus, about 10 megawatt hours of the electric energy are required to perform the necessary series of computational experiments.
As will be shown below, these energy costs can be reduced by orders of magnitude by using a specialized FPGA-based calculator.

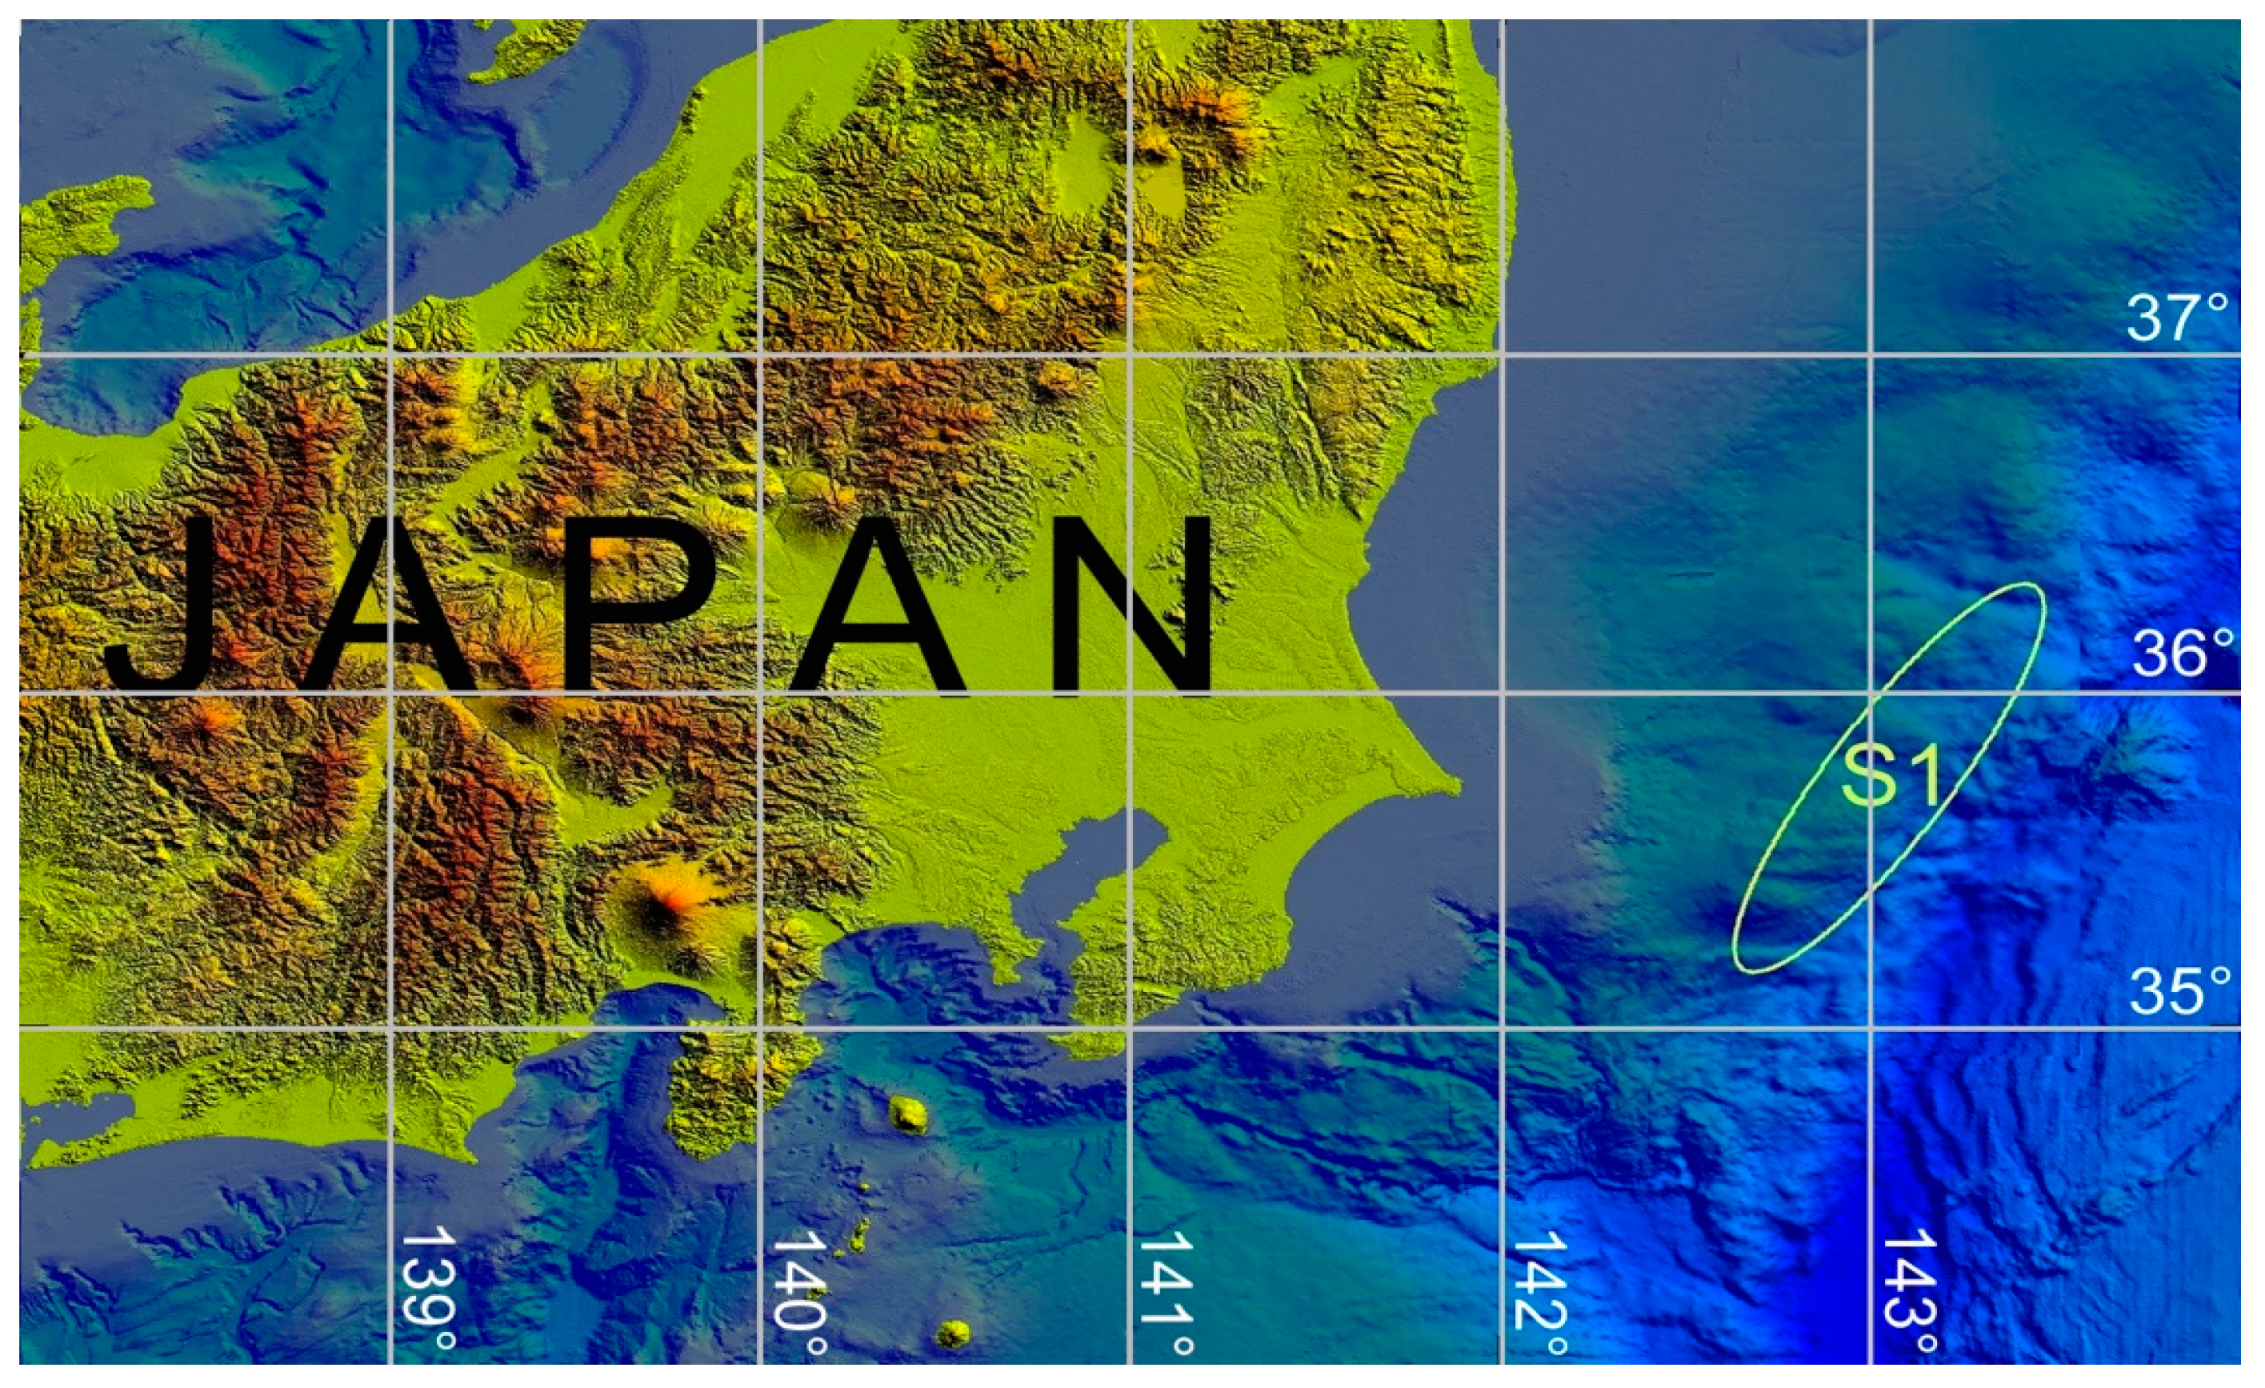
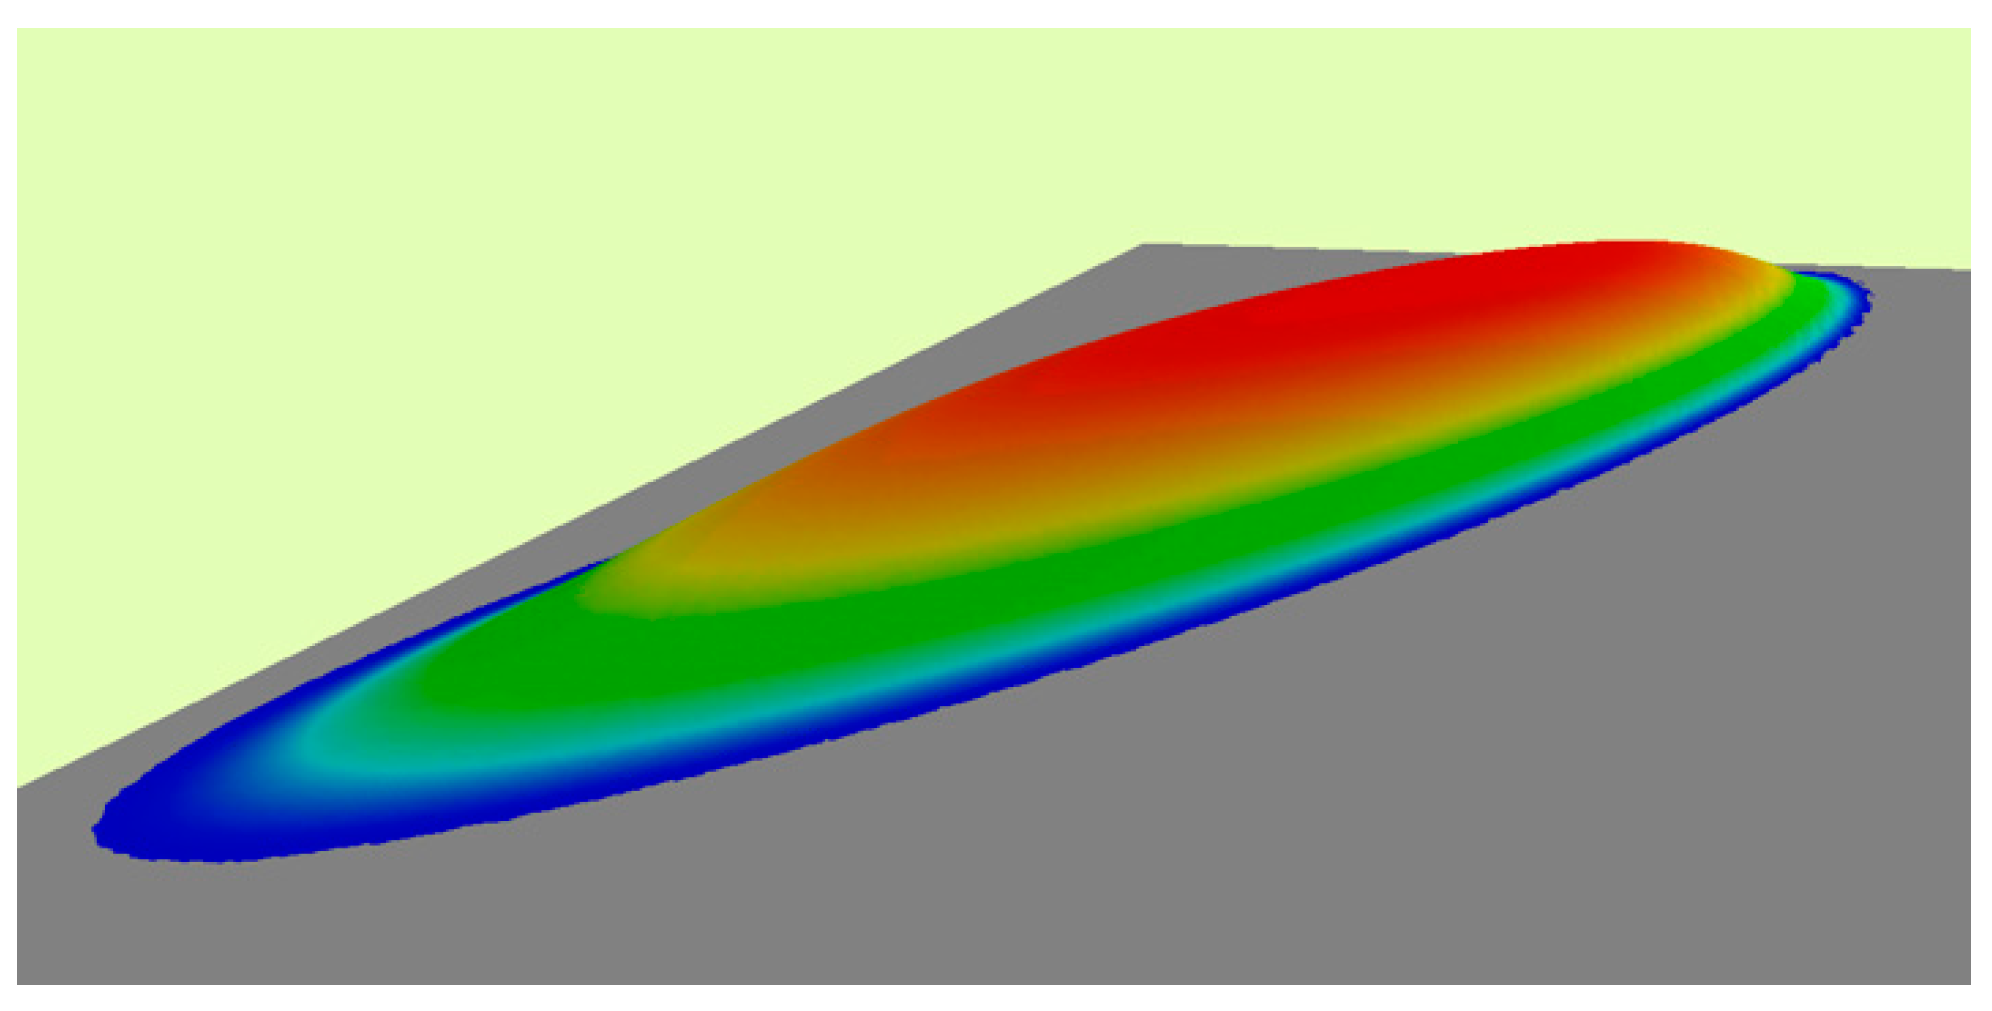
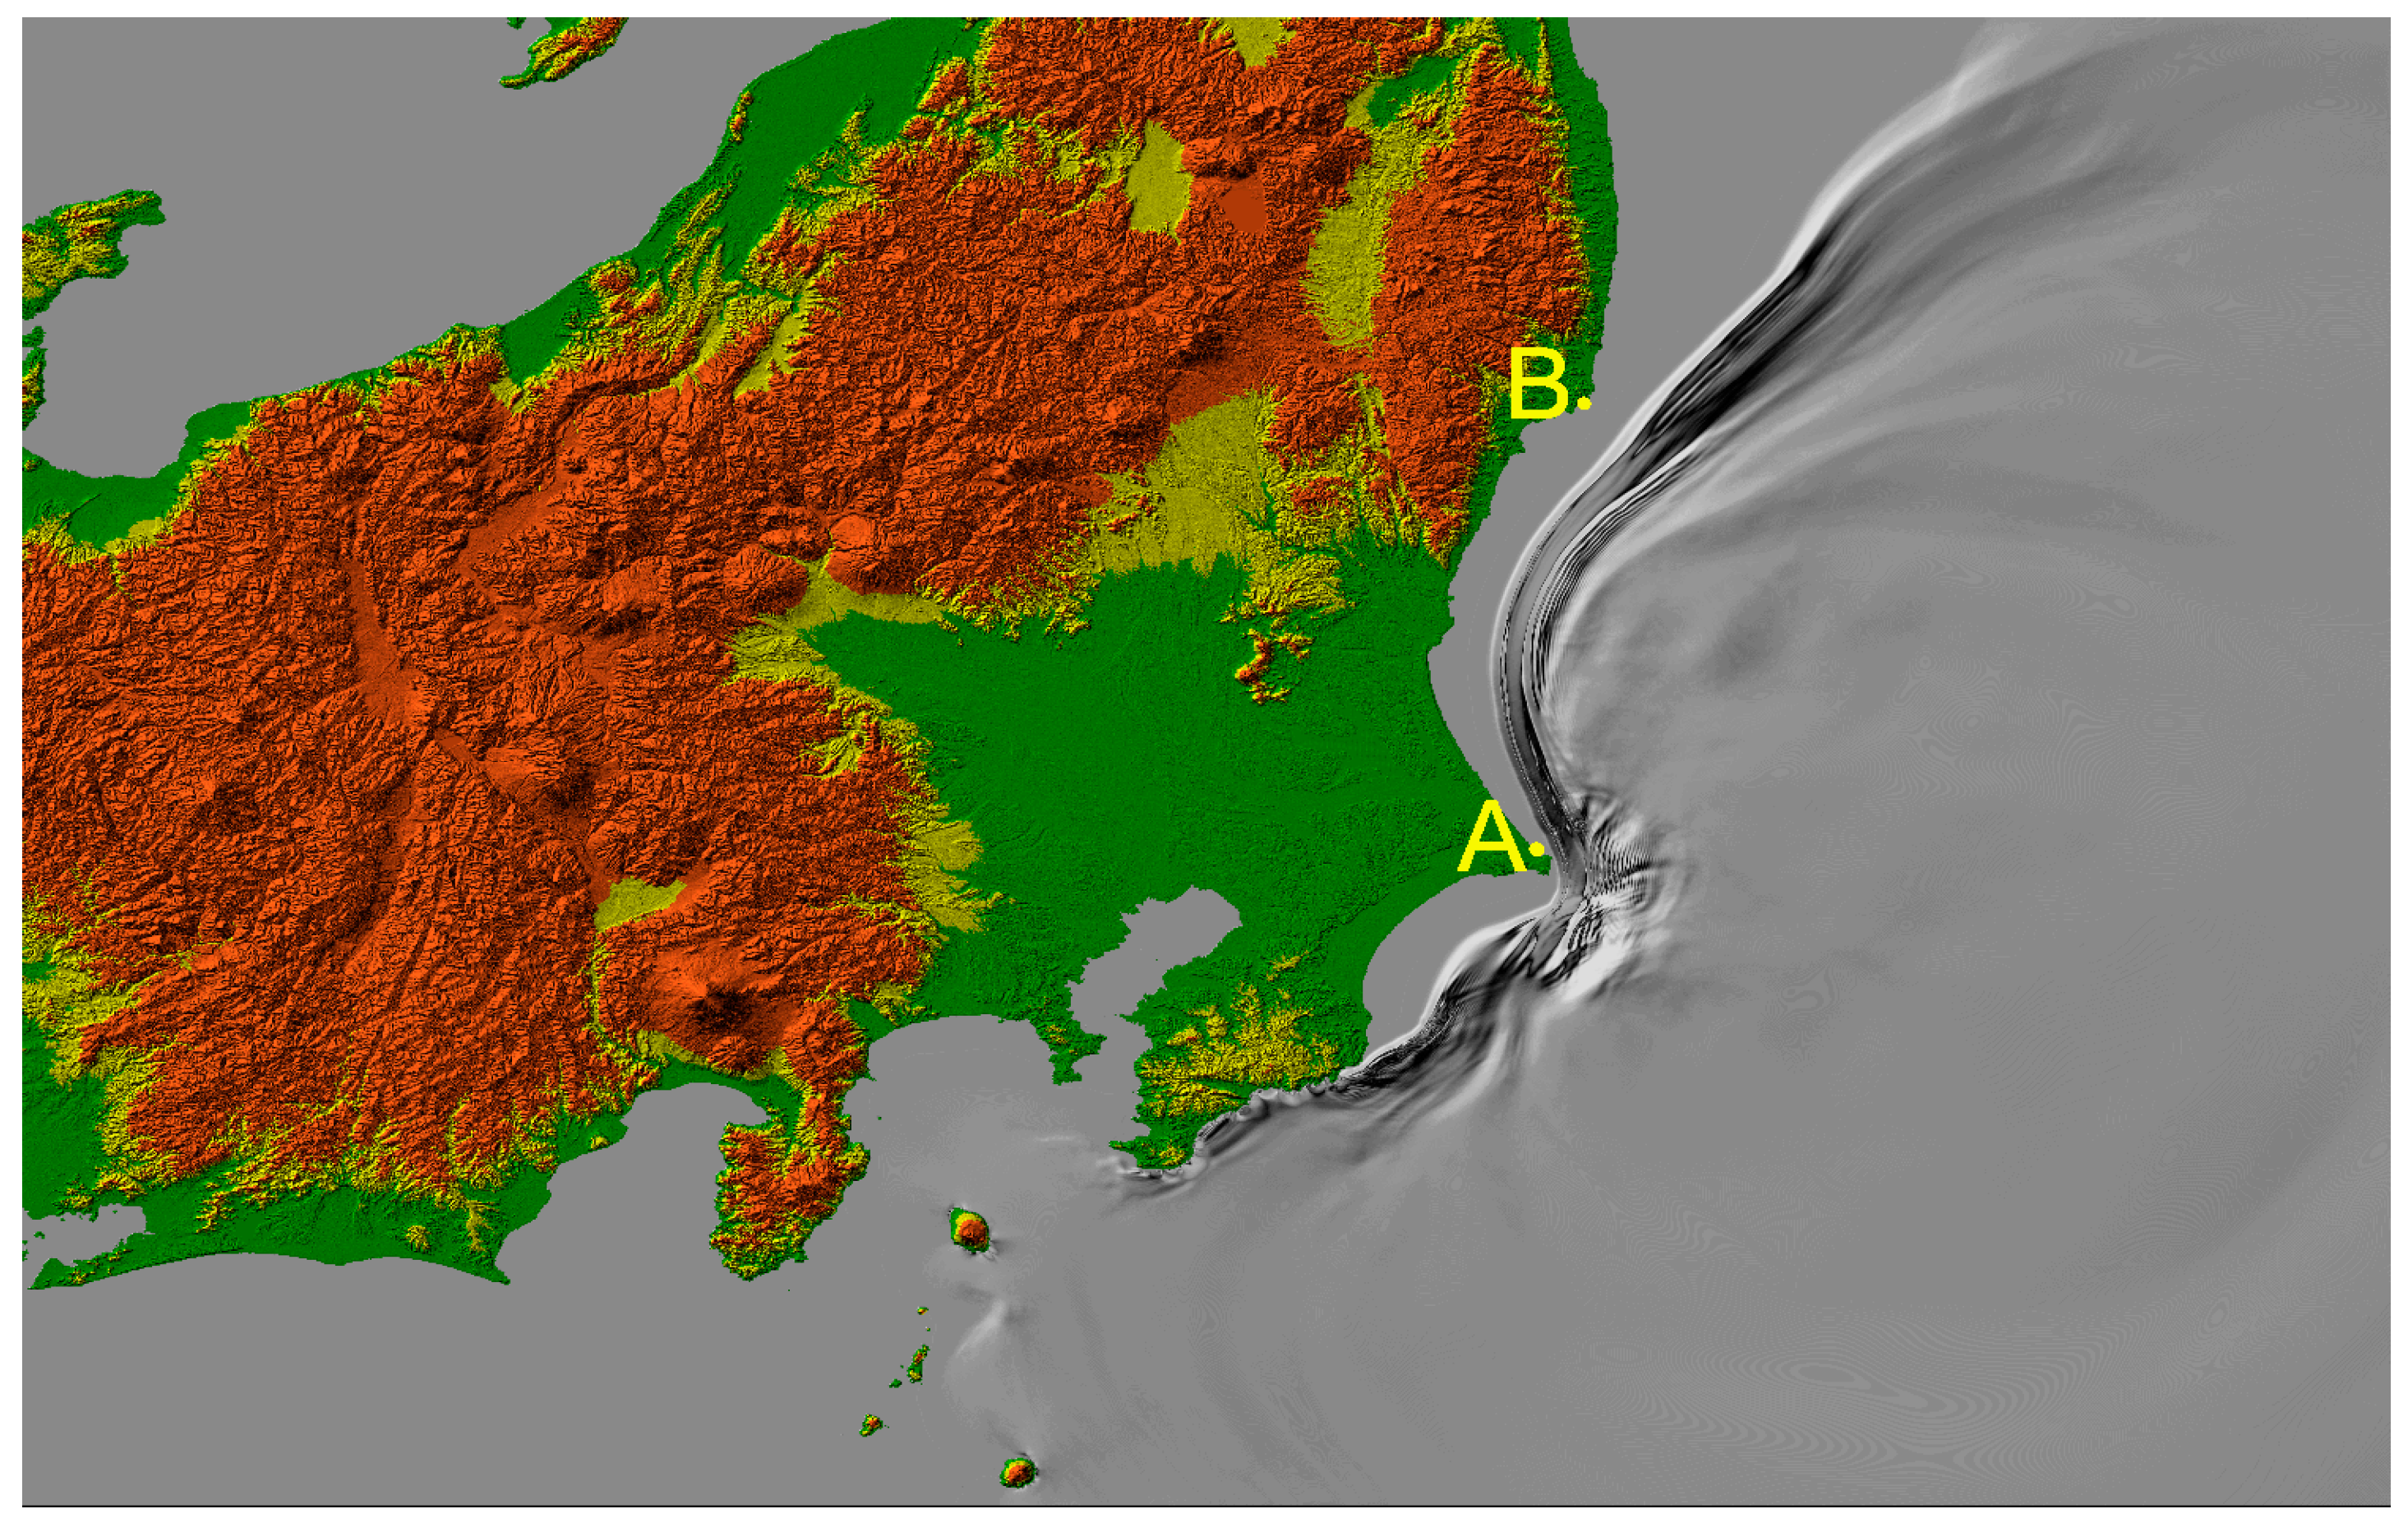
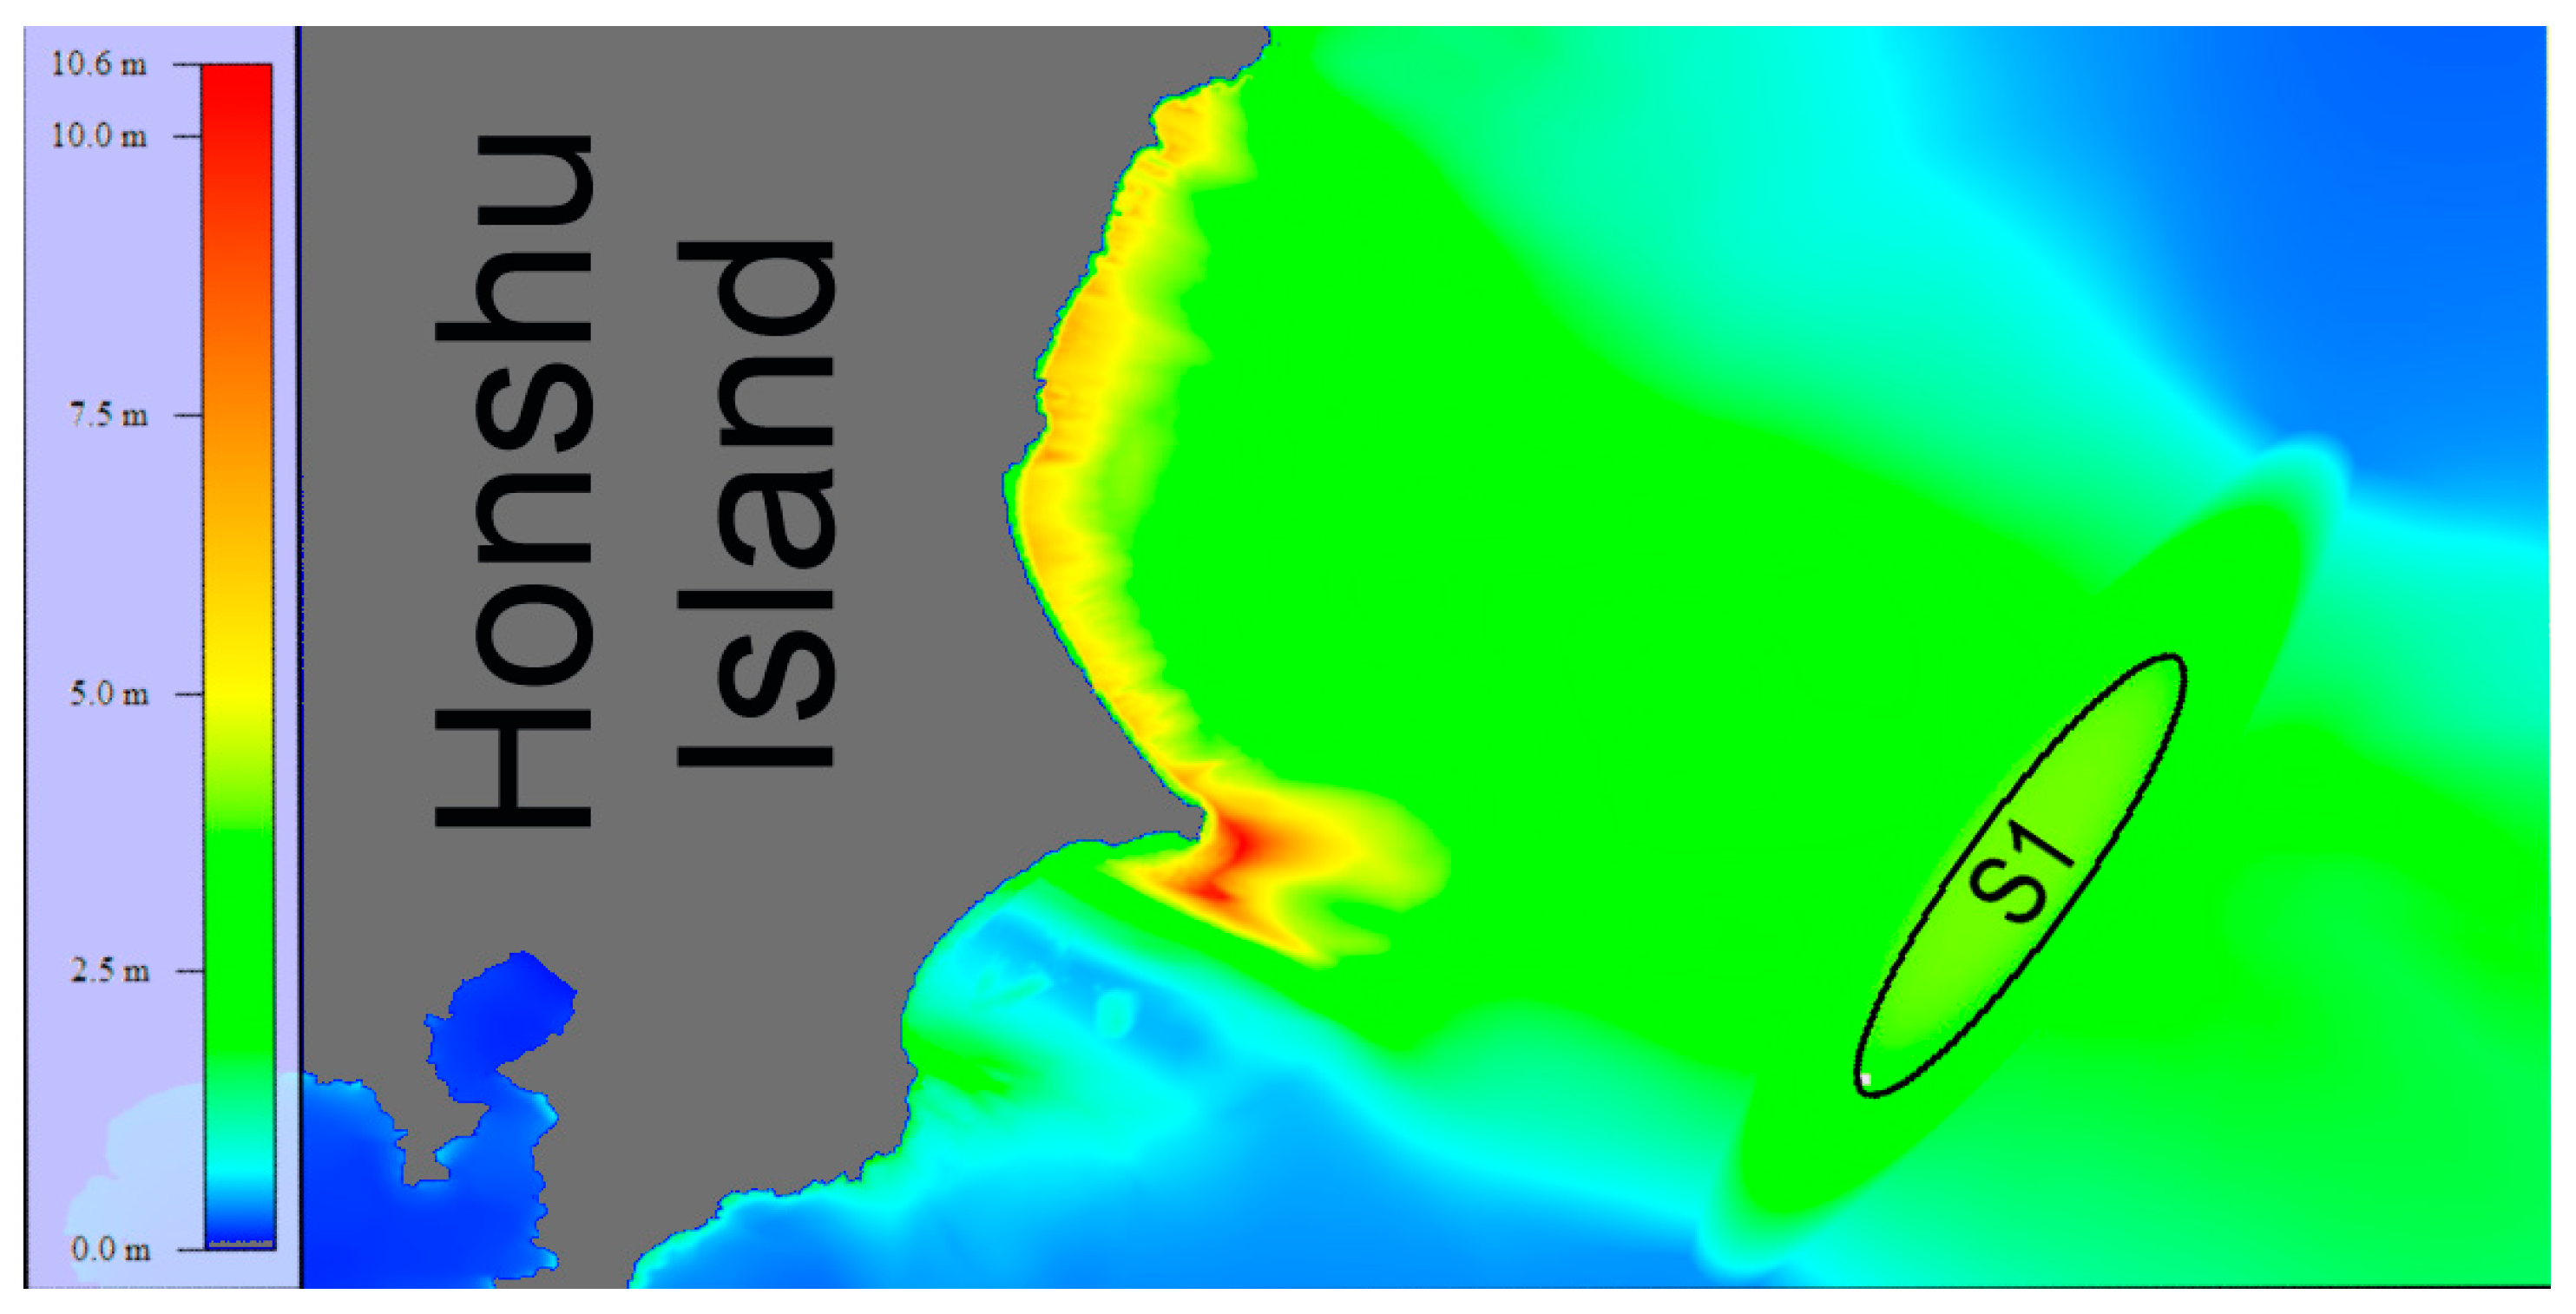
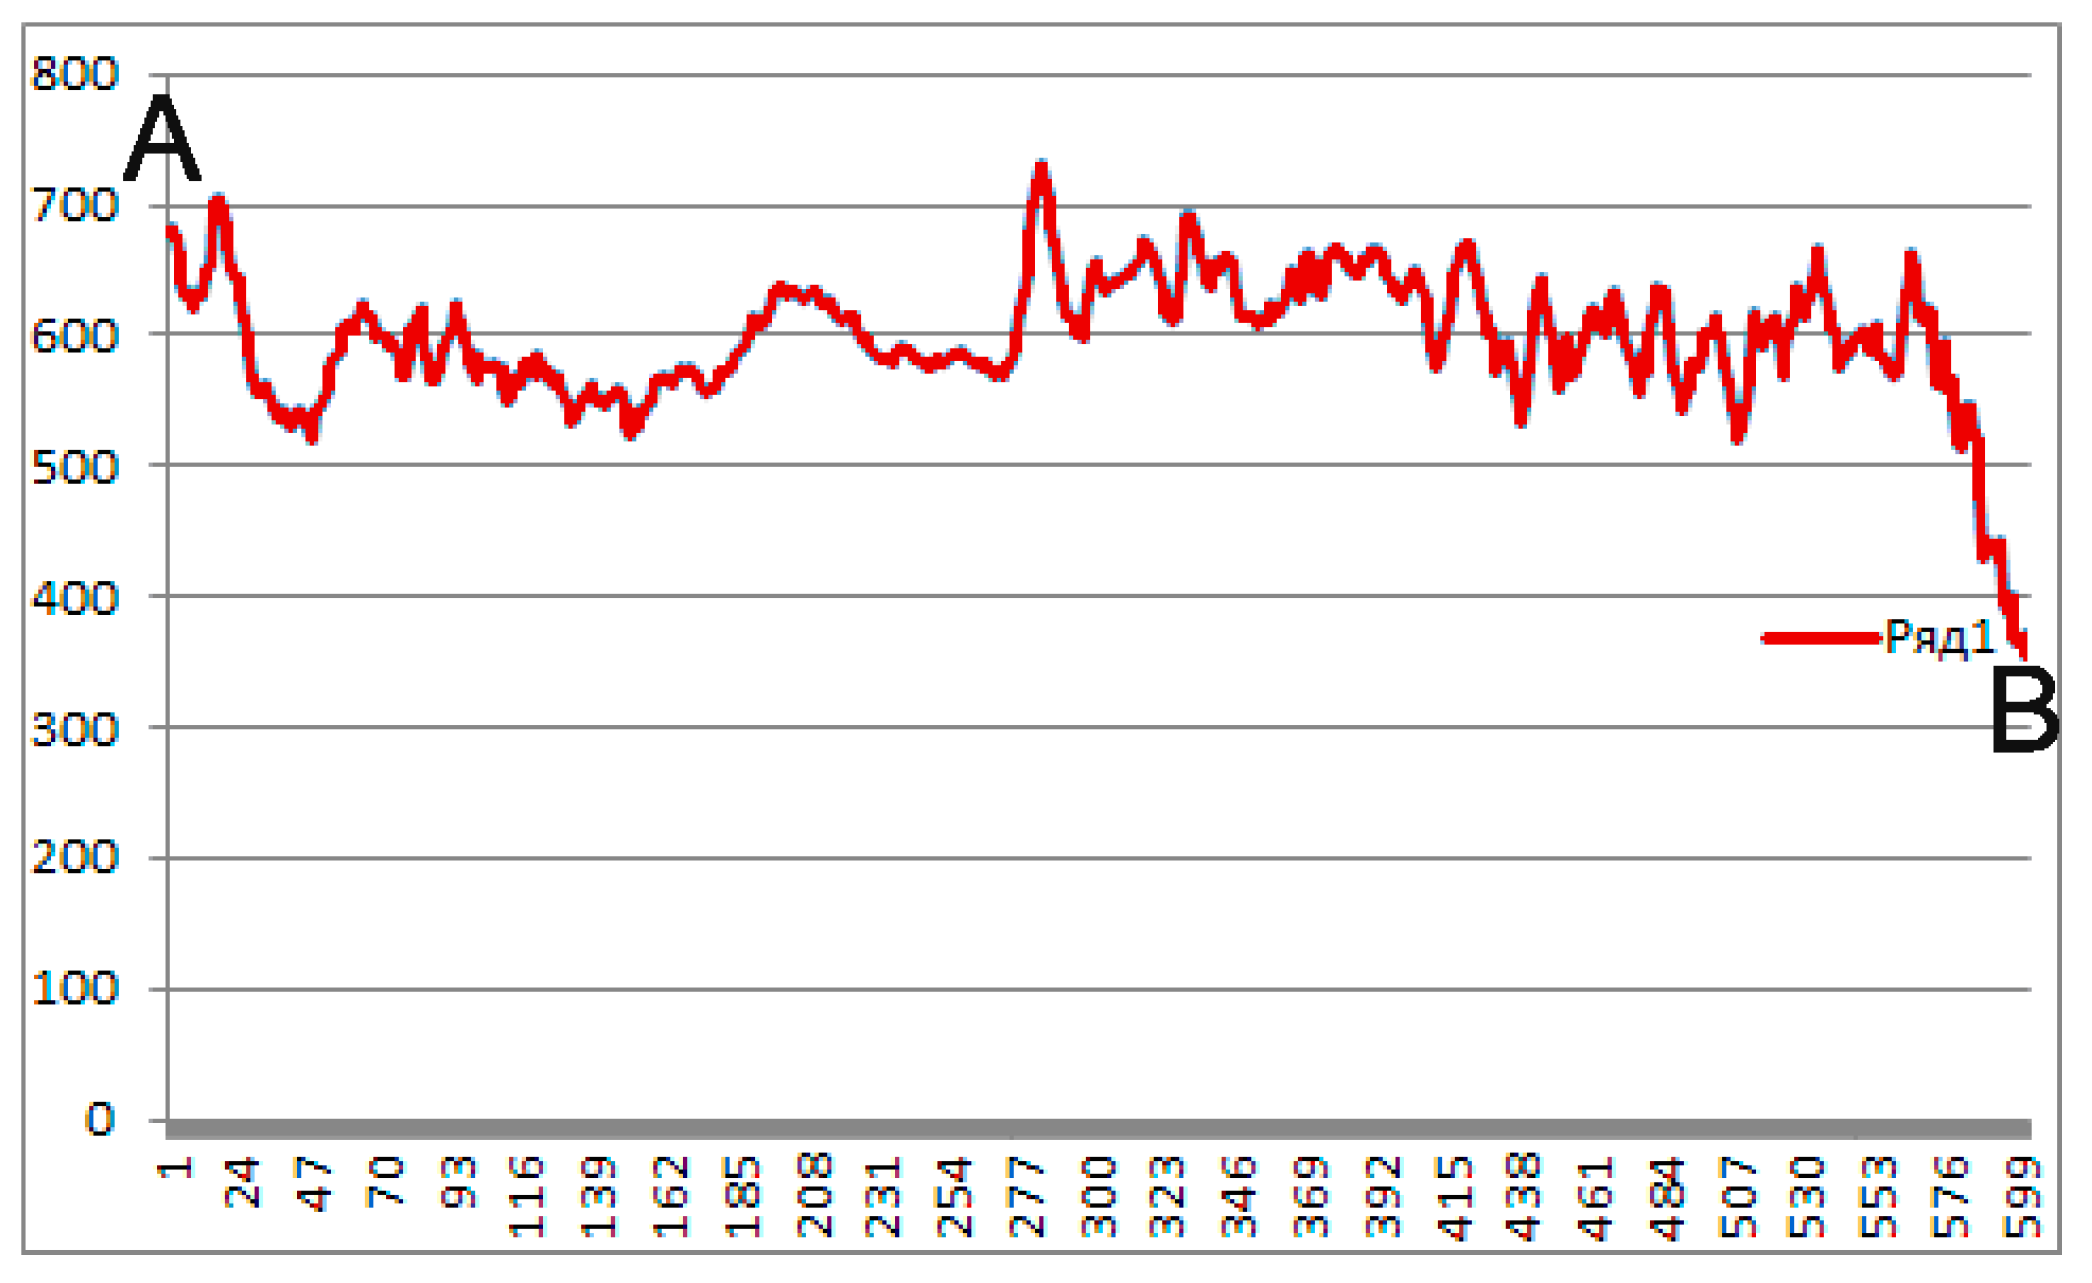
2.2. Numerical Experiment Setup

It was evaluated the required energy consumption by the corresponding measurements related to numerical experiment simulating one of the scenarios of tsunami generation and propagation. A rectangular region near the eastern coast of Japan stretching from 137° to 143° eastern longitude (EL) and from 34° to 38° northern latitude (NL), as the modelling area was chosen. A grid bathymetry with a 0.002° resolution in both directions (223 m in the North–South direction and 180 m in the West–East direction) was created based on the bathymetric data issued by the Japan Oceanographic Data Center (JODC) [13]. The bottom topography and geography of the computational area are visualized in Figure 1.
The initial sea surface displacement in the form of an ellipse with axes lengths of 300 km and 75 km was taken as the tsunami source. The source profile with the maximum uplift of 4 m in the center is shown in Figure 2.
According to the requirement of the stability condition for explicit difference schemes, which limited the wave propagation to no more than one spatial step per time step, the time step value was taken as 0.5 s. The total number of iterations was equal to 10,000 steps, which corresponded to 5000 s of the tsunami wave propagation. During this time, the wave reached almost the entire coast of the calculated water area.

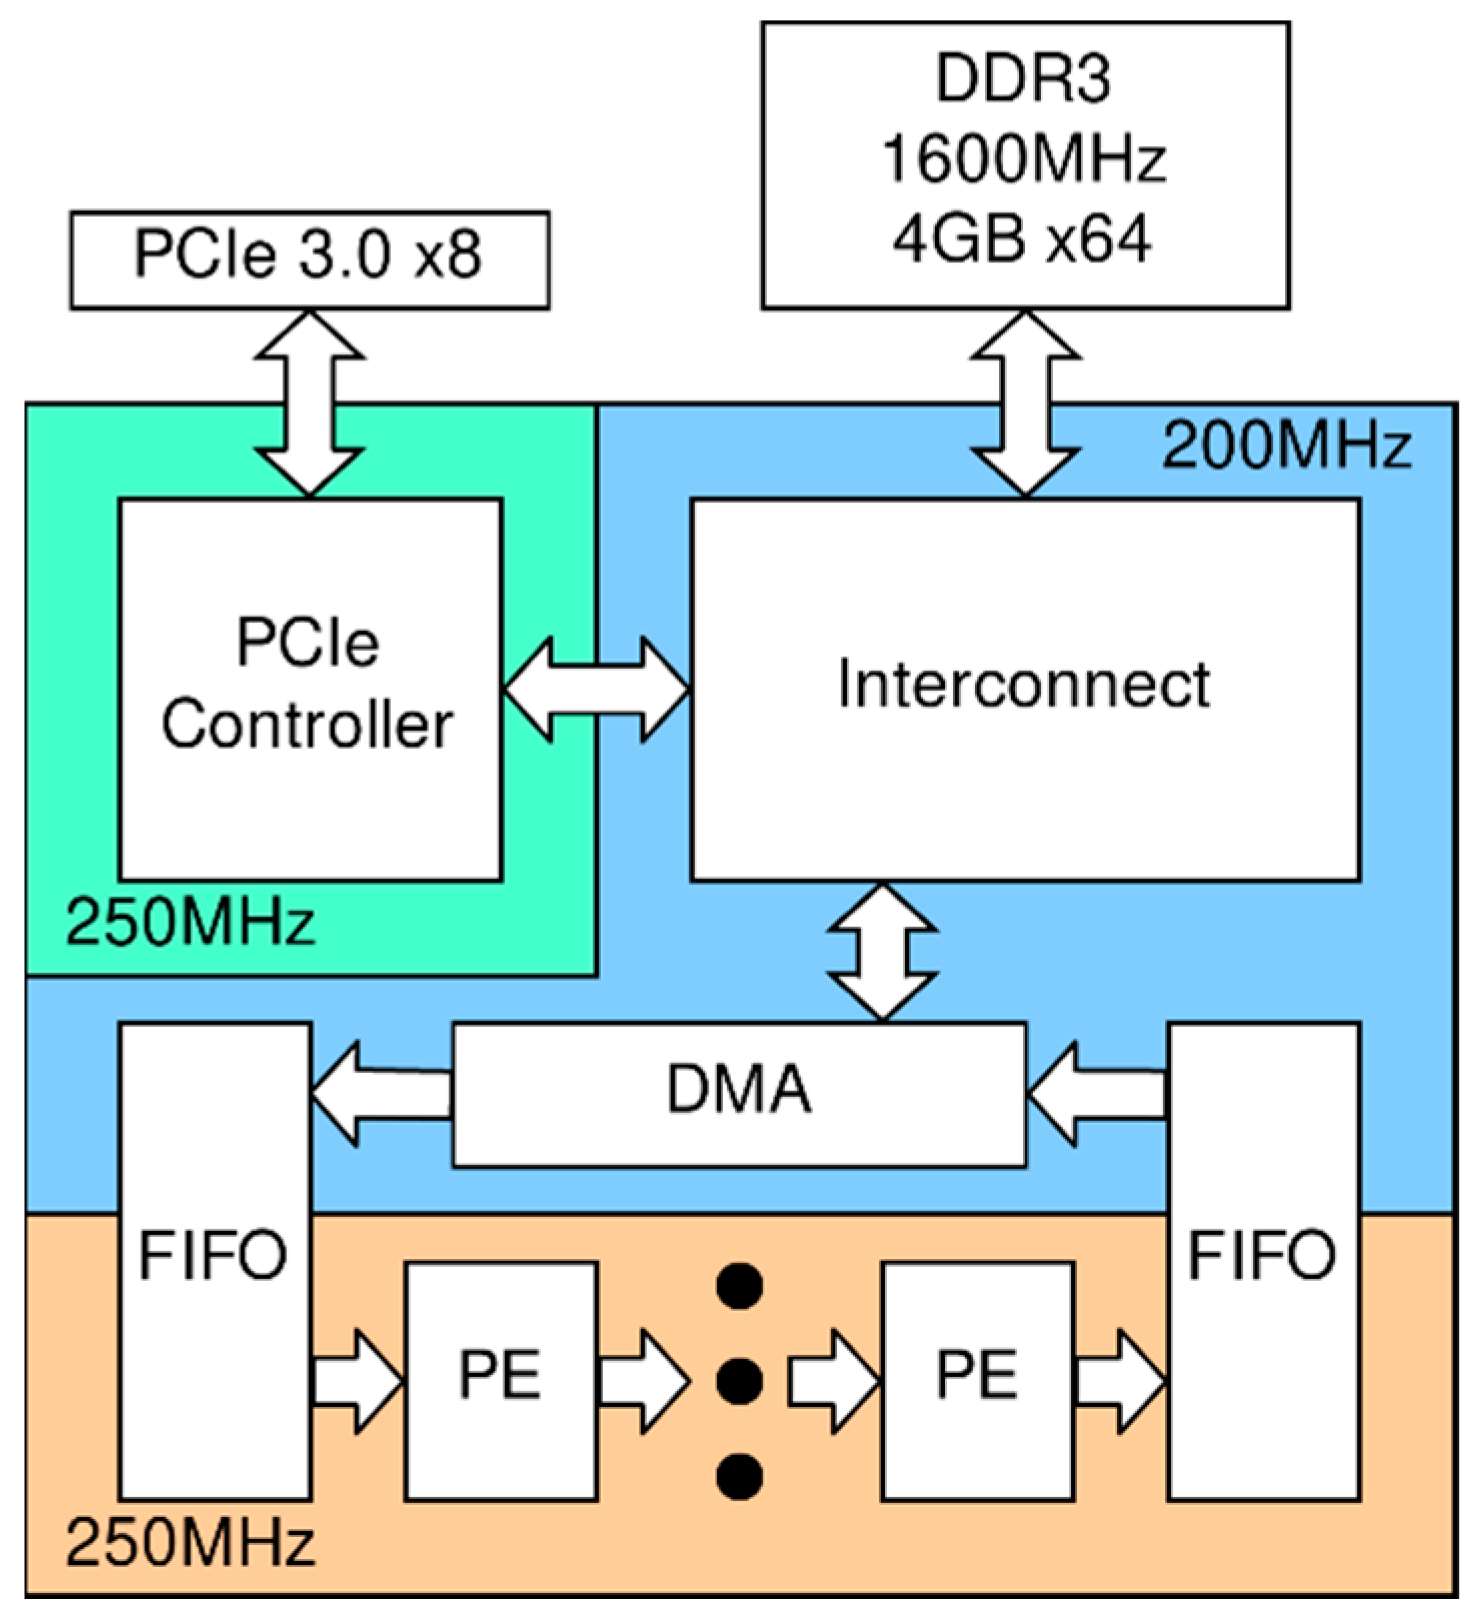
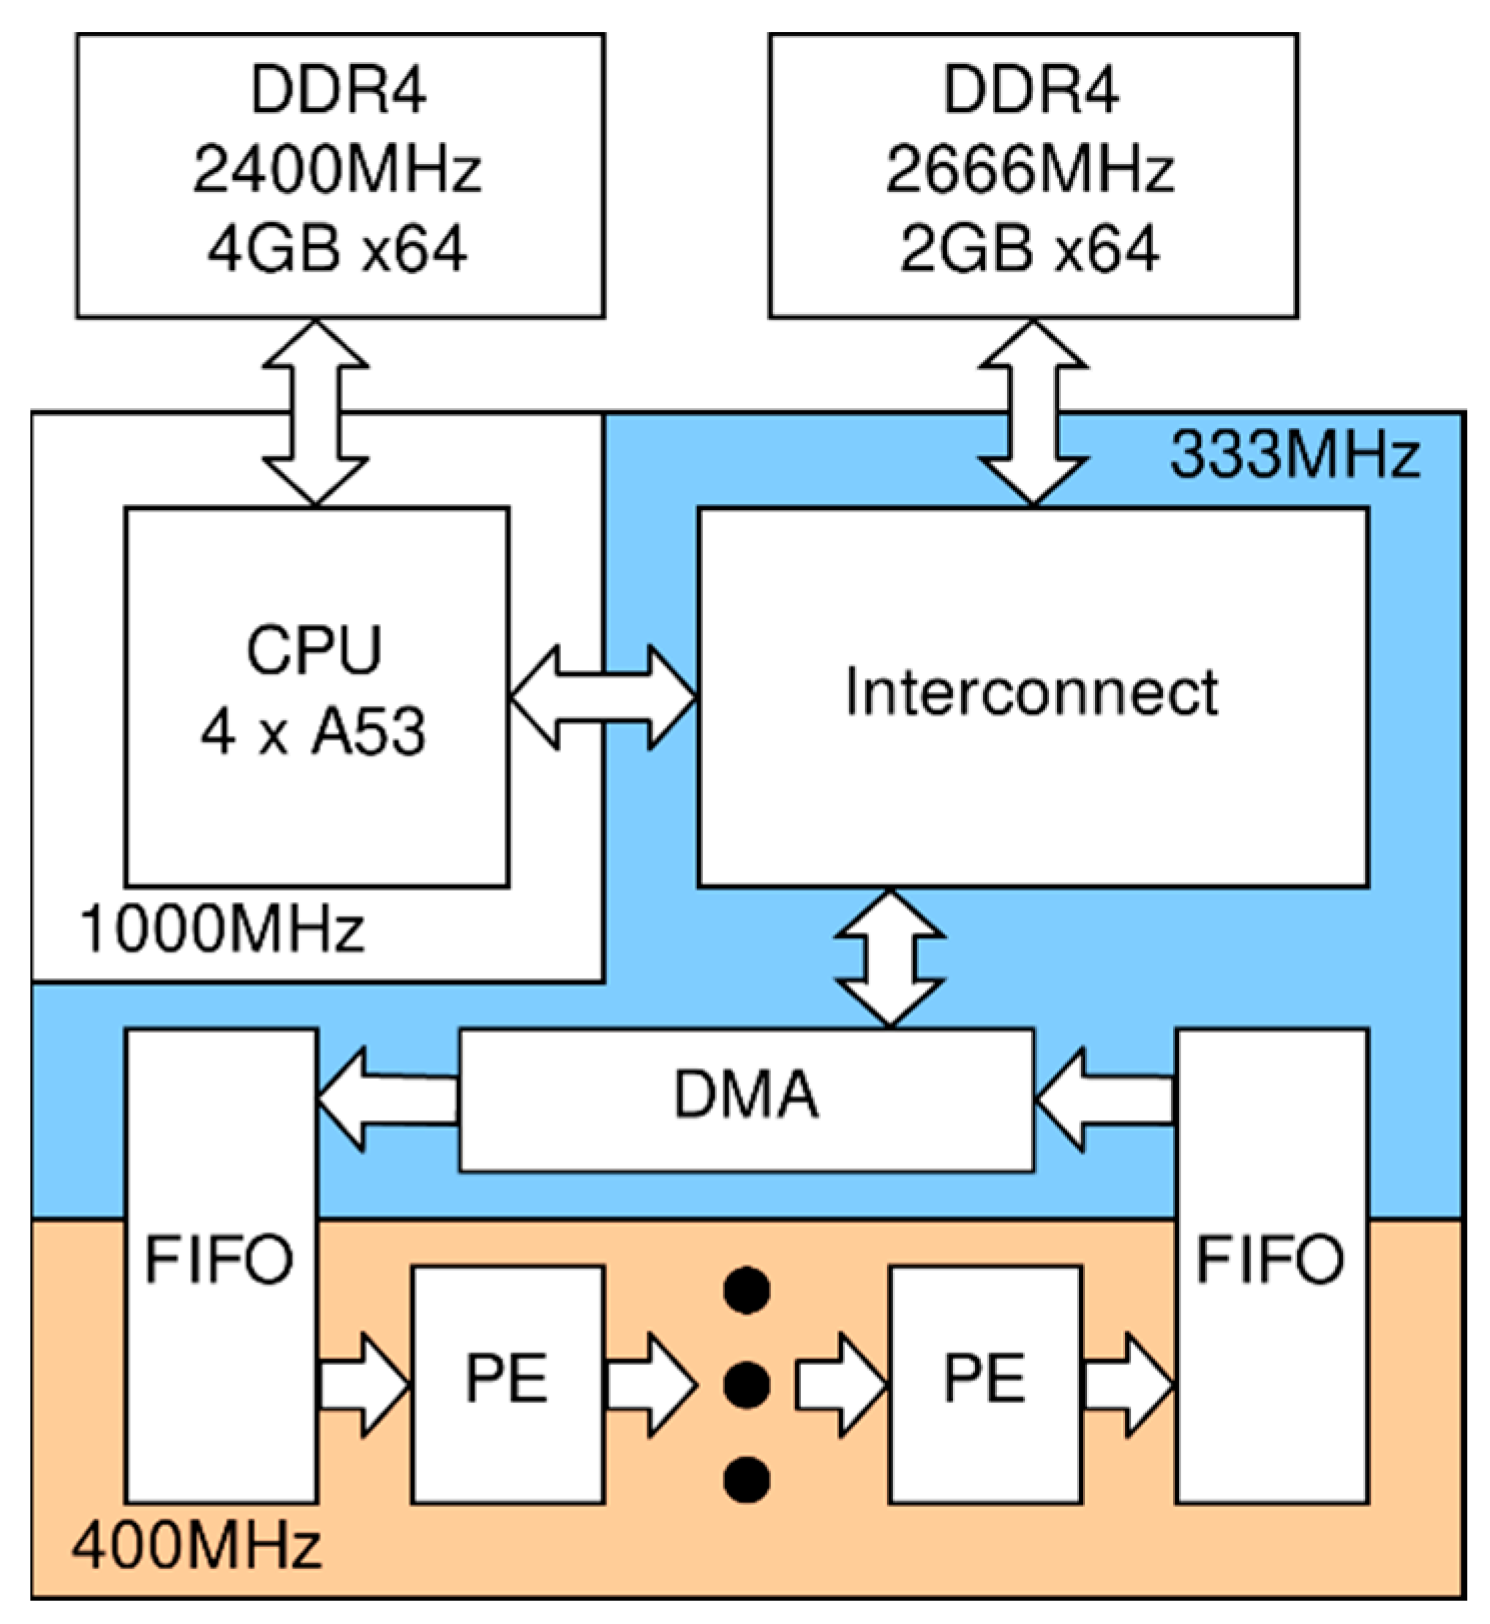
2.3. Hardware Solution Proposed

The details of the proposed hardware/software solution were described. In order to implement the McCormack algorithm (finite-difference scheme) on the FPGA platform [9,14], PEs were designed. One PE represents the implementation of one step of the algorithm. PEs were implemented using the HLS technology [9]. A stream of values H, u, v, and D (see the Materials and Methods section) at the i-th step comes to the PE input, which is a sequential traversal of the computational stack. The output is the same stream, with values at step i + 1. The PE operates in the pipeline mode and allows processing one grid point per clock cycle. Connecting the PE output with the input of another PE, it is possible to organize chains (pipelines) of different lengths that allow calculating several algorithm steps simultaneously, as the results from the previous element arrive. The maximum length of the pipeline depends only on the capabilities (capacity) of the FPGA chip. In addition, each PE needs to store two lines of values in the internal FPGA memory, which imposes limitations on the maximum size (width) of the computation grid and on the parameters required from the FPGA.
Since the internal FPGA memory is not always enough to store the entire computational grid, external (relative to the FPGA chip) storage and modules of interaction with it are necessary. Specially for this purpose memory access controllers (direct memory access (DMA)) were developed using the standard AMBA AXI4 protocol [15], which allows the use of any type of memory that has a controller with an AXI4 interface. The proposed architecture is given in Figure 3.
The purpose of the DMA controller is to transfer the data among the calculator, the memory, and the host. The DMA controller can work with any kind of memory/bus controllers, which support the AXI4-MM protocol. Specifically, in VC709, it is used to transfer the data between the Peripheral Component Interconnect Express (PCIe) Intellectual property (IP) core (which implements the AXI4 protocol) and the Xilinx Memory Interface Generator (MIG), which controls the double data rate 3 memory (DDR3)/double-data-rate 4 memory (DDR4) memory and implements the AXI4 protocol. In case of ZCU106, it is used to transfer the data between the CPU memory and the MIG.
To perform the analysis and measurements, the implemented McCormack algorithm was run on different platforms, namely:
  • PC based on an Intel Core i9-9900K CPU;
  • Xilinx VC709 demboard [16] based on FPGA Virtex-7;
  • Xilinx ZCU106 demboard [17] based on the Zynq Ultrascale+ system-on-chip (SoC).
The VC709 is a PCIe-form-factor card plugged into a com-host. It carries a Virtex-7 FPGA (28 nm TSMC), two DDR3 1600 MHz, 64-bit memory modules in a SODIMM-form factor with 4 GB each, and four 10-gigabit Ethernet. The interaction with the host is via a PCIe 3.0 x8 bus with a peak bandwidth of 64 Gbps. It should be noted that for the VC709 accelerator, a host computer is required, which needs additional power. The ZCU106 solution is standalone, and the SoC itself is made according to a more modern process, which results in better performance and energy efficiency compared to the PCIe gas pedal.
The ZCU106 is a standalone system based on the Zynq Ultrascale+ SoC. The SoC is a four-core ARM processor (Cortex-A53) combined with an FPGA. The advantage of this solution is autonomy and high integration. The combination of the FPGA, the CPU, and high-speed interfaces between them on one chip provides a high power efficiency. ZCU106 has Zynq Ultrascale+ (16 nm TSMC), 4 GB DDR4 2400MHz memory connected to CPU, and 2 GB DDR4 2666MHz memory connected to FPGA. Note that many other peripherals are available in this variant, which demonstrates that the platform can be used in various application areas, but it does not affect the power efficiency in the particular task of tsunami wave modeling in the best way.
In spite of the fact that the architecture of the debug boards is very different, the internal architecture of the calculator has a similar principle (see Figure 3 and Figure 4).
The computation data are stored in an external DDR3/4 memory. The host CPU loads the data there via the PCIe bus or the internal SoC bus. With the DMA controller and a FIFO buffer, the data are sequentially loaded into a chain of PEs running at their independent frequencies. The pipeline length and frequency depend on the volume and speed of the FPGA. For the VC709 platform, the pipeline consists of eight PEs operating at 250 MHz. For ZCU106, the pipeline consists of 4 PEs at 400 MHz. The result of the calculations is also fed to the external memory via DMA.
The comparison was done on a 3000 × 2000 nodes bathymetry, described in Section 2.2. The performance was compared with a benchmark implementation on a CPU using the OpenMP technology for parallelization. The system consumption was power consumption at the inputs of the PC power supply (CPU, VC709) and the board (ZCU106). The consumption for the CPU was measured by the utility [18], which used internal sensors of Intel processors. The consumption on the FPGA was measured by external sensors installed on the debug board. The obtained results are shown in Table 1.
Note that the system power consumption is understood as an average power, consumed by the whole computation platform from an Alternating current (AC) wall socket, measured by an AC power meter during computation. This includes a power supply unit, a motherboard, disks, a CPU, and an FPGA. The processor power consumption is regarded as a power consumed by the CPU or FPGA, measured by power sensors installed on a board near the CPU/FPGA. The system includes all CPU cores, FPGA fabric, a memory, and PCIe controllers. The measured power (P) converted to energy (E) was calculated using the following equation:
E = P × T ,
where T is the time used for computing one iteration of the algorithm on bathymetry with 3200 × 2000 points.
The power/energy consumption of one PE was not calculated, since it is near impossible to distinguish the power consumed by the PE from other elements in the FPGA design.
The basic part of the proposed solution is PEs. It is a special IP that implements one step of the MacCormack algorithm. It processes the computation grid as a sequential stream and computes one point of the grid per clock cycle using the computation pipeline. Each PE has a cache memory to keep previous lines of the grid and reduce the memory access to one reading per iteration.
It should be noted that in case of using ZCU106 the line “CPU consumption” included the energy consumption of the CPU cores, which was 2–3 W or about 15% of the total SoC consumption. As can be seen, in spite of the fact that the power efficiencies of the VC709 and ZCU106 FPGAs were comparable (76 and 66 joules per iteration, respectively), the PCIe-based solution (VC709) was much (twice) less efficient in the total system power consumption due to the host computer.

2.4. Numerical Results

As a result of the computational experiment described in Section 2.2, arranged at the proposed FPGA-based platforms (see Section 2.3), we obtained the water surfaces calculated at different time instances and the distributions of the tsunami height maxima in the entire computational domain and, in particular, along the coastlines under investigation. Figure 5 shows the water surface after 5000 time steps, which corresponded to 2500 s of the tsunami wave propagation.
In Figure 6, one can observe the distribution of the wave height maxima in a fragment of the computed region after 10,000 time steps of the tsunami propagation generated by the ellipsoidal source labeled S1 in the figure.
Finally, Figure 7 represents what the computational experiment described above was conducted for. This was a detailed distribution of the numerically obtained tsunami heights maxima along the coastline between points A and B (see Figure 5). The numbers along the horizontal axis showed the difference along the North–South direction (in spatial steps) between the current point and point A.
The results of this computational experiment simulating one of the tsunami propagation scenarios from a given source showed that it is possible to obtain estimates of tsunami heights from such a source at all points along the coast in two orders of magnitude less time (tens of seconds instead of 2–3 h), which saves a significant amount of electric energy.

3. Discussion

Using the capabilities of modern computer architectures (e.g., FPGA) allows creating specialized calculators, working as a part of a PC or independently, to solve specific problems (such as streaming data processing and numerical solutions of PDE systems). The achieved performance could be comparable with those of supercomputer resources. However, for data processing (calculation), it requires orders of magnitude less energy. Thus, using this hardware/software solution to simulate different tsunami propagation scenarios saves a significant amount of energy consumption (2–3 kWh per computational experiment). In addition, the high performance of the proposed method will make it possible to estimate in real time the tsunami heights at different points of the coast before it arrives there, even if the power supply is interrupted.
The validity of the method proposed was confirmed by the comparison of numerical results of several test problems against the ones obtained by MOST software [13]. The precision and reliability of the MOST method [7], which currently is used by NOAA (Washington, DC, USA), is undoubted.
The conducted experiments have shown that compared to the use of PCs, the use of specialized devices based on FPGAs can be up to 35 times more energy-efficient, which is certainly an extremely important result in terms of the power generation. Thus, when using specialized architectures to solve modeling problems, it is possible and expedient to use them in the 24/7/365 mode. It is impossible for supercomputer solutions to work in this mode.
In the future, the authors plan to use specialized FPGA-based calculators to solve other tasks that currently require the use of supercomputing resources.

4. Materials and Methods

To simulate the tsunami wave propagation, a nonlinear shallow-water PDE system [19] was used. Following [3] (as well as the majority of tsunami phenomena researchers), the equivalent form of a shallow-water system (which did not take into account external forces such as as sea bed friction and the Coriolis force) was used:
H t + ( u H ) x + ( v H ) y = 0 ,   u t + u u x + v u y + g H x = g D x ,   v t + u v x + v v y + g H y = g D y ,
where H(x,y,t) = η(x,y,t) + D(x,y) is the entire height of the water column, η is the sea surface disturbance (wave height), D(x,y) is the depth profile (which is supposed to be known at all grid points), u and v are components of the velocity vector, and g is the acceleration of gravity.
For numerical experiments, the following finite-difference MacCormack scheme [20] was implemented:
H i j n + 1 H i j n τ + H i j n u i j n H i 1 j n u i 1 j n Δ x + H i j n v i j n H i j 1 n v i j 1 n Δ y = 0 ,
u i j n + 1 u i j n τ + u i j n u i j n u i 1 j n Δ x + v i j n u i j n u i j 1 n Δ y + g η i j n η i 1 j n Δ x = 0 ,
v i j n + 1 v i j n τ + u i j n v i j n v i 1 j n Δ x + v i j n v i j n v i j 1 n Δ y + g η i j n η i j 1 n Δ y = 0 ,
H i j n + 1 ( H i j n + 1 + H i j n ) / 2 τ / 2 + H i + 1 j n + 1 u i + 1 j n + 1 H i j n + 1 u i j n + 1 Δ x + H i j + 1 n + 1 v i j + 1 n + 1 H i j n + 1 v i j n + 1 Δ y = 0 ,
u i j n + 1 ( u i j n + 1 + u i j n ) / 2 τ / 2 + u i j n u i + 1 j n + 1 u i j n + 1 Δ x + v i j n u i j + 1 n + 1 u i j n + 1 Δ y + g η i + 1 j n + 1 η i j n + 1 Δ x = 0 ,
v i j n + 1 ( v i j n + 1 + v i j n ) / 2 τ / 2 + u i j n v i + 1 j n + 1 v i j n + 1 Δ x + v i j n v i j + 1 n + 1 v i j n + 1 Δ y + g η i j + 1 n + 1 η i j n + 1 Δ y = 0 ,
where Hnij, unij, and vnij are the gridded variables which correspond to the H, u, and v functions in differential system (1), respectively; the parameters τ, Δx, and Δy are the time step and spatial steps of the computational grid. In order to account the sphericity of the Earth, we used a decreasing grid step with respect to the longitude for larger values of the latitude. The notation F i j n represents variables at time layer n, F i j n + 1 represents intermediate values, and F i j n + 1 corresponds to the variables at time layer n + 1.
The details of the implementation of the abovementioned finite-difference scheme in the FPGA-based calculator could be found in [9].

Author Contributions

Conceptualization, M.L., M.S. and A.M.; methodology, K.L. and M.S.; software, K.O.; visualization of numerical results, A.M.; writing—original draft preparation, K.O. and A.M.; writing—review and editing, M.L., K.O. and A.M. All authors have read and agreed to the published version of the manuscript.

Funding

This research was supported by the state contract with IAE SB RAS (121041800012-8) and with ICMMG SB RAS (0315-2019-0005).

Data Availability Statement

The data presented in this study are available on request from the corresponding author. The data are not publicly available due to the fact that all the authors work at the same institution and there is no necessity to create repository for data exchange.

Conflicts of Interest

The authors declare no conflict of interest.

Abbreviations

PCpersonal computer
FPGAfield-programmable gate array
NOAANational Oceanic and Atmospheric Administration
HLShigh-level synthesis
PDEpartial differential equation
MOSTMethod of Splitting Tsunami
PEprocessor element
SB RASSiberian Branch of the Russian Academy of Sciences
CPUcentral processing unit
DMAdirect memory access
AMBAadvanced microcontroller bus architecture
PCIePeripheral Component Interconnect Express
TSMCTaiwan Semiconductor Manufacturing Company
DDR3double data rate 3 memory
SODIMMsmall outline dual in-line memory module
ZCU106Zynq UltraScale+ MPSoC ZCU106 Evaluation Kit Board
SoCsystem-on-a-chip
FIFOfirst-in-first-out (type of memory organization)
OpenMPopen multi-processing (programming standard)

References

  1. Top 500. The List. Available online: http://top500.org (accessed on 4 November 2021).
  2. The Green 500. Available online: http://green500.org (accessed on 4 November 2021).
  3. Titov, V.V.; Gonzalez, F.I. Implementation and Testing of the Method of Splitting Tsunami (MOST) Model; NOAA Technical Memorandum ERL PMEL-112; Pacific Marine Environmental Laboratory: Seattle, WA, USA, 1997.
  4. Liu, P.L.F.; Woo, S.B.; Cho, Y.K. Computer Programs for Tsunami Propagation and Inundation; Tech. Rep.; School of Civil and Environmental Engineering, Cornell University: Ithaca, NY, USA, 1998. [Google Scholar]
  5. Imamura, F.; Yalciner, A.C.; Ozyurt, G. Tsunami Modelling Manual (TUNAMI Model). Available online: http://www.tsunami.civil.tohoku.ac.jp/hokusai3/J/projects/manual-ver-3.1.pdf (accessed on 14 December 2021).
  6. Tsushima, H.; Yusaku, Y. Review on Near-Field Tsunami Forecasting from Offshore Tsunami Data and Onshore GNSS Data for Tsunami Early Warning. J. Disaster Res. 2014, 9, 339–357. [Google Scholar] [CrossRef]
  7. Gica, E.; Spillane, M.; Titov, V.; Chamberlin, C.; Newman, J. Development of the Forecast Propagation Database for NOAA’s Short-Term Inundation Forecast for Tsunamis (SIFT). NOAA Technical Memorandum. 2008. Available online: https://nctr.pmel.noaa.gov/Pdf/brochures/sift_Brochure.pdf (accessed on 19 December 2021).
  8. Titov, V.V.; Gonzalez, F.; Mofjeld, H.; Newman, J.C. Project SIFT (Short-term inundation forecasting for tsunamis). In Submarine Landslides and Tsunamis; Springer Science + Business Media: Dordrecht, The Netherlands; pp. 715–721. [CrossRef]
  9. Lavrentiev, M.; Lysakov, K.; Marchuk, A.; Oblaukhov, K.; Shadrin, M. Hardware Acceleration of Tsunami Wave Propagation Modeling in the Southern Part of Japan. Appl. Sci. 2020, 10, 4159. [Google Scholar] [CrossRef]
  10. Vitis High-Level Synthesis User Guide. Available online: https://www.xilinx.com/support/documentation/sw_manuals/xilinx2020_2/ug1399-vitis-hls.pdf (accessed on 4 November 2021).
  11. Federal Research Center for Information and Computational Technologies. Available online: http://www.ict.nsc.ru/en (accessed on 6 November 2021).
  12. Hayashi, K.; Marchuk, A.G.; Vazhenin, A.P. Generating Boundary Conditions for the Calculation of Tsunami Propagation on Nested Grids. Numer. Anal. Appl. 2018, 11, 256–267. [Google Scholar] [CrossRef]
  13. JODC 500m Gridded Barhymetry Data. Available online: https://jdoss1.jodc.go.jp/vpage/depth500_file.html (accessed on 21 October 2021).
  14. Lavrentiev, M.M.; Marchuk, A.G.; Oblaukhov, K.K.; Romanenko, A.A. Comparative testing of MOST and Mac-Cormack numerical schemes to calculate tsunami wave propagation. J. Phys. Conf. Ser. 2020, 1666, 012028. [Google Scholar] [CrossRef]
  15. AMBA AXI and ACE Protocol Specification AXI3, AXI4, and AXI. Available online: https://developer.arm.com/documentation/ihi0022/e/AMBA-AXI3-and-AXI4-Protocol-Specification (accessed on 6 November 2021).
  16. Xilinx Virtex-7 FPGA VC709 Connectivity Kit. Available online: https://www.xilinx.com/products/boards-and-kits/dk-v7-vc709-g.html (accessed on 6 November 2021).
  17. Zynq UltraScale+ MPSoC ZCU106 Evaluation Kit. Available online: https://www.xilinx.com/products/boards-and-kits/zcu106.html (accessed on 6 November 2021).
  18. Github.com/sosy-lab/cpu-energy-meter. Available online: https://github.com/sosy-lab/cpu-energy-meter (accessed on 6 November 2021).
  19. Stoker, J.J. Water Waves: The Mathematical Theory with Applications; Interscience Publishers: New York, NY, USA, 1957. [Google Scholar]
  20. MacCormack, R.W.; Paullay, A.J. Computational Efficiency Achieved by Time Splitting of Finite–Difference Operators. In Proceedings of the 10th Aerospace Sciences Meeting, San Diego, CA, USA, 17–19 January 1972; pp. 72–154. [Google Scholar]
Figure 1. Geography and bathymetry of the area under consideration. The tsunami source location is indicated as S1.
Jlpea 12 00006 g001
Figure 2. Three-dimensional (3D) visualization of the initial sea surface displacement at an elliptic tsunami source.
Jlpea 12 00006 g002
Figure 3. The proposed VC709-based implementation architecture.
Jlpea 12 00006 g003
Figure 4. Xilinx ZCU106-based implementation architecture.
Jlpea 12 00006 g004
Figure 5. Pseudo-3D visualization of the water surface 2500 s after the calculation started. Yellow dots A and B delineate the segments of the coastline along which a more detailed distribution of the tsunami heights is shown.
Jlpea 12 00006 g005
Figure 6. Distribution of the maximum tsunami heights in the fragment of the computational domain, located closer to the tsunami source. The left part of the figure shows the color legend of the corresponding wave heights.
Jlpea 12 00006 g006
Figure 7. Graph of the distribution of the maximum heights in cm along the fragment of the coastline between points A and B (Figure 5). Along the horizontal axis, the difference (in spatial steps) between the projections to the meridian of the current point and point A is shown.
Jlpea 12 00006 g007
Table 1. Comparison of parameters and measured results for different platforms.
Core i9-9900KVC709ZCU106
Technology used14 nm Intel28 nm TSMC16 nm TSMC
Number of streams 884
Frequency3600 MHz250 MHz400 MHz
Entire system power consumption 141.2 W104.2 W41.1 W
Processor power consumption 66.7 W19.5 W13.45 W
Time for one iteration46 ms3.9 ms4.92 ms
Energy consumption per iteration
(system)
6495 mJ406 mJ202 mJ
Energy consumption per iteration
(processor)
3068 mJ76 mJ66 mJ
Publisher’s Note: MDPI stays neutral with regard to jurisdictional claims in published maps and institutional affiliations.

